2020 U.S. Goodwill Impairment Study - Duff & Phelps
16
February 2021 2020 U.S. Goodwill Impairment Study INSIDE INTRODUCTION Duff & Phelps is pleased to launch the 2020 U.S. Goodwill Impairment Study (the “2020 Study”), now in its 12th year of publication. The 2020 Study examines general and industry goodwill impairment (GWI) trends through December 2019 of over 8,800 publicly traded companies incorporated in the U.S. Also included in this year’s edition is an expanded look at the largest 30 impairments recorded during 2019, a feature that debuted in last year’s study. Recognizing the significance of a recent global health event, this study also touches on the impact of the COVID-19 pandemic on goodwill impairments taken by U.S. based companies up to the time of writing.* Times of crises and significant economic recessions always place an additional focus on impairments recorded by publicly traded companies. Goodwill and impairment continue to be topics of interest to standard setters and stakeholders. Both the Financial Accounting Standards Board (FASB) and the International Accounting Standards Board (IASB) have current projects addressing goodwill and impairment. More developments in this area are expected to take place in 2021. Historical Goodwill Impairment Studies Access Duff & Phelps’ Goodwill Impairment Studies online back to 2010, covering the U.S., Europe and Canada. www.duffandphelps.com/GWIStudies Highlights of the 2020 Study Top 10 Goodwill Impairments Top 30 Goodwill Impairment Spotlight Summary Statistics by Industry Tables 1 and 2 2019 U.S. Industry Spotlight Goodwill Impairments by Sub-industry Appendix: Company Base Set Selection and Methodology About Duff & Phelps 2. 3. 4. 6. 9. 10. 14. 15. * Information collected through January 28, 2021.
Transcript of 2020 U.S. Goodwill Impairment Study - Duff & Phelps

February 2021
2020 U.S. GoodwillImpairment Study
INSIDE INTRODUCTION
Duff & Phelps is pleased to launch the 2020 U.S. Goodwill Impairment Study (the “2020 Study”), now in its 12th year of publication. The 2020 Study examines general and industry goodwill impairment (GWI) trends through December 2019 of over 8,800 publicly traded companies incorporated in the U.S.
Also included in this year’s edition is an expanded look at the largest 30 impairments recorded during 2019, a feature that debuted in last year’s study.
Recognizing the significance of a recent global health event, this study also touches on the impact of the COVID-19 pandemic on goodwill impairments taken by U.S. based companies up to the time of writing.* Times of crises and significant economic recessions always place an additional focus on impairments recorded by publicly traded companies.
Goodwill and impairment continue to be topics of interest to standard setters and stakeholders. Both the Financial Accounting Standards Board (FASB) and the International Accounting Standards Board (IASB) have current projects addressing goodwill and impairment. More developments in this area are expected to take place in 2021.
Historical Goodwill Impairment Studies Access Duff & Phelps’ Goodwill Impairment Studies online back to 2010, covering the U.S., Europe and Canada. www.duffandphelps.com/GWIStudies
Highlights of the 2020 Study
Top 10 Goodwill Impairments
Top 30 Goodwill Impairment Spotlight
Summary Statistics by Industry Tables 1 and 2
2019 U.S. Industry Spotlight
Goodwill Impairments by Sub-industry
Appendix: Company Base Set Selection and Methodology
About Duff & Phelps
2.
3.
4.
6.
9.
10.
14.
15.
* Information collected through January 28, 2021.

CONSUMER STAPLES GWI (USD in bn)
HIGHLIGHTS OF THE 2020 STUDY
* The 2020 Study only captures companies that are incorporated in the U.S. Therefore,
certain companies that are incorporated outside of the U.S. are excluded from our
analyses, even if they are viewed as U.S. companies by financial markets. If such
companies were included, total GWI in 2019 would, at a minimum, increase by
Schlumberger’s $8.8 bn impairment, leading to an aggregate $79.9 bn and thereby
exceeding the 2018 GWI total amount.
† Source: S&P Capital IQ platform. M&A activity based on transactions closed
in each year, where U.S. publicly traded companies acquired a 50% or
greater interest.
Total GWI recorded by U.S. public companies fell 10%, from
$78.9 billion (bn) in 2018 to $71.0 bn in 2019, but this was still
the second highest level since the 2008 global financial crisis.*
Moreover, the 2018 aggregate GWI amount was significantly
impacted by a single GWI event
of $22.1 bn, recorded by General
Electric (GE). If GE’s impairment
event was excluded from the 2018
totals, aggregate GWI would have
risen by 25% in 2019 (from $56.7 bn
in 2018).
Additionally, the number of GWI
events increased by 4%, from 307
in 2018 to 318 in 2019. The size of
impairments has generally become
larger, with the average GWI per
event (excluding GE’s 2018
impairment) rising by 21% in 2019 to $223 million (mn),
or a drop of 13% if GE was included.
Trade tensions between the U.S. and its main trading partners
(particularly China), combined with a Brexit impasse, created
significant uncertainty among companies and global investors in late
2018 and early 2019. Most major economies saw growth decelerate
in 2019, with U.S. real GDP moderating to 2.3%. Nevertheless, U.S.
investors grew optimistic into 2019 and a “Phase 1” trade deal
announced in October 2019 between the U.S. and China spurred
new stock market record highs.
M&A activity by U.S. publicly traded companies saw deal value drop
marginally (by 4%) in 2019 relative to the record levels achieved in
2018, while deal volume fell 18%. Yet, 2019 still marked the second-
best year in M&A deal value since we began tracking these statistics
in 2008. This led to $391 bn of goodwill being added to U.S. public
companies’ balance sheets in 2019. However, the onset of the
COVID-19 pandemic put a damper on M&A activity by U.S.
acquirers, with the number of closed deals in 2020 dropping to the
lowest level in the study’s records (statistics begin in 2008).†
From an industry standpoint, GWI increased or remained at similar
levels in seven out of ten industries analyzed, with Industrials and
Consumer Discretionary being notable exceptions. Industrials saw
its aggregate goodwill impairment drop by over 80% in 2019 to
$4.5 bn. However, excluding the top impairment event in 2018
(GE’s $22.1 bn), aggregate impairments in Industrials have
remained at comparable levels over the last four years. In 2019,
the industries with the largest increase in GWI over 2018, are as
follows, in order of magnitude ($ in billions):
− Communication Services ($8.6 to $19.7)
− Information Technology ($2.7 to $8.1)
− Consumer Staples ($9.5 to $12.9)
Communication Services’ aggregate GWI amount more than
doubled from 2018 to 2019, reaching its highest level since 2007.
However, 2007 was dominated by a single large impairment event
(Sprint-Nextel at $29.7 bn out of the $29.8 bn industry total),
whereas 2019 impairments affected the industry more broadly.
Traditional broadband, video and voice service providers were
under pressure from new entrants (vertical integration and
disrupting start-ups), as well as large providers that underwent
M&A consolidation.
Information Technology’s aggregate GWI amount tripled from
2018 to 2019, reaching its highest level since 2015. After seeing
steep declines in GWI for the two years following 2015, the trend
appears to have reversed, with GWI for this industry increasing for
two consecutive years.
Consumer Staples reached a new record high in aggregate
GWI since we began collecting statistics in 2005. Established
companies are struggling with shifting consumer tastes and
competition from new brands and/or lower prices. GWI in this
industry has now increased for three consecutive years.
2018 2019
-10%
Total GWI(U.S. Public Companies)
$79 bn
$71 bn
$3.8
2008 2009 2010 2011 2012 2013 2014 2015 2016 2017 2018 2019
$2.3 $2.2
$5.0
$1.3 $1.0
$2.5
$0.8
$1.8
$9.5
$12.9
$3.5
Duff & Phelps | A Kroll Business 2
2020 U.S. Goodwill Impairment Study

2020 STUDY: LOOKING BACK AND
LOOKING AHEAD
The 2020 Study captures 8,800+ public companies incorporated
in the U.S.* In 2019, the top five impairments totaled $25.5 bn,
while the top 10 impairments reached $37.4 bn, accounting
respectively for nearly 36% and 53% of the aggregate GWI
of $71.0 bn.†
Looking at 2020, the COVID-19 pandemic was the biggest
challenge for U.S. companies, as the related economic recession
is expected to be the most severe since World War II. Certain
companies benefitted from stay-at-home and lockdown policies,
while others struggled to survive without the physical presence
of consumers. Even within the same industry, there was a marked
divergence in performance, depending on the business model and
how quickly a company was able to adapt to the new reality.
At the time of writing, the disclosed top 10 GWI events for 2020
reached a combined $54 bn, far surpassing the top 10 in 2019.
Although full 2020 calendar year-end results for U.S. public
companies will not be known for some time, early reporting
points to overall GWI already exceeding $120 bn in 2020.
For perspective, in 2008, at the height of the global financial crisis,
U.S. companies recorded a total GWI of $188 bn, according to our
prior studies. Should the final 2020 aggregate GWI figures remain
at a level lower than that in 2008, it will be partly a reflection of the
unprecedented level of support provided by both the Federal
Reserve (with swift implementation of liquidity-enhancing monetary
policies) and the U.S. government (with large fiscal stimulus
packages) in response to the COVID-19 crisis. By a wide margin,
the most impacted industry so far is Energy, a reflection of the
collapse in global oil prices following the classification of
COVID-19 as a pandemic.‡
* The 2020 Study uses the S&P Capital IQ platform as the primary source
of data. The procedures described in the Appendix were undertaken to
arrive at the final dataset, which was used to calculate all ratios and
summary statistics throughout the study.
† As indicated earlier, the 2020 Study excludes companies that are incorporated
outside of the U.S. and yet may be viewed as U.S. companies by financial markets.
If they were included, Schlumberger’s $8.8 bn impairment would become the top
event for 2019, changing the statistics on GWI concentration.
‡ Data for calendar year 2020 was compiled on January 28, 2021. The identity
of the top 10 largest impairment events in 2020 may change once all companies
report full-year 2020 results.
§ Calendar years (not “most recent fiscal years”) were used to examine impairments
during a specific period of time, regardless of company-specific choices of fiscal
years. Financial data was also adjusted to include goodwill impairment amounts
disclosed within discontinued operations or disposal groups, when identified.
GOODWILL IMPAIRMENTS§
In 2019 (in bn)
$6.5Lumen Technologies, Inc. (fka Century Link)
$3.5National Oilwell Varco, Inc.
$2.0Sprint Corporation
$2.6Coty Inc.
$2.7Dollar Tree, Inc.
$2.9DXC Technology Company
$5.7Frontier Communications Corporation
$6.8 The Procter & Gamble Company
$2.7Windstream Holdings, Inc.
$2.0Conduent Incorporated
Duff & Phelps | A Kroll Business 3
2020 U.S. Goodwill Impairment Study

No. Company GICS Industry
Goodwill Impairment
(USD)% of GW Impaired
1. The Procter & Gamble Company 30 Consumer Staples $6.8 bn 14%
2. Lumen Technologies, Inc. 50 Communication Services $6.5 bn 23%
3. Frontier Communications Corporation 50 Communication Services $5.7 bn 90%
4. National Oilwell Varco, Inc. 10 Energy $3.5 bn 56%
5. DXC Technology Company 45 Information Technology $2.9 bn 39%
6. Dollar Tree, Inc. 25 Consumer Discretionary $2.7 bn 54%
7. Windstream Holdings, Inc. 50 Communication Services $2.7 bn 98%
8. Coty Inc. 30 Consumer Staples $2.6 bn 33%
9. Sprint Corporation 50 Communication Services $2.0 bn 30%
10. Conduent Incorporated 45 Information Technology $2.0 bn 57%
11. General Electric Company 20 Industrials $1.5 bn 3%
12. MEDNAX, Inc. 35 Healthcare $1.4 bn 33%
13. McKesson Corporation 35 Healthcare $1.2 bn 11%
14. The Kraft Heinz Company 30 Consumer Staples $1.2 bn 3%
15. Marathon Petroleum Corporation 10 Energy $1.2 bn 6%
1. Procter and Gamble
− Recognized $6.8 bn of goodwill impairment in its Shave Care
reporting unit, which is the global leader in the blades and
razors market. This reporting unit is comprised entirely of
acquired businesses. A substantial portion of the impairment
stemmed from the mega acquisition of Gillette in 2005.
− The impairment was largely driven by a significant appreciation
of the U.S. dollar relative to a number of currencies, a drop in
sales volume caused by changing grooming habits (primarily
in developed markets) and an increasingly competitive market
environment in the U.S. and elsewhere. Collectively, these
factors resulted in lower cash flow projections.
− A $1.6 bn impairment charge related to brands in the Gillette
indefinite-lived intangible portfolio was also recorded.
2. Lumen Technologies, Inc. (fka Century Link)
− Recognized an aggregate of $6.5 bn in goodwill impairment
across several reporting units. Competitive pressures
contributed to revenue declines in a number of segments during
2019. An internal reorganization in January and a continued
decline in the stock price triggered two interim impairment tests
in the first quarter of 2019, leading to impairment charges.
− This tops a $2.7 bn goodwill impairment taken in 2018 in
the consumer reporting unit, which ranked as the sixth largest
impairment event in our 2019 Study.
3. Frontier Communications Corporation
− Recognized $5.7 bn of goodwill impairment in 2019, preceded
by goodwill impairments totaling $641 mn and $2.7 bn in 2018
and 2017, respectively. No goodwill balance remained after the
2019 impairment.
− The series of goodwill impairments over the last three-year
period have been due to continued stock price declines and
lower profitability driven by sustained revenue deterioration,
failure from a strategic transformation initiative in achieving
improvements in revenue, shifting customer trends, questions
about the long-term sustainability of the capital structure and
a lower outlook for the overall industry.
− Filed for bankruptcy shortly following year-end 2019.
TOP 30 GOODWILL IMPAIRMENT SPOTLIGHT
Duff & Phelps | A Kroll Business 4
2020 U.S. Goodwill Impairment Study

4. National Oilwell Varco, Inc.
− Recognized an aggregate goodwill impairment of $3.5 bn
in 2019.
− Impairment driven by certain oil and gas market indicators
hitting new decade-lows (signaling a more prolonged downturn
for the industry), an increase in the number of oilfield services
firms (including customers) declaring bankruptcy and a
drop in drilling activity in North America (with U.S. rig count
experiencing its first double-digit sequential decline
since 2016).
− As an independent provider of equipment and technology to
the upstream oil and gas industry, the company is highly
dependent on drilling activity and global oil and gas prices.
5. DXC Technology
− Recognized an aggregate $6.8 bn of goodwill impairment in
the fiscal year ended March 31, 2020; however, our current
study only captures the $2.9 bn recognized during calendar
year 2019.
− DXC Technology was created in April 2017 by the merger
of Hewlett Packard Enterprise Services and Computer
Sciences Corp, which led to the recognition of a substantial
amount of goodwill. Following the merger, revenues have seen
annual consecutive declines, without an accompanying
reduction in costs.
No. Company GICS Industry
Goodwill Impairment
(USD)% of GW Impaired
16. DuPont de Nemours, Inc. 15 Materials $1.2 bn 2%
17. EnLink Midstream, LLC 10 Energy $1.1 bn 86%
18. Dow Inc. 15 Materials $1.0 bn 11%
19. Covetrus, Inc. 35 Health Care $938 mn 125%*
20. Equitrans Midstream Corporation 10 Energy $852 mn 69%
21. Bed Bath & Beyond Inc. 25 Consumer Discretionary $716 mn 100%
22. Molson Coors Beverage Company 30 Consumer Staples $674 mn 8%
23. Avaya Holdings Corp. 45 Information Technology $657 mn 24%
24. O-I Glass, Inc. 15 Materials $595 mn 24%
25. The Mosaic Company 15 Materials $589 mn 34%
26. AECOM 20 Industrials $588 mn 10%
27. Arrow Electronics, Inc. 45 Information Technology $570 mn 22%
28. The Estée Lauder Companies Inc. 30 Consumer Staples $559 mn 29%
29. Party City Holdco Inc. 25 Consumer Discretionary $556 mn 34%
30. Entercom Communications Corp. 50 Communication Services $537 mn 100%
* The company impaired goodwill from the prior year, as well as a portion of goodwill related to newly acquired businesses in 2019, leading to a GWI/GW ratio greater than 100%.
Duff & Phelps | A Kroll Business 5
2020 U.S. Goodwill Impairment Study

SUMMARY STATISTICS BY INDUSTRY*
(TABLE 1)
* Revisions to the Global Industry Classification Standard (GICS®) structure in 2018 affect historical comparability on an industry basis. See Appendix for more information on the methodology. ** Amounts shown are aggregates. Differences due to rounding.
2019 (Companies)
2015 2016 2017 2018 2019
Goodwill Impairments: $ billions (number of events)Percent of Total Companies that Recorded GWIPercent of Companies with GoodwillPercent of Companies with Goodwill that Recorded a GWI
Companies with GW
PercentRecording
GWI
Communication Services(572)
0.1 (1)1.0%
31.1%3.1%
0.0 (2)1.9%
41.9%4.5%
4.9 (3)2.9%
36.3%8.1%
8.6 (22)3.7%
23.2%16.1%
19.7 (30)5.2%
24.0%21.9%
24% 22%
Consumer Staples(476)
2.5 (18)3.9%
25.7%15.0%
0.8 (19)4.1%
33.0%12.3%
1.8 (23)4.9%
32.0%15.4%
9.5 (21)4.4%
24.5%17.9%
12.9 (25)5.3%
23.5%22.3%
24% 22%
Energy (621)
18.2 (65)9.6%
17.1%56.0%
7.2 (27)4.2%
19.3%21.6%
1.5 (13)2.2%
19.1%11.4%
8.1 (33)5.0%
16.1%30.8%
8.7 (33)5.3%
15.6%34.0%
16% 34%
Information Technology(1,228)
12.9 (65)4.4%
37.1%11.8%
4.1 (44)3.0%
42.0%7.2%
1.3 (41)2.8%
40.7%6.9%
2.7 (50)4.0%
35.0%11.4%
8.1 (41)3.3%
35.2%9.5%
35% 9%
Consumer Discretionary(944)
7.6 (51)4.2%
35.0%12.0%
5.4 (58)4.9%
41.0%11.9%
9.3 (63)5.3%
40.1%13.1%
8.7 (49)5.0%
35.4%14.2%
7.2 (54)5.7%
35.6%16.1%
36% 16%
Healthcare(1,468)
1.3 (28)2.2%
27.9%8.0%
3.1 (39)3.1%
30.8%9.9%
7.2 (51)3.9%
30.0%12.9%
15.0 (46)3.2%
23.7%13.7%
5.3 (44)3.0%
24.9%12.1%
25% 12%
Industrials(1,088)
7.7 (74)6.9%
40.3%17.1%
4.5 (59)5.3%
46.0%11.6%
5.9 (59)5.4%
45.4%11.8%
25.1 (50)4.5%
38.6%11.6%
4.5 (50)4.6%
39.0%11.8%
39% 12%
Materials(552)
2.8 (18)2.9%
19.9%14.6%
1.0 (19)3.2%
23.1%13.7%
1.3 (14)2.4%
23.1%10.2%
0.6 (12)2.0%
18.4%11.0%
3.7 (14)2.5%
19.6%13.0%
20%13%
Financials & Real Estate(1,808)
1.4 (24)1.6%
37.4%4.4%
1.2 (15)1.1%
42.5%2.5%
1.8 (20)1.4%
41.1%3.3%
0.4 (19)1.2%
35.1%3.5%
0.4 (20)1.1%
34.6%3.2%
35% 3%
Utilities(139)
2.3 (6)4.0%
43.0%9.2%
1.4 (6)4.2%
46.9%9.0%
0.2 (6)4.2%
42.7%9.8%
0.2 (5)3.4%
40.1%8.5%
0.3 (7)5.0%
41.0%12.3%
41% 12%
TOTAL**(8,896)
56.9 (350)4.1%
32.5%12.7%
28.5 (288)3.4%
37.3%9.2%
35.1 (293)3.5%
36.3%9.6%
78.9 (307)3.5%
29.9%11.7%
71.0 (318)3.6%
30.3%11.8%
30% 12%
Duff & Phelps | A Kroll Business 6
2020 U.S. Goodwill Impairment Study

SUMMARY STATISTICS BY INDUSTRY*
(TABLE 2)
2019 (Companies)
2015 2016 2017 2018 2019
Goodwill Intensity (GW/TA)Loss Intensity (GWI/GW)Loss Intensity (GWI/TA)
GW / TAGWI / GW
Communication Services(572)
19.2%0.1%0.0%
19.6%0.0%0.0%
18.7%2.6%0.5%
21.6%1.9%0.4%
20.6%3.8%0.8%
21% 3.8%
Consumer Staples(476)
22.0%0.9%0.2%
22.4%0.2%0.1%
21.7%0.5%0.1%
23.2%3.0%0.7%
22.1%3.7%0.9%
22% 3.7%
Energy (621)
5.0%14.9%
0.7%
4.7%6.7%0.3%
4.4%1.4%0.1%
4.9%8.5%0.4%
5.1%7.4%0.4%
5% 7.4%
Information Technology(1,228)
19.9%2.7%0.5%
19.9%0.8%0.2%
19.7%0.2%0.0%
23.5%0.5%0.1%
25.2%1.3%0.3%
25% 1.3%
Consumer Discretionary(944)
13.7%2.4%0.3%
13.7%1.8%0.2%
14.7%2.5%0.3%
10.0%4.2%0.4%
8.4%3.6%0.4%
8% 3.6%
Healthcare(1,468)
26.0%0.3%0.1%
26.2%0.7%0.2%
27.7%1.4%0.4%
28.6%2.7%0.7%
26.6%0.8%0.2%
27% 0.8%
Industrials(1,088)
17.9%1.9%0.3%
19.3%1.0%0.2%
20.4%1.3%0.2%
20.5%4.9%1.0%
18.7%0.9%0.2%
19% 0.9%
Materials(552)
14.9%2.6%0.4%
15.3%0.9%0.1%
19.0%1.1%0.2%
19.4%0.4%0.1%
18.4%2.0%0.4%
18% 2.0%
Financials & Real Estate(1,808)
1.6%0.3%0.0%
1.8%0.2%0.0%
1.8%0.3%0.0%
1.9%0.1%0.0%
2.0%0.1%0.0%
2% 0.1%
Utilities(139)
4.5%3.5%0.2%
5.3%2.1%0.1%
5.2%0.2%0.0%
5.2%0.3%0.0%
5.2%0.4%0.0%
5% 0.4%
TOTAL**(8,896)
7.0%2.1%0.1%
7.2%1.0%0.1%
7.5%1.1%0.1%
8.0%2.3%0.2%
7.8%1.8%0.1%
8% 1.8%
* Revisions to the Global Industry Classification Standard (GICS®) structure in 2018 affect historical comparability on an industry basis. See Appendix for more information on the methodology. ** Amounts shown are aggregates. Differences due to rounding.
Duff & Phelps | A Kroll Business 7
2020 U.S. Goodwill Impairment Study

Goodwill Trends
Provides the aggregate
goodwill balances for
year-end 2014 and 2019, as
well as the cumulative goodwill
additions and impairments over that
five-year period.
Impairment History
Presents annual GWI
amounts and number of
impairment events over the
2015-2019 period. The median
market-to-book ratio (grey line)
provides some context for the annual
impairment measures.
Market-to-Book Ratio
Distribution
Highlights the number of
companies (shown in
percentage terms) with a market-to-
book ratio below and above 1.0. The
blue shaded area to the left of the
needle further separates the
proportion of companies with a ratio
above and below 0.5. Although not
predictive on its own, companies with
a low market-to-book ratio may be at a
greater risk of impairment. Reporting
unit structures, their respective
performance and where the goodwill
resides are a few of the critical factors
that must be considered in the
impairment testing process.
Summary Statistics
Depicts the following
calendar-year 2019
statistics for the companies
included in the 2020 Study sample:
(i) Number of Companies; (ii) Goodwill
Intensity (GW/TA); (iii) Loss Intensity
ratio (goodwill impairment as a
percentage of the prior year’s total
goodwill, or GWI/GW); (iv) Percent of
Companies with Goodwill; (v) Percent
of Companies with Goodwill that
Recorded a Goodwill Impairment; and
(vi) Median Market-to-Book ratio.
Size of Industry Sectors
Represents the aggregate
size of the companies within
an industry sector relative to
the combined size of all the
companies included in the 2020
Study sample, measured in terms
of market capitalization at the end
of 2019.
Index
Shows the five-year
cumulative returns of 10
industries as represented by
the respective S&P 500 sector
indices versus the performance of the
overall S&P 500 Index over the
2015-2019 period. Summarizes the
relative performance of each industry
reflecting what a $1 investment at the
end of 2014 would be worth at the
end of 2019.
$1,675 ADDED
$270 bnIMPAIRED
$2,746 bn2014
$4,151 bn2019
2015
$56.9
$28.5$35.1
$78.9
2016 2017 2018 2019$0
$20
$40
$60
$80
$100
$120
0
0.5
1.0
1.5
2.0
$71.0
Number ofImpairment
Events
Market-to-Book Ratio
Goodwill Impairments ($ bn)
350 288 293 307 318
1.0
0.5
1.5
18% 82%
8,896 Companies
7.8%Goodwill to Total Assets (GW/TA)
1.8%Percent of Goodwill Impaired (GWI/GW ratio)
30.3%Companies with Goodwill
11.8%Percent of Companies with Goodwill that Recorded a Goodwill Impairment in 2019
2.0Market-to-Book Ratio (median)
Energy4.4% Materials
2.5%Industrials9.6%
Consumer Discretionary10.5%
ConsumerStaples7.3%
Healthcare13.2%
Financials and Real Estate
17.0%
InformationTechnology
22.3%
CommunicationServices
10.2%
Utilities3.1%
S&P 500Index$1.74$1.41
$0.91
$1.85
$1.57 $1.49$1.70
$2.51
$1.46$1.63
Energ
y
Materia
ls
Indus
trials
Consu
mer
Discre
tiona
ry
Consu
mer
Staples
Health
care
Finan
cials
Infor
mation
Tech
nolog
y
Commun
icatio
n
Servic
esUtili
ties
$1.63
$0.50
$1.00
$1.50
$2.00
$2.50
$3.00
$3.50
Duff & Phelps | A Kroll Business 8
2020 U.S. Goodwill Impairment Study
2019 U.S . INDUSTRY SPOTLIGHT
The U.S. Industry Spotlight aggregates data from Tables 1 and 2 and provides a glance at historical GWI trends and statistics,
as well as a summary of the relative size and performance of each industry versus the overall universe of companies captured
in the 2020 Study.
The guide below provides a brief description of the components of the U.S. Industry Spotlight.

2019 U.S . INDUSTRY SPOTLIGHT
CUMULATIVE 5-YEAR TOTAL RETURN BY INDUSTRY FROM 2015 TO 2019 (YEAR END 2014 = $1)
SIZE OF INDUSTRY SECTORS (Relative to Study’s Total Market Cap)
MARKET-TO-BOOK RATIO DISTRIBUTION (Based on Number of Companies)
GOODWILL TRENDS 2014 - 2019 GOODWILL IMPAIRMENT HISTORY
SUMMARY STATISTICS
S&P 500Index$1.74
$1.41$0.91
$1.85
$1.57 $1.49
$1.70
$2.51
$1.46$1.63
Energ
y
Materia
ls
Indus
trials
Consu
mer
Discre
tiona
ry
Consu
mer
Staples
Health
care
Finan
cials
Infor
mation
Tech
nolog
y
Commun
icatio
n
Servic
esUtili
ties
$0.50
$1.00
$1.50
$2.00
$2.50
$3.00
$3.50
$1.63
Energy4.4% Materials
2.5%Industrials9.6%
Consumer Discretionary10.5%
ConsumerStaples7.3%
Healthcare13.2%
Financials and Real Estate
17.0%
InformationTechnology
22.3%
CommunicationServices
10.2%
Utilities3.1%
$1,675 ADDED
$270 bnIMPAIRED
$2,746 bn2014
$4,151 bn2019
1.0
0.5
1.5
18% 82%
8,896 Companies
7.8%Goodwill to Total Assets (GW/TA)
1.8%Percent of Goodwill Impaired (GWI/GW ratio)
30.3%Companies with Goodwill
11.8%Percent of Companies with Goodwill that Recorded a Goodwill Impairment in 2019
2.0Market-to-Book Ratio (median)
2015
$56.9
$28.5$35.1
$78.9
2016 2017 2018 2019$0
$20
$40
$60
$80
$100
$120
0
0.5
1.0
1.5
2.0
$71.0
Number ofImpairment
Events
Market-to-Book Ratio
Goodwill Impairments ($ bn)
350 288 293 307 318
Duff & Phelps | A Kroll Business 9
2020 U.S. Goodwill Impairment Study
GICS Code
GICS Sub-Industry Name
Number Co’s
% of Co’s with GW GW/TA GWI/GW
% of Co’s with GW that
Recorded GWI
Goodwill Impairment
($ in millions)Market-to- Book Ratio
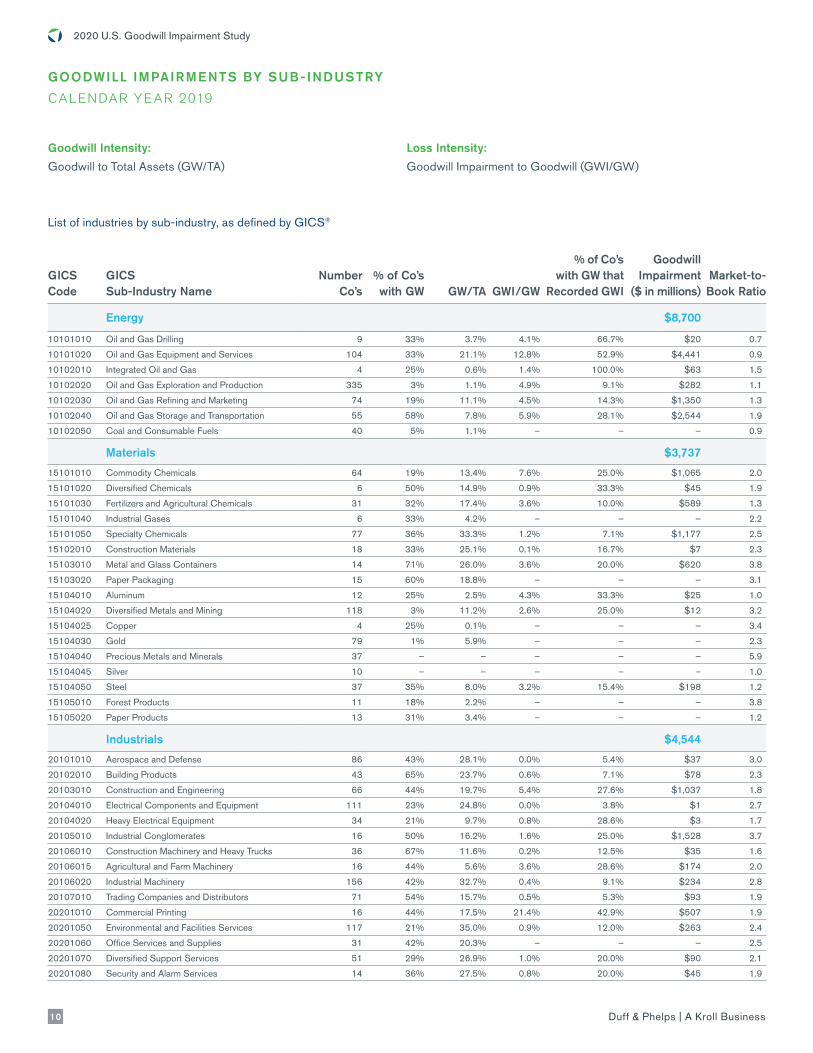
Energy $8,700
10101010 Oil and Gas Drilling 9 33% 3.7% 4.1% 66.7% $20 0.7
10101020 Oil and Gas Equipment and Services 104 33% 21.1% 12.8% 52.9% $4,441 0.9
10102010 Integrated Oil and Gas 4 25% 0.6% 1.4% 100.0% $63 1.5
10102020 Oil and Gas Exploration and Production 335 3% 1.1% 4.9% 9.1% $282 1.1
10102030 Oil and Gas Refining and Marketing 74 19% 11.1% 4.5% 14.3% $1,350 1.3
10102040 Oil and Gas Storage and Transportation 55 58% 7.8% 5.9% 28.1% $2,544 1.9
10102050 Coal and Consumable Fuels 40 5% 1.1% – – – 0.9
Materials $3,737
15101010 Commodity Chemicals 64 19% 13.4% 7.6% 25.0% $1,065 2.0
15101020 Diversified Chemicals 6 50% 14.9% 0.9% 33.3% $45 1.9
15101030 Fertilizers and Agricultural Chemicals 31 32% 17.4% 3.6% 10.0% $589 1.3
15101040 Industrial Gases 6 33% 4.2% – – – 2.2
15101050 Specialty Chemicals 77 36% 33.3% 1.2% 7.1% $1,177 2.5
15102010 Construction Materials 18 33% 25.1% 0.1% 16.7% $7 2.3
15103010 Metal and Glass Containers 14 71% 26.0% 3.6% 20.0% $620 3.8
15103020 Paper Packaging 15 60% 18.8% – – – 3.1
15104010 Aluminum 12 25% 2.5% 4.3% 33.3% $25 1.0
15104020 Diversified Metals and Mining 118 3% 11.2% 2.6% 25.0% $12 3.2
15104025 Copper 4 25% 0.1% – – – 3.4
15104030 Gold 79 1% 5.9% – – – 2.3
15104040 Precious Metals and Minerals 37 – – – – – 5.9
15104045 Silver 10 – – – – – 1.0
15104050 Steel 37 35% 8.0% 3.2% 15.4% $198 1.2
15105010 Forest Products 11 18% 2.2% – – – 3.8
15105020 Paper Products 13 31% 3.4% – – – 1.2
Industrials $4,544
20101010 Aerospace and Defense 86 43% 28.1% 0.0% 5.4% $37 3.0
20102010 Building Products 43 65% 23.7% 0.6% 7.1% $78 2.3
20103010 Construction and Engineering 66 44% 19.7% 5.4% 27.6% $1,037 1.8
20104010 Electrical Components and Equipment 111 23% 24.8% 0.0% 3.8% $1 2.7
20104020 Heavy Electrical Equipment 34 21% 9.7% 0.8% 28.6% $3 1.7
20105010 Industrial Conglomerates 16 50% 16.2% 1.6% 25.0% $1,528 3.7
20106010 Construction Machinery and Heavy Trucks 36 67% 11.6% 0.2% 12.5% $35 1.6
20106015 Agricultural and Farm Machinery 16 44% 5.6% 3.6% 28.6% $174 2.0
20106020 Industrial Machinery 156 42% 32.7% 0.4% 9.1% $234 2.8
20107010 Trading Companies and Distributors 71 54% 15.7% 0.5% 5.3% $93 1.9
20201010 Commercial Printing 16 44% 17.5% 21.4% 42.9% $507 1.9
20201050 Environmental and Facilities Services 117 21% 35.0% 0.9% 12.0% $263 2.4
20201060 Office Services and Supplies 31 42% 20.3% – – – 2.5
20201070 Diversified Support Services 51 29% 26.9% 1.0% 20.0% $90 2.1
20201080 Security and Alarm Services 14 36% 27.5% 0.8% 20.0% $45 1.9
List of industries by sub-industry, as defined by GICS®
Goodwill Intensity:
Goodwill to Total Assets (GW/TA)
Loss Intensity:
Goodwill Impairment to Goodwill (GWI/GW)
GOODWILL IMPAIRMENTS BY SUB- INDUSTRY
CALENDAR YE AR 2019
Duff & Phelps | A Kroll Business 10
2020 U.S. Goodwill Impairment Study

GICS Code
GICS Sub-Industry Name
Number Co’s
% of Co’s with GW GW/TA GWI/GW
% of Co’s with GW that
Recorded GWI
Goodwill Impairment
($ in millions)Market-to-Book Ratio
20202010 Human Resource and Employment Services 44 45% 17.1% 1.5% 15.0% $73 2.7
20202020 Research and Consulting Services 74 30% 48.3% 0.0% 13.6% $3 3.6
20301010 Air Freight and Logistics 26 54% 11.0% – – – 2.7
20302010 Airlines 17 35% 8.6% – – – 1.7
20303010 Marine 6 50% 12.6% – – – 1.6
20304010 Railroads 9 11% 0.0% – – – 4.1
20304020 Trucking 40 50% 4.6% 4.8% 20.0% $341 2.5
20305010 Airport Services 3 67% 29.8% – – – 1.2
20305020 Highways and Railtracks 1 – – – – – –
20305030 Marine Ports and Services 4 25% 5.5% – – – 0.4
Consumer Discretionary $7,222
25101010 Auto Parts and Equipment 69 38% 10.8% 6.4% 23.1% $594 1.5
25101020 Tires and Rubber 4 50% 2.9% – – – 0.8
25102010 Automobile Manufacturers 15 27% 0.4% – – – 1.9
25102020 Motorcycle Manufacturers 7 14% 0.6% – – – 4.2
25201010 Consumer Electronics 26 23% 9.2% – – – 1.7
25201020 Home Furnishings 23 43% 19.8% 0.0% 10.0% $2 0.9
25201030 Homebuilding 31 61% 5.4% 0.8% 5.3% $49 1.5
25201040 Household Appliances 22 18% 12.7% – – – 3.8
25201050 Housewares and Specialties 8 50% 20.9% 8.3% 100.0% $266 1.6
25202010 Leisure Products 55 35% 11.9% 2.3% 21.1% $98 2.8
25203010 Apparel, Accessories and Luxury Goods 66 32% 14.1% 0.1% 9.5% $6 1.4
25203020 Footwear 14 36% 2.2% – – – 4.2
25203030 Textiles 11 27% 2.6% 31.6% 33.3% $11 1.3
25301010 Casinos and Gaming 46 41% 10.1% 0.8% 15.8% $119 3.2
25301020 Hotels, Resorts and Cruise Lines 37 32% 25.0% 0.0% 25.0% $5 4.5
25301030 Leisure Facilities 38 24% 19.2% 0.1% 11.1% $2 1.7
25301040 Restaurants 92 48% 11.2% 1.1% 13.6% $199 2.2
25302010 Education Services 45 36% 27.7% 0.1% 12.5% $12 1.4
25302020 Specialized Consumer Services 31 39% 21.8% 0.4% 16.7% $26 2.3
25501010 Distributors 55 15% 22.0% 1.2% 12.5% $82 2.5
25502020 Internet and Direct Marketing Retail 98 26% 12.3% 1.4% 12.0% $564 3.8
25503010 Department Stores 7 29% 7.3% – – – 1.1
25503020 General Merchandise Stores 7 57% 8.1% 26.1% 25.0% $2,727 3.8
25504010 Apparel Retail 44 36% 2.2% 14.3% 37.5% $506 1.7
25504020 Computer and Electronics Retail 8 38% 4.8% 27.2% 33.3% $364 2.0
25504030 Home Improvement Retail 8 63% 3.0% – – – 2.8
25504040 Specialty Stores 35 49% 7.9% 12.9% 17.6% $623 2.0
25504050 Automotive Retail 34 47% 8.0% 0.0% 6.3% $2 2.8
25504060 Home Furnishing Retail 8 50% 2.9% 62.0% 50.0% $966 1.3
Consumer Staples $12,899
30101010 Drug Retail 11 18% 17.7% – – – 2.2
30101020 Food Distributors 23 43% 19.9% 3.7% 20.0% $346 2.5
30101030 Food Retail 16 44% 7.5% 0.4% 14.3% $19 2.1
30101040 Hypermarkets and Super Centers 4 75% 10.9% – – – 4.5
30201010 Brewers 4 75% 25.7% 8.1% 33.3% $674 2.6
30201020 Distillers and Vintners 23 17% 25.7% – – – 3.3
30201030 Soft Drinks 50 16% 24.1% 0.1% 25.0% $45 7.9
30202010 Agricultural Products 37 14% 9.6% 0.5% 40.0% $23 1.7
Duff & Phelps | A Kroll Business 11
2020 U.S. Goodwill Impairment Study

GICS Code
GICS Sub-Industry Name
Number Co’s
% of Co’s with GW GW/TA GWI/GW
% of Co’s with GW that
Recorded GWI
Goodwill Impairment
($ in millions)Market-to-Book Ratio
30202030 Packaged Foods and Meats 121 31% 33.6% 1.0% 13.5% $1,345 2.8
30203010 Tobacco 20 35% 11.6% 0.0% 28.6% $1 3.8
30301010 Household Products 24 50% 31.0% 11.8% 16.7% $6,899 5.9
30302010 Personal Products 143 10% 19.5% 29.3% 57.1% $3,547 2.9
Healthcare $5,337
35101010 Healthcare Equipment 233 27% 33.0% 0.1% 4.7% $131 4.5
35101020 Healthcare Supplies 59 47% 25.2% 1.8% 10.7% $148 5.4
35102010 Healthcare Distributors 39 31% 18.6% 7.0% 25.0% $2,147 5.0
35102015 Healthcare Services 106 33% 34.6% 1.1% 17.1% $1,719 3.3
35102020 Healthcare Facilities 50 38% 25.5% 0.0% 10.5% $9 2.6
35102030 Managed Healthcare 16 56% 29.5% 0.3% 11.1% $259 3.2
35103010 Health Care Technology 91 31% 26.1% 3.5% 10.7% $228 4.0
35201010 Biotechnology 513 17% 13.2% 0.8% 11.6% $381 3.6
35202010 Pharmaceuticals 309 18% 23.3% 0.3% 21.8% $308 4.0
35203010 Life Sciences Tools and Services 52 56% 38.0% 0.0% 3.4% $7 5.3
Financials/Real Estate $441
40101010 Diversified Banks 9 89% 1.8% – – – 1.3
40101015 Regional Banks 753 45% 2.8% 0.0% 0.9% $5 1.2
40102010 Thrifts and Mortgage Finance 167 31% 0.1% 0.1% 2.0% $5 1.2
40201020 Other Diversified Financial Services 8 25% 1.1% – – – 0.9
40201030 Multi-Sector Holdings 17 24% 9.7% 0.1% 50.0% $43 1.6
40201040 Specialized Finance 25 28% 33.2% 10.2% 14.3% $2 0.9
40202010 Consumer Finance 49 47% 2.1% 0.0% 4.3% $11 1.3
40203010 Asset Management and Custody Banks 228 12% 3.3% 0.0% 3.7% $1 8.7
40203020 Investment Banking and Brokerage 54 41% 1.0% 0.1% 9.1% $31 2.0
40203030 Diversified Capital Markets 1 100% 0.1% – – – 0.1
40203040 Financial Exchanges & Data 22 68% 20.8% – – – 5.6
40204010 Mortgage REITs 48 19% 0.2% – – – 1.0
40301010 Insurance Brokers 19 42% 39.9% 0.1% 37.5% $18 3.6
40301020 Life and Health Insurance 30 37% 0.6% – – – 0.9
40301030 Multi-line Insurance 9 67% 1.1% 0.3% 16.7% $28 1.1
40301040 Property and Casualty Insurance 53 53% 2.7% – – – 1.3
40301050 Reinsurance 3 67% 0.5% – – – 1.1
60101010 Diversified REITs 24 21% 3.8% 1.8% 20.0% $50 1.4
60101020 Industrial REITs 14 21% 0.4% – – – 2.2
60101030 Hotel and Resort REITs 20 10% 0.7% 1.4% 50.0% $9 1.1
60101040 Office REITs 23 17% 0.1% – – – 1.7
60101050 Healthcare REITs 19 26% 1.3% – – – 2.1
60101060 Residential REITs 22 27% 0.3% – – – 2.7
60101070 Retail REITs 37 16% 0.3% 0.3% 16.7% $2 1.7
60101080 Specialized REITs 32 56% 13.2% 0.0% 5.6% $0 2.9
60102010 Diversified Real Estate Activities 16 6% 0.0% – – – 1.0
60102020 Real Estate Operating Companies 59 2% 0.2% – – – 1.2
60102030 Real Estate Development 32 3% 0.0% – – – 1.7
60102040 Real Estate Services 15 53% 28.0% 2.2% 12.5% $237 2.9
Duff & Phelps | A Kroll Business 12
2020 U.S. Goodwill Impairment Study

GICS Code
GICS Sub-Industry Name
Number Co’s
% of Co’s with GW GW/TA GWI/GW
% of Co’s with GW that
Recorded GWI
Goodwill Impairment
($ in millions)Market-to-Book Ratio
Information Technology $8,117
45102010 IT Consulting and Other Services 109 26% 35.9% 4.3% 3.6% $2,940 2.4
45102020 Data Processing and Outsourced Services 87 51% 31.8% 2.8% 11.4% $2,317 4.4
45102030 Internet Services and Infrastructure 44 34% 31.8% 0.8% 13.3% $71 6.4
45103010 Application Software 380 32% 36.3% 1.2% 12.5% $903 6.4
45103020 Systems Software 82 38% 22.5% 0.3% 6.5% $356 9.8
45201020 Communications Equipment 108 35% 30.3% 1.1% 10.5% $544 1.8
45202030 Technology Hardware, Storage and Peripherals 67 27% 14.0% 0.3% 11.1% $209 2.0
45203010 Electronic Equipment and Instruments 130 28% 32.2% 0.1% 5.6% $6 2.8
45203015 Electronic Components 33 45% 18.9% 0.1% 6.7% $9 2.2
45203020 Electronic Manufacturing Services 30 50% 6.4% 2.3% 13.3% $47 1.8
45203030 Technology Distributors 42 29% 14.8% 6.7% 25.0% $714 1.6
45301010 Semiconductor Equipment 43 51% 17.1% – – – 2.4
45301020 Semiconductors 73 52% 25.5% 0.0% 5.3% $1 4.2
Communication Services $19,681
50101010 Alternative Carriers 41 15% 27.3% 21.9% 16.7% $6,506 1.8
50101020 Integrated Telecommunication Services 41 34% 19.6% 4.8% 35.7% $8,627 1.8
50102010 Wireless Telecommunication Services 24 38% 3.9% 21.5% 22.2% $2,009 2.1
50201010 Advertising 86 17% 30.6% 1.7% 13.3% $293 2.8
50201020 Broadcasting 36 53% 28.4% 2.7% 42.1% $938 1.2
50201030 Cable and Satellite 14 57% 23.6% – – – 2.7
50201040 Publishing 28 32% 27.7% 5.5% 66.7% $548 1.6
50202010 Movies and Entertainment 131 18% 32.1% 0.8% 4.3% $368 2.7
50202020 Interactive Home Entertainment 36 17% 34.1% – – – 4.8
50203010 Interactive Media and Services 135 21% 11.3% 0.8% 17.9% $393 3.2
Utilities $348
55101010 Electric Utilities 34 53% 4.9% 0.1% 16.7% $75 2.3
55102010 Gas Utilities 17 71% 10.5% 0.0% 8.3% $4 2.3
55103010 Multi-Utilities 16 75% 5.2% 1.3% 25.0% $269 2.1
55104010 Water Utilities 23 35% 5.2% – – – 3.3
55105010 Independent Power Producers and Energy Traders
9 22% 5.2% – – – 1.4
55105020 Renewable Electricity 40 13% 2.3% – – – 2.2
Duff & Phelps | A Kroll Business 13
2020 U.S. Goodwill Impairment Study

* S&P Global Market Intelligence; S&P Capital IQ platform. S&P Global Market Intelligence is a division of S&P Global, Inc. Adjustments made to financial information contained in
the S&P Capital IQ platform and subsequent analytical procedures applied to the data were performed by Duff & Phelps. The information presented in this Study has been obtained
with the greatest of care from sources believed to be reliable, but is not guaranteed to be complete, accurate or timely. While most of the information for the 2015-2018 period was
carried forward from the prior studies and analyses, certain historical financial data was adjusted for database errors. These corrections did not materially impact the historical trends
observed for goodwill impairments.
† In 1999, MSCI and S&P Dow Jones Indices introduced the GICS® classification system, consisting of 10 industry sectors. In September 2016, MSCI and S&P Dow Jones introduced
for the first time since the creation of GICS® structure a new eleventh sector for real estate. However, due to a limited sample size, compiling some of the goodwill impairment
statistics for a stand-alone Real Estate industry would not result in meaningful comparisons. Therefore, we elected to continue to aggregate statistics for a combined Financials
and Real Estate industry.
‡ Structure revisions that were introduced in September 2018 may impact industry level comparisons from prior years. For information on the structure revisions,
see https://www.msci.com/gics.
§ The dataset includes firms classified by S&P Capital IQ as Public Investment Firms. In prior studies, this category of companies was excluded because it primarily consisted of
non-operating and holding companies whose business was essentially comprised of investments in other companies and securities. However, as an increasing number of operating
companies have been added to this category – including, but not limited to, firms with positive goodwill balances – we deemed appropriate to incorporate in the 2020 Study dataset
those that appeared to have an operating nature. This step added over 240 companies to the dataset.
** The dataset was assessed each year to identify any company with a controlling interest in another company, because in such cases the controlling investor (the parent) would have
consolidated the underlying entity’s (the subsidiary’s) financial results. To avoid double counting the parent’s and the subsidiary’s reported financial information (including recorded
impairments), we excluded the financial results of any subsidiary companies from the dataset that met this criterion.
Duff & Phelps | A Kroll Business 14
2020 U.S. Goodwill Impairment Study
APPENDIX: COMPANY BASE SET SELECTION AND METHODOLOGY
The 2020 Study focused on financial data for U.S.-based publicly
traded companies filing under U.S. GAAP for the period 2015-
2019. The primary sources of data for the 2020 Study were S&P
Capital IQ platform, as well as individual company annual and
interim financial reports.*
The 2020 Study relies upon the GICS® structure as of the
end of calendar year 2019 for industry classification purposes.
In September 2016, MSCI and S&P Dow Jones Indices separated
exchange-listed equity REITs and other listed real estate
companies from the Financials industry to create a new Real Estate
GICS® industry sector. However, for purposes of the 2020 Study,
statistics continue to be compiled for the combined Financials &
Real Estate industry.†
In September 2018, the GICS® structure was further revised to
reflect the evolution and convergence of telecommunications,
media and internet companies. As a result, the Telecommunication
Services sector was broadened and renamed to Communication
Services. The renamed sector includes existing telecommunication
firms as well as firms selected from the Consumer Discretionary
and Information Technology sectors.‡
The following procedures were used to arrive at the 2020 Study
dataset, which was used to calculate all ratios and summary
statistics throughout the 2020 Study.
− American Depositary Receipts (ADRs), exchange traded funds
(ETFs) and Closed End Funds were excluded from the dataset
leaving 9,002 U.S.-based, U.S.-traded companies as of March
13, 2020.
− From this set, further excluded were companies identified as
consolidated subsidiaries of other companies also within the
dataset or not deemed to be publicly traded U.S. firms in 2019,
resulting in a base set of 8,896 companies.§ **
− The current methodology was first applied in the 2015 Study.
The prior selection process excluded companies that did not
have stock returns data over the prior five-year period; this
restriction was removed in 2015. The five-years returns data
selection criterion had been deemed relevant in previous
studies, which were performed shortly after the financial crisis
of 2008-2009.
− Financial data for all companies in the 2020 Study was
adjusted, when applicable, to a calendar year-end (rather than
the most recent fiscal year-end) to examine impairments over a
specific period of time, regardless of company-specific choices
of fiscal year. Financial data was also adjusted to include GWI
amounts disclosed within discontinued operations or disposal
groups, when identified.

Duff & Phelps | A Kroll Business 15
2020 U.S. Goodwill Impairment Study
DUFF & PHELPS , A KROLL BUSINESS
For nearly 100 years, Duff & Phelps has helped clients make
confident decisions in the areas of valuation, real estate, taxation
and transfer pricing, disputes, M&A advisory and other corporate
transactions.
Kroll is the world’s premier provider of services and digital
products related to governance, risk and transparency. We
work with clients across diverse sectors in the areas of valuation,
expert services, investigations, cyber security, corporate finance,
restructuring, legal and business solutions, data analytics and
regulatory compliance.
The firm’s nearly 5,000 professionals are located in 30 countries
and territories around the world.
M&A advisory, capital raising and secondary market advisory
services in the United States are provided by Duff & Phelps
Securities, LLC. Member FINRA/SIPC. Pagemill Partners is a
Division of Duff & Phelps Securities, LLC. M&A advisory, capital
raising and secondary market advisory services in the United
Kingdom are provided by Duff & Phelps Securities Ltd. (DPSL),
which is authorized and regulated by the Financial Conduct
Authority. Valuation Advisory Services in India are provided by
Duff & Phelps India Private Limited under a category 1 merchant
banker license issued by the Securities and Exchange Board
of India.
Contact:
Greg Franceschi
Managing Director and Global Leader Financial Reporting
Practice and Office of Professional Practice
+1 650 798 5570
Contributing Authors:
Carla Nunes
Managing Director
+1 215 430 6149
Gary Roland
Managing Director
+1 215 430 6042
Marianna Todorova
Managing Director
+1 212 871 6239
Jamie Warner
Vice President
+1 215 430 6132
Other Contributors:
Howard Peterson
Senior Associate

© 2021 Duff & Phelps, LLC. All rights reserved. Kroll is a trade name for Duff & Phelps, LLC and its affiliates. DP21010037
About Duff & Phelps, A Kroll Business
For nearly 100 years, Duff & Phelps has helped clients make confident decisions in the areas of valuation, real estate, taxation and transfer pricing, disputes, M&A advisory and other corporate transactions. For more information, visit www.duffandphelps.com.
About Kroll
Kroll is the world’s premier provider of services and digital products related to governance, risk and transparency. We work with clients across diverse sectors in the areas of valuation, expert services, investigations, cyber security, corporate finance, restructuring, legal and business solutions, data analytics and regulatory compliance. Our firm has nearly 5,000 professionals in 30 countries and territories around the world. For more information, visit www.kroll.com.
M&A advisory, capital raising and secondary market advisory services in the United States are provided by Duff & Phelps Securities, LLC. Member FINRA/SIPC. Pagemill Partners is a Division of Duff & Phelps Securities, LLC. M&A advisory, capital raising and secondary market advisory services in the United Kingdom are provided by Duff & Phelps Securities Ltd. (DPSL), which is authorized and regulated by the Financial Conduct Authority. Valuation Advisory Services in India are provided by Duff & Phelps India Private Limited under a category 1 merchant banker license issued by the Securities and Exchange Board of India.