2020 STATE OF BUSINESS REPORT Pivoting from Pandemic to ...
56
2020 STATE OF BUSINESS REPORT Pivoting from Pandemic to Recovery
Transcript of 2020 STATE OF BUSINESS REPORT Pivoting from Pandemic to ...
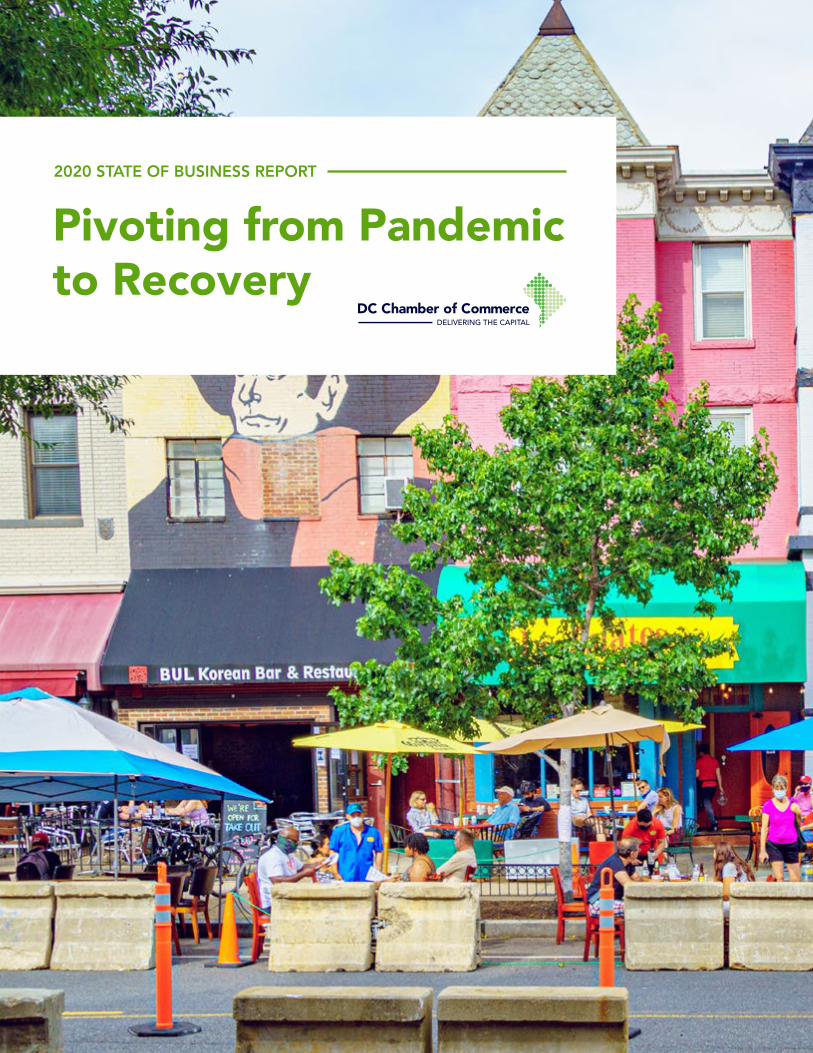
2020 STATE OF BUSINESS REPORT
Pivoting from Pandemic to Recovery

Midtown Center. Photo/Aimee Custis.
ABOUT THE DISTRICT OF COLUMBIA CHAMBER OF COMMERCE
The DC Chamber of Commerce is the voice of business in Washington, DC, the nation’s capital. It advocates on behalf of businesses and entrepreneurs, and provides services to improve the business climate and attract new companies to the District of Columbia. As a leading advocate for economic growth, the DC Chamber reflects the diversity and prosperity of the District’s robust business community, from tech startups to Fortune 500 corporations.
ACKNOWLEDGEMENTS
Washington, DC is a flourishing and diverse global city. Its leadership—including Mayor Muriel Bowser, the Council of the District of Columbia, and the DC Chamber of Commerce under the stewardship of Interim President and CEO Angela Franco—are the catalysts for the production of the 2020 State of Business Report: Pivoting from Pandemic to Recovery.
The Office of the Deputy Mayor for Planning and Economic Development, under the leadership of Deputy Mayor for Planning and Economic Development John Falcicchio, and Sybongile Cook, Director of Business Development and Strategy, provided financial support for the production of this report.
Our thanks to photographers Ted Eytan, Bekah Richards, Kian McKellar, Joe Flood, and Aimee Custis for use of their photos throughout the report. Cover photo by Ted Eytan.
ABOUT THIS REPORT
This report was prepared and produced by the D.C. Policy Center for the DC Chamber of Commerce. The D.C. Policy Center is an independent nonprofit think tank committed to advancing policies for a strong and vibrant economy in the District of Columbia.
The views expressed in this report should not be attributed to the members of the D.C. Policy Center’s Board of Directors or its funders. Funders do not determine research findings or the insights and recommendations of D.C. Policy Center employees and experts. Further information about the D.C. Policy Center is available at dcpolicycenter.org/about.

Message from the Chamber ......................................................................................................... 3
Executive Summary ....................................................................................................................... 4
Introduction .................................................................................................................................. 10
How Has the Pandemic-Induced Recession Changed Economic Activity in DC? ........................ 14
Impact on Mobility and Consumer Spending ........................................................................ 14
Impact on Small Business Operations and Revenue .............................................................. 17
Impact on Labor Markets ....................................................................................................... 20
How Has the Pandemic-Induced Recession Changed DC’s Economic Outlook? ......................... 26
Economic Forecast ................................................................................................................. 27
Business Experiences and Expectations ................................................................................. 29
Household Experiences and Expectations ............................................................................. 32
What Are Some of the Risks to Recovery, and How Can Policy Help Clear the Path to Recovery? ......................................................................................................................... 36
Business and Entrepreneurial Capacity .................................................................................. 37
Return to Work ....................................................................................................................... 39
Risk to Revenue ...................................................................................................................... 40
The DC Chamber Agenda for 2020-2021 .................................................................................... 46
Endnotes ....................................................................................................................................... 50
TABLE OF CONTENTS
THE 2020 STATE OF BUSINESS REPORT 1
Key Bridge as viewed from Roosevelt Island. Photo/Kian McKellar.

WASHINGTON, D.C.
The DC Chamber of Commerce is the region’s largest and most dynamic business network, creating a better environment to work, play, and do business in the District. No other business organization delivers what we do: We deliver the capital.
DELIVERS
Learn more at DCCHAMBER.ORG
Markets for Real Estate
Investment
No. 1Forbes
January 2019
Best Cities for Job Seekers
TOP 10 Fast Company
June 2019
Global Cities Ranking for 2019
TOP 10 A.T. Kearney
2019
Best Cities for New College
Grads
TOP 15 Business Insider
May 2019
Best Places to Live in the U.S.
TOP 20 U.S. News & World Report
April 2019
Best Places to Retire
TOP 10 The BalanceApril 2019
Most Influential Global Cities
TOP 10 Business Insider
June 2019
LEED Platinum City in the World
1stU.S. Green Building Council
August 2017

As the District of Columbia moves prudently toward reopening, we know that much is at stake even as much is still unknown. With the release of the 2020 State of Business Report: Pivoting from Pandemic to Recovery, we seek to contribute to the public dialogue about what has happened to DC’s economy and clarify what we must do to move efficiently and safely toward our new normal.
The report, which reflects comprehensive research by the D.C. Policy Center, details the economic challenges faced by the District and the key pain points that are still being felt by the business community. We believe that sharing this knowledge is an important step toward transcending adversity for our members, the District, and the region.
Let there be no mistake, the report presents a sobering account of the impact of the pandemic and the recession that resulted from the necessary shutdown of DC’s economy. The report does not pull any punches. Quite simply, the effects on the District have been real, and in some corners, devastating.
By August 2020, some 80 percent of DC businesses reported that their operations had been negatively impacted by COVID-19 and the shutdown. That has resulted in temporary business closures, a loss of revenue, a loss of capacity, and an inability to pay rent, utilities, or payroll. The challenge seems insurmountable at times.
Yet, in the wake of the coronavirus, the DC business community is coming together, working with the DC government and other stakeholders to design a viable way forward. DC’s business
community already has exhibited extraordinary strength and resilience in the first 10 months of 2020, and only by continuing to work together will we be able to fully recover DC’s economic vitality.
The combined assault of the pandemic and recession has not only shaped today’s dynamics, but has also brought to the fore trends that have been merely undercurrents up until now. Movements such as the growth in remote work, the swing toward online retail shopping, and a rethinking in mobility have gained a greater foothold under the pandemic. These trends, as discussed in the report, must be factored into the business community’s “new normal” and accounted for in any recovery plan.
At every turn, the business community has proven to be up to the challenge of the pandemic, displaying enormous strength, and showcasing its collaborative energy in searching for innovative solutions. Many businesses have found groundbreaking avenues to serve their customers while also advancing inventive ways to keep employees on the payroll and engaged. This work must and will continue.
The phased reopening advanced by DC Mayor Muriel Bowser has ensured that the District is given time to effectively and safely respond to the pandemic and shutdown. The DC government’s implementation of realistic economic, tax, and regulatory solutions will be crucial if the business community is to weather the shutdown and the District is to fully recover.
MESSAGE FROM THE CHAMBER
Angela Franco Interim President and CEO
THE 2020 STATE OF BUSINESS REPORT 3

The pandemic-induced recession has put an unprecedented pressure on the District’s economy.
Precautions taken to slow the spread of COVID-19 have closed businesses and schools, reduced travel and mobility, and put thousands out of work. With the dramatic decline in demand from consumers, and halted business operations, the nation swiftly fell into a recession at the end of February. By mid-July, thousands of District residents were unemployed, and 35 percent of residents aged 18+ predicted that their chances of paying rent were slim to none in the next month. While previous data show that projections on the ability to make rent and mortgage payments were more pessimistic than households’ actual track record, getting DC residents employment income again is imperative. As an urban employment center and a destination for workers, visitors, and businesses, the District has experienced dramatic losses in its workforce. While some have been insulated from the economic impacts, local economic activity has declined significantly, putting financial strains on businesses, households, and local government.
The economic losses borne by residents and businesses are too great for the District government to cover alone. But the city’s policy actions can go a long way in mitigating risks to recovery. Yet, with its own finances at risk, the District will have to balance its budget while addressing as many social needs as it can. Recovery will be faster if fewer households experience the trauma of losing their homes, if fewer business owners carry the stigma of bankruptcy, and if workers can return to work without having to worry about their safety, health, or child care needs.
JOB LOSSES FROM FEBRUARY TO JULY OF 2020 ARE THREE TIMES THE LOSSES EXPERIENCED DURING THE GREAT RECESSION.
The COVID-19-induced recession has erased nearly seven years of private sector job growth in the District, eliminating 57,100 jobs. Between February 2020 and July 2020, private sector jobs declined from 564,200 to 506,700. Most of these job losses were felt in the leisure and hospitality sectors. Specifically, hotels and restaurants lost a combined 29,400 jobs, or almost half of the job loss in the District. As of the third week of July, 205,000 residents reported that they were not
4 PIVOTING FROM PANDEMIC TO RECOVERY
EXECUTIVE SUMMARY

employed in the last seven days. Approximately 25 percent of this group were retired, sick, or disabled for a reason other than COVID-19; and 45 percent were out of work because they were laid off, furloughed, or their employer went out of business.
Job losses in DC have been greatest for middle- and low-income workers. Relative to January 2020 levels, 20 percent of workers
making less than $110,000—the threshold for the top quartile of worker income—have lost their wage or salary income due to unemployment, lost hours, or furloughs. Accordingly, unemployment claims increased by over 10 times, from 7,000 claims in January 2020 to 75,000 in July 2020. Those claiming unemployment are disproportionately Latinx, young, and working in food, personal care, and service industries. Additionally, those who
THE 2020 STATE OF BUSINESS REPORT 5
DC workforce All persons actively working in businesses located in the District of Columbia, regardless of where they live.
Discouraged worker A person who is eligible for employment and can work but is currently unemployed and has not attempted to find employment in the last four weeks.
Economic recession A significant decline in economic activity spread across the economy, lasting more than a few months, normally visible in real Gross Domestic Product (GDP), real income, employment, industrial production, and wholesale-retail sales.1 Officially defined as a fall in GDP in two successive quarters.
High-propensity business applications Business applications that have a high propensity of turning into businesses with payroll.2
Labor force All DC residents over the age of 16 who are either employed regardless of where they work, or unemployed and actively seeking work.
Non-withholding taxes Part of personal income taxes collected from quarterly estimated payments made by individuals. These taxes are largely a reflection of dividends and rents earned by individuals and proprietors but are also sensitive to stock market performance.
Unemployment rate The number of people in the labor force who are not employed and are actively looking for work.
Withholding taxes Part of personal income taxes collected from businesses at the time of payroll.
FREQUENTLY USED TERMS IN THIS REPORT
have lost jobs are disproportionately women and people with children under the age of 18 in the household.
While the District reversed some of the deeper job losses experienced in April and May, a rapid recovery is unlikely. Job postings have not yet recovered. By the end of August, advertisements for jobs that do not require experience or credentialing were approximately half as prevalent as before the pandemic began, and high-skill job postings had been reduced by 25 percent.
The high level of unemployment is also putting a strain on the District’s unemployment insurance program. The District started 2020 with a robust balance of $515 million in its Unemployment Insurance Trust Fund. Historically high levels of claims have exhausted more than half of this balance. In June and July of 2020, the city paid out five times in benefit payments compared to the tax revenue it collects from employers. The strong fund balance has allowed the city to buy some time, but if current trends continue, the demands on the unemployment insurance program could far exceed what the city can support by the tax increases allowable under the current program design.
Finding new workers when recovery begins is among the top concerns of small businesses in the District. One disconcerting trend is the increased number of discouraged workers who have stopped searching for work. At the time of this report, the labor force in the District has been reduced by 32,000 residents. Of these residents who have left the labor force, many cited the need to take care of children or elderly people, and concerns over contracting or spreading COVID-19. Others became discouraged because they thought they would not be able to find a job.
Policies that enhance the safety of workers, as well as supports for child care and care for the elderly, would help District residents return
to work. The District has had a good start, offering clear guidelines to different types of businesses about what they must do to minimize the risk of transmission.
SMALL BUSINESSES ARE BEARING THE BRUNT OF THE COSTS OF THE PANDEMIC.
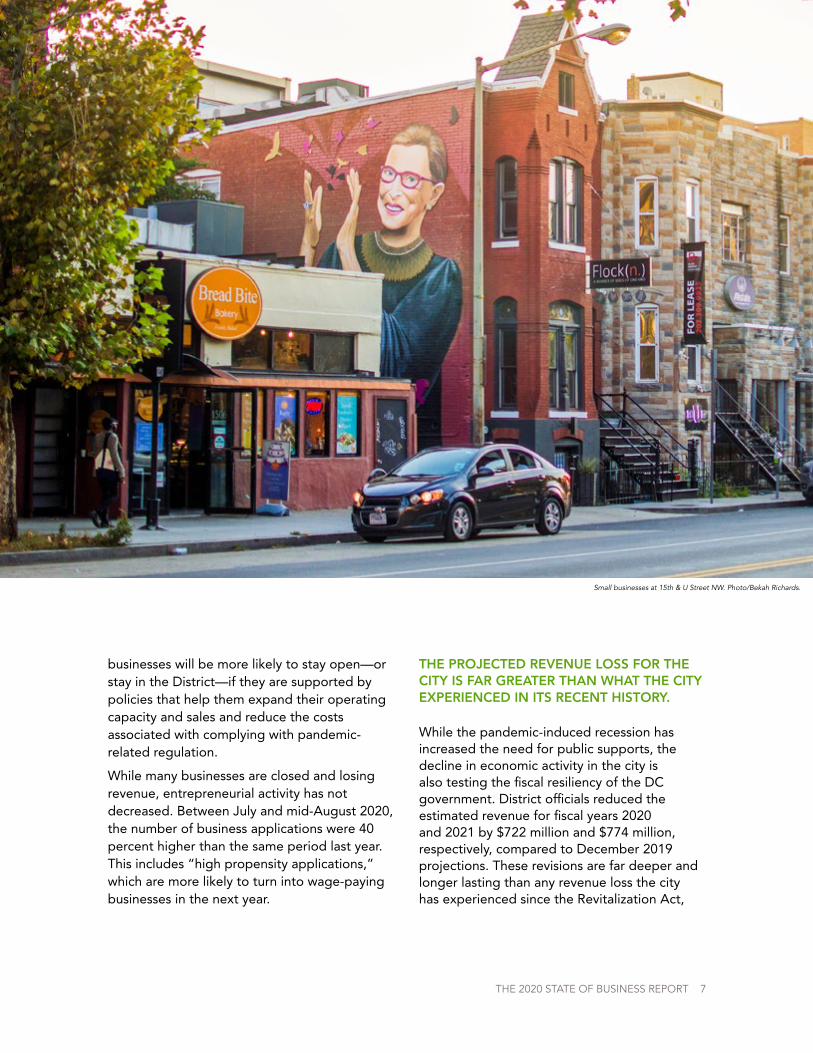
Small businesses are vital to the employment of District residents and attractiveness of the city. Due to pandemic-related concerns and constraints, many businesses in the District have closed their doors and lost revenue: 28 percent of the District’s small businesses were closed as of July 2020, and small business revenue was down by approximately 50 percent. And 80 percent of small businesses note that they have experienced negative impacts—a combination of reduced operations and revenue—since the pandemic. The District’s small businesses have seen the third largest negative impact and sixth largest closure rate of 53 major cities in the United States.
A larger share of small businesses now believe, compared to at the beginning of the pandemic, that they will not be able to return to normal operating capacity for at least six months or more. They cite the need to raise revenue and market their services more effectively as their most important concerns. They also need help to pivot their operations to adapt to the new normal, which includes developing more of an online presence to advertise their services and deliver services directly to customers—on or off premises.
The pandemic has changed the business revenue structure by increasing costs for the foreseeable future. Businesses need to take extensive precautions to limit the spread of disease. This means higher costs associated with purchasing Personal Protective Equipment (PPE) and cleaning and sanitizing efforts. They will also have to increase their capacity to monitor their employees to ensure that workers who show up to work are healthy. These
6 PIVOTING FROM PANDEMIC TO RECOVERY
THE 2020 STATE OF BUSINESS REPORT 7
businesses will be more likely to stay open—or stay in the District—if they are supported by policies that help them expand their operating capacity and sales and reduce the costs associated with complying with pandemic-related regulation.
While many businesses are closed and losing revenue, entrepreneurial activity has not decreased. Between July and mid-August 2020, the number of business applications were 40 percent higher than the same period last year. This includes “high propensity applications,” which are more likely to turn into wage-paying businesses in the next year.
THE PROJECTED REVENUE LOSS FOR THE CITY IS FAR GREATER THAN WHAT THE CITY EXPERIENCED IN ITS RECENT HISTORY.
While the pandemic-induced recession has increased the need for public supports, the decline in economic activity in the city is also testing the fiscal resiliency of the DC government. District officials reduced the estimated revenue for fiscal years 2020 and 2021 by $722 million and $774 million, respectively, compared to December 2019 projections. These revisions are far deeper and longer lasting than any revenue loss the city has experienced since the Revitalization Act,
Small businesses at 15th & U Street NW. Photo/Bekah Richards.

including the period after the 9-11 attacks and throughout the Great Recession.
The most immediate impact of the pandemic-induced economic slowdown has been on sales taxes. Half of sales tax revenue in the District is generated by hotels, restaurants, and arts and entertainment venues. It is projected that sales taxes will decline by 22 percent in fiscal year 2020, totaling $342 million. If there is continued depressed activity, or a second wave of COVID-19 infections causing additional shutdowns, revenue could be further depressed.
Losses experienced in 2020 are projected to reduce personal and business franchise tax collections through 2021. So far in 2020, withholding taxes have been held steady at levels similar to 2019, but non-withholding taxes are lower, reflecting the weaknesses in the stock market and perceived risks about future earnings. Real estate taxes are projected to remain stable through 2021, but this is a feature of the administrative process, which
values income-generating buildings based on the income and expense statements from two years prior. However, if COVID-19 discourages leasing activity, increases vacancy, or otherwise reduces rent payments from commercial leaseholders, a larger number of landlords—compared to the usual level—will likely appeal their tax assessments, and this can potentially reduce tax revenue in the future.
With so much unknown about the future of the economy, increasing taxes to meet the needs of residents and businesses in the city will add to fiscal risks.
LOCAL POLICY WILL MATTER IN SHAPING RECOVERY AND BUILDING RESILIENCY.
While the District government alone cannot make up for the economic losses incurred as a result of the pandemic-induced economic recession, it can adopt the right policies to shape and strengthen economic recovery even under adverse conditions.
8 PIVOTING FROM PANDEMIC TO RECOVERY
Precautionary COVID emergency hospital staging at Walter E. Washington Convention Center. Photo/Events DC.

THE 2020 STATE OF BUSINESS REPORT 9
To support business resiliency and preserve entrepreneurial capacity, the District can help create conditions which will allow businesses to continue to operate and expand sales and revenue. These include:
• Provide expanded and subsidized supply of PPE to businesses to help reduce the risk of transmission between workers and customers.
• Develop rules around access to public space, especially outdoor spaces, to conduct business, and support investments in power infrastructure and equipment such was outdoor heaters to help businesses operate successfully and safely through the cooler fall months.
• Reduce permitting costs and simplify procedures, possibly deferring permit costs, for example, to sustain existing businesses and foster the creation of new businesses.
• Review regulatory restrictions on business operations and professional licensing, especially if regulations interfere with virtual provision or services or off-premise services.
• Provide additional technical assistance and consultations to help navigate the new regulatory landscape.
• Support continuing education for small business owners to assist with the challenges of maintaining a productive workforce, such as the transition to online sales, legal advice, or assistance with PPP loan compliance.
Businesses are also concerned about finding workers when it is time to reopen or expand operations. To support return to work, the District can:
• Consider transportation interventions that are safe alternatives to crowded public transit.
• Invest in programs to close the digital divide and support individuals and small business owners in obtaining the necessary technology to be able to work productively from home.
• Provide operational support for child care centers to cover the increased costs of sanitation and the decrease in revenue due to new staffing restrictions.
• Consider temporary changes to zoning laws to allow for alternative uses of underused spaces.
• Provide parking subsidies for essential workers who are wary of taking public transportation.
The District was able to maintain its spending and preserve all its workforce by using the city’s substantial savings. However, if the period of economic activity remains depressed beyond the revenue projections, difficult decisions may have to be made. To maintain the fiscal health and resiliency of the city, the District can:
• Conduct a comprehensive expenditure review of DC government finances in anticipation of a future with tighter revenue.
• Identify programs and expenditures that could be put on hold to divert funds to interventions related to the COVID-19 response.
• Consider the economic impact of all new policies, not just the fiscal impact, to ensure that the city’s long-term competitiveness is preserved.
• Consider alternatives to the current unemployment insurance tax structure that balances benefits with the additional costs of raising taxes on businesses.

INTRODUCTION
The first case of COVID-19 in the
District of Columbia was confirmed on
March 7, 2020. During the weeks that
followed, life in the nation’s capital
changed dramatically.
Schools were closed and restaurants and bars suspended in-house dining on March 16. Mayor Muriel Bowser issued a “stay at home” order, effective April 1, 2020.3 By this time, many businesses had already closed their doors and sent employees home. Still, both the number of cases and the death rate in the District
10 PIVOTING FROM PANDEMIC TO RECOVERY
Mar 1 Apr 1 May 1 Jun 1 Jul 1 Aug 1
0
1
2
3
4
5
6
7
8
9
10
New
con
firm
ed C
OVI
D-1
9 de
aths
per
100
,000
peo
ple,
sev
en-d
ay m
ovin
g av
erag
e
0.04
1.11
0.12
Scho
ols
clos
ed
Stay
-at-
hom
e or
der
New deaths
Mar 1 Apr 1 May 1 Jun 1 Jul 1 Aug 1
0
20
40
60
80
100
120
New
con
firm
ed C
OVI
D-1
9 ca
ses
per 1
00,0
00 p
eopl
e, s
even
-day
mov
ing
aver
age
67.5
3.0
9.5
Scho
ols
clos
ed
Stay
-at-
hom
e or
der
New cases
Source: Data from The New York Times COVID-19 repository, via Opportunity Insights COVID-19 data tracker, available at https://tracktherecovery.org.
New confirmed cases and deaths per 100,000, seven-day moving average, Washington, DC and other cities,through mid-August 2020
Washington,DC
Other cities
FIGURE 1 - Cases and deaths, March through Mid-August, seven-day moving average

continued growing through May. Since then, new case growth has stabilized, and the death rate has gone down significantly. By mid-August, with fewer than 10 cases per 100,000 persons per day, and approximately one death every other day, the District has been more successful in containing COVID-19 than many other cities in the country (Figure 1).
Business closures and stay-at-home orders across the country have been necessary to control the spread of the disease, but they have also come at a high economic price. In June, the National Bureau of Economic Research—the official reporter of business cycles—announced that the U.S. had entered a recession at the end of February. This deep and swift recession has exacted a heavy toll on the District’s businesses, workers, residents, and government finances.
The 2020 State of Business Report: Pivoting from Pandemic to Recovery takes stock of the impact of the COVID-19-induced recession on the District. It compiles data from the first five months of the recession, February through July 2020, to present how profound the impacts have been on the city. The report covers areas pertinent to the District’s economic viability: consumer demand and spending; businesses capacity to operate and generate revenue; employment, unemployment, and hiring trends; impacts on households; impacts on tax revenue; and expectations about the future of the city.
The report also reviews short-term and long-term risks brought about by COVID-19 that can jeopardize DC’s economic recovery and amplify inequities in the city. In March, the expectation was that within a few months
THE 2020 STATE OF BUSINESS REPORT 11
Pillsbury Bulding, 15th & L Street NW. photo/Aimee Custis.

there would be a return to normalcy. Many businesses surveyed at that time expected that by the fall, the disease would be under control, and by the beginning of 2021, it would have largely passed.4 However, uncertainty about the country’s ability to contain the disease has increased since March. This uncertainty imposes additional risks to the District’s economy, which is heavily dependent on the presence of workers and tourists, and street-level activity.
In the short run, prolonged closures can have a chilling impact on entrepreneurial activity. The District has seen a tremendous number of new business starts in the last 20 years due to a confluence of many positive factors: a growing population, increasing incomes,
favorable financial conditions, and improved city services. But, if closed by the pandemic, many businesses will take a long time to rebuild themselves if they can rebuild at all.5 Rebuilding a productive team of employees will be more difficult for those businesses that have had to lay off many employees. Future financing could be more difficult if a business had to default on a loan or failed to pay back credit extended by vendors.6 For example, half of the restaurants that temporarily closed their doors on March 16 are not expected to open ever again.7 Most retail stores in downtown DC reopened in July, but the sales volume was at 30 to 50 percent of 2019.8 The impacts will spread to households, especially to middle- and lower-income households whose members
12 FROM PANDEMIC TO RECOVERY
Hand sanitizer production at Compass Coffee. Photo/Ted Eytan.

THE 2020 STATE OF BUSINESS REPORT 13
are employed by small businesses. As of July 21, 2020, 37 percent of DC households have reported income losses associated with COVID-19, and 23 percent of adults reported missing last month’s rent or mortgage payment, or did not think that they could make next month’s rent or mortgage payment on time.9 While households can weather a few months of unemployment, recovering from losing housing is far more difficult.
In the long run, the pandemic can alter the attractiveness of the District to businesses, workers, and residents. The 2019 State of Business Report: Building a Competitive City10 indicated that the qualitative advantages that made the District attractive had largely overshadowed its comparatively higher cost of living and doing business. Despite higher housing and child care costs, higher commercial rents, higher taxes, and, for some, longer commutes; residents, workers, and businesses have gladly chosen DC as their home to benefit from the high quality of life, availability of amenities, and concentration of businesses that provide a strong labor market and robust commercial activity. COVID-19 can change this calculus.
For example, half the workers in the Washington metropolitan area can work from home—the third highest share among all metropolitan areas in the nation.11 Accordingly, many companies in the region as well as the federal government have indefinitely allowed their workers to work from home. Telework is providing some protection to District businesses and workers through the pandemic, but it could also mean that workers can work for a District establishment without setting foot in the city for long periods of time. There is increasing evidence that many companies will continue with telework, which is both popular among workers and has significant cost-cutting implications for businesses.12 If worker location ceases to be important, then, when recovery begins, business
location will also matter less in attracting a talented workforce. We are already seeing signs of reduced demand for office space and commercial real estate. There is also increasing evidence that suburbs are outperforming central cities in home sales.13 If these trends hold, they pose a significant risk to the District’s fiscal capacity, as a substantial amount of revenue is driven by commuter activity14 and the demand for real estate in the city.
While the economic losses of COVID-19 borne by residents and businesses are far too great for the District government to cover, the city’s policy actions will greatly affect how it recovers. With its own finances at great risk, the District will have to find a way to keep its financial house in order while addressing as many social needs as it can. Recovery will be faster if fewer households experience the trauma of losing their homes, if fewer business owners carry the stigma of bankruptcy, and if workers can return to work without having to worry about their safety, health, or child care needs. Businesses will also be more likely to stay in the District if they are supported by policies that decrease the costs of and risk related to doing business, such as high taxes, high real estate costs, and regulatory interventions, and if they expect that their consumer base will remain strong.

14 PIVOTING FROM PANDEMIC TO RECOVERY
HOW HAS THE PANDEMIC-INDUCED RECESSION CHANGED ECONOMIC ACTIVITY IN DC?
The economic impacts of COVID-19 began with a profound demand shock: With residents, commuters, and tourists staying home, fewer people spent money on things they would usually buy—coffee from coffee shops, meals at restaurants, and clothes from retailers. Business closures meant many places frequented by residents emptied: from gyms to hair and nail salons to doctors’ offices.
Along with lower spending, fears of viral transmission kept many business establishments from having workers and customers at their places of business. For those sectors where remote operations have been possible, businesses continued to operate, but offices largely remained closed. For others, staying open and generating enough revenue to cover their operating costs has been a challenge.
When DC moved to Phase II of its reopening plan15 on June 22, 2020, 30 percent of small establishments that were in business in January had closed their doors not knowing if they would ever be able to reopen. By the end of July, that share remained above 25 percent.
As a result, the District has seen its swiftest declines in employment in recorded history. Between March and July, 57,000 DC jobs were
lost—nearly seven years’ worth of growth. During the same period, the number of employed DC residents declined by 35,115. Importantly, the District’s resident labor force—those residents who are working or actively looking for work—declined by 27,300. For various reasons including fear of contracting the disease, the lost hope of finding a job, and the necessity of staying home to take care of children, 27,400 taxpaying residents (6.5 percent of the labor force) decided not to return to work.
IMPACT ON MOBILITY AND CONSUMER SPENDING
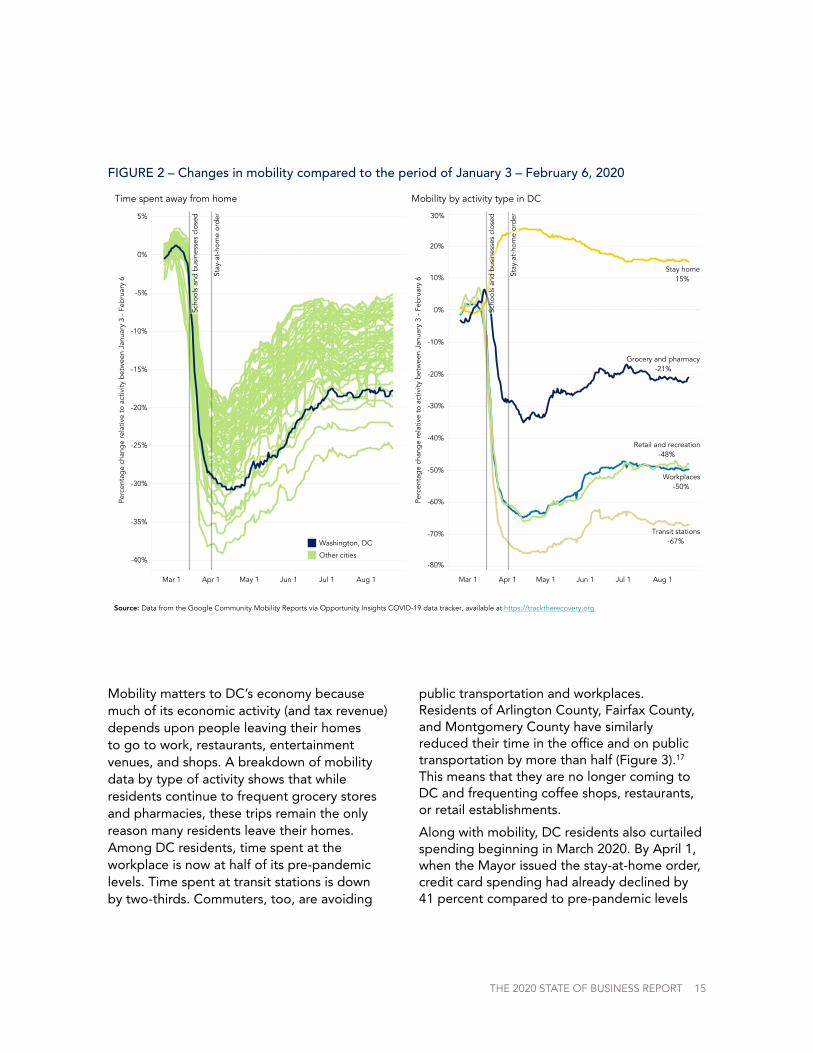
The immediate impact of the pandemic has been a significant decline in mobility. Recent research shows that many people had already minimized time outside their homes before their state or local government ordered them to stay home.16 In DC, when the Mayor issued a stay-at-home order on April 1, 2020, residents had already cut back the time they spent away from home by one-third. Mobility began increasing again in May and settled at 80 percent of pre-pandemic levels in July. The decline in time spent outside of the home is greater in DC than many other large cities in the country. Among the 53 cities for which data are available, DC experienced the fourth largest decline, following Oakland, San Jose, and San Francisco (Figure 2).
THE 2020 STATE OF BUSINESS REPORT 15
Mobility matters to DC’s economy because much of its economic activity (and tax revenue) depends upon people leaving their homes to go to work, restaurants, entertainment venues, and shops. A breakdown of mobility data by type of activity shows that while residents continue to frequent grocery stores and pharmacies, these trips remain the only reason many residents leave their homes. Among DC residents, time spent at the workplace is now at half of its pre-pandemic levels. Time spent at transit stations is down by two-thirds. Commuters, too, are avoiding
public transportation and workplaces. Residents of Arlington County, Fairfax County, and Montgomery County have similarly reduced their time in the office and on public transportation by more than half (Figure 3).17 This means that they are no longer coming to DC and frequenting coffee shops, restaurants, or retail establishments.
Along with mobility, DC residents also curtailed spending beginning in March 2020. By April 1, when the Mayor issued the stay-at-home order, credit card spending had already declined by 41 percent compared to pre-pandemic levels
Source: Data from the Google Community Mobility Reports via Opportunity Insights COVID-19 data tracker, available at https://tracktherecovery.org.
Changes in mobility compared to January 3 - February 6, 2020
Mar 1 Apr 1 May 1 Jun 1 Jul 1 Aug 1
-40%
-35%
-30%
-25%
-20%
-15%
-10%
-5%
0%
5%
Perc
enta
ge
chan
ge
rela
tive
to a
ctiv
ity b
etw
een
Janu
ary
3 - F
ebru
ary
6
Scho
ols
and
bus
ines
ses
clos
ed
Stay
-at-
hom
e or
der
Time spent away from home
Mar 1 Apr 1 May 1 Jun 1 Jul 1 Aug 1
-80%
-70%
-60%
-50%
-40%
-30%
-20%
-10%
0%
10%
20%
30%
Perc
enta
ge
chan
ge
rela
tive
to a
ctiv
ity b
etw
een
Janu
ary
3 - F
ebru
ary
6
Retail and recreation-48%
Grocery and pharmacy-21%
Workplaces-50%
Transit stations-67%
Stay home15%
Scho
ols
and
bus
ines
ses
clos
ed
Stay
-at-
hom
e or
der
Mobility by activity type in DC
Washington, DC
Other cities
FIGURE 2 – Changes in mobility compared to the period of January 3 – February 6, 2020

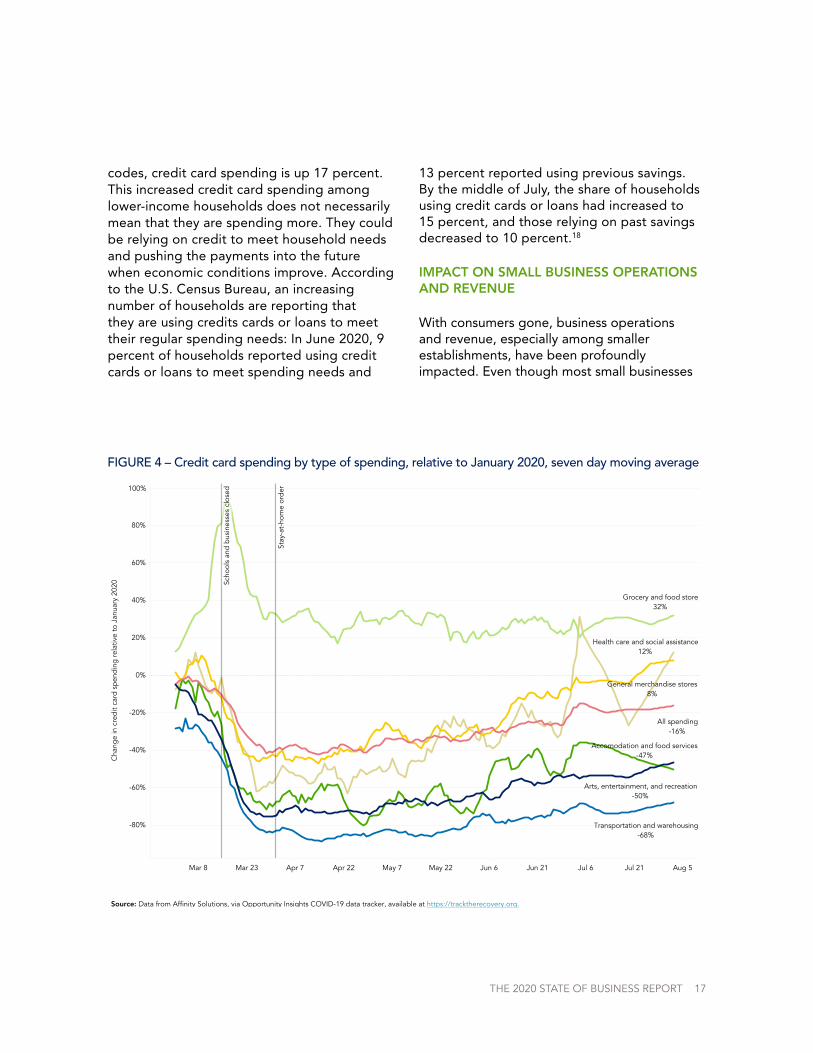
(in January). Spending was at its lowest on April 14 (42.6 percent decline compared to January), and then began a slow recovery. By the end of July, spending was hovering at around 85 percent of pre-pandemic levels. With more time at home, grocery and food store spending has remained higher than historic levels, replacing spending outside of the home in restaurants, hotels, arts and entertainment venues, and on transportation. Credit card data suggest that residents also delayed attending to their health care needs and put off their spending in general merchandise stores until the end of June (Figure 4).
Importantly, consumer spending by higher- and middle-income residents, which constitutes a larger share of spending (and therefore tax revenue), remains below pre-pandemic levels. Among consumers living in ZIP codes with high incomes (top quartile of median income), spending, as of the beginning of August 2020, was still 20 percent below January levels. Among consumers from middle-income ZIP codes, it was 15 percent below January levels. The only group that is using its credit cards more intensely is residents who live in ZIP codes with low income levels (bottom quartile of median income). In these low-income ZIP
16 PIVOTING FROM PANDEMIC TO RECOVERY
Transit Stations Workplaces
Mar 1 Apr 1 May 1 Jun 1 Jul 1 Aug 1 Mar 1 Apr 1 May 1 Jun 1 Jul 1 Aug 1
-80%
-70%
-60%
-50%
-40%
-30%
-20%
-10%
0%
10%
Perc
enta
ge c
hang
e re
lativ
e to
act
ivity
bet
wee
n Ja
nuar
y 3
- Feb
ruar
y 6
-67%
-48%
-53%
-49%
-43%
-50%
-37%
Declines in mobility across selected jurisdictions in the metropolitan Washington area
Washington, DC
Arlington Co., VA
Alexandria City, VA
Fairfax Co., VA
Montgomery Co.,MD
Prince Georges Co., MD
Source: Data from the Google Community Mobility Reports via Opportunity Insights COVID-19 data tracker, available at https://tracktherecovery.org.
FIGURE 3 – Declines in mobility across selected jurisdictions in the Washington metropolitan area
THE 2020 STATE OF BUSINESS REPORT 17
codes, credit card spending is up 17 percent. This increased credit card spending among lower-income households does not necessarily mean that they are spending more. They could be relying on credit to meet household needs and pushing the payments into the future when economic conditions improve. According to the U.S. Census Bureau, an increasing number of households are reporting that they are using credits cards or loans to meet their regular spending needs: In June 2020, 9 percent of households reported using credit cards or loans to meet spending needs and
13 percent reported using previous savings. By the middle of July, the share of households using credit cards or loans had increased to 15 percent, and those relying on past savings decreased to 10 percent.18
IMPACT ON SMALL BUSINESS OPERATIONS AND REVENUE
With consumers gone, business operations and revenue, especially among smaller establishments, have been profoundly impacted. Even though most small businesses
Source: Data from Affinity Solutions, via Opportunity Insights COVID-19 data tracker, available at https://tracktherecovery.org.
Mar 8 Mar 23 Apr 7 Apr 22 May 7 May 22 Jun 6 Jun 21 Jul 6 Jul 21 Aug 5
-80%
-60%
-40%
-20%
0%
20%
40%
60%
80%
100%
Cha
nge
in c
redi
t car
d sp
endi
ng re
lativ
e to
Jan
uary
202
0
Transportation and warehousing-68%
Health care and social assistance12%
General merchandise stores8%
Arts, entertainment, and recreation-50%
All spending-16%
Accomodation and food services-47%
Grocery and food store32%
Scho
ols
and
busi
ness
es c
lose
d
Stay
-at-
hom
e or
der
Credit card spending by type of spending relative to January 2020, seven day moving averageFIGURE 4 – Credit card spending by type of spending, relative to January 2020, seven day moving average
18 PIVOTING FROM PANDEMIC TO RECOVERY
remained open in the District until March 15, their revenues had begun to decline by the third week of February. By the time the city implemented its stay-at-home order, over one-third of small businesses had already shut down and small business revenue was at one-fifth of where it stood in January 2020.
Some businesses that closed their doors in early April began opening in May and June, perhaps because they found a way to adjust their operations, and perhaps because they have benefited from the District’s microgrants or the federal Paycheck Protection Program that provided them with some liquidity. But since July 1, an increasing number of businesses have shut down their operations: 28 percent of small businesses that were operating in January were closed at the end of July, up from 20
percent on July 1 (Figure 5). Business revenues, which similarly began to show recovery through June, lost ground in July. This may be because business owners have exhausted their cash, grants, or loans, or were not able to reopen safely, or because economic activity remained too weak to generate enough revenue to pay for wages, rent, and other operating expenses.
Because DC’s small businesses heavily rely on the presence of commuters and tourists, their operations and revenue have been more greatly impacted than small businesses in other cities in the country. Of the 53 cities tracked, the District’s small businesses have seen the third largest negative revenue impact (after New Orleans and Boston), and sixth largest closure rate (after New Orleans, San Jose, San Antonio, San Francisco, and Austin).
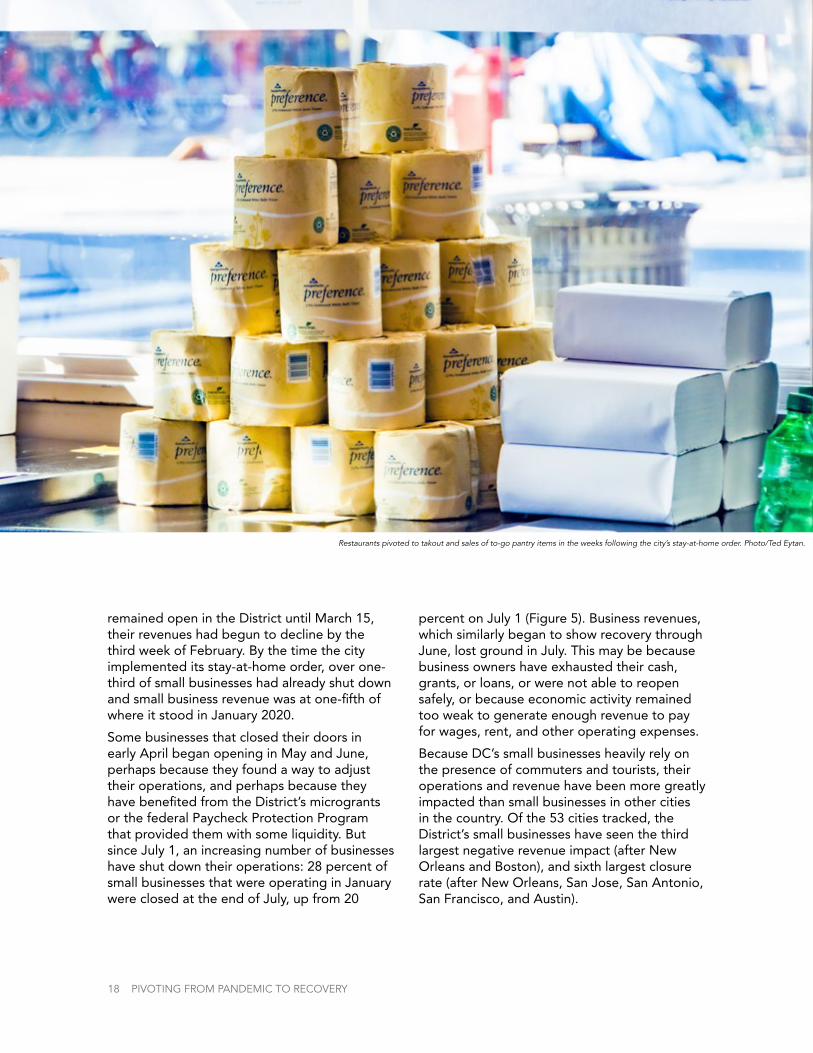
Restaurants pivoted to takout and sales of to-go pantry items in the weeks following the city’s stay-at-home order. Photo/Ted Eytan.

THE 2020 STATE OF BUSINESS REPORT 19
Mar 1 Apr 1 May 1 Jun 1 Jul 1 Aug 1
-55%
-50%
-45%
-40%
-35%
-30%
-25%
-20%
-15%
-10%
-5%
0%
5%
10%
Perc
ent c
hang
e in
num
ber o
f sm
all b
usin
esse
s op
en re
lativ
e to
Jan
uary
202
0
Scho
ols
and
busi
ness
es c
lose
Stay
-at-
hom
e or
der
Small businesses open
Mar 1 Apr 1 May 1 Jun 1 Jul 1 Aug 1
-90%
-80%
-70%
-60%
-50%
-40%
-30%
-20%
-10%
0%
10%
20%
30%
40%
Perc
ent c
hang
e in
net
reve
nue
for s
mal
l bus
ines
ses
rela
tive
to J
anua
ry 2
020
Scho
ols
and
busi
ness
es c
lose
Stay
-at-
hom
e or
der
Small business revenue
Source: Data from Wombly, via Opportunity Insights COVID-19 data tracker, available at https://tracktherecovery.org.
Washington, DC
Other cities
FIGURE 5 – Percentage change in the number of small businesses open and their revenues relative to January 2020, seven day moving average
While businesses in high-income neighborhoods were equally as likely to close as those in middle- and low-income neighborhoods, the negative revenue impacts were much larger. By the end of July, businesses in high-income ZIP codes were generating less than half of the revenue they did back in January compared to a 16-percent decline in businesses in low-income neighborhoods. This is largely because low-income neighborhoods
in DC have fewer restaurants, arts and entertainment venues, or retail stores; and they are more likely to have corner stores and other grocery stores that remained opened throughout the pandemic. Small business revenue loss in the District has been higher than in other parts of the Washington metropolitan area. Only small businesses in Arlington County have experienced deeper revenue losses than DC (67 percent reported on July 31), and those

in Fairfax City have seen about 50 percent in losses. In other counties in the metropolitan area, losses have been at or below 30 percent (Figure 6).
IMPACT ON LABOR MARKETS
Between February 2020 and July 2020, the pandemic-induced recession took away 57,100 jobs in DC, down 7 percent from February. Job losses were incurred
entirely in the private sector. During this period, private sector jobs in DC declined from 564,200 to 506,700—the equivalent of nearly seven years of private sector job growth in the city, or 60 percent of all gains since the Great Recession. Public sector employment increased by a small amount—400 jobs overall including DC government and federal government—yet, unlike what the city experienced during the Great Recession, the gains were too minimal
20 PIVOTING FROM PANDEMIC TO RECOVERY
DC Maryland Virginia
Washington,DC
PrinceGeorges Co.
MontgomeryCo.
ManassasPark City
ManassasCity
AlexandriaCity
Falls ChurchCity
Stafford Co. Loudoun Co. Fairfax Co. Fauquier Co. PrinceWilliam Co.
Fairfax City ArlingtonCo.
-70%
-65%
-60%
-55%
-50%
-45%
-40%
-35%
-30%
-25%
-20%
-15%
-10%
-5%
Reve
nue
com
pare
d to
Jan
uary
202
0
-53%
-23%
-3%
-12%
-22% -22% -22%
-26%-27%
-28% -29%
-31%
-50%
-67%
Source: Data from Wombly, via Opportunity Insights COVID-19 data tracker, available at https://tracktherecovery.org.
FIGURE 6 – Revenue losses reported on July 31 across small businesses in the Washington metropolitan area

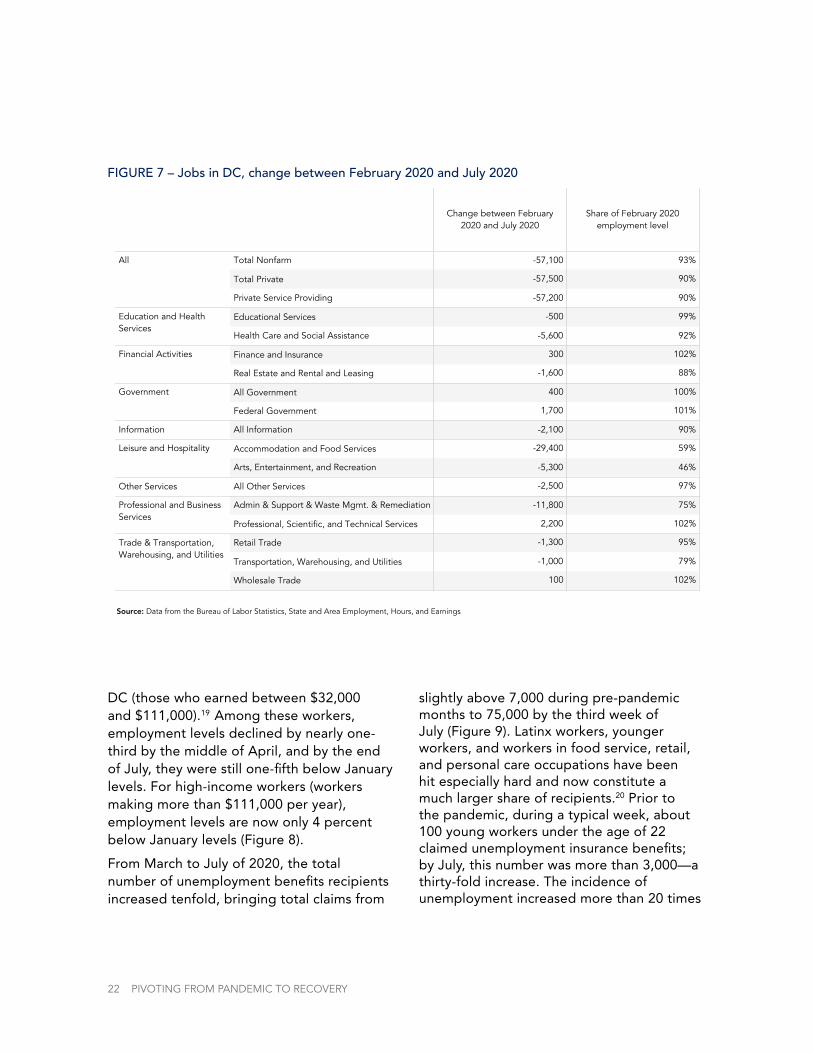
to make up for the losses in the private sector. The leisure and hospitality sectors have experienced the greatest losses in 2020, followed by administrative workers in offices, and workers in transportation. Hotels and restaurants lost a combined 29,400 jobs (59 percent of February’s employment levels), and arts and entertainment venues lost 5,300 jobs (46 percent of February’s employment levels). Employees in administrative and support industries such as back-office workers, grounds maintenance crews, security guards, and staff at employment agencies have lost 11,800 jobs (one-quarter of the jobs
in that sector), and employment in real estate and leasing-related industries was down by 1,600 jobs (a 12 percent loss for that sector). While telecommuting protected professional, scientific, and technical service sectors (2,200 new jobs were created), it could not save the jobs held by those who serve offices and office buildings. Additionally, employment by health care establishments shrank by 8 percent (Figure 7).
Importantly, job losses have been swiftest and greatest for workers from the middle two quartiles of income distribution in
THE 2020 STATE OF BUSINESS REPORT 21
A row of small business establishments in Petworth. Photo/Bekah Richards.
DC (those who earned between $32,000 and $111,000).19 Among these workers, employment levels declined by nearly one-third by the middle of April, and by the end of July, they were still one-fifth below January levels. For high-income workers (workers making more than $111,000 per year), employment levels are now only 4 percent below January levels (Figure 8).
From March to July of 2020, the total number of unemployment benefits recipients increased tenfold, bringing total claims from
slightly above 7,000 during pre-pandemic months to 75,000 by the third week of July (Figure 9). Latinx workers, younger workers, and workers in food service, retail, and personal care occupations have been hit especially hard and now constitute a much larger share of recipients.20 Prior to the pandemic, during a typical week, about 100 young workers under the age of 22 claimed unemployment insurance benefits; by July, this number was more than 3,000—a thirty-fold increase. The incidence of unemployment increased more than 20 times
22 PIVOTING FROM PANDEMIC TO RECOVERY
Source: Data from the Bureau of Labor Statistics, State and Area Employment, Hours, and Earnings
Change between February2020 and July 2020
Share of February 2020employment level
All Total Nonfarm
Total Private
Private Service Providing
Education and HealthServices
Educational Services
Health Care and Social Assistance
Financial Activities Finance and Insurance
Real Estate and Rental and Leasing
Government All Government
Federal Government
Information All Information
Leisure and Hospitality Accommodation and Food Services
Arts, Entertainment, and Recreation
Other Services All Other Services
Professional and BusinessServices
Admin & Support & Waste Mgmt. & Remediation
Professional, Scientific, and Technical Services
Trade & Transportation,Warehousing, and Utilities
Retail Trade
Transportation, Warehousing, and Utilities
Wholesale Trade
-57,200
-57,500
-57,100
90%
90%
93%
-5,600
-500
92%
99%
-1,600
300
88%
102%
1,700
400
101%
100%
-2,100 90%
-5,300
-29,400
46%
59%
-2,500 97%
2,200
-11,800
102%
75%
100
-1,000
-1,300
102%
79%
95%
Jobs in DC, change between February 2020 and July 2020FIGURE 7 – Jobs in DC, change between February 2020 and July 2020

for workers in food service and personal care occupations. The number of Latinx workers receiving benefits increased from about 750 to over 12,000—a sixteen-fold increase.
The District started 2020 with a balance of $515 million in its Unemployment Insurance Trust Fund—the account that uses unemployment insurance taxes to pay for benefits. By the last week of July, the balance of this account had been halved to $256 million.21 That month, the city distributed approximately $100 million in benefits
payments, and took in only $17 million in unemployment taxes.
Given these trends, unemployment taxes will likely increase as much as the current system allows, but barring an increase in hiring, the trust fund could be exhausted, requiring the city to borrow from the federal government.
DC residents, who make up about a third of the workforce in the District, have not been spared from the impact of the recession. By April 2020, the unemployment rate in
THE 2020 STATE OF BUSINESS REPORT 23
FIGURE 8 – Changes in level of employment by income of the employee
Source: Data from Paychex, Earnin, and Intuit, via Opportunity Insights COVID-19 data tracker, available at https://tracktherecovery.org.
Jan 20 Feb 4 Feb 19 Mar 5 Mar 20 Apr 4 Apr 19 May 4 May 19 Jun 3 Jun 18 Jul 3
-30%
-25%
-20%
-15%
-10%
-5%
0%
5%
Empl
oym
ent l
evel
s re
lativ
e to
Jan
uary
4-3
1, 2
020
Middle two quartiles of income-21%
Bottom quartile of income-19%
Top quartile of income-4%
Scho
ols
and
busi
ness
es c
lose
d
Stay
-at-
hom
e or
der
Employment levels by income level of the worker in DC
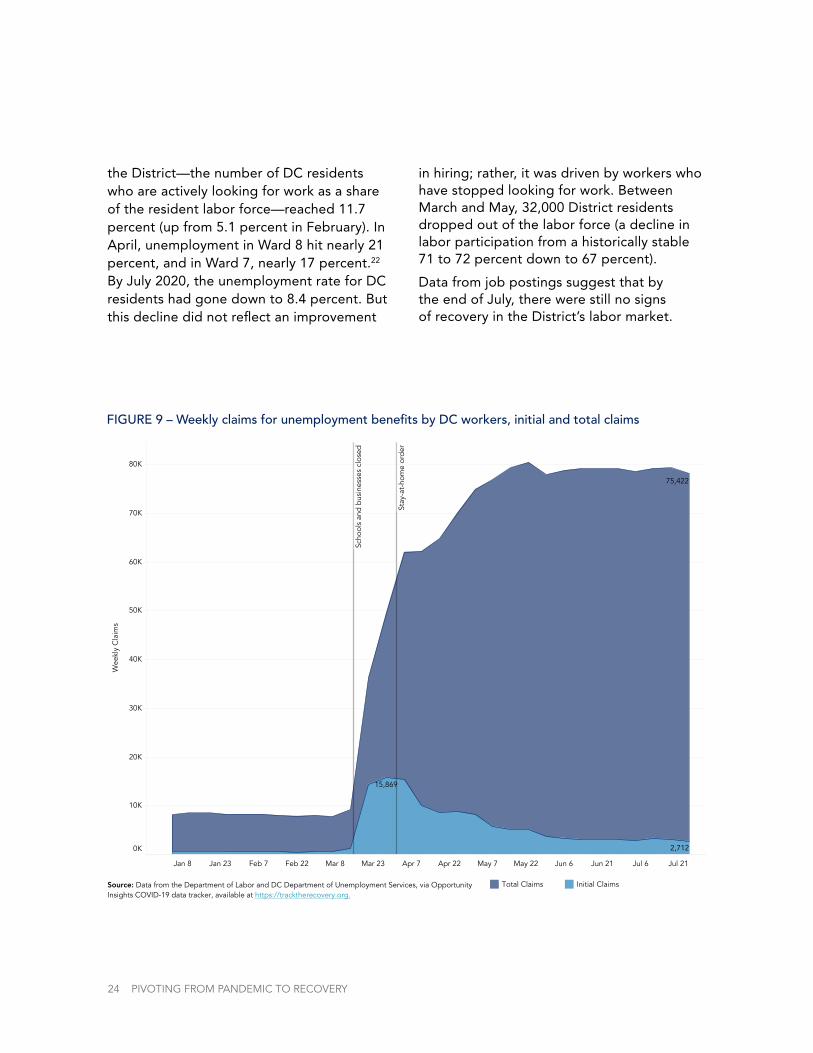
the District—the number of DC residents who are actively looking for work as a share of the resident labor force—reached 11.7 percent (up from 5.1 percent in February). In April, unemployment in Ward 8 hit nearly 21 percent, and in Ward 7, nearly 17 percent.22 By July 2020, the unemployment rate for DC residents had gone down to 8.4 percent. But this decline did not reflect an improvement
in hiring; rather, it was driven by workers who have stopped looking for work. Between March and May, 32,000 District residents dropped out of the labor force (a decline in labor participation from a historically stable 71 to 72 percent down to 67 percent).
Data from job postings suggest that by the end of July, there were still no signs of recovery in the District’s labor market.
24 PIVOTING FROM PANDEMIC TO RECOVERY
Source: Data from the Department of Labor and DC Department of Unemployment Services, via OpportunityInsights COVID-19 data tracker, available at https://tracktherecovery.org.
Jan 8 Jan 23 Feb 7 Feb 22 Mar 8 Mar 23 Apr 7 Apr 22 May 7 May 22 Jun 6 Jun 21 Jul 6 Jul 21
0K
10K
20K
30K
40K
50K
60K
70K
80K
Wee
kly
Cla
ims
15,869
2,712
75,422
Scho
ols
and
bus
ines
ses
clos
ed
Stay
-at-
hom
e or
der
Weekly claims for unemployment benefits by DC workers, initial and total
Total Claims Initial Claims
FIGURE 9 – Weekly claims for unemployment benefits by DC workers, initial and total claims

Overall job postings remained 29 percent below where they were in January 2020. The uncertainties about the availability of a COVID-19 cure or vaccine are still depressing activity in leisure and hospitality industries. Job postings for hotels, restaurants, and arts and entertainment venues have consistently stayed below 60 percent of where they were in January 2020 (Figure 10).
Importantly, postings for jobs that require little preparation (through experience or credentialing) remain depressed. In July, employers were posting such jobs half as often than they did back in January. Postings for jobs that require higher levels of skill and experience were down as well, but only by 25 percent.
THE 2020 STATE OF BUSINESS REPORT 25
Source: Data from Burning Glass Technologies, via Opportunity Insights COVID-19 data tracker, available at https://tracktherecovery.org.
Jan 1 Feb 1 Mar 1 Apr 1 May 1 Jun 1 Jul 1 Aug 1
-80%
-70%
-60%
-50%
-40%
-30%
-20%
-10%
0%
10%
20%
Ave
rag
e le
vel o
f job
pos
ting
s re
lativ
e to
Jan
uary
4-3
1, 2
020,
four
-wee
k m
ovin
g a
vera
ge
Financial activities-11%
Education and health services-20%
Professional and business services-25%
Leisure and hospitality-62%
Scho
ols
and
bus
ines
ses
clos
e
Stay
-at-
hom
e or
der
Job posting in DC relative to January 2020, four week moving averageFIGURE 10 – Weekly job postings in DC as a percentage of postings in January 2020, by industry, four-week moving average

HOW HAS THE PANDEMIC-INDUCED RECESSION CHANGED DC’S ECONOMIC OUTLOOK?
Perhaps the most daunting aspect of this recession is the amount of risk and uncertainty it has created. Without a clear path to a vaccine, the future of the economy and the timing of its recovery are difficult to ascertain. The economic uncertainty has been reflected in the expectations formed by the city’s officials, businesses, and households.
In response to the pandemic, the DC Office of the Chief Financial Officer (OCFO) first delayed its economic and revenue forecast from February to April 2020, and in April, while revising revenue down significantly (over 7 percent for fiscal year 2021), left open the possibility of future downward revisions, citing high uncertainty about the economy. In April’s economic forecast, every economic indicator—from employment to wages to housing starts—was projected to perform more poorly in 2020. Future expectations of growth in 2021 and 2022
were not strong enough to make up for these initial economic losses.
From the end of April through the middle of August 2020, 80 percent of DC small businesses consistently reported that their operations had been negatively impacted by COVID-19, resulting in loss of capacity, temporary closures, loss of revenue, and missing payments such as rent, utilities, or payroll. During that period, expectations of recovery became increasingly negative, with a larger share of businesses reporting that it would take longer than six months to go back to normal levels of operations. Businesses report that in order to survive they would have to increase sales and marketing and will likely need more financial assistance and a better way of increasing the safety of their employees.
Many adults in DC lost their jobs and incomes as a result of the pandemic, forcing them to make difficult decisions. In mid-June, for example, approximately 40 percent of DC residents aged 18 or older reported
26 PIVOTING FROM PANDEMIC TO RECOVERY

experiencing a loss in their income. Around the same time, 25 percent reported not being able to pay their rent; 50 percent reported delaying needed medical care; and 11 percent reported experiencing food insecurity. Residents became increasingly more optimistic about keeping their incomes through the first five months of the pandemic, but contrary to these expectations, income losses have become more widespread than expected as time has passed.
ECONOMIC FORECAST
Each quarter, the OCFO publishes an economic forecast along with a revenue estimate that tracks the projected revenues for the next four fiscal years. These forecasts are generally
released in February, June, September, and December. The February forecast is the most important one, as it provides the baseline revenue projections that shape the next fiscal year’s budget. The February 2020 revenue letter did not provide any new estimates or economic projections; rather, it reflected on the deep uncertainties about the future, adopting a “wait and see” approach. The budget was likewise delayed as the city focused on the emergency response to the pandemic. The OCFO released a revenue estimate in April, with a dramatic reduction in projected revenue for fiscal years 2020 and 2021.23 At that time, it also released an economic forecast, which showed that economic fundamentals would worsen drastically in 2020 and 2021, and that
THE 2020 STATE OF BUSINESS REPORT 27
Foggy Bottom. Photo/Bekah Richards.

improvements in the following two years would come too slowly to make up for the losses.
In the April forecast, every variable that matters for DC’s economic health and growth showed significant deterioration compared to expectations in December 2019. At that time, population and households—the main drivers of income earned in the city and income taxes paid—were projected to grow at 0.9 percent and 1 percent, respectively, in fiscal years 2021
and 2022; in April, these projections were pared back to 0.6 percent and 0.7 percent, respectively. In December 2019, employment in DC was projected to grow at rates between 0.6 percent and 1.1 percent through fiscal years 2021 and 2023; by April, it was projected to contract by 5 percent. DC’s Real Gross Domestic Product (the value of all goods and services produced in the city), wages earned in the city, and real personal incomes were likewise projected to decline (Figure 11). Much
28 PIVOTING FROM PANDEMIC TO RECOVERY
A “streetery” on Dupont Circle’s 19th Street. Photo/Joe Flood.

FIGURE 11 – Economic forecast December 2019 v. April 2020
FY18
FY19
FY20
FY21
FY22
FY23
$120
$125
$130131.40
133.90
Real GDP - DC ($billions)
FY18
FY19
FY20
FY21
FY22
FY23
$45
$46
$47
$48
$49
$5050.400
48.280
Real Personal Income ($billions)
FY18
FY19
FY20
FY21
FY22
FY23
$75
$80
$85
$9092.70
85.81
Wages in DC ($billions)
FY18
FY19
FY20
FY21
FY22
FY23
700
710
720
730
733.60
723.80
Population (000)
FY18
FY19
FY20
FY21
FY22
FY23
760
780
800
820 819.40
798.50
Employment (000)
FY18
FY19
FY20
FY21
FY22
FY23
310
315
320
325324.70
320.20
Households (000)
Source: DC Office of the Chief Financial Officer revenue certification letters for December 2019 and April 2020Dec-19 Forecast Apr-20 Forecast
THE 2020 STATE OF BUSINESS REPORT 29
like the national forecasts,24 the economic forecast for DC projects a relatively rapid recovery in 2021, but it remains cautious of risk.
BUSINESS EXPERIENCES AND EXPECTATIONS
Beginning the last week of April, the U.S. Census Bureau began implementing weekly surveys to gauge the impact of the pandemic-induced recession on small businesses across the country.25 These data show that throughout the pandemic, in every week surveyed, at least 80 percent of DC businesses reported experiencing moderate or large negative
impacts. At the beginning, more than three-quarters of small businesses reported losing revenue, receipts, or sales. Over time, this share has declined to 27 percent (week ending August 22), suggesting that some businesses were able to shift to alternative means of operations that helped restore some of their cashflow. Still, by the end of August, one-fifth of small businesses were reporting that they had missed a scheduled payment such as rent, payroll, or a utility bill (Figure 12).
Among most small businesses that remained open, the structure of operations had to change significantly to adjust to the requirements of social distancing and isolation. For many, this

meant reduced operational capacity. Only 36 percent of small businesses reported (the week ending August 22) that their operating capacity was the same as a year ago. A third were operating at less than half of their normal capacity, and 27 percent reported that their operational capacity had declined but remained
above half of their normal capacity. Over the course of the pandemic, some 60 percent of small businesses consistently predicted that it would take more than four months to return to normal. However, as the months progressed, the projected recovery time has increased.
30 PIVOTING FROM PANDEMIC TO RECOVERY
FIGURE 12 – Small business experiences and expectations in the District of Columbia
2-M
ay
9-M
ay
16-M
ay
23-M
ay
30-M
ay
6-Ju
n
13-J
un
20-J
un
27-J
un
15-A
ug
22-A
ug
0%
20%
40%
60%
80%
53% 52%
52%
27%
49%
48%
77%
62%65%
73%
36%
A decline in revenues, receipts, or sales
2-M
ay
9-M
ay
16-M
ay
23-M
ay
30-M
ay
6-Ju
n
13-J
un
20-J
un
27-J
un
15-A
ug
22-A
ug
0%
20%
40%
60%
80%
26%
37%
24%
24%
22%18%
21%
34%
34%
20%
34%
A missed payment like rent, payroll, or utilities
2-M
ay
9-M
ay
16-M
ay
23-M
ay
30-M
ay
6-Ju
n
13-J
un
20-J
un
27-J
un
15-A
ug
22-A
ug
0%
20%
40%
60%
80%
Large negative effect
Moderate negative effect
A moderate or large negative impact
0% 10% 20% 30% 40% 50% 60% 70%
27%Decreased less than 50%
32%Decreased 50% or more
36%No change
Change in operating capacity from one year ago
2-M
ay
9-M
ay
16-M
ay
23-M
ay
30-M
ay
6-Ju
n
13-J
un
20-J
un
27-J
un
15-A
ug
22-A
ug
0%
10%
20%
30%
40%
50%
60%
70%
80%
90%
More than 6 months
4-6 months
Expected time to retun to normal operating capacity
2-M
ay
9-M
ay
16-M
ay
23-M
ay
30-M
ay
6-Ju
n
13-J
un
20-J
un
27-J
un
15-A
ug
22-A
ug
0%
10%
20%
30%
40%
50%
60%
70%
80%
Under 3 months
3 or more months
Cash in hand from all sources including loans
Capacity and expectations:
Source: U.S. Census Bureau Small Business Pulse Surveys
Share of businesses that experienced:

THE 2020 STATE OF BUSINESS REPORT 31
FIGURE 13 – Business needs in the next six months, reported in August 2020
0% 5% 10% 15% 20% 25% 30% 35% 40%
Better provide for safety of customers and employees26%
Obtain financial assistance/additional capital36%
Develop online sales or websites16%
Identify and hire new employees25%
Increase marketing or sales38%
None of the above26%
Business needs in the next six months
Source: U.S. Census Bureau Small Business Pulse Surverys Week ending August 15
During this time, local and federal programs provided much-needed cash infusions for small businesses. The District government, directly and through Events DC, made available approximately $48 million26 in microgrants that were quickly disbursed early in May 2020 and benefited approximately 25 percent of small businesses in DC. Additionally, according to the U.S. Small Business Administration, 12,484 DC small businesses (over 70 percent) received loans or grants under the Paycheck Protection Program.27 Finally, a third of businesses reported receiving Economic Injury Disaster Loans, payments to provide economic relief for small businesses and non-profit organizations experiencing a temporary revenue loss.
On average, only about a fifth of small establishments reported that they had not
yet needed a loan or financial assistance. Availability of loans and grants helped increase cash in hand during June, with about 40 percent of small businesses reporting three or more months of cash in hand.
In August 2020, the need reported most by U.S small businesses was to increase marketing and sales in the next six months (38 percent), followed by the need to obtain financial assistance or additional financial capacity (36 percent). About a quarter of small businesses reported the need to better provide for the safety of their customers and employees, and to identify and hire new employees. These are good signs suggesting that businesses may be ready to expand hiring, but only if they can secure additional funds, either through expanded operations or financial assistance,
32 PIVOTING FROM PANDEMIC TO RECOVERY
and ensure the safety of employees through personal protective equipment (PPE) and other measures (Figure 13). These data suggest that while many small businesses were able to stay open, they lost a significant amount of capacity and will have difficulty recovering without additional supports. Local and federal governments can assist with small business recovery efforts through financial assistance and by centralizing and subsidizing protective equipment for small businesses and non-profits.
HOUSEHOLD EXPERIENCES AND EXPECTATIONS
The pandemic forced many adults aged 18+ out of work and, consequently, many households experienced income losses. By the end of May 2020, over 40 percent of adults aged 18+ reported experiencing income losses in the previous month; by mid-
July, this share had declined to about a third, suggesting mild improvements in economic conditions (Figure 14). Similarly, the share of adults aged 18+ who were expecting an income loss also declined beginning in mid-May, from its highest level of 36 percent to 21 percent by the middle of July. Both experience with and expectations of income losses were more pronounced among adults who live in households with children (and especially in households with four or more persons), among those who do not have a college degree, and among those who live in households with income levels under $50,000 per year.
Loss of income meant that many households faced missing rent or mortgage payments. According to the National Multifamily Housing Council, prior to the pandemic, the share of renters in multifamily buildings that missed rent
A front porch in Petworth. Photo/Bekah Richards.

THE 2020 STATE OF BUSINESS REPORT 33
FIGURE 14 – Income losses—experienced and expected—among DC residents aged 18+
Experienced loss of income in the previous four weeks Expect loss of income in the next four weeks
May 4 May 19 Jun 3 Jun 18 Jul 3 May 4 May 19 Jun 3 Jun 18 Jul 3
0%
5%
10%
15%
20%
25%
30%
35%
40%
Shar
e of
adu
lts a
ged
18+
38%
37% 37%
36%
39%
32%
42%
33%
42%42%
35%
27%
36%
28%
28%
23%
21%
23% 23%
33%31%
23%
Household experience and expectations with income loss
Source: U.S. Census Bureau Household Pulse Surveys
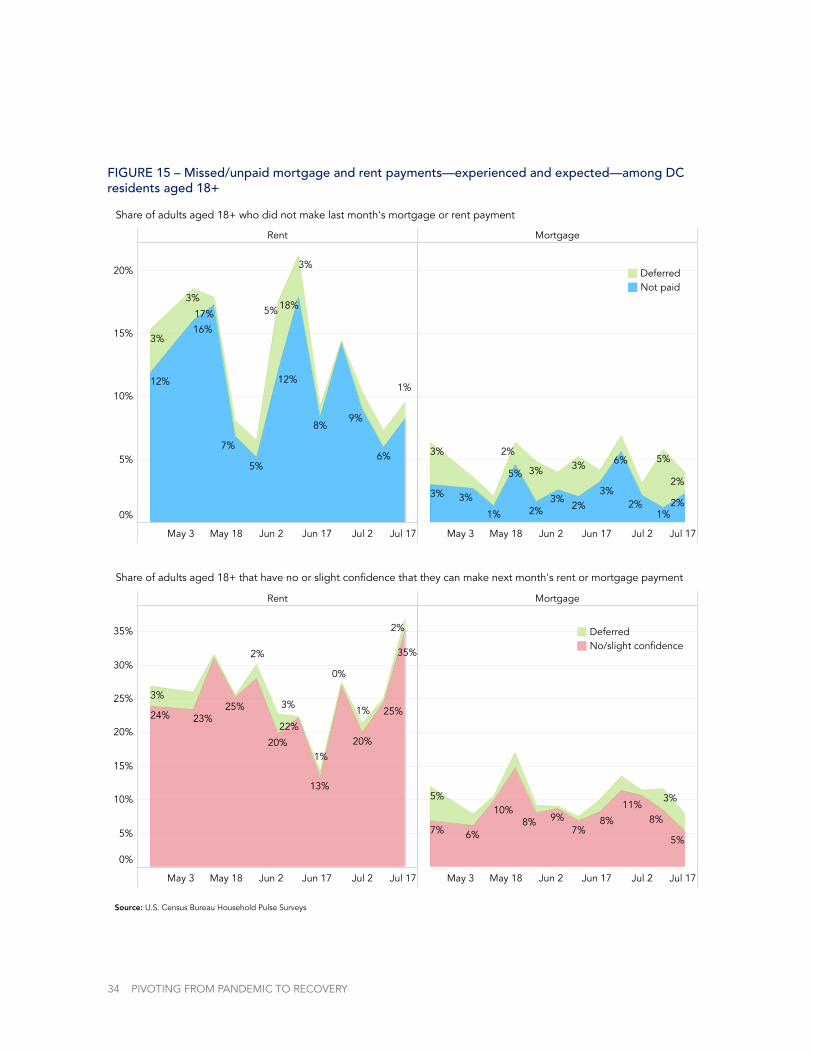
payments ranged from 4 percent to 6 percent. In August 2020, that share had climbed up to 8 percent.28 Data from the U.S. Census show that among DC residents aged 18+ (who could be sharing the same household), 12 percent to 18 percent missed rent from the beginning of April to mid-May (and an additional 3 percent were able to defer rent). This share declined through June and stood at 6 percent to 8 percent by the middle of July. Missing a mortgage payment was relatively rarer, varying between 1 percent and 3 percent from April to mid-July of 2020. Interestingly, mortgage holders were more likely to obtain deferrals through this period of the pandemic. In the first week of July, for example, 5 percent of DC renters reported that they were able to defer rent in the previous month (Figure 15).
Household expectations about their ability to meet rent or mortgage payments in the next
month were more dire than their actual ability. During the same period, on average, 22 percent of DC residents aged 18+ predicted that their chances of paying rent were slim to none in the next month. This share was at its highest—at 35 percent—by mid-July (the latest date for which we have data). Projections about the ability to meet mortgage payments were similarly more pessimistic than households’ actual track record. In July, 1 percent to 2 percent of adults reported missing their mortgage payment, but when asked in June, 7 percent to 9 percent had no confidence or slight confidence that they would be able to pay their mortgages.
Return to work is a key factor in reigniting the District’s economy. Many small businesses in DC report that they would have to identify and hire new workers in the next six months to be able to return to normal levels of operations. Given this need, the sharp declines in DC’s resident
34 PIVOTING FROM PANDEMIC TO RECOVERY
Rent Mortgage
May 3 May 18 Jun 2 Jun 17 Jul 2 Jul 17 May 3 May 18 Jun 2 Jun 17 Jul 2 Jul 17
0%
5%
10%
15%
20%
25%
30%
35%
35%2%
3%
1%
0%
1%
2%
25%
13%
24%25%
3%
23%22%
20%20%
9% 8%8%8%
3%10%
5%
5%
11%
7% 7%6%
Share of adults aged 18+ that have no or slight confidence that they can make next month's rent or mortgage payment
Rent Mortgage
May 3 May 18 Jun 2 Jun 17 Jul 2 Jul 17 May 3 May 18 Jun 2 Jun 17 Jul 2 Jul 17
0%
5%
10%
15%
20%
1%12% 12%
3%
3%
9%
18%
8%
17%
5%6%
5%3%
16%
7%6%
3%
3% 3%3%
3%
2%3%
2%
2%
2%
5%5%
2% 1%
3% 2%
1%
Share of adults aged 18+ who did not make last month's mortgage or rent payment
Source: U.S. Census Bureau Household Pulse Surveys
DeferredNot paid
DeferredNo/slight confidence
FIGURE 15 – Missed/unpaid mortgage and rent payments—experienced and expected—among DC residents aged 18+

THE 2020 STATE OF BUSINESS REPORT 35
labor force—that is, sharp increases in the number of adults who are not actively looking for work—is a cause for concern.
According to the Bureau of Labor Statistics, between March and July of 2020, the District’s labor force shrank by 27,400, from 420,500 in February. Data from the Census Bureau’s Household Pulse Surveys provide some insight on why DC workers are becoming increasingly less likely to look for work. During the third week of July, 205,000 residents reported that they were not employed in the last seven days, the survey found. Of this group, approximately 25 percent were retired, sick, or disabled for a reason other than COVID-19; and 45 percent were out of work because they were laid off, furloughed, or their employer went out of
business. This leaves approximately 27,500 adults (a number comparable to those who left the labor force) who have stopped looking for or have been unable to return to work. Among this group, the most common reason for not working is having to take care of children or the elderly (13,143, or nearly half those who appear to have stopped looking for work). The second common reason was the concern of getting or spreading the disease (7,300, or a quarter of those who appear to be discouraged) (Figure 16).
FIGURE 16 – Reported reasons for not working in the last seven days among DC residents aged 18+
Likely left labor force
Jun 11 Jun 21 Jul 1 Jul 11
0K
5K
10K
15K
20K
25K
30K
35K
40K
45K
50K
55K
Don't want to be employed at this timeJuly 16: 6,903 (25%)
Concerned about getting or spreading COVID-19July 16: 7,353 (27%)
Caring for children or elderlyJuly 16: 13,143 (48%)
Likely still in labor force
Jun 11 Jun 21 Jul 1 Jul 11
0K
10K
20K
30K
40K
50K
60K
70K
80K
90K
Source: U.S. Census Bureau Household Pulse Surveys
Top reported reasons for not working in the last seven days
Laid, furloughed, or no hours because ofCOVID-19-related business impact
July 16: 92,399
WHAT ARE SOME OF THE RISKS TO RECOVERY, AND HOW CAN POLICY HELP CLEAR THE PATH TO RECOVERY?
36 PIVOTING FROM PANDEMIC TO RECOVERY
As the previous two sections chronicled, the impact of the pandemic-induced recession on DC has been swift and deep. Confinement measures and social distancing rules have been necessary for reducing the risk of spreading COVID-19, but they are putting unprecedented pressure on DC’s labor market and economy, creating both short- and long-term risks that can impede economic recovery.
Short-term economic risks include continued stagnation in economic activity if workers cannot return to work due to lack of child care or worries about their health, and a larger number of businesses closing doors if they cannot increase sales to generate revenue or find workers. While the District’s workforce includes many professionals who can work from home, local economic activity—including activity serving commuters and tourists such as hotels, restaurants, retail, transportation
services, office and administrative support companies, and personal services—account for a substantial share of employment, especially for low- and middle-wage jobs. As seen in the data, businesses in these sectors have experienced greater disruptions, and their workers constitute a larger share of the unemployed. If these trends continue, more households will feel financial strains, amplifying inequalities already present in the city.
The DC government is taking the lead in responding to the crises—from reopening protocols, to supports for small- and medium-sized businesses, to aids to households. Large savings from previous years have made it possible for the city to maintain and even expand public services and supports while maintaining its workforce. But continued economic distress also poses a risk for future revenue and could force budget cuts or furloughs.
A “return to normal” will depend on the availability of a cure or a vaccine. At the same time, local action, including the policies the city adopts during and after the crises, can mitigate some of the risks, help minimize economic losses, and support a stronger recovery.

THE 2020 STATE OF BUSINESS REPORT 37
BUSINESS FORMATION AND ENTREPRENEURIAL CAPACITY
At the onset of the pandemic, the focus of public policy was limiting the transmission of COVID-19. Business closures and limited street-level activity that came with stay-at-home orders have been—and continue to be—necessary. However, they are depleting—and in some cases, destroying—DC businesses’ capacity to bounce back when it is time to grow and thrive again. This makes it even more important to mitigate the economic impacts in the short term and build a more resilient local economy in the long run.
In the immediate term, three key issues have emerged for businesses in the District: the
impact of closures and uncertainty associated with reopening on revenue and business viability; losing hard-gained staff and operational capacity; and adapting to a new normal.29
At first, businesses were seeking life support to avoid laying off workers, direct unemployment support to workers if they couldn’t, and assistance with rent. In late March 2020, the uncertainties were so great and the impact on small business revenue so dire that some business owners thought they would have to shut down their operations permanently. Others expressed concern that they would not be able to rehire their team and operate in what will likely be a fragile economy. Many business owners were clear that reopening would not mean they could immediately return
John A. Wilson Building and Freedom Plaza. Photo/Aimee Custis.
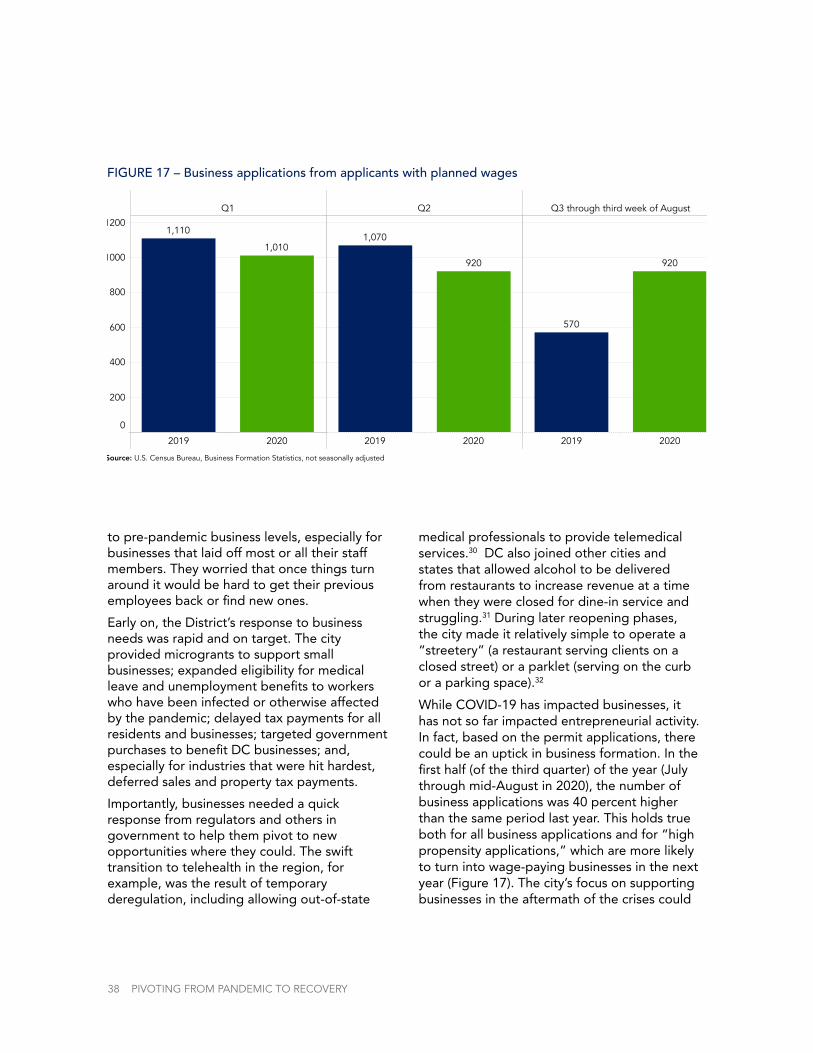
38 PIVOTING FROM PANDEMIC TO RECOVERY
FIGURE 17 – Business applications from applicants with planned wages
Q1 Q2 Q3 through third week of August
2019 2020 2019 2020 2019 2020
0
200
400
600
800
1000
12001,110
1,0101,070
920
570
920
Business applications in DC
Source: U.S. Census Bureau, Business Formation Statistics, not seasonally adjusted
to pre-pandemic business levels, especially for businesses that laid off most or all their staff members. They worried that once things turn around it would be hard to get their previous employees back or find new ones.
Early on, the District’s response to business needs was rapid and on target. The city provided microgrants to support small businesses; expanded eligibility for medical leave and unemployment benefits to workers who have been infected or otherwise affected by the pandemic; delayed tax payments for all residents and businesses; targeted government purchases to benefit DC businesses; and, especially for industries that were hit hardest, deferred sales and property tax payments.
Importantly, businesses needed a quick response from regulators and others in government to help them pivot to new opportunities where they could. The swift transition to telehealth in the region, for example, was the result of temporary deregulation, including allowing out-of-state
medical professionals to provide telemedical services.30 DC also joined other cities and states that allowed alcohol to be delivered from restaurants to increase revenue at a time when they were closed for dine-in service and struggling.31 During later reopening phases, the city made it relatively simple to operate a “streetery” (a restaurant serving clients on a closed street) or a parklet (serving on the curb or a parking space).32
While COVID-19 has impacted businesses, it has not so far impacted entrepreneurial activity. In fact, based on the permit applications, there could be an uptick in business formation. In the first half (of the third quarter) of the year (July through mid-August in 2020), the number of business applications was 40 percent higher than the same period last year. This holds true both for all business applications and for “high propensity applications,” which are more likely to turn into wage-paying businesses in the next year (Figure 17). The city’s focus on supporting businesses in the aftermath of the crises could

THE 2020 STATE OF BUSINESS REPORT 39
be one reason, and these supports should continue even after the pandemic’s effects begin to diminish.
RETURN TO WORK
As noted, when surveyed in August, DC businesses reported that they plan to focus on bringing their workers back to work in the next six months (ending February 2021). At the same time, 6.5 percent of the District’s adults have left the labor force, and for them, the risks associated with transmitting the disease and child care appear to be the key impediments to return to work.
With schools and child care centers closed or operating remotely, parents are having to give up jobs or reduce their hours to shoulder the
additional responsibilities of educating and caring for their children without outside help. In the long run, workers may choose to stay home if they are not comfortable with sending their children back to school or child care centers. They may also be forced to stay home if they cannot find affordable child care centers.
In mid-May of 2020, 88 percent of all child care facilities in DC reported being closed,33 many relying on insufficient government subsidies and family payments to cover utility costs and payroll. Facilities that remained open haven’t fared much better, with 71 percent of open facilities operating at less than 25 percent of capacity. The industry had been operating on narrow profit margins prior to the pandemic, with many workers making near minimum wage and qualifying for public assistance.34
Tivoli Theatre in Columbia Heights. Photo/Aimee Custis.
40 PIVOTING FROM PANDEMIC TO RECOVERY
Now, due to pandemic-related financial pressures, 20 percent of child care slots could be lost in the District, a city with an already limited child care supply and where the capacity for infants and toddlers represents about 28 percent of this population.35 These child development facilities are located throughout the city, with some of the largest centers situated downtown where some parents commute to work, affecting residents in every ward.
To protect workers and children, reopening guidelines have put in place new restrictions and protocols such as limiting the number of slots for children, which hurts revenues and sustainability and prevents parents from returning to work in reopening phases—a problem seen in Maryland. Child care facilities will also have to incur additional sanitation costs, further hurting their ability to stay afloat. Without proper financial support, reopening under these conditions may not be possible for child care facilities, disproportionately affecting small businesses, parents, women, and people of color in DC.
The health of essential workers is another concern that could make return to work more difficult. According to Census Bureau data, frontline workers—grocery store clerks, nurses, cleaners, warehouse workers, and bus drivers, among others36—comprise 13.6 percent of the District’s employees and 17.8 percent of working parents with children. Regulatory interventions designed to limit the spread of disease, like PPE and sanitation protocols, have also increased the costs of doing business while capacity limitations are depressing revenue. Since reversing cleaning protocols and capacity limits is not likely in the short run, the District must consider other policies to reduce business costs, such as lessening tax obligations and removing other costly regulatory barriers.
The District would also have to rethink its approach to transportation to help workers return to work. Transportation is already a concern among essential workers but will
become a bigger impediment as businesses begin reopening and teleworking organizations reopen their physical offices. Even with subsidies, public transportation needs high-density ridership to be financially feasible. Metro’s plan to limit customers to 20 per railcar will likely increase transit times while further weakening the transit agency’s financial prospects.
Prior to the pandemic, 34 percent of essential workers relied on public transportation to get to work, while slightly under 50 percent drove their cars. Some of these workers do not have access to a private vehicle and must take public transportation, but many do have access to a car and may be hindered by parking permitting and costs. To support the return to work of essential workers (and eventually all workers), the District must rethink its policies around cars and for-hire vehicles. For example, parking garages that are largely empty while work-from-home policies persist could be made available at reduced cost to essential workers wishing to return to work but wary of public transportation.
RISK TO REVENUE
An important element that has made DC attractive to residents, workers, and businesses is the city’s fiscal discipline and increased quality of services. The pandemic-induced recession is threatening the city’s fiscal viability. In April, city officials reduced the estimated revenue for fiscal years 2020 and 2021 by $722 million and $774 million, respectively, compared to their projections in December 2019. While significantly lower, this estimate carries a lot of risk.
The largest sources of revenue for DC are income taxes, sales taxes, and property taxes. Looking forward, there are risks associated with each source. For income taxes, the two sources of risks are continued depressed economic activity, which will reduce income taxes collected from workers, and a depressed

THE 2020 STATE OF BUSINESS REPORT 41
FIGURE 18 – Tax revenue performance in the first seven months of the calendar year, 2019 and 2020
Income YTD 2019
YTD 2020
Property YTD 2019
YTD 2020
Sales and Excise YTD 2019
YTD 2020
Gross Receipts YTD 2019
YTD 2020
Other Taxes YTD 2019
YTD 2020
Total Taxes YTD 2019
YTD 2020
$2.41B
$2.53B
$1.47B
$1.49B
$1.42B
$1.23B
$0.36B
$0.34B
$0.44B
$0.44B
$6.10B
$6.04B
All sources of revenue
2019
2020
Non-witholding$247.5M
Non-witholding$198.0M
Witholding$1,208.6M
Witholding$1,260.3M
Individual income tax components
Source: DC Office of the Chief Financial Officer
Tax revenue in the first seven months of the calendar year, 2019 v 2020
stock market, which would reduce income earned on investments.
During the Great Recession, for example, when job losses were relatively modest and personal incomes held steady with the growing resident employment, personal income tax collections declined by 10 percent, largely because of stock market declines.37 Current stock market projections for the District forecast a decline of 15 percent by the end of 2020, followed by a quick comeback.38 So far, the stock market has performed significantly better
than expectations. Accordingly, income tax collections held up in the first seven months of 2020 compared to the same period in 2019, but a breakdown of individual income tax collections shows that non-withholding taxes (taxes paid on income other than wage and salary earnings) are below their 2019 levels (Figure 18).
Sales taxes, on the other hand, are lagging. Half of the District’s sales taxes are generated by hotels, restaurants, and arts and entertainment venues. Consequently, the impact of the

42 PIVOTING FROM PANDEMIC TO RECOVERY
pandemic-induced shutdown is first felt through this revenue source. Sales taxes were projected to decline by nearly 22 percent (or $342 million) in fiscal year 2020, and by the end of July, the city had already seen a $200 million decline. The main risk that threatens sales tax revenue is a second wave of COVID-19-related closures. Even when some establishments shift to online activities, such an adjustment will not make up for lost commuter activity or depressed tourism.
Because of administrative practices, for income-generating properties like office buildings, hotels, and multifamily rental apartments, real property taxes reflect the economic conditions from two years prior. For example, tax year 2020 assessments for these properties were based on their income and expense statements from 2019. Tax bills in 2021 will reflect the pre-pandemic activity of 2019. For these reasons, the revenue projections do not foresee a decline in real property taxes in the next few years.
However, if the income-generating capacity of buildings is severely impacted through the pandemic—through dismal occupancy at hotels,39 stalled lease activity in commercial office buildings, or missed rents—the revenue impacts could be much deeper and come much sooner, especially if more landlords (than what is usually the case, or is anticipated in the revised revenue estimates) successfully appeal their property assessments. Recovery could also be further halted if commuter activity is permanently depressed, and commercial tenants reduce their footprints either by leasing less space or closing shop.
In the long run, DC could experience significant changes to its economy and capacity to raise revenue and spend on government programs if it ceases to be a destination for residents, workers, and businesses. There also are signs that the preference for urban living could be weakening during and after the pandemic. With rapid transition to telework, just the loss of commuter activity could mean large losses to DC coffers. For example, a 2017 study from the D.C. Policy
Center found that a 43 percent decline in cars on the street could reduce automobile-related revenue the city collects (from its parking tax to automated traffic enforcement revenue) by $373 million. The original study was done in the context of autonomous vehicles but applies to the current situation.
The longer-term impacts will depend on the length of lockdowns, other regulations regarding social distancing, the scale of indirect impacts such as drops in consumer spending, and the effectiveness of the short-term policy responses. The District could be left with a weaker economy if it loses appeal as a destination for residents, businesses, and workers. To mitigate this risk, the city should prioritize policies that would strengthen its competitiveness in the region.
Impaired demand for office space in DC will also permanently reduce revenue. A recent CoStar analysis suggests that even if as few as one in four workers who have converted to telework during the pandemic permanently stay in telework, the office vacancy rate could climb to as high as 14.6 percent across the nation (from its current rate of 9.7 percent). In the District, downtown vacancy rates have been hovering at 15 percent prior to the pandemic. Additional declines in demand, if they continue after the end of the crisis, can bring vacancy rates to unsustainable levels. If the vacancy rates remain high because of a permanent decline in demand for office space, building valuations will likely decline, reducing future tax revenue for the city.
Ultimately, a decline in the importance of business location could mean an entirely different future for DC. Two-thirds of the District’s workforce are commuters. A recent study found that half the workers in the Washington metropolitan area can work from home—the third-highest jurisdiction in the nation.40 During the pandemic, many companies in the region, and the federal government, have allowed their workers to work indefinitely from

THE 2020 STATE OF BUSINESS REPORT 43
home. Telework is providing some protection to District businesses and workers through the pandemic, but it could also mean that workers can work for a District establishment without coming to their office in the city for long periods of time. If worker location ceases to be important, then, when recovery begins, business location could also matter less in attracting a talented workforce. As a result, business establishments might be more inclined to move from high-cost jurisdictions such as the District to lower-cost jurisdictions.
HOW CAN POLICY HELP CLEAR THE PATH TO RECOVERY?
Local policy will matter in shaping recovery and mitigating against both the short-and longer-term risks and negative impacts from the pandemic-induced recession. While the District government alone cannot make up for the economic losses incurred as a result of the
recession, it can adopt the right policies to shape and strengthen economic recovery, even under adverse conditions.
To support business resiliency and preserve entrepreneurial capacity, the District can help create conditions which will allow businesses to continue to operate and expand sales and revenue. These include:
• Provide an expanded and subsidized supply of PPE to businesses to help reduce the risk of transmission between workers and customers.
• Develop rules around access to public space, and especially outdoor spaces to conduct business, and support investments in power infrastructure and equipment such as outdoor heaters to help businesses operate successfully and safely through the fall.
• Reduce permitting costs and simplify
Extended sidewalks replace parking in support of social distancing. Photo/Ted Eytan.

procedures, possibly deferring permit costs, for example, to sustain existing businesses and foster the creation of new businesses.
• Review regulatory restrictions on business operations and professional licensing, especially if regulations interfere with virtual provision of services or off-premise services.
• Provide technical assistance and consultations to help navigate the new regulatory landscape.
• Support continuing education for small business owners to assist with the challenges of maintaining a productive workforce, such as the transition to online sales, legal advice, or assistance with PPP loan compliance.
Businesses are also concerned about finding workers when it is time to reopen or expand operations. To support return to work, the District can:
• Consider transportation interventions that are safe alternatives to crowded public transportation.
• Invest in programs to close the digital divide, and support individuals and small business owners in obtaining the necessary technology to be able to work productively from home.
• Provide operational support for child care centers to cover the increased costs of sanitation, and the decrease in revenue due to new staffing restrictions.
• Consider temporary changes to zoning to allow for alternative uses of underused spaces.
• Provide parking subsidies for essential workers who are wary of taking public transportation.
The District was able to maintain its spending and preserve all its workforce by using the city’s substantial savings. However, if the period of economic activity remains depressed beyond the revenue projections, difficult decisions may have to be made. To maintain the fiscal health and resiliency of the city, the District can:
• Conduct a comprehensive expenditure review of DC government finances in anticipation of a future with tighter revenue.
• Identify programs and expenditures that could be put on hold to divert funds to interventions related to the COVID-19 response.
• Consider the economic impact of all new policies, not just the fiscal impact, to ensure that the city’s long-term competitiveness is preserved.
• Consider alternatives to the current unemployment insurance tax structure that balances benefits with the additional costs of raising taxes on businesses..
Finally, the District must be thoughtful about how recovery will look. COVID-19 has illuminated inequalities in the city, from access to amenities under lockdown, to exposure to transmission risk to household resiliency. The District has recovered from economic crises (both prolonged, and short) in the past, but recovery did not improve prospects for all residents. In the aftermath of the pandemic, the city can be more diverse, more inclusive, and more welcoming if it adopts a recovery plan that invests in workforce development, eases the restrictions on housing, builds a strong infrastructure, and supports stronger amenities in neighborhoods that lack them today.
44 PIVOTING FROM PANDEMIC TO RECOVERY

THE 2019 STATE OF BUSINESS REPORT 45
Cyclists at 14th & U Street NW/ Photo/Ted Eytan.

46 PIVOTING FROM PANDEMIC TO RECOVERY
THE DC CHAMBER OF COMMERCE AGENDA FOR 2020-2021
Challenging times are awaiting the District’s businesses. We do not know the timeline for a cure or a vaccine, but we cannot wait for their availability to restart the District’s economy. Businesses are shifting their operations in dramatic ways to adapt to the new physical and economic environment forced by the pandemic, so that District residents, workers, and businesses can continue to thrive during this unique time.
For the DC Chamber of Commerce and its membership, the most important priority is that current District policies being considered by elected officials are focused on creating an environment that supports economic recovery. In the short term, three important components of recovery will be: maintaining existing business and entrepreneurial capacity, supporting return to work, and keeping the District’s fiscal house in order. Government and business collaboration will be key to opening businesses safely, helping our employees return to work, and rebuilding the private sector so that the District can rise out of this recession
with a stable financial future and keep the engine of the economy running smoothly.
The Chamber has developed a 2020-2021 Policy Framework that will serve as a strategic guide shaping the Chamber’s policy work and actions as we continue to advocate, educate, and communicate on behalf of our members.
To help maintain and expand business and entrepreneurial capacity in DC, the Chamber will:
• Advocate for the elimination of or the creation of new taxes and fees that will endanger the efforts to rebuild the economy or the ability to retain and attract new small and large businesses. Support robust incentives and resources to increase more foreign domestic investment (FDI) and to support the recruitment of new firms to the District, as well as to encourage businesses to not relocate to surrounding jurisdictions.
• Advocate for additional business support and resources from the government including immediate working capital. Advance full funding of the Business Recovery Grants that have been adopted by the DC Council.

THE 2020 STATE OF BUSINESS REPORT 47
• Provide technical support and added programing to support the recovery of local and small businesses.
• Encourage the District to make it easier for businesses to start and grow in the District and work with decision-makers on a suite of incentives and supports to retain more employers.
• Advocate for more business outreach and notice of the changing regulatory landscape. For example, compliance with and enforcement of local regulatory mandates are issues that impact our members and others in the business community every day. Yet District laws change frequently and on an emergency basis making it difficult for the average business owner to stay up to date. A more effective approach to compliance is to provide additional education, training, and
outreach on the recent changes and not to fine and overly penalize businesses to the point they cannot operate.
To help make workplaces safer and remove barriers to returning to work, the Chamber of Commerce will:
• Encourage elected officials to work collaboratively with businesses on plans and policies that ensure the unemployment trust fund is solvent, alleviates the ongoing financial burden on employers, and the structure of the fund aligns to contribute to economic growth and lowering the unemployment rate.
• Support efforts to increase the infrastructure and resources to accommodate connectivity and e-commerce, driverless cars, and innovation. Prioritize infrastructure by
18th Street in Adams Morgan reconfigured for use as a “streetery.” Photo/Ted Eytan.

advocating for the expansion of WiFi and technology resources to support businesses that need to pivot their brick-and-mortar locations to e-commerce.
• Support efforts that allow the city to maintain its child care capacity and open schools as quickly and as safely as possible, ensuring workers are able to return to work and do not face impediments because of child care.
• Ensure that the District’s workforce—especially essential workers—are safe, and advocate for greater access to health care for communities east of the Anacostia River.
• Dissuade government from considering policies that weaken business owners’ operating autonomy, dictate personnel decisions, and disrupt the employer-employee relationship.
To ensure that the DC government’s finances remain strong during and after the pandemic-induced recession, the Chamber will:
• Advocate for a comprehensive expenditure review in the government in anticipation of a future with tighter revenue.
• Advocate for the adoption of economic impact statements on legislation as the private sector is key to the sustainability and overall economic health of the District. Request that elected officials seek input
from relevant stakeholders, including non-government sources, interested parties, and impacted industries, in advance of introducing legislation.
• Advocate for an analysis of District’s revenues and tax structure with a consideration of longer-term risks.
• Advocate for a more comprehensive approach to fiscal policy and budgeting as revenue sources continue to be impacted by the existing recession, and prevent ad hoc policy making without proper stakeholder input and consideration of the economic and competitive impacts.
• Advocate that proposed language in appropriation bills should be germane to the budget. The budget support act should not be the vehicle that shifts or changes the scope of current policy practices by bypassing the traditional legislative process.
48 PIVOTING FROM PANDEMIC TO RECOVERY
[email protected] | dcchamber.org Follow us on Twitter: @dcchamber

The District’s commercial revitalization initiative to transform emerging corridors into thriving livable, walkable, and shoppable neighborhood centers.
Grants available to brick and mortar businesses located on designated Great Streets corridors.
GREAT STREETS RETAIL GRANT Awards up to $50k towards storefront renovations, equipment purchases
and technology enhancements to support e-commerce.
GREAT STREETS RESILIENCY GRANT Awards between $10k-$12k for business model restructuring, business continuity
planning, infrastructure development (such as e-commerce platform procurement), related COVID-19 marketing expenses, and specified operational expenses.
For more information, visit GreatStreets.dc.gov
SHOP LOCAL OR ONLINE!
EAT
GREAT STREETS

ENDNOTES
1 “Business Cycle Expansions and Contractions”. National Bureau of Economic Research. Archived from the original on 5 March 2020.2 The identification of high-propensity applications is based on the characteristics of applications revealed on the IRS Form SS-4 that are associated with a high rate of business formation. High-propensity applications include applications: (a) for a corporate entity, (b) that indicate they are hiring employees, purchasing a business, or changing organizational type, (c) that provide a first wages-paid date (planned wages); or (d) that have a NAICS industry code in manufacturing (31-33), retail stores (44), health care (62), or restaurants/food service (72).3 Aimee Custis, “A Timeline of the D.C. Region’s COVID-19 Pandemic,” D.C. Policy Center, 2020, https://www.dcpolicycenter.org/publications/covid-19-timeline/.4 Alexander Bartik et al., “How Are Small Businesses Adjusting to COVID-19? Early Evidence from a Survey,” SSRN Electronic Journal, April 12, 2020, https://doi.org/10.2139/ssrn.3574741.5 Tracy Hadden Loh, Annelies Goger, and Sifan Liu, “‘Back to Work in the Flames’: The Hospitality Sector in a Pandemic” (Washington DC, 2020), https://www.brookings.edu/blog/the-avenue/2020/08/20/back-to-work-in-the-flames-the-hospitality-sector-in-a-pandemic/.6 Yesim Sayin Taylor, “COVID-19 Pandemic and the District of Columbia: What to Expect?” (Washington, D.C., 2020), https://www.dcpolicycenter.org/publications/covid-19-pandemic-economy/.7 Irish Abedejos, “How COVID-19 Is Affecting Small Businesses and What Can You Do,” Business 2 Community (Washington DC, 2020), https://www.business2community.com/small-business/how-covid-19-is-affecting-small-businesses-and-what-can-you-do-02297699.8 Downtown BID, “Downtown DC Economy Update, Summer 2020, available at https://s26552.pcdn.co/
wp-content/uploads/2020/09/DowntownDC-Economic-Update-Q2-2020.pdf9 U.S. Census Bureau Household Pulse Surveys, Week 12, available at https://www.census.gov/data-tools/demo/hhp/10 DC Chamber of Commerce (2019): “The 2019 State of Business Report: Building a Competitive City” available at https://www.dcpolicycenter.org/publications/2019-state-business-report-building-competitive-city/11 Jonathan I. Dingel and Brent Neiman, “How Many Jobs Can Be Done at Home?,” Journal of Public Economics 189 (September 1, 2020): 104235, https://doi.org/10.1016/J.JPUBECO.2020.104235.12 Uri Berliner, “Get A Comfortable Chair: Permanent Work From Home Is Coming,” NPR, June 22, 2020, https://www.npr.org/2020/06/22/870029658/get-a-comfortable-chair-permanent-work-from-home-is-coming13 Sitian Liu and Yichen Su, “The Impact of the COVID-19 Pandemic on the Demand for Density: Evidence from the U.S. Housing Market,” Research Department Working Papers, 2020, https://doi.org/10.24149/wp2024.14 Will Leimenstoll, “Autonomous Vehicles Could Have a Big Impact on D.C.’s Budget” (Washington, DC, 2017), https://www.dcpolicycenter.org/publications/autonomous-vehicles-could-have-a-big-impact-on-d-c-s-budget/.15 The details of the Phase II of the opening plan can be found at https://coronavirus.dc.gov/phasetwo.16 Austan Goolsbee et al., “COVID-19 Lockdown Policies at the State and Local Level” (Chicago, 2020), https://bfi.uchicago.edu/working-paper/2020-116/.17 Data from county comparisons of Google Community Mobility reports, available at https://tracktherecovery.org.18 U.S. Census Bureau Household Pulse Surveys.19 This is based on 2019 income distribution data for DC.
50 PIVOTING FROM PANDEMIC TO RECOVERY
https://www.dcpolicycenter.org/publications/autonomous-vehicles-could-have-a-big-impact-on-d-c-s-bud

THE 2020 STATE OF BUSINESS REPORT 51
No.
1No.
1No.
2
No.
4
No.
4
No.
5
No.
6
No.
6
No.
7
No.
9
No.
5
No.
3
Best cities for women in tech SmartAsset, March 2019
Cities in U.S. with best park systems The Trust for Public Land May 2019
Best educated cities in America CNBC, July 2018
Greenest cities in America WalletHub, October 2019
Top ranked cities for tech talentCBRE, July 2019
Best cities in America Bloomberg, June 2019
Best cities for young professionals U.S. News & World Report, January 2019
No.
6Leading life sciences markets CBRE, February 2019
Fittest cities in the U.S.U.S. News & World Report, May 2019
Best places to eat Food & Wine January 2019
Most walkable U.S. cities SmarterTravel July 2019
Top 20 high-tech cities PC Magazine, May 2019
Washington: Obviously, DC
Top cities for high-tech workers USA Today, March 2019
Available from Sarah Flood, Miriam King, Renae Rodgers, Steven Ruggles, and J. Robert Warren. Integrated Public Use Microdata Series, Current Population Survey: Version 6.0 [dataset]. Minneapolis, MN: IPUMS, 2019. https://doi.org/10.18128/D030.V6.020 Yesim Sayin Taylor, “Pandemic-Induced Unemployment Has Hit the District’s Hispanic, Latino, and Younger Workers More Intensely” (Washington, DC, 2020), https://www.dcpolicycenter.org/publications/hispanic-latino-pandemic-unemployment/.21 Information on account transactions are available at the U.S. Department of the Treasury website at https://www.treasurydirect.gov/govt/reports/tbp/account-statement/report.html.22 Data from the DC Department of Employment Services, preliminary numbers for April 2020.23 Yesim Sayin Taylor, “Tax Policy under the District’s New ‘Fiscal Normal’” (Washington, DC, 2020), https://www.dcpolicycenter.org/publications/tax-policy-under-new-fiscal-normal/.24 See, for example, the forecast from the Federal Reserve Bank Presidents and Board members issued on June 10, 2020, available at https://www.federalreserve.gov/monetarypolicy/files/fomcprojtabl20200610.pdf.25 Catherine Buffington et al., “Measuring the Effect of COVID-19 on U.S. Small Businesses: The Small Business Pulse Survey” (Washington, DC, 2020), http://www.census.gov/ces.26 DC first set aside $25 million for the DC Small Business Recovery Microgrants Program, but the program ran out of money on April 1. In late April, the city found an additional $4.3 million for the program from federal and local resources and $4 million from Events DC. The Events DC support was part of an $18 million relief program for DC restaurants, hotel industry, destination marketing, and undocumented workers.27 Sunaina Kathpalia and Yesim Sayin Taylor, “Paycheck Protection Program in the District: Hard-Hit Industries Receive a Smaller Share of Loans” (Washington, DC, 2020), https://www.dcpolicycenter.org/publications/ppploans/.28 Data available at https://www.nmhc.org/research-insight/nmhc-rent-payment-tracker/.29 Kathryn Zickuhr, “How COVID-19 Is Affecting Small Businesses in D.C.” (Washington, DC, 2020), https://www.dcpolicycenter.org/publications/small-businesses-coronavirus/.30 Philip A. Wallach and Shoshana Weissmann, “Taking Stock of COVID-19 Deregulation” (Washington, DC, 2020), https://www.brookings.edu/research/taking-stock-of-covid-19-deregulation/.
31 Caleb Pershan, “Some States Allow Takeout Booze to Help Restaurants Amid Coronavirus Pandemic,” Eater, 2020, https://www.eater.com/2020/3/20/21188482/state-liquor-laws-loosen-to-allow-takeout-alcohol-during-coronavirus-pandemic.32 The Distict of Columbia Department of Transportation’s website describes the process here. 33 National Association for the Education of Young Children, A State-by-State Look at the Ongoing Effects of the Pandemic on Child Care, May 20, 2020, available at https://www.naeyc.org/sites/default/files/globally-shared/downloads/PDFs/resources/topics/ongoing_effect_of_pandemic.naeyc_state_by_state.pdf. Accessed 21 September 2020.34 Chelsea Coffin and Amanda Chu, “D.C. Voices: Sustainability of D.C. Child Care Facilities during the Pandemic” (Washington, DC, 2020), https://www.dcpolicycenter.org/publications/child-care-facilities/.35 Steven Jessen-Howard and Simon Workman, “Coronavirus Pandemic Could Lead to Permanent Loss of Nearly 4.5 Million Child Care Slots - Center for American Progress,” 2020, https://www.americanprogress.org/issues/early-childhood/news/2020/04/24/483817/coronavirus-pandemic-lead-permanent-loss-nearly-4-5-million-child-care-slots/.36 For the full definition we have used in this calculation, please see here: https://cepr.net/a-basic-demographic-profile-of-workers-in-frontline-industries/.37 Yesim Sayin Taylor, “Tax Policy under the District’s New ‘Fiscal Normal’” (Washington, DC, 2020), https://www.dcpolicycenter.org/publications/tax-policy-under-new-fiscal-normal/.38 See the revenue certification letter issued by the Office of the Chief Financial Officer on April 24, 2020: https://cfo.dc.gov/sites/default/files/dc/sites/ocfo/publication/attachments/April 2020 Revenue Estimate Letter 042020_rev.pdf.39 WAMU, “D.C.’s Once-Thriving Hospitality Industry Is Languishing. Relief Efforts Aren’t Enough. | WAMU,” 2020, https://wamu.org/story/20/04/20/d-c-s-once-thriving-hospitality-industry-is-languishing-relief-efforts-arent-enough/. WAMU.40 Dingel and Neiman, “How Many Jobs Can Be Done at Home?” Dingel and Neiman. https://www.nber.org/papers/w26948.
52 PIVOTING FROM PANDEMIC TO RECOVERY
https://www.eater.com/2020/3/20/21188482/state-liquor-laws-loosen-to-allow-takeout-alcohol-during-co
https://www.eater.com/2020/3/20/21188482/state-liquor-laws-loosen-to-allow-takeout-alcohol-during-co
https://www.eater.com/2020/3/20/21188482/state-liquor-laws-loosen-to-allow-takeout-alcohol-during-co
https://www.naeyc.org/sites/default/files/globally-shared/downloads/PDFs/resources/topics/ongoing_ef
https://www.naeyc.org/sites/default/files/globally-shared/downloads/PDFs/resources/topics/ongoing_ef
https://www.naeyc.org/sites/default/files/globally-shared/downloads/PDFs/resources/topics/ongoing_ef
https://www.americanprogress.org/issues/early-childhood/news/2020/04/24/483817/coronavirus-pandemic-
https://www.americanprogress.org/issues/early-childhood/news/2020/04/24/483817/coronavirus-pandemic-
https://www.americanprogress.org/issues/early-childhood/news/2020/04/24/483817/coronavirus-pandemic-
https://www.americanprogress.org/issues/early-childhood/news/2020/04/24/483817/coronavirus-pandemic-
https://wamu.org/story/20/04/20/d-c-s-once-thriving-hospitality-industry-is-languishing-relief-effor
https://wamu.org/story/20/04/20/d-c-s-once-thriving-hospitality-industry-is-languishing-relief-effor

Creating a brighter future.
At Exelon, we believe that collaboration delivers better solutions. We volunteer our time and commit resources to support organizations that foster thriving communities. We are energized by these experiences and inspired to help everyone succeed.
Exelon is proud to partner with the DC Chamber of Commerce.
© Exelon Corporation, 2020

1133 21st Street NW, Suite M200, Washington, DC 20036(202) 347-7201 dcchamber.org