2020 Results Presentation - Teleborsa
27
Integrated Solutions Provider 2020 Results Presentation
Transcript of 2020 Results Presentation - Teleborsa

Integrated Solutions Provider
2020 Results Presentation

2.
3.
4.
1. Key Market trends & Corporate strategy
2020 Business highlights & Results
Outlook
ANNEX
Index

Key Market trends & Corporate strategy1.

4
Green and Digital Technology trends drive market opportunities
Key growth driversBUSector Main markets Market growth
Secondary Tesmec target sectorsMain Tesmec target sectors
Note: * increase in average annual investment to reach Paris Accord targets compared to current trends
Source: IEA, WEO, 2019
ENERGY
&
RENEWABLES TRENCHER
ENERGY▪ Environmental issues and greater focus on energy saving and
efficiency
▪ Faster growth of renewables in the electricity sector
▪ Trends related to electrification (e.g. electric cars) and
cybersecurity
Smart Grid CAGR11.8%
2019-2025
Power grid23%*
2019-2040
RAILRAIL
ENERGY ▪ Pushing improvement and safety of existing railways in order to
reduce accidents (Italy and Europe)
▪ Technical market trends include technologies for alternative
traction systems (hybrid, zero emission …)
CAGR
2.2%2019-2025
CONSTRUCTIONAND UTILITIES*
▪ Demographic boom, new cities or enlargement of existing ones
(Africa and Asia)
▪ Increasing investment in water pipes, irrigation/drainage and
wastewater management
n.a.TRENCHER
SURFACE
MINING
▪ Growing attention to security standards resulting in increase in
regulations on the use of explosives
▪ Need for technological changes to increase sustainability while
reducing operational costs (smart mining)
CAGR
1.5%2020-2023
TRENCHER
PIPELINE TRENCHER
▪ Oil and natural gas price issues
▪ More restrictive regulations on ageing pipelines in developed
markets
▪ Growing gas demand (Asia- Pacific, Russia, Africa) and need for
additional pipeline capacity
n.a.
TELECOM
&
FIBRE
▪ Increase in internet users and demand for high-speed internet
▪ Growth in demand for improved IT infrastructure, especially in
emerging economies
CAGR
5%2020-2025TRENCHER
ENERGY

INVESTMENT & DIVERSIFICATION
Corporate strategy
2020-2023
THE NEXT DEVELOPMENTS
5
Strategic drivers
▪ DIGITALISATION
▪ SUSTAINABILITY
▪ ENERGY TRANSITION
New Business Model
▪ INTEGRATED SYSTEMS
▪ DIGITAL SOLUTIONS
▪ FULL SERVICES
to increase recurring revenue streams

6
Business strategy
TRENCHERS RAILWAY
CLEAN & FAST SOLUTIONS for underground energy cable and fiber optic networks
DIGITAL & CONNECTED systems
Autonomous Mining machine (SMART Mining)
Complete package of INTEGRATED SERVICES (sales, wet/dry rental, training, mapping, survey, fleet management…)
Working vehicles CERTIFIED as passenger trains in EU
Advanced technologies for railway ELECTRIFICATION
AUTOMATED & CLOUD CONNECTED vehicles
Artificial Intelligence for UNMANNED DIAGNOSTIC & BIG DATA MANAGEMENT
Green approach with HYBRID & BIMODAL SOLUTIONS
STRINGING ENERGY AUTOMATION
ENERGY
INNOVATIVE WORKING
METHODOLOGIES for grid
maintenance
Green technologies for
SUSTAINABLE JOBSITES
AUTOMATING process
for new line construction
INTEGRATED and
OPTIMIZED approach to
underground HV links
DIGITAL solutions and
Substation Automation
SYSTEMS
CYBERSECURITY
requirements for Grid
safety
IOT integration for energy
data analytics
VIRTUALIZATION of
technological application on
multi purpose platform

2020 Business highlights & Results2.

2020 highlights
Business model focused on increasing recurring revenues:
▪ Wide offer of services and cable laying solutions especially in EU (TLC, energy)
▪ Increasing demand of rental equipment instead of CAPEX
Relevant contracts awarded in the renewable energy field (Australia..)
Great opportunities in West Africa in the surface mining industry (bauxite..)
Consolidation of the expertise in the diagnostic field:
▪ award of the RFI tender for a total value of 49.8 M€ for the supply of diagnostic railway vehicles
Growing importance of recurring business (Full Maintenance Service)
Solutions for catenary refurbishment (working methodology)
STRINGING ENERGY AUTOMATION
TRENCHERS RAILWAY
8
ENERGY
CORPORATE▪ New ERP project implementation and go live for Tesmec SpA▪ Cost saving actions
Important growth in strategic markets:
▪ US & Australia positive trend
confirmed
Machines Improvements:
▪ Digital 4.0 range becomes
the standard
▪ Growing business on tailor
made solutions
Green innovation & newmaintenance methodologies:
Growth strategy on Transmission market in Italy:
▪ New systems engineering approach to offer high added value and turnkey solutions for HV substations
▪ Increased opportunities for integrated remote controlsystems based on IEC 61850
Push on innovative technologies:
▪ Growing business on cyber-security protection and control solutions

2020.FY Closing
9
Achieved the target communicated during theprocess of the share capital increase
(1) Revenues: (mainly TRS Sales) affected by theactions taken by public authorities to containthe spread of the COVID-19. After theslowdown and lockdown phases, the Grouprestarted its activities in May, reaching fulloperations during June and generate around100 M€ of revenues in the 2H
(2) EBITDA: negative impact by the drop of TRSsales and the performance of the railwaysbusiness due to the production of lowmargin vehicles. Positive impact thanks toRental activities with high margin and cosstreduction
(3) Efficiency: Starting from March, the Groupundertook all the necessary actions tocontain its fixed costs. This actions willimpact the 2H, too. The Group collected allthe possible operating grants in the differentcountries around the world
(4) Impacted by 4service’s fleet depreciation
(5) Negative impact of Forex losses (USD &related currencies), 3,3 M€ are “notrealized” forex losses.
REVENUES (1) 172,8 170,6 199,6 200,7 -13,4% -15,0%
EBITDA (2) (3) 22,9 21,0 30,0 27,4 -23,8% -23,6%
% on Revenues 13,2% 12,3% 15,0% 13,7%
EBIT (4) (0,6) (0,9) 6,4 8,4
% on Revenues -0,3% -0,5% 3,2% 4,2%
Differences in Exchange (5) (3,3) (3,6) (3,6) 0,8
% on Revenues -1,9% -2,1% -1,8% 0,4%
PROFIT (LOSS) BEFORE TAX (8,7) (9,0) 2,0 4,2
% on Revenues -5,0% -5,3% 1,0% 2,1%
NET INCOME/(LOSS) (6,5) (6,8) 1,6 3,0
% on Revenues -3,8% -4,0% 0,8% 1,5%
NFP ante IFRS 16 82,3 82,3 106,9 98,5 23,0% 16,4%
NFP post IFRS 16 104,4 104,4 130,9 118,0 20,2% 11,5%
NFP without Share capital Increase 129,1 129,1 130,9 118,0
GROUP (€ mln) 2020 2019
Delta
vs.
19-20
GROUP (€ mln) 2020 2019
Delta
vs.
19-20
2020
proforma
2020
proforma
2019
proforma
2019
proforma
Delta vs.
Proforma
19-20
Delta vs.
Proforma
19-20
* The pro-forma results include the result of the 4Service Group on the annual basis, instead of theresults achieved within the perimeter of the Tesmec Group from the date of first consolidation (April 23,2020)
2020.FY Proforma Closing – Business Breakdown
10
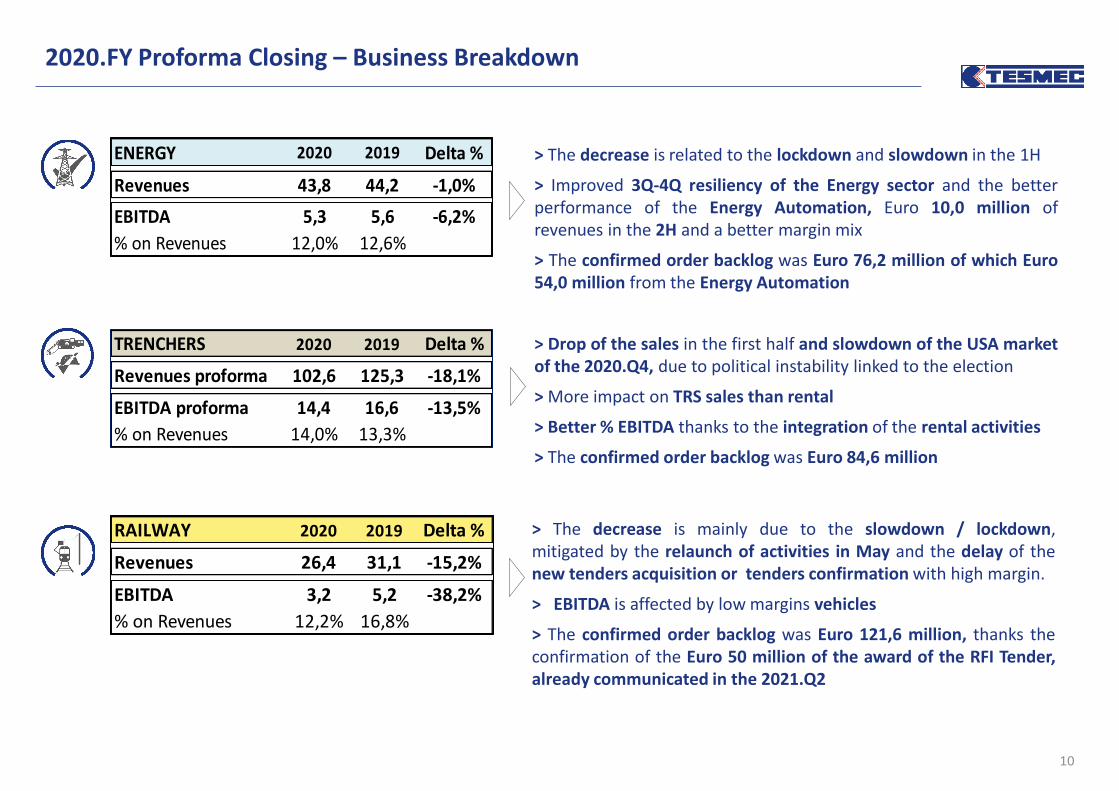
ENERGY 2020 2019 Delta %
Revenues 43,8 44,2 -1,0%
EBITDA 5,3 5,6 -6,2%
% on Revenues 12,0% 12,6%
RAILWAY 2020 2019 Delta %
Revenues 26,4 31,1 -15,2%
EBITDA 3,2 5,2 -38,2%
% on Revenues 12,2% 16,8%
TRENCHERS 2020 2019 Delta %
Revenues proforma 102,6 125,3 -18,1%
EBITDA proforma 14,4 16,6 -13,5%
% on Revenues 14,0% 13,3%
> The decrease is related to the lockdown and slowdown in the 1H
> Improved 3Q-4Q resiliency of the Energy sector and the betterperformance of the Energy Automation, Euro 10,0 million ofrevenues in the 2H and a better margin mix
> The confirmed order backlog was Euro 76,2 million of which Euro54,0 million from the Energy Automation
> Drop of the sales in the first half and slowdown of the USA marketof the 2020.Q4, due to political instability linked to the election
> More impact on TRS sales than rental
> Better % EBITDA thanks to the integration of the rental activities
> The confirmed order backlog was Euro 84,6 million
> The decrease is mainly due to the slowdown / lockdown,mitigated by the relaunch of activities in May and the delay of thenew tenders acquisition or tenders confirmation with high margin.
> EBITDA is affected by low margins vehicles
> The confirmed order backlog was Euro 121,6 million, thanks theconfirmation of the Euro 50 million of the award of the RFI Tender,already communicated in the 2021.Q2

BACKLOG
Trencher
Energy
Railway
Total
BACKLOG
Sales 2020.Q4
14,6
53,8
5,0
34,2
13,8
26,8
Intake 2020.Q4
Euro/mln
98,2
76,2
282,4
121,6
84,6
31/12/2020
(1)
77,0
238,0
69,0
92,0
30/09/2020(1) Including the confirmed
award of the RFI tender forthe production of diagnosticvehicles for around Euro 50million and an RFI order ofrevamping activities for Euro7,5 million
(2) Of which Euro 54 million byEnergy Automation
(2)
57,6
11

24%
20%
7%20%
9%
20%19%
34%
6%
15%
7%
19%
Italy
Europe
Middle East
BRICs and Oceania
Africa
North-Central America
INTERNATIONAL SCALE, FOCUS ON EU-USA
IMPORTANCE OF THE ITALIAN MARKET
2020 2019
ITALY: railway business & energy automation impact
USA&EU: trencher and railway impact
BRICS: trencher and stringing impact
2020.FY Revenues: sales spread over different geographical area
12

(0,3) (4,8)
(2,0)
0,0
3,0
6,0
9,0
12,0
15,0
18,0
21,0
24,0
27,0
30,0
2019 proforma Energy Trencher Railway 2020 proforma
30,0
22,9
€ mln
2019Impacted from the drop of TRS sales in the 1H (partially mitigated by the rental activities) and from the negative performance of railways
business for the execution of low margin orders. 2020
2020.FY Proforma EBITDA
13

2020 2019
64,3 73,0
76,7 66,8
22,8 20,1
10,0 4,2
173,8 164,2
82,3 98,5
Lease liability - IFRS 16/IAS 17 22,1 19,5
69,4 46,2
173,8 164,2
Net Invested Capital
Net Financial Indebtness
Equity
Total Sources of Financing
Financial Information (€ mln)
Net Working Capital
Non Current assets
Other Long Term assets/liabilities
Right of use - IFRS 16/IAS 17
2020
Decrease of NWC (mainly for the work in progress and receivables reduction), increase of the asset by the change of Group perimeter (4Service Group) and decrease of NFP due the decrease of the NWC
and share capital increase
2019
2020.FY Financial Results
14

2020 2020.1H 20192020 2019
60,4 59,8 67,9 127 122
74,4 77,5 69,9 157 125
11,2 17,8 16,3 24 29
(61,4) (50,9) (57,5) -130 -103
(20,4) (21,0) (23,6) -43 -42
64,3 83,3 73,0Net Working Capital
€ Mln
Trade Receivables
Inventories
Trade Payables
Other Current Assets/(Liabilities)
Work in progress contracts
€ 60,8 mln
After the increase of the NWC due to the impact of the Covid 19 in the 1H, the Group recorded a reduction of the inventories and working in
progress and a better balance of DPO - DSO
2019€ 73,0 mln
2020€ 64,3 mln
73,0 64,3
4,5 (5,1) (7,5)(3,9) 3,3
0102030405060708090
2019Net Working
capital
Inventories WIP TradeReceivables
TradePayables
Other currentass. / liab.
2020Net Working
capital
2020.FY Working Capital evolution
15

118,0104,4
(2,9) 10,33,4
14,2 143,0 (4,8)(19,0)
9,9 (24,7)
0
20
40
60
80
100
120
140
NFP2019
OFCF NWC Capex Changeof Cons.
Area
NFP2020.1H
OFCF NWC Capex ShareCapital
Increase
NFP2020
NET FINANCIAL POSITION€ mln
2019Impacted by the change of Cons Area and NWC in the 1H, starting from Q3 NFP has been reducing by the impact of the share capital increase,
the operating cash generation and the reduction of NWC2020
2020.FY Net Financial Position Evolution
16

NET FINANCIAL POSITION
* From 1st January 2019, the new IFRS 16 has been introduced, the impact in term of NFP is around 23,1 M€, otherwise the NFPwould have been around 82,3. Since April the NFP included the financial debt from the acquisition of 4service around 5,9 M€.
92,6 94,197,8 99,8
105,0119,2 114,7
82,3
112,5 112,5 115,6 118,0123,8
143,0 137,8
104,4*
0
20
40
60
80
100
120
140
1Q 2019 1H 2019 9M 2019 2019 1Q 2020 1H 2020 9M 2020 2020
€ mln
10,211,0
NFP ante IFRS 16 IFRS 16 4service NFP impact
2020.FY Net Financial Position Evolution
5,9
17

Outlook3.

19
Outlook
MACROECONOMIC SCENARIO
▪ Booming of specific geographic areas (e.g. Asia Pacific)
▪ Positive impact of recovery plans on reference markets of the Group
▪ Growth of demand, increasing suppling process, higher logistic costs and commodities, shortage of materials
▪ Stronger foreign currencies (USD..)
▪ Stable interest rates thanks to the incentives package
COVID-19
▪ 2021 year of the recovery: vaccination plan worldwide
▪ Uncertainty in the short term but long-term trends confirmed
▪ Push on specific industry such as Telecommunication and Energy due to the increasing need of connectivity and smart infrastructures

Outlook 2021
Further focus on recurring revenues through the offer of rental business model
Strategic positioning in key and growing sectors such as:
▪ Telecommunication: higher connectivity request
▪ Mining: increasing demand of raw materials
▪ Renewable: push on green energies
Increasing revenues thanks to:
▪ Strong backlog (121.6 M€)
▪ Opportunities in EU, tenderspipeline
Higher margins thanks to:
▪ new products in the portfolio
▪ diagnostic solutions
▪ services growth
R&D and product development in line with the latest technological trend (green and diagnostic)
TRENCHERS RAILWAY
20
STRINGING ENERGY AUTOMATION
ENERGY
Expected positive outlook driven by "Green Deal” on key markets such as US, Western Europe and Australia
Innovation and optimization of newly developed solutions
Portfolio rationalization and industrial planning for stock reduction
Strong growth perspective based on high visibility significant market opportunities
Profitability improvement coming from
▪ Product mix
▪ Economies of scale
COVID impact on lead times and not on new projects

TURNOVER
EBITDA
NFP / EBITDA
~ 220 M€ 275 290 M€
>16%53 58 M€
improvement
2021 2023
>> Better mix of products & systems, premium price policy, impact of new high margin activities such as rental and hi-tech solutions
>> Rationalization and standardization of the products portfolio
>> Broadly stable fixed costs
>> Significant performance of the Energy Automation segment; Stringing segment back to historical performances
>> Focus on recurring revenues (rental & services)
>> Growth in each business line
>> Net working capital improvement and efficiency actions on inventory
>> Optimization of credit management policies
>> 2020-2023: Cumulated Capex in 4 years 60 M€, progressive reduction to 5% of the CAPEX/Revenues
2019pf
199.6
M€
30,0
M€
4.4x
~
~cagr19-23: 8.5%~10.0%
cagr19-23: 17.0%~18.0%
2020-2023 Business Plan guidelines - Confirmed
2020pf
172.8
M€
22,9
M€
104,4
M€improvement
21

22
USE OF PROCEEDS
STRENGTHENING
FINANCIAL
STRUCTURE
SPECIAL
BUSINESS
INITIATIVES
UNDER
EVALUATION
▪ Financial ratio improvements and rating upgrade, adding further commercial
competitiveness
INVESTMENT PLAN ACCELERATION: RIDING THE WAVE OF GREEN AND DIGITAL TECHNOLOGY
RAILStrengthening of diagnostic systems and development of
technological platforms for the maintenance of railway networks
TRENCHE
RFurther push on the rental business
E N
E R
G Y
ST
RIN
GIN
G
EN
ER
GY
AU
TO
MA
TIO
N
Strengthening of the
Group's presence in
North America
Internationalisation of
business activities in the
geographic areas in
which the main
customers operate
▪ Net financial position improvement
Financial contribution
Revenue increase
from 2021
Additional 2023
Revenues
≈21M€
2023 EBITDA margin
>21%

ANNEX4.

Summary 2020.FY Profit & Loss statement - Appendix A
Profit & Loss Account (Euro mln) 2020 2019 Delta vs 2019 Delta %
Net Revenues 170,7 200,7 (30,0) -15,0%
Raw materials costs (-) (77,4) (88,0) 10,6 -12,1%
Cost for services (-) (30,2) (35,4) 5,2 -14,8%
Personnel Costs (-) (48,5) (52,6) 4,1 -7,8%
Other operating revenues/costs (+/-) 0,2 (4,7) 4,9 -104,4%
Non recurring revenues/costs (+/-) 0,0 0,0 0,0 na
Portion of gain/(losses)
from equity investments evaluated
using the equity method
0,5 0,2 0,3 107,1%
Capitalized R&D expenses 5,8 7,2 (1,4) -20,0%
Total operating costs (149,6) (173,2) 23,6 -13,6%
% on Net Revenues (88%) (86%)
EBITDA 21,1 27,4 (6,4) -23,3%
% on Net Revenues 12% 14%
Depreciation, amortization (-) (21,8) (19,1) (2,8) 14,5%
EBIT (0,8) 8,4 (9,2) -109,3%
% on Net Revenues 0% 4%
Net Financial Income/Expenses (+/-) (8,2) (4,2) (4,0) 95,6%
Taxes (-) 2,2 (1,2) 3,4 -282,1%
Minorities (0) (0) (0,0)
Group Net Income (Loss) (6,8) 3,0 (9,7) n/a
% on Net Revenues -4,0% 1,5% 24

Summary 2020.FY Balance Sheet - Appendix B
Inventory 74,2 69,9
Work in progress contracts 11,2 16,3
Accounts receivable 60,7 67,9
Accounts payable (-) (61,4) (57,5)
Op. working capital 84,7 96,7
Other current assets (liabilities) (20,4) (23,6)
Net working capital 64,3 73,0
Tangible assets 49,8 42,5
Right of use - IFRS 16/IAS 17 22,8 20,1
Intangible assets 22,5 20,4
Financial assets 4,4 3,9
Fixed assets 99,5 87,0
Net long term liabilities 9,3 4,2
Net invested capital 173,1 164,2
Cash & near cash items (-) (70,4) (17,9)
Short term financial assets (-) (14,5) (12,1)
Lease liability - IFRS 16/IAS 17 22,1 19,5
Short term borrowing 85,8 79,8
Medium-long term borrowing 77,3 48,7
Net financial position 100,3 118,0
Equity 69,5 46,2
Funds 169,8 164,2
Balance Sheet (€ mln) 2020 2019
25

Notes
The pro-forma results were prepared for illustrative purposes only, and were obtained by making appropriate pro-forma adjustments to the historical data to retroactively
highlight the effects of the 4Service Group's transaction, as if this transaction had occurred on 1st January 2020, instead of on 23 April 2020. The pro-forma results therefore
include the result of the 4Service Group on the half-year basis, instead of just the results achieved within the perimeter of the Tesmec Group from the date of first consolidation
(April 23, 2020).
Considering the uncertainty linked to the spread of the COVID-19 virus and the impacts on the global economy, the targets set by the Management may be susceptible to
changes. These targets are set in the assumption that the pandemic situation remains stable and / or better in Europe and that it does not get worse in other areas of the world,
such as the United States and Latin America
The plan doesn’t include any cash in from share capital increase. 50 M€ of credit lines already collected from financial institutions
Disclaimer
The manager responsible for the preparation of the corporate accounting documents, Marco Paredi, declares, pursuant to article 154-bis, paragraph 2, of Legislative Decree No.
58/1998 ("Consolidated Law on Finance") that the information contained in this press release corresponds to the document results, books and accounting records. Note that in
this press release, in addition to financial indicators required by IFRS, there are also some alternative performance indicators (e.g. EBITDA) in order to allow a better
understanding of the economic and financial management. These indicators are calculated according to the usual market practice.
This press release contains some forward looking statements that reflect the current opinion of the Tesmec Group management on future events and financial and operational
results of the Company and of its subsidiaries, as well as other aspects of the Group's activities and strategies. These forward looking statements are based on current
expectations and assessments of the Tesmec Group regarding future events, as well as on the Group's intentions and beliefs. Considering that these forward looking statements
are subject to risk and uncertainty, the actual future results may considerably differ from what is indicated in the above forward looking statements as these differences may
arise from several factors, many of which lie beyond the Tesmec Group’s ability to accurately check and estimate them. Amongst these - including but not limited to - there are
potential changes in the regulatory framework, future developments in the market, price fluctuations and other risks. Therefore, the reader is asked to not fully rely on the
content of the forecasts provided as the final results could significantly differ from those contained in these forecasts for the reasons indicated above. They have been included
only with reference up to the date of the above-mentioned press release. The prospective data are, in fact, forecasts or strategic targets established within the corporate
planning.
The Tesmec Group does not assume any obligation to publicly disclose updates or amendments of the forecasts included regarding events or future circumstances that occur
after the date of the above-mentioned press release. The information contained in this press release is not meant to provide a thorough analysis and has not been independently
verified by any third party. This press release does not constitute a recommendation for investment on the Company’s financial instruments. Furthermore, this press release does
not constitute an offer of sale or an invitation to purchase financial instruments issued by the Company or by its subsidiaries.

www.tesmec.com