2020 Renewable Energy Target Realisation Forecast for...
37
2020 Renewable Energy Target Realisation Forecast for Poland Final Report
-
Upload
nguyentuong -
Category
Documents
-
view
213 -
download
0
Transcript of 2020 Renewable Energy Target Realisation Forecast for...

2020 Renewable Energy Target
Realisation Forecast for Poland
Final Report

ECOFYS Germany GmbH | Albrechtstraße 10 c | 10117 Berlin | T +49 (0)30 29773579-0 | F +49 (0)30 29773579-99 | E [email protected] | I www.ecofys.com
Managing Director C. Petersdorff | Register Court: Local Court Cologne | Chamber of commerce Cologne HRB 28527 | VAT ID DE 187378615
2020 Renewable Energy Target Realisation Forecast for Poland Final Report
By: Luis Janeiro (Ecofys) and Gustav Resch (TU Wien)
Date: March 10th, 2017
Project number: EPODE17004
Reviewer: Heleen Groenenberg (Ecofys)
© Ecofys 2017 by order of: Polish Wind Energy Association

ECOFYS Germany GmbH | Albrechtstraße 10 c | 10117 Berlin | T +49 (0)30 29773579-0 | F +49 (0)30 29773579-99 | E [email protected] | I www.ecofys.com
Managing Director C. Petersdorff | Register Court: Local Court Cologne | Chamber of commerce Cologne HRB 28527 | VAT ID DE 187378615
EXECUTIVE SUMMARY
In the EU Renewable Energy Directive (2009/28/EC) Poland committed to a target of 15% renewable
sources (RES) overall in its gross final consumption of energy by 2020.
Several stakeholders claim that changes recently adopted in the Polish RES support schemes - in
particular, the switch from a green certificate scheme to auctions for green electricity - could put the
realisation of the abovementioned 2020 target at risk.
The aim of this study is to determine whether Poland is on track to realise its 2020 renewable energy
target under the current conditions and - if the country is not - provide alternative scenarios to meet
the target. We start from the analysis of renewable energy deployment in Poland over the period 2010
to 2015 and model its possible future evolution under different conditions over the period 2016-2020.
The results of the scenario analysis show that the mere continuation of the current conditions for RES
deployment (i.e. support policies in place and announced for the period 2017-2020) would likely result
in Poland missing its 15% renewable energy target for 2020 as established in the Renewable
Energy Directive (2009/28/EC).
Under optimistic baseline modelling assumptions, it is estimated that Poland would miss its 2020
RES target by at least 791 ktoe. Under pessimistic assumptions the renewable target gap could
increase up to 3,556 ktoe. In terms of the share of renewables in the final energy consumption, this
translates into a range between 10.0% and 13.8% overall RES share in 2020.
Three scenarios by which Poland could reach the 2020 RES target were analysed in this study. All of
them require significant additional accumulated investments and support expenditures over the
period 2017-2020 compared to the baseline cases.
In order to guarantee the realisation of the 2020 RES target Poland needs to take additional and
swift action to incentivise further deployment across all RES subsectors. Additional measures
are needed to meet the 2020 target irrespective of the assumptions on final energy demand growth
for the coming years.

ECOFYS Germany GmbH | Albrechtstraße 10 c | 10117 Berlin | T +49 (0)30 29773579-0 | F +49 (0)30 29773579-99 | E [email protected] | I www.ecofys.com
Managing Director C. Petersdorff | Register Court: Local Court Cologne | Chamber of commerce Cologne HRB 28527 | VAT ID DE 187378615

ECOFYS Germany GmbH | Albrechtstraße 10 c | 10117 Berlin | T +49 (0)30 29773579-0 | F +49 (0)30 29773579-99 | E [email protected] | I www.ecofys.com
Managing Director C. Petersdorff | Register Court: Local Court Cologne | Chamber of commerce Cologne HRB 28527 | VAT ID DE 187378615
Table of contents
1 Introduction 6
2 RES target realisation assessment 8
2.1 Approach 8
2.2 Scenario definitions and assumptions 9
2.2.1 Key modelling assumptions 9
2.2.2 RES policy support 2016-2020 11
2.2.3 Gross final energy consumption scenarios 12
2.2.4 RES deployment scenarios 14
2.3 RES deployment results 17
2.4 RES target realisation forecast results 20
3 Scenarios to meet the 2020 RES target 22
4 Conclusions and recommendations 26
4.1 Conclusions 26
4.2 Policy recommendations 27
Appendices 28
Appendix 1: Additional note on the evolution of the RES-E sector in 2016 28
Appendix 2: Assumed project lead times 29
Appendix 3: Assumed allocation of auctions 30
Appendix 4: Green-X model description 32
Appendix 5: Cost assumptions for RES technologies (extract from the Green-X database) 34

EPODE17004 6
1 Introduction
Poland established an ambitious renewable energy target of 15,5% by 2020 in its National Renewable
Energy Action Plan (NREAP), which comprises three sub-targets:
19,13% renewable electricity
17,05% green heat
10,14% green transport
The actual target to which Poland committed in the EU Renewable Energy Directive (2009/28/EC) is
15% of energy from renewable sources (RES) overall in gross final consumption of energy by 2020.
According to the latest Keep on Track report1, Poland achieved both its 2013 target, reflecting the
trajectory proposed in the NREAP, as well as the interim target for 2013/2014 according to the
indicative trajectory of the EU Renewable Energy Directive (2009/28/EC).
However, several stakeholders claim that recently adopted changes in the regulatory framework
supporting renewable energy - in particular the switch from a green certificate scheme to auctions -
could put the realisation of the 2020 target at risk.
In this context, the Polish Wind Energy Association (PWEA) contracted Ecofys and TU Wien to carry out
a study to determine whether Poland is on track to realise its 2020 renewable energy target under the
current conditions and - if the country is not - provide alternative scenarios to meet the target.
In this study we start from the analysis of renewable energy deployment in Poland over the period
2010 to 2015 and model its possible future evolution under different conditions over the period 2016-
2020. All renewable technologies for power, heating and cooling generation and biofuel production are
covered. The modelling work provides two types of scenarios for renewable energy developments in
Poland in years 2016-2020:
- “Baseline” scenarios, to determine whether Poland will meet its 2020 RES target with
existing and announced policy support measures.
- “Target” scenarios, providing alternative pathways where 2020 renewable target fulfilment
is taken as a precondition.
Two scenarios were developed to determine the range of possible RES target achievement outcomes
under “baseline” conditions. These reflect either an optimistic or pessimistic view on how the future
RES market and the overall energy demand might evolve. By optimistic we mean conditions either in
the RES market or on the demand side that are favourable to RES target achievement and by
pessimistic we mean conditions that make it harder for Poland to achieve its 2020 RES target.
1 Keep On Track, 2015. Is Poland on track? Available from: http://www.keepontrack.eu/contents/keeptrackcountryfactsheet/rm_poland.pdf
Last accessed: January, 2017.

EPODE17004 7
With respect to the RES pathways in line with the achievement of the 2020 RES target, three distinct
scenarios are analysed:
• A “RES-E focus” scenario, where the already announced auction volumes for RES-E are
scaled up proportionally until the RES target overall is met, while the current trend on the
uptake of RES in heating & cooling and in transport (similar to the “optimistic” baseline
scenario) is assumed.
• A “balanced” scenario with increased RES-E auctioned volumes but here accompanied by
stronger support also for RES-H&C and RES-T, which reduces the pressure put on the
electricity sector.
• An “alternative balanced” scenario building on a least-cost allocation of the required
uptake of renewables in the electricity sector and with similar assumptions on RES-H&C
and on RES in transport as in the “balanced” scenario.
This report is structured as follows: Chapter 2 is dedicated to the analysis of the baseline scenarios,
assessing whether Poland will meet its 2020 RES target with existing and announced policies. Chapter
3 discusses three scenarios in which Poland would reach the target, including an analysis of the resulting
technology mix in the RES-E sector for each scenario and the associated costs from a social perspective.
Finally, in Chapter 4 we provide our conclusions and policy recommendations.

EPODE17004 8
2 RES target realisation assessment
2.1 Approach
In this section we analyse the possible range of situations of Poland with regards to the realisation of
its 2020 RES target under existing renewable energy policy support conditions.
The realisation of the Polish RES target in 2020 as established in the Renewable Energy Directive
(2009/28/EC) depends on the development of two main factors: on the one hand the evolution of the
final energy consumption in the country over the next 4 years will determine the actual RES target for
Poland in absolute energy terms (the lower the final energy consumption of the country in 2020, the
easier it will be to reach the RES target); on the other hand, the actual deployment of additional RES
generation in the next 4 years will determine the share of renewables for a given final energy
consumption in 2020.
In this study we have considered a range of possible developments (optimistic and pessimistic baseline
scenarios) both for the evolution of the final energy consumption and for the future deployment of
renewables. The analysis of the combination of optimistic and pessimistic baseline scenarios for final
energy consumption and additional RES deployment results in a possible range of RES target ‘margin’
(if the target in 2020 is exceeded) or RES target ‘gap’ (if the target in 2020 is not met).
Figure 1 below illustrates this approach to estimate the range of possible situations.
Figure 1: Approach to estimate Poland’s 2020 target achievement gap

EPODE17004 9
The best possible outcome in terms of RES target achievement for Poland in 2020 results from the
combination of the most optimistic RES deployment scenario with the most optimistic demand scenario
(baseline optimistic scenario). The worst possible outcome results from the combination of the most
pessimistic scenarios (baseline pessimistic scenario).
For the period 2010 to 2015 we use historical data from official sources. Data from 2010 to 2014 -both
for final energy consumption and RES deployment - was obtained from the Eurostat RES Shares
database online2. The official figures for 2015 were not available from Eurostat RES Shares at the time
of elaboration of this study. For this reason, they were obtained from the Polish Central Statistical
Office3. For the period 2016 to 2020 the Green-X model was used to develop the optimistic and
pessimistic baseline scenarios discussed above under the assumptions described in detail in the
following chapter.
The Green-X model has detailed RES resource and technology representation accompanied by thorough
energy policy descriptions, which allows assessing various policy options with respect to the resulting
market development as well as associated costs and benefits. A short characterization of the model is
given in the Appendix 4 to this report, whilst for a detailed description we refer to www.green-x.at.
2.2 Scenario definitions and assumptions
2.2.1 Key modelling assumptions
To ensure maximum consistency with existing EU scenarios and projections, key input parameters of
the scenarios presented in this report are derived from PRIMES modelling and from the Green-X model
database e.g. with respect to the potentials and cost of RES technologies.4 Table 1 below shows which
parameters are based on PRIMES, on the Green-X database and which have been specifically defined
for this study. The PRIMES scenario used for this assessment is the latest reference scenario.5
Table 1 Main input sources for scenario parameters
Based on PRIMES Based on Green-X database Defined for this assessment
- Primary energy prices
- Conventional supply
portfolio and
conversion efficiencies
- Renewable energy technology cost
(investment, fuel, O&M)
- Renewable energy potentials
- Technology diffusion / Non-economic
barriers
- Learning rates
- Market values for variable renewables
- Renewable energy policy
framework (varying by scenario)
- Reference electricity prices
- Energy demand by sector
2 Available from: http://ec.europa.eu/eurostat/web/energy/data/shares
3 Glowny Urzad Statystyczny, 2016. Energy from renewable sources in 2015. November 2016. According to the study, the gross RES share
in the energy consumption was elaborated based on the SHARES_2015 application (SHort Assessment of Renewable Energy Sources).
4 Assumed costs for RES technologies can be found in Appendix 5
5 European Union, 2016. EU Reference Scenario 2016 Energy, transport and GHG emissions Trends to 2050.

EPODE17004 10
While generally sector-specific reference energy prices used in this analysis are based on the primary
energy price assumptions applied in the latest PRIMES reference scenario, for future prices at the
wholesale electricity market a simplified approach is followed. A wide number of factors influence future
wholesale market prices e.g. fossil fuel and carbon prices, demand developments, and RES-E
expansion, among others. Therefore, there is high uncertainty about how wholesale prices will evolve
in the future in the Central European electricity market.
In this study, as outlined in Figure 2 below, within our scenario analysis until 2020, it was assumed
that wholesale prices remain at 2016 levels. In a similar manner, we take the assumption that green
certificate prices for existing RES-E producers will remain at a constant level in the near future.
Figure 2 Historic and expected future wholesale electricity and green certificate (GC) prices in Poland (nominal values
in EUR/MWh). Source: own assessment
It must be noted here that lower or higher electricity and green certificate prices affect primarily the
profitability of existing plants but have only a minor impact on the deployment of the new RES-E
generation capacity that is required for target achievement. In this study, it is assumed that the
renewable power generation capacity that is already online will remain in the system. However, a
sensitivity check was undertaken beforehand, confirming that revenues from selling the produced
electricity on the wholesale market and the derived certificates to obliged parties6 would suffice for
RES-E producer to recover operational expenditures. This statement is also valid for biomass co-firing
where also fuel costs are a key element in the operational expenditures; however, with today’s low
prices on the wholesale electricity market and in the certificate regime, a full cost recovery - including
up-front investments - cannot be achieved in general.
6 Parties operating under the old green certificate scheme.
0
10
20
30
40
50
60
70
80
2010 2011 2012 2013 2014 2015 2016 2017 2018 2019 2020
Assumed trends on electricity and GC prices
Electricity price (wholesale) GC prices

EPODE17004 11
2.2.2 RES policy support 2016-2020
In this section we introduce our main modelling assumptions in terms of policy support framework for
renewables over the period 2016-2020.
In the RES-E sector, support for new utility scale plants will be available according to announced
auctioned volumes under the Renewable Energy Act of 2015. Auction volumes7 are already known for
2016 (105,000 MWh/year) and 2017 (2,267,000 MWh/year). The auction volumes for 2018 and 2019
are unknown. In addition to support for utility-scale projects, the effect of the existing regulation
supporting prosumers – allowing distributed generators to sell excess power to the grid up to 70% of
their own consumption8 is also considered in the modelling exercise.
In the RES-H&C sector, two main economic support instruments are considered in the modelling of
future RES deployment scenarios. Firstly, the already existing subsidies for the (public) building sector,
- financed by EU structural funds, primarily aimed at energy efficiency improvements. Secondly, the
subsidies from Thermal Renovation Law for the buildings sector – financed from the national budget -
are also included. Incentives for heat from renewable cogeneration of heat and power (CHP) are
considered as part of the thermal renovation programme.9
In the RES-T sector it is assumed that the existing biofuel obligation remains in place, and that the EU
cap on first generation biofuels is respected. It is assumed that the only incentive for the introduction
of second generation biofuels until 2020 is the double counting provision of the Renewable Energy
Directive (2009/28/EC). It is also assumed that no fiscal incentives for biofuels will be implemented in
the period 2016-2020.
7 Detailed figures about auctioned volumes are provided in Appendix 3.
8 RES law, chapter 2, art 4-18.
9 Ustawa z dnia 21 listopada 2008 r. o wspieraniu termomodernizacji i remontów, Dz.U. 2008 Nr 223 poz. 1459.

EPODE17004 12
2.2.3 Gross final energy consumption scenarios
In its NREAP, Poland projected an evolution of its final energy consumption characterised by continuous
growth from 2010 to 2020, with a higher growth rate for the period 2015 to 2020. This projection is
shown in Figure 3 below.
Figure 3 Expected final energy consumption in Poland according to NREAP (ktoe). Source: Polish NREAP
Contrary to the abovementioned projections, the actual recorded final energy consumption of the
country - as registered in EUROSTAT - followed a decreasing trajectory since 2010, starting from 69,179
ktoe in 2010 and reaching 64,252 ktoe in 2014. In 2015 demand grew again to reach 65,260 ktoe.
For the analysis of the possible future development of the final energy consumption until 2020, two
scenarios have been considered: a pessimistic scenario, in which demand would increase from 2016
onwards following the same growth rates as initially expected in the NREAP for the same period, and
an optimistic scenario, in which demand stagnates until 2020 at 2015 levels. This scenario is considered
optimistic in view of the demand recovery observed in 2015 and latest projections from official
documents of the Polish Government which estimate demand growth for the coming years at 1.6%10.
10 Sprawozdanie z wynikow monitorowania bezpieczeñstwa dostaw energii elektrycznejza okres od dnia 01.01.2013 do dnia 31.12.2014
Ministerstwo Gospodarki

EPODE17004 13
It is important to note that optimistic and pessimistic scenarios here refer to the extent to which they
would make RES target achievement easier or more challenging for Poland. Figure 4 below shows the
range of demand scenarios considered in the baseline RES target achievement assessment.
Figure 4 Recorded final energy consumption in Poland and range of future scenarios considered (ktoe)

EPODE17004 14
2.2.4 RES deployment scenarios
2.2.4.1 RES Electricity
The actual developments in the renewable electricity sector in Poland outpaced the NREAP projections
from 2010 to 2015.
Two major RES-E technologies were deployed over the period 2010-2015 under the support of the
green certificate scheme: co-firing of biomass in existing coal fired units (requiring minor investments
to adapt to co-firing of biomass with coal) and wind onshore. Since 2012, a discussion on the change
of the support scheme towards auctions started. Since July 2016 it was not possible to start operations
under the green certificate scheme anymore11.
Two auctions for new RES-E capacity have been announced (for 2016 and 2017) as published in orders:
Rozporządzenie Rady Ministrów z dnia 27 października 2016 r. w sprawie maksymalnej ilości i
wartości energii elektrycznej z odnawialnych źródeł energii, która może zostać sprzedana w
drodze aukcji w 2016 r.
Projekt rozporządzenia Rady Ministrów w sprawie maksymalnej ilości i wartości energii
elektrycznej z odnawialnych źródeł energii, która może być sprzedana w drodze aukcji w 2017 r.
The first auction took place on December 30th, 2016.
Figure 5 RES electricity consumption in the period 2010-2015 and NREAP trajectory (ktoe)
11 Ustawa z dnia 20.02.2015 o odnawialnych zrodlach energii ze zmianami, art. 223 p. 1 (Dz. U. z 2015 r. poz. 478, 2365, z 2016 r. poz. 925, 1579.)

EPODE17004 15
The following modelling input assumptions were made to determine RES-E developments12 until 2020
with Green-X:
In the optimistic baseline scenario, it is assumed that project lead times are short13. Moreover, it is
assumed that additional auction rounds for new RES-E generation capacity will be announced for 2018
and 2019, offering the same volumes as for the already announced auction for 2017. For 2020 no
volumes are considered in the modelling exercise, since it is assumed that the corresponding generating
plants would not enter in operation in time to contribute to realisation of the 2020 RES target.
In the pessimistic scenario, it is assumed that for the new RES-E capacity allocated in auctions the
project lead times are long13. No additional auction rounds after 2017 are assumed.
The law on wind investments14 could create further significant constraints for the deployment of this
technology. These potential constraints were not considered in our modelling.
The assumed allocation of new RES generation capacity to the different auction categories (‘baskets’)
is shown in Appendix 3.
2.2.4.2 RES heating and cooling
Renewable energy consumption in the heating and cooling sector has been above the original NREAP
trajectory defined by Poland for the period 2010-2015; after a period of continuous increase, RES in
heating and cooling declined in 2014 and slightly recovered in 2015.
From 2016 onwards higher growth rates will be required in the sector to keep up with the NREAP
trajectory.
12 After finalisation of the modelling work for this study, the statistics for the electricity sector in 2016 from the Polish Energy Market Agency
became available. While it was not possible to recalculate the scenarios ensuring consistency across all RES subsectors within the timeframe
for this study, we briefly comment on the observed 2016 RES-E deployment and compare with our 2016 scenario projections in Appendix 1.
13 See Table 2 in Appendix 2 for the ranges considered for project lead times per technology
14 USTAWA z dnia 20 maja 2016 r. o inwestycjach w zakresie elektrowni wiatrowych

EPODE17004 16
Figure 6 RES consumption for heating and cooling in the period 2010-2015 and NREAP trajectory (ktoe)
The following modelling input assumptions are made to determine deployment of RES in heating and
cooling until 2020 with Green-X: in the optimistic scenario it is assumed that non-cost barriers to the
implementation of renewable technologies are mitigated according to best practice standards in the EU
and the financial investment incentives from the programmes in place is increased.15 In the pessimistic
scenario it is assumed both non-cost barriers and the investment incentive remain as in recent past.
2.2.4.3 RES Transport
In the period 2010-2015 the consumption of renewable energy in the transport sector in Poland has
fallen substantially behind the trajectory defined in the NREAP. Moreover, figures showed a clear
downward trend until 2014, increasing the gap between planned developments and actual renewable
consumption. Figures for 2015 show a slight recovery to 2012 levels.
15 In modelling, we assumed that average effective support for RES-H&C (that is generally provided via investment grants) doubles in
forthcoming years, from around 5% (default, pessimistic baseline) to ca. 10% of total investment cost.

EPODE17004 17
Figure 7 RES consumption for transport in the period 2010-2015 and NREAP trajectory (ktoe)
The following modelling input assumptions were made to determine biofuel deployment in the transport
sector until 2020 with Green-X: in the optimistic scenario it is assumed that - in contrast with the past
trends observed – a slight increase in the biofuels market will occur for the period 2016-2020, driven
by the existing obligation in place and the given EU and national 2020 target for renewables in
transport. The upper ceiling defined for the contribution of first generation biofuels in meeting this
target was also considered. In the pessimistic scenario it is assumed that the contribution of renewables
in the transport sector slightly declines until 2020, in line with the trend observed from 2010 to 2015.
2.3 RES deployment results
In this section we present the outcomes of the modelling exercise in terms of expected RES deployment.
Figure 8 below shows the amount of electricity generation that can be expected in 2020 to stem from
new RES installed in the years 2017 to 2020 according to both the optimistic and the pessimistic
baseline scenarios.

EPODE17004 18
Figure 8: Electricity generation by 2020 from new RES (installed 2017 to 2020) according to Baseline Scenarios
(GWh). Source: Green-X modelling
The overall amount of new RES-E generation would make up around 3.85 TWh by 2020 under the
optimistic baseline scenario. Biomass (including biomass co-firing in coal-fired power plants) would
make up the lion’s share of RES-E generation stemming from newly installed RES plants, followed by
solar PV and onshore wind.
Under the pessimistic baseline case more than four times lower RES generation additions can be
expected than in the optimistic case. The technology mix changes but biomass would still have the
largest share of the new RES-E added to the system.
The aggregated picture with respect to overall RES deployment is provided in Figure 9 below. Here the
historic record is illustrated as well as the expected future deployment by sector according to baseline
conditions, taking either an optimistic (left) or a pessimistic (right) perspective.

EPODE17004 19
Figure 9: Historic and expected future total RES deployment according to Baseline Scenarios. Source: Own
assessment, Green-X modelling
It can be seen that overall RES deployment is significantly higher in the optimistic baseline scenario
where total RES deployment by 2020 would account for ca. 9,000 ktoe. In contrast to that, taking a
pessimistic view, Poland would deliver only 7,029 ktoe by 2020.
5,117 5,201 5,407 5,6235,890
1,848 1,8741,915
2,045
2,178
859 885912
935
931
0
1,000
2,000
3,000
4,000
5,000
6,000
7,000
8,000
9,000
10,000
11,000
12,000
2010 2011 2012 2013 2014 2015 2016 2017 2018 2019 2020
"Optimistic" Baseline scenario (RES deployment in ktoe)
RES-Deploy_H&C RES-Deploy_E
RES-Deploy_T RES-Proj_H&C
RES-Proj_E RES-Proj_T
RES-NREAP_Overall
4,916 4,820 4,720 4,610 4,513
1,847 1,863 1,882 1,899 1,917
822 764 702 666 599
0
1,000
2,000
3,000
4,000
5,000
6,000
7,000
8,000
9,000
10,000
11,000
12,000
2010 2011 2012 2013 2014 2015 2016 2017 2018 2019 2020
"Pessimistic" Baseline scenario (RES deployment in ktoe)
RES-Deploy_H&C RES-Deploy_E
RES-Deploy_T RES-Proj_H&C
RES-Proj_E RES-Proj_T
RES-NREAP_Overall

EPODE17004 20
2.4 RES target realisation forecast results
The result of our RES target realisation assessment is summarised in Figure 10 below. The blue bar on
the left side of the graph represents the expected range for the RES target for Poland in 2020 expressed
in absolute energy terms (ktoe). The green bar in the center represents the range of expected
contribution of renewable energy to the final energy consumption of the country in 2020. The red bar
on the right-hand side of the graph represents the maximum and minimum differences between the
renewable target and the expected value of renewable energy consumed in the country in 2020.
Figure 10 Expected RES target gap ranges (ktoe)
Under the most optimistic scenario (low absolute RES target due to low final energy consumption,
coupled with high RES deployment assumptions), it is estimated that Poland would miss its 2020 RES
target by 791 ktoe. Under the most pessimistic scenario (high absolute RES target due to increasing
final energy consumption and low RES deployment assumptions) the renewable target gap could
increase to 3,556 ktoe.
In terms of the share of renewables in the final energy consumption of Poland, the abovementioned
results translate into a range between 10.0% and 13.8% RES share in 2020 for the pessimistic and
optimistic scenarios respectively. This is shown in Figure 11 below.

EPODE17004 21
Figure 11 Historic and expected future RES share in final energy consumption according to baseline scenarios.
Source: Own assessment, Green-X modelling.
Additional note on the evolution of the RES-E sector in 2016:
After finalisation of the modelling work for this study, the statistics for the electricity sector in 2016 from the Polish Energy
Market Agency became available.
It was not possible to recalculate the scenarios ensuring consistency across all RES sectors within the timeframe for this
study; however, we briefly comment on the observed deployment and compare with our 2016 scenario projections in
Appendix 1.
While there were substantial increases in generation for most RES-E technologies in 2016, the important reduction in
biomass co-firing mitigates their impact, limiting the overall growth.
RES-E generation in Poland grew by just 0.5% in 2016 with respect to the previous year. The observed growth rate is
roughly half of the growth rate expected for RES-E over the same period in our pessimistic baseline scenario, pointing to
a potentially higher RES deployment gap in 2020 than foreseen in this study if no corrective measures are taken.

EPODE17004 22
3 Scenarios to meet the 2020 RES target
This section takes a closer look at possible pathways by which Poland could achieve its RES target by
2020. Three different scenarios were analysed:
A “RES-E focus” scenario, where the already announced auction volumes for RES-E are scaled
up proportionally until the RES target overall is met, while the current trend on the uptake of
RES in heating & cooling and in transport (similar to the “optimistic” baseline scenario) is
assumed.
A “balanced” scenario with increased RES-E auctioned volumes but here accompanied by
stronger support also for RES- H&C and RES-T, which reduces the pressure put on the electricity
sector.
An “alternative balanced” scenario building on a least-cost allocation of the required uptake
of renewables in the electricity sector and with similar assumptions on RES-H&C and on RES in
transport as in the “balanced” scenario.
As with the analysis of baseline scenarios we present first the expected RES-E deployment. Figure 12
below indicates the amount of electricity generation that can be expected in 2020 stemming from new
RES installed in the years 2017 to 2020 according to the three assessed scenarios.
The amount of RES-E generation is larger in the scenario where preference is given to renewables for
power generation – i.e. the “RES-E focused” target scenario. The overall amount of new RES-E
generation would then amount to 12.0 TWh by 2020, whereas under the “balanced” and the “alternative
balanced” target scenarios, new RES-E would contribute 11.3-11.4 TWh respectively.
Similar power generation mixes can be observed under the “balanced” and the “RES-E focused” target
scenarios, following the assumed allocation of auction volumes to distinct RES-E technologies of
auctions16. Onshore wind energy would here dominate, followed by biomass and solar PV on third place.
A different technology mix can be expected under the “alternative balanced” scenario. Under these
circumstances onshore wind and hydropower would increase deployment, replacing solar PV and the
most expensive biomass options.
16 The assumed allocation of new RES generation capacity to the different auction categories (‘baskets’) as published in official orders is
shown in Appendix 3.

EPODE17004 23
Figure 12: Electricity generation by 2020 from new RES (installed 2017 to 2020) according to Target Scenarios
(GWh). Source: Green-X modelling
The volumes presented in Figure 12 are the minimum required to meet the target assuming the low
energy demand scenario (the aggregated RES consumption by 2020 amounts under all assessed target
scenarios to ca. 9.8 Mtoe, corresponding to the RES target under the low demand scenario). If energy
demand would increase according to the pessimistic baseline scenario assumptions, additional volumes
of RES-E would be required to meet the overall target.
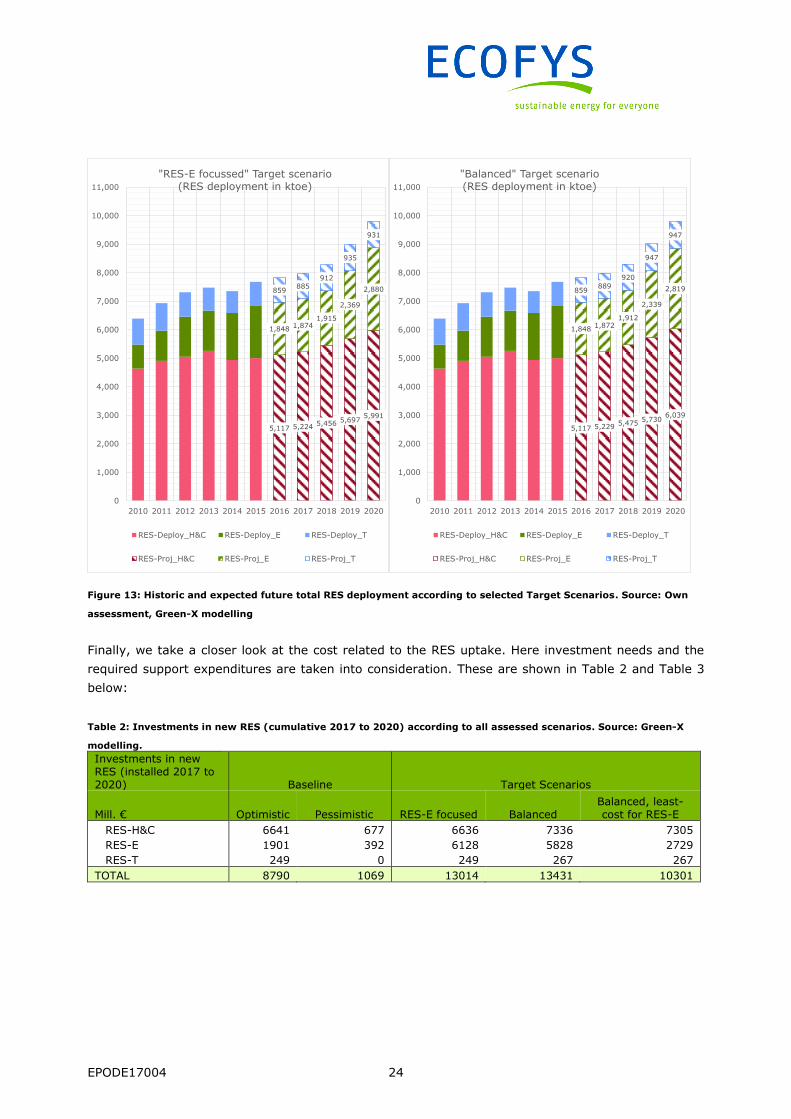
The aggregated picture concerning overall RES deployment is shown in Figure 13 below. A closer look
at the expected future deployment by sector indicates that under a balanced approach (“balanced”
Target Scenario - Figure 13 right) a stronger contribution is expected to come from RES in heating &
cooling and from biofuels in transport compared to the “RES-E focused” target scenario where only the
auction volumes for RES-E are scaled up until the RES target is met.
EPODE17004 24
Figure 13: Historic and expected future total RES deployment according to selected Target Scenarios. Source: Own
assessment, Green-X modelling
Finally, we take a closer look at the cost related to the RES uptake. Here investment needs and the
required support expenditures are taken into consideration. These are shown in Table 2 and Table 3
below:
Table 2: Investments in new RES (cumulative 2017 to 2020) according to all assessed scenarios. Source: Green-X
modelling.
Investments in new RES (installed 2017 to 2020) Baseline Target Scenarios
Mill. € Optimistic Pessimistic RES-E focused Balanced Balanced, least-cost for RES-E
RES-H&C 6641 677 6636 7336 7305
RES-E 1901 392 6128 5828 2729
RES-T 249 0 249 267 267
TOTAL 8790 1069 13014 13431 10301
5,117 5,224 5,4565,697
5,991
1,8481,874
1,915
2,369
2,880859885
912
935
931
0
1,000
2,000
3,000
4,000
5,000
6,000
7,000
8,000
9,000
10,000
11,000
2010 2011 2012 2013 2014 2015 2016 2017 2018 2019 2020
"RES-E focussed" Target scenario (RES deployment in ktoe)
RES-Deploy_H&C RES-Deploy_E RES-Deploy_T
RES-Proj_H&C RES-Proj_E RES-Proj_T
5,117 5,2295,475
5,7306,039
1,8481,872
1,912
2,339
2,819859889
920
947
947
0
1,000
2,000
3,000
4,000
5,000
6,000
7,000
8,000
9,000
10,000
11,000
2010 2011 2012 2013 2014 2015 2016 2017 2018 2019 2020
"Balanced" Target scenario (RES deployment in ktoe)
RES-Deploy_H&C RES-Deploy_E RES-Deploy_T
RES-Proj_H&C RES-Proj_E RES-Proj_T

EPODE17004 25
Table 3: Cumulative support expenditures for new RES (installed 2017 to 2020) according to all assessed scenarios.
Source: Green-X modelling
Support expenditures for new RES (total cost, incl. residual cost post 2020) Baseline Target Scenarios
Mill. € Optimistic Pessimistic RES-E
focused Balanced Balanced, least-cost for RES-E
RES-H&C 553 31 552 1288 1283
RES-E 2978 311 10951 10070 5374
RES-T 1041 0 1041 1117 1117
TOTAL 4572 343 12544 12475 7773
In order to meet the 2020 target, significant additional investments in the RES sector will be required.
The “alternative balanced” target scenario - where a least-cost allocation of RES-E technologies is
assumed - leads to lowest investment needs. A significantly higher but similar level of investments is
required for all other target scenarios. Baseline scenarios where Poland would fail to realise the target
result in low investments in renewables in the years up to 2020 since several of the RES-E capacities
auctioned in 2016 and 2017 (or the years thereafter as presumed in the optimistic baseline scenario)
can only be finished post 2020.
Similarly, support expenditures would need to increase significantly in order to meet the 2020 target.
The “alternative balanced” target scenario also results in the lowest accumulated support expenditures
of all the target scenarios, due to the “optimised” technology allocation assumed and the lower level of
support that is needed in consequence.17 Under baseline trends lower support expenditures would be
required, in line with the lower deployment of renewables expected.
17 Note however that support for small-scale PV systems may be overestimated in the modelling approach used since the simplified assumption
is taken that all power generation options have to participate in the wholesale market. Consequently, also for small scale PV systems it is the
wholesale price or, more precisely, the resulting market value of PV electricity and not the retail price that counts in the cost analysis. This
may lead to an overestimation of the resulting cost burden.

EPODE17004 26
4 Conclusions and recommendations
4.1 Conclusions
From the analysis of the scenarios described above it can be concluded that the mere continuation
of the current conditions for RES deployment (i.e. support policies in place and announced for the
period 2017-2020) would likely result in Poland missing its 15% renewable energy target for
2020 as established in the Renewable Energy Directive (2009/28/EC).
Under optimistic baseline modelling assumptions, it is estimated that Poland would miss its 2020
RES target by at least 791 ktoe. Under pessimistic assumptions the renewable target gap could
increase up to 3,556 ktoe. In terms of the share of renewables in the final energy consumption, this
translates into a range between 10.0% and 13.8% overall RES share in 2020.
Key factors underlying these results are:
- The RES deployment planned by Poland for the period 2010–2020 in its NREAP does not follow
a linear trajectory. The required new renewable energy additions in the second half of the
decade (3108 ktoe) are almost double than those of the period 2010-2015 (1743 ktoe). This
requires a significant investment effort in years 2016-2018 (to assure green production from
new sources will start before the end of 2020).
- While the RES-H&C and RES-E sectors have met their respective trajectories planned in the
NREAP until 2015, the RES-T sector is substantially behind (861 ktoe gap in 2015). If the
observed trend in the RES-T sector for the period 2010–2015 continues until 2020, a significant
gap will need to be compensated by substantial additional deployment - beyond the NREAP
sector trajectory in the RES H&C and/or the RES-E sectors.
- For RES H&C, the latest deployment records (2014-2015) do not show a trend towards
overachievement in this sector that could (partially) compensate for underachievement in the
RES-T sector.
- In the RES-E sector, the support scheme that triggered deployment over the period 2010-2015
in line with the NREAP trajectory, has been phased-out for new plants. The new RES-E volumes
from auctions (already allocated for 2016 and proposed for 2017) will bring Poland closer to
meet the 2020 RES-E sector target; however, they are insufficient to compensate for an
eventual overall RES gap in 2020. The 2016 (recently allocated) and 2017 (proposed) auction
volumes put together - if fully realised - could add ~200 ktoe/year of RES-E to the system,

EPODE17004 27
while Poland needs to increase its overall renewable energy consumption in 3,044 ktoe/year
by 2020 to meet its NREAP trajectory18.
Three scenarios by which Poland could reach the 2020 RES target were analysed in this study. All of
them require significant additional accumulated investments and support expenditures over the period
2017-2020 compared to the baseline cases.
The technology mix for a least-cost allocation of new RES-E capacity in the power sector would be
formed primarily by wind onshore and biomass (including co-firing in coal plants), with smaller
contributions of hydro, biogas and other RES technologies. Solar PV would have a significant
contribution in the mix (for new installations) if the target would be reached by scaling up proportionally
the volumes of each technology ‘basket’ of the already announced auctions.
4.2 Policy recommendations
To guarantee the realisation of the 2020 RES target Poland needs to take additional and swift
action to incentivise further deployment across the three RES subsectors. Additional measures
are needed to meet the 2020 target irrespective of the assumptions on final energy demand
growth for the coming years.
Existing support policies can be used as a framework for target achievement but need to be
strengthened to meet the policy objectives; examples of such tools could be increased budgets for
the Thermal Renovation Law (to stimulate replacement of heat sources in houses to green heat) and
up scaled auctions for RES-E technologies that could deliver the required additional volumes by 2020.
Moreover, action should be taken to reduce the RES deployment gap in the transport sector, thereby
minimising the additional efforts that will be required in the other two sectors to realise the overall
target.
In parallel to the measures described above, additional efforts should be made to remove existing
non-cost barriers currently preventing investment in renewables. Finally, predictability and medium
and long-term visibility of RES deployment plans are critical to mobilise the required investments. For
this reason, the additional measures to meet the target, such as further RES-E auctions for the 2018-
2020, or increased budgets for renewables in buildings, should be announced as early as possible to
ensure that investments happen in time to meet the 2020 RES target.
18 RES deployment overall was 7,681 ktoe in 2015. Target RES in 2020 according to NREAP is 10,725 ktoe.

EPODE17004 28
Appendices
Appendix 1: Additional note on the evolution of the RES-E sector in 2016
As discussed in section 2.1, in this study we used historical data from official sources for the period
2010 to 2015, including Eurostat RES Shares and the Polish Central Statistical Office19. For the period
2016 to 2020 the Green-X model was used to develop the optimistic and pessimistic baseline scenarios.
After finalisation of the modelling work for this study, the statistics for the electricity sector in 2016
from the Polish Energy Market Agency became available.
While it was not possible to recalculate the scenarios ensuring consistency across all RES sectors within
the timeframe for this study, we briefly comment here on the observed deployment and compare with
our 2016 scenario projections.
In Table 4 below we show the production for different RES-E technologies in 2015 and 2016 in Poland
and the % annual growth.
Table 4 RES-E production in Poland per technology in 2015 and 2016 (GWh). Source: Polish Energy Market Agency
RES-E technology Production in 2015
(GWh)
Production in 2016
(GWh) % annual growth
Hydro 1,832.2 2,139.6 16.8%
Wind onshore 10,902.6 12,595.3 15.5%
Biogas 857.9 1,020.8 19.0%
Biomass 4,550.1 4,571.6 0.5%
Biomass co-firing 4,479.8 2,351.9 -47.5%
Photovoltaics 56.6 123.7 118.5%
Total RES-E 22,679.3 22,803.0 0.5%
While there were substantial increases in generation for most RES-E technologies in 2016, the
important reduction in biomass co-firing mitigates their impact, limiting the overall growth.
RES-E generation in Poland grew by just 0.5% in 2016 with respect to the previous year. This growth
rate is roughly half of the growth rate expected for RES-E over the same period in our pessimistic
baseline scenario, pointing to a potentially higher RES deployment gap in 2020 than foreseen in this
study if no corrective measures are taken.
19 Glowny Urzad Statystyczny, 2016. Energy from renewable sources in 2015. November 2016. According to the study, the gross RES share
in the energy consumption was elaborated based on the SHARES_2015 application (SHort Assessment of Renewable Energy Sources).

EPODE17004 29
Appendix 2: Assumed project lead times
Table 5 Assumed project lead times for each RES-E technology (years)
Quick deployment Slow deployment
Onshore wind 2 4
Offshore wind 3 6
Solar PV 1 2
Biogas 2 4
Hydropower 3 6
Biomass 2 4

EPODE17004 30
Appendix 3: Assumed allocation of auctions
Table 6 Announced auctions, corresponding yearly energy volumes, assumed allocation to RES-E technologies
MWh MWh years MWh/year MWh/year
Basket 2016 2017
lengh of
support 2016 2017 RES technology assigned
Assumed
Load Factor
1 >3504 full load hours - 825,000 15 - 55,000 Biogas 6500
2 biow aste - - 15 - - No capacity auctioned -
3 >3504 full load hours and <100 kn CO2/MWh - 540,000 15 - 36,000 Hydropow er 6500
4 energy clusters - - 15 - - No capacity auctioned -
5 energy cooperative - - 15 - - No capacity auctioned -
6 agricultural biogas - 8,190,000 15 - 546,000 Biogas 6500
7 other 1,575,000 4,725,000 15 105,000 315,000 Solar PV 900
1 >3504 full load hours - 10,500,000 15 - 700,000 Biomass 4000
2 biow aste - - 15 - - No capacity auctioned -
3 >3504 full load hours and <100 kn CO2/MWh - 540,000 15 - 36,000 Hydropow er 6500
4 energy clusters - - 15 - - No capacity auctioned -
5 energy cooperative - - 15 - - No capacity auctioned -
6 agricultural biogas - 3,510,000 15 - 234,000 Biogas 6500
7 other - 5,175,000 15 - 345,000 Onshore w ind 2700
<1M
W>1M
W

EPODE17004 31
Table 7 Announced auctions, assumed allocated capacity to RES-E technologies (MW)
Assumed allocated capacity per basket (MW)
MW MW
Basket RES technology assigned2016 2017
1 >3504 full load hours Biogas - 8
2 biow aste No capacity auctioned
3 >3504 full load hours and <100 kn CO2/MWh Hydropow er - 6
4 energy clusters No capacity auctioned
5 energy cooperative No capacity auctioned
6 agricultural biogas Biogas - 84
7 other Solar PV 117 350
1 >3504 full load hours Biomass - 175
2 biow aste No capacity auctioned
3 >3504 full load hours and <100 kn CO2/MWh Hydropow er - 6
4 energy clusters No capacity auctioned
5 energy cooperative No capacity auctioned
6 agricultural biogas Biogas - 36
7 other Onshore w ind - 128
<1M
W>1M
W

EPODE17004 32
Appendix 4: Green-X model description
TU Wien’s Green-X is a specialised energy system model focussing on renewable energy technologies
that offers:
a thorough assessment of impacts stemming from various forms of energy policy
interventions, offering a detailed representation of key characteristics of different energy
policy instruments as input to modelling, complemented by a detailed assessment of their
impacts, and
a detailed description renewable energy technologies, characterised by their resource
potentials and related technology and feedstock cost, in Europe and in the analysed
neighbouring countries.
Green-X aims at indicating consequences of RES policy choices in a real-world energy policy context.
In principle, the model allows for conducting in-depth analyses of future RES deployment and
corresponding costs, expenditures and benefits arising from the preconditioned policy choices on
country, sector and technology level on a yearly basis, in the time span up to 2050.
Box 1: Brief characterisation of the Green-X model
The model Green-X has been developed by the Energy Economics Group (EEG) at TU Wien under
the EU research project “Green-X–Deriving optimal promotion strategies for increasing the share
of RES-E in a dynamic European electricity market" (Contract No. ENG2-CT-2002-00607).
Initially focussed on the electricity sector, this modelling tool, and its database on renewable
energy (RES) potentials and costs, has been extended to incorporate renewable energy
technologies within all energy sectors.
Green-X covers the EU-28, the Contracting Parties of the Energy Community (West Balkans,
Ukraine, Moldova) and selected other EU neighbours (Turkey, North African countries). It allows
the investigation of the future deployment of RES as well as the accompanying cost (including
capital expenditures, additional generation cost of RES compared to conventional options,
consumer expenditures due to applied supporting policies) and benefits (for instance, avoidance
of fossil fuels and corresponding carbon emission savings). Results are calculated at both a
country- and technology-level on a yearly basis. The time-horizon allows for in-depth
assessments up to 2050. The Green-X model develops nationally specific dynamic cost-resource
curves for all key RES technologies, including for renewable electricity, biogas, biomass,
biowaste, wind on- and offshore, hydropower large- and small-scale, solar thermal electricity,
photovoltaic, tidal stream and wave power, geothermal electricity; for renewable heat, biomass,
sub-divided into log wood, wood chips, pellets, grid-connected heat, geothermal grid-connected
heat, heat pumps and solar thermal heat; and, for renewable transport fuels, first generation
biofuels (biodiesel and bioethanol), second generation biofuels (lignocellulosic bioethanol,
biomass to liquid), as well as the impact of biofuel imports. Besides the formal description of RES
potentials and costs, Green-X provides a detailed representation of dynamic aspects such as
technological learning and technology diffusion.

EPODE17004 33
Through its in-depth energy policy representation, the Green-X model allows an assessment of
the impact of applying (combinations of) different energy policy instruments (for instance, quota
obligations based on tradable green certificates / guarantees of origin, (premium) feed-in tariffs,
tax incentives, investment incentives, impact of emission trading on reference energy prices) at
both country or European level in a dynamic framework. Sensitivity investigations on key input
parameters such as non-economic barriers (influencing the technology diffusion), conventional
energy prices, energy demand developments or technological progress (technological learning)
typically complement a policy assessment.
Within the Green-X model, the allocation of biomass feedstock to feasible technologies and
sectors is fully internalised into the overall calculation procedure. For each feedstock category,
technology options (and their corresponding demands) are ranked based on the feasible revenue
streams as available to a possible investor under the conditioned, scenario-specific energy policy
framework that may change on a yearly basis. Recently, a module for intra-European trade of
biomass feedstock has been added to Green-X that operates on the same principle as outlined
above but at a European rather than at a purely national level. Thus, associated transport costs
and GHG emissions reflect the outcomes of a detailed logistic model. Consequently, competition
on biomass supply and demand arising within a country from the conditioned support incentives
for heat and electricity as well as between countries can be reflected. In other words, the
supporting framework at MS level may have a significant impact on the resulting biomass
allocation and use as well as associated trade.
Moreover, Green-X was extended throughout 2011 to allow an endogenous modelling of
sustainability regulations for the energetic use of biomass. This comprises specifically the
application of GHG constraints that exclude technology/feedstock combinations not complying
with conditioned thresholds. The model allows flexibility in applying such limitations, that is to
say, the user can select which technology clusters and feedstock categories are affected by the
regulation both at national and EU level, and, additionally, applied parameters may change over
time.

EPODE17004 34
Appendix 5: Cost assumptions for RES technologies (extract from the Green-X database)
Economic conditions of the various RES technologies are based on both economic and technical
specifications, varying across the EU countries and specifically also within Poland.20 The Green-X
database and the corresponding model use a quite detailed level of specifying costs and potentials. The
analysis is not based on average costs per technology. For each technology, a detailed cost-curve is
specified for each year, based on so-called cost-bands. These cost-bands summarize a range of
production sites that can be described by similar cost factors. For each technology, a minimum of 6 to
10 cost bands are specified by country. For biomass, at least 50 cost bands are specified for each year
in each country.
To illustrate the economic figures for each technology Table 8 represents the economic parameters and
accompanying technical specifications for renewable energy technologies in the electricity sector. Note
that all expressed data aim to reflect the situation at the start year within the modelling of scenarios -
more precisely, they refer to the year 2010 and are expressed in real terms (i.e. €2010). Complementary
to this table, a graphical illustration of the assumed cost trends over time is shown in Figure 14 for
selected key renewable energy technologies, considering the specifics of the modelling exercise done
for Poland. One can observe the achieved and in future expected progress in reducing cost of
photovoltaics. A cost decline can also be identified for other renewable energy technologies like wind
or the various types of biomass technologies – but at a significantly lower magnitude than in the case
of photovoltaics.
Figure 14 Assumed development of investment cost (per kW) for selected key renewable energy technologies
20 Note that in the model Green-X the calculation of generation costs for the various generation options is done by a rather complex mechanism,
internalized within the overall set of modelling procedures. Thereby, band-specific data (e.g. investment costs, efficiencies, full load-hours,
etc.) is linked to general model parameters as interest rate and depreciation time.
0
500
1000
1500
2000
2500
3000
3500
4000
2010 2012 2014 2016 2018 2020
€p
er k
W
Biogas
Biomass cofiring
Biomass CHP plants (small-scale)
Biomass CHP plants (large-scale)
Photovoltaics
Wind onshore

EPODE17004 35
Table 8 Overview on economic-& technical-specifications for new RES-E plant (for the base year 2010)
RES-E sub-category
Plant specification
Investment costs
O&M costs
Efficiency (electricity)
Efficiency (heat)
Lifetime (average)
Typical plant size
[€/kWel] [€/(kWel*
year)] [1] [1] [years] [MWel]
Biogas
Agricultural biogas plant 2890 – 4860 137 - 175 0.28 - 0.34 - 25 0.1 - 0.5
Agricultural biogas plant -
CHP 3120 – 5085 143 – 182 0.27 - 0.33 0.55 - 0.59 25 0.1 - 0.5
Landfill gas plant 1445 - 2080 51 – 82 0.32 - 0.36 - 25 0.75 - 8
Landfill gas plant - CHP 1615 - 2255 56 - 87 0.31 - 0.35 0.5 - 0.54 25 0.75 - 8
Sewage gas plant 2600 - 3875 118 – 168 0.28 - 0.32 - 25 0.1 - 0.6
Sewage gas plant - CHP 2775 - 4045 127 – 179 0.26 - 0.3 0.54 - 0.58 25 0.1 - 0.6
Biomass
Biomass plant 2540 - 3550 97 – 175 0.26 - 0.3 - 30 1 – 25
Cofiring 350 - 580 112 – 208 0.35 – 0.45 - 30 -
Biomass plant - CHP 2600 - 4375 86 – 176 0.22 - 0.27 0.63 - 0.66 30 1 – 25
Cofiring – CHP 370 - 600 115 – 242 0.20 – 0.35 0.5 - 0.65 30 -
Biowaste Waste incineration plant 5150 – 6965 100 - 184 0.18 - 0.22 - 30 2 – 50
Waste incineration plant -
CHP 5770 - 7695 123 – 203 0.16 - 0.19 0.62 - 0.64 30 2 – 50
Geothermal electricity
Geothermal power plant 2335 - 7350 101 - 170 0.11 - 0.14 - 30 5 – 50
Hydro large-scale
Large-scale unit 1600 - 3460 33 – 36 - - 50 250
Medium-scale unit 2125 – 4900 34 – 37 - - 50 75
Small-scale unit 2995 – 6265 35 – 38 - - 50 20
Upgrading 870 – 3925 33 – 38 - - 50 -
Hydro small-scale
Large-scale unit 1610 - 3540 36 – 39 - - 50 9.5
Medium-scale unit 1740 - 5475 37 – 40 - - 50 2
Small-scale unit 1890- 6590 38 – 41 - - 50 0.25
Upgrading 980 - 3700 36 – 41 - - 50 -
Photovoltaics PV plant 2675 - 3480 30 – 39 - - 25 0.005 -
0.05
Wind onshore
Wind power plant 1350 – 1685 30 – 36 - - 20 2
Wind offshore
Wind power plant -
nearshore 2850 - 2950 64 – 70 - - 20 5
Wind power plant -
offshore: 5…30km 3150 – 3250 70 – 80 - - 20 5
Wind power plant -
offshore: 30…50km 3490 - 3590 75 – 85 - - 20 5
Wind power plant -
offshore: 50km… 3840 - 3940 80 – 90 - - 20 5

ECOFYS Germany GmbH | Albrechtstraße 10 c | 10117 Berlin | T +49 (0)30 29773579-0 | F +49 (0)30 29773579-99 | E [email protected] | I www.ecofys.com

ECOFYS Germany GmbH
Albrechtstraße 10 c
10117 Berlin
T: +49 (0) 30 29773579-0
F: +49 (0) 30 29773579-99
I: www.ecofys.com