2020 Methodology for Determining Rural Status
29
MEMBERS FIONA MA, CPA, CHAIR State Treasurer BETTY YEE State Controller KEELY MARTIN BOSLER Director of Finance GUSTAVO VELASQUEZ Director of HCD TIA BOATMAN PATTERSON Executive Director of CalHFA EXECUTIVE DIRECTOR Judith Blackwell 915 Capitol Mall, Suite 485 Sacramento, CA 95814 p (916) 654-6340 f (916) 654-6033 [email protected] www.treasurer.ca.gov/ctcac CALIFORNIA TAX CREDIT ALLOCATION COMMITTEE DATE: June 3, 2020 TO: Tax Credit Applicants FROM: Gina Ferguson, Development Section Chief RE: Methodology for Determining Rural Status of Project Site for 2020 Applications Pursuant to California law, the California Tax Credit Allocation Committee (“TCAC” or “Committee”) shall set aside twenty percent (20%) of all annual nine percent (9%) federal credits for projects in rural areas. 1 With certain limited exceptions, TCAC regulations require all projects located in rural areas to compete for credits in the rural set-aside. 2 Therefore, all applicants competing for nine percent (9%) tax credits must document, to the Committee’s satisfaction, the rural or non-rural status of their projects. Section 50199.21 of the Health and Safety Code defines “rural area” as an area that satisfies one of three criteria on January 1 of any calendar year. A project competing in the rural set-aside must demonstrate that the project area is rural under one of the three methodologies listed under Section 50199.21 of the Health and Safety Code and detailed in this memo: 1. Non-metropolitan Counties; 2. Rural Housing Service (RHS) Eligible Area; or 3. Small City Status. Continue reading for complete instructions on determining rural status via the three methodologies. See also attached Exhibits: Exhibit A: Health and Safety Code Sections 50199.20 and 50199.21 Exhibit B: USDA Section 515 Designated Places List (expires 12/31/21) Exhibit C: Department of Finance 2019 Population Estimates (as available May 2019) 1 REV.& TAX. § 23610.5(j)(5); HEALTH & SAFETY § 50199.20. 2 CAL. CODE. REGS. tit. 4, § 10315(c).
Transcript of 2020 Methodology for Determining Rural Status

MEMBERS
FIONA MA, CPA, CHAIR
State Treasurer
BETTY YEE
State Controller
KEELY MARTIN BOSLER
Director of Finance
GUSTAVO VELASQUEZ
Director of HCD
TIA BOATMAN PATTERSON
Executive Director of CalHFA
EXECUTIVE DIRECTOR
Judith Blackwell
915 Capitol Mall, Suite 485
Sacramento, CA 95814
p (916) 654-6340
f (916) 654-6033
www.treasurer.ca.gov/ctcac
CALIFORNIA TAX CREDIT ALLOCATION COMMITTEE
DATE: June 3, 2020
TO: Tax Credit Applicants
FROM: Gina Ferguson, Development Section Chief
RE: Methodology for Determining Rural Status of Project Site for 2020 Applications
Pursuant to California law, the California Tax Credit Allocation Committee (“TCAC” or “Committee”)
shall set aside twenty percent (20%) of all annual nine percent (9%) federal credits for projects in rural
areas.1 With certain limited exceptions, TCAC regulations require all projects located in rural areas to
compete for credits in the rural set-aside.2 Therefore, all applicants competing for nine percent (9%) tax
credits must document, to the Committee’s satisfaction, the rural or non-rural status of their projects.
Section 50199.21 of the Health and Safety Code defines “rural area” as an area that satisfies one of three
criteria on January 1 of any calendar year. A project competing in the rural set-aside must demonstrate that
the project area is rural under one of the three methodologies listed under Section 50199.21 of the Health
and Safety Code and detailed in this memo:
1. Non-metropolitan Counties;
2. Rural Housing Service (RHS) Eligible Area; or
3. Small City Status.
Continue reading for complete instructions on determining rural status via the three methodologies. See
also attached Exhibits:
Exhibit A: Health and Safety Code Sections 50199.20 and 50199.21
Exhibit B: USDA Section 515 Designated Places List (expires 12/31/21)
Exhibit C: Department of Finance 2019 Population Estimates (as available May 2019)
1 REV.& TAX. § 23610.5(j)(5); HEALTH & SAFETY § 50199.20. 2 CAL. CODE. REGS. tit. 4, § 10315(c).

Methodology 1: Non-metropolitan Counties
Projects in non-metropolitan areas are considered rural. Under the current definition of “metropolitan
statistical area” established by the United States Office of Management and Budget effective in 2010 and
still effective as of January 1, 2020, twenty one (21) of the fifty eight (58) counties in California are
considered non-metropolitan. Projects located in the following counties are not required to provide
documentation of their rural status and will be considered as rural:
Alpine Colusa Humboldt Lassen Modoc Plumas Tehama
Amador Del Norte Inyo Mariposa Mono Sierra Trinity
Calaveras Glenn Lake Mendocino Nevada Siskiyou Tuolumne
Methodology 2: Rural Housing Service (RHS) Eligible Area
Areas eligible for the RHS Section 515 program are considered rural.
The USDA Rural Development established a list of eligible areas known as the “Section 515 Designated
Places List.” An area is eligible under the Section 515 program on January 1 of the calendar year in question
if it resides on the Section 515 Designated Places List in effect the prior September 30.3 For 2020, the
effective list is the Section 515 Designated Places List included in Exhibit B of this memo.
Note, the Designated Places List does not contain every area eligible for the Section 515 program. Certain
areas not included in the list may still be eligible for the Section 515 program. Note also, an existing project
with an existing RHS 515 loan does not necessarily qualify for Section 515 program under the current
Designated Places List. Applicants are advised to contact the California State Office of the USDA Rural
Housing Services (“USDA”) directly to confirm the Section 515 program eligibility of a project’s area.4
Proceed as follows to satisfy Methodology 2:
1) Check to see if the project’s area is on the Section 515 Designated Places List (Exhibit B);
2) If the project’s area is listed on the Section 515 Designated Places List, include the following items
in Tab 3 of the application: a) a printout of the page in the Designated Places List with the project’s
area highlighted, and b) evidence that the project is located within the highlighted area;
3) If the project’s area is not listed on the Section 515 Designated Places List, contact USDA to
determine whether or not the area is eligible for the Section 515 program. If the area is eligible for
the Section 515 program according to USDA, the applicant must provide a current letter from the
USDA Multifamily Housing Program Director stating that the project is located in an area eligible
for the Section 515 program.
USDA Contact for Section 515 Designated Places List:
Debra Moretton, Multifamily Housing Program Specialist
United States Department of Agriculture, Rural Development, Auburn Office
11661 Blocker Drive, Suite 120
Auburn, CA 95603
Phone: 530-217-6248
www.rd.usda.gov/ca
3 CAL. CODE. REGS. tit. 4, § 10315(c); HEALTH & SAFETY § 50199.21. 4 Id. § 10322(h)(31).

Methodology 3: Small City Status
A project area may be rural under the Small City Status methodology, provided that both of the following
conditions are met:
1) The project is located in an incorporated city having a population of 40,000 or less, or in an
unincorporated area which adjoins5 a city having a population of 40,000 or less. Check the city’s
latest population estimate in California Department of Finance Report E-1: 2019 Population
Estimates (“DOF 2019 Population Estimates”), included in Exhibit C of this memo.6 AND
2) The project’s address is located in an area that is not designated as an “urbanized area.” Refer to
the Census Data located at the U.S. Census Bureau website using the Geocoder search tool to
determine whether or not an address is located in an area that is rural. Note, an area designated as
“inside urban clusters” is considered rural. An area designated as “inside urbanized areas” is not
considered rural.
Proceed as follows to satisfy Methodology 3:
1) Check the project city’s latest population estimate (as of 1/1/2019) in DOF 2019 Population
Estimates (Exhibit C);
a. If the project city has a population exceeding 40,000, then STOP. The project area is not
rural under the Small City Status methodology;
b. If the project city has a population of 40,000 or less, proceed to step 2;
2) Go to the Geocoder search tool at the US Census Bureau website: https://geocoding.geo.census.gov/geocoder/geographies/address?form
a. In the “Find Address Results” field in Geocoder, enter the project’s street address and press
the “FIND” button in the lower left corner of the screen. Ensure that “Public_AR_Current”
is slected in the “Benchmark” dropdown menu. This will correctly automatically select
“Current_Current” in the “Vintage” dropdown field. Following these steps will produce a
partial results page.
b. On the partial results page, modify the url by adding the following sequence to the end of
the url in the browser address bar: &layers=64,66 A modified url will look similar to this:
Once you’ve modified the url, press enter on your keyboard. This will produce a final results
page.
c. On the final results page, scroll down and review the data to determine if any identification
information was returned under the “Urbanized Areas” header. Identification information
under this header would look like this:
5 For guidance on determining “adjoining” contact TCAC’s rural region analyst, Ruben Barcelo. 6 For more information http://www.dof.ca.gov/research/demographic/reports/estimates/e-1/view.php.

d. If identification information was returned under the “Urbanized Areas” header, then the
project’s location is not rural.
e. If no identification information was returned under the “Urbanized Areas” header, then no
information and no error message will be displayed under the header, as in the following
example:
f. If no identification information or error was returned in the “Urbanized Areas” header, the
final results page may return identification information under the “Urban Clusters” section,
which would look like this:
g. If identification information is returned in the “Urban Clusters” header and none was
returned in the “Urbanized Areas” header, we conclude that the project’s address is located
within a rural area. If no identifying information is returned under either the “Urbanized
Areas” header or the “Urban Clusters” header, we also conclude that the project’s address is
located in a rural area.

h. If the project meets both the conditions under the Small City Status methodology, include
the following items in Tab 3 of the application: 1) a copy of the page in the DOF 2019
Population Estimates with the project’s city and population highlighted, and 2) a copy of the
final results page from Geocoder. Prepare this copy by copying the returned data and pasting
it into a blank Excel worksheet.
i. When using Geocoder, you may paste an entire address using the convenient “One Line”
option found on the left margin under the “Find Geographies Using…” Option, rather than
entering the street address, city, state and zip code on separate lines. If your search in
Geocoder returns data that includes errors, refresh the page by selecting either the “One
Line” or “Address” options under the “Find Geographies Using…” Option and then re-enter
your address. If this does not clear the error, try your search again later in the day.
Technical Assistance:
For assistance or information regarding TCAC’s rural status determination, contact TCAC’s rural region
analyst Ruben Barcelo at 916-651-6018 or [email protected].

EXHIBIT A
Health and Safety Code
Sections 50199.20 and 50199.21
50199.20.(a) Not less than 20 percent of the federal ceiling onlow-income housing tax credits shall be set aside for allocation to rural areas as defined in Section 50199.21. Any amount of credit set aside for rural areas remaining after the ranking of credits in the final cycle of any calendar year shall be available for allocation to any eligible project.(b) Up to 2 percent of the low-income housing tax credit available under this chapter and Sections 12206, 17058, and 23610.5 of the Revenue and Taxation Code may be set aside for small developments as determined by the committee. Any amount of credit set aside for small developments remaining after the ranking of projects in the final cycle of any calendar year shall be available for allocation to any eligible project.(c) Not less than the amount specified in paragraph (4) of subdivision (g) of Sections 12206, 17058, and 23610.5 of the Revenue and Taxation Code shall be set aside to provide farmworker housing, as defined in subdivision (h) of Section 50199.7 of the Health and Safety Code.
50199.21."Rural area" for the purpose of this chapter and Sections17058 and 23610.5 of the Revenue and Taxation Code, means an area, which, on January 1 of any calendar year satisfies any of the following criteria:(a) The area is eligible for financing under the Section 515 program, or successor program, of the Rural Development Administration of the United States Department of Agriculture.(b) The area is located in a nonmetropolitan area as defined in Section 50090.(c) The area is either (1) an incorporated city having a population of 40,000 or less as identified in the most recent Report E-1 published by the Demographic Research Unit of the Department of Finance, or (2) an unincorporated area which adjoins a city having a population of 40,000 or less, provided that the city and its adjoining unincorporated area are not located within a census tract designated as an urbanized area by the United States Census Bureau. The department shall assist in determinations of eligibility pursuant to this subdivision upon request. With respect to areas eligible under subdivision (b) and this subdivision, the committee may rely upon the recommendations made by the department. Any inconsistencies between areas eligible under subdivisions (a) and (b), and this subdivision, shall be resolved in favor of considering the area a rural area. Eligible and ineligible areas need not be established by regulation.

EXHIBIT B
USDA Section 515 Designated Places List

USDA RURAL DEVELOPMENTCalifornia State Office
DESIGNATED PLACES FOR SECTION 515 RURAL RENTAL HOUSING PROJECTSExpires 12/31/2021
Places on this list are considered equal, with no regard to their order on the list. Inclusion on this list does not indicate that a need or demand for Section 515 has been established.
County PlaceAmador Amador CityAmador IoneAmador JacksonAmador PlymouthAmador Sutter CreekButte BiggsButte DurhamButte GridleyButte OrovilleButte PalermoCalaveras Angels City (Angels Camp)Calaveras Arnold Calaveras Murphys (Family Only)Calaveras San Andreas (Elderly Only)Calaveras West PointColusa ArbuckleColusa ColusaColusa Williams (Elderly Only)Contra Costa KnightsenDel Norte Crescent CityDel Norte Crescent City NorthDel Norte KlamathDel Norte Smith RiverEl Dorado Diamond SpringsEl Dorado El DoradoEl Dorado GeorgetownEl Dorado Pollock PinesEl Dorado Shingle SpringsFresno CaruthersFresno Del ReyFresno FirebaughFresno FowlerFresno HuronFresno LaytonvilleFresno Orange CoveFresno TranquilityFresno San JoaquinFresno Squaw ValleyGlenn Hamilton
1

Designated Places for Section 515 - California - continued
County Place Glenn Orland Glenn Willows Humboldt Arcata Humboldt Bayside Humboldt Blue Lake Humboldt Ferndale Humboldt Fortuna Humboldt Garberville Humboldt McKinleyville Humboldt Redway Humboldt Rio Dell Humboldt Trinidad Humboldt Willow Creek Imperial Calipatria Imperial Holtville Imperial Niland Imperial Seely Imperial Westmoreland Inyo Bishop Inyo Lone Pine Kern Delano Kern Lake Isabella Kern Lost Hills Kern Maricopa Kern Taft Kings Armona Lake Clearlake Lake Kelseyville Lake Lakeport Lake Lower Lake Lake Middle Lake Lake Lucerne Lake Nice Lake Upper Lake Lassen Susanville Mariposa Mariposa Mendocino Covelo Mendocino Fort Bragg Mendocino Laytonville Mendocino Mendocino Mendocino Point Arena Mendocino Ukiah Mendocino Willits Merced Dos Palos Merced Gustine Modoc Alturas
2

Designated Places for Section 515 - California - continued
County Place Mono Mammoth Lakes Monterey Castroville Monterey Chualar Monterey Del Rey Oaks Monterey Gonzales Monterey Las Lomas Monterey San Lucas Napa Calistoga Napa St. Helena Napa Yountville Nevada Grass Valley Nevada Nevada City Nevada Penn Valley Nevada Truckee Placer Colfax Placer Loomis Placer Foresthill Placer Kings Beach Placer Meadow Vista Placer Newcastle Placer Penryn Placer Sunnyside-Tahoe City Placer Weimar Plumas Portola Plumas Quincy Riverside Cabazon Sacramento Isleton San Benito San Juan Bautista San Bernardino Joshua Tree San Bernardino Lenwood San Bernardino Running Springs San Bernardino Wrightwood San Diego Borrego Springs San Diego Rainbow San Diego Valley Center San Joaquin Escalon San Luis Obispo Grover Beach San Luis Obispo Oceano San Luis Obispo Pismo Beach San Luis Obispo Santa Margarita San Luis Obispo Templeton Santa Barbara Buellton Santa Barbara Guadalupe Santa Barbara Los Alamos Santa Barbara Los Olivos Santa Cruz Ben Lomond Santa Cruz Felton
3

Designated Places for Section 515 - California - continued
County Place Shasta Anderson Shasta Burney Shasta Cottonwood Shasta Fall River Mills Sierra Loyalton Siskiyou Dorris Siskiyou Dunsmuir Siskiyou Etna Siskiyou Fort Jones Siskiyou McCloud Siskiyou Montague Siskiyou Mt. Shasta Siskiyou Tulelake Siskiyou Weed Siskiyou Yreka (Elderly Only) Solano Rio Vista Sonoma Cloverdale Sonoma Forestville Sonoma Guerneville Sonoma Monte Rio Sonoma Sebastopol Stanislaus Hughson Sutter Live Oak Sutter Sutter Tehama Corning Tehama Red Bluff (Elderly Only) Tehama Tehama Trinity Hayfork Trinity Lewiston Trinity Weaverville Tulare Earlimart Tulare London Tulare Richgrove Tulare Strathmore Tulare Tipton Tuolumne Columbia Tuolumne Jamestown Tuolumne Sonora Tuolumne Tuolumne Tuolumne Twaine Hart (Elderly Only) Ventura Santa Paula Yolo Esparto Yolo Winters Yuba Wheatland
4

The following California Colonia’s are eligible to compete for the Colonia’s Set-Aside:
County Place Imperial Bombay Beach Colonia Imperial CN Perry Colonia Imperial East Colonia Imperial El Dorado Colonia Imperial Heber Colonia Imperial Kloke Colonia Imperial Niland Colonia Imperial Ocotillo Colonia Imperial Palo Verde Colonia Imperial Poe Colonia Imperial Salton Sea Beach Colonia Imperial Seeley Colonia Imperial South Colonia Imperial Winterhaven Colonia Riverside Mecca Colonia Riverside Thermal Colonia San Diego Campo Colonia San Diego Guatay Colonia San Diego Jacumba Colonia San Diego Lake Morena Colonia San Diego Tecate Colonia
The following places have been identified as eligible high-need communities for rural rental housing from the FY 2018/2019 Annual Action Plan supplement to the State of CA, 2015-2020 Consolidated Plan:
County Place Amador Amador City Amador Ione Amador Jackson Amador Plymouth Amador Sutter Creek Butte Biggs Butte Gridley Butte Oroville Calaveras Angels Camp Colusa Colusa Del Norte Crescent City Fresno Firebaugh Fresno Fowler Fresno Huron Fresno Orange Cove Fresno San Joaquin Glenn Orland Glenn Willows Humboldt Arcata Humboldt Blue Lake
5

Eligible California High-Needs Communities - continued
County Place Humboldt Ferndale Humboldt Fortuna Humboldt Rio Dell Humboldt Trinidad Imperial Calipatria Imperial Holtville Imperial Seely Inyo Bishop Kern Delano Kern Maricopa Kern Taft Lake Clearlake Lake Lakeport Lassen Susanville Mendocino Fort Bragg Mendocino Point Arena Mendocino Ukiah Mendocino Willits Merced Dos Palos Merced Gustine Modoc Alturas Mono Mammoth Lakes Monterey Del Rey Oaks Napa Calistoga Napa St. Helena Napa Yountville Nevada Grass Valley Nevada Nevada City Nevada Truckee Placer Colfax Placer Loomis Plumas Portola Riverside Cabazon San Benito San Juan Bautista San Luis Obispo Grover Beach San Luis Obispo Pismo Beach Santa Barbara Guadalupe Santa Cruz Capitola Santa Cruz Scotts Valley Shasta Anderson Sierra Loyalton Siskiyou Dorris Siskiyou Dunsmuir Siskiyou Etna Siskiyou Fort Jones Siskiyou Montague Siskiyou Mt. Shasta
6

Eligible California High-Needs Communities - continued
County Place Siskiyou Tulelake Siskiyou Weed Siskiyou Yreka (Elderly Only) Solano Rio Vista Sutter Live Oak Tehama Corning Tehama Red Bluff (Elderly Only) Tehama Tehama Tuolumne Sonora
The following Federally Recognized Indian Tribes have been identified as high-need Indian Reservations or communities located within the boundaries of tribal allotted or trust land:
County Tribe/Reservation Alpine Washoe Tribe of Nevada & California (Woodfords Community Only) Humboldt Hoopa Valley Tribe Humboldt Yurok Tribe of the Yurok Reservation Imperial Fort Yuma Quechan Indian Nation Inyo Bishop Paiute Tribe Lassen Susanville Indian Rancheria Riverside Cabazon Band of Indians Riverside San Pasqual Band of Mission Indians Riverside Torres-Martinez Desert Cahuilla Indians San Bernardino Chemhuevi Reservation San Bernardino Fort Mojave Indian Tribe San Diego Barona Group of the Capitan Grande San Diego Pala Band of Mission Indians San Diego Rincon Band of Luiseno Indians Siskiyou Karuk Tribe of California
USDA is an equal opportunity provider, employer and lender.
7

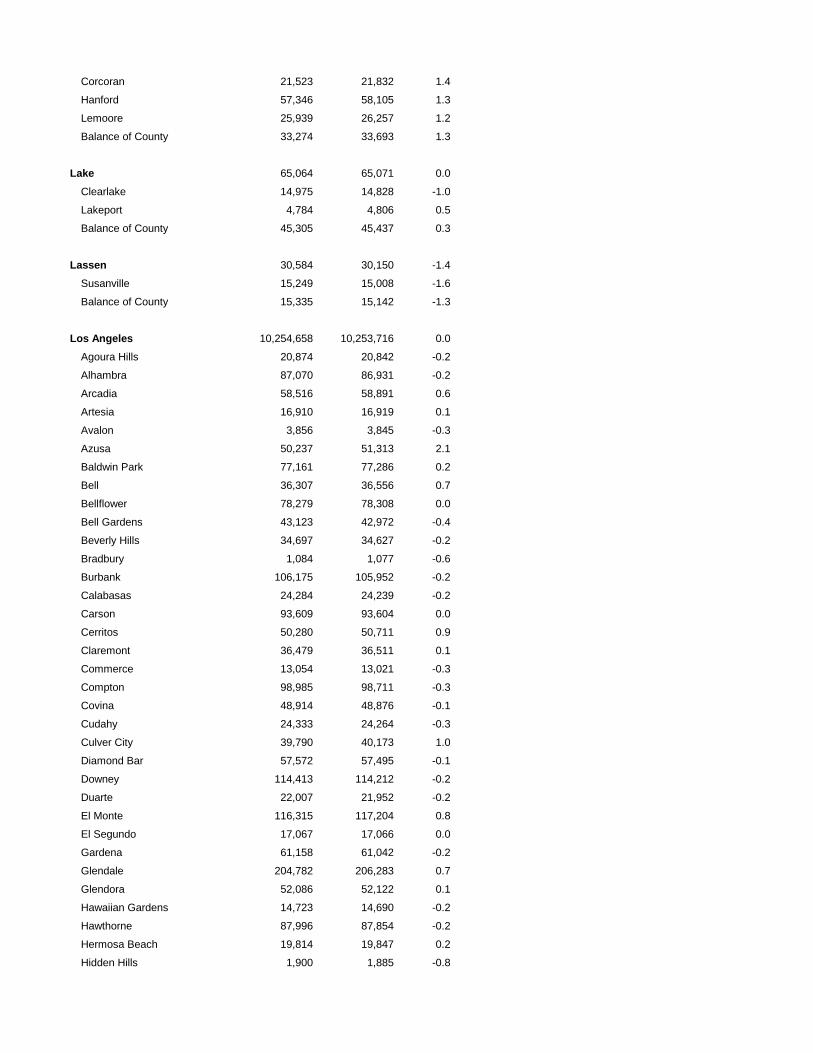
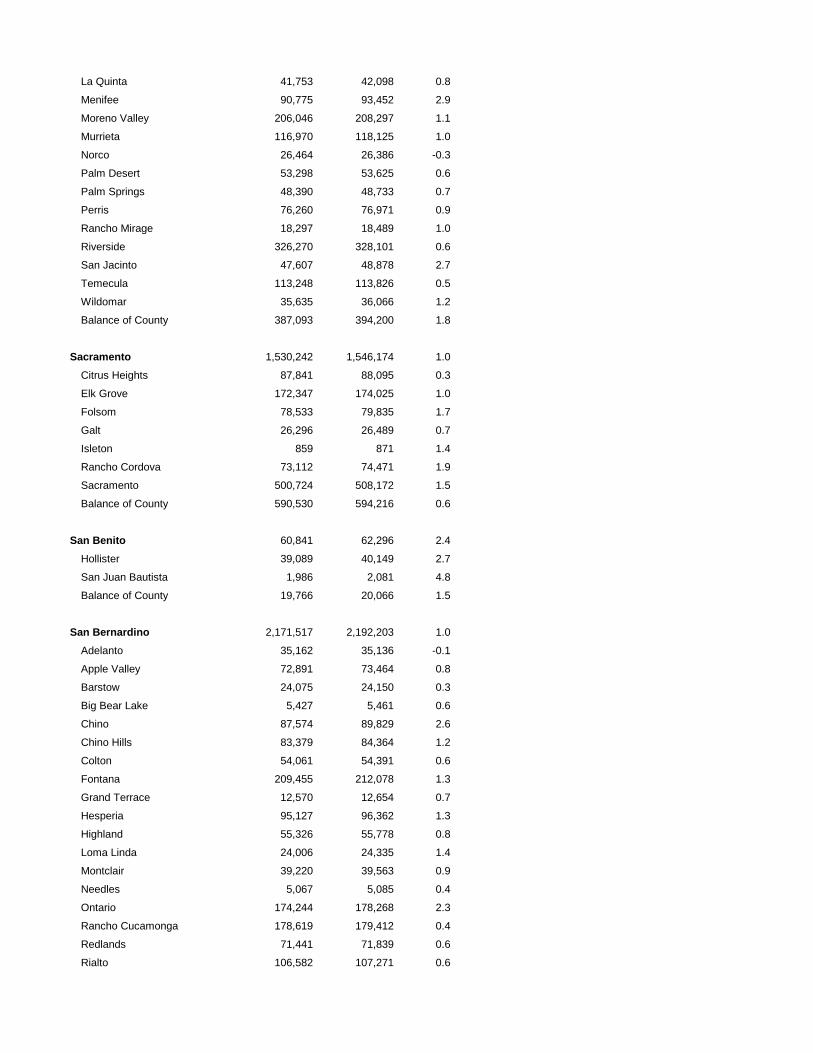
EXHIBIT C
California Department of Finance
Report E-1: 2019 Population Estimates

State/County/City Percent
1/1/2018 1/1/2019 Change
California 39,740,508 39,927,315 0.5
Alameda 1,656,884 1,669,301 0.7
Alameda 78,980 79,316 0.4
Albany 19,216 19,393 0.9
Berkeley 122,369 123,328 0.8
Dublin 61,874 64,577 4.4
Emeryville 11,871 11,885 0.1
Fremont 231,252 232,532 0.6
Hayward 158,693 159,433 0.5
Livermore 90,359 91,039 0.8
Newark 47,178 48,712 3.3
Oakland 431,373 432,897 0.4
Piedmont 11,368 11,420 0.5
Pleasanton 79,483 80,492 1.3
San Leandro 89,552 89,825 0.3
Union City 74,058 74,916 1.2
Balance of County 149,258 149,536 0.2
Alpine 1,161 1,162 0.1
Amador 37,920 38,294 1.0
Amador 186 188 1.1
Ione 8,016 7,991 -0.3
Jackson 4,692 4,770 1.7
Plymouth 991 1,012 2.1
Sutter Creek 2,523 2,559 1.4
Balance of County 21,512 21,774 1.2
Butte 227,896 226,466 -0.6
Biggs 1,894 2,066 9.1
Chico 92,861 112,111 20.7
Gridley 6,921 7,224 4.4
Oroville 18,091 21,773 20.4
Paradise 26,423 4,590 -82.6
Balance of County 81,706 78,702 -3.7
Calaveras 45,147 45,117 -0.1
Angels City 3,826 3,840 0.4
Balance of County 41,321 41,277 -0.1
Colusa 22,063 22,117 0.2
E-1: City/County Population Estimates with Annual Percent Change
January 1, 2018 and 2019
Total Population

Colusa 6,282 6,255 -0.4
Williams 5,438 5,527 1.6
Balance of County 10,343 10,335 -0.1
Contra Costa 1,147,879 1,155,879 0.7
Antioch 113,266 113,901 0.6
Brentwood 62,140 63,662 2.4
Clayton 11,631 11,653 0.2
Concord 129,493 129,889 0.3
Danville 45,103 45,270 0.4
El Cerrito 25,192 25,459 1.1
Hercules 25,964 26,224 1.0
Lafayette 26,077 26,327 1.0
Martinez 38,406 38,490 0.2
Moraga 16,886 16,939 0.3
Oakley 40,949 41,759 2.0
Orinda 19,331 19,475 0.7
Pinole 19,458 19,498 0.2
Pittsburg 72,006 72,541 0.7
Pleasant Hill 34,969 35,055 0.2
Richmond 110,128 110,436 0.3
San Pablo 31,737 31,817 0.3
San Ramon 83,179 83,957 0.9
Walnut Creek 69,498 70,121 0.9
Balance of County 172,466 173,406 0.5
Del Norte 27,192 27,401 0.8
Crescent City 6,821 6,828 0.1
Balance of County 20,371 20,573 1.0
El Dorado 189,592 191,848 1.2
Placerville 10,784 10,917 1.2
South Lake Tahoe 22,491 22,800 1.4
Balance of County 156,317 158,131 1.2
Fresno 1,007,252 1,018,241 1.1
Clovis 113,895 117,003 2.7
Coalinga 17,120 17,600 2.8
Firebaugh 8,078 8,132 0.7
Fowler 6,520 6,605 1.3
Fresno 531,580 536,683 1.0
Huron 7,289 7,308 0.3
Kerman 15,096 15,495 2.6
Kingsburg 12,253 12,392 1.1
Mendota 12,255 12,315 0.5
Orange Cove 9,924 9,975 0.5
Parlier 15,917 16,151 1.5
Reedley 26,556 26,666 0.4
Sanger 26,489 27,094 2.3

San Joaquin 4,200 4,216 0.4
Selma 24,932 25,045 0.5
Balance of County 175,148 175,561 0.2
Glenn 28,762 29,132 1.3
Orland 7,998 8,337 4.2
Willows 6,273 6,282 0.1
Balance of County 14,491 14,513 0.2
Humboldt 136,084 135,333 -0.6
Arcata 18,054 18,078 0.1
Blue Lake 1,253 1,243 -0.8
Eureka 27,195 26,977 -0.8
Ferndale 1,344 1,335 -0.7
Fortuna 12,144 12,084 -0.5
Rio Dell 3,351 3,326 -0.7
Trinidad 363 360 -0.8
Balance of County 72,380 71,930 -0.6
Imperial 189,623 190,266 0.3
Brawley 27,073 27,337 1.0
Calexico 42,034 42,198 0.4
Calipatria 7,551 7,281 -3.6
El Centro 46,193 46,248 0.1
Holtville 6,738 6,779 0.6
Imperial 19,511 19,929 2.1
Westmorland 2,460 2,461 0.0
Balance of County 38,063 38,033 -0.1
Inyo 18,599 18,593 0.0
Bishop 3,900 3,899 0.0
Balance of County 14,699 14,694 0.0
Kern 906,563 916,464 1.1
Arvin 21,577 22,178 2.8
Bakersfield 384,921 389,211 1.1
California City 14,871 15,000 0.9
Delano 53,664 53,936 0.5
Maricopa 1,237 1,240 0.2
McFarland 15,171 15,242 0.5
Ridgecrest 29,404 29,712 1.0
Shafter 20,093 20,886 3.9
Taft 9,493 9,430 -0.7
Tehachapi 12,976 13,668 5.3
Wasco 27,681 27,955 1.0
Balance of County 315,475 318,006 0.8
Kings 151,776 153,710 1.3
Avenal 13,694 13,823 0.9
Corcoran 21,523 21,832 1.4
Hanford 57,346 58,105 1.3
Lemoore 25,939 26,257 1.2
Balance of County 33,274 33,693 1.3
Lake 65,064 65,071 0.0
Clearlake 14,975 14,828 -1.0
Lakeport 4,784 4,806 0.5
Balance of County 45,305 45,437 0.3
Lassen 30,584 30,150 -1.4
Susanville 15,249 15,008 -1.6
Balance of County 15,335 15,142 -1.3
Los Angeles 10,254,658 10,253,716 0.0
Agoura Hills 20,874 20,842 -0.2
Alhambra 87,070 86,931 -0.2
Arcadia 58,516 58,891 0.6
Artesia 16,910 16,919 0.1
Avalon 3,856 3,845 -0.3
Azusa 50,237 51,313 2.1
Baldwin Park 77,161 77,286 0.2
Bell 36,307 36,556 0.7
Bellflower 78,279 78,308 0.0
Bell Gardens 43,123 42,972 -0.4
Beverly Hills 34,697 34,627 -0.2
Bradbury 1,084 1,077 -0.6
Burbank 106,175 105,952 -0.2
Calabasas 24,284 24,239 -0.2
Carson 93,609 93,604 0.0
Cerritos 50,280 50,711 0.9
Claremont 36,479 36,511 0.1
Commerce 13,054 13,021 -0.3
Compton 98,985 98,711 -0.3
Covina 48,914 48,876 -0.1
Cudahy 24,333 24,264 -0.3
Culver City 39,790 40,173 1.0
Diamond Bar 57,572 57,495 -0.1
Downey 114,413 114,212 -0.2
Duarte 22,007 21,952 -0.2
El Monte 116,315 117,204 0.8
El Segundo 17,067 17,066 0.0
Gardena 61,158 61,042 -0.2
Glendale 204,782 206,283 0.7
Glendora 52,086 52,122 0.1
Hawaiian Gardens 14,723 14,690 -0.2
Hawthorne 87,996 87,854 -0.2
Hermosa Beach 19,814 19,847 0.2
Hidden Hills 1,900 1,885 -0.8

Huntington Park 59,386 59,350 -0.1
Industry 432 432 0.0
Inglewood 112,759 112,549 -0.2
Irwindale 1,447 1,506 4.1
La Canada Flintridge 20,623 20,602 -0.1
La Habra Heights 5,489 5,485 -0.1
Lakewood 81,459 81,352 -0.1
La Mirada 49,585 49,558 -0.1
Lancaster 161,395 161,604 0.1
La Puente 40,719 40,795 0.2
La Verne 33,239 33,201 -0.1
Lawndale 33,527 33,436 -0.3
Lomita 20,776 20,763 -0.1
Long Beach 475,984 475,013 -0.2
Los Angeles 4,038,313 4,040,079 0.0
Lynwood 71,497 71,343 -0.2
Malibu 13,011 12,046 -7.4
Manhattan Beach 36,010 35,922 -0.2
Maywood 28,029 27,971 -0.2
Monrovia 38,582 38,529 -0.1
Montebello 64,316 64,247 -0.1
Monterey Park 62,061 61,828 -0.4
Norwalk 106,888 106,744 -0.1
Palmdale 157,782 157,854 0.0
Palos Verdes Estates 13,579 13,544 -0.3
Paramount 55,503 55,497 0.0
Pasadena 145,003 146,312 0.9
Pico Rivera 64,306 64,033 -0.4
Pomona 154,189 154,310 0.1
Rancho Palos Verdes 42,664 42,560 -0.2
Redondo Beach 68,361 68,473 0.2
Rolling Hills 1,898 1,892 -0.3
Rolling Hills Estates 8,254 8,247 -0.1
Rosemead 55,237 55,097 -0.3
San Dimas 34,669 34,584 -0.2
San Fernando 24,593 24,918 1.3
San Gabriel 41,270 41,178 -0.2
San Marino 13,360 13,352 -0.1
Santa Clarita 212,378 218,103 2.7
Santa Fe Springs 18,253 18,261 0.0
Santa Monica 93,698 93,593 -0.1
Sierra Madre 11,165 11,135 -0.3
Signal Hill 11,758 11,795 0.3
South El Monte 21,092 21,293 1.0
South Gate 97,019 96,777 -0.2
South Pasadena 26,276 26,245 -0.1
Temple City 36,447 36,583 0.4
Torrance 148,408 148,054 -0.2
Vernon 302 301 -0.3

Walnut 30,557 30,551 0.0
West Covina 108,388 108,116 -0.3
West Hollywood 36,723 36,660 -0.2
Westlake Village 8,451 8,378 -0.9
Whittier 87,756 87,526 -0.3
Balance of County 1,055,942 1,046,858 -0.9
Madera 158,328 159,536 0.8
Chowchilla 18,994 18,742 -1.3
Madera 65,671 66,419 1.1
Balance of County 73,663 74,375 1.0
Marin 262,803 262,879 0.0
Belvedere 2,148 2,148 0.0
Corte Madera 10,043 10,047 0.0
Fairfax 7,714 7,721 0.1
Larkspur 12,588 12,578 -0.1
Mill Valley 14,669 14,675 0.0
Novato 54,161 54,115 -0.1
Ross 2,528 2,526 -0.1
San Anselmo 12,908 12,902 0.0
San Rafael 60,020 60,046 0.0
Sausalito 7,421 7,416 -0.1
Tiburon 9,366 9,362 0.0
Balance of County 69,237 69,343 0.2
Mariposa 18,112 18,068 -0.2
Mendocino 89,130 89,009 -0.1
Fort Bragg 7,519 7,478 -0.5
Point Arena 466 463 -0.6
Ukiah 16,368 16,296 -0.4
Willits 5,025 4,996 -0.6
Balance of County 59,752 59,776 0.0
Merced 279,424 282,928 1.3
Atwater 30,980 31,470 1.6
Dos Palos 5,525 5,541 0.3
Gustine 5,888 5,884 -0.1
Livingston 14,376 14,811 3.0
Los Banos 40,880 41,898 2.5
Merced 85,921 87,110 1.4
Balance of County 95,854 96,214 0.4
Modoc 9,599 9,602 0.0
Alturas 2,725 2,755 1.1
Balance of County 6,874 6,847 -0.4
Mono 13,727 13,616 -0.8

Mammoth Lakes 8,064 8,004 -0.7
Balance of County 5,663 5,612 -0.9
Monterey 442,940 445,414 0.6
Carmel-by-the-Sea 3,967 3,987 0.5
Del Rey Oaks 1,727 1,734 0.4
Gonzales 8,640 8,677 0.4
Greenfield 17,932 18,009 0.4
King City 14,527 14,724 1.4
Marina 22,548 22,957 1.8
Monterey 28,473 28,448 -0.1
Pacific Grove 15,807 15,883 0.5
Salinas 161,899 162,797 0.6
Sand City 393 397 1.0
Seaside 34,382 33,776 -1.8
Soledad 25,890 26,079 0.7
Balance of County 106,755 107,946 1.1
Napa 140,966 140,779 -0.1
American Canyon 20,630 20,629 0.0
Calistoga 5,391 5,453 1.2
Napa 79,495 79,490 0.0
St Helena 6,119 6,133 0.2
Yountville 2,938 2,916 -0.7
Balance of County 26,393 26,158 -0.9
Nevada 99,024 98,904 -0.1
Grass Valley 12,785 12,769 -0.1
Nevada City 3,114 3,122 0.3
Truckee 16,432 16,434 0.0
Balance of County 66,693 66,579 -0.2
Orange 3,213,275 3,222,498 0.3
Aliso Viejo 51,664 51,372 -0.6
Anaheim 358,703 359,339 0.2
Brea 44,539 45,606 2.4
Buena Park 83,594 83,384 -0.3
Costa Mesa 114,536 115,830 1.1
Cypress 49,774 49,833 0.1
Dana Point 34,365 34,249 -0.3
Fountain Valley 56,914 56,652 -0.5
Fullerton 143,313 142,824 -0.3
Garden Grove 174,951 175,155 0.1
Huntington Beach 202,097 203,761 0.8
Irvine 274,055 280,202 2.2
Laguna Beach 23,474 23,358 -0.5
Laguna Hills 31,751 31,572 -0.6
Laguna Niguel 65,777 66,748 1.5
Laguna Woods 16,612 16,518 -0.6

La Habra 62,558 63,542 1.6
Lake Forest 85,048 86,346 1.5
La Palma 15,914 15,820 -0.6
Los Alamitos 11,790 11,721 -0.6
Mission Viejo 96,856 96,434 -0.4
Newport Beach 87,614 87,180 -0.5
Orange 141,116 141,691 0.4
Placentia 52,602 52,333 -0.5
Rancho Santa Margarita 49,238 48,960 -0.6
San Clemente 65,732 65,405 -0.5
San Juan Capistrano 36,541 36,821 0.8
Santa Ana 339,192 337,716 -0.4
Seal Beach 25,191 25,073 -0.5
Stanton 39,483 39,307 -0.4
Tustin 81,755 81,369 -0.5
Villa Park 5,961 5,933 -0.5
Westminster 93,035 92,610 -0.5
Yorba Linda 68,804 68,706 -0.1
Balance of County 128,726 129,128 0.3
Placer 389,480 396,691 1.9
Auburn 14,291 14,392 0.7
Colfax 2,071 2,073 0.1
Lincoln 47,808 48,277 1.0
Loomis 6,848 6,887 0.6
Rocklin 66,711 69,249 3.8
Roseville 136,260 139,643 2.5
Balance of County 115,491 116,170 0.6
Plumas 19,793 19,779 -0.1
Portola 1,981 1,976 -0.3
Balance of County 17,812 17,803 -0.1
Riverside 2,412,536 2,440,124 1.1
Banning 30,950 31,044 0.3
Beaumont 46,545 48,401 4.0
Blythe 19,651 19,428 -1.1
Calimesa 9,080 9,159 0.9
Canyon Lake 11,213 11,285 0.6
Cathedral City 54,466 54,907 0.8
Coachella 45,777 46,351 1.3
Corona 167,013 168,101 0.7
Desert Hot Springs 29,102 29,251 0.5
Eastvale 65,725 66,078 0.5
Hemet 84,423 84,754 0.4
Indian Wells 5,389 5,445 1.0
Indio 88,194 89,406 1.4
Jurupa Valley 104,661 106,318 1.6
Lake Elsinore 62,241 62,949 1.1
La Quinta 41,753 42,098 0.8
Menifee 90,775 93,452 2.9
Moreno Valley 206,046 208,297 1.1
Murrieta 116,970 118,125 1.0
Norco 26,464 26,386 -0.3
Palm Desert 53,298 53,625 0.6
Palm Springs 48,390 48,733 0.7
Perris 76,260 76,971 0.9
Rancho Mirage 18,297 18,489 1.0
Riverside 326,270 328,101 0.6
San Jacinto 47,607 48,878 2.7
Temecula 113,248 113,826 0.5
Wildomar 35,635 36,066 1.2
Balance of County 387,093 394,200 1.8
Sacramento 1,530,242 1,546,174 1.0
Citrus Heights 87,841 88,095 0.3
Elk Grove 172,347 174,025 1.0
Folsom 78,533 79,835 1.7
Galt 26,296 26,489 0.7
Isleton 859 871 1.4
Rancho Cordova 73,112 74,471 1.9
Sacramento 500,724 508,172 1.5
Balance of County 590,530 594,216 0.6
San Benito 60,841 62,296 2.4
Hollister 39,089 40,149 2.7
San Juan Bautista 1,986 2,081 4.8
Balance of County 19,766 20,066 1.5
San Bernardino 2,171,517 2,192,203 1.0
Adelanto 35,162 35,136 -0.1
Apple Valley 72,891 73,464 0.8
Barstow 24,075 24,150 0.3
Big Bear Lake 5,427 5,461 0.6
Chino 87,574 89,829 2.6
Chino Hills 83,379 84,364 1.2
Colton 54,061 54,391 0.6
Fontana 209,455 212,078 1.3
Grand Terrace 12,570 12,654 0.7
Hesperia 95,127 96,362 1.3
Highland 55,326 55,778 0.8
Loma Linda 24,006 24,335 1.4
Montclair 39,220 39,563 0.9
Needles 5,067 5,085 0.4
Ontario 174,244 178,268 2.3
Rancho Cucamonga 178,619 179,412 0.4
Redlands 71,441 71,839 0.6
Rialto 106,582 107,271 0.6

San Bernardino 218,992 219,233 0.1
Twentynine Palms 27,247 28,958 6.3
Upland 78,027 78,481 0.6
Victorville 125,782 126,543 0.6
Yucaipa 54,293 54,844 1.0
Yucca Valley 21,905 22,050 0.7
Balance of County 311,045 312,654 0.5
San Diego 3,333,128 3,351,786 0.6
Carlsbad 115,095 115,241 0.1
Chula Vista 268,060 271,411 1.3
Coronado 21,708 24,199 11.5
Del Mar 4,442 4,451 0.2
El Cajon 105,258 105,559 0.3
Encinitas 63,375 63,390 0.0
Escondido 152,478 152,739 0.2
Imperial Beach 27,202 27,448 0.9
La Mesa 60,707 60,820 0.2
Lemon Grove 27,068 27,208 0.5
National City 62,268 62,307 0.1
Oceanside 177,274 178,021 0.4
Poway 50,210 50,320 0.2
San Diego 1,414,373 1,420,572 0.4
San Marcos 96,335 98,369 2.1
Santee 57,410 58,408 1.7
Solana Beach 13,895 13,933 0.3
Vista 101,770 101,987 0.2
Balance of County 514,200 515,403 0.2
San Francisco 880,980 883,869 0.3
San Joaquin 757,279 770,385 1.7
Escalon 7,725 7,765 0.5
Lathrop 23,711 24,936 5.2
Lodi 67,042 68,272 1.8
Manteca 81,022 83,781 3.4
Ripon 16,290 16,613 2.0
Stockton 313,822 316,410 0.8
Tracy 90,832 92,800 2.2
Balance of County 156,835 159,808 1.9
San Luis Obispo 280,048 280,393 0.1
Arroyo Grande 17,880 17,876 0.0
Atascadero 30,353 30,405 0.2
El Paso de Robles 31,204 31,244 0.1
Grover Beach 13,617 13,533 -0.6
Morro Bay 10,498 10,439 -0.6
Pismo Beach 8,251 8,239 -0.1
San Luis Obispo 46,741 46,802 0.1

Balance of County 121,504 121,855 0.3
San Mateo 772,372 774,485 0.3
Atherton 7,042 7,070 0.4
Belmont 27,182 27,174 0.0
Brisbane 4,689 4,691 0.0
Burlingame 30,345 30,317 -0.1
Colma 1,487 1,512 1.7
Daly City 108,927 109,122 0.2
East Palo Alto 30,478 30,499 0.1
Foster City 33,094 33,693 1.8
Half Moon Bay 12,558 12,631 0.6
Hillsborough 11,748 11,769 0.2
Menlo Park 35,802 35,790 0.0
Millbrae 23,168 23,154 -0.1
Pacifica 38,718 38,674 -0.1
Portola Valley 4,657 4,659 0.0
Redwood City 84,444 85,319 1.0
San Bruno 45,255 45,257 0.0
San Carlos 29,832 29,864 0.1
San Mateo 104,497 104,570 0.1
South San Francisco 67,054 67,078 0.0
Woodside 5,628 5,615 -0.2
Balance of County 65,767 66,027 0.4
Santa Barbara 452,747 454,593 0.4
Buellton 5,315 5,453 2.6
Carpinteria 13,762 13,680 -0.6
Goleta 32,179 32,759 1.8
Guadalupe 7,640 7,839 2.6
Lompoc 43,534 43,649 0.3
Santa Barbara 93,299 93,532 0.2
Santa Maria 106,645 107,356 0.7
Solvang 5,849 5,822 -0.5
Balance of County 144,524 144,503 0.0
Santa Clara 1,947,798 1,954,286 0.3
Campbell 42,767 43,250 1.1
Cupertino 59,988 59,879 -0.2
Gilroy 55,252 55,928 1.2
Los Altos 31,225 31,190 -0.1
Los Altos Hills 8,720 8,785 0.7
Los Gatos 30,995 30,988 0.0
Milpitas 74,980 76,231 1.7
Monte Sereno 3,657 3,787 3.6
Morgan Hill 44,653 45,742 2.4
Mountain View 80,800 81,992 1.5
Palo Alto 69,395 69,397 0.0
San Jose 1,042,900 1,043,058 0.0

Santa Clara 128,789 128,717 -0.1
Saratoga 31,397 31,407 0.0
Sunnyvale 153,944 155,567 1.1
Balance of County 88,336 88,368 0.0
Santa Cruz 276,071 274,871 -0.4
Capitola 10,317 10,240 -0.7
Santa Cruz 65,784 65,807 0.0
Scotts Valley 12,162 12,082 -0.7
Watsonville 53,246 53,021 -0.4
Balance of County 134,562 133,721 -0.6
Shasta 178,926 178,773 -0.1
Anderson 10,327 10,431 1.0
Redding 91,958 92,839 1.0
Shasta Lake 10,121 10,275 1.5
Balance of County 66,520 65,228 -1.9
Sierra 3,220 3,213 -0.2
Loyalton 746 744 -0.3
Balance of County 2,474 2,469 -0.2
Siskiyou 44,605 44,584 0.0
Dorris 903 903 0.0
Dunsmuir 1,584 1,581 -0.2
Etna 721 720 -0.1
Fort Jones 693 692 -0.1
Montague 1,423 1,420 -0.2
Mount Shasta 3,287 3,283 -0.1
Tulelake 1,007 1,003 -0.4
Weed 2,764 2,793 1.0
Yreka 7,662 7,659 0.0
Balance of County 24,561 24,530 -0.1
Solano 439,102 441,307 0.5
Benicia 27,641 27,570 -0.3
Dixon 19,533 19,794 1.3
Fairfield 115,966 117,149 1.0
Rio Vista 9,083 9,416 3.7
Suisun City 29,448 29,447 0.0
Vacaville 98,226 98,807 0.6
Vallejo 119,637 119,544 -0.1
Balance of County 19,568 19,580 0.1
Sonoma 502,866 500,675 -0.4
Cloverdale 9,141 9,257 1.3
Cotati 7,739 7,919 2.3
Healdsburg 12,232 12,501 2.2
Petaluma 62,251 62,247 0.0

Rohnert Park 43,178 43,339 0.4
Santa Rosa 177,017 175,625 -0.8
Sebastopol 7,808 7,885 1.0
Sonoma 11,423 11,556 1.2
Windsor 28,356 28,565 0.7
Balance of County 143,721 141,781 -1.3
Stanislaus 554,108 558,972 0.9
Ceres 49,179 49,510 0.7
Hughson 7,954 8,017 0.8
Modesto 213,374 215,201 0.9
Newman 11,497 11,738 2.1
Oakdale 23,413 23,807 1.7
Patterson 23,414 23,764 1.5
Riverbank 25,038 25,318 1.1
Turlock 73,979 74,471 0.7
Waterford 9,051 9,100 0.5
Balance of County 117,209 118,046 0.7
Sutter 97,210 97,490 0.3
Live Oak 8,799 8,840 0.5
Yuba City 67,354 67,536 0.3
Balance of County 21,057 21,114 0.3
Tehama 64,103 64,387 0.4
Corning 7,561 7,590 0.4
Red Bluff 14,187 14,250 0.4
Tehama 410 411 0.2
Balance of County 41,945 42,136 0.5
Trinity 13,650 13,688 0.3
Tulare 475,346 479,112 0.8
Dinuba 24,918 25,328 1.6
Exeter 10,984 11,002 0.2
Farmersville 11,341 11,358 0.1
Lindsay 13,062 13,358 2.3
Porterville 60,241 60,260 0.0
Tulare 65,503 66,967 2.2
Visalia 136,403 138,207 1.3
Woodlake 7,793 7,891 1.3
Balance of County 145,101 144,741 -0.2
Tuolumne 54,721 54,590 -0.2
Sonora 4,887 4,877 -0.2
Balance of County 49,834 49,713 -0.2
Ventura 857,415 856,598 -0.1
Camarillo 68,452 69,880 2.1

Fillmore 15,840 15,925 0.5
Moorpark 36,828 37,020 0.5
Ojai 7,741 7,769 0.4
Oxnard 209,269 209,879 0.3
Port Hueneme 23,370 23,526 0.7
San Buenaventura 110,125 108,170 -1.8
Santa Paula 30,931 30,779 -0.5
Simi Valley 127,421 127,716 0.2
Thousand Oaks 130,283 129,557 -0.6
Balance of County 97,155 96,377 -0.8
Yolo 221,175 222,581 0.6
Davis 68,999 69,761 1.1
West Sacramento 53,693 53,911 0.4
Winters 7,427 7,417 -0.1
Woodland 60,178 60,292 0.2
Balance of County 30,878 31,200 1.0
Yuba 77,202 77,916 0.9
Marysville 12,581 12,627 0.4
Wheatland 3,692 3,703 0.3
Balance of County 60,929 61,586 1.1
Department of Finance
Demographic Research Unit
Phone: (916) 323-4086
For more information: http://www.dof.ca.gov/research/demographic/reports/estimates/e-1/view.php
Released on May 1, 2019