2020 IEEE Aerospace Conference Data Mules on Cycler Orbits ... · 2020 IEEE Aerospace Conference...
19
2020 IEEE Aerospace Conference Data Mules on Cycler Orbits for High-Latency, Planetary-Scale Data Transfers Marc Sanchez-Net Etienne Pellegrini Joshua Vander Hook © 2020. California Institute of Technology. Government sponsorship acknowledged. This document has been reviewed and determined not to contain export controlled technical data. CL#20-1298
Transcript of 2020 IEEE Aerospace Conference Data Mules on Cycler Orbits ... · 2020 IEEE Aerospace Conference...
2020 IEEE Aerospace Conference
Data Mules on Cycler Orbits for High-Latency, Planetary-Scale Data Transfers
Marc Sanchez-NetEtienne PellegriniJoshua Vander Hook
© 2020. California Institute of Technology. Government sponsorship acknowledged. This document has been reviewed and determined not to contain export controlled technical data. CL#20-1298
jpl.nasa.gov
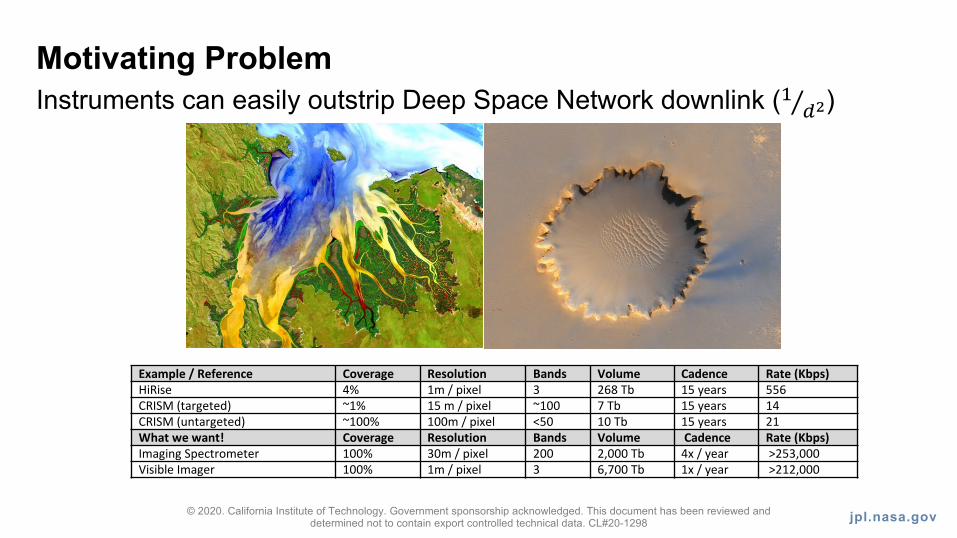
Motivating ProblemInstruments can easily outstrip Deep Space Network downlink ( ⁄" #$)
© 2020. California Institute of Technology. Government sponsorship acknowledged. This document has been reviewed and determined not to contain export controlled technical data. CL#20-1298
Example / Reference Coverage Resolution Bands Volume Cadence Rate (Kbps)HiRise 4% 1m / pixel 3 268 Tb 15 years 556 CRISM (targeted) ~1% 15 m / pixel ~100 7 Tb 15 years 14CRISM (untargeted) ~100% 100m / pixel <50 10 Tb 15 years 21What we want! Coverage Resolution Bands Volume Cadence Rate (Kbps)Imaging Spectrometer 100% 30m / pixel 200 2,000 Tb 4x / year >253,000 Visible Imager 100% 1m / pixel 3 6,700 Tb 1x / year >212,000
jpl.nasa.gov
Motivating Problem
• DSN will be improving to 100s Mbps between Mars and Earth. But those data rates
(theoretically) scale up as you get closer. • Storage capacities have exploded in capacity (and density)
• One commercial hard drive can hold 8 years of annual, global, Landsat-like surveys of Mars or
Titan. (20 channels, 16bits/ch, 50m/pix, 1.4x10&' m) , = 17.9 terabits)
• If you can get close enough to get data fast, and store enough of it, and get it back to
Earth fast enough, you can beat DSN … once• What we need is a recurring data mule network
• This is the end of the creativity
© 2020. California Institute of Technology. Government sponsorship acknowledged. This document has been reviewed and
determined not to contain export controlled technical data. CL#20-1298
“Never underestimate the bandwidth of a station wagon full of tapes hurtling
down the highway.” – Andrew Tanenbaum Computer Networks, 3rd ed., p. 83
jpl.nasa.gov
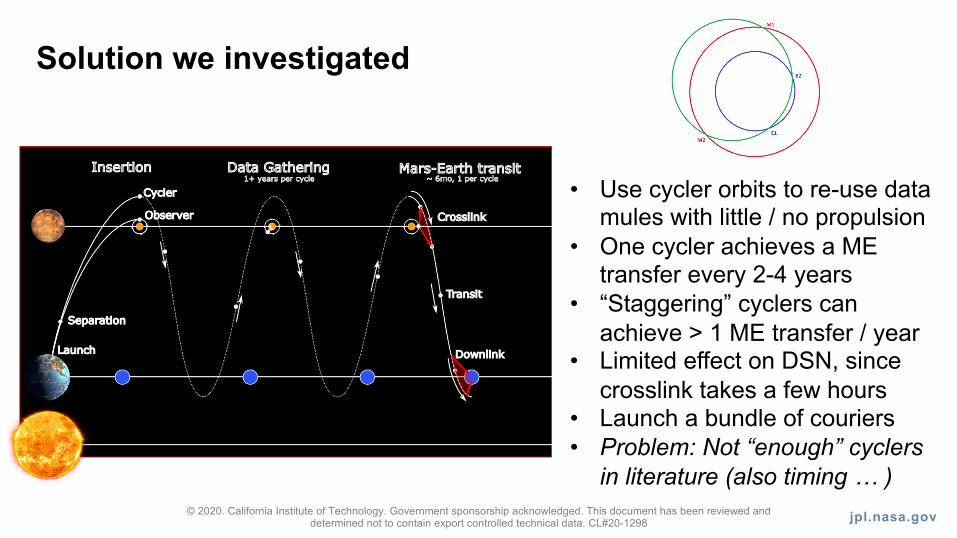
Solution we investigated
© 2020. California Institute of Technology. Government sponsorship acknowledged. This document has been reviewed and determined not to contain export controlled technical data. CL#20-1298
• Use cycler orbits to re-use data mules with little / no propulsion
• One cycler achieves a ME transfer every 2-4 years
• “Staggering” cyclers can achieve > 1 ME transfer / year
• Limited effect on DSN, since crosslink takes a few hours
• Launch a bundle of couriers• Problem: Not “enough” cyclers
in literature (also timing … )
jpl.nasa.gov
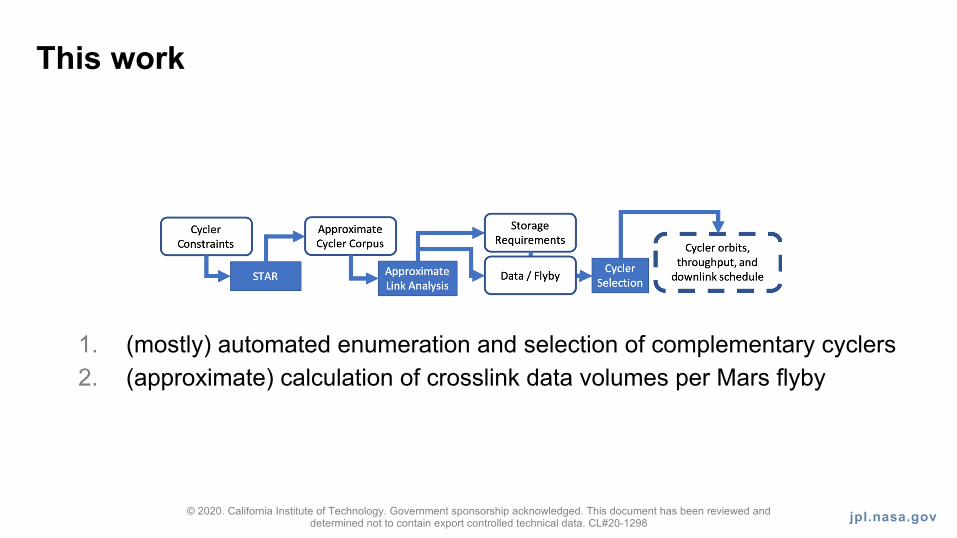
This work
1. (mostly) automated enumeration and selection of complementary cyclers2. (approximate) calculation of crosslink data volumes per Mars flyby
© 2020. California Institute of Technology. Government sponsorship acknowledged. This document has been reviewed and determined not to contain export controlled technical data. CL#20-1298
jpl.nasa.gov
Cycler Generation
© 2020. California Institute of Technology. Government sponsorship acknowledged. This document has been reviewed and determined not to contain export controlled technical data. CL#20-1298
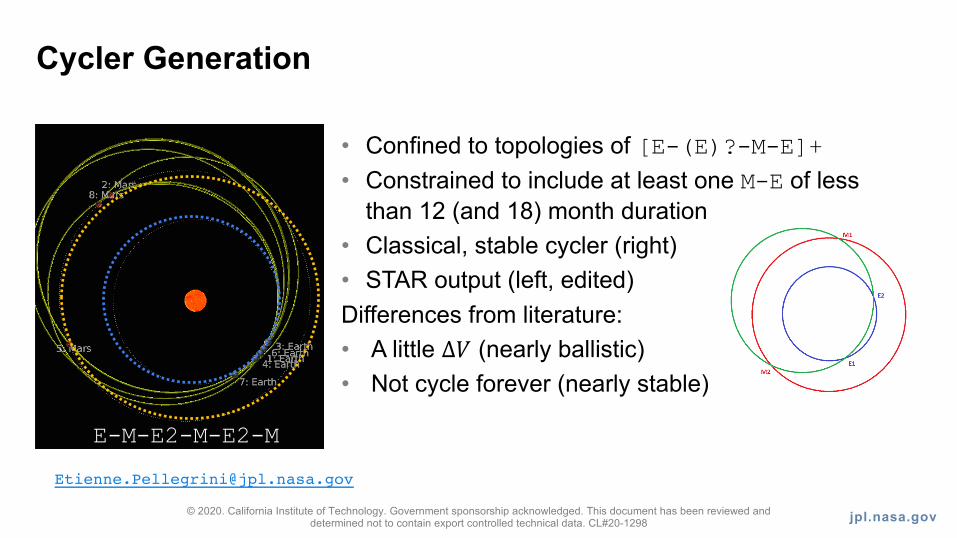
• Confined to topologies of [E-(E)?-M-E]+• Constrained to include at least one M-E of less
than 12 (and 18) month duration• Classical, stable cycler (right)• STAR output (left, edited)Differences from literature:• A little Δ" (nearly ballistic)• Not cycle forever (nearly stable)
E-M-E2-M-E2-M
jpl.nasa.gov
Cycler Generation
© 2020. California Institute of Technology. Government sponsorship acknowledged. This document has been reviewed and determined not to contain export controlled technical data. CL#20-1298
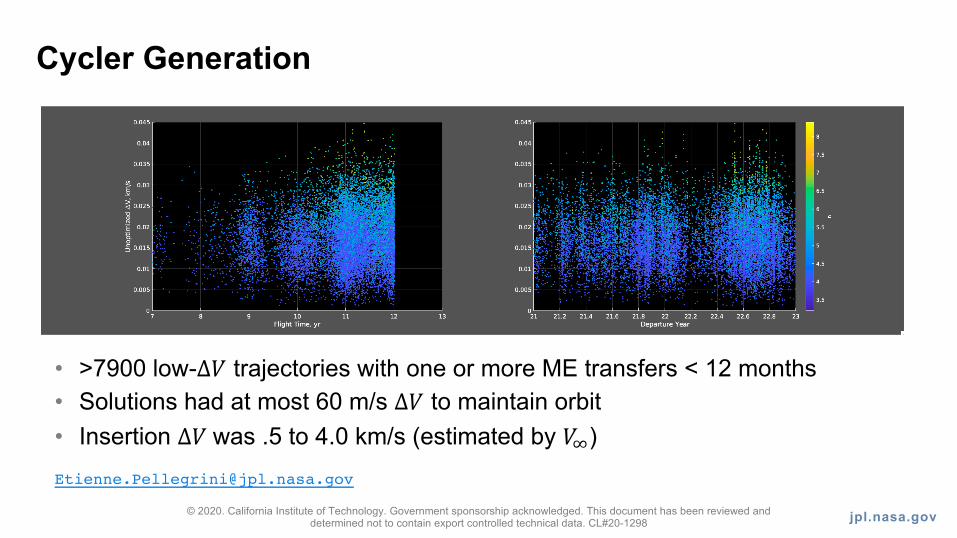
• >7900 low-Δ" trajectories with one or more ME transfers < 12 months• Solutions had at most 60 m/s Δ" to maintain orbit• Insertion Δ" was .5 to 4.0 km/s (estimated by "#)
jpl.nasa.gov
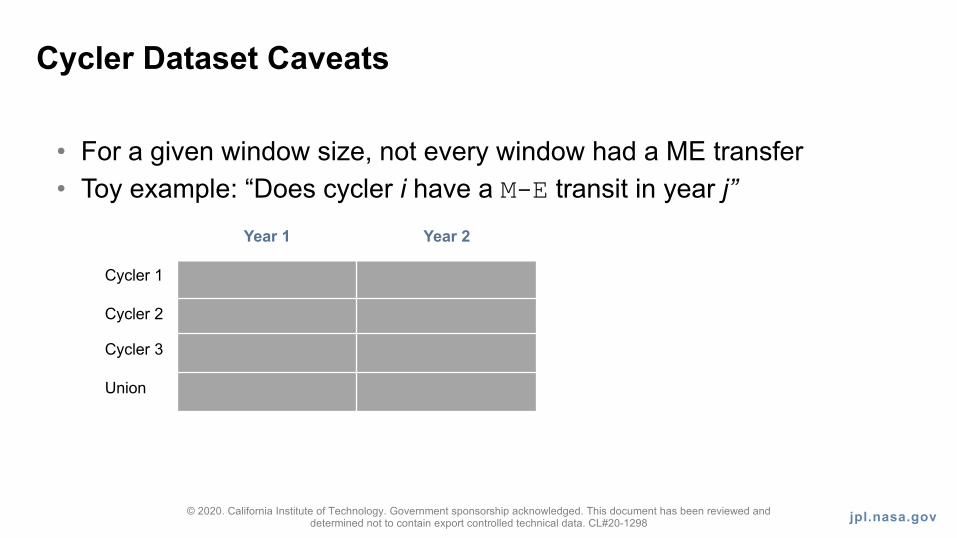
Cycler Dataset Caveats
• For a given window size, not every window had a ME transfer• Toy example: “Does cycler i have a M-E transit in year j”
© 2020. California Institute of Technology. Government sponsorship acknowledged. This document has been reviewed and determined not to contain export controlled technical data. CL#20-1298
Year 1 Year 2
Cycler 1
Cycler 2
Cycler 3
Union
jpl.nasa.gov
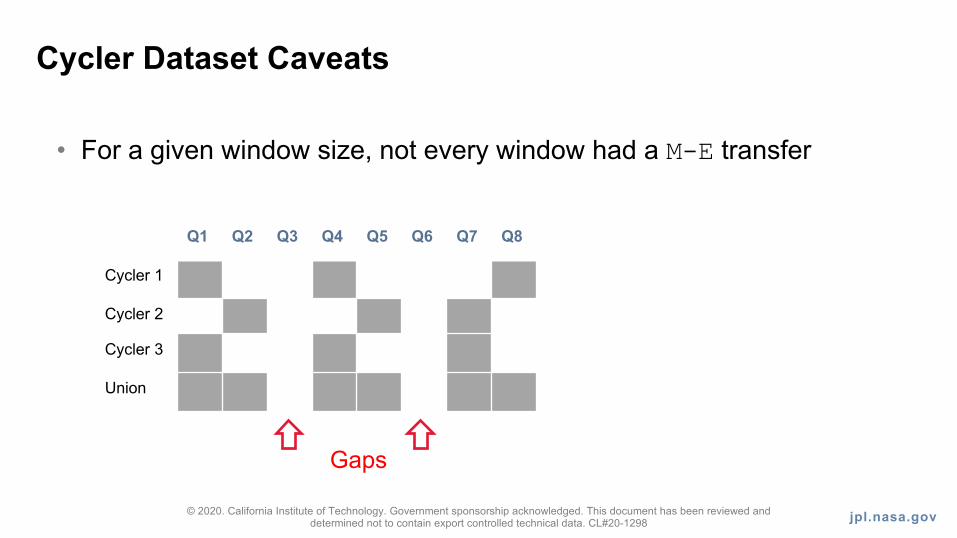
Cycler Dataset Caveats
• For a given window size, not every window had a M-E transfer
© 2020. California Institute of Technology. Government sponsorship acknowledged. This document has been reviewed and determined not to contain export controlled technical data. CL#20-1298
Q1 Q2 Q3 Q4 Q5 Q6 Q7 Q8
Cycler 1
Cycler 2
Cycler 3
Union
Gaps
jpl.nasa.gov
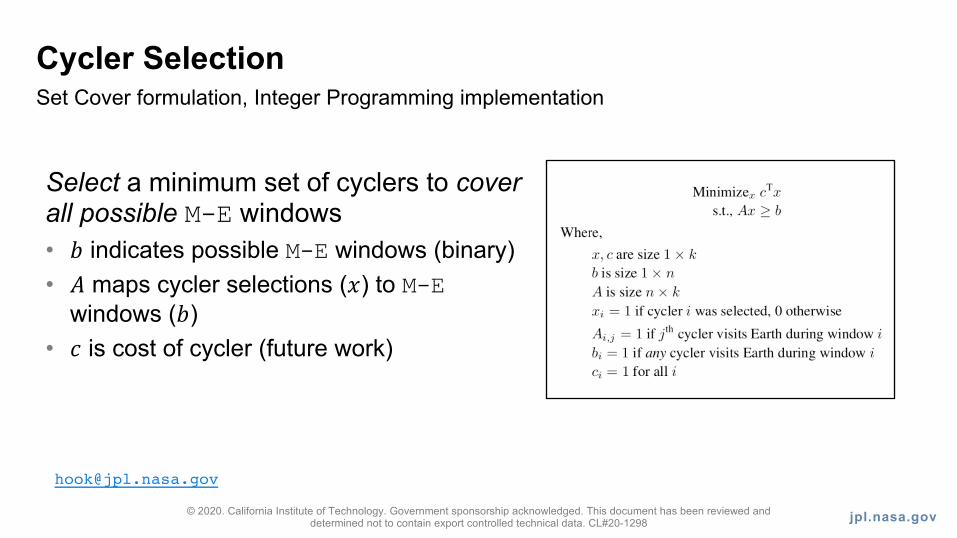
Cycler SelectionSet Cover formulation, Integer Programming implementation
Select a minimum set of cyclers to coverall possible M-E windows• ! indicates possible M-E windows (binary)• " maps cycler selections (#) to M-E
windows (!)• $ is cost of cycler (future work)
© 2020. California Institute of Technology. Government sponsorship acknowledged. This document has been reviewed and determined not to contain export controlled technical data. CL#20-1298
jpl.nasa.gov
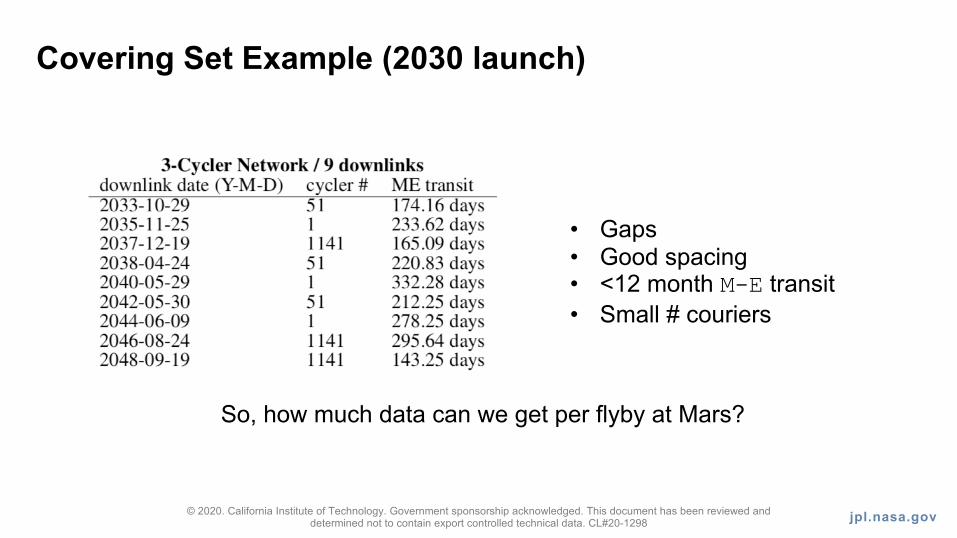
Covering Set Example (2030 launch)
© 2020. California Institute of Technology. Government sponsorship acknowledged. This document has been reviewed and determined not to contain export controlled technical data. CL#20-1298
• Gaps• Good spacing • <12 month M-E transit• Small # couriers
So, how much data can we get per flyby at Mars?
jpl.nasa.gov
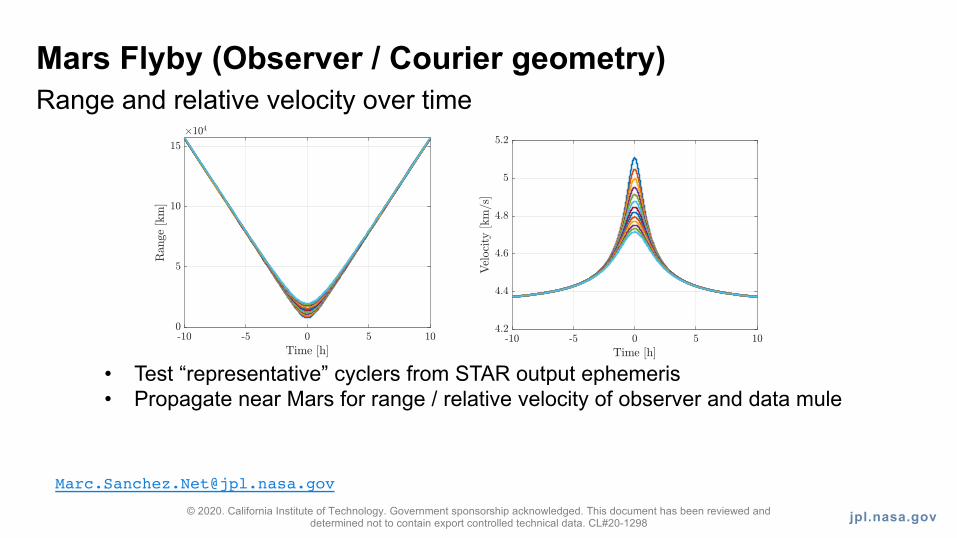
Mars Flyby (Observer / Courier geometry)Range and relative velocity over time
© 2020. California Institute of Technology. Government sponsorship acknowledged. This document has been reviewed and determined not to contain export controlled technical data. CL#20-1298
• Test “representative” cyclers from STAR output ephemeris• Propagate near Mars for range / relative velocity of observer and data mule

jpl.nasa.gov
Mars Flyby (Observer / Courier geometry)Range and relative velocity over time
© 2020. California Institute of Technology. Government sponsorship acknowledged. This document has been reviewed and determined not to contain export controlled technical data. CL#20-1298
• Test “representative” cyclers from STAR output ephemeris• Propagate near Mars for range / relative velocity of observer and data mule• Assume 2.5 hours of transmission*
• (*fairly restrictive assumption)
jpl.nasa.gov
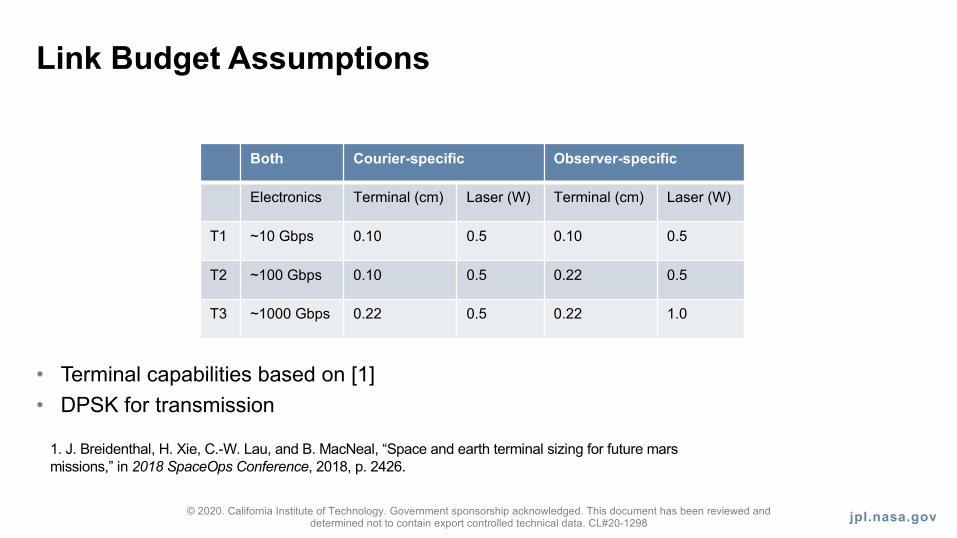
Link Budget Assumptions
© 2020. California Institute of Technology. Government sponsorship acknowledged. This document has been reviewed and determined not to contain export controlled technical data. CL#20-1298
• Terminal capabilities based on [1]• DPSK for transmission
1. J. Breidenthal, H. Xie, C.-W. Lau, and B. MacNeal, “Space and earth terminal sizing for future mars missions,” in 2018 SpaceOps Conference, 2018, p. 2426.
Both Courier-specific Observer-specific
Electronics Terminal (cm) Laser (W) Terminal (cm) Laser (W)
T1 ~10 Gbps 0.10 0.5 0.10 0.5
T2 ~100 Gbps 0.10 0.5 0.22 0.5
T3 ~1000 Gbps 0.22 0.5 0.22 1.0
jpl.nasa.gov
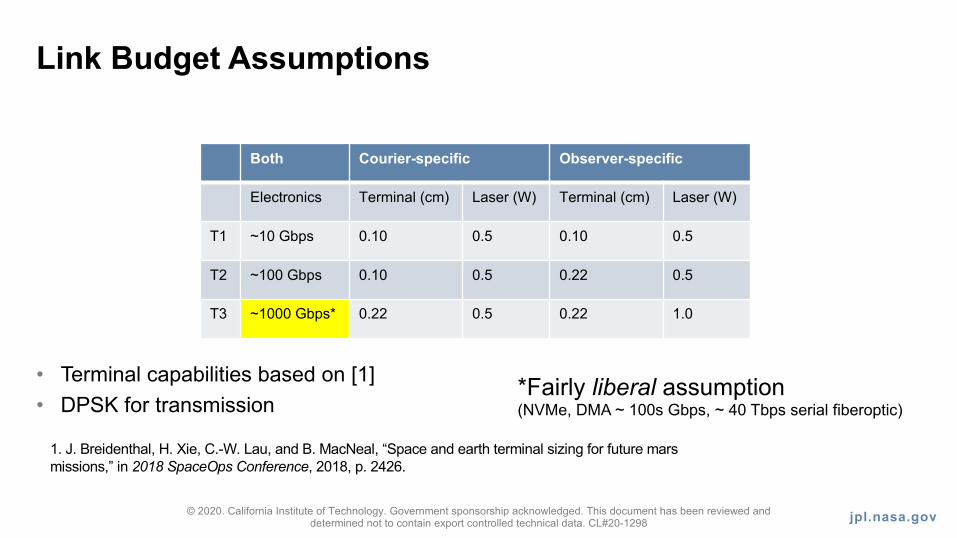
Link Budget Assumptions
© 2020. California Institute of Technology. Government sponsorship acknowledged. This document has been reviewed and determined not to contain export controlled technical data. CL#20-1298
• Terminal capabilities based on [1]• DPSK for transmission
1. J. Breidenthal, H. Xie, C.-W. Lau, and B. MacNeal, “Space and earth terminal sizing for future mars missions,” in 2018 SpaceOps Conference, 2018, p. 2426.
Both Courier-specific Observer-specific
Electronics Terminal (cm) Laser (W) Terminal (cm) Laser (W)
T1 ~10 Gbps 0.10 0.5 0.10 0.5
T2 ~100 Gbps 0.10 0.5 0.22 0.5
T3 ~1000 Gbps* 0.22 0.5 0.22 1.0
*Fairly liberal assumption (NVMe, DMA ~ 100s Gbps, ~ 40 Tbps serial fiberoptic)
jpl.nasa.gov
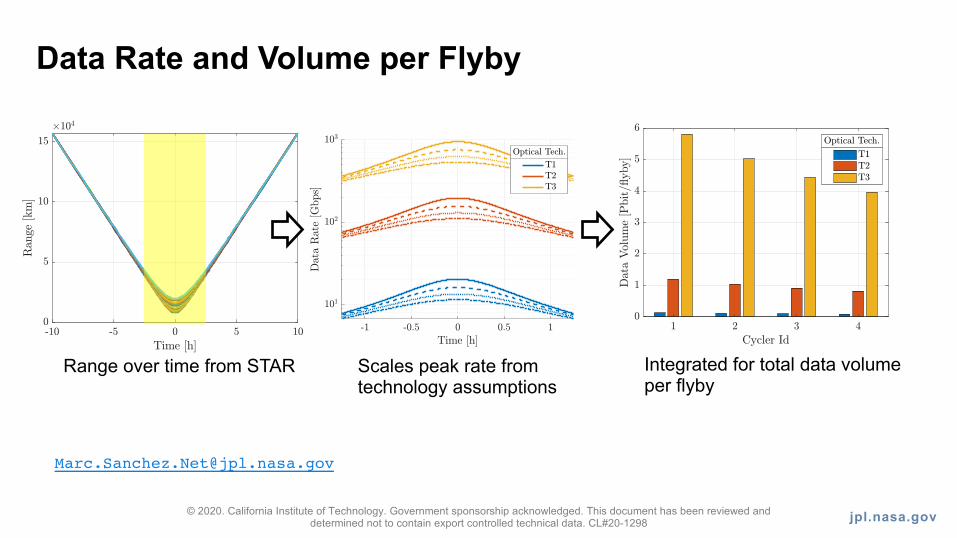
Data Rate and Volume per Flyby
© 2020. California Institute of Technology. Government sponsorship acknowledged. This document has been reviewed and determined not to contain export controlled technical data. CL#20-1298
Range over time from STAR Scales peak rate from technology assumptions
Integrated for total data volume per flyby
jpl.nasa.gov
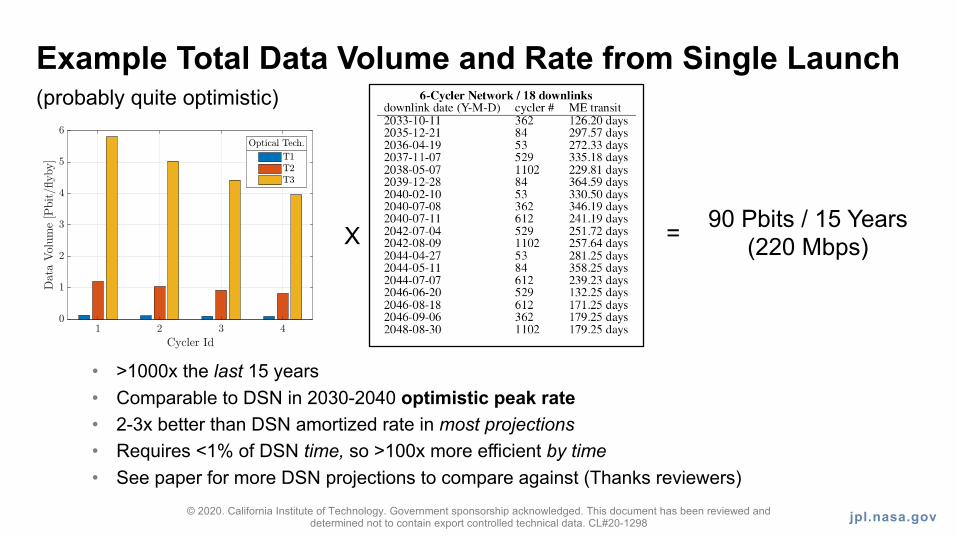
Example Total Data Volume and Rate from Single Launch(probably quite optimistic)
© 2020. California Institute of Technology. Government sponsorship acknowledged. This document has been reviewed and determined not to contain export controlled technical data. CL#20-1298
• >1000x the last 15 years• Comparable to DSN in 2030-2040 optimistic peak rate• 2-3x better than DSN amortized rate in most projections• Requires <1% of DSN time, so >100x more efficient by time• See paper for more DSN projections to compare against (Thanks reviewers)
90 Pbits / 15 Years(220 Mbps)X =
jpl.nasa.gov
Work to do
• Reduce data rate w/ longer comms window• Expand to Venus (should be better)• Trajectories instead of patched conics• Insertion for 6+ couriers to 6+ cycler orbits
from single launch (Very Hard?)• Size, Weight, Power (ESPA~= 6x180kg)
© 2020. California Institute of Technology. Government sponsorship acknowledged. This document has been reviewed and determined not to contain export controlled technical data. CL#20-1298
jpl.nasa.gov