
2020 FINANCIAL REPORT - pdx.edu
86
FINANCIAL REPORT 2020
Transcript of 2020 FINANCIAL REPORT - pdx.edu

FINANCIAL REPORT2020

E XECUTIVE OFFICERSBOARD OF TRUSTEES
Gregory Hinckley, Chair
Margaret D. Kirkpatrick, Vice-Chair
Benjamin Berry
Emily Chow
Sho Dozono
Thomas J. Imeson
Yves Labissiere
Irving Levin
Pete Nickerson
Judith Ramaley
Lisa Sablan
Peter W. Stott
Wally Van Valkenburg
Christine Vernier
Stephen Percy, Non-voting member
Stephen Percy President
Susan Jeffords Provost & Vice President, Academic Affairs
Ame Lambert Vice President, Global Diversity & Inclusion
Kirk Kelly Chief Information Officer
Chuck Knepfle Vice President, Enrollment Management
Jason Podrabsky Interim Vice President, Research
Kevin Reynolds Vice President, Finance & Administration
Cindy Starke General Counsel & Secretary to the Board of Trustees

TABLE OF CONTENTS
Vision, Mission, Values and Strategic Goals 3
Message from the Interim President 5
2019 Campus Highlights 6
Independent Auditors’ Report 7
Management’s Discussion and Analysis 9
Statements of Net Position 24
Statements of Financial Position 25
Statements of Revenues, Expenses and Changes in Net Position 26
Statements of Activities 27
Statements of Cash Flows 28
Notes to the Financial Statements 30
Required Supplementary Information 74
The new Jordan Schnitzer Museum of Art at PSU.

2 P O R T L A N D S T A T E U N I V E R S I T Y
LOCATED ON A 50-ACRE downtown campus, Portland State University (PSU) is a nationally acclaimed leader in sustainability, community-based learning and social mobility. The University’s position in the heart of Oregon’s economic and cultural center enables students and faculty to apply scholarly theory to the real-world problems of business and community organizations.
Portland State, Oregon’s only public, urban, research university, offers more than 220 undergraduate, master’s and doctoral degree programs, as well as graduate certificates and continuing education programs. With more than 27,000 students who come from all 50 states and nearly 100 nations around the world, PSU is the state’s most diverse campus.
KNOWLEDGE THAT SERVES

2 0 2 0 A N N U A L F I N A N C I A L R E P O R T 3
VISIONPortland State University leads the way to an equitable and sustainable future through academic excellence, urban engagement, and expanding opportunity for all.
MISSION We serve and sustain a vibrant urban region through our creativity, collective knowledge, and expertise.
We are dedicated to collaborative learning, innovative research, sustainability, and community engagement.
We educate a diverse community of lifelong learners.
Our research and teaching have global impact.
VALUES We promote access, inclusion, and equity as pillars of excellence.
We commit to curiosity, collaboration, stewardship, and sustainability.
We strive for excellence and innovation that solves problems.
We believe everyone should be treated with integrity and respect.
STRATEGIC GOAL SGOAL 1 Elevate student retention and success.
GOAL 2 Innovate our student recruitment.
GOAL 3 Advance excellence in research.
GOAL 4 Expand our commitment to equity.
GOAL 5 Explore long-term strategies and challenges in the PSU Futures Initiative.
GOAL 6 Reach our goal in the PSU fundraising campaign.
GOAL 7 Enhance external relationships with legislators, public officials, and the public.
KNOWLEDGE THAT SERVES

4 P O R T L A N D S T A T E U N I V E R S I T Y 4 P O R T L A N D S T A T E U N I V E R S I T Y

2 0 2 0 A N N U A L F I N A N C I A L R E P O R T 5
A YEAR LIKE NO OTHER Fiscal year 2019-2020 began with our continued focus on student success and ended with a pandemic. In between, PSU made progress in several key areas while keeping our students and campus community healthy and engaged with their learning.
This year, the Board of Trustees also asked me to change my status from interim to permanent president. I am honored to take on this challenge and look forward to working with the entire PSU community to prepare our students for a rapidly changing world.
Focused on our number one priority - student success - Provost Susan Jeffords continued our work from last year to improve student retention, quality learning and graduation rates. Working groups for Persistence, Academic Success, Affordability, and Student Experience have accelerated their pace and begin to show positive outcomes. This work continued through the year and involved faculty, students, and staff.
As the year continued, there were other achievements to be proud of:
The 20-month renovation of Neuberger Hall was completed, and the building opened for business under a new name — Fariborz Maseeh Hall. Home to administrative support units, as well as English, World Languages, the School of Art and Design studio classrooms, the Jordan Schnitzer Museum of Art at PSU, and the Fariborz Maseeh Department of Mathematics + Statistics. This gorgeous “new” building is the physical manifestation of PSU’s commitment to collaborative learning and student success.
We expanded our commitment to campus safety with Safer Together. This program acknowledges the role everyone plays when it comes to keeping PSU an open, safe, and welcoming community. This comprehensive approach addresses a full range of safety issues, including digital safety, building access, and physical safety through the addition of cameras in our residence halls. New student safety ambassadors and additional Campus Public Safety officers and dispatchers were hired to provide 24/7 response to emergencies and calls for assistance. All have received enhanced instruction that include field training in PSU-specific areas such as de-escalation techniques, multicultural competency, first aid and CPR.
Then came February when conditions for higher education were changed overnight by Covid 19. PSU was an early adopter of CDC protocols and began closely monitoring Covid 19 developments by instituting daily contacts with the Multnomah County Health Department and Oregon Health Authority. The Incident Management Team, representing all sectors of campus, led our efforts to coordinate preparedness, response, communications, and contingencies in anticipation of the virus spreading to Portland. We developed specific continuity plans
for our academic units, operations, housing, and day-to-day business in case of disruptions.
The rest of the fiscal year involved a variety of disruptions. In the spring, I welcomed faculty, students, and staff to a term of unprecedented virtual teaching and learning at Portland State. For the next 10 weeks, we stayed on track with our educational and research mission while protecting the health and safety of our campus and doing our part to help curb the global pandemic. At the same time, to help alleviate the acute financial challenges we know many students were facing during these trying times, the Board of Trustees eliminated or reduced certain spring fees for services that were modified or unavailable due to the pandemic.
Additional support for our students came in the form of a new philanthropic fund to help Portland State address the multi-faceted stresses created by COVID-19: the PSU Resilience Fund. The resilience fund has already attracted $150,000 in contributions from members of the PSU Board of Trustees, PSU Foundation Board of Trustees, PSU Alumni Association Board, and by senior leaders of both PSU and the PSU Foundation.
We launched the resilience fund to complement existing student emergency funds that provide direct hardship grants to students. We used the first resilience funds to help bolster academic continuity. Before the beginning of the term, the university purchased 200 computers for use by students and staff to ease the transition to virtual instruction.
But Resilience is more than an adjective that describes a philanthropic effort, resilience is in PSU’s DNA. In the face of a pandemic, calls for social equity, climate change, or any other challenge, PSU is committed to keeping our instruction and core services moving forward. It is that commitment to and love for PSU that will sustain us for now and renew us soon.
Sincerely,
Stephen Percy President, Portland State University
MESSAGE FROM THE PRESIDENT

1. The 4th and Montgomery building, a $104 million dollar col-laboration between PSU, PCC, OHSU, and the City of Portland is on schedule to open in October, 2020. The 3/4 block site housing the “L-shaped”, seven-story, 174,500 GSF building, is bound by public transit on four sides, and will contain a variety of uses including ground level retail, classrooms, a dental clinic, academic and non-academic offices. With mul-tiple users joining together in one building, key partners can share resources and become greater than the sum of their parts—enhancing programs and expanding their impact in our community.
2. Portland State University was recognized in two reports on collegiate excellence. For the second year in a row, U.S.News & World Report ranked PSU as the number one school in Oregon for social mobility. PSU graduates more students who receive federal Pell Grants than any other school in the state. PSU was also acknowledged in Princeton Review’s list of the 127 best western colleges and as one of the 385 best colleges (out of over 4,000 in the nation).
3. The National Institutes of Health has awarded an additional $19.3 million grant to continue and expand the successful Building Infrastructure Leading to Diversity for Enhancing Cross Disciplinary Infrastructure and Training at Oregon (BUILD EXITO) program that helps students from socioeco-nomically disadvantaged backgrounds become top-level health sciences researchers. The program started with a $23.7 million grant from NIH to PSU five years ago. The new grant will fund BUILD EXITO for another five years, by which time PSU hopes to make the program self-sustaining.
4. After nearly two years and $70 million worth of renovations, the building formerly known as Neuberger Hall re-opened its doors as the newly named Fariborz Maseeh Hall. The brighter, more open building is now a vibrant center for student suc-cess, interdisciplinary learning and cultural outreach. Maseeh
Hall is home to English, World Languages, the School of Art and Design and studio classrooms, as well as the Fariborz Maseeh Department of Mathematics and Statistics.
5. Graduates of PSU’s College of Education were named both Oregon Teacher of the Year, and National Superintendent of the year. Mercedes Muñoz was named the 2020 Oregon Teacher of the Year. Muñoz, a first-generation college gradu-ate, is a Learning Center teacher and special education case manager at Franklin High School in Portland. Gustavo Bal-deras, has won National Superintendent of the Year. Balderas, a 2001 graduate of PSU’s Master in Curriculum and Instruction program, is only the third Oregon superintendent to receive this distinction.
6. Long-time Portland State advocates Christine and David Vernier—founders of Vernier Software & Technology, an Or-egon company providing scientific hardware and software for education—have made a $4.5 million pledge to PSU. The gift will help renovate the university’s 53-year-old undergraduate science building to provide flexible classrooms,state-of-the-art laboratories, and collaborative research and teaching spaces. To acknowledge the Venier’s generosity, PSU plans to name the renovated Science Building One in their honor: the Vernier Science Center.
7. The new Jordan Schnitzer Museum of Art opened to the public after a series of events showcasing the impressive array of fine art from the renowned Schnitzer collection and a showcase of pieces from PSU students and others. The gal-lery inside the renovated Fariborz Maseeh Hall occupies more than 7,500 square feet on two floors. It offers rich educational and collaborative opportunities and free art experiences to PSU and the public. Its galleries will feature art by Northwest artists, faculty and students as well as exhibitions by national and international artists.
6 P O R T L A N D S T A T E U N I V E R S I T Y
HIGHLIGHTS2020 CAMPUS

2 0 2 0 A N N U A L F I N A N C I A L R E P O R T 7
INDEPENDENT AUDITORS' REPORT
Members of the Board
Report on the Financial Statements We have audited the accompanying financial statements of the business-type activities and the discretely presented component unit of Portland State University (the University), a component unit of the State of Oregon, as of and for the years ended June 30, 2020 and 2019, and the related notes to the financial statements, which collectively comprise the entity’s basic financial statements as listed in the table of contents.
Management’s Responsibility for the Financial Statements Management is responsible for the preparation and fair presentation of these financial statements in accordance with accounting principles generally accepted in the United States of America; this includes the design, implementation, and maintenance of internal control relevant to the preparation and fair presentation of financial statements that are free from material misstatement, whether due to fraud or error.
Auditors’ Responsibility Our responsibility is to express opinions on these financial statements based on our audits. We did not audit the 2020 and 2019 financial statements of the discretely presented component unit, the Portland State University Foundation (the Foundation) which represents 100% percent of the total net assets, revenues, and expenses of the component unit. Those statements were audited by other auditors whose reports have been furnished to us, and our opinion, insofar as it relates to the amounts included for the Foundation, is based solely on the reports of the other auditors. We conducted our audit in accordance with auditing standards generally accepted in the United States of America and the standards applicable to financial audits contained in Government Auditing Standards, issued by the Comptroller General of the United States. Those standards require that we plan and perform the audit to obtain reasonable assurance about whether the financial statements are free from material misstatement. The financial statements of the discretely presented component unit were not audited in accordance with Government Auditing Standards. An audit involves performing procedures to obtain audit evidence about the amounts and disclosures in the financial statements. The procedures selected depend on the auditors’ judgment, including the assessment of the risks of material misstatement of the financial statements, whether due to fraud or error. In making those risk assessments, the auditor considers internal control relevant to the entity’s preparation and fair presentation of the financial statements in order to design audit procedures that are appropriate in the circumstances, but not for the purpose of expressing an opinion on the effectiveness of the entity’s internal control. Accordingly, we express no such opinion. An audit also includes evaluating the appropriateness of accounting policies used and the reasonableness of significant accounting estimates made by management, as well as evaluating the overall presentation of the financial statements.
INDEPENDENT AUDITOR’S REPORT

8 P O R T L A N D S T A T E U N I V E R S I T Y
We believe that the audit evidence we have obtained is sufficient and appropriate to provide a basis for our audit opinions.
Opinions
In our opinion, based on our audit and the report of other auditors, the financial statements referred to above present fairly, in all material respects, the respective financial position of the business-type activities and the discretely presented component unit of the University as of June 30, 2020 and 2019, and the respective changes in financial position and, where applicable, cash flows thereof for the years then ended in accordance with accounting principles generally accepted in the United States of America.
Other Matters Required Supplementary Information Accounting principles generally accepted in the United States of America require that management’s discussion and analysis, the Schedule of University Defined Benefit Pension Employer Contributions, the Schedule of University PERS Defined Benefit Pension Proportionate Share of Net Pension Liability, the Schedule of University PERS RHIA OPEB Employer Contributions, the Schedule of University’s Proportionate Share of the Net PERS RHIA OPEB Asset, the Schedule of University PERS RHIPA OPEB Employer Contribution, the Schedule of University’s Proportionate Share of the Net PERS RHIPA OPEB Liability, and the Schedule of University’s Proportionate Share of the Total PEBB OPEB Liability, collectively referred to as required supplementary information, be presented to supplement the basic financial statements. Such information, although not a part of the basic financial statements, is required by the Governmental Accounting Standards Board who considers it to be an essential part of financial reporting for placing the basic financial statements in an appropriate operational, economic, or historical context. We have applied certain limited procedures to the required supplementary information in accordance with auditing standards generally accepted in the United States of America, which consisted of inquiries of management about the methods of preparing the information and comparing the information for consistency with management’s responses to our inquiries, the basic financial statements, and other knowledge we obtained during our audit of the basic financial statements. We do not express an opinion or provide any assurance on the information because the limited procedures do not provide us with sufficient evidence to express an opinion or provide any assurance
Other Information Our audit was conducted for the purpose of forming opinions on the financial statements that collectively comprise Portland State University’s basic financial statements. The Message from the President is presented for purposes of additional analysis and is not a required part of the basic financial statements.
The Message from the President has not been subjected to the auditing procedures applied in the audit of the basic financial statements, and accordingly, we do not express an opinion or provide any assurance on it.
INDEPENDENT AUDITOR’S REPORT

2 0 2 0 A N N U A L F I N A N C I A L R E P O R T 9
Other Reporting Required by Government Auditing Standards In accordance with Government Auditing Standards, we have also issued our report dated December 7, 2020, on our consideration of the University's internal control over financial reporting and on our tests of its compliance with certain provisions of laws, regulations, contracts, and grant agreements and other matters. The purpose of that report is solely to describe the scope of our testing of internal control over financial reporting and compliance and the results of that testing, and not to provide an opinion on the effectiveness of University’s internal control over financial reporting or on compliance. That report is an integral part of an audit performed in accordance with Government Auditing Standards in considering University’s internal control over financial reporting and compliance.
a CliftonLarsonAllen LLP Greenwood Village, Colorado December 7, 2020
INDEPENDENT AUDITOR’S REPORT
MANAGEMENT’S DISCUSSION AND ANALYSIS For the Years Ended June 30, 2020, 2019 and 2018 (dollars in millions)
1 0 P O R T L A N D S T A T E U N I V E R S I T Y
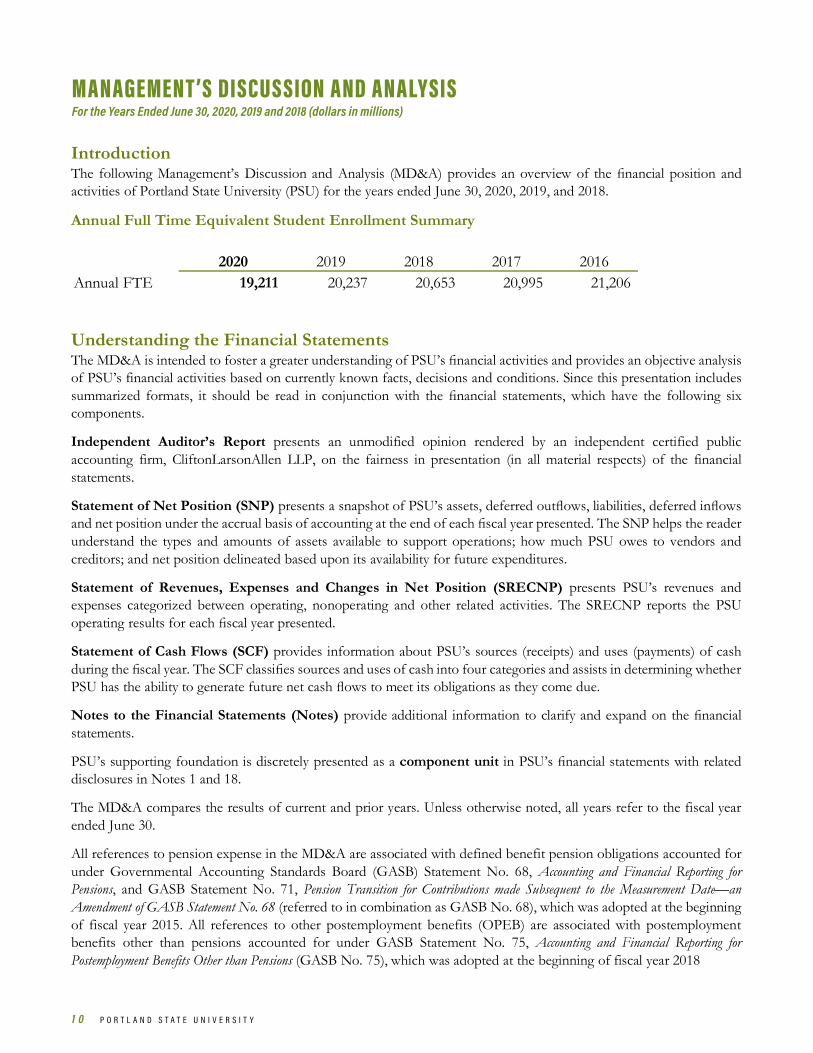
Introduction The following Management’s Discussion and Analysis (MD&A) provides an overview of the financial position and activities of Portland State University (PSU) for the years ended June 30, 2020, 2019, and 2018.
Annual Full Time Equivalent Student Enrollment Summary
Understanding the Financial Statements The MD&A is intended to foster a greater understanding of PSU’s financial activities and provides an objective analysis of PSU’s financial activities based on currently known facts, decisions and conditions. Since this presentation includes summarized formats, it should be read in conjunction with the financial statements, which have the following six components.
Independent Auditor’s Report presents an unmodified opinion rendered by an independent certified public accounting firm, CliftonLarsonAllen LLP, on the fairness in presentation (in all material respects) of the financial statements.
Statement of Net Position (SNP) presents a snapshot of PSU’s assets, deferred outflows, liabilities, deferred inflows and net position under the accrual basis of accounting at the end of each fiscal year presented. The SNP helps the reader understand the types and amounts of assets available to support operations; how much PSU owes to vendors and creditors; and net position delineated based upon its availability for future expenditures.
Statement of Revenues, Expenses and Changes in Net Position (SRECNP) presents PSU’s revenues and expenses categorized between operating, nonoperating and other related activities. The SRECNP reports the PSU operating results for each fiscal year presented.
Statement of Cash Flows (SCF) provides information about PSU’s sources (receipts) and uses (payments) of cash during the fiscal year. The SCF classifies sources and uses of cash into four categories and assists in determining whether PSU has the ability to generate future net cash flows to meet its obligations as they come due.
Notes to the Financial Statements (Notes) provide additional information to clarify and expand on the financial statements.
PSU’s supporting foundation is discretely presented as a component unit in PSU’s financial statements with related disclosures in Notes 1 and 18.
The MD&A compares the results of current and prior years. Unless otherwise noted, all years refer to the fiscal year ended June 30.
All references to pension expense in the MD&A are associated with defined benefit pension obligations accounted for under Governmental Accounting Standards Board (GASB) Statement No. 68, Accounting and Financial Reporting for Pensions, and GASB Statement No. 71, Pension Transition for Contributions made Subsequent to the Measurement Date—an Amendment of GASB Statement No. 68 (referred to in combination as GASB No. 68), which was adopted at the beginning of fiscal year 2015. All references to other postemployment benefits (OPEB) are associated with postemployment benefits other than pensions accounted for under GASB Statement No. 75, Accounting and Financial Reporting for Postemployment Benefits Other than Pensions (GASB No. 75), which was adopted at the beginning of fiscal year 2018
2020 2019 2018 2017 2016Annual FTE 19,211 20,237 20,653 20,995 21,206
MANAGEMENT’S DISCUSSION AND ANALYSIS For the Years Ended June 30, 2020, 2019 and 2018 (dollars in millions)
2 0 2 0 A N N U A L F I N A N C I A L R E P O R T 1 1
Financial Net Position Summary
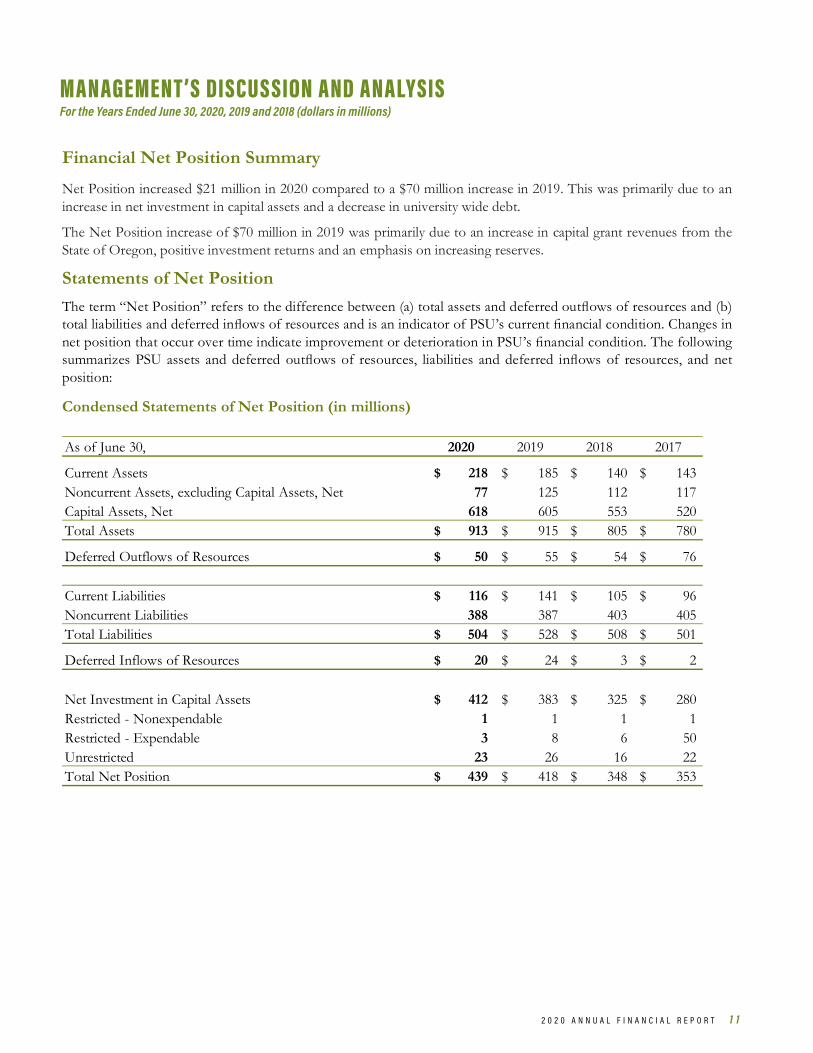
Net Position increased $21 million in 2020 compared to a $70 million increase in 2019. This was primarily due to an increase in net investment in capital assets and a decrease in university wide debt.
The Net Position increase of $70 million in 2019 was primarily due to an increase in capital grant revenues from the State of Oregon, positive investment returns and an emphasis on increasing reserves.
Statements of Net Position The term “Net Position” refers to the difference between (a) total assets and deferred outflows of resources and (b) total liabilities and deferred inflows of resources and is an indicator of PSU’s current financial condition. Changes in net position that occur over time indicate improvement or deterioration in PSU’s financial condition. The following summarizes PSU assets and deferred outflows of resources, liabilities and deferred inflows of resources, and net position:
Condensed Statements of Net Position (in millions)
As of June 30, 2020 2019 2018 2017
Current Assets 218$ 185$ 140$ 143$ Noncurrent Assets, excluding Capital Assets, Net 77 125 112 117 Capital Assets, Net 618 605 553 520 Total Assets 913$ 915$ 805$ 780$
Deferred Outflows of Resources 50$ 55$ 54$ 76$
Current Liabilities 116$ 141$ 105$ 96$ Noncurrent Liabilities 388 387 403 405 Total Liabilities 504$ 528$ 508$ 501$
Deferred Inflows of Resources 20$ 24$ 3$ 2$
Net Investment in Capital Assets 412$ 383$ 325$ 280$ Restricted - Nonexpendable 1 1 1 1 Restricted - Expendable 3 8 6 50 Unrestricted 23 26 16 22 Total Net Position 439$ 418$ 348$ 353$

MANAGEMENT’S DISCUSSION AND ANALYSIS For the Years Ended June 30, 2020, 2019 and 2018 (dollars in millions)
1 2 P O R T L A N D S T A T E U N I V E R S I T Y
The following graph presents the composition of net position at June 30, 2020, 2019, and 2018.
Total Net Position
Total Net Position increased $21 million to $439 million at June 30, 2020 and increased $70 million to $418 million at June 30, 2019. The components of Total Net Position changed as follows:
• Net Investment in Capital Assets increased $29 million during 2020 to $412 million due to capital asset additions of $41 million and repayments of long-term debt of $30 million, partially offset by $29 million of depreciation expense and newly issued debt of $14 million. Net Investment of Capital Assets increased $58 million during 2019 to $383 million due to capital asset additions of $79 million and repayments of long-term debt of $13 million, partially offset by $28 million of depreciation expense and newly issued debt of $6 million.
• Net Position Restricted for Nonexpendable Endowments was consistent from year to year.
• Restricted Expendable Net Position decreased $5 million during 2020 due to the University outspending restricted funds on capital assets faster than revenue that will be recognized in the future to recoup these costs once certain eligibility requirements have been met and lower cash balances at year end due to COVID-19. Restricted Expendable Net Position increased $1 million during 2019 due to a $676 thousand increase in the University’s Other Post Employment Benefit Assets and other small cash increases.
• Unrestricted Net Position decreased $3 million during 2020 due to covering the overspend from restricted expendable capital assets. Unrestricted Net Position increased $11 million during 2019 to $27 million primarily due to a decrease in pension expense of $9 million.
MANAGEMENT’S DISCUSSION AND ANALYSIS For the Years Ended June 30, 2020, 2019 and 2018 (dollars in millions)
2 0 2 0 A N N U A L F I N A N C I A L R E P O R T 1 3
Total Assets and Deferred Outflows
Total Assets and Deferred Ouflows decreased $7 million, or 1%, and increased $110 million, or 12%, during the years ended June 30, 2020 and 2019, respectively.
• Current Assets increased $33 million, or 15%, and increased $45 million, or 24%, during 2020 and 2019, respectively. The increase during 2020 was primarily due to an increase in cash balances due to investment sales by Public University Fund Administrator in quarter 4, partially offset by a decrease in the amount Due from the Primary Government as the Fariborz Maseeh Hall, formerly Neuberger Hall, project completed in 2020 and the anticipated completion of the Fourth and Montgomery project. The increase during 2019 was primarily due to an increase of $31 million in Cash and Cash Equivalents resulting from receiving funds in advance of payments from our joint partners in the Fourth and Montgomery Construction Project and $13 million in amounts Due from Primary Government for the same project and the Fariborz Maseeh Hall, formerly Neuberger Hall renovation.
• Noncurrent Assets, excluding Capital Assets, Net of Accumulated Depreciation, decreased $48 million during 2020 primarily due to a decrease in Investments and increased $13 million during 2019 primarily due to an increase in Investments.
• Capital Assets, Net increased $13 million and $52 million during 2020 and 2019, respectively. See “Changes to Capital Assets” in this MD&A for additional information.
• Deferred Outflows of Resources decreased $5 million during 2020 primarily due to the difference between plan experience and actuarial assumptions. Deferred Outflows of Resources remained relatively consistent during 2019 compared to 2018.
Total Liabilities and Deferred Inflows
Total Liabilities and Deferred Inflows decreased increased $28 million, or 5% and increased $40 million, or 7%, during 2020 and 2019, respectively.
• Current Liabilities decreased $25 million in 2020 and increased $36 million in 2019.
• Accounts Payable and Accrued Liabilities decreased $3 million at June 30, 2020, mainly due to a decrease in the year end wage accrual and a decrease in insurance claims. An increase of $4 million at June 30, 2019 was mainly due to an increase in payables and retainage at year end related to work on Capital Projects, specifically the Forth and Montgomery Building.
• Deposits decreased $18 million in 2020, due to the University spending funds that had previously been received in advance of payments from our partners related to the construction of the Fourth and Montgomery Building. An increase of $33 million in 2019, was due to receiving funds in advance of payments from our partners related to the construction of the Fourth and Montgomery building.
• Current Portion of Long-Term Liabilities was relatively consistent from 2019 to 2020 and 2018 to 2019.
• The current portion of Unearned Revenue was relatively consistent from 2019 to 2020 and 2018 to 2019.
MANAGEMENT’S DISCUSSION AND ANALYSIS For the Years Ended June 30, 2020, 2019 and 2018 (dollars in millions)
1 4 P O R T L A N D S T A T E U N I V E R S I T Y
• Noncurrent Liabilities decreased $28 million in 2020 and decreased $16 million in 2019.
• Net Pension Liability increased $18 million during 2020 due to an increase in the system’s overall liability and decreased $10 million during 2019 due to a decrease in the total pension liability at the plan level and a decrease in the University’s proportionate share.
• The Net Other Postemployment Liability decreased $1 million during 2020 due to a decrease in the University’s proportionate share at the measurement date and was consistent from 2018 to 2019.
• Long-Term Liabilities decreased $15 million primarily due to $32 million of payments on long term debt and other obligations and $14 million of additions from newly issued XI-Q debt and an increase of $2 million in the University’s liability of compensated absences. Long-Term Liabilities decreased $8 million due to $15 million of payments on long-term debt and other obligations and $6 million of additions from a new Loan Agreement with HECC for the construction of the Fourth and Montgomery Building.
• The non-current portion of Unearned Revenue was consistent from 2019 to 2020. In 2019, the non-current portion of Unearned Revenue increased $3 million, due to a grant from Proper Portland in support of the Gateway Project, formerly the Fourth & Lincoln project.
• Deferred Inflows of Resources decreased $4 million in 2020 due to a difference between projected and actual earnings on investments and a decrease in of University’s proportionate share of the plan’s deferred inflow balance. Deferred Inflows of Resources increased $21 million in 2019 due to a significant decrease in the University’s proportionate share creating a $15 million deferred inflow as well as plan investments performing better than actuarially projection, creating a $6 million deferred inflow.
MANAGEMENT’S DISCUSSION AND ANALYSIS For the Years Ended June 30, 2020, 2019 and 2018 (dollars in millions)
2 0 2 0 A N N U A L F I N A N C I A L R E P O R T 1 5
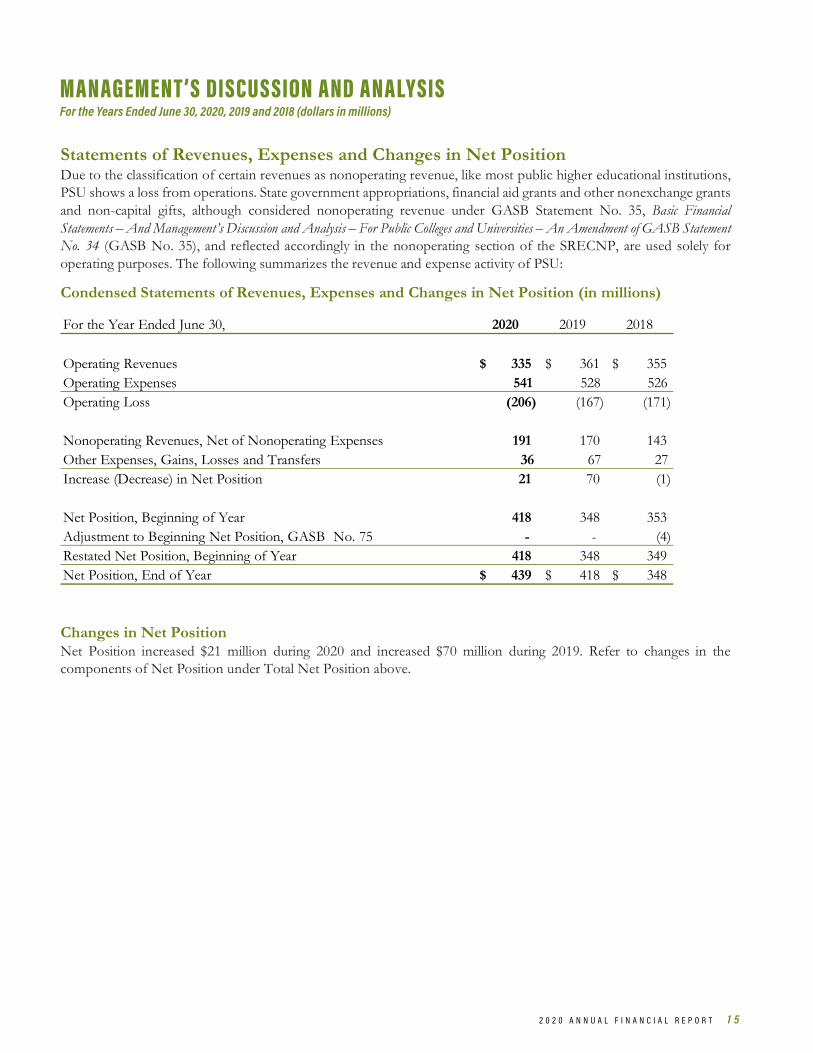
Statements of Revenues, Expenses and Changes in Net Position Due to the classification of certain revenues as nonoperating revenue, like most public higher educational institutions, PSU shows a loss from operations. State government appropriations, financial aid grants and other nonexchange grants and non-capital gifts, although considered nonoperating revenue under GASB Statement No. 35, Basic Financial Statements – And Management’s Discussion and Analysis – For Public Colleges and Universities – An Amendment of GASB Statement No. 34 (GASB No. 35), and reflected accordingly in the nonoperating section of the SRECNP, are used solely for operating purposes. The following summarizes the revenue and expense activity of PSU:
Condensed Statements of Revenues, Expenses and Changes in Net Position (in millions)
Changes in Net Position Net Position increased $21 million during 2020 and increased $70 million during 2019. Refer to changes in the components of Net Position under Total Net Position above.
For the Year Ended June 30, 2020 2019 2018
Operating Revenues 335$ 361$ 355$ Operating Expenses 541 528 526 Operating Loss (206) (167) (171)
Nonoperating Revenues, Net of Nonoperating Expenses 191 170 143 Other Expenses, Gains, Losses and Transfers 36 67 27 Increase (Decrease) in Net Position 21 70 (1)
Net Position, Beginning of Year 418 348 353 Adjustment to Beginning Net Position, GASB No. 75 - - (4)Restated Net Position, Beginning of Year 418 348 349 Net Position, End of Year 439$ 418$ 348$

MANAGEMENT’S DISCUSSION AND ANALYSIS For the Years Ended June 30, 2020, 2019 and 2018 (dollars in millions)
1 6 P O R T L A N D S T A T E U N I V E R S I T Y
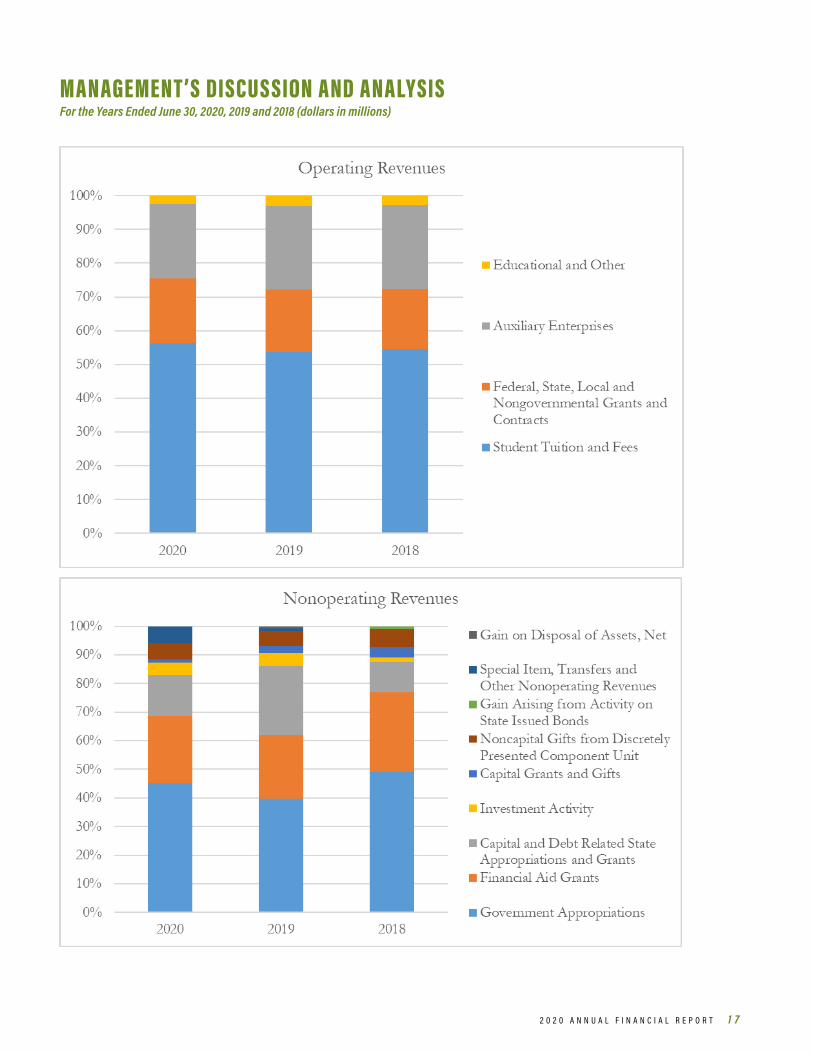
Total Operating, Nonoperating and Other Revenues (in millions)
Total Revenues decreased $36 million, or 6%, in 2020 compared to 2019 and increased $64 million, or 11%, in 2019 compared to 2018. The following graphs present the composition of Operating Revenues and Nonoperating and Other Revenues.
For the Year Ended June 30, 2020 2019 2018
Student Tuition and Fees 188$ 194$ 194$ Federal, State, Local and Nongovernmental Grants and Contracts 64 67 63 Auxiliary Enterprises 75 89 88 Educational and Other 8 11 10 Total Operating Revenues 335 361 355
Government Appropriations 106 98 94 Financial Aid Grants 55 55 53 Investment Activity 10 11 3 Gain Arising from Activity on State Issued Bonds 3 - - Noncapital Gifts from Discretely Presented Component Unit 13 13 12 Capital and Debt Related State Appropriations and Grants - 60 20 Capital Grants and Gifts 34 6 7 Gain on Disposal of Assets, Net - 2 - Special Item, Transfers and Other Nonoperating Revenues 14 2 - Total Nonoperating and Other Revenues 235 247 189
Total Revenues 570$ 608$ 544$
MANAGEMENT’S DISCUSSION AND ANALYSIS For the Years Ended June 30, 2020, 2019 and 2018 (dollars in millions)
2 0 2 0 A N N U A L F I N A N C I A L R E P O R T 1 7
MANAGEMENT’S DISCUSSION AND ANALYSIS For the Years Ended June 30, 2020, 2019 and 2018 (dollars in millions)
1 8 P O R T L A N D S T A T E U N I V E R S I T Y
Operating Revenues Operating Revenues decreased $27 million, or 8% in 2020 compared to 2019 and increased $6 million, or nearly 2% to $361 million in 2019 compared to as a result of the changes described below.
Student Tuition and Fees Revenues decreased $6 million, or 3.1%, in 2020 compared to 2019 despite tuition rate increases of 4.97% and 4.91% for resident and nonresident undergraduate students, 4.83% and 4.92% for resident and nonresident graduate students, and a 6.38% increase in mandatory fees. The decrease was primarily due to an overall decline in student credits of 5% which included 5% declines in both non-resident and resident student credit hours. Overall, the annual full-time equivalent student enrollment decreased to 19,211 in 2020 from 20,237 in 2019.
Student Tuition and Fees Revenues was relatively unchanged in 2019 compared to 2018. There was an increase in tuition rates of 3.95% and 3.64% for resident and nonresident undergraduate, 3.24% and 4.14% for resident and nonresident graduate students and a 2.17% increase in mandatory fees. However, there was an overall decline in student credit hours of 1.7%, including a 4.3% decrease in non-resident student credit hours and a 1% decrease in resident student credit hours, with annual full-time equivalent student enrollment decreasing slightly to 20,237 in 2019 from 20,653 in 2018.
Federal, State, Local and Nongovernmental Grants and Contracts Revenues decreased $3 million, or nearly 5% in 2020 compared to 2019 and increased $4 million, or 6%, in 2019 compared to 2018.
• Federal Grants and Contracts Revenues decrease $1 million in 2020 compared to 2019 due to a decrease in activity on the University’s awarded grants brought on by the COVID-19 pandemic and increased $4 million in 2019 compared to 2018 which included increased revenues from the National Institute of Health in support of an undergraduate research training program for under-represented students in the health sciences
• State and Local Grants and Contracts Revenues decreased $2 million in 2020 compared to 2019 due to a decrease in activity on the University’s awarded grants brought on by the COVID-19 pandemic and increased $1 million in 2019 as compared to 2018 due to an increase in revenue across a variety of awards.
• Nongovernmental Grants and Contracts Revenues were relatively consistent in 2020 compared to 2019 and 2019 compared to 2018.
Auxiliary Enterprises Revenues decreased $15 million in 2020 compared to 2019 due to the inability to operate at 100% for the last quarter of the fiscal year because of the COVID-19 pandemic and were relatively consistent in 2019 compared to 2018.
Educational and Other Operating Revenues decreased $3 million in 2020 compared to 2019 due to a decrease in activity in the last quarter brought on by the COVID-19 pandemic and increased $1 million in 2019 compared to 2018, mainly due to higher foreign government grants and contracts revenue.
Nonoperating and Other Revenues decreased $9 million, or 4%, in 2020 compared to 2019 and increased $58 million, or 22%, in 2019 compared to 2018.
• Government Appropriations Revenues increased $8 million and increased $4 million in 2020 and 2019, respectively, due to higher funding received from the State of Oregon.
• Capital and Debt Related State Appropriations and Grants Revenues decreased $26 million in 2020 and increased $40 million in 2019. The 2020 decrease was due to the completion of the Fariborz Maseeh Hall, formerly Neuberger Hall, during the first quarter of 2020, after 4 years of construction, offset by the ongoing construction of the Fourth & Montgomery building. The 2019 increase was due primarily to cost reimbursements from bonds issued by the State of Oregon on behalf of two capital projects; the construction of the Fourth & Montgomery building and the renovation of Neuberger Hall. Refer to Note 8 for additional information regarding these grant agreements with the State of Oregon.

MANAGEMENT’S DISCUSSION AND ANALYSIS For the Years Ended June 30, 2020, 2019 and 2018 (dollars in millions)
2 0 2 0 A N N U A L F I N A N C I A L R E P O R T 1 9
• Financial Aid Grants Revenues were relatively consistent between 2019 and 2020 and increased $2 million, or 4%, in 2019 compared to 2018 due to an increase in money received from the Oregon Opportunity Grant and the Pell Grant.
• Investment Activity was relatively consistent between 2019 and 2020 and increased $8 million in 2019 compared to 2018. The increase in investment in 2019 was primarily a result of rising bond prices that supported significant price appreciation in the value of the core bond fund.
• Capital Grants and Gifts Revenues, which include capital gifts from the PSU Foundation, decreased $3 million in 2020, due to lower gifts for the Viking Pavilion & Peter Stott Center, Karl Miller Center, and Fariborz Maseeh Hall, formerly Neuberger Hall, projects. Capital Grant and Gifts were relatively flat in 2019 compared to 2018.
• Noncapital Gifts from Discretely Presented Component Unit was consistent in 2020 compared to 2019 and increased $1 million in 2019 compared to 2018.
• Gain on Disposal of Assets, Net had a small recognized gain in 2020 due to the sale of equipment and a $2 million gain in 2019 due to the sale of the President’s residence.
• Special Item, Transfers and Other Nonoperating increased $12 million in 2020 due to the funds received from the Higher Education Emergency Relief Fund, from the CARES Act. The 2019 reported amount of $2 million in 2019 was consistent with 2017, as there was no Special Items to report, while there was a net expense in 2018 due to close out of the Federal Perkins Loan Program as described below under Other Nonoperating expense.
MANAGEMENT’S DISCUSSION AND ANALYSIS For the Years Ended June 30, 2020, 2019 and 2018 (dollars in millions)
2 0 P O R T L A N D S T A T E U N I V E R S I T Y
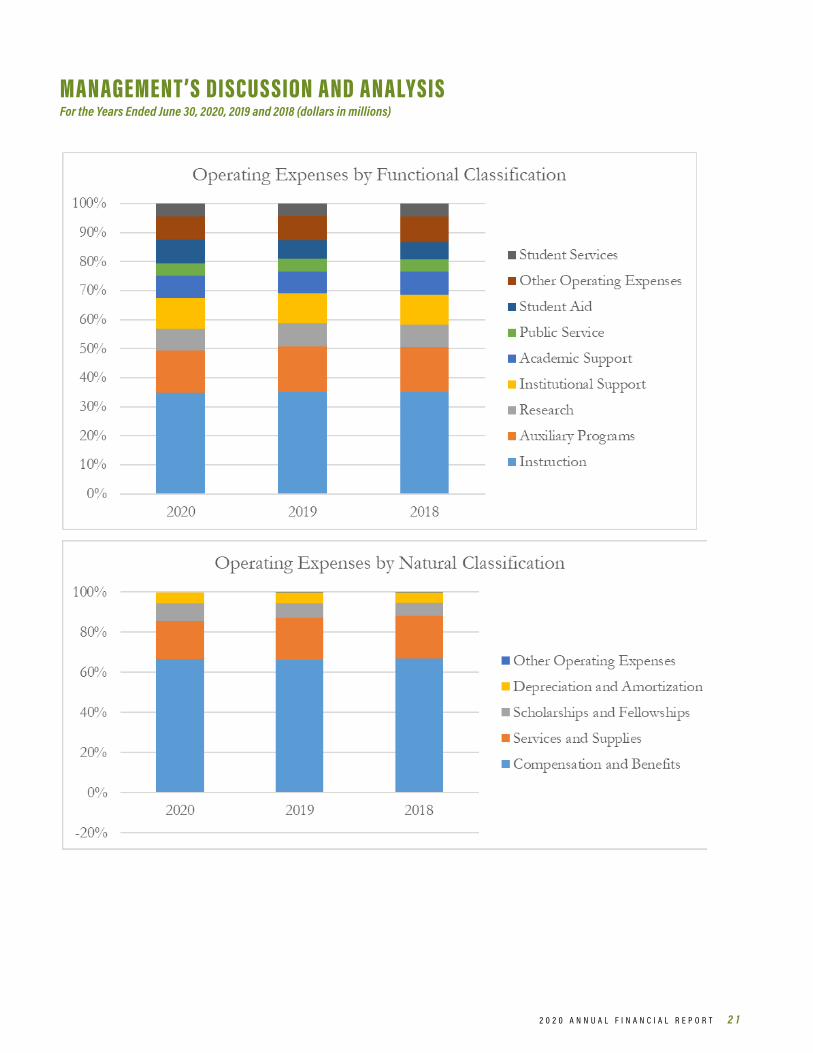
Expenses Operating Expenses Operating expenses increased $13 million, or 2%, to $541 million during 2020 compared to 2019, primarily due to increase in pension expense, offset by decreases in year-end wage based accruals. Operating expenses increased $2 million, or .4%, to $528 million during 2019 compared to 2018. There was a $9 million decrease in pension expense offset by increases in expenses.
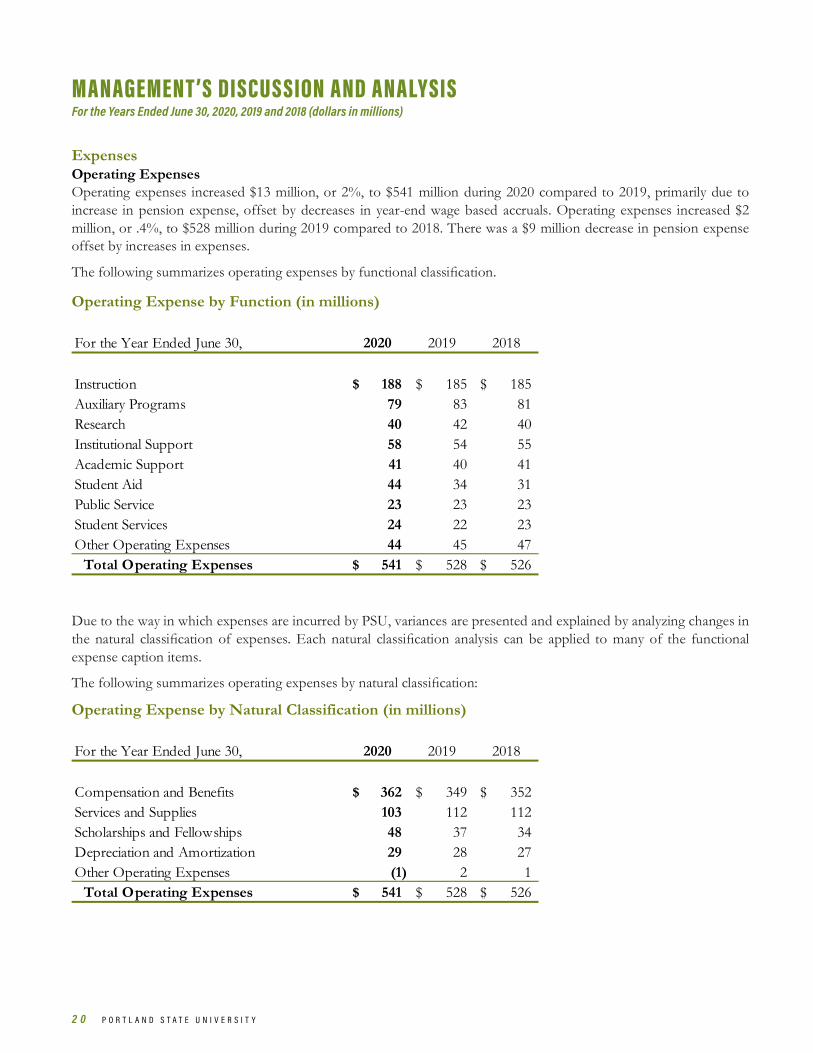
The following summarizes operating expenses by functional classification.
Operating Expense by Function (in millions)
Due to the way in which expenses are incurred by PSU, variances are presented and explained by analyzing changes in the natural classification of expenses. Each natural classification analysis can be applied to many of the functional expense caption items.
The following summarizes operating expenses by natural classification:
Operating Expense by Natural Classification (in millions)
For the Year Ended June 30, 2020 2019 2018
Instruction 188$ 185$ 185$ Auxiliary Programs 79 83 81 Research 40 42 40 Institutional Support 58 54 55 Academic Support 41 40 41 Student Aid 44 34 31 Public Service 23 23 23 Student Services 24 22 23 Other Operating Expenses 44 45 47
Total Operating Expenses 541$ 528$ 526$
For the Year Ended June 30, 2020 2019 2018
Compensation and Benefits 362$ 349$ 352$ Services and Supplies 103 112 112 Scholarships and Fellowships 48 37 34 Depreciation and Amortization 29 28 27 Other Operating Expenses (1) 2 1
Total Operating Expenses 541$ 528$ 526$
MANAGEMENT’S DISCUSSION AND ANALYSIS For the Years Ended June 30, 2020, 2019 and 2018 (dollars in millions)
2 0 2 0 A N N U A L F I N A N C I A L R E P O R T 2 1
MANAGEMENT’S DISCUSSION AND ANALYSIS For the Years Ended June 30, 2020, 2019 and 2018 (dollars in millions)
2 2 P O R T L A N D S T A T E U N I V E R S I T Y
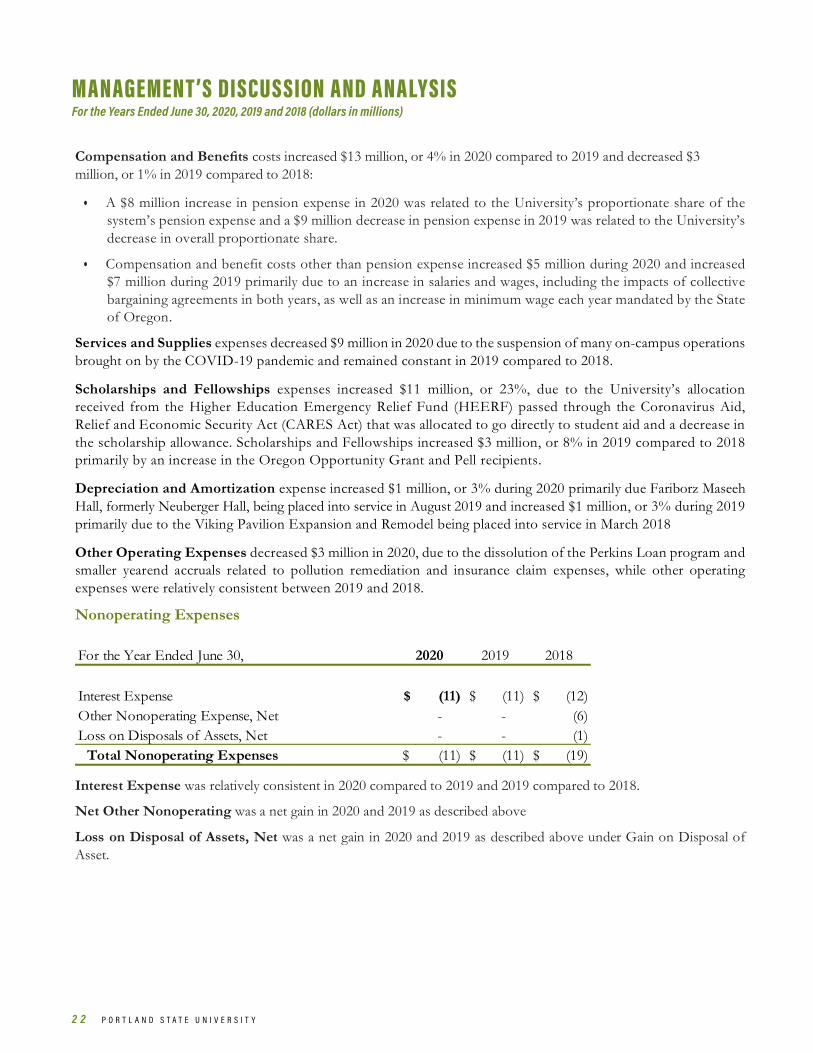
Compensation and Benefits costs increased $13 million, or 4% in 2020 compared to 2019 and decreased $3 million, or 1% in 2019 compared to 2018:
• A $8 million increase in pension expense in 2020 was related to the University’s proportionate share of the system’s pension expense and a $9 million decrease in pension expense in 2019 was related to the University’s decrease in overall proportionate share.
• Compensation and benefit costs other than pension expense increased $5 million during 2020 and increased $7 million during 2019 primarily due to an increase in salaries and wages, including the impacts of collective bargaining agreements in both years, as well as an increase in minimum wage each year mandated by the State of Oregon.
Services and Supplies expenses decreased $9 million in 2020 due to the suspension of many on-campus operations brought on by the COVID-19 pandemic and remained constant in 2019 compared to 2018.
Scholarships and Fellowships expenses increased $11 million, or 23%, due to the University’s allocation received from the Higher Education Emergency Relief Fund (HEERF) passed through the Coronavirus Aid, Relief and Economic Security Act (CARES Act) that was allocated to go directly to student aid and a decrease in the scholarship allowance. Scholarships and Fellowships increased $3 million, or 8% in 2019 compared to 2018 primarily by an increase in the Oregon Opportunity Grant and Pell recipients.
Depreciation and Amortization expense increased $1 million, or 3% during 2020 primarily due Fariborz Maseeh Hall, formerly Neuberger Hall, being placed into service in August 2019 and increased $1 million, or 3% during 2019 primarily due to the Viking Pavilion Expansion and Remodel being placed into service in March 2018
Other Operating Expenses decreased $3 million in 2020, due to the dissolution of the Perkins Loan program and smaller yearend accruals related to pollution remediation and insurance claim expenses, while other operating expenses were relatively consistent between 2019 and 2018.
Nonoperating Expenses
Interest Expense was relatively consistent in 2020 compared to 2019 and 2019 compared to 2018.
Net Other Nonoperating was a net gain in 2020 and 2019 as described above
Loss on Disposal of Assets, Net was a net gain in 2020 and 2019 as described above under Gain on Disposal of Asset.
For the Year Ended June 30, 2020 2019 2018
Interest Expense (11)$ (11)$ (12)$ Other Nonoperating Expense, Net - - (6) Loss on Disposals of Assets, Net - - (1)
Total Nonoperating Expenses (11)$ (11)$ (19)$

MANAGEMENT’S DISCUSSION AND ANALYSIS For the Years Ended June 30, 2020, 2019 and 2018 (dollars in millions)
2 0 2 0 A N N U A L F I N A N C I A L R E P O R T 2 3
Capital Assets and Related Financing Activities Changes to Capital Assets (in millions)
During 2020, capital asset additions totaled $41 million, $25 million of which, was related to the Fourth & Montgomery project and $6 million to the completion of the Fariborz Maseeh Hall, formerly Neuberger Hall, project. The remaining amount of additions was spread over several different projects occurring around campus. During 2019, capital asset additions totaled $79 million and were mainly due to continued work on Neuberger Hall and the Fourth & Montgomery projects and the purchased of land at 4th and Lincoln. During 2018, capital asset additions totaled $61 million and were mainly due to the Peter Stott Center & Viking Pavilion, Neuberger Hall, Karl Miller Center and Fourth & Montgomery projects. The Fourth & Montgomery additions included the purchase of the land for the project for which new construction begin in 2018
Accumulated depreciation increased $28 million during 2020 due to $29 million of depreciation expense, partially offset by asset retirements. Accumulated depreciation increased $24 million during 2019 due to $28 million of depreciation expense, partially offset by asset retirements, which included the sale of the president’s residence.
PSU is committed to a comprehensive program of capital investment and facility maintenance that includes addressing current maintenance needs and minimizing PSU’s deferred maintenance backlog. State, federal, private, debt and internal PSU funding are used to accomplish PSU’s capital objectives.
Capital Commitments PSU had outstanding capital commitments on partially completed and planned construction projects of $41 million at June 30, 2020, included $30 million for the Fourth & Montgomery project. See Note 16 for additional information relating to capital construction commitments.
For the Year Ended June 30, 2020 2019 2018
Capital Assets, Beginning of Year 1,046$ 970$ 917$ Add: Purchases/Construction 41 79 61 Less: Retirements/Disposals/Adjustments - (3) (8)
Total Capital Assets, End of Year 1,087$ 1,046$ 970$
Accum. Depreciation, Beginning of Year (441) (417) (397) Add: Depreciation Expense (29) (28) (27) Less: Retirements/Disposals/Adjustments 1 4 7
Total Accum. Depreciation, End of Year (469)$ (441)$ (417)$ Total Capital Assets, Net, End of Year 618$ 605$ 553$

MANAGEMENT’S DISCUSSION AND ANALYSIS For the Years Ended June 30, 2020, 2019 and 2018 (dollars in millions)
2 4 P O R T L A N D S T A T E U N I V E R S I T Y
Debt Administration As described in Note 8, the State of Oregon issues general obligation bonds on behalf of PSU to support its capital renewal and construction projects. Bonds issued on behalf of PSU under Oregon Constitution Article XI-(F)(1) are repaid by the university with PSU revenue streams and thus give rise to a note payable to the State of Oregon. Bonds issued under Articles XI-G and XI-Q are repaid by the State and thus are recorded as capital grants revenue from the State of Oregon.
During 2020, The State of Oregon issued XI-Q bonds totaling $14 million to pay off the remaining balance of the Certificates of Participation (COPs) debt for an overall reduction of debt service payments. During 2019, the State of Oregon issued $6 million of Article XI-(F)(1) debt on behalf of PSU in conjunction with its development of a mixed-use facility, known as the Fourth & Montgomery. Repayments of long-term debt due to the State of Oregon were $30 million and $13 million during 2020 and 2019, respectively. During 2020 and 2019, PSU incurred eligible expenditures under the State’s cost reimbursable Articles XI-G and XI-Q bond programs that gave rise to $31 million and $58 million, respectively, of capital state grants revenue. Economic Outlook
Overall funding for the major activities of PSU continues to be diversified, being generated through a variety of sources including tuition and fees, financial aid programs, state appropriations, grants and contracts through government and private sources, donor gifts, and investment earnings.
In the near term, PSU faces several challenges on the revenue front. Over the last five years, while there have been declines in full time equivalent student enrollment and student credit hour production, tuition revenue has remained steady through rate increases. Continuing enrollment declines driven by numerous factors including demographics are forecast, and the ability to offset these with further tuition increases has diminished. The impact of Covid-19 has led to significant short- and long- term uncertainty on both the university and the broader economy in the State of Oregon, making the continuation of recent biennial state allocation increases uncertain. Additionally, the university’s predominantly remote operational mode in response to the Covid-19 pandemic is likely to continue impacting auxiliary revenue.
PSU will continue to face increasing costs, primarily associated with labor expenditures and other payroll expenses. The university’s expenditures are heavily weighted toward personnel costs, which rise at rates greater than the common measures of inflation. At the same time, there is continuing upward pressure on non-payroll costs. To mitigate the combined impact of cost increases and revenue declines and achieve a balanced budget, the university will need to pursue both cost containment and the limited use of reserve funds. With restoration of on-campus activities, Portland State University can stabilize auxiliary operations and begin to realize the benefits of strategies implemented to grow enrollment and support student success.
Despite the challenges ahead, the PSU Board of Trustees and University leadership remain committed to ensuring the long-term financial health of PSU to carry out its core mission to “Let Knowledge Serve the City”.

2 0 2 0 A N N U A L F I N A N C I A L R E P O R T 2 5
Statements of Net PositionUniversity University
As of June 30, 2020 2019
ASSETS Current Assets
Cash and Cash Equivalents 143,100$ 99,328$ Collateral from Securities Lending 3,019 6,737 Due from Primary Government 9,632 24,939 Accounts Receivable, Net 60,525 51,342 Notes Receivable, Net 72 115 Inventories 657 593 Prepaid Expense 1,451 2,303
Total Current Assets 218,457 185,357 Noncurrent Assets
Investments 74,648 122,558 Notes Receivable – Noncurrent, Net 60 67 Net Other Postemployment Benefits Asset 2,170 1,167 Other Noncurrent Assets 250 250 Due from Primary Government - 900 Capital Assets, Net of Accumulated Depreciation 617,959 604,905
Total Noncurrent Assets 695,087 729,847 TOTAL ASSETS 913,544$ 915,204$ DEFERRED OUTFLOWS OF RESOURCES 49,667$ 54,625$ LIABILITIES Current Liabilities
Accounts Payable and Accrued Liabilities 36,035$ 39,019$ Obligations Under Securities Lending 3,019 6,737 Deposits 25,118 42,865 Current Portion of Long-Term Liabilities 23,067 23,486 Unearned Revenues 28,557 29,096
Total Current Liabilities 115,796 141,203 Noncurrent Liabilities
Unearned Revenues 22,286$ 22,894$ Net Pension Liability 148,387 130,218 Other Postemployment Benefits Liability 6,889 8,043 Long-Term Liabilities 210,689 226,053
Total Noncurrent Liabilities 388,251 387,208 TOTAL LIABILITIES 504,047$ 528,411$ DEFERRED INFLOWS OF RESOURCES 20,298$ 23,888$ NET POSITION
Net Investment in Capital Assets 411,644$ 383,064$ Restricted for:
Nonexpendable Endowments 1,285 1,285 Expendable:
Gifts, Grants and Contracts 601 1,419 Capital Projects - 3,572 Student Loans 655 638 Other Postemployment Benefits Asset 2,170 1,167
Unrestricted 22,511 26,385 TOTAL NET POSITION 438,866$ 417,530$ The accompanying notes are an integral part of these financial statements.
(in thousands)
STATEMENTS OF NET POSITION
2 6 P O R T L A N D S T A T E U N I V E R S I T Y
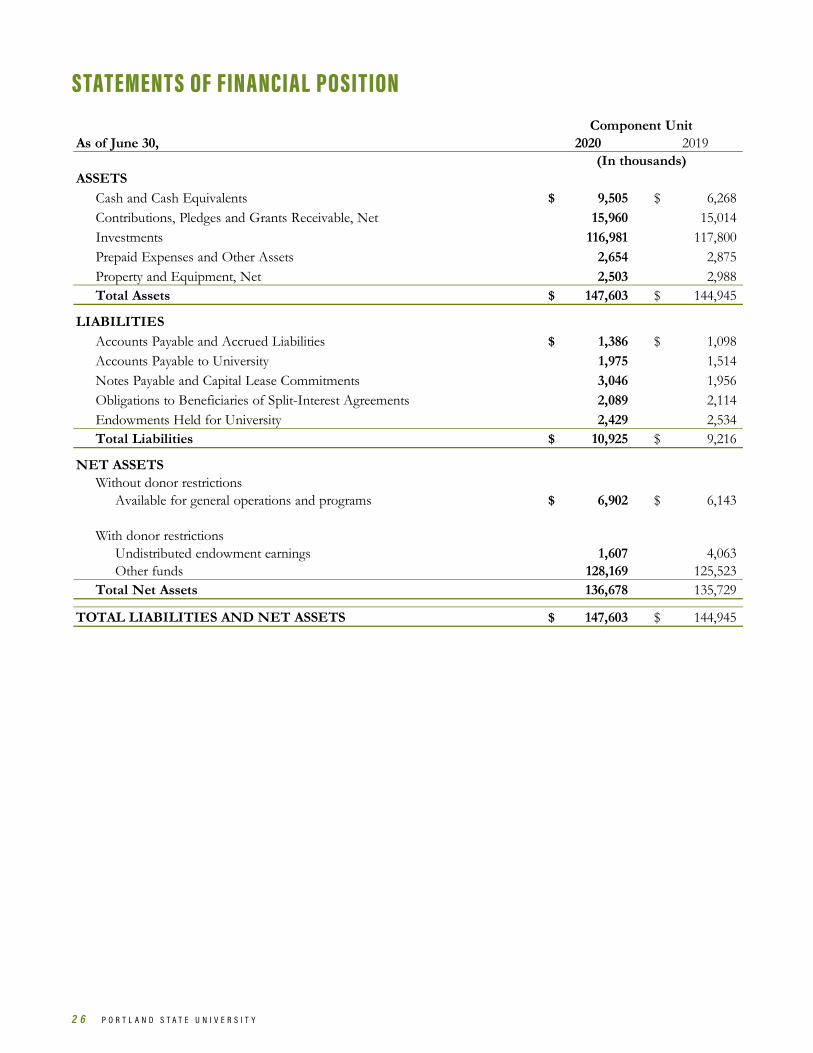
Statements of Financial Position
As of June 30, 2020 2019
ASSETSCash and Cash Equivalents 9,505$ 6,268$ Contributions, Pledges and Grants Receivable, Net 15,960 15,014 Investments 116,981 117,800 Prepaid Expenses and Other Assets 2,654 2,875 Property and Equipment, Net 2,503 2,988 Total Assets 147,603$ 144,945$
LIABILITIESAccounts Payable and Accrued Liabilities 1,386$ 1,098$ Accounts Payable to University 1,975 1,514Notes Payable and Capital Lease Commitments 3,046 1,956Obligations to Beneficiaries of Split-Interest Agreements 2,089 2,114Endowments Held for University 2,429 2,534Total Liabilities 10,925$ 9,216$
NET ASSETSWithout donor restrictions
Available for general operations and programs 6,902$ 6,143$
With donor restrictionsUndistributed endowment earnings 1,607 4,063 Other funds 128,169 125,523
Total Net Assets 136,678 135,729
TOTAL LIABILITIES AND NET ASSETS 147,603$ 144,945$
Component Unit
(In thousands)
STATEMENTS OF FINANCIAL POSITION

2 0 2 0 A N N U A L F I N A N C I A L R E P O R T 2 7
Statements of Revenues, Expenses and Changes in Net PositionUniversity University
For the Year Ended June 30, 2020 2019
OPERATING REVENUESStudent Tuition and Fees (Net of Allowances) 187,670$ 193,994$ Federal Grants and Contracts 44,848 45,603 State and Local Grants and Contracts 14,384 16,350 Nongovernmental Grants and Contracts 4,791 5,266 Educational Department Sales and Services 4,454 5,941 Auxiliary Enterprises Revenues (Net of Allowances) 74,733 88,610 Other Operating Revenues 3,841 5,540
Total Operating Revenues 334,721 361,304 OPERATING EXPENSES
Instruction 188,295 184,996 Research 39,549 42,248 Public Service 22,665 23,138 Academic Support 40,889 39,672 Student Services 23,626 21,900 Auxiliary Programs 79,962 83,346 Institutional Support 58,131 53,825 Operation and Maintenance of Plant 22,108 22,219 Student Aid 43,829 34,238 Other Operating Expenses 22,309 22,624
Total Operating Expenses 541,363 528,206 Operating Loss (206,642) (166,902) NONOPERATING REVENUES (EXPENSES)
Government Appropriations 105,832 97,743 Financial Aid Grants 55,394 55,484 Investment Activity 10,489 11,126 Gain (Loss) on Disposal of Assets, Net 177 1,884 Interest Expense (10,982) (10,968) Gain Arising from Activity on State Issued Bonds 3,380 - Noncapital Gifts from Discretely Presented Component Unit 13,223 12,897 CARES Act: Higher Education Emergency Relief Fund 11,627 - Other Nonoperating Items 2,283 2,197
Total Nonoperating Revenues (Expenses) 191,423 170,363 Loss Before Other Expenses, Gains, Losses and Transfers (15,219) 3,461
Capital and Debt Related State Appropriations and Grants 33,717 60,315 Capital Grants and Gifts 2,838 6,343 Transaction with Discretely Presented Component Unit - -
Total Other (Expenses), Gains, (Losses) and Transfers 36,555 66,658 Increase (Decrease) In Net Position 21,336 70,119 NET POSITION Beginning Balance 417,530 347,411 Ending Balance 438,866$ 417,530$
The accompanying notes are an integral part of these financial statements.
(In thousands)
STATEMENTS OF REVENUES, E XPENSES AND CHANGES IN NET POSITION

2 8 P O R T L A N D S T A T E U N I V E R S I T Y
Statements of Activities
For The Year Ended June 30,
Without Donor Restrictions
With Donor Restrictions Total
Without Donor Restrictions
With Donor Restrictions Total
REVENUES, GAINS AND OTHER SUPPORTContributions and grants 1,275$ 20,207$ 21,482$ 1,613$ 29,065$ 30,678 Special Events 601 414 1,015 687 712 1,399 Portland State University Contract Revenue 7,725 - 7,725 7,489 - 7,489 Investment Income (Loss), Net 1,331 3,488 4,819 123 3,731 3,854 Rental Income 462 - 462 462 - 462 Other Revenues 3 259 262 73 306 379 Net Assets Released From Restrictions and Other Transfers 20,189 (20,189) - 20,321 (20,321) - Total Revenues, Gains, and Other Support 31,586$ 4,179$ 35,765$ 30,768$ 13,493$ 44,261
EXPENSESUniversity Support 20,012 - 20,012 20,221 - 20,221General and Administrative 3,718 - 3,718 4,572 - 4,572Other Expenses 6,450 - 6,450 5,648 - 5,648
Total Expenses 30,180 - 30,180 30,441 - 30,441Increase (Decrease) In Net Assets 1,406 4,179 5,585 327 13,493 13,820Beginning Balance, Net Assets 4,737 125,407 130,144 4,410 111,914 116,324Ending Balance, Net Assets 6,143$ 129,586$ 135,729$ 4,737$ 125,407$ 130,144
2019 2018(In thousands)
Component Unit
STATEMENTS OF AC TIVITIES
Statements of Activities
For The Year Ended June 30,
Without Donor Restrictions
With Donor Restrictions Total
Without Donor Restrictions
With Donor Restrictions Total
REVENUES, GAINS AND OTHER SUPPORTContributions and grants 1,275$ 20,207$ 21,482$ 1,613$ 29,065$ 30,678 Special Events 601 414 1,015 687 712 1,399 Portland State University Contract Revenue 7,725 - 7,725 7,489 - 7,489 Investment Income (Loss), Net 1,331 3,488 4,819 123 3,731 3,854 Rental Income 462 - 462 462 - 462 Other Revenues 3 259 262 73 306 379 Net Assets Released From Restrictions and Other Transfers 20,189 (20,189) - 20,321 (20,321) - Total Revenues, Gains, and Other Support 31,586$ 4,179$ 35,765$ 30,768$ 13,493$ 44,261
EXPENSESUniversity Support 20,012 - 20,012 20,221 - 20,221General and Administrative 3,718 - 3,718 4,572 - 4,572Other Expenses 6,450 - 6,450 5,648 - 5,648
Total Expenses 30,180 - 30,180 30,441 - 30,441Increase (Decrease) In Net Assets 1,406 4,179 5,585 327 13,493 13,820Beginning Balance, Net Assets 4,737 125,407 130,144 4,410 111,914 116,324Ending Balance, Net Assets 6,143$ 129,586$ 135,729$ 4,737$ 125,407$ 130,144
2019 2018(In thousands)
Component Unit

2 0 2 0 A N N U A L F I N A N C I A L R E P O R T 2 9
Statements of Cash FlowsUniversity University
For the Years Ended June 30, 2020 2019 CASH FLOWS FROM OPERATING ACTIVITIES Tuition and Fees 182,102$ 195,030$
Grants and Contracts 55,957 66,270 Educational Department Sales and Services 4,454 5,941 Auxiliary Enterprises Operations 76,893 86,329 Payments to Employees for Compensation and Benefits (345,103) (341,136) Payments to Suppliers (102,215) (113,404) Student Financial Aid (48,225) (37,348) Other Operating Receipts 1,473 4,993
Net Cash Provided Used by Operating Activities (174,664) (133,325)
CASH FLOWS FROM NONCAPITAL FINANCING ACTIVITIESGovernment Appropriations 105,832 97,743 Financial Aid Grants 55,394 55,484 CARES Act: Higher Education Emergency Relief Fund 11,627 - Other Gifts and Private Contracts 29 1,159 Noncapital Gifts from Discretely Presented Component Unit 12,942 11,358 Net Agency Fund Receipts (Payments) (17,747) 32,840
Net Cash Provided by Noncapital Financing Activities 168,077 198,584
CASH FLOWS FROM CAPITAL AND RELATED FINANCING ACTIVITIESCapital and Debt Related State Appropriations and Grants 49,924 52,125 Capital Grants and Gifts 6,309 9,896 Bond Proceeds from Capital Debt 14,125 575
Proceeds from Sales of Capital Assets 1,349 2,214 Purchases of Capital Assets (43,062) (74,328) Capital Debt Extinguishment (14,125) - Interest Payments on Capital Debt (10,418) (11,200) Principal Payments on Capital Debt (12,142) (12,768)
Net Cash Used by Capital and Related Financing Activities (8,040) (33,486)
CASH FLOWS FROM INVESTING ACTIVITIESNet Sales (Purchases) of Investments 48,400 (7,227) Interest and Earnings on Investments and Cash Balances 9,999 6,331
Net Cash Provided (Used) by Investing Activities 58,399 (896) NET INCREASE (DECREASE) IN CASH AND CASH EQUIVALENTS 43,772 30,877
CASH AND CASH EQUIVALENTSBeginning Balance 99,328 68,451 Ending Balance 143,100$ 99,328$
The accompanying notes are an integral part of these financial statements.
(In thousands)
STATEMENTS OF CASH FLOWS
3 0 P O R T L A N D S T A T E U N I V E R S I T Y
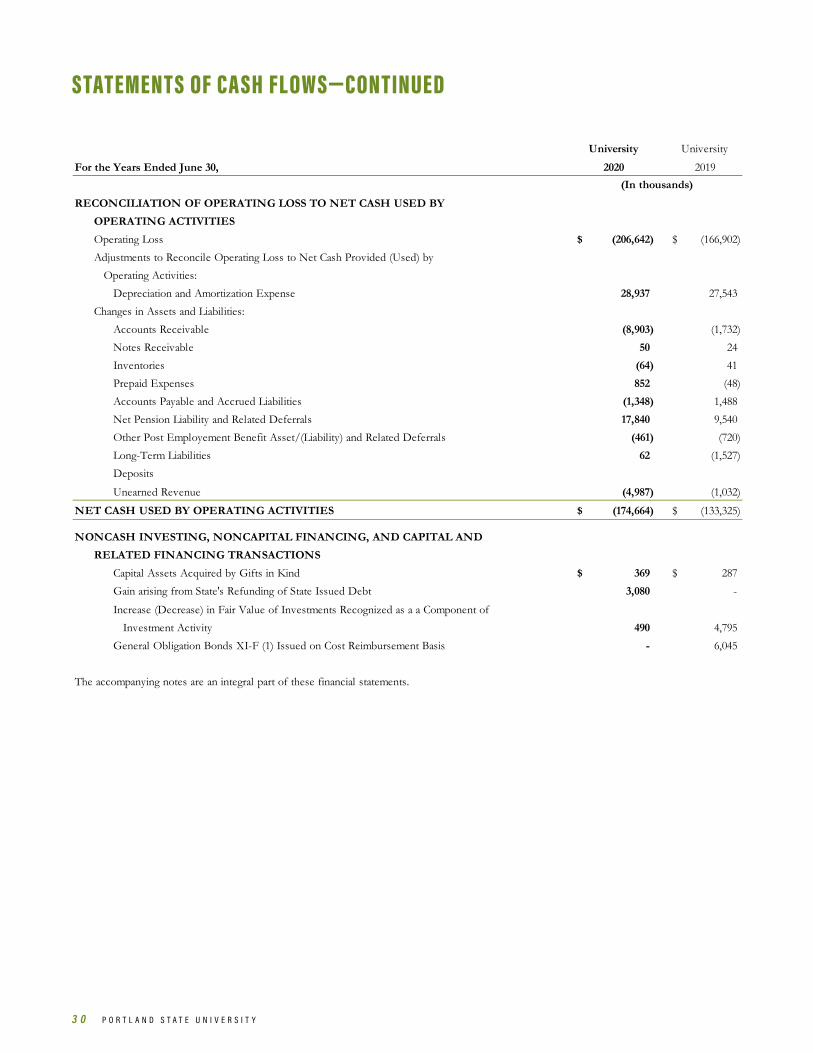
Statements of Cash Flows - Continued University University
For the Years Ended June 30, 2020 2019 RECONCILIATION OF OPERATING LOSS TO NET CASH USED BY
OPERATING ACTIVITIESOperating Loss (206,642)$ (166,902)$ Adjustments to Reconcile Operating Loss to Net Cash Provided (Used) by Operating Activities:
Depreciation and Amortization Expense 28,937 27,543 Changes in Assets and Liabilities:
Accounts Receivable (8,903) (1,732) Notes Receivable 50 24 Inventories (64) 41 Prepaid Expenses 852 (48) Accounts Payable and Accrued Liabilities (1,348) 1,488 Net Pension Liability and Related Deferrals 17,840 9,540 Other Post Employement Benefit Asset/(Liability) and Related Deferrals (461) (720) Long-Term Liabilities 62 (1,527) Deposits
Unearned Revenue (4,987) (1,032)
NET CASH USED BY OPERATING ACTIVITIES (174,664)$ (133,325)$
NONCASH INVESTING, NONCAPITAL FINANCING, AND CAPITAL ANDRELATED FINANCING TRANSACTIONS
Capital Assets Acquired by Gifts in Kind 369$ 287$ Gain arising from State's Refunding of State Issued Debt 3,080 -
Increase (Decrease) in Fair Value of Investments Recognized as a a Component of Investment Activity 490 4,795 General Obligation Bonds XI-F (1) Issued on Cost Reimbursement Basis - 6,045
The accompanying notes are an integral part of these financial statements.
(In thousands)
STATEMENTS OF CASH FLOWS—CONTINUED

2 0 2 0 A N N U A L F I N A N C I A L R E P O R T 3 1
NOTES TO THE FINANCIAL STATEMENTS For the Years Ended June 30, 2020 and 2019 (dollars in thousands)Notes to the Financial Statements For the Years Ended June 30, 2020 and 2019 (dollars in thousands)
1. ORGANIZATION AND SUMMARY OF SIGNIFICANT ACCOUNTING POLICIES
A. REPORTING ENTITY
The PSU financial reporting entity is reported under the heading of University on the Basic Financial Statements. The PSU reporting entity also includes the PSU Foundation, which is reported as a discretely presented component unit (DPCU) in the PSU financial statements. See “Note 19 University Foundation” for additional information relating to this component unit, including how to obtain the PSU Foundation’s audited financial statements that should be read in conjunction with these financial statements. Organizations that are not financially accountable to PSU, such as booster and alumni organizations, are not included in the reporting entity.
PSU and the PSU Foundation are reported as a discretely presented component unit in the Comprehensive Annual Financial Report (CAFR) issued by the State of Oregon (State). These financial statements present only PSU and its discretely presented component unit and are not intended to present the financial position, changes in financial position or the cash flows of the State as a whole.
B. FINANCIAL STATEMENT PRESENTATION
PSU financial accounting records are maintained in accordance with accounting principles generally accepted in the United States of America (GAAP) as prescribed in applicable pronouncements of the Governmental Accounting Standards Board (GASB). The financial statement presentation required by GASB No. 35, Basic Financial Statements – And Management’s Discussion and Analysis – For Public Colleges and Universities – An Amendment of GASB Statement No. 34, provides a comprehensive, entity-wide perspective of PSU assets, deferred outflows of resources, liabilities, deferred inflows of resources, net position, revenues, expenses, changes in net position and cash flows. Financial statements of the PSU Foundation are presented in accordance with GAAP prescribed by the Financial Accounting Standards Board.
In preparing the financial statements, significant transactions and balances between university funds have been eliminated. Unless otherwise stated, dollars are presented in thousands.
NEWLY IMPLEMENTED ACCOUNTING STANDARDS
In November 2016, GASB issued Statement No. 83, Certain Asset Retirement Obligations (GASB No. 83), which require entities to recognize liabilities and corresponding deferred outflows of resources when certain criteria to perform future asset retirement activities for a tangible capital assets are present. GASB No. 83 was effective July 1, 2018 and did not have a material impact on PSU’s financial statement.
In April 2018, GASB issued Statement No. 88, Certain Disclosures Related to Debt, including Direct Borrowings and Direct Placements (GASB No. 88). GASB No. 88 requires additional debt-related disclosures be included in the notes to the financial statements, including unused lines of credit; assets pledged as collateral; events of default and termination events that would trigger finance-related consequences; and significant subjective acceleration clauses. GASB No. 88 was effective for reporting periods beginning after June 15, 2018 and did not have a material impact on PSU’s disclosures.

3 2 P O R T L A N D S T A T E U N I V E R S I T Y
NOTES TO THE FINANCIAL STATEMENTS For the Years Ended June 30, 2020 and 2019 (dollars in thousands)Notes to the Financial Statements For the Years Ended June 30, 2020 and 2019 (dollars in thousands)
UPCOMING ACCOUNTING STANDARDS
In January 2017, the GASB issued Statement No. 84, Fiduciary Activities (GASB No. 84), which establishes criteria for identifying fiduciary activities and requires certain reporting requirements. In determining whether a fiduciary activity exists, GASB No. 84 focuses on whether the entity is controlling the assets of the fiduciary activity and the beneficiaries with whom a fiduciary relationship exists. GASB No. 84 was originally effective for reporting periods beginning after December 15, 2018. See GASB 95 below for postponement of effective date. PSU is currently evaluating the impact of adopting GASB No. 84 on its financial statements.
In June 2017, GASB issued Statement No. 87, Leases, (GASB No. 87). The objective of GASB No. 87 is to improve the accounting and financial reporting for leases by requiring recognition of certain lease assets and liabilities for leases that were previously classified as operating leases. GASB No. 87 establishes a single model for lease accounting based on the principle that leases are financings of the right to use an asset. GASB No. 87 was originally effective for reporting periods beginning after December 15, 2019. See GASB 95 below for postponement of effective date. PSU is currently evaluating the impact of adopting GASB No. 87 on its financial statements and disclosures.
In August 2018, GASB issued Statement No. 90, Majority Equity Interest – An Amendment of GASB No. 14 & No. 61, (GASB No. 90). The objectives of GASB No. 90 are to improve the consistency and comparability of reporting a government’s majority equity interest in a legally separate organization and to improve the relevance of financial statement information for certain component units. Further, it defines a majority equity interest and specifies that a majority equity interest in a legally separate organization should be reported as an investment if a government’s holding of the equity interest meets the definition of an investment. GASB No. 90 was originally effective for reporting periods beginning after December 15, 2018. See GASB 95 below for postponement of effective date. PSU is currently evaluating the impact of adopting GASB No. 90 on its financial statements and disclosures.
In May 2019, GASB issued Statement No. 91, Conduit Debt Obligations, (GASB No. 91). The objectives of GASB No. 91 are to provide a single method of reporting conduit debt obligations by issuers and eliminate diversity in practice associated with (1) commitments extended by issuers, (2) arrangements associated with conduit debt obligations, and (3) related note disclosures. GASB No. 91 achieves those objectives by clarifying the existing definition of a conduit debt obligation; establishing that a conduit debt obligation is not a liability of the issuer; establishing standards for accounting and financial reporting of additional commitments and voluntary commitments extended by issuers and arrangements associated with conduit debt obligations; and improving required note disclosures. GASB No. 91 was effective for reporting period beginning after December 15, 2020. See GASB 95 below for postponement of effective date. PSU is currently evaluating the impact of adopting GASB No. 91 on its financial statements and disclosures.
In May 2020, GASB issued Statement No. 94, Public-Private and Public-Public Partnerships and Availability Payment Arrangements, (GASB No. 94). The primary objective of this Statement is to improve financial reporting by addressing issues related to public-private and public-public partnership arrangements (PPPs). As used in this Statement, a PPP is an arrangement in which a government (the transferor) contracts with an operator (a governmental or nongovernmental entity) to provide public services by conveying control of the right to operate or use a nonfinancial asset, such as infrastructure or other capital asset (the underlying PPP asset), for a period of time in an exchange or exchange-like transaction. Some PPPs meet the definition of a service concession arrangement (SCA), which the Board defines in this Statement as a PPP in which (1) the operator collects and is compensated by fees from third parties; (2) the transferor determines or has the ability to modify or approve which services the operator is required to provide, to whom the operator is required to provide the services, and the prices or rates that can be charged for the services; and (3) the transferor is entitled to significant residual interest in the service utility of the underlying PPP asset at the end of the arrangement. The requirements of this Statement are effective for fiscal years beginning after June 15, 2022, and all reporting periods thereafter. Earlier application is encouraged.

2 0 2 0 A N N U A L F I N A N C I A L R E P O R T 3 3
NOTES TO THE FINANCIAL STATEMENTS For the Years Ended June 30, 2020 and 2019 (dollars in thousands)Notes to the Financial Statements For the Years Ended June 30, 2020 and 2019 (dollars in thousands)
In May 2020, GASB issued Statement No. 95, Postponement of the Effective Dates of Certain Authoritative Guidance, (GASB No. 95). The primary objective of this Statement is to provide temporary relief to governments and other stakeholders in light of the COVID-19 pandemic. That objective is accomplished by postponing the effective dates of certain provisions in Statements and Implementation Guides that first became effective or are scheduled to become effective for periods beginning after June 15, 2018, and later.
The effective dates of certain provisions contained in the following pronouncements are postponed by one year: • Statement No. 83, Certain Asset Retirement Obligations • Statement No. 84, Fiduciary Activities • Statement No. 88, Certain Disclosures Related to Debt, including Direct Borrowings and Direct
Placements • Statement No. 89, Accounting for Interest Cost Incurred before the End of a Construction Period • Statement No. 90, Majority Equity Interests • Statement No. 91, Conduit Debt Obligations • Statement No. 92, Omnibus 2020 • Statement No. 93, Replacement of Interbank Offered Rates
The effective dates of the following pronouncements are postponed by 18 months:
• Statement No. 87, Leases • Implementation Guide No. 2019-3, Leases.
Earlier application of the provisions addressed in this Statement is encouraged and is permitted to the extent specified in each pronouncement as originally issued.
In May 2020, GASB issued Statement No. 96, Subscription-Based Information Technology Arrangements, (GASB No. 96). This Statement provides guidance on the accounting and financial reporting for subscription-based information technology arrangements (SBITAs) for government end users (governments). GASB No. 96 (1) defines a SBITA; (2) establishes that a SBITA results in a right-to-use subscription asset—an intangible asset—and a corresponding subscription liability; (3) provides the capitalization criteria for outlays other than subscription payments, including implementation costs of a SBITA; and (4) requires note disclosures regarding a SBITA. To the extent relevant, the standards for SBITAs are based on the standards established in Statement No. 87, Leases, as amended. The requirements of this Statement are effective for fiscal years beginning after June 15, 2022, and all reporting periods thereafter.
C. BASIS OF ACCOUNTING
For financial reporting purposes, PSU is considered a special-purpose governmental entity engaged only in business-type activities. Accordingly, the PSU financial statements are presented using the economic resources measurement focus and the accrual basis of accounting. Under the accrual basis, revenues are recognized when earned and expenses are recorded when incurred.
D. CASH AND CASH EQUIVALENTS
Cash and cash equivalents include highly liquid investments with original maturities of three months or less. Cash and cash equivalents consist of cash on hand, amounts held by the State in the Oregon Short-Term Fund (OSTF) and agency funds.

3 4 P O R T L A N D S T A T E U N I V E R S I T Y
NOTES TO THE FINANCIAL STATEMENTS For the Years Ended June 30, 2020 and 2019 (dollars in thousands)Notes to the Financial Statements For the Years Ended June 30, 2020 and 2019 (dollars in thousands)
E. INVESTMENTS
Investments are reported at fair value in accordance with GASB Statement No. 72, Fair Value Measurement and Application (GASB No. 72), and may include amounts restricted for endowments. Unrealized gains or losses on investments are reported as investment activity in the Statements of Revenues, Expenses and Changes in Net Position (SRECNP).
GASB No. 72 requires that investments be recorded at fair value using the three levels of the fair value hierarchy described below.
Level 1 inputs – This is the first and most reliable level and is based on quoted prices for assets or liabilities in active markets that governments can access at a particular date.
Level 2 inputs – This level is based on inputs that are directly or indirectly observable but lack quoted prices in active markets.
Level 3 inputs – This is the lowest level of reliability and is based on prices that cannot be observed.
F. INVENTORIES
Inventories are recorded at the lower of average cost or market and consist primarily of supplies in storerooms and physical plant stores.
G. CAPITAL ASSETS
Capital assets are recorded at cost on the date acquired or at fair market value on the date donated. PSU capitalizes equipment with unit costs of $5 or more and an estimated useful life of greater than one year. PSU capitalizes real property expenditures that increase the functionality and/or extend the useful life of the real property if total expenditures exceed the capitalization thresholds of $50 to $100, depending on the type of real property. Intangible assets valued in excess of $100 are capitalized. Expenditures below the capitalization threshold and repairs and maintenance are charged to operating expense in the year in which the expense is incurred.
Effective July 1, 2017, PSU adopted GASB No. 89 requiring that interest costs no longer be capitalized. Prior to the adoption of GASB No. 89, PSU capitalized interest expense on construction projects that were partially or fully funded by XI-F(1) debt.
Depreciation is computed using the straight-line method over the estimated useful lives of the assets, generally 15 to 50 years for buildings, 10 to 20 years for infrastructure and land improvements, 10 years for library books and 5 to 10 years for equipment. Amortization terms of intangible assets vary depending on the factors relating to the specific asset. Depreciation is not applied to museum collections, works of art or historical treasures, or library special collections.
H. DEFERRED OUTFLOWS OF RESOURCES
Deferred Outflows of Resources represent expected future decreases in net position. At June 30, 2020, deferred outflows were $49,667, comprised of $48,989 related to defined benefit pension plans and $678 million related to defined benefit OPEB plans. Included in these amounts were $17,082 and $382 of contributions made subsequent to the measurement date for the pension and OPEB plans, respectively. At June 30, 2019, deferred outflows were $54,625, comprised of $53,267 related to defined benefit pension plans and $1,359 related to defined benefit OPEB plans. Included in these amounts were $13,108 and $1,028 of contributions made subsequent to the measurement date for the pension and OPEB plans, respectively Refer to Notes 13 and 14 for additional information.

2 0 2 0 A N N U A L F I N A N C I A L R E P O R T 3 5
NOTES TO THE FINANCIAL STATEMENTS For the Years Ended June 30, 2020 and 2019 (dollars in thousands)Notes to the Financial Statements For the Years Ended June 30, 2020 and 2019 (dollars in thousands)
I. UNEARNED REVENUES
Unearned revenues include amounts received for tuition and fees, grants and contracts, lease income and auxiliary enterprises activities, including long-term sponsorships that relate to subsequent fiscal years.
J. COMPENSATED ABSENCES
PSU accrues a liability for vacation leave and other compensated absences that were earned but not used during the current or prior fiscal year for which employees can receive compensation in a future period. Sick leave is recorded as an expense when paid as there is no payout provision for unused sick leave.
K. DEFERRED INFLOWS OF RESOURCES
Deferred Inflows of Resources represent future increases in net position. At June 30, 2020, deferred inflows were $20,298, comprised of $18,120 associated with defined benefit pension plans and $2,179 associated with defined benefit OPEB plans. Refer to Notes 13 and 14 for additional information. At June 30, 2019, deferred inflows were $23,888, comprised of $22,725 associated with defined benefit pension plans and $1,163 associated with defined benefit OPEB plans.
L. NET POSITION
PSU net position is classified as follows:
NET INVESTMENT IN CAPITAL ASSETS
Net investment in capital assets represents the total investment in capital assets, net of accumulated depreciation and amortization, and outstanding debt obligations related to those capital assets.
RESTRICTED – NONEXPENDABLE
Restricted nonexpendable consists of endowment funds in which donors have stipulated, as a condition of the gift instrument, that the principal is to be maintained inviolate and in perpetuity, and invested for the purpose of producing present and future income. The income may either be expended or, depending on the terms of the gift instrument, added to principal.
RESTRICTED – EXPENDABLE
Restricted expendable includes resources that PSU is legally or contractually obligated to spend in accordance with restrictions imposed by external parties.
UNRESTRICTED
Unrestricted are resources that may be used at the discretion of the Board. When an expense is incurred that can be paid using either restricted or unrestricted resources, restricted resources are applied first. Although no external restrictions are in place, PSU internally designated certain amounts for debt service as described in Note 2.

3 6 P O R T L A N D S T A T E U N I V E R S I T Y
NOTES TO THE FINANCIAL STATEMENTS For the Years Ended June 30, 2020 and 2019 (dollars in thousands)Notes to the Financial Statements For the Years Ended June 30, 2020 and 2019 (dollars in thousands)
M. ENDOWMENTS
PSU entered into a fund management agreement with the PSU Foundation in June 2014. All investments and reinvestment of the endowment funds are managed in accordance with the Oregon Uniform Prudent Management of Institutional Funds Act. Current PSU Foundation policy is to annually distribute up to 4.5% of the endowment fund’s average fair value over the prior 12 quarters through March 31 of the prior fiscal year.
Nonexpendable Endowments on the Statements of Net Position of $1,285 at June 30, 2020 and 2019, respectively, represent the original corpus of true endowment funds and does not include the accumulated gains on those endowments.
N. INCOME TAXES
PSU is an agency of the State and is treated as a governmental entity for tax purposes. As such, PSU is generally not subject to federal and state income taxes. However, PSU remains subject to income taxes on any income that is derived from a trade or business regularly carried on and not in furtherance of the purpose for which it was granted exemption from income taxes. No income tax provision has been recorded because quarterly estimated payments are made during the year for the amount of unrelated business income tax generated.
O. REVENUES AND EXPENSES
PSU has classified its revenues and expenses as either operating or nonoperating according to the following criteria:
Operating revenues and expenses generally have the characteristics of exchange transactions. These transactions can be defined as an exchange in which two or more entities both receive and sacrifice value, such as purchases and sales of goods or services. Examples of operating revenues include student tuition and fees, sales and services of auxiliary enterprises, most federal, state and local grants and contracts, and other operating revenues. Examples of operating expenses include employee compensation, benefits and related expense, scholarships and fellowships, utilities, supplies and other services, professional fees, and depreciation of capital assets.
Nonoperating revenues generally have the characteristics of nonexchange transactions. In a nonexchange transaction, PSU receives value without directly giving equal value in exchange. Examples of nonoperating revenues include State appropriations, nonexchange grants, gifts and contributions. Nonoperating expenses are defined in GASB No. 9, Reporting Cash Flows of Proprietary and Non-expendable Trust Funds and Governmental Entities That Use Proprietary Fund Accounting, and GASB No. 34, Basic Financial Statement and – Management Discussion and Analysis – for State and Local Governments. Examples of nonoperating expenses include interest on capital-asset-related debt.
P. CARES ACT – HIGHER EDUCATION EMERGENCY RELIEF FUND
The university was awarded $16,640 from the U.S. Department of Education through the CARES Act for the Higher Education Emergency Relief Fund (HEERF), which is split equally to be used on Student Emergency Aid and Institutional Aid. Of the total award, the university incurred allowable costs, and thus recognized revenue of $7,194 in Student Aid and $4,429 in eligible Institutional Aid costs. The amount drawn as of fiscal year ended 2020 for Student Emergency Aid was $7,194. For Institutional Aid, no draw down had occurred as of June 30, 2020; as such, the university recorded a receivable of $4,429. This receivable, along with the remaining unspent award of $5,017 is anticipated to be drawn by fiscal year ended 2021.

2 0 2 0 A N N U A L F I N A N C I A L R E P O R T 3 7
NOTES TO THE FINANCIAL STATEMENTS For the Years Ended June 30, 2020 and 2019 (dollars in thousands)
Notes to the Financial Statements For the Years Ended June 30, 2020 and 2019 (dollars in thousands)
Q. ALLOWANCES
Student tuition and fees and campus housing revenues included in auxiliary enterprises revenues are reported net of scholarship allowances. A scholarship allowance is the difference between the revenues charged to students and the amounts actually paid. PSU has two types of scholarship allowances that net into tuition and fees. Tuition and housing remissions, provided directly by PSU, amounted to $20,536 and $21,103 for the fiscal years ended 2020 and 2019, respectively. Revenues from financial aid programs (e.g., Pell Grants, Supplemental Educational Opportunity Grants and Oregon Opportunity Grants) and scholarships used for paying student tuition and fees and campus housing were estimated to be $27,870 and $30,371 for the fiscal years ended 2020 and 2019, respectively. Bad debt expense is included as an allowance to operating revenues and was $1,958 and $2,032 for the fiscal years ended 2020 and 2019, respectively.
R. DIRECT FEDERAL STUDENT LOAN PROGRAMS
PSU receives proceeds from the Federal Direct Student Loan Program. Since PSU transmits these grantor-supplied proceeds without having administrative or direct financial involvement in the program, these loans are reported as an agency activity. Federal student loans received by PSU students but not reported in in the SRECNP were $103,627 and $114,662 for the fiscal years ended 2020 and 2019, respectively.
S. USE OF ESTIMATES
The preparation of financial statements in conformity with GAAP requires management to make estimates and assumptions that could affect the reported amounts of assets and liabilities, revenues and expenses, and disclosure of contingent assets and liabilities at the date of the financial statements. Actual results could differ from those estimates.
2. CASH AND INVESTMENTS
The Public University Fund (PUF) maintains centralized management for substantially all of PSU’s cash and investments. The invested assets are managed through investment pools at the Oregon State Treasury (State Treasury), which commingle the invested assets of all member universities, including PSU, in the OSTF and fixed income investments in the PUF’s Core Bond Fund. Each investment pool has a board approved investment policy and set of objectives identifying risk and return parameters for each investment pool.
In general, deposits and investment securities as described below are exposed to various risks such as credit, concentration of credit, custodial credit, interest rate and foreign currency. Although the objective of each investment pool is to preserve capital within defined risk parameters, it is likely that the value of the investment securities will fluctuate during short periods of time, and possible that such changes could materially affect the amounts reported in the financial statements.
At June 30, 2020 and 2019, PSU had $20,979 and 41,606 of cash and cash equivalents and investments associated with matching funds unconditionally available for specified capital projects, respectively. Additionally, at June 30, 2020 and 2019, PSU had $21,481 and $21,380 of cash and cash equivalents and investments internally designated for debt service, respectively.

3 8 P O R T L A N D S T A T E U N I V E R S I T Y
NOTES TO THE FINANCIAL STATEMENTS For the Years Ended June 30, 2020 and 2019 (dollars in thousands)
Notes to the Financial Statements For the Years Ended June 30, 2020 and 2019 (dollars in thousands)
A. CASH AND CASH EQUIVALENTS
DEPOSITS WITH STATE TREASURY
PSU maintains the majority of its cash balances on deposit with the State Treasury. These deposits at the State Treasury are held, on a pooled basis as described above, in the OSTF. The OSTF is a cash and investment pool for use by all state agencies. The State Treasury invests these deposits in high-grade short-term investment securities. At June 30, 2020 and 2019, PSU cash and cash equivalents on deposit in the OSTF at State Treasury were $143,026 and $98,697, respectively.
A copy of the State Treasury audited annual financial report may be obtained by writing to the Oregon State Treasury, 350 Winter St. NE, Suite 100, Salem, OR 97301-3896 or by linking to https://www.oregon.gov/treasury/news-data/pages/treasury-news-reports.aspx.
CUSTODIAL CREDIT RISK—DEPOSITS
Custodial credit risk is the risk that, in the event of a financial institution failure, cash balances will not be returned to a depositor. Since PSU cash balances held on deposit at the State Treasury are invested consistently, custodial credit risk exposure to the State Treasury is low.
FOREIGN CURRENCY RISK—DEPOSITS
Deposits in foreign currency run the risk of changing value due to fluctuations in foreign exchange rates. State Treasury deposits are in U.S. currency and therefore not exposed to foreign currency risk.
OTHER DEPOSITS
PSU has certain cash balances that are not on deposit at State Treasury. At June 30, 2020 and 2019, PSU had cash on deposit of $0 and $1,731 that was covered by FDIC insurance up to $250 with amounts in excess of $250 collateralized with securities held by the pledging financial institution. At June 30, 2020 and 2019, PSU had vault and petty cash balances of $74 and $68, respectively.
B. INVESTMENTS
At June 30, 2020, PSU’s investments included $72,219 held in the PUF’s core bond fund managed by State Treasury and $2,429 of endowments held at the PSU Foundation with a nonexpendable corpus of $1,285. At June 30, 2019, PSU’s investments included $120,025 held in the PUF’s Core Bond Fund and $2,534 of endowments held at the PSU Foundation with a nonexpendable corpus of $1,285.
The PUF investment policy is governed by the Oregon Investment Council (OIC). In accordance with Oregon Revised Statutes (ORS), all investments are managed as would a prudent investor, exercising reasonable care, skill and caution. While the State Treasury is authorized to utilize demand deposit accounts and fixed-income investments, equity investments must be directed by external investment managers who are under contract to the OIC. The PUF Core Bond Fund is not rated by a nationally recognized statistical rating organization although the portfolio rules provide minimum requirements with respect to the credit quality of the investments.
Due to PSU’s participation in the PUF, it is not required to provide detailed disclosures otherwise required under GASB No. 72 nor is its investment in the PUF required to be separately valued under GASB No. 72 as the PUF values all funds at fair value in accordance with GASB No. 72. Investments held by the PUF are predominately valued using Level 2 inputs.

2 0 2 0 A N N U A L F I N A N C I A L R E P O R T 3 9
NOTES TO THE FINANCIAL STATEMENTS For the Years Ended June 30, 2020 and 2019 (dollars in thousands)
Notes to the Financial Statements For the Years Ended June 30, 2020 and 2019 (dollars in thousands)
Significant events in domestic and international investment markets or aggressive action by the Federal Open Market Committee to influence both short and long-term interest rates contribute to price volatility. Consequently, the fair value of PSU’s portion of the PUF’s pooled investments is exposed to price volatility which could result in a substantial change in the fair value of certain investments from the amounts reported as of June 30, 2019 and 2018.
Investments are all classified as noncurrent and include both restricted (if any) and unrestricted funds. Earnings on investments from restricted fund sources are spent in accordance with the restrictions on the funding source. Investments held by the PSU Foundation are primarily valued used Level 1 and Level 2 inputs.
CREDIT RISK
Credit risk is the risk that the issuer of an investment fails to fulfill its obligations. The PUF investment policy requires the following minimum credit standards at the time of purchase: (a) for investments in non-U.S. government securities, a minimum rating of Aa2, AA or AA by Moody’s Investors Services, Standard & Poor’s or Fitch, respectively; (b) for municipal debt securities, a minimum rating of A3, A- or A- by Moody’s Investors Services, Standard & Poor’s or Fitch, respectively; (c) for corporate debt securities, a minimum investment rating by at least one of the noted rating agencies; and (d) for both asset-based securities and commercial mortgage-backed securities, a AAA rating.
Based on these parameters, as of June 30, 2020, approximately 91.5 percent of investment in the PUF pools were subject to credit risk reporting. Fixed income securities rated by the credit agencies as lower medium to high quality, indicating the issuer has a strong capacity to pay principal and interest when due, totaled $120,344 at June 30, 2020. Fixed income securities that have not been evaluated by the rating agencies totaled $55,753 at June 30, 2020. The PUF Investment Pools totaled $192,396 at June 30, 2020, of which PSU owned $72,219, or 37.5 percent.
Based on these parameters, as of June 30, 2019, approximately 93 percent of investment in the PUF pools were subject to credit risk reporting. Fixed income securities rated by the credit agencies as lower medium to high quality, indicating the issuer has a strong capacity to pay principal and interest when due, totaled $209,190 at June 30, 2019. Fixed income securities that have not been evaluated by the rating agencies totaled $106,502 at June 30, 2019. The PUF Investment Pools totaled $338,348 at June 30, 2019, of which PSU owned $120,025, or 35.5 percent.
CUSTODIAL CREDIT RISK
Custodial credit risk refers to PUF investments that are held by others and not registered in PUF’s or the State Treasury’s name. This risk typically occurs in repurchase agreements where one transfers cash to a broker-dealer in exchange for securities, but the securities are held by a separate trustee in the name of the broker-dealer. There are policy provisions around securities lending to control this risk. See “C. Securities Lending” in this footnote for additional information.
CONCENTRATION OF CREDIT RISK
Concentration of credit risk refers to potential losses if total investments are concentrated with one or few issuers. PUF policy for reducing this risk in fixed income securities is that, with the exception of U.S. Government and Agency issues, no more than 10 percent of the bond portfolio, at market value, will be invested in securities of a single issuer or no more than five percent of the individual issue. For all other types of fixed income investments, not more than five percent of the market value of any investment fund will be invested in any single security, unless part of an index fund.

4 0 P O R T L A N D S T A T E U N I V E R S I T Y
NOTES TO THE FINANCIAL STATEMENTS For the Years Ended June 30, 2020 and 2019 (dollars in thousands)Notes to the Financial Statements For the Years Ended June 30, 2020 and 2019 (dollars in thousands)
FOREIGN CURRENCY RISK
Foreign currency risk is the risk that investments may lose value due to fluctuations in foreign exchange rates. No amounts of the PUF investments had reportable foreign currency risk at years ended June 30, 2020 and 2019.
INTEREST RATE RISK
Investments in fixed income securities are subject to the risk that changes in interest rates will adversely affect the fair value of the investments. For the years ended June 30, 2020 and 2019, securities in the PUF Investment Pool held subject to interest rate risk totaling $176,097 and $315,692 with an average duration of 3.77 and 3.39, respectively. Duration measures the change in the value of a fixed-income security that will result from a one percent change in interest rates.
C. SECURITIES LENDING
In accordance with the State investment policies, the State Treasury participates in securities lending transactions. The State Treasurer has authorized its custodian to act as its agent in the lending of PSU’s proportionate share of securities, held in the PUF, pursuant to a form of loan agreement, in accordance with OSTF and Core Bond Fund investment policies. There have been no significant violations of the provisions of securities lending agreements. Amounts reported on PSU’s Statement of Net Position as Collateral From and Obligations Under Securities Lending are a percent share of the amount owned by the PUF in total.
The State’s securities lending agent lent short-term fixed-income securities and received as collateral U.S. dollar-denominated cash and U.S. Treasury securities. Borrowers were required to deliver collateral for each loan equal to not less than 102 percent of the market value of the loaned security. The State may pledge or sell the collateral securities received only in the event of a borrower default. The State has the ability to impose restrictions on the amount of the loans that the securities lending agent made on its behalf. Several such restrictions were made during the years ended June 30, 2020 and 2019. The State is fully indemnified by its securities lending agent against losses due to borrower default. There were no losses during the year from the failure of borrowers to return loaned securities. The Custodian is authorized by the Securities Lending Agreement to invest cash collateral received for the PUF’s securities on loan. The funds’ rules provide that broker/dealers meet certain qualifications and that investments are delivered to and held by a third party custodian, which holds the funds’ securities in the State’s name. The cash collateral of PUF securities on loan was invested and maintained by the custodial agent, into U.S. Agency Securities, U.S. Treasury and Corporate notes. The investments were held by a third-party custodian in the State’s name.
The State Treasury and borrowers maintain the right to terminate all securities lending transactions on demand. As a consequence, the maturities of investments made with the cash collateral generally do not match the maturities of the securities loans.

2 0 2 0 A N N U A L F I N A N C I A L R E P O R T 4 1
NOTES TO THE FINANCIAL STATEMENTS For the Years Ended June 30, 2020 and 2019 (dollars in thousands)Notes to the Financial Statements For the Years Ended June 30, 2020 and 2019 (dollars in thousands)
3. ACCOUNTS RECEIVABLE
Accounts Receivable, including amounts due from component unit, were comprised of the following:
Amounts Due from Primary Government of $9,632 and $25,839 at June 30, 2020 and 2019, respectively, were attributable to cost reimbursable State bond proceeds for capital projects.
4. NOTES RECEIVABLE
Notes Receivable were comprised of the following:
June 30, 2020
June 30, 2019
Student Tuition and Fees 33,008$ 28,462$ Auxiliary Enterprises and Other Operating Activities 6,467 9,176 Federal Grants and Contracts 12,808 9,967 PSU Foundation 1,745 1,465 State, Other Government, and Private Gifts, Grants and Contracts 11,193 8,521 Other 4,771 2,404
69,992 59,995 Less: Allowance for Doubtful Accounts (9,467) (8,653) Accounts Receivable, Net 60,525$ 51,342$
Current Noncurrent Total Current Noncurrent Total
Institutional and OtherStudent Loans 66$ -$ 66$ 109$ -$ 109$
Auxiliary 6 55 61 6 61 67 Federal Student Loans - 5 5 - 6 6
72$ 60$ 132$ 115$ 67$ 182$ Less: Allowance for Doubtful
Accounts - - - - - - Notes Receivable, Net 72$ 60$ 132$ 115$ 67$ 182$
June 30, 2020 June 30, 2019
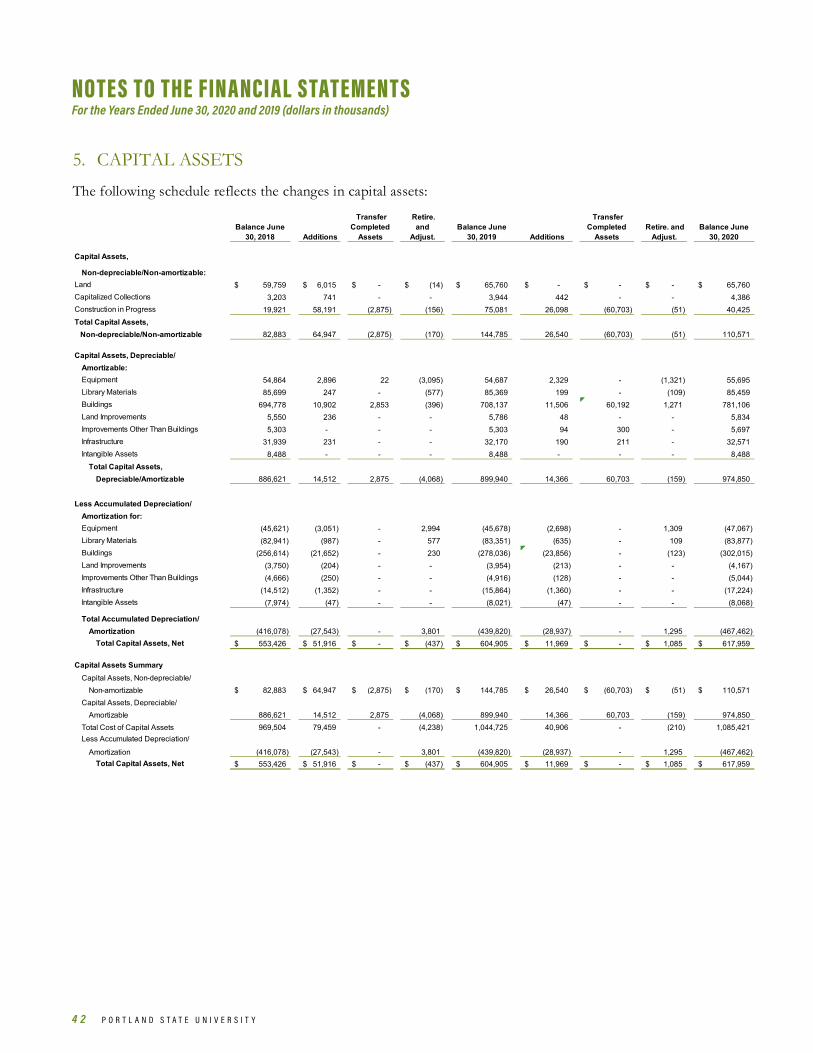
4 2 P O R T L A N D S T A T E U N I V E R S I T Y
NOTES TO THE FINANCIAL STATEMENTS For the Years Ended June 30, 2020 and 2019 (dollars in thousands)Notes to the Financial Statements For the Years Ended June 30, 2020 and 2019 (dollars in thousands)
5. CAPITAL ASSETS
The following schedule reflects the changes in capital assets:
Balance June 30, 2018 Additions
Transfer Completed
Assets
Retire. and
Adjust. Balance June
30, 2019 Additions
Transfer Completed
Assets Retire. and
Adjust. Balance June
30, 2020
Capital Assets,
Non-depreciable/Non-amortizable:Land 59,759$ 6,015$ -$ (14)$ 65,760$ -$ -$ -$ 65,760$Capitalized Collections 3,203 741 - - 3,944 442 - - 4,386Construction in Progress 19,921 58,191 (2,875) (156) 75,081 26,098 (60,703) (51) 40,425Total Capital Assets, Non-depreciable/Non-amortizable 82,883 64,947 (2,875) (170) 144,785 26,540 (60,703) (51) 110,571
Capital Assets, Depreciable/Amortizable:Equipment 54,864 2,896 22 (3,095) 54,687 2,329 - (1,321) 55,695Library Materials 85,699 247 - (577) 85,369 199 - (109) 85,459Buildings 694,778 10,902 2,853 (396) 708,137 11,506 60,192 1,271 781,106Land Improvements 5,550 236 - - 5,786 48 - - 5,834Improvements Other Than Buildings 5,303 - - - 5,303 94 300 - 5,697Infrastructure 31,939 231 - - 32,170 190 211 - 32,571Intangible Assets 8,488 - - - 8,488 - - - 8,488
Total Capital Assets,Depreciable/Amortizable 886,621 14,512 2,875 (4,068) 899,940 14,366 60,703 (159) 974,850
Less Accumulated Depreciation/Amortization for:Equipment (45,621) (3,051) - 2,994 (45,678) (2,698) - 1,309 (47,067)Library Materials (82,941) (987) - 577 (83,351) (635) - 109 (83,877)Buildings (256,614) (21,652) - 230 (278,036) (23,856) - (123) (302,015)Land Improvements (3,750) (204) - - (3,954) (213) - - (4,167)Improvements Other Than Buildings (4,666) (250) - - (4,916) (128) - - (5,044)Infrastructure (14,512) (1,352) - - (15,864) (1,360) - - (17,224)Intangible Assets (7,974) (47) - - (8,021) (47) - - (8,068)
Total Accumulated Depreciation/Amortization (416,078) (27,543) - 3,801 (439,820) (28,937) - 1,295 (467,462)
Total Capital Assets, Net 553,426$ 51,916$ -$ (437)$ 604,905$ 11,969$ -$ 1,085$ 617,959$
Capital Assets SummaryCapital Assets, Non-depreciable/
Non-amortizable 82,883$ 64,947$ (2,875)$ (170)$ 144,785$ 26,540$ (60,703)$ (51)$ 110,571$Capital Assets, Depreciable/
Amortizable 886,621 14,512 2,875 (4,068) 899,940 14,366 60,703 (159) 974,850Total Cost of Capital Assets 969,504 79,459 - (4,238) 1,044,725 40,906 - (210) 1,085,421Less Accumulated Depreciation/
Amortization (416,078) (27,543) - 3,801 (439,820) (28,937) - 1,295 (467,462)Total Capital Assets, Net 553,426$ 51,916$ -$ (437)$ 604,905$ 11,969$ -$ 1,085$ 617,959$
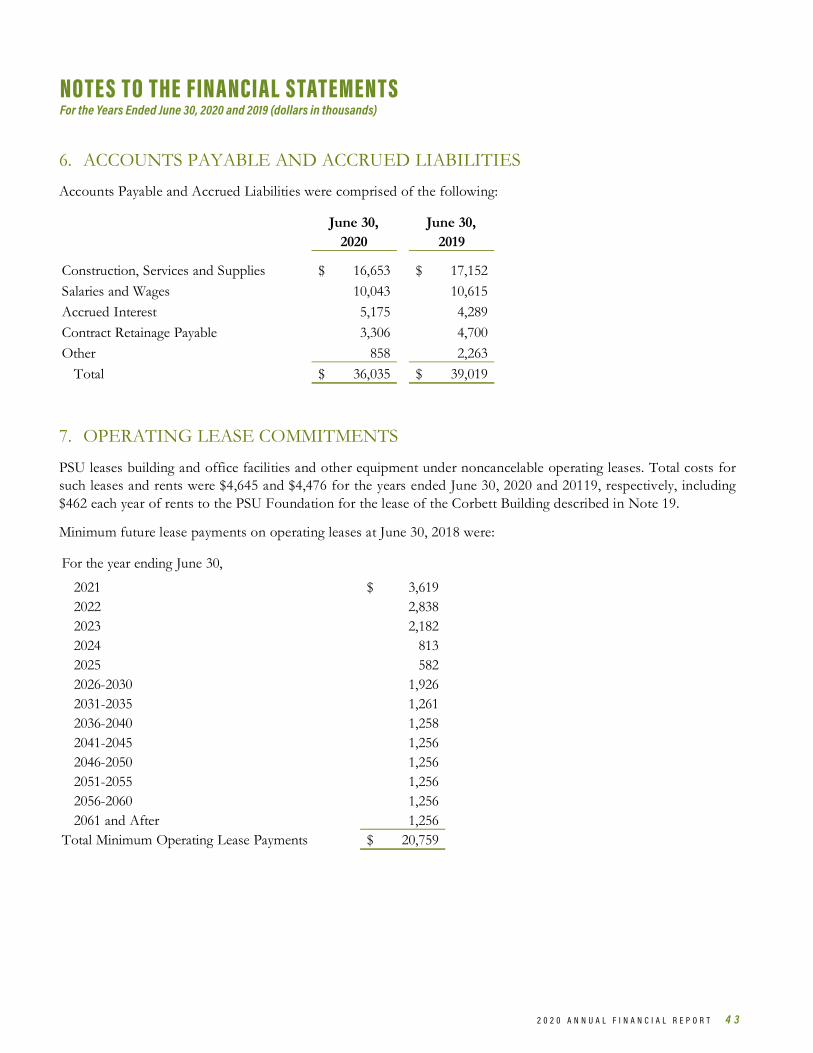
2 0 2 0 A N N U A L F I N A N C I A L R E P O R T 4 3
NOTES TO THE FINANCIAL STATEMENTS For the Years Ended June 30, 2020 and 2019 (dollars in thousands)Notes to the Financial Statements For the Years Ended June 30, 2020 and 2019 (dollars in thousands)
6. ACCOUNTS PAYABLE AND ACCRUED LIABILITIES
Accounts Payable and Accrued Liabilities were comprised of the following:
7. OPERATING LEASE COMMITMENTS
PSU leases building and office facilities and other equipment under noncancelable operating leases. Total costs for such leases and rents were $4,645 and $4,476 for the years ended June 30, 2020 and 20119, respectively, including $462 each year of rents to the PSU Foundation for the lease of the Corbett Building described in Note 19.
Minimum future lease payments on operating leases at June 30, 2018 were:
June 30,2020
June 30,2019
Construction, Services and Supplies 16,653$ 17,152$ Salaries and Wages 10,043 10,615 Accrued Interest 5,175 4,289 Contract Retainage Payable 3,306 4,700 Other 858 2,263
Total 36,035$ 39,019$
For the year ending June 30,
2021 3,619$ 2022 2,838 2023 2,182 2024 813 2025 582 2026-2030 1,926 2031-2035 1,261 2036-2040 1,258 2041-2045 1,256 2046-2050 1,256 2051-2055 1,256 2056-2060 1,256 2061 and After 1,256
Total Minimum Operating Lease Payments 20,759$
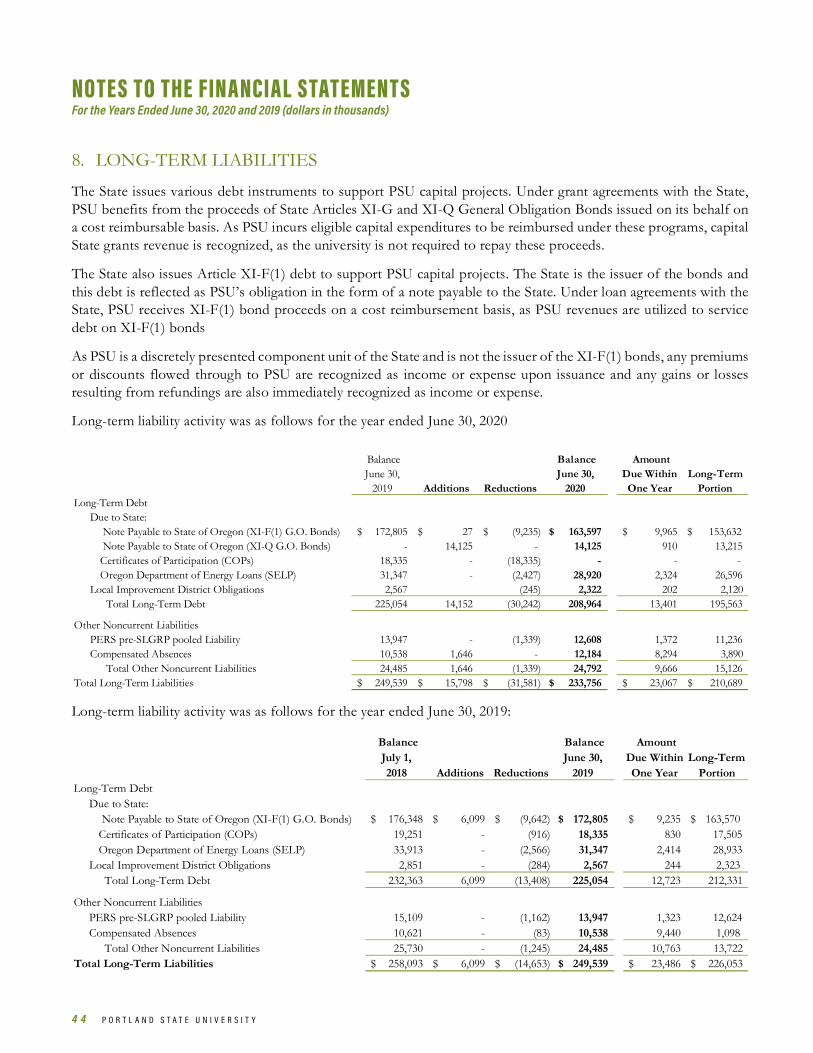
4 4 P O R T L A N D S T A T E U N I V E R S I T Y
NOTES TO THE FINANCIAL STATEMENTS For the Years Ended June 30, 2020 and 2019 (dollars in thousands)Notes to the Financial Statements For the Years Ended June 30, 2020 and 2019 (dollars in thousands)
8. LONG-TERM LIABILITIES
The State issues various debt instruments to support PSU capital projects. Under grant agreements with the State, PSU benefits from the proceeds of State Articles XI-G and XI-Q General Obligation Bonds issued on its behalf on a cost reimbursable basis. As PSU incurs eligible capital expenditures to be reimbursed under these programs, capital State grants revenue is recognized, as the university is not required to repay these proceeds.
The State also issues Article XI-F(1) debt to support PSU capital projects. The State is the issuer of the bonds and this debt is reflected as PSU’s obligation in the form of a note payable to the State. Under loan agreements with the State, PSU receives XI-F(1) bond proceeds on a cost reimbursement basis, as PSU revenues are utilized to service debt on XI-F(1) bonds
As PSU is a discretely presented component unit of the State and is not the issuer of the XI-F(1) bonds, any premiums or discounts flowed through to PSU are recognized as income or expense upon issuance and any gains or losses resulting from refundings are also immediately recognized as income or expense.
Long-term liability activity was as follows for the year ended June 30, 2020
Long-term liability activity was as follows for the year ended June 30, 2019:
Balance June 30,
2019 Additions Reductions
Balance June 30,
2020
Amount Due Within
One Year Long-Term
PortionLong-Term Debt
Due to State: Note Payable to State of Oregon (XI-F(1) G.O. Bonds) 172,805$ 27$ (9,235)$ 163,597$ 9,965$ $ 153,632 Note Payable to State of Oregon (XI-Q G.O. Bonds) - 14,125 - 14,125 910 13,215 Certificates of Participation (COPs) 18,335 - (18,335) - - - Oregon Department of Energy Loans (SELP) 31,347 - (2,427) 28,920 2,324 26,596
Local Improvement District Obligations 2,567 (245) 2,322 202 2,120 Total Long-Term Debt 225,054 14,152 (30,242) 208,964 13,401 195,563
Other Noncurrent LiabilitiesPERS pre-SLGRP pooled Liability 13,947 - (1,339) 12,608 1,372 11,236 Compensated Absences 10,538 1,646 - 12,184 8,294 3,890
Total Other Noncurrent Liabilities 24,485 1,646 (1,339) 24,792 9,666 15,126 Total Long-Term Liabilities 249,539$ 15,798$ (31,581)$ 233,756$ 23,067$ 210,689$
Balance July 1, 2018 Additions Reductions
Balance June 30,
2019
Amount Due Within One Year
Long-Term Portion
Long-Term DebtDue to State:
Note Payable to State of Oregon (XI-F(1) G.O. Bonds) 176,348$ 6,099$ (9,642)$ 172,805$ 9,235$ $ 163,570 Certificates of Participation (COPs) 19,251 - (916) 18,335 830 17,505 Oregon Department of Energy Loans (SELP) 33,913 - (2,566) 31,347 2,414 28,933
Local Improvement District Obligations 2,851 - (284) 2,567 244 2,323 Total Long-Term Debt 232,363 6,099 (13,408) 225,054 12,723 212,331
Other Noncurrent LiabilitiesPERS pre-SLGRP pooled Liability 15,109 - (1,162) 13,947 1,323 12,624 Compensated Absences 10,621 - (83) 10,538 9,440 1,098
Total Other Noncurrent Liabilities 25,730 - (1,245) 24,485 10,763 13,722 Total Long-Term Liabilities 258,093$ 6,099$ (14,653)$ 249,539$ 23,486$ 226,053$
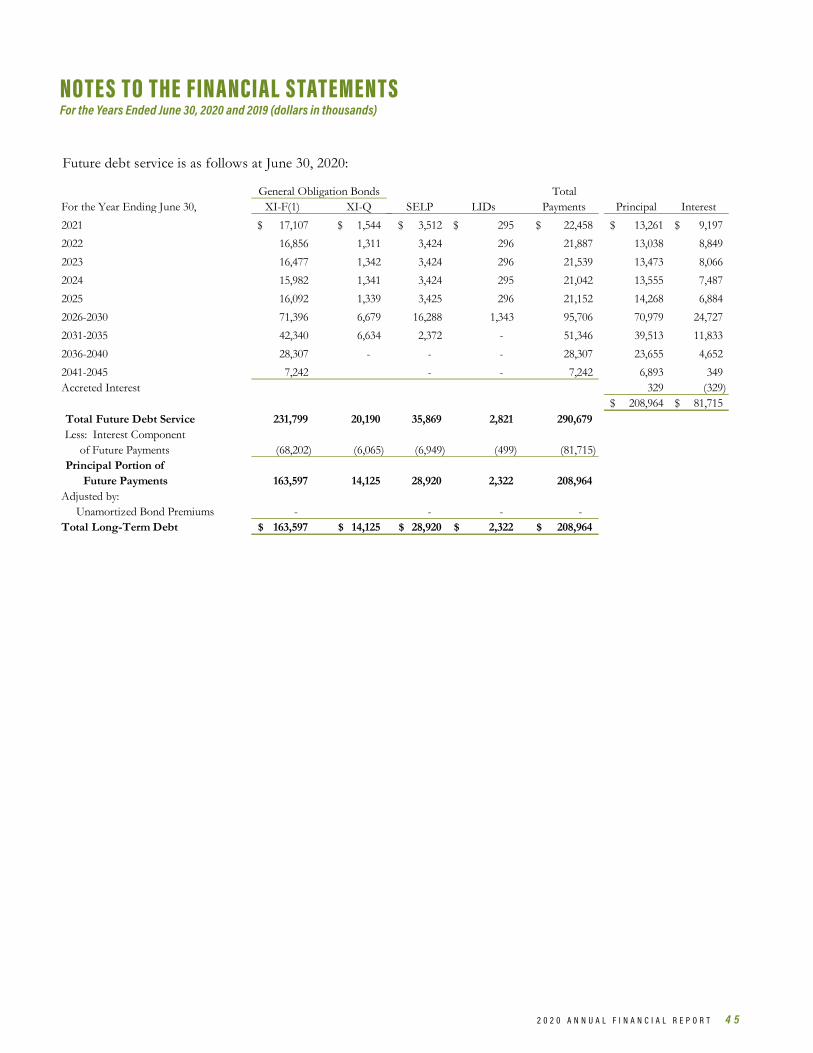
2 0 2 0 A N N U A L F I N A N C I A L R E P O R T 4 5
NOTES TO THE FINANCIAL STATEMENTS For the Years Ended June 30, 2020 and 2019 (dollars in thousands)Notes to the Financial Statements For the Years Ended June 30, 2020 and 2019 (dollars in thousands)
Future debt service is as follows at June 30, 2020:
TotalFor the Year Ending June 30, XI-F(1) XI-Q SELP LIDs Payments Principal Interest2021 17,107$ 1,544$ 3,512$ 295$ 22,458$ 13,261$ 9,197$ 2022 16,856 1,311 3,424 296 21,887 13,038 8,849 2023 16,477 1,342 3,424 296 21,539 13,473 8,066 2024 15,982 1,341 3,424 295 21,042 13,555 7,487 2025 16,092 1,339 3,425 296 21,152 14,268 6,884 2026-2030 71,396 6,679 16,288 1,343 95,706 70,979 24,727 2031-2035 42,340 6,634 2,372 - 51,346 39,513 11,833 2036-2040 28,307 - - - 28,307 23,655 4,652 2041-2045 7,242 - - 7,242 6,893 349 Accreted Interest 329 (329)
208,964$ 81,715$ Total Future Debt Service 231,799 20,190 35,869 2,821 290,679 Less: Interest Component of Future Payments (68,202) (6,065) (6,949) (499) (81,715) Principal Portion of Future Payments 163,597 14,125 28,920 2,322 208,964
Adjusted by: Unamortized Bond Premiums - - - - Total Long-Term Debt 163,597$ 14,125$ 28,920$ 2,322$ 208,964$
General Obligation Bonds
4 6 P O R T L A N D S T A T E U N I V E R S I T Y
NOTES TO THE FINANCIAL STATEMENTS For the Years Ended June 30, 2020 and 2019 (dollars in thousands)Notes to the Financial Statements For the Years Ended June 30, 2020 and 2019 (dollars in thousands)
A. NOTES PAYABLE FOR GENERAL OBLIGATION BONDS XI-F(1)
Amounts due to the State for Article XI-F(1) bonds, with effective yields ranging from 0.3 percent to 7.0 percent, are due serially through 2042.
In June 2019, the State of Oregon issued $6,045 of Article XI-F(1) bonds, to support PSU’s construction of the Joint School of Public Health. The bonds were issued as part of the 2019 Series F (Taxable) at an effective interest rate of 3.46 percent due serially through June 2042. PSU entered into a loan agreement with the State of Oregon’s Higher Education Coordinating Commission for the $6,045 par value of the bonds, including costs of issuance with an effective interest rate of 2.8 percent based on the State of Oregon’s average coupon rate on the bonds.
During the year ended June 30, 2020, PSU recognized as Gain Arising from Activity on State Issued Bonds in the Statement of Revenue and Expenses $3,380 from refinancing COP-Series 2010B with proceeds of the 2019N XI-Q Bond issuance. There were no refundings that impacted PSU during the year ended, June 30, 2019 that impacted PSU.
B. OREGON DEPARTMENT OF ENERGY LOANS
PSU has entered into loan agreements with the Oregon Department of Energy (DOE) Small Scale Energy Loan Program (SELP) for energy conservation projects at PSU. PSU makes monthly loan payments (principal and interest) to the DOE in accordance with the loan agreements. SELP loans, with interest rates ranging from 2.0 percent to 5.95 percent, are due through 2031.
C. CERTIFICATES OF PARTICIPATION
COPs, with effective yields ranging from 1.7 percent to 6.2 percent, are due through fiscal year 2035. The State has not issued COPs on behalf of PSU or the former Oregon University System since fiscal year 2010. These were defeased in fiscal year 2020 as described above.
D. DEFEASED DEBT
From time to time and when fiscally appropriate, the State Treasury will sell bonds and use the proceeds to defease other debt.
During the year ended June 30, 2020, XI-Q series 2019N bonds with a par value of $12,550 were issued at an average 5% coupon with an all-in TIC of 1.96 percent to defease existing debt with a par value of $15,970 at an average coupon rate of 6.1%. The defeasance reduces future debt service payment by $3,220 and resulted in a $2,667 economic gain.
An additional XI-Q series 2020G bonds with a par value of $1,575 were issued at an average 0.46% coupon with an all-in TIC of 1.80% to defease existing debt with a par value of $1,535 at an average coupon rate of 5.06 percent. The defeasance reduces future debt service payment by $62 and resulted in a $62 economic gain.
E. FINANCIAL GUARANTEES
As a university with a governing board, PSU is not considered a state agency. As a result, the State has no responsibility for PSU’s financial obligations other than those related to State general obligation debt.
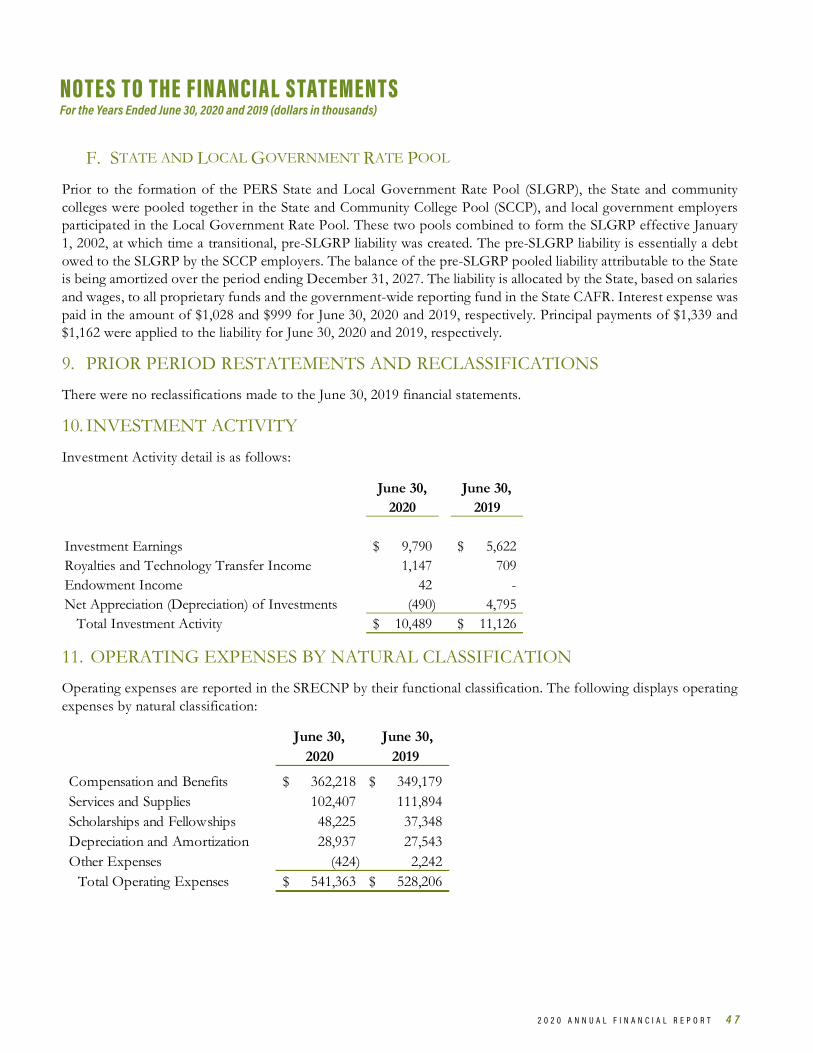
2 0 2 0 A N N U A L F I N A N C I A L R E P O R T 4 7
NOTES TO THE FINANCIAL STATEMENTS For the Years Ended June 30, 2020 and 2019 (dollars in thousands)Notes to the Financial Statements For the Years Ended June 30, 2020 and 2019 (dollars in thousands)
F. STATE AND LOCAL GOVERNMENT RATE POOL
Prior to the formation of the PERS State and Local Government Rate Pool (SLGRP), the State and community colleges were pooled together in the State and Community College Pool (SCCP), and local government employers participated in the Local Government Rate Pool. These two pools combined to form the SLGRP effective January 1, 2002, at which time a transitional, pre-SLGRP liability was created. The pre-SLGRP liability is essentially a debt owed to the SLGRP by the SCCP employers. The balance of the pre-SLGRP pooled liability attributable to the State is being amortized over the period ending December 31, 2027. The liability is allocated by the State, based on salaries and wages, to all proprietary funds and the government-wide reporting fund in the State CAFR. Interest expense was paid in the amount of $1,028 and $999 for June 30, 2020 and 2019, respectively. Principal payments of $1,339 and $1,162 were applied to the liability for June 30, 2020 and 2019, respectively.
9. PRIOR PERIOD RESTATEMENTS AND RECLASSIFICATIONS
There were no reclassifications made to the June 30, 2019 financial statements.
10. INVESTMENT ACTIVITY
Investment Activity detail is as follows:
11. OPERATING EXPENSES BY NATURAL CLASSIFICATION
Operating expenses are reported in the SRECNP by their functional classification. The following displays operating expenses by natural classification:
June 30, 2020
June 30, 2019
Investment Earnings 9,790$ 5,622$ Royalties and Technology Transfer Income 1,147 709 Endowment Income 42 - Net Appreciation (Depreciation) of Investments (490) 4,795
Total Investment Activity 10,489$ 11,126$
June 30,2020
June 30, 2019
Compensation and Benefits 362,218$ 349,179$ Services and Supplies 102,407 111,894 Scholarships and Fellowships 48,225 37,348 Depreciation and Amortization 28,937 27,543 Other Expenses (424) 2,242
Total Operating Expenses 541,363$ 528,206$

4 8 P O R T L A N D S T A T E U N I V E R S I T Y
NOTES TO THE FINANCIAL STATEMENTS For the Years Ended June 30, 2020 and 2019 (dollars in thousands)Notes to the Financial Statements For the Years Ended June 30, 2020 and 2019 (dollars in thousands)
12. GOVERNMENT APPROPRIATIONS
Government appropriations, including capital grants and debt related appropriations, were comprised of the following:
Refer to Note 8 for information regarding grant agreements with the State for funding of capital projects on a cost reimbursable basis.
13. EMPLOYEE RETIREMENT PLANS
PSU offers various retirement plans to qualified employees as described below, as well as offers postemployment healthcare assistance as described in Note 14.
OREGON PUBLIC EMPLOYEES RETIREMENT SYSTEM/OREGON PUBLIC SERVICE RETIREMENT PLAN
The following provides an overview of PSU’s participation in both the defined benefit and defined contribution plans in which it participates.
The Oregon Public Employees Retirement System (PERS) holds assets in a pension trust and provides a statewide defined benefit retirement plan in which PSU employees are eligible to participate. The PERS trust also administers other postemployment benefits as described in Note 14. The PERS defined benefit retirement plan is administered by the Public Employees Retirement Board (Retirement Board) as required by Chapters 238 and 238A of the ORS. Effective July 1, 2015, PSU had a campus police office such that PERS benefits terms provided to police members became applicable to PSU prospectively.
PERS is a cost-sharing multiple-employer defined benefit plan consisting of multiple tiers of membership. The 1995 Oregon Legislature enacted a law creating a second tier of PERS benefits. Employees hired into an eligible position prior to January 1, 1996 are enrolled in Tier One, while employees hired into an eligible position on or after January 1, 1996 but before August 29, 2003 are enrolled in Tier Two. The 2003 Oregon Legislature enacted ORS 238A creating the Oregon Public Service Retirement Plan (OPSRP), which covers employees hired into eligible positions on or after August 29, 2003. The OPSRP is comprised of a defined benefit pension program and an individual account program (IAP). The OPSRP defined benefit component is part of the cost-sharing multiple-employer defined benefit plan administered by PERS. IAP within the OPSRP is considered a defined contribution plan for financial reporting purposes.
Capital Capital General Projects Debt General Projects Debt
Operations Related Service Total Operations Related Service TotalState General Fund 104,836$ 31,535$ 2,182$ 138,553$ 96,604$ 58,133$ 2,182$ 156,919$ State Lottery Funding 996 996 1,139 1,139
Total Appropriations 105,832$ 31,535$ 2,182$ 139,549$ 97,743$ 58,133$ 2,182$ 158,058$
June 30, 2020 June 30, 2019
2 0 2 0 A N N U A L F I N A N C I A L R E P O R T 4 9
NOTES TO THE FINANCIAL STATEMENTS For the Years Ended June 30, 2020 and 2019 (dollars in thousands)Notes to the Financial Statements For the Years Ended June 30, 2020 and 2019 (dollars in thousands)
PERS employee contributions requirements are established by ORS 238A.330 and are credited to an employee’s account in the IAP and may be amended by an act of the Oregon Legislature. PERS employer contributions are set by the PERS Board based on actuarial valuations performed in odd numbered years. Since July 1, 1979 with the exception of employees represented by the PSU American Federation of Teachers (AFT) union, the employee’s contribution rate of 6 percent has been paid by the employer. For the year ended June 30, 2020, the Tiers One and Two general service contribution rate was 22.24 percent and was 27.31 percent for police service. For the year ended June 30, 2019, the Tiers One and Two general service contribution rate was 17.84 percent and was 22.83 percent for police service.
OPSRP contribution requirements are established by ORS and may be amended by an act of the Oregon Legislature. OPSRP collects contributions from both employers and employees for the purpose of funding retirement benefits. Since July 1, 1979 with the exception of employees represented by the PSU AFT union, the employee’s contribution rate of 6 percent has been paid by the employer. The PSU employer contribution rates for OPSRP for the year ended June 30, 2020 was 14.75 percent for general service and 19.38 percent for police service. The PSU employer contribution rate for OPSRP for the year ended June 30, 2019 was 10.78 percent for general service and 15.55 percent for police service.
PERS members as of January 1, 2004 have their employee contribution (paid by the employer) deposited to the defined contribution portion of the OPSRP (the IAP) and their employer contribution credited to the defined benefit portion of the OPSRP. They continue to retain their existing PERS accounts and other benefits associated with PERS membership.
Further information for the defined benefit PERS plan and the defined benefit component of the OPSRP, including detailed disclosures required by GASB No. 68, is presented below under “Defined Benefit Plans.”
The Retirement Bond Debt Service Assessment was authorized by the Oregon Legislature in 2003 to sell general obligation bonds in the amount of $2 billion to pay a PERS unfunded actuarial liability. This action reduced the PERS contribution rate for PERS covered employers in the State actuarial pool in November 2003. The Oregon Department of Administrative Services (DAS) coordinates the debt service assessments to PERS employers to cover the bond debt service payments. PERS employers are assessed a percentage of PERS-subject payroll to fund the payments. The assessment rate is adjusted biennially over the life of the 24-year debt repayment schedule. The payroll assessment for the pension obligation bond began May 2004 and is currently at a rate of 6.2 percent. Payroll assessments for the University for the fiscal years ended June 30, 2020 and 2019 were $6,971 and $7,330, respectively.
PERS issues a separate, publicly available financial report that contains audited financial statements and RSI. The report includes 10-year historical trend information showing the progress made in accumulating sufficient assets to pay benefits when due. The report may be obtained by writing to PERS, Fiscal Services Division, PO Box 23700, Tigard, OR 97281-3700 or online at https://www.oregon.gov/pers/Pages/Financials/Actuarial-Financial-Information.aspx.

5 0 P O R T L A N D S T A T E U N I V E R S I T Y
NOTES TO THE FINANCIAL STATEMENTS For the Years Ended June 30, 2020 and 2019 (dollars in thousands)Notes to the Financial Statements For the Years Ended June 30, 2020 and 2019 (dollars in thousands)
OPSRP IAP
An IAP member becomes vested on the date the employee account is established or on the date the rollover account was established. If the employer makes optional employer contributions for a member, the member becomes vested on the earliest of the following dates: the date the member completes 600 hours of service in each of five calendar years, the date the member reaches normal retirement age, the date the IAP is terminated, the date the active member becomes disabled, or the date the active member dies. The IAP accounts fall under Internal Revenue Code Section 401(a).
Upon retirement, a member of the OPSRP Individual Account Program (IAP) may receive the amounts in his or her employee account, rollover account, and vested employer account as a lump-sum payment or in equal installments over a 5-, 10-, 15-, 20-year period or an anticipated life span option. Each distribution option has a two-hundred-dollar minimum distribution limit.
Upon the death of a non-retired member, the beneficiary receives in a lump sum the member’s account balance, rollover account balance, and vested employer optional contribution account balance. If a retired member dies before the installment payments are completed, the beneficiary may receive the remaining installment payments or choose a lump-sum payment.
OPTIONAL RETIREMENT PLAN
The 1995 Oregon Legislature enacted legislation that authorized the former Oregon University System to offer a defined contribution retirement plan as an alternative to PERS. The Board appointed a Retirement Plan Committee to administer the Optional Retirement Plan (ORP) and established trustees to manage plan assets placed with mutual funds and insurance companies. Beginning April 1, 1996, the ORP was made available to PSU unclassified faculty and staff who are eligible for PERS membership. Employees choosing the ORP may invest the employee and employer contributions in one of multiple investment companies. The ORP is administered by the University of Oregon.
Through June 30, 2014, the ORP consisted of three tiers. Membership under ORP Tier One and Tier Two is determined using the same criteria as PERS. The third tier is determined by membership under the OPSRP and is also referred to as the OPSRP Equivalent. Under the ORP Tier One, Tier Two and OPSRP Equivalent, the employee’s contribution rate is 6 percent and, with the exception of employees represented by the PSU AFT union, is paid by the employer. Effective July 1, 2014, the Oregon Legislature adopted a fourth ORP tier, which includes an employer contribution, as well as an employer matching contribution on employee contributions to the Oregon Public University tax-deferred investment 403(b) plan of up to 4 percent.
The employer contribution rates for the ORP are as follows:
2020 2019ORP Tiers 1 & 2 27.20% 23.68%OPSRP Equivalent (general service) 9.85% 9.29%OPSRP Equivalent (police) 14.75% 14.74%ORP Tier 4 8.00% 8.00%

2 0 2 0 A N N U A L F I N A N C I A L R E P O R T 5 1
NOTES TO THE FINANCIAL STATEMENTS For the Years Ended June 30, 2020 and 2019 (dollars in thousands)Notes to the Financial Statements For the Years Ended June 30, 2020 and 2019 (dollars in thousands)
TEACHER’S INSURANCE AND ANNUITY ASSOCIATION/COLLEGE RETIREMENT EQUITIES FUND
Eligible unclassified employees may participate in the Teacher’s Insurance and Annuity Association and College Retirement Equities Fund (TIAA-CREF) retirement program, a defined contribution plan, on all salary in excess of forty-eight hundred dollars per calendar year. Employee contributions are directed to PERS on the first forty-eight hundred dollars. The employer contribution to TIAA-CREF is an amount sufficient to provide an annuity pension equal to the employee’s contributions. To participate in this retirement option, employees must have been hired on or before September 9, 1995. This plan was closed to new enrollment at the time the ORP started in 1996.
SUPPLEMENTAL RETIREMENT PLAN (SRP)
Through June 2019, the University of Oregon maintained an IRC Section 414(d) cash balance deferred compensation plan to provide a specific benefit value to certain university presidents upon separation, including PSU’s. The SRP was fully funded prior to termination.
SUMMARY OF PENSION PAYMENTS
PSU total payroll for the year ended June 30, 2020, was $232,833, of which $193,641 was subject to retirement contributions. The following summarizes payments made by PSU for the fiscal year:
Of the employee share, the employer paid $6,844 of PERS/OPSRP, $3,731 of ORP and $39 of TIAA-CREF during the fiscal year ended June 30, 2020. Of the employee share, the employer paid $6,834 of PERS/OPSRP, $3,752 of ORP and $50 of TIAA-CREF during the fiscal year ended June 30, 2019.
Employer
Percent of Covered Payroll
Employee Contribution
Percent of Covered Payroll Employer
Percent of Covered Payroll
Employee Contribution
Percent of Covered Payroll
PERS/OPSRP 17,081$ 8.82% 7,228$ 3.73% 12,080$ 6.28% 7,170$ 3.73%ORP 10,269 5.30% 4,424 2.28% 9,538 4.96% 4,360 2.27%TIAA-CREF 39 0.02% 39 0.02% 50 0.03% 50 0.03%Total 27,389$ 14.14% 11,691$ 6.04% 21,668$ 11.27% 11,580$ 6.02%
2020 2019
5 2 P O R T L A N D S T A T E U N I V E R S I T Y
NOTES TO THE FINANCIAL STATEMENTS For the Years Ended June 30, 2020 and 2019 (dollars in thousands)Notes to the Financial Statements For the Years Ended June 30, 2020 and 2019 (dollars in thousands)
DEFINED BENEFIT PLANS
The disclosures and amounts presented below are based on the actuarial valuation performed as of December 31, 2017 rolled forward to the June 30, 2019 measurement date.
A. Name of pension plan:
PERS consists of a cost-sharing multiple employer defined benefit pension plan.
B. Description of benefit terms:
Plan Benefits
All benefits of PERS are established by the Oregon Legislature pursuant to ORS Chapters 238 and 238A.
1. Tier One/Tier Two Retirement (Benefit Chapter 238). Tier One/Tier Two Retirement Benefit plan is closed to new members hired on or after August 29, 2003.
Pension Benefits
The PERS retirement allowance is payable monthly for life. It may be selected from 13 retirement benefit options. These options include survivorship benefits and lump-sum refunds. The basic benefit is based on years of service and final average salary. A percentage (1.67 percent for general service employees and 2.0 percent for police employees) is multiplied by the number of years of creditable service and the final average salary. Benefits may also be calculated under either a formula plus annuity (for members who were contributing before August 21, 1981) or a money match computation if a greater benefit results.
A member is considered vested and will be eligible at minimum retirement age for a service retirement allowance if he or she has had a contribution in each of five calendar years or has reached at least 50 years of age before ceasing employment with a participating employer (age 45 for police members). General service employees may retire after reaching age 55. Police members are eligible after reaching age 50. Tier One general service employee benefits are reduced if retirement occurs prior to age 58 with fewer than 30 years of service. Police member benefits are reduced if retirement occurs prior to age 55 with fewer than 25 years of service. Tier Two members are eligible for full benefits at age 60.
Death Benefits
Upon the death of a non-retired member, the beneficiary receives a lump-sum refund of the member’s account balance (accumulated contributions and interest). In addition, the beneficiary will receive a lump-sum payment from employer funds equal to the account balance, provided one or more of the following conditions are met:
• the member was employed by a PERS employer at the time of death,
• the member died within 120 days after termination of PERS-covered employment,
• the member died as a result of injury sustained while employed in a PERS-covered job, or
• the member was on an official leave of absence from a PERS-covered job at the time of death.
Disability Benefits
A member with 10 or more years of creditable service who becomes disabled from other than duty-connected causes may receive a non-duty disability benefit. A disability resulting from a job-incurred injury or illness qualifies a member for disability benefits regardless of the length of PERS-covered service. Upon qualifying for either a non-duty or duty disability, service time is computed to age 58 (55 for police members) when determining the monthly benefit.
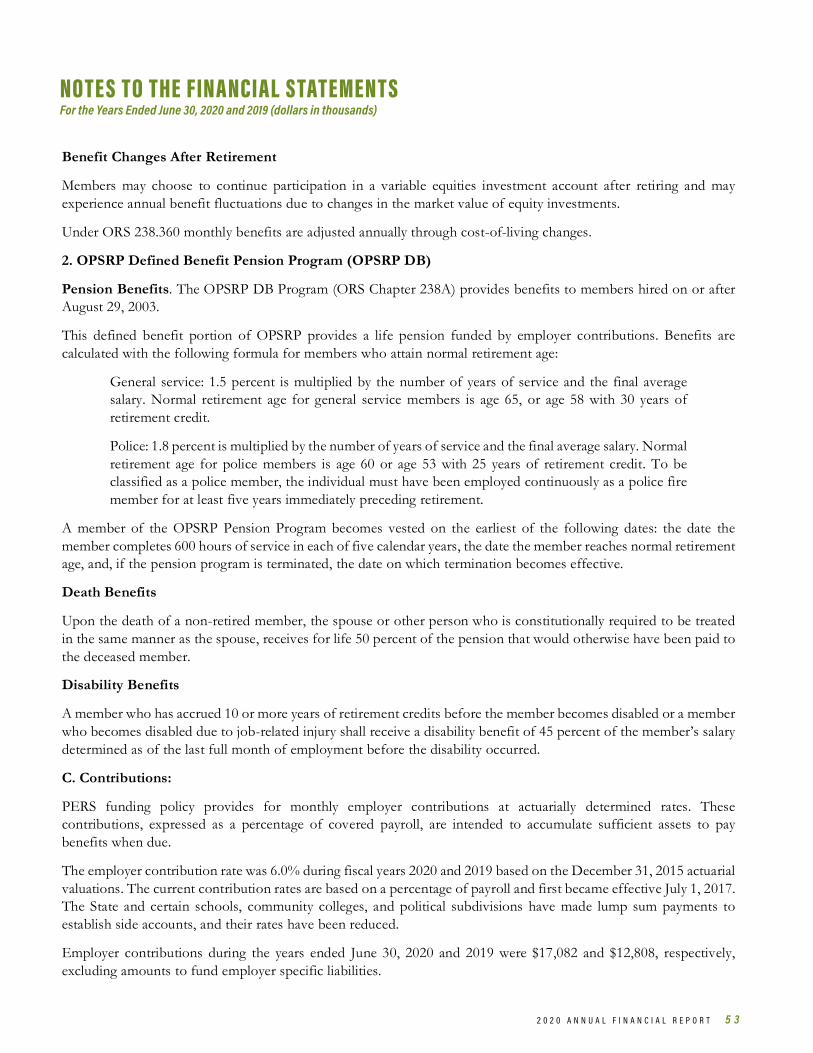
2 0 2 0 A N N U A L F I N A N C I A L R E P O R T 5 3
NOTES TO THE FINANCIAL STATEMENTS For the Years Ended June 30, 2020 and 2019 (dollars in thousands)Notes to the Financial Statements For the Years Ended June 30, 2020 and 2019 (dollars in thousands)
Benefit Changes After Retirement
Members may choose to continue participation in a variable equities investment account after retiring and may experience annual benefit fluctuations due to changes in the market value of equity investments.
Under ORS 238.360 monthly benefits are adjusted annually through cost-of-living changes.
2. OPSRP Defined Benefit Pension Program (OPSRP DB)
Pension Benefits. The OPSRP DB Program (ORS Chapter 238A) provides benefits to members hired on or after August 29, 2003.
This defined benefit portion of OPSRP provides a life pension funded by employer contributions. Benefits are calculated with the following formula for members who attain normal retirement age:
General service: 1.5 percent is multiplied by the number of years of service and the final average salary. Normal retirement age for general service members is age 65, or age 58 with 30 years of retirement credit.
Police: 1.8 percent is multiplied by the number of years of service and the final average salary. Normal retirement age for police members is age 60 or age 53 with 25 years of retirement credit. To be classified as a police member, the individual must have been employed continuously as a police fire member for at least five years immediately preceding retirement.
A member of the OPSRP Pension Program becomes vested on the earliest of the following dates: the date the member completes 600 hours of service in each of five calendar years, the date the member reaches normal retirement age, and, if the pension program is terminated, the date on which termination becomes effective.
Death Benefits
Upon the death of a non-retired member, the spouse or other person who is constitutionally required to be treated in the same manner as the spouse, receives for life 50 percent of the pension that would otherwise have been paid to the deceased member.
Disability Benefits
A member who has accrued 10 or more years of retirement credits before the member becomes disabled or a member who becomes disabled due to job-related injury shall receive a disability benefit of 45 percent of the member’s salary determined as of the last full month of employment before the disability occurred.
C. Contributions:
PERS funding policy provides for monthly employer contributions at actuarially determined rates. These contributions, expressed as a percentage of covered payroll, are intended to accumulate sufficient assets to pay benefits when due.
The employer contribution rate was 6.0% during fiscal years 2020 and 2019 based on the December 31, 2015 actuarial valuations. The current contribution rates are based on a percentage of payroll and first became effective July 1, 2017. The State and certain schools, community colleges, and political subdivisions have made lump sum payments to establish side accounts, and their rates have been reduced.
Employer contributions during the years ended June 30, 2020 and 2019 were $17,082 and $12,808, respectively, excluding amounts to fund employer specific liabilities.
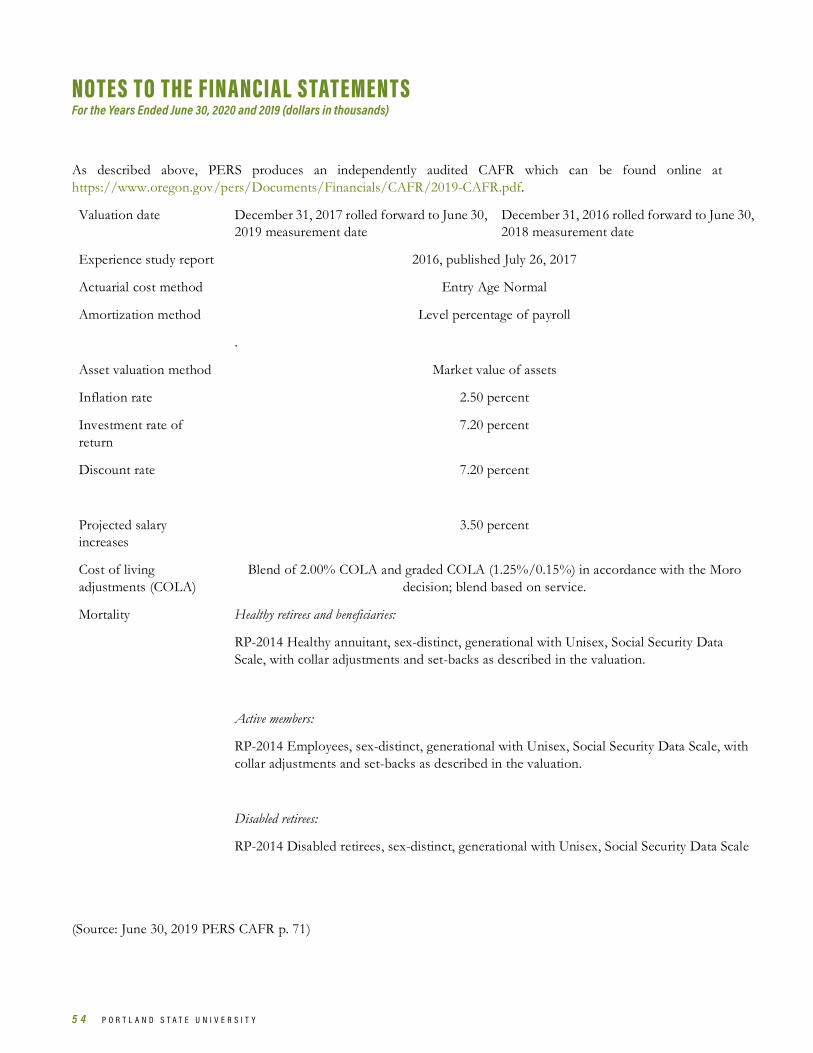
5 4 P O R T L A N D S T A T E U N I V E R S I T Y
NOTES TO THE FINANCIAL STATEMENTS For the Years Ended June 30, 2020 and 2019 (dollars in thousands)Notes to the Financial Statements For the Years Ended June 30, 2020 and 2019 (dollars in thousands)
D. Pension Plan CAFR:
As described above, PERS produces an independently audited CAFR which can be found online at https://www.oregon.gov/pers/Documents/Financials/CAFR/2019-CAFR.pdf.
Valuation date December 31, 2017 rolled forward to June 30, 2019 measurement date
December 31, 2016 rolled forward to June 30, 2018 measurement date
Experience study report 2016, published July 26, 2017
Actuarial cost method Entry Age Normal
Amortization method Level percentage of payroll
.
Asset valuation method Market value of assets
Inflation rate 2.50 percent
Investment rate of return
7.20 percent
Discount rate 7.20 percent
Projected salary increases
3.50 percent
Cost of living adjustments (COLA)
Blend of 2.00% COLA and graded COLA (1.25%/0.15%) in accordance with the Moro decision; blend based on service.
Mortality Healthy retirees and beneficiaries:
RP-2014 Healthy annuitant, sex-distinct, generational with Unisex, Social Security Data Scale, with collar adjustments and set-backs as described in the valuation.
Active members:
RP-2014 Employees, sex-distinct, generational with Unisex, Social Security Data Scale, with collar adjustments and set-backs as described in the valuation.
Disabled retirees:
RP-2014 Disabled retirees, sex-distinct, generational with Unisex, Social Security Data Scale
(Source: June 30, 2019 PERS CAFR p. 71)
2 0 2 0 A N N U A L F I N A N C I A L R E P O R T 5 5
NOTES TO THE FINANCIAL STATEMENTS For the Years Ended June 30, 2020 and 2019 (dollars in thousands)Notes to the Financial Statements For the Years Ended June 30, 2020 and 2019 (dollars in thousands)
Actuarial valuations of an ongoing plan involve estimates of the value of projected benefits and assumptions about the probability of events far into the future. Actuarially determined amounts are subject to continual revision as actual results are compared to past expectations and new estimates are made about the future. Experience studies are performed as of December 31 of even numbered years. The methods and assumptions shown above are based on the 2016 Experience Study, which reviewed experience for the four-year period ending December 31, 2016.
Discount Rate
The discount rate used to measure the total pension liability reported at June 30, 2020 and 2019 was 7.20 present. The projection of cash flows used to determine the discount rate assumed that contributions from plan members and those of the contributing employers are made at the contractually required rates, as actuarially determined. Based on those assumptions, the pension plan’s fiduciary net position was projected to be available to make all projected future benefit payments of current plan members. Therefore, the long-term expected rate of return on pension plan investments for the defined benefit pension plan was applied to all periods of projected benefit payments to determine the total pension liability.
(Source: June 30, 2019 PERS CAFR; p. 72)
Long-Term Expected Rate of Return
To develop an analytical basis for the selection of the long-term expected rate of return assumption, in July 2017 the PERS Board reviewed long-term assumptions developed by both Milliman’s capital market assumptions team and the OIC’s investment advisors. The table below shows Milliman’s assumptions for each of the asset classes in which the plan was invested at that time based on the OIC long-term target asset allocation (presented below under Investments). The OIC’s description of each asset class was used to map the target allocation to the asset classes shown below. Each asset class assumption is based on a consistent set of underlying assumptions, and includes adjustment for the inflation assumption. These assumptions are not based on historical returns, but instead are based on a forward-looking capital market economic model.
(Source: June 30, 2019 PERS CAFR; p. 72)

5 6 P O R T L A N D S T A T E U N I V E R S I T Y
NOTES TO THE FINANCIAL STATEMENTS For the Years Ended June 30, 2020 and 2019 (dollars in thousands)Notes to the Financial Statements For the Years Ended June 30, 2020 and 2019 (dollars in thousands)
(Source: June 30, 2019 PERS CAFR; p. 74)
F. Sensitivity Analysis:
The sensitivity analysis below shows the sensitivity of the university’s proportionate share of the net pension liability calculated using the discount rate of 7.20 percent as of June 30, 2020 and 2019, respectively, if it were calculated using a discount rate that is one percent lower or one percent higher than the current rate:
Asset Class TargetCompound
Annual Return (Geometric)
Core Fixed Income 8.00% 3.49%Short-Term Bonds 8.00 3.38 Bank/Leveraged Loans 3.00 5.09 High Yield Bonds 1.00 6.45 Large/Mid Cap US Equities 15.75 6.30 Small Cap US Equities 1.31 6.69 Micro Cap US Equities 1.31 6.80 Developed Foreign Equities 13.13 6.71 Emerging Market Equities 4.13 7.45 Non-US Small Cap Equities 1.88 7.01 Private Equity 17.50 7.82 Real Estate (Property) 10.00 5.51 Real Estate (REITS) 2.50 6.37 Hedge Fund of Funds - Diversified 2.50 4.09 Hedge Fund - Event-driven 0.63 5.86 Timber 1.88 5.62 Farmland 1.88 6.15 Infrastructure 3.75 6.60 Commodities 1.88 3.84
Assumed Inflation – Mean 2.50%
Sensitivity of Net Pension Liability to Changes in the Discount Rate
1% Decrease
Current Discount
Rate
1% Increase
1% Decrease
Current Discount
Rate
1% Increase
6.20% 7.20% 8.20% 6.20% 7.20% 8.20%PSU's Proportionate Share of Net Pension Liability $ 237,628 $ 148,387 $ 73,703 $ 217,619 $ 130,218 $ 58,076
June 30, 2020 June 30, 2019

2 0 2 0 A N N U A L F I N A N C I A L R E P O R T 5 7
NOTES TO THE FINANCIAL STATEMENTS For the Years Ended June 30, 2020 and 2019 (dollars in thousands)Notes to the Financial Statements For the Years Ended June 30, 2020 and 2019 (dollars in thousands)
G. Summary of Significant Accounting Policies for PERS/OPSRP:
Reporting Entity
PERS’ financial statements are prepared on the basis of a fiscal year ended June 30. The State Treasurer has statutory responsibility for custody and investment of PERS assets. As a result of this fiduciary responsibility, PERS is included as part of the primary government in the State’s CAFR.
Basis of Presentation
The PERS’ financial statements are prepared in accordance with GASB Statements and GAAP that apply to governmental accounting for fiduciary and enterprise funds.
Basis of Accounting
The accrual basis of accounting is used. Revenues are recognized when earned. Contributions are recognized when due, pursuant to legal (or statutory) requirements. Expenses are recognized when incurred. Benefits are recognized in the month they are due and payable. Withdrawals are recognized in the month they are due and payable.
Investments
ORS 293.706 established OIC, which consists of five voting members. Four members of the council, who are qualified by training and experience in the field of investment or finance, are appointed by the governor subject to state Senate confirmation. The State Treasurer serves as the council’s remaining voting member. In addition, the director of the PERS serves as a non-voting OIC member. The asset allocation policy approved by the OIC as of June 30, 2019 is as follows:
(Source: June 30, 2019 PERS CAFR; p. 100)
Investments are recognized at fair value, the amount that could be received to sell an asset or paid to transfer a liability in an orderly transaction between market participants at the measurement date. Refer to June 30, 2019 PERS CAFR for information regarding the valuation of the various investments and investment related disclosures.
Asset Allocation PolicyLow
Range High
Range OIC
Target Cash 0.0% 3.0% 0.0%Debt Securities 15.0% 25.0% 20.0%Public Equity 32.5% 42.5% 37.5%Real Estate 9.5% 15.5% 12.5%Private Equity 14.0% 21.5% 17.5%Alternative Equity 0.0% 12.5% 12.5%Opportunity Portfolio 0.0% 3.0% 0.0%Total 100.0%

5 8 P O R T L A N D S T A T E U N I V E R S I T Y
NOTES TO THE FINANCIAL STATEMENTS For the Years Ended June 30, 2020 and 2019 (dollars in thousands)Notes to the Financial Statements For the Years Ended June 30, 2020 and 2019 (dollars in thousands)
Due to the inherent uncertainty and the degree of judgment involved in determining private equity, opportunity, alternatives, and real estate portfolio investment valuations, the fair values reflected in the PERS financial statements may differ significantly from values that would have been used had a readily determinable market value for the investments existed and the difference could be material. In addition, these investments are generally considered to be illiquid long-term investments, and the recorded fair values may materially differ from the amounts that eventually may be realized from the sale or other disposition of these investments.
OIC has approved the following asset classes for the Oregon Public Employees Retirement Fund (OPERF): Short-Term Investments, Fixed Income, Real Estate, Public and Private Equities, and Alternative Investments. In addition, the OPERF invests in the Opportunity Portfolio which may be populated with investment approaches across a wide range of investment opportunities with no limitation as to asset classes or strategies. OIC must approve, in advance, the purchase of investments in a new asset class not described above.
As of the June 30, 2019 measurement date, PERS did not hold investments in any one organization that represent 5 percent of more of PERS’ fiduciary net position or total investments.
H. Deferred Items:
Deferred items are calculated at the system-wide and employer-specific level and are allocated based on proportionate share. For the measurement period ending June 30, 2019 and 2018, deferred items were due to the following:
• Differences between expected and actual experience
• Changes in assumptions
• Net difference between projected and actual earnings on investments
• Changes in proportion and differences between fund contributions and proportionate share of contributions
• Contributions subsequent to the measurement date of June 30, 2019
Experience gains and losses, changes in assumptions, changes in employer’s proportionate share of contributions and changes in employer proportion are amortized over the average remaining service lives of all plan participants, including retirees, determined as of the beginning of the respective measurement period. Employers are required to recognize pension expense based on the balance of the closed period “layers” attributable to each measurement period. The average remaining service lives determined as of the beginning of each measurement period are as follows:
• Measurement period ended June 30, 2019 – 5.2 years • Measurement period ended June 30, 2018 – 5.2 years • Measurement period ended June 30, 2017 – 5.3 years • Measurement period ended June 30, 2016 – 5.3 years • Measurement period ended June 30, 2015 – 5.4 years • Measurement period ended June 30, 2014 – 5.6 years
Differences between projected and actual earnings are amortized over a closed five-year period with one year’s amortization recognized in the year in which the difference arose.
Contributions subsequent to the measurement date will be fully recognized as a reduction of net pension liability in the subsequent year.
(Source: June 30, 2019 PERS GASB No. 68 report)

2 0 2 0 A N N U A L F I N A N C I A L R E P O R T 5 9
NOTES TO THE FINANCIAL STATEMENTS For the Years Ended June 30, 2020 and 2019 (dollars in thousands)Notes to the Financial Statements For the Years Ended June 30, 2020 and 2019 (dollars in thousands)
The composition of PSU’s deferred outflows (inflows) related to the defined benefit plans were as follows:
PSU net deferred outflows to be recognized over the next five years and thereafter are as follows as of June 30, 2020:
I. Independent Auditors Report:
The independent auditors’ report on the Schedule of Allocations (Proportionate Shares) and Schedule of Pension Amounts is published on the PERS employer website at: http://www.oregon.gov/pers/EMP/Pages/GASB.aspx
J. Net Pension Liability and Pension Expense:
As of the December 31, 2018 actuarial valuation, PERS had a funded ratio of 75.0 percent for the defined benefit plan it administers, including employer side accounts, and 69.0 percent excluding employer side accounts. Net pension liabilities are calculated at the system-wide level and are allocated to employers based on their proportionate share using the methodology described in the PERS GASB No. 68 independent auditors’ report that can be found at the link provided above. PERS does not provide PSU an audited proportionate share as a separate employer; rather, PSU is allocated a proportionate share of PERS employer State agencies.
Deferred Outflows of Resources
Deferred Inflows of Resources
Deferred Outflows of Resources
Deferred Inflows of Resources
Changes in employers' proportion and differences between the employer's contributions and employer's proportionate share of contributions 3,595$ (13,913)$ 5,454$ (16,943)$ Changes in assumptions 20,130 - 30,275 - Differences between expected and actual earnings on pension plan investments - (4,207) - (5,782) Differences between expected and actual experience 8,183 - 4,430 - Employer's contributions subsequent to measurement date 17,082 - 13,108 -
48,990$ (18,120)$ 53,267$ (22,725)$
June 30, 2020 June 30, 2019
Net deferred outflows to be recognized over next five years and thereafter:2021 11,572$ 2022 (1,296) 2023 801 2024 2,517 2025 194 Thereafter - Total future expense 13,788$
Amount of deferred outflows resulting from contributions subsequent to the measurement date to be included as a future decrease in net pension liability during fiscal year ended June 30, 2021 17,082$

6 0 P O R T L A N D S T A T E U N I V E R S I T Y
NOTES TO THE FINANCIAL STATEMENTS For the Years Ended June 30, 2020 and 2019 (dollars in thousands)Notes to the Financial Statements For the Years Ended June 30, 2020 and 2019 (dollars in thousands)
DAS calculated PSU’s proportionate share of all State agencies internally based on actual contributions by PSU as compared to the total for employer State agencies. The Oregon Audits Division reviewed this internal calculation. PSU’s system-wide proportionate share of the defined benefit pension obligation was as follows:
L. Changes in Plan Provisions Subsequent to Measurement Date:
There were no changes subsequent to the measurement date. The PERS Board reviews the discount rate in odd-numbered years as part of the Board’s adoption of actuarial methods and assumptions. The discount rate is then adopted in an administrative rule at the time the Board sets the new rate.
14. OTHER POSTEMPLOYMENT BENEFITS
During the years ended June 30, 2020 and 2019, PSU was as a participant in the State’s defined benefit postemployment health care plan administered by the Public Employees Benefit Board (PEBB), as well as the Retirement Health Insurance Account (RHIA) and Retiree Health Insurance Premium Account (RHIPA) postemployment health care plans administered by PERS. As described in Note 1, PSU adopted GASB No. 75 effective July 1, 2017 requiring liabilities to be reported for these defined benefit plans net of any applicable trust assets on the Statement of Net Position. Prior to the adoption of GASB No. 75, PSU accounted for its obligations associated with the PEBB plan under GASB No. 45.
A. PERS (RHIA and RHIPA)
Plan Descriptions
The PERS Board contracts for health insurance coverage on behalf of eligible PERS members. Eligible retirees pay their own age-adjusted premiums. To help retirees defray the cost of these premiums, PERS administers two separate defined benefit OPEB plans: the RHIA and the RHIPA. Only Tier One and Tier Two PERS members are eligible to participate in the RHIA and RHIPA plans. Refer to Note 13 for details concerning Tier One and Tier Two membership in PERS.
The RHIA is a cost-sharing multiple-employer defined benefit OPEB plan for financial reporting purposes. Established under ORS 238.420, the plan provides a payment of up to $60 toward the monthly cost of health insurance for eligible PERS members. To be eligible to receive the RHIA subsidy, the member must (1) have eight years or more of qualifying service in PERS at the time of retirement or receive a disability allowance as if the member had eight years or more of creditable service in PERS, (2) receive both Medicare parts A and B coverage, and (3) enroll in a PERS-sponsored health plan. A surviving spouse or dependent of a deceased PERS retiree who was eligible to receive the subsidy is eligible to receive the subsidy if he or she (1) is receiving a retirement benefit or allowance from PERS or (2) was insured at the time the member died and the member retired before May 1, 1991. The Oregon Legislature has sole authority to amend the benefit provisions and employer obligations for the RHIA plan.
2020 2019
Employer's proportionate share of collective net pension liability 148,387$ 130,218$ Employer's proportionate % share of collective net pension liability 0.86% 0.86%Employer's pension expense 34,922$ 22,648$
June 30,

2 0 2 0 A N N U A L F I N A N C I A L R E P O R T 6 1
NOTES TO THE FINANCIAL STATEMENTS For the Years Ended June 30, 2020 and 2019 (dollars in thousands)Notes to the Financial Statements For the Years Ended June 30, 2020 and 2019 (dollars in thousands)
Established under ORS 238.415, the RHIPA is also a cost-sharing multiple-employer defined benefit OPEB plan for financial reporting purposes. The plan provides payment of the average difference between the health insurance premiums paid by retired State employees under contracts entered into by the PERS Board and health insurance premiums paid by State employees who are not retired. PERS members are qualified to receive the RHIPA subsidy if they have eight or more years of qualifying service in PERS at the time of retirement or receive a disability pension calculated as if they had eight or more years of qualifying service, but are not eligible for federal Medicare coverage. A surviving spouse or dependent of a deceased retired State employee is eligible to receive the subsidy if he or she (1) is receiving a retirement benefit or allowance from PERS or (2) was insured at the time the member died and the member retired on or after September 29, 1991. The Oregon Legislature has sole authority to amend the benefit provisions and employer obligations of the RHIPA plan.
Both RHIA and RHIPA are closed to employees hired on or after August 29, 2003, who had not established membership prior to that date.
OPEB Plans Report
The RHIA and RHIPA defined benefit OPEB plans are reported separately under Other Employee Benefit Trust Funds in the fiduciary funds combining statements and as part of the Pension and Other Employee Benefit Trust in the state’s Comprehensive Annual financial Report. PERS issues a separate, publicly available financial report that includes audited financial statements and required supplementary information. The report may be obtained by writing to the Public Employees Retirement System, Fiscal Services Division, PO Box 23700, Tigard, OR 97281-3700. The report may also be accessed online at: http://www.oregon.gov/pers/Pages/Financials/Actuarial-Financial-Information.aspx
Basis of Accounting
The financial statements for the PERS OPEB plans are prepared using the accrual basis of accounting. Employer contributions to PERS are calculated based on creditable compensation for active members reported by employers. Employer contributions are accrued when due pursuant to legal requirements. Benefits are recognized in the month they are due and payable.
Investments
Investments are recognized at fair value. Refer to Note 13. G. for additional information.
Proportionate Share Allocation Methodology
The basis for the employer’s proportion is determined by comparing the employer’s actual, legally required contributions made during the fiscal year to the Plan with the total actual contributions made in the fiscal year of all employers.
Measurement Date
The measurement date for the PERS plans is one year prior to the fiscal year end date. All references to balances at June 30, 2020 are based upon a June 30, 2019 measurement date and all references to balances at June 30, 2019 are based upon a June 30, 2018 measurement date.

6 2 P O R T L A N D S T A T E U N I V E R S I T Y
NOTES TO THE FINANCIAL STATEMENTS For the Years Ended June 30, 2020 and 2019 (dollars in thousands)Notes to the Financial Statements For the Years Ended June 30, 2020 and 2019 (dollars in thousands)
OPEB Plan (Asset)/Liability
The components of the State’s total net OPEB liability (asset) for the State’s OPEB plans are as follows (in millions):
Contributions
Both of the OPEB plans administered by PERS are funded through actuarially determined employer contributions.
For the fiscal year ended June 30, 2020, the university contributed .06 percent of PERS-covered payroll for Tier One and Tier Two plan members to fund the normal cost portion of RHIA benefits. For fiscal year ended June 30, 2019, the university contributed 0.07 percent of PERS-covered payroll for Tier One and Tier Two plan members to fund the normal cost portion of RHIA benefits and contributed 0.43 percent of all PERS-covered payroll to amortize the unfunded actuarial accrued liability over a fixed period with new unfunded actuarial accrued liabilities amortized over 20 years. The required employer contributions were approximately $19 and $537 for the year ended June 30, 2020 and 2019, respectively. The actual contribution equaled the annual required contribution for the fiscal year.
For the fiscal year ended June 30, 2020, the university contributed 0.12 percent of PERS-covered payroll for Tier One and Tier Two plan members to fund the normal cost portion of RHIPA benefits. In addition, the university contributed 0.27 percent of all PERS-covered payroll to amortize the unfunded actuarial accrued liability over a fixed period with new unfunded actuarial accrued liabilities amortized over 20 years. For the fiscal year ended June 30, 2019, the university contributed 0.11 percent of PERS-covered payroll for Tier One and Tier Two plan members to fund the normal cost portion of RHIPA benefits. In addition, the university contributed 0.38 percent of all PERS-covered payroll to amortize the unfunded actuarial accrued liability over a fixed period with new unfunded actuarial accrued liabilities amortized over 20 years. The required employer contribution were approximately $363 and $491 for the year ended June 30, 2020 and 2019, respectively. The actual contribution equaled the annual required contribution for the fiscal year.
Net OPEB - RHIA (Asset)June 30,
2020 Net OPEB - RHIPA LiabilityJune 30,
2020Total OPEB - RHIA Liability 435.6$ Total OPEB - RHIPA Liability 72.0$ Plan Fiduciary Net Position 628.9 Plan Fiduciary Net Position 46.7 Plan Net OPEB - RHIA (Asset) (193.3)$ Plan Net OPEB - RHIA Liability 25.3$
Plan net position as % of Total OPEB Liability 144.4% 64.9%
Net OPEB - RHIA (Asset)June 30,
2019 Net OPEB - RHIPA LiabilityJune 30,
2019Total OPEB - RHIA Liability 465.2$ Total OPEB - RHIPA Liability 70.3$ Plan Fiduciary Net Position 576.8 Plan Fiduciary Net Position 35.0 Plan Net OPEB - RHIA (Asset) (111.6)$ Plan Net OPEB - RHIA Liability 35.3$
Plan net position as % of Total OPEB Liability 124.0% 49.8%
2 0 2 0 A N N U A L F I N A N C I A L R E P O R T 6 3
NOTES TO THE FINANCIAL STATEMENTS For the Years Ended June 30, 2020 and 2019 (dollars in thousands)Notes to the Financial Statements For the Years Ended June 30, 2020 and 2019 (dollars in thousands)
Net OPEB Asset/Liability
a. RHIA
At June 30, 2020, PSU reported an asset of $2,170 for its proportionate share of the RHIA net OPEB asset. The net OPEB asset as of June 30, 2020 was measured as of June 30, 2019, and the total OPEB asset used to calculate the net OPEB asset was determined by an actuarial valuation as of December 31, 2017. At June 30, 2019, PSU reported an asset of $1,167 for its proportionate share of the RHIA net OPEB asset. The net OPEB asset as of June 30, 2019 was measured as of June 30, 2018, and the total OPEB asset used to calculate the net OPEB asset was determined by an actuarial valuation as of December 31, 2016. The PERS system does not provide PSU an audited proportionate share as a separate employer; rather, PSU is allocated a proportionate share of PERS employer state agencies. DAS calculated PSU’s proportionate share of all state agencies internally based on actual contributions by PSU as compared to the total for employer state agencies. The Oregon Audits Division reviewed this internal calculation. At June 30, 2020 and 2019, PSU’s proportion was 1.12 and 1.05, respectively, of the statewide OPEB plan.
For the year ended June 30, 2020 and 2019, PSU recorded total OPEB benefit of $300 and $100, respectively, due to the change in the net RHIA OPEB asset, changes to deferred outflows and inflows and amortization of previously deferred amounts.
b. RHIPA
At June 30, 2020, PSU reported a liability of $902 for its proportionate share of the RHIPA net OPEB liability. The net OPEB liability as of June 30, 2020 was measured as of June 30, 2019, and the total OPEB liability used to calculate the net OPEB liability was determined by an actuarial valuation as of December 31, 2017.At June 30, 2019, PSU reported a liability of $1,249 for its proportionate share of the RHIPA net OPEB liability. The net OPEB liability as of June 30, 2019 was measured as of June 30, 2018, and the total OPEB liability used to calculate the net OPEB liability was determined by an actuarial valuation as of December 31, 2016. The PERS system does not provide PSU an audited proportionate share as a separate employer; the University is allocated a proportionate share of PERS employer state agencies. DAS calculated PSU’s proportionate share of all state agencies internally based on actual contributions by PSU as compared to the total for employer state agencies. The Oregon Audits Division reviewed this internal calculation. At June 30, 2020 and 2019, PSU’s proportion was 3.56 and 3.53, respectively, of the statewide OPEB plan.
For the year ended June 30, 2020 and 2019, PSU recorded total OPEB expense of $115 and $147, respectively, due to the changes to the net RHIPA OPEB liability, deferred outflows and inflows and amortization of previously deferred amounts.
Deferred Items
A. RHIA
Some deferred inflows of resources and deferred outflows of resources are calculated at the system-wide level and are allocated to employers based on their proportionate share, others are calculated at the employer level. For the measurement period ended June 30, 2019, there were:
• Difference between expected and actual experience • Difference due to changes in assumptions • Changes in employer proportion since the prior measurement date • A difference between employer contributions and proportionate share of contributions • Net difference between projected and actual OPEB plan investment earnings • Contributions subsequent to the measurement date
Experience gains and losses, changes in assumption, changes in employer’s proportionate share of contributions and changes in employer proportion are amortized over the average remaining service lives of all plan participants, including retirees, determined as of the beginning of the respective measurement period. Employers are required to recognize OPEB expense based on the balance of the closed period “layers” attributable to each measurement period.
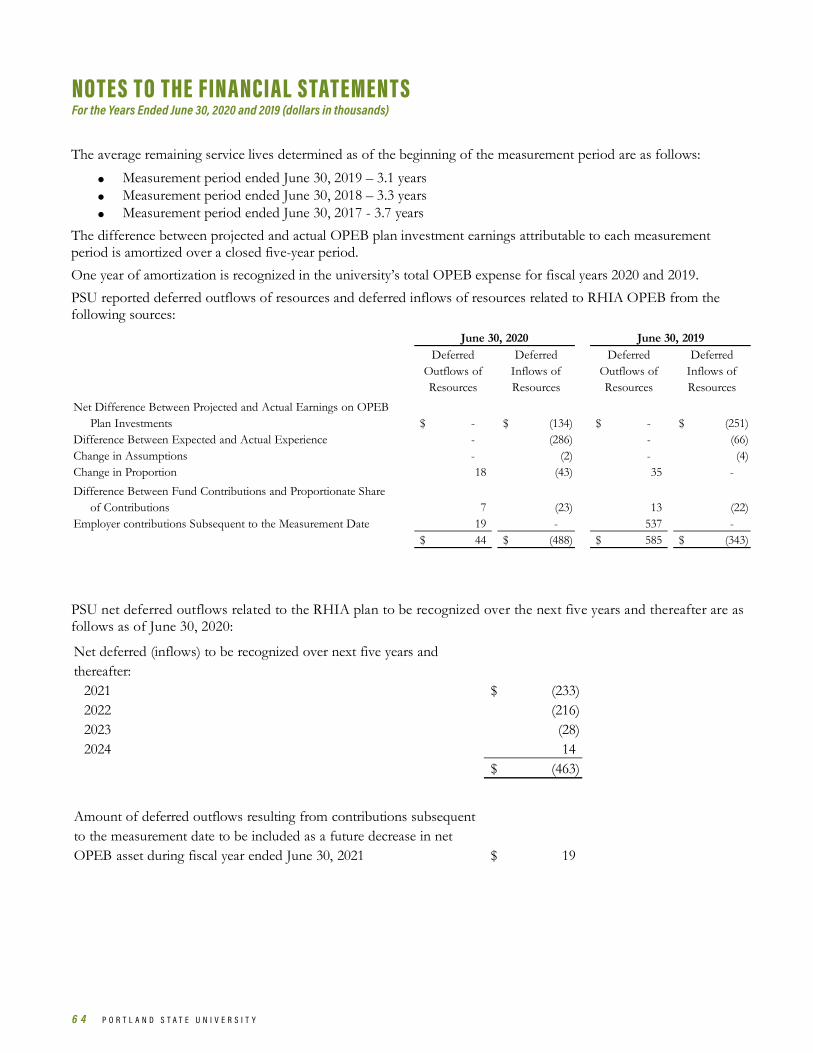
6 4 P O R T L A N D S T A T E U N I V E R S I T Y
NOTES TO THE FINANCIAL STATEMENTS For the Years Ended June 30, 2020 and 2019 (dollars in thousands)Notes to the Financial Statements For the Years Ended June 30, 2020 and 2019 (dollars in thousands)
The average remaining service lives determined as of the beginning of the measurement period are as follows:
• Measurement period ended June 30, 2019 – 3.1 years • Measurement period ended June 30, 2018 – 3.3 years • Measurement period ended June 30, 2017 - 3.7 years
The difference between projected and actual OPEB plan investment earnings attributable to each measurement period is amortized over a closed five-year period. One year of amortization is recognized in the university’s total OPEB expense for fiscal years 2020 and 2019. PSU reported deferred outflows of resources and deferred inflows of resources related to RHIA OPEB from the following sources:
PSU net deferred outflows related to the RHIA plan to be recognized over the next five years and thereafter are as follows as of June 30, 2020:
Deferred Outflows of Resources
Deferred Inflows of Resources
Deferred Outflows of Resources
Deferred Inflows of Resources
Net Difference Between Projected and Actual Earnings on OPEB Plan Investments -$ (134)$ -$ (251)$ Difference Between Expected and Actual Experience - (286) - (66) Change in Assumptions - (2) - (4) Change in Proportion 18 (43) 35 - Difference Between Fund Contributions and Proportionate Share of Contributions 7 (23) 13 (22) Employer contributions Subsequent to the Measurement Date 19 - 537 -
44$ (488)$ 585$ (343)$
June 30, 2020 June 30, 2019
Net deferred (inflows) to be recognized over next five years and thereafter:
2021 (233)$ 2022 (216) 2023 (28) 2024 14
(463)$
Amount of deferred outflows resulting from contributions subsequent to the measurement date to be included as a future decrease in net OPEB asset during fiscal year ended June 30, 2021 19$

2 0 2 0 A N N U A L F I N A N C I A L R E P O R T 6 5
NOTES TO THE FINANCIAL STATEMENTS For the Years Ended June 30, 2020 and 2019 (dollars in thousands)Notes to the Financial Statements For the Years Ended June 30, 2020 and 2019 (dollars in thousands)
B. RHIPA
Some deferred inflows of resources and deferred outflows of resources are calculated at the system-wide level and are allocated to employers based on their proportionate share, others are calculated at the employer level. For the measurement period ended June 30, 2019, there were:
• Difference due to changes in assumptions • Difference between expected and actual experience • Changes in employer proportion since the prior measurement date • Difference between employer contributions and proportionate share of contributions • Net difference between projected and actual OPEB plan investment earnings • Contributions subsequent to the measurement date
Experience gains and losses, changes in assumption, changes in employer’s proportionate share of contributions and change in employer proportion are amortized over the average remaining service lives of all plan participants, including retirees, determined as of the beginning of the respective measurement period. Employers are required to recognize OPEB expense based on the balance of the closed period “layers” attributable to each measurement period. The average remaining service lives determined as of the beginning of the measurement period are as follows:
• Measurement period ended June 30, 2019 – 6.7 years • Measurement period ended June 30, 2018 – 6.9 years • Measurement period ended June 30, 2017 - 7.2 years
The difference between projected and actual OPEB plan investment earnings attributable to each measurement period is amortized over a closed five-year period. One year of amortization is recognized in the university’s total OPEB expense for fiscal years 2020 and 2019. PSU reported deferred outflows of resources and deferred inflows of resources related to RHIPA OPEB from the following sources:
Deferred Outflows of Resources
Deferred Inflows of Resources
Deferred Outflows of Resources
Deferred Inflows of Resources
Net Difference Between Projected and Actual Earnings on OPEB Plan Investments -$ (3)$ -$ (21)$ Difference Between Expected and Actual Experience - (86) (92) Change in Assumptions 11 - 13 Change in Proportion 73 (91) 81 (109) Difference Between Fund Contributions and Proportionate Share of Contributions 5 (20) 6 (17) Employer Contributions Subsequent to the Measurement Date 363 - 490 -
452$ (200)$ 590$ (239)$
June 30, 2020 June 30, 2019
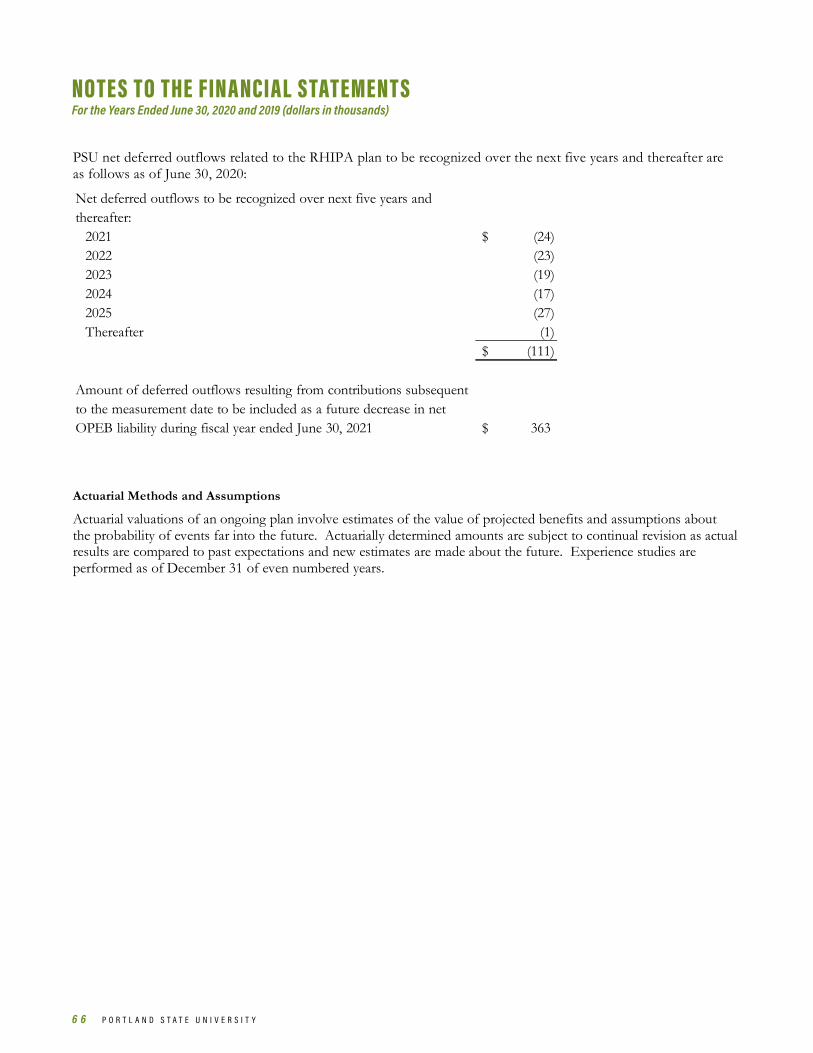
6 6 P O R T L A N D S T A T E U N I V E R S I T Y
NOTES TO THE FINANCIAL STATEMENTS For the Years Ended June 30, 2020 and 2019 (dollars in thousands)Notes to the Financial Statements For the Years Ended June 30, 2020 and 2019 (dollars in thousands)
PSU net deferred outflows related to the RHIPA plan to be recognized over the next five years and thereafter are as follows as of June 30, 2020:
Actuarial Methods and Assumptions
Actuarial valuations of an ongoing plan involve estimates of the value of projected benefits and assumptions about the probability of events far into the future. Actuarially determined amounts are subject to continual revision as actual results are compared to past expectations and new estimates are made about the future. Experience studies are performed as of December 31 of even numbered years.
Net deferred outflows to be recognized over next five years and thereafter:
2021 (24)$ 2022 (23) 2023 (19) 2024 (17) 2025 (27) Thereafter (1)
(111)$
Amount of deferred outflows resulting from contributions subsequent to the measurement date to be included as a future decrease in net OPEB liability during fiscal year ended June 30, 2021 363$

2 0 2 0 A N N U A L F I N A N C I A L R E P O R T 6 7
NOTES TO THE FINANCIAL STATEMENTS For the Years Ended June 30, 2020 and 2019 (dollars in thousands)Notes to the Financial Statements For the Years Ended June 30, 2020 and 2019 (dollars in thousands)
The following methods and assumptions were used to measure the total RHIA OPEB asset:
Valuation date December 31, 2017 rolled forward to June 30, 2019 measurement date
December 31, 2016 rolled forward to June 30, 2018 measurement date
Experience study report 2016, published July 26, 2017
Actuarial cost method Entry Age Normal
Inflation rate 2.50 percent
Long-Term Expected Rate of Return
7.20 percent
Discount rate 7.20 percent
Projected salary increases
3.50 percent
Retiree Healthcare Healthy Retirees: 35 percent Healthy Retirees: 38 percent
Participation Disabled Retirees: 20 percent
Healthcare Cost Trend Rate
Not Applicable
Mortality Healthy retirees and beneficiaries:
RP-2014 Healthy annuitant, sex-distinct, generational with Unisex, Social Security Data Scale, with collar adjustments and set-back as described in the valuation.
RP-2000 sex-distinct, generational per Scale BB, with collar adjustments and set-backs as described in the valuation
Active members:
RP-2014 Employees, sex-distinct, generational with Unisex, Social Data Scale, with collar adjustments and set-backs as described in the valuation.
Mortality rates are a percentage of healthy retiree rates that vary by group, as described in the valuation
Disabled retirees:
RP-2014 Disabled retirees, sex-distinct, generational with Unisex, Social Security Data Scale.
Mortality rates are a percentage (70% for males, 95% for females) of the RP-2000 sex-distinct generational per Scale BB disable mortality table.
(Source: 2019 PERS CAFR, table 29, page 73)

6 8 P O R T L A N D S T A T E U N I V E R S I T Y
NOTES TO THE FINANCIAL STATEMENTS For the Years Ended June 30, 2020 and 2019 (dollars in thousands)Notes to the Financial Statements For the Years Ended June 30, 2020 and 2019 (dollars in thousands)
The following methods and assumptions were used to measure the total RHIPA OPEB liability:
Valuation date December 31, 2017 rolled forward to June 30, 2019 measurement date
December 31, 2016 rolled forward to June 30, 2018 measurement date
Experience study report 2016, published July 26, 2017
Actuarial cost method Entry Age Normal
Inflation rate 2.50 percent
Long-Term Expected Rate of Return
7.20 percent
Discount rate 7.20 percent
Projected salary increases
3.50 percent
Retiree Healthcare Participation
8-14 Years of Service: 10.0% 15-19 Years of Service: 18.0% 20-24 Years of Service: 23.0% 25-29 Years of Service: 29.0% 30 + Years of Service: 38.0%
.
Healthcare cost trend rate
Applied at beginning of plan year, starting with 7.5% for 2017, decreasing to 5.2% for 2024, increasing to 6.2% for 2029, and decreasing to an ultimate rate of 4.2% for 2093
Applied at beginning of plan year, starting with 6.5% for 2018, decreasing to 5.9% for 2019, increasing to 6.2% for 2029, and decreasing to an ultimate rate of 4.2% for 2093 and beyond
Mortality Healthy retirees and beneficiaries:
RP-2014 Healthy annuitant, sex-distinct, generational with Unisex, Social Security Data Scale, with collar adjustments and set-backs as described in the valuation.
Active members:
RP-2014 Employees, sex-distinct, generational with Unisex, Social Security Data Scale, with collar adjustments and set-backs as described in the valuation.
Disabled retirees:
RP-2014 Disabled retirees, sex-distinct, generational with Unisex, Social Security Data Scale
(Source: 2019 PERS GASB75 RHIPA Rpt, page6)

2 0 2 0 A N N U A L F I N A N C I A L R E P O R T 6 9
NOTES TO THE FINANCIAL STATEMENTS For the Years Ended June 30, 2020 and 2019 (dollars in thousands)Notes to the Financial Statements For the Years Ended June 30, 2020 and 2019 (dollars in thousands)
Discount Rate
The discount rate used to measure the total OPEB liabilities at June 30, 2020 and 2019 was 7.20. The projection of cash flows used to determine the discount rate assumed that contributions from contributing employers are made at the contractually required rates, as actuarially determined. Based on those assumptions, the OPEB plans’ fiduciary net position was projected to be available to make all projected future benefit payments of current plan members. Therefore, the long-term expected rate of return on OPEB plan investments for the OPEB Plans was applied to all periods of projected benefit payments to determine the total OPEB liability.
Sensitivity Analysis
The sensitivity analysis below shows the sensitivity of the university’s proportionate share of the net OPEB liability/(asset) calculated using the discount rate of 7.20 percent as of June 30, 2020 and 2019, as well as what the net OPEB liability/(asset) would be if it were calculated using a discount rate that is one percent lower or one percent higher than the current rate:
The sensitivity analysis below shows the sensitivity of the university’s proportionate share of the net OPEB liability/(asset) calculated using the current healthcare cost trend rates, as well as what the net OPEB liability/(asset) would be if it were calculated using healthcare trend rates that are one percentage point lower, or one percentage point higher than the current rates:
Assumed Asset Allocation
Discount RateRHIA RHIPA RHIA RHIPA
1% Decrease to 6.5% ($1,683) $1,072 ($679) $1,400Current Discount Rate 7.5% (2,170) 902 (1,167) 1,249 1% Increase to 8.5% (2,586) 743 (1,582) 1,076
June 30, 2019June 30, 2020
Healthcare Cost RateRHIA RHIPA RHIA RHIPA
1% Decrease ($2,170) $678 ($1,167) $1,011Current Trend Rate (2,170) 902 (1,167) 1,249 1% Increase (2,170) 1,154 (1,167) 1,481
June 30, 2020 June 30, 2019
Asset Class/ StrategyDebt Securities 15.00 25.00 20.00Public Equity 32.50 42.50 37.50Private Equity 14.0 21.00 17.50Real Estate 9.50 15.50 12.50Alternative Equity 0.00 12.50 12.50Opportunity Portfolio
0.00 3.00 0.00
Total 100 %
Low Range
High Range
OIC Target
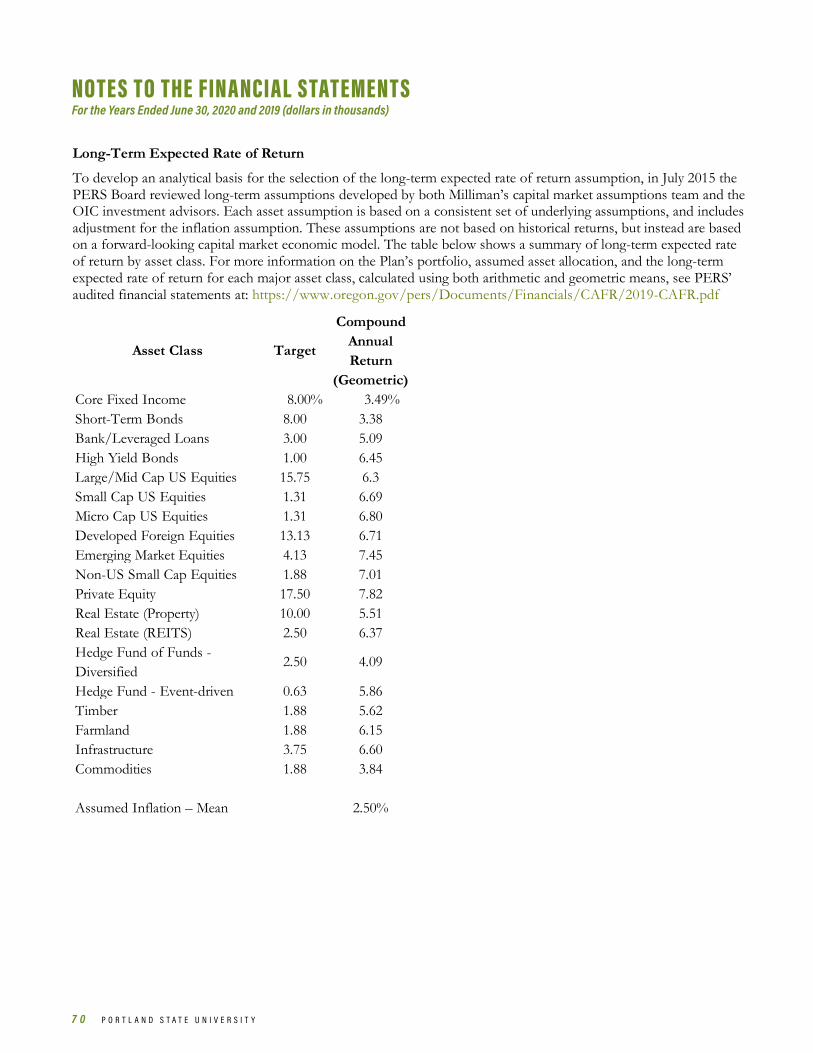
7 0 P O R T L A N D S T A T E U N I V E R S I T Y
NOTES TO THE FINANCIAL STATEMENTS For the Years Ended June 30, 2020 and 2019 (dollars in thousands)Notes to the Financial Statements For the Years Ended June 30, 2020 and 2019 (dollars in thousands)
Long-Term Expected Rate of Return
To develop an analytical basis for the selection of the long-term expected rate of return assumption, in July 2015 the PERS Board reviewed long-term assumptions developed by both Milliman’s capital market assumptions team and the OIC investment advisors. Each asset assumption is based on a consistent set of underlying assumptions, and includes adjustment for the inflation assumption. These assumptions are not based on historical returns, but instead are based on a forward-looking capital market economic model. The table below shows a summary of long-term expected rate of return by asset class. For more information on the Plan’s portfolio, assumed asset allocation, and the long-term expected rate of return for each major asset class, calculated using both arithmetic and geometric means, see PERS’ audited financial statements at: https://www.oregon.gov/pers/Documents/Financials/CAFR/2019-CAFR.pdf
Asset Class Target
Compound Annual Return
(Geometric)Core Fixed Income 8.00% 3.49%Short-Term Bonds 8.00 3.38Bank/Leveraged Loans 3.00 5.09High Yield Bonds 1.00 6.45Large/Mid Cap US Equities 15.75 6.3Small Cap US Equities 1.31 6.69Micro Cap US Equities 1.31 6.80Developed Foreign Equities 13.13 6.71Emerging Market Equities 4.13 7.45Non-US Small Cap Equities 1.88 7.01Private Equity 17.50 7.82Real Estate (Property) 10.00 5.51Real Estate (REITS) 2.50 6.37Hedge Fund of Funds - Diversified
2.50 4.09
Hedge Fund - Event-driven 0.63 5.86Timber 1.88 5.62Farmland 1.88 6.15Infrastructure 3.75 6.60Commodities 1.88 3.84
Assumed Inflation – Mean 2.50%

2 0 2 0 A N N U A L F I N A N C I A L R E P O R T 7 1
NOTES TO THE FINANCIAL STATEMENTS For the Years Ended June 30, 2020 and 2019 (dollars in thousands)Notes to the Financial Statements For the Years Ended June 30, 2020 and 2019 (dollars in thousands)
Depletion Date Projection
GASB Statement No. 75, Accounting and Financial Reporting for Postemployment Benefits Other Than Pensions, generally requires that a blended discount rate be used to measure the Total OPEB Liability (the Actuarial Accrued Liability calculated using the Individual Entry Age Normal Cost Method). The long-term expected return on plan investments may be used to discount liabilities to the extent that the plan’s Fiduciary Net Position (fair market value of assets) is projected to cover benefit payments and administrative expenses. A 20-year high quality (AA/Aa or higher) municipal bond rate must be used for periods where the Fiduciary Net Position is not projected to cover benefit payments and administrative expenses. Determining the discount rate under GASB Statement No. 75 will often require that the actuary perform complex projections of future benefit payments and asset values. GASB Statement No. 75 (paragraph 82) does allow for alternative evaluations of projected solvency, if such evaluation can reliably be made. GASB does not contemplate a specific method for making an alternative evaluation of sufficiency; it is left to professional judgment.
The following circumstances justify an alternative evaluation of sufficiency for Oregon PERS:
• Oregon PERS has a formal written policy to calculate an actuarially determined contribution (ADC), which is articulated in the actuarial valuation report.
• The ADC is based on a closed, layered amortization period, which means that payment of the full ADC each year will bring the plan to a 100 percent funded position by the end of the amortization period if future experience follows assumption.
• GASB Statement No. 75 specifies that the projections regarding future solvency assume that plan assets earn the assumed rate of return and there are no future changes in the plan provisions or actuarial methods and assumptions, which means that the projections would not reflect any adverse future experience that might impact the plan’s funded position.
Based on these circumstances, it is the independent actuary’s opinion that the detailed depletion date projections outlined in GASB Statement No. 75 would clearly indicate that the fiduciary net position is always projected to be sufficient to cover benefit payments and administrative expenses, as such, the long term expected rate of return was used to discount the liabilities.
Changes Subsequent to the Measurement
The university is not aware of any changes to benefit terms or actuarial methods and assumptions subsequent to the June 30, 2019 measurement date. B. Public Employees’ Benefit Board (PEBB)
Plan Description
The PEBB plan offers healthcare assistance to eligible retired state employees and their beneficiaries. Chapter 243 of the ORS gives PEBB the authority to establish and amend the benefit provisions of the PEBB Plan. The PEBB Plan is a single-employer plan treated as a cost-sharing multiple-employer plan for financial reporting purposes and has no assets accumulated in a trust that meets the criteria in GASB No. 75. PEBB does not issue a separate, publicly available financial report. The PEBB Plan allows qualifying retired employees to continue their “active” health insurance coverage on a self-pay basis until they are eligible for Medicare. Participating retirees pay their own monthly premiums. However, the premium amount is based on a blended rate that is determined by pooling the qualifying retirees with active employees, thus, creating an “implicit rate subsidy.”

7 2 P O R T L A N D S T A T E U N I V E R S I T Y
NOTES TO THE FINANCIAL STATEMENTS For the Years Ended June 30, 2020 and 2019 (dollars in thousands)Notes to the Financial Statements For the Years Ended June 30, 2020 and 2019 (dollars in thousands)
Changes in Total OPEB Plan Liability
The State’s total OPEB liability was determined by an actuarial valuation as of the valuation date, calculated based on the discount rate and actuarial assumptions, and was then projected forward to the measurement date.
Proportionate Share Allocation Methodology
The basis for the employer’s proportion is determined by comparing the employer’s actual contributions made during the fiscal year with the total actual contributions made in the fiscal year of all employers.
Total OPEB Liability
At June 30, 2020, the university reported a liability of $5,987 for its proportionate share of the total OPEB liability. The total OPEB liability as of June 30, 2020 was measured as of June 30, 2020, and was determined by an actuarial valuation as of July 1, 2019. At June 30, 2019, the university reported a liability of $6,794 for its proportionate share of the total OPEB liability. The total OPEB liability as of June 30, 2019 was measured as of June 30, 2019, and was determined by an actuarial valuation as of July 1, 2017. PEBB does not provide PSU an audited proportionate share as a separate employer; the university is allocated a proportionate share of PEBB participating employers. DAS calculated PSU’s proportionate share of all participating employers internally based on actual contributions by PSU as compared to the total for participating employers. The Oregon Audits Division reviewed this internal calculation. At June 30, 2019 and 2018, PSU’s proportion was 4.08 and 4.22 percent, respectively, of participating employers.
For the year ended June 30, 2020 and 2019, PSU recorded total OPEB expense of $462 and $574, respectively, due to the changes to the total OPEB liability, deferred inflows, and amortization of previously deferred amounts.
Deferred Items
Some deferred inflows of resources and deferred outflows of resources are calculated at the system-wide level and are allocated to employers based on their proportionate share, others are calculated at the employer level. For the measurement period ended June 30, 2019, there were:
• Changes in assumptions
• Changes in employer proportion since the prior measurement date Changes in assumption and changes in proportion are amortized over the closed period equal to the average expected remaining service lives of all covered active and inactive participants. Employers are required to recognize OPEB expense based on the balance of the closed period “layers” attributable to each measurement period. The weighted average expected remaining service lives, assuming zero years for all retirees, determined as of the beginning of the measurement period ended June 30, 2020 and 2019 was 8.6 years and 8.2 years, respectively. One year of amortization is recognized in the university’s total OPEB expense for fiscal years 2020 and 2019.
June 30, 2020 June 30, 2019Changes in State's Total OPEB Liability
Beginning Balance 161,171$ 148,563$
Changes for the year:Service cost 10,100 9,132 Interest on total OPEB liability 5,856 5,960 Effect of economic/demographic gains or losses (788) Effect of assumptions changes or inputs (21,720) 4,967 Benefit payments (7,923) (7,451)
Ending Balance 146,696$ 161,171$

2 0 2 0 A N N U A L F I N A N C I A L R E P O R T 7 3
NOTES TO THE FINANCIAL STATEMENTS For the Years Ended June 30, 2020 and 2019 (dollars in thousands)Notes to the Financial Statements For the Years Ended June 30, 2020 and 2019 (dollars in thousands)
PSU reported deferred outflows of resources and deferred inflows of resources related to OPEB from the following sources (in thousands):
PSU net deferred inflows related to the PEBB plan to be recognized over the next five years and thereafter are as follows as of June 30, 2020:
Deferred Outflows of Resources
Deferred Inflows of Resources
Deferred Outflows of Resources
Deferred Inflows of Resources
Difference Between Expected and Actual Experience
$ - $ (29)
Change in Assumptions 153 (879) 184$ (117)$ Change in Proportion - (583) - (463) Difference Between Fund Contributions and Proportionate Share of Contributions 29 -
Total 182$ (1,491)$ 184$ (580)$
July 30, 2020 July 30, 2019
Net deferred inflows to be recognized over next five years and thereafter:
2020 (190)$ 2021 (190) 2022 (190) 2023 (189) 2024 (189) Thereafter (361)
(1,309)$

7 4 P O R T L A N D S T A T E U N I V E R S I T Y
NOTES TO THE FINANCIAL STATEMENTS For the Years Ended June 30, 2020 and 2019 (dollars in thousands)Notes to the Financial Statements For the Years Ended June 30, 2020 and 2019 (dollars in thousands)
Actuarial Methods and Assumptions
Actuarial valuations of an ongoing plan involve estimates of the value of projected benefits and assumptions about the probability of events far into the future. Actuarially determined amounts are subject to continual revision as actual results are compared to past expectations and new estimates are made about the future.
Valuation date July 1, 2019 July 1, 2017
Measurement Date June 30, 2020 June 30, 2019
Actuarial cost method Entry Age Normal
Inflation rate 2.50 percent
Discount rate 2.21 percent 3.50 percent
Projected salary increases
3.50 percent
Withdrawal, retirement, and mortality rates
December 31, 2018 Oregon PERS valuation December 31, 2016 Oregon PERS valuation
Healthcare Cost Trend Rate
Pursuant to ORS 243.135(8), growth in per-member expenditures under self-insured
plans and premium amounts is assumed to be 3.40% per year.
Medical and vision cost increases:
0.80 percent in the first year; 5.10 percent in the second year; 5.30 percent in the third year; varying from 6.20 percent to 4.20 percent
Dental cost changes:
decrease 1.10% in the first year; over the remainder of the projection period
increase 3.10% in the second year; increase 4.00% per year thereafter
Election and lapse rates
30 percent of eligible employees 60 percent spouse coverage for males
35 percent for females 7 percent annual lapse rate
(Source: PEBB Valuation Report_July 1 2019; pages 8 and 18)

2 0 2 0 A N N U A L F I N A N C I A L R E P O R T 7 5
NOTES TO THE FINANCIAL STATEMENTS For the Years Ended June 30, 2020 and 2019 (dollars in thousands)Notes to the Financial Statements For the Years Ended June 30, 2020 and 2019 (dollars in thousands)
Discount Rate
Unfunded plans must use a discount rate that reflects a 20-year tax-exempt municipal bond yield or index rate. The Bond Buyer 20-Year General Obligation Bond Index was used to determine the discount rate for the OPEB liability. The discount rate in effect for the June 30, 2020 and 2019 reporting date is 2.21 and 3.50, respectively.
Sensitivity Analysis
The sensitivity analysis below shows the sensitivity of the university’s proportionate share of the total OPEB liability calculated using the discount rate of 2.21 percent as of June 30, 2020 and 3.50 percent as of June 30, 2019, as well as what the total OPEB liability would be if it were calculated using a discount rate that is one percent lower or one percent higher than the current rate:
The sensitivity analysis below shows the sensitivity of the university’s proportionate share of the total OPEB liability calculated using the current healthcare cost trend rates, as well as what the net OPEB liability would be if it were calculated using healthcare trend rates that are one percentage point lower, or one percentage point higher than the current rates:
15. RISK FINANCING
PSU participates in the Public University Risk Management and Insurance Trust (PURMIT). PURMIT is a separate legal entity that operates for the benefit of the participating universities.
The following risks are managed through PURMIT:
• Real property loss for university owned buildings, equipment, automobiles and other types of property
• Tort liability claims brought against university officers, employees or agents
• Workers’ compensation and employer’s liability
• Criminal and fiduciary liability
• Certain specialty lines of business, including fine art, non-owned aviation and other liability coverage.
PSU retains the first $100 of loss per occurrence on property loss and tort liability claims while the pooled risk covered by PURMIT varies depending on the type of occurrence. Pooled risk covered by PURMIT and excess third party commercial insurance coverage is described below and applies to the participating universities in aggregate.
Effective October 2017, PURMIT covers up to $250 per occurrence for real property damages. PURMIT covers up to $500 per occurrence for general liability damages. Excess third party commercial insurance covers up to $500,000 per occurrence with aggregate sub-limits for flood and earth movement of $250,000 and $100,000, respectively.
Discount Rate June 30, 2020 June 30, 20191% Decrease to 1.21%/2.50% $6,417 $7,393
Current Discount Rate at 2.21%/3.50% 5,987 6,794
1% Increase to 3.21%/4.50% 5,583 6,243
Healthcare Cost Trend Rate June 30, 2020 June 30, 20191% Decrease $5,387 $2,920Current Trend Rate 5,987 6,794 1% Increase 6,693 7,844
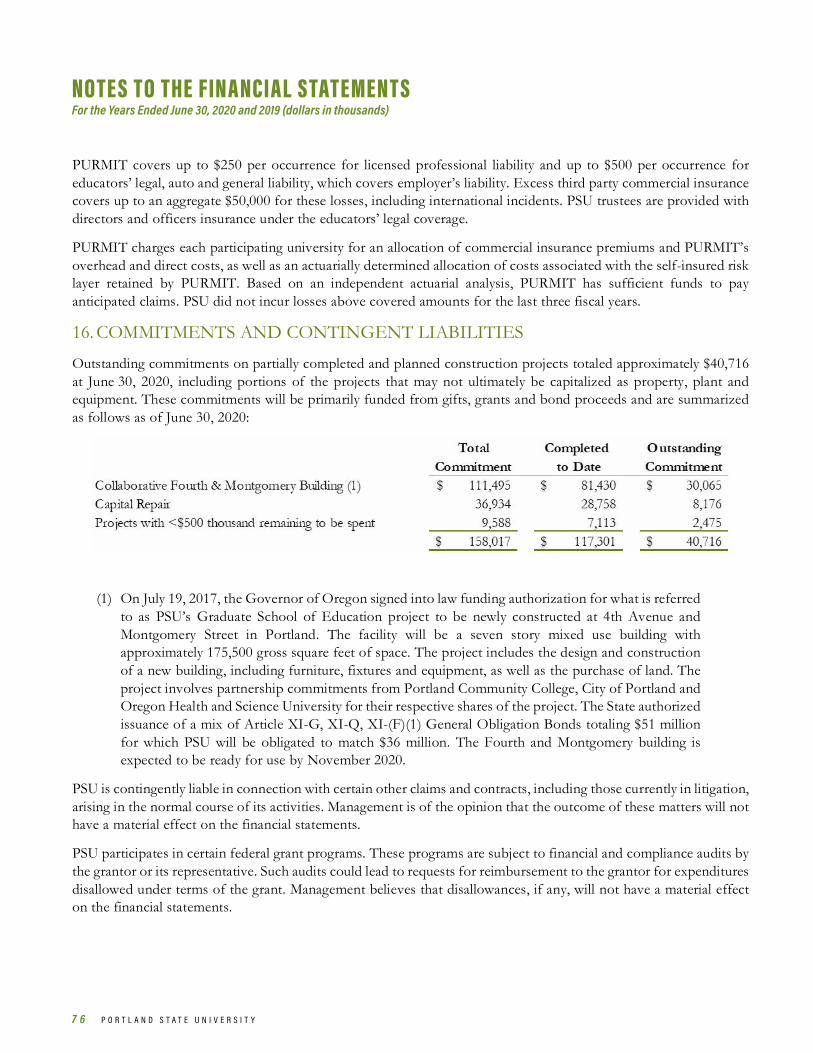
7 6 P O R T L A N D S T A T E U N I V E R S I T Y
NOTES TO THE FINANCIAL STATEMENTS For the Years Ended June 30, 2020 and 2019 (dollars in thousands)
Notes to the Financial Statements For the Years Ended June 30, 2020 and 2019 (dollars in thousands)
PURMIT covers up to $250 per occurrence for licensed professional liability and up to $500 per occurrence for educators’ legal, auto and general liability, which covers employer’s liability. Excess third party commercial insurance covers up to an aggregate $50,000 for these losses, including international incidents. PSU trustees are provided with directors and officers insurance under the educators’ legal coverage.
PURMIT charges each participating university for an allocation of commercial insurance premiums and PURMIT’s overhead and direct costs, as well as an actuarially determined allocation of costs associated with the self-insured risk layer retained by PURMIT. Based on an independent actuarial analysis, PURMIT has sufficient funds to pay anticipated claims. PSU did not incur losses above covered amounts for the last three fiscal years.
16. COMMITMENTS AND CONTINGENT LIABILITIES
Outstanding commitments on partially completed and planned construction projects totaled approximately $40,716 at June 30, 2020, including portions of the projects that may not ultimately be capitalized as property, plant and equipment. These commitments will be primarily funded from gifts, grants and bond proceeds and are summarized as follows as of June 30, 2020:
(1) On July 19, 2017, the Governor of Oregon signed into law funding authorization for what is referred to as PSU’s Graduate School of Education project to be newly constructed at 4th Avenue and Montgomery Street in Portland. The facility will be a seven story mixed use building with approximately 175,500 gross square feet of space. The project includes the design and construction of a new building, including furniture, fixtures and equipment, as well as the purchase of land. The project involves partnership commitments from Portland Community College, City of Portland and Oregon Health and Science University for their respective shares of the project. The State authorized issuance of a mix of Article XI-G, XI-Q, XI-(F)(1) General Obligation Bonds totaling $51 million for which PSU will be obligated to match $36 million. The Fourth and Montgomery building is expected to be ready for use by November 2020.
PSU is contingently liable in connection with certain other claims and contracts, including those currently in litigation, arising in the normal course of its activities. Management is of the opinion that the outcome of these matters will not have a material effect on the financial statements.
PSU participates in certain federal grant programs. These programs are subject to financial and compliance audits by the grantor or its representative. Such audits could lead to requests for reimbursement to the grantor for expenditures disallowed under terms of the grant. Management believes that disallowances, if any, will not have a material effect on the financial statements.

2 0 2 0 A N N U A L F I N A N C I A L R E P O R T 7 7
NOTES TO THE FINANCIAL STATEMENTS For the Years Ended June 30, 2020 and 2019 (dollars in thousands)Notes to the Financial Statements For the Years Ended June 30, 2020 and 2019 (dollars in thousands)
Unemployment compensation claims are administered by the Oregon Employment Division pursuant to ORS 657. PSU reimburses the Oregon Employment Division on a quarterly basis for actual benefits paid. Although the amount of future benefit payments to claimants and the resulting liability to PSU cannot be reasonably determined at June 30, 2020, such amounts are not expected to be material.
Refer also to Note 19 for commitments associated with the PSU Foundation.
17. RISKS AND UNCERTAINTIES
The University participates in a number of federal programs, which are subject to financial and compliance audits. The amount of expenses that may be disallowed by the granting agencies cannot be determined at this time although the University does not expect these amounts, if any, to be material to the financial statements.
The University is a party to a number of matters of litigation. It is the opinion of management, based on the advice of counsel, that the University’s liability insurance is sufficient to cover the potential judgments and that the outcome of the suits will not have a material adverse effect on the financial position or operations of the University.
During the fiscal year, the World Health Organization declared the spread of Coronavirus Disease (COVID-19) a worldwide pandemic. Subsequent to year end, the COVID-19 pandemic continues to have significant effects on global markets, supply chains, businesses, and communities. Specific to the university, COVID-19 may impact various parts of its 2021 operations and financial results, including, but not limited to, declines in enrollment, loss of auxiliary revenues, additional bad debts and/or costs for increased use of technology. The University is taking appropriate actions to mitigate any negative impact; however, the full impact of COVID-19 is unknown and cannot be fully estimated as these events are still developing.
18. SUBSEQUENT EVENTS
No events have occurred subsequent to June 30, 2020 and through the date of these financial statements that would require adjustment to, or disclosure in, the financial statements.
19. UNIVERSITY FOUNDATION
The PSU Foundation was established to provide assistance in fund raising, public outreach and other support for the mission of PSU and is a legally separate, tax-exempt entity with an independent governing board.
Under an amended and restated recognition and support agreement, PSU financially supports the PSU Foundation’s operating costs. During the years ended June 30, 2020 and 2019, PSU transferred $7,563 and $7,725, respectively, to the PSU Foundation under this agreement. PSU’s financial support to the PSU Foundation is budgeted to be $6,981 during the year ended June 30, 2021. This includes supplemental funding of $750 in 2021 to support the PSU Foundation’s comprehensive funding raising campaign initiative.
During the years ended June 30, 2020 and 2019, gifts of $15,042 and $17,539, respectively, were transferred from the PSU Foundation to PSU. Gifts received from the PSU Foundation include amounts contributed by certain members of the PSU Board of Trustees and their affiliates. During the years ended June 30, 2020 and 2019, the PSU Foundation recognized $3,150 and $4,823 of revenues associated with donations and pledges from members of the PSU Board of Trustees and their affiliates.
PSU leases a building from the PSU Foundation (the Corbett Building) that will expire on December 2020 unless renewed. Annual base rent is $462. The lease contains a fair market value purchase option.
7 8 P O R T L A N D S T A T E U N I V E R S I T Y
NOTES TO THE FINANCIAL STATEMENTS For the Years Ended June 30, 2020 and 2019 (dollars in thousands)Notes to the Financial Statements For the Years Ended June 30, 2020 and 2019 (dollars in thousands)
Although PSU does not control the timing or amount of receipts from the PSU Foundation, the majority of resources, or income thereon that the PSU Foundation holds and invests are restricted to the activities of PSU by the donors. As these restricted resources held by the PSU Foundation can only be used by, or for the benefit of, PSU, the PSU Foundation is considered a component unit of PSU and is discretely presented in the financial statements. Refer to the Statements of Financial Position and Statements of Activities for the PSU component unit financial statements. The PSU Foundation is audited annually and received an unqualified audit opinion on both fiscal years presented. Complete financial statements for the PSU Foundation may be obtained by writing to the following: Portland State University Foundation, 2125 SW Fourth Avenue, Suite 510, Portland, OR 97201.

2 0 2 0 A N N U A L F I N A N C I A L R E P O R T 7 9
Required Supplementary Information (dollars in thousands)
Defined Benefit Pension Plans* 2020 2019 2018 2017 2016 2015 2014
Statutorily required employer contributions 17,082$ 12,080$ 12,033$ 9,345$ 8,566$ 7,315$ 7,586$ Employer contributions recognized 17,082$ 12,080$ 12,033$ 9,345$ 8,566$ 7,315$ 7,586$ Contribution Excess (Deficiency) -$ -$ -$ -$ -$ -$ -$ Covered employee payroll 120,458$ 119,441$ 115,380$ 112,635$ 108,245$ 103,588$ 103,961$ Employer contributions recognized as a percentage of covered payroll
14.2% 10.1% 10.4% 8.3% 7.9% 7.1% 7.3%
SCHEDULE OF UNIVERSITY PERS DEFINED BENEFIT PENSION EMPLOYER CONTRIBUTIONSYear Ended June 30,
June 30,
Defined Benefit Pension Plans* 2020 2019 2018 2017 2016 2015 2014
Employer's proportionate % share of collective net pension asset or liability** 0.86% 0.86% 1.04% 0.96% 0.92% 0.92% 0.92%Employer's proportionate share of collective net pension (asset) liability** 148,387$ 130,218$ 140,322$ 144,817$ 52,642$ (20,769)$ 46,757$ Covered employee payroll** 119,441$ 115,380$ 112,635$ 108,245$ 103,588$ 103,961$ 98,057$ Employer's share of net pension (asset) liability as a percentage of covered payroll** 124% 113% 125% 134% 51% -20% 48%Plan fiduciary net position as a percentage of the total pension liability** 80.2% 82.1% 83.1% 80.5% 91.9% 103.6% not avail.
SCHEDULE OF UNIVERSITY PERS DEFINED BENEFIT PENSION PROPORTIONATE SHAREOF NET PENSION LIABILITY
*10-year trend information specific to PSU is not available prior to the year ended June 30, 2014.**Based on measurement date one year prior to the fiscal year end.
REQUIRED SUPPLEMENTARY INFORMATION (DOLL ARS IN THOUSANDS)

8 0 P O R T L A N D S T A T E U N I V E R S I T Y
Required Supplementary Information (dollars in thousands)
2020 2019 2018 2017 2016 2015 2014 2013 2012 2011Actuarially Determined Contributions1 19$ 537$ 520$ 537$ 519$ 549$ 555$ 533$ 510$ 187$ Contributions in Relation to the Actuarially Determined Contributions 19 537 520 537 519 549 555 533 510 187
Contribution Deficiency (Excess) -$ -$ -$ -$ -$ -$ -$ -$ -$ -$
Covered Payroll 120,458$ 119,441$ 115,380$ 112,635$ 108,245$ 103,588$ 103,961$ 98,057$ 93,153$ 77,200$ Contributions as a Percentage of Covered Payroll 0.02% 0.45% 0.45% 0.48% 0.48% 0.53% 0.53% 0.54% 0.55% 0.24%
1For Actuarial Assumptions and Methods, see table in Note 14
2020 2019 2018 2017University's Allocation of the Net RHIA OPEB Liability/(Asset) 1.05% 1.05% 1.18% 1.18%
University's Proportionate Share of the Net RHIA OPEB Liability/(Asset) (2,170)$ (1,167)$ (491)$ 288$
University's Covered Payroll 119,441 115,380 112,635 108,245
1.82% 1.01% 0.44% 0.27%
Plan Fiduciary Net Position as a Percentage of the Total RHIA OPEB Liability/(Asset) 144.38% 123.99% 108.88% 94.15%
*Based on measurement date one year prior to the fiscal year end. 10-year trend information specific to PSU is not available for earlier years.
SCHEDULE OF UNIVERSITY PERS RHIA OPEB EMPLOYER CONTRIBUTION
University's Proportionate Share of the Net RHIA OPEB Liability/(Asset) as a Percentage of Covered Payroll
Year Ended June 30,
Year Ended June 30,
SCHEDULE OF UNIVERSITY'S PROPORTIONATE SHARE OF THE NET PERS RHIA OPEB LIABILITY/(ASSET)*
REQUIRED SUPPLEMENTARY INFORMATION (DOLL ARS IN THOUSANDS)

2 0 2 0 A N N U A L F I N A N C I A L R E P O R T 8 1
Required Supplementary Information (dollars in thousands)
2020 2019 2018 2017 2016 2015 2014 2013 2012 2011Actuarially Determined Contributions1 363$ 491$ 477$ 428$ 414$ 236$ 240$ 132$ 127$ 40$ Contributions in Relation to the Actuarially Determined Contributions 363 491 477 428 414 236 240 132 127 40
Contribution Deficiency (Excess) -$ -$ -$ -$ -$ -$ -$ -$ -$ -$
Covered Payroll 120,458$ 119,441$ 115,380$ 112,635$ 108,245$ 103,588$ 103,961$ 98,057$ 93,153$ 77,200$ Contributions as a Percentage of Covered Payroll 0.30% 0.41% 0.41% 0.38% 0.38% 0.23% 0.23% 0.13% 0.14% 0.05%
1For Actuarial Assumptions and Methods, see table in Note 14
2020 2019 2018 2017University's Allocation of the Net RHIPA OPEB Liability/(Asset) 3.56% 3.53% 3.81% 0.00%
University's Proportionate Share of the Net RHIPA OPEB Liability/(Asset) 902$ 1,249$ 1,775$ 1,930$
University's Covered Payroll 120,458 119,441 115,380 112,635
0.75% 1.05% 1.54% 1.71%
Plan Fiduciary Net Position as a Percentage of the Total RHIPA OPEB Liability/(Asset) 64.86% 49.79% 34.25% 21.87%
*Based on measurement date one year prior to the fiscal year end. 10-year trend information specific to PSU is not available for earlier years.
University's Proportionate Share of the Net RHIPA OPEB Liability/(Asset) as a Percentage of Covered Payroll
SCHEDULE OF UNIVERSITY'S PROPORTIONATE SHARE OF THE NET PERS RHIPA OPEB LIABILITY/(ASSET)*
Year Ended June 30,
Year Ended June 30,
SCHEDULE OF UNIVERSITY PERS RHIPA OPEB EMPLOYER CONTRIBUTION
REQUIRED SUPPLEMENTARY INFORMATION (DOLL ARS IN THOUSANDS)
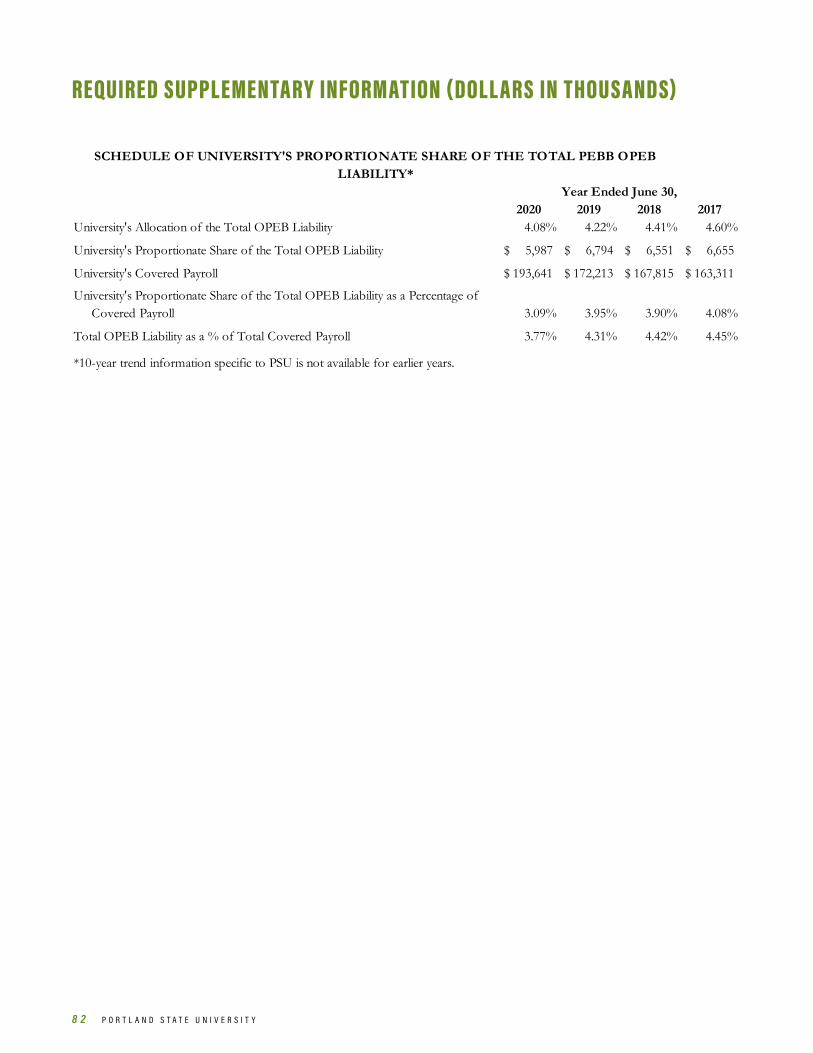
8 2 P O R T L A N D S T A T E U N I V E R S I T Y
Required Supplementary Information (dollars in thousands)
2020 2019 2018 2017University's Allocation of the Total OPEB Liability 4.08% 4.22% 4.41% 4.60%
University's Proportionate Share of the Total OPEB Liability 5,987$ 6,794$ 6,551$ 6,655$
University's Covered Payroll 193,641$ 172,213$ 167,815$ 163,311$
3.09% 3.95% 3.90% 4.08%
Total OPEB Liability as a % of Total Covered Payroll 3.77% 4.31% 4.42% 4.45%
*10-year trend information specific to PSU is not available for earlier years.
University's Proportionate Share of the Total OPEB Liability as a Percentage of Covered Payroll
SCHEDULE OF UNIVERSITY'S PROPORTIONATE SHARE OF THE TOTAL PEBB OPEB LIABILITY*
Year Ended June 30,
REQUIRED SUPPLEMENTARY INFORMATION (DOLL ARS IN THOUSANDS)

2 0 2 0 A N N U A L F I N A N C I A L R E P O R T 8 3
For information about the financial data included in this report, contact:
Office of the President Portland State University Richard & Maurine Neuberger Center 1600 SW 4th Avenue Portland, OR 97201
503-725-4411 www.pdx.edu