2020 Annual Program Budget - Sheboygan · include The Vollrath Company, LLC, Rockline Industries,...
312
2020 Annual Program Budget City of Sheboygan, Wisconsin
Transcript of 2020 Annual Program Budget - Sheboygan · include The Vollrath Company, LLC, Rockline Industries,...

2020Annual Program Budget
City of Sheboygan, Wisconsin


TABLE OF CONTENTS
Community Profile
Table of Contents ................................................................................................. 3 Elected Officials .................................................................................................... 7 Background/General Information .......................................................................... 9 Demographics .................................................................................................... 11
Budget Message
City Administrator’s Message ............................................................................. 13 GFOA Distinguished Budget Presentation Award .............................................. 21 ICMA Certificate of Distinction ............................................................................ 22
Strategic Goals and Strategies
Strategic Plan ..................................................................................................... 23 Budget Structure
Fund Structure .................................................................................................... 31 Budgetary Basis ................................................................................................. 32 Overview of Fiscal Policies, Budget Presentation and Process .......................... 43 Fiscal Policies ..................................................................................................... 43 Budget Presentation ........................................................................................... 49 Explanation of Budgetary Process ...................................................................... 49
Budget Overview
2020 Budget Facts ............................................................................................. 53 Budget Summary ................................................................................................ 54 Fund Balance Summary ..................................................................................... 56 Combined Summary of Changes in Fund Balances ........................................... 59 Personnel Schedule Summary ........................................................................... 60 Summary of Revenues and Expenditures
Fund Type and Category ......................................................................... 61 Departments by Fund Classification ................................................................... 62
Revenue Analysis
Long Term Financial Plan and Fiscal Policies .................................................... 64 Major Revenue Sources, Trends and Assumptions ............................................ 73
General Fund General Fund Budget Summary ......................................................................... 91 General Fund Revenues .................................................................................... 93 General Fund Expenditure Summary ................................................................. 97
General Government Office of the Mayor ............................................................................................. 99 Office of the City Administrator ......................................................................... 101 Common Council .............................................................................................. 103
3

Office of the City Clerk ...................................................................................... 105 Elections ........................................................................................................... 107 Finance ............................................................................................................. 108 Assessing ......................................................................................................... 111 Human Resources ............................................................................................ 112 Office of the City Attorney ................................................................................. 114 City Hall ............................................................................................................ 116 Insurance .......................................................................................................... 117 Employee Benefits ............................................................................................ 118
Public Safety Police Department
Police - Administration ................................................................................ 119 Police - Patrol .............................................................................................. 122 Police - Fleet ............................................................................................... 124 Police - Parking Enforcement ...................................................................... 125 Police - Facility ............................................................................................ 126 Police - Criminal Investigation ..................................................................... 127
Fire ................................................................................................................... 129 Building Inspection ........................................................................................... 131 Civil Defense .................................................................................................... 133
Public Works Administration ................................................................................................... 135 Engineering ...................................................................................................... 137 MSB – Administration. ...................................................................................... 138 MSB – Maintenance ......................................................................................... 139 Streets, Alleys and Sidewalk ............................................................................ 141 Storm Water Management................................................................................ 143 Street Lights ..................................................................................................... 144 Bridges ............................................................................................................. 145 Snow and Ice Control ....................................................................................... 146 Traffic Control Signs ......................................................................................... 147 Traffic Control Signals ...................................................................................... 148 Solid Waste ...................................................................................................... 149 Street Cleaning ................................................................................................. 150 Weed Control .................................................................................................... 151 Residential Drop-Off ......................................................................................... 152
Health and Human Services Cemetery .......................................................................................................... 153
Culture and Recreation Parks and Forestry ........................................................................................... 155 Parks - Maywood .............................................................................................. 157 Senior Services ................................................................................................ 158
4

Conservation and Development Planning and Development .............................................................................. 161
Other Interfund Transfers ........................................................................................... 163 Unclassified ...................................................................................................... 164
Special Revenue Funds
Summary of Special Revenue Funds ............................................................... 165 Police MEG Unit Fund ...................................................................................... 166 Block Grant Fund .............................................................................................. 168 Housing Revolving Loan Fund.......................................................................... 169 Business Revolving Loan Fund ........................................................................ 170 Neighborhood Revitalization Fund .................................................................... 171 Mead Public Library Fund ................................................................................. 172 Tourism Fund ................................................................................................... 175 Park, Forestry, and Open Space Fund ............................................................. 176 Park Impact Fee Fund ...................................................................................... 177 Cable TV Fund ................................................................................................. 178 Municipal Court Fund ....................................................................................... 180 Ambulance Fund .............................................................................................. 182 Special Assessment Fund ................................................................................ 184 Harbor Centre Marina Fund .............................................................................. 185 Redevelopment Authority Fund ........................................................................ 186 Storm Water Fund ............................................................................................ 187
Debt Service Funds
Summary of Debt Service Funds ...................................................................... 189 G.O. Debt Service Fund ................................................................................... 190
Computation of Legal Debt Margin .............................................................. 191 Debt Service Fund – Notes and Bonds ....................................................... 192 Debt Service Revenues and Expenditures .................................................. 194 Debt Service Requirements of Outstanding G.O. Bonds and Notes ........... 195
Convention Center Debt Service Fund ............................................................. 198 TID 5 Debt Service Fund .................................................................................. 199 TID 6 Debt Service Fund .................................................................................. 200 TID 10 Debt Service Fund ................................................................................ 204 TID 11 Debt Service Fund ................................................................................ 206 TID 12 Debt Service Fund ................................................................................ 208 TID 13 Debt Service Fund ................................................................................ 210 TID 14 Debt Service Fund ................................................................................ 212 TID 15 Debt Service Fund ................................................................................ 215 TID 16 Debt Service Fund ................................................................................ 217 TID 17 Debt Service Fund ................................................................................ 221 TID 18 Debt Service Fund ................................................................................ 224 TID 19 Debt Service Fund ................................................................................ 229 Environmental TID Debt Service Fund ............................................................. 232
5

Capital Improvement Funds Summary of Capital Improvement Funds ......................................................... 233 Capital Project Fund ......................................................................................... 234 Capital Improvement Fund ............................................................................... 236 Industrial Park Fund ......................................................................................... 239 TID 6 Capital Project Fund ............................................................................... 240 TID 12 Capital Project Fund ............................................................................. 241 TID 14 Capital Project Fund ............................................................................. 242 TID 16 Capital Project Fund ............................................................................. 243 TID 17 Capital Project Fund ............................................................................. 244 TID 18 Capital Project Fund ............................................................................. 246 TID 19 Capital Project Fund ............................................................................. 247
Proprietary Funds Summary of Proprietary Funds ......................................................................... 249 Motor Vehicle Fund .......................................................................................... 250 Health Insurance Fund ..................................................................................... 252 Liability Insurance Fund .................................................................................... 253 Workers Compensation Fund ........................................................................... 254 Information Technology Fund ........................................................................... 255 Water Utility Fund ............................................................................................. 258 Recycling Utility Fund ....................................................................................... 261 Wastewater Utility Fund .................................................................................... 263 Transit Utility Fund ............................................................................................ 267 Parking Utility Fund .......................................................................................... 269 Boat Facilities Fund .......................................................................................... 271
Fiduciary Funds
Summary of Fiduciary Funds ............................................................................ 273 Cemetery Perpetual Care Fund ........................................................................ 274 Mead Public Library Trust Fund ........................................................................ 275
Appendix City of Sheboygan Assessed Tax Rate ............................................................ 277 Personnel Schedule ......................................................................................... 278 Total Expenditures by Fund and Department ................................................... 286 General Fund Summary of Expenses by Category .......................................... 288 5 Year Capital Improvement Program .............................................................. 290 Resolution Adopting the 2020 Annual Program Budget ................................... 296 Public Hearing Notice ....................................................................................... 298 Chart of Accounts ............................................................................................. 299 Glossary ........................................................................................................... 303 Acronyms ......................................................................................................... 309
**To view detailed account-level financial information, please refer to the 2020 Annual Program Budget Revenue and Expenditures Detail Addendum.
6

Alderperson Mary Lynne Donohue, Council Vice
President
Alderperson Jim Bohren
Alderperson Trey Mitchell
CITY OF SHEBOYGAN ELECTED OFFICIALS
Michael Vandersteen, Mayor
Charles Adams, City Attorney
Meredith DeBruin,
City Clerk
Natasha Torry,
Municipal Court Judge
Alderperson Markus Savaglio
Alderperson Rose Phillips Alderperson Barbara Felde Alderperson Dean Dekker
Alderperson Todd Wolf, Council President
Alderperson Betty Ackley
Alderperson Ryan Sorenson
7

Functional Authority
Appointment Authority
Name TitleDarrell Hofland City AdministratorDavid Biebel Director of Public WorksEric Bushman Information Technology DirectorSandra Rohrick Director of Human Resources and Labor RelationsChad Pelishek Director of Planning and DevelopmentDerek Muench Director of Parking and TransitMarty Halverson Finance DirectorChristopher Domagalski Police ChiefEric Montellano Fire ChiefJoe Trueblood Water Utility SuperintendentGarrett Erickson Library DirectorVicky Schneider Director of Senior Services
Elected Officials TitleMike Vandersteen MayorChuck Adams City AttorneyMeredith DeBruin City ClerkNatasha Torry Municipal Court Judge
Residents of Sheboygan
Mayor
City Attorney
City Clerk
Office of City Administrator
Police and Fire Commission Board of Water Library Board
Municipal Court Judge
Common Council
Police Department
Fire Department
City Development Department
Parking & Transit
Department
Information Technology Department
Human Resources Department
Finance Department
Library Water Utility Public Works Department
Senior Activity Center
8

Background / General Information
Sheboygan was first witnessed in 1635 by Jean Nicolet while exploring Lake Michigan and the Fox River Valley by canoe. After discovering the Upper Mississippi River in 1643, Sieur Louis Joliet and James Marquette passed by what would eventually become the City of Sheboygan. However, the first landing in Sheboygan did not occur until 1699. Quebec missionary Father Saint Cosme came to intermingle with the then resident Native American Potowatomi Tribe.
The city’s name is derived from the Native American language. However, reports of its meaning vary. A thesis by Jerome Francis Hesselink concludes the name Sheboygan is derived from the Native American term “Sheu-wau-wau-gum”, meaning rumbling waters, referring to the many waterfalls along the Sheboygan River. Local author, Janice Hildebrand reports that Sheboygan means “waterway between the lakes” referring to the connection of the Sheboygan River between Lake Michigan and Lake Winnebago. Regardless of which of these hypotheses are correct, the name was derived from the first Native American residents who inhabited the area.
In 1846, Sheboygan was incorporated as a village. Sheboygan became a city in 1853. In 1891, Sheboygan was one of the great manufacturing centers of the state. The 1900’s highlighted further expansion of city services to its 22,962 residents. In order to further protect the harbor from Lake Michigan’s waves, a breakwater and lighthouse were built north of the river in 1900. In 1930, Sheboygan had 39,251 citizens and today has 49,228 residents.
Today, Sheboygan’s strong work ethic in manufacturing and business continues to yield outstanding employment opportunities in varied private and publicly owned industries. Privately owned companies with strong roots in the area include The Vollrath Company, LLC, Rockline Industries, Torke Family Coffee Roasters, Scandia Plastics Incorporated, and Plastics Engineering Company. Sheboygan’s strategic location makes it an important transportation hub in east central Wisconsin, providing access by highway, rail, air, and water. Sheboygan offers the lifestyle of small-town America, combined with the convenience of living 50 miles from either Milwaukee or Green Bay.
The city operates under a “Council-Manager” form of government with a City Administrator responsible for the day-to-day responsibilities of supervision, coordination, and administration of the city departmental activities; formulation, presentation, and administration of the budget. Policymaking and legislative authority are vested in a 10 member Common Council, chaired by the Common Council President.
9

The Sheboygan Police Department consists of 83 full-time sworn officers providing 24-hour police protection. The Sheboygan Fire Department consists of 73 sworn officers, offering 24-hour fire and ambulance services to the residents of Sheboygan. The city partners with the Sheboygan Area School District (SASD) Community Recreation Department to support recreational needs within the community. The Senior Activity Center provides opportunities for 709 active members. Mead Public Library offers library resources for the city and surrounding communities. Sheboygan Water Utility, under the direction of the Board of Water Commissioners, provides water to the city and adjacent communities from Lake Michigan, while the Sheboygan regional wastewater treatment plant collects and treats sewage waste from Sheboygan residents, surrounding towns and villages.
Shoreline Metro serves as the city’s premier provider of public transportation serving Sheboygan and the surrounding communities of Kohler and Sheboygan Falls. Service is available Monday through Saturday. Most routes operate on a 30-minute schedule. All buses are equipped with bike racks and accessible to accommodate mobility concerns. A bike-share program was added in 2019.
SASD operates 26 public schools, serving a student population of 10,153, making it the largest public-school district within Sheboygan County. SASD instruction offers a wide-variety of educational opportunities, from traditional to charter schools serving students from four-year old kindergarten to college level courses for dual-enrollment at the high school level.
Sheboygan proudly houses the UW Green Bay - Sheboygan Campus within its municipal boundaries. UW Green Bay - Sheboygan Campus offers a variety of bachelors and associates degrees through collaborative programs with other University of Wisconsin schools.
Sheboygan County is home to Lakeland University, a liberal arts university offering both undergraduate and graduate degrees. Lakeland University students receive an education that is broad in scope, comprehensive in spirit and concentrated in at least one area of study. Lakeshore Technical College (LTC) is a leading provider of technical education offering over 100 career focused programs including associate degrees, technical diplomas, technical certificates and apprenticeship programs.
As the city advances in the future, growth potential and expansion needs to be considered when planning for resources and services. Today, Sheboygan boasts many opportunities to enjoy a good life. With the lake’s scenic and recreational resources, a mix of housing and retail attractions, a broad-spectrum of arts and cultural activities, groups and opportunities, and established health care facilities typically found in much larger communities, residents proudly call Sheboygan home.
10

Demographics
Building Permits (2018) Public Safety- Police (2018)Year Number Year
2018 3,394 110.6 2018 832017 3,497 110.2 2017 822016 3,323 114.4 2016 822015 3,331 144.0 2015 812014 3,328 273.3 2014 812013 3,384 28.5 2013 812012 3,288 45.9 2012 81
Employment Trends (2018)Year Employment Unemployment Rate Number of Police Stations 12018 62,749 2.1% Number of Fire Stations 52017 62,123 2.5% ISO Rating 22016 60,905 3.7%2015 59,614 3.8% Public Safety- Firefighter (2018)2014 57,860 5.2% Year2013 54,490 7.5% 2018 732012 54,420 8.4% 2017 73Parks (2018) 2016 72Year Developed Parks Acres Maintained 2015 692018 38 705.00 2014 722017 38 675.00 2013 722016 38 614.04 2012 722015 38 614.042014 38 614.042013 36 557.252012 36 557.25 Infrastructure (2018)
Miles of State Highway System 17Elections (2018) Miles of County Highway System 17Year 2018 2017 2016 Miles of Local Roads & Streets 200Ballots Cast 34,740 9,856 42,675 Miles of Sidewalks 375
Number of City-owned Street Lights 4,505Employment by Industry-Sheboygan County (2018)Manufacturing 21,962 35% Water/Wastewater (2018)Trade/Transportation/Utility 10,767 17% Active Accounts Serviced 19,252Education/Health Services 10,139 17% Water Treated/Distributed-Gallons 3,881,393Leisure/Hospitality 5,747 9% Miles of Sanitary Sewers 170Professional/Business 4,492 7% Miles of Water Main 205Financial Activities 3,237 5%Construction 2,609 4% School Registration (2018-19)Public Administration 1,915 3% Elementary Schools 5,088Other Services 1,882 3% Middle Schools 2,043Total All Industries 62,750 100% High Schools 3,022
Value (millions)
Number of Sworn Officers
Number of Sworn Officers
11

Area Square Miles (2018) Education Attainment (2018)2018 15.80 (Population 25 years and older)2017 15.78 High School Graduate 92.60%2016 14.81 Associates Degree 6.00%2015 14.71 Bachelor's Degree 23.80%2014 14.53 Graduate or Professional Degreee 4.90%2013 14.522012 14.462011 14.19 Housing Units (2018)2010 14.19 Total Dwelling Units 21,602
Single Family 15,276Age (2018) Two Family 4,760Under 5 years 7.30% Three Family 1805 to 9 years 6.80% Condominiums 74410 to 14 years 6.50% Apartment Units 64215 to 19 years 6.70%20 to 24 years 6.30%25 to 29 years 7.40% Largest Property Taxpayers (2018)30 to 34 years 6.70% Assessed Value35 to 39 years 6.10% Acuity Mutual Insurance Company $149,754,28040 to 44 years 6.60% Aurora Medical Group $24,389,11045 to 49 years 7.40% Sheboygan Acquisitions, LLC $18,025,49050 to 54 years 6.90% Nemak USA, Inc $16,661,00055 to 59 years 5.90% PJR Properties $14,806,20060 to 64 years 4.80% Plastics Engineering Company $14,063,80065 to 69 years 3.80% Wal-Mart $14,021,99070 to 74 years 2.90% Country Village Apartments $13,953,38075 to 79 years 2.70% St. Nicholas Hospital $12,201,57080 to 84 years 2.60% American Orthodontics $11,264,80085 years and older 2.60%
Race (2018) Major Employers (2018)White 79.28% Aurora Medical Group 1,370Hispanic - Latino 9.90% Nemak 1,279Asian 9.00% Acuity Mutual Insurance Company 1,253Black - African American 1.76% Sheboygan Area School District 1,198American Indian - Alaskan Native 0.05% Rockline Industries 870
Sheboygan County 842The Vollrath Company, LLC 560
Population (2018) American Orthodontics 5152018 48,329 Piggly Wiggly Midwest, LLC 5802010 49,288 City of Sheboygan 4942000 50,7921990 49,6761980 48,0851970 48,484
12

OFFICE OF THE CITY ADMINISTRATOR
CITY HALL 828 CENTER AVENUE SHEBOYGAN, WI 53081-4442
920-459-3315 FAX 920-459-3967 [email protected]
www.sheboyganwi.gov
January 1, 2020 To the Members of the Common Council and Mayor Mike Vandersteen: Transmitted herein is the City of Sheboygan’s 2020 Annual Program Budget for the fiscal year beginning January 1, 2020. The Annual Program Budget represents one of the most important documents presented to and approved by the Common Council. The 2020 Budget is more than just revenues, expenses, appropriations, and projects. It serves four basic purposes:
It is a policy document that is defined by the Common Council as the direction toward which the city is moving.
It is a financial plan that defines the various sources of funds to be collected as well as the services, programs, and activities that citizens can expect to be provided.
It is an operational guide for department directors on how programs and activities are structured.
It is a communication device providing the public and other entities with a document defined in a layperson’s language as opposed to past budget’s exclusive financial numbers format.
LONG TERM GOALS AND IMPACT ON BUDGET Consistent with the six focus areas of the City of Sheboygan Strategic Plan 2017-2021 (see next section of the budget document for details), the 2020 Adopted Budget establishes an operational and financial plan for the delivery of city services and implementation of the city’s Capital Improvement Program (CIP). Regarding implementation of the CIP, the 2020 Capital improvement-related expenditures (as contained in the Capital Improvement Funds) are proposed to decrease by $17.8 million or 57 percent over 2019 levels. SHORT TERM FACTORS AND IMPACT ON BUDGET Two factors will negatively affect the city’s largest revenue source – property taxes in 2020: limited new development outside of Tax Incremental Districts (TIDs) and Wisconsin property tax levy limits.
The city is experiencing limited growth in new construction ($9.4 million in net new construction according to the Wisconsin Department of Revenue) with the vast majority of this development occurring within TIDs. As a result, most of the subsequent new property tax levy increase is not available to fund general operations, capital, nor debt-related expenditures.
The city continues to be constrained by Wisconsin legislation which places limits on the amount of the increase in the property tax levy. The 2020 Adopted Budget is limited to receive an additional amount of $202,518 (to fund its general operations, capital, but no debt-related expenditures). This is similar to the 2019 budget which received an additional amount of $221,010.
Due to a 2020 increase in debt service expenses (associated with prior street improvement projects), the Budget also recommends a corresponding $119,869 increase in the tax levy. The total levy increase of $322,387 will result in a property tax rate increase of 1.33 percent or $0.13 per $1,000 in assessed property valuation. (For comparison purposes with other communities, the equalized property tax rate will decrease by $0.12 or 1.37 percent.)
13

BUDGET OVERVIEW The 2020 Budget includes monies for both operating and capital purposes totals $109,579,877. This amount represents a decrease of $21,507,169 or 16.4 percent from the prior year – 2019 Amended Budget. The 2020 Budget includes four new funds: Neighborhood Revitalization Fund, TID 17 Debt Service Fund (Indiana Avenue Corridor), TID 19 Debt Service Fund (redevelopment area bounded by Pennsylvania Avenue, north of Niagara Avenue and the Sheboygan River west of North 15th Street), and Recycling Utility Fund. Of the city’s six fund categories, four fund categories are estimated to increase their expenditure levels: General Fund, Special Revenue Funds, Fiduciary Funds, and Proprietary Funds. Two remaining funds – Debt Service Funds and Capital Improvement Funds are proposed to decrease its expenditures. The largest fund category expenditure change is the Capital Improvement Funds with a $17,757,740 decrease in comparison to 2019 Amended Budget. The reason for the decrease is reduced street and bridge reconstruction projects in 2020. The following table presents a summary breakdown of budgets by fund.
Budget Summary 2019
Amended 2020
Adopted Dollar
Change Percent Change
General Fund $38,545,378 $39,294,527 $749,149 1.94% Special Revenue Funds $10,649,705 $11,264,142 $614,437 5.77% MEG Unit Fund $53,827 $50,605 ($3,222) (5.99%) Community Development Block Grant
Fund $954,201 $939,625 ($14,576) (1.53%)
Housing Revolving Loan Fund $75,528 $247,048 $171,520 22.71% Business Revolving Loan Fund $450,000 $190,000 ($260,000) (57.78%) Neighborhood Revitalization Fund $0 $292,993 $292,993 Mead Public Library Fund $3,313,714 $3,442,783 $129,069 3.89% Tourism Fund $1,539,460 $1,941,256 $401,796 26.10% Park, Forestry, and Open Space Fund $110,000 $315,000 $205,000 186.36% Park Impact Fee Fund $40,000 $60,000 $20,000 50.00% Cable Television Fund $1,056,303 $543,640 ($512,663) (48.53%) Municipal Court Fund $753,797 $902,750 $148,953 19.76% Ambulance Fund $1,151,800 $1,250,800 $99,000 8.60% Special Assessment Fund $125,000 $100,000 ($25,000) (20.00%) Harbor Centre Marina Fund $914,335 $878,643 ($35,692) (3.90%) Redevelopment Authority Fund $51,275 $50,000 ($1,275) (2.49%) Storm Water Fund $60,464 $59,000 ($1,464) (2.42%) Debt Service Funds $15,851,930 $8,862,198 ($6,989,313) (44.09%) G O Debt Service Fund $9,374,354 $4,311,333 ($5,063,021) (54.01%) Convention Center Debt Service Fund $499,486 $499,486 $0 0.00% TID 5 Debt Service Fund $2,850 $0 ($2,850) (100.00%) TID 6 Debt Service Fund $1,310,474 $1,263,187 ($47,287) (3.61%) TID 10 Debt Service Fund $6,150 $650 ($5,500) (89.43%)
14

Budget Summary 2019
Amended 2020
Adopted Dollar
Change Percent Change
Debt Service Funds - continued TID 11 Debt Service Fund $146,600 $713,614 $567,014 386.78% TID 12 Debt Service Fund $150 $223,677 $223,527 149,018.00% TID 13 Debt Service Fund $42,332 $300,650 $258,318 610.22% TID 14 Debt Service Fund $112,599 $101,200 ($11,399) (10.12%) TID 15 Debt Service Fund $155,037 $159,046 $4,009 2.59% TID 16 Debt Service Fund $607,990 $587,426 ($20,564) (3.38%) TID 17 Debt Service Fund $0 $135,110 $135,110 TID 18 Debt Service Fund $3,593,258 $548,047 ($3,045,211) (84.75%) TID 19 Debt Service Fund $0 $18,123 $18,123 Environmental TID Debt Fund $650 $650 $0 0.00% Capital Improvement Funds $30,997,118 $13,239,378 ($17,757,740) (57.29%) Capital Project Fund $17,239,206 $3,611,598 ($13,627,608) (79.05%) Capital Improvement Fund $6,479,318 $3,580,546 ($2,898,772) (44.74%) Industrial Park Fund $9,585 $6,000 ($3,585) (37.40%) TID 12 Capital Project Fund $150 $223,677 $233,527 149,018.00% TID 14 Capital Project Fund $449,540 $57,700 ($391,840) (87.16%) TID 16 Capital Project Fund $575,875 $226,992 ($348,883) (60.58%) TID 17 Capital Project Fund $4,525,000 $5,152,639 $627,639 13.89% TID 18 Capital Project Fund $1,649,290 $86,265 ($1,563,025) (94.77%) TID 19 Capital Project Fund $60,000 $517,639 $457,639 762.73% Fiduciary Funds $2,000 $166,000 $164,000 8,200.00% Cemetery Perpetual Care Fund $2,000 $16,000 $14,000 700.00% Mead Public Library Trust Fund $0 $150,000 $150,000 Proprietary Funds $35,040,914 $36,753,631 ($1,712,716) (4.89%) Motor Vehicle Fund $2,996,724 $2,512,803 ($483,921) (16.15%) Health Insurance Fund $7,560,116 $7,027,878 ($532,238) (7.04%) Liability Insurance Fund $588,200 $484,436 ($103,764) (17.64%) Workers Compensation Fund $649,640 $655,228 $5,588 0.86% Information Technology Fund $1,060,898 $1,118,772 $57,874 5.46% Boat Facilities Fund $177,947 $178,503 $556 0.31% Recycling Utility Fund $0 $1,218,127 $1,218,127 Parking Utility Fund $492,187 $493,167 $980 0.19% Transit Utility Fund $4,419,647 $4,416,674 ($2,973) (0.07%) Water Utility Fund* $7,575,377 $8,872,986 $1,297,609 17.13% Wastewater Utility Fund $9,520,179 $9,775,057 $254,878 2.68% Total Financial Plan $131,087,045 $109,579,876 ($21,507,169) (16.41%) *Includes Water Utility for informational purposes only. The Board of Water Commission has authority for review and approval. In the city's largest (individual) fund - General Fund is recommended to increase by $749,149 or 1.94 percent. Personnel Change Highlights Regarding personnel, the 2020 Budget recommends the following changes over the 2019 Amended Budget’s authorized positions:
Addition of the following positions: 1.00 Grant Coordinator and 1.00 Distribution Technician
15

Elimination of the following positions: 1.00 Network Administrator and 2.50 Maintenance Worker II Operational Service and Program Change Highlights In 2020, the city will implement enhanced garbage and recycling pickup service with the introduction of the automated collection of garbage and recycling carts. For new programs, the city will create an upper floor rehabilitation loan program and residential façade and landscaping reimbursement grant program. Capital Expenditures and Capital Improvement Projects Highlights The approved Five-year Capital Improvement Program was the foundation for the consideration of the 2020 Adopted Budget’s list of capital improvement projects. The following are some highlights:
$1,300,000 for the purchase of former railroad right-of-way for Shoreland 400 multimodal trail, which is adjacent to Indiana Avenue;
$3,500,000 for the reconstruction of streets which surround proposed Badger State Lofts, a mixed-use development including 118 “loft style” apartments;
$1,272,000 for miscellaneous water main replacement; $750,000 for miscellaneous sanitary sewer replacement; and $2,000,000 for the reconstruction of Superior Avenue between North 29th Street and North
Taylor Drive (1,584 linear feet). Income/Outgo The following pie charts represent the city’s income and outgo. Revenues are grouped by major category; expenditures are shown by program area and by type of expenditure. Of the 2020 revenues (Source of Funds) as identified on the pie chart below, Charges for Services representing 24 percent which is the largest revenue source. The second largest category – Property Tax Levy represents 23 percent.
Where the Money Comes From by Source of Funds
16

The chart on the following page depicts the breakdown of city expenditures and how the money is spent by program. Public Works and Public Safety represent the first and second largest areas of expenditure appropriations, accounting for 36 percent and 22 percent respectively of the total financial program in 2020.
Where the Money Goes by Type of Program
The final chart below depicts appropriation by expenditure type (Line Item Category). Personal Services represents the largest portion of the total financial program at 40 percent.
Where the Money Goes by Line Item Category
17

FINANCIAL ASSESSMENT Sheboygan has developed and maintained a strong financial position through conservative financial management and adherence to sound fiscal analysis and policies. The 2020 Budget is no exception. Fund Balances One measure of a municipality’s financial strength is the level of fund balances. All of the city’s six fund categories have a positive fund balance for 2020. The 2020 Budget identifies the use of $4,797,990 in fund balance. The following chart depicts a comparison of the 2017 – 2020 General Fund’s (uncommitted) target and actual fund balances. The city’s fund balance policy is to maintain not less than 25 percent (target fund balance). For the 2020 Budget, the projected end of 2020 uncommitted fund balance of $15,452,517 will be 39 percent of the proposed 2020 expenditure level.
General Fund Balance (Uncommitted) by Actual and Target Amounts
Debt Management In addition to the management of existing debt and associated reserves, the city also forecast future debt within a framework of policies priorities and financial capacity. Current and anticipated capital improvement objectives, available operating revenue, and tax base fluctuations are all evaluated on an ongoing basis to estimate the extent to which the city may issue additional tax-supported debt. This active debt management aids in the development of a sustainable debt portfolio and is a key financial practice contributing to the maintenance of the city’s favorable bond rating. The city’s overall General Obligation debt as a percentage of the statutory limit (including a recommendation to borrow an additional $6.5 million) is 29.0 percent for 2020 (in comparison to the City’s goal to not exceed 60 percent).
As of December 31 Net Debt Outstanding Ratio of Net Debt to Debt Capacity 2017 2018 2019 2020
$27,313,477 $35,373,845 $43,237,359 $43,341,976
20.9% 25.2% 29.6% 29.0%
Of the 29.6 percent of (existing) 2019 legal debt used, 70.4% of this debt is non-TID related.
Actual Fund Balance
Target Fund Balance
18

Bond Rating The city’s 2019 bond rating is further evidence of its financial strength. Sheboygan’s general obligation bonds are currently rated Aa2 by Moody’s Investors Service. Having solid financial policies and prudent financial management practices are principle reasons for this excellent bond rating. This “strong” rating translates directly into lower interest rates on the city’s debt. LOCAL ECONOMY AND DEVELOPMENT ACTIVITY The city’s moderate economic growth has contributed to the community’s low unemployment rate of 2.8 percent (December 2019) which is comparable to Wisconsin’s 3.4 percentage rate, and lower than the United States’ 3.5 percentage rate. This low unemployment rate is accomplished by a solid manufacturing base. Sheboygan County has the third highest concentration of manufacturing jobs (per capita) in the nation. The City of Sheboygan is located on the west shore of Lake Michigan and is substantially surrounded by the developed areas of the Towns of Wilson and Sheboygan and the Village of Kohler. As such, the city has limited opportunities for geographic expansion. The city continues to promote redevelopment of older sections of the community into higher density uses. Multifamily development investment continues in Sheboygan. In late 2019, construction will finish on three apartment and/or condominium projects: 7Penn apartments - $13 million valuation, The Luxe apartments – $8 million valuation and Water’s Edge condominiums (Phase 1) - $7 million valuation. Three additional multifamily projects started in 2019 and are expected to be completed in 2020 are Badger State Lofts mixed use project including apartments - $30 million, South Pier condominiums (Phase 1) - $6 million valuation and Kingsbury Village Apartments - $6 million valuation. For the third year in row since the Great Recession, existing residential properties appreciated in valuation, with a five percent increase in 2018. Regarding new construction in 2019, the city experienced another year of limited single and two-family home construction. An increase is expected in 2020 due to the development of a new subdivision on the city’s southwest side. Several development projects completed in 2019 are 159,253 square foot Meijer supercenter, 54,000 square foot visual art storage facility - the Art Preserve, by John Michael Kohler Arts Center on 39 acres, 4,300 square foot Panera Restaurant, 16,570 square foot Dulmes Décor Carpet One, 12,300 square foot Central Tool House multi-tenant building, 61,000 square foot Prevea medical office building, and 27,000 square foot FedEx distribution center. Two new hotels with a total of 201 rooms commenced construction in 2019 - Fairfield Inn and Suites and Hampton Inn. A Sheboygan-based insurance company, Acuity Insurance, began construction of 715-space parking structure and 41,000 square foot recreation center in second half of 2019. In 2019, the city completed the construction of the municipal-owned SouthPointe Enterprise Campus, a 150 acre business park located on the southwest side of the city. The city continues to take the lead in the redevelopment of Indiana Avenue corridor with the financial assistance of a 2018-created tax incremental district (TID 17). This corridor will feature Fresh Tech Innovation District, a live-work-play talent magnet for innovation and entrepreneurship. CONCLUSION The 2020 Budget is committed to advancing the city’s Strategic Plan and its 2020 Action Items. Consistent with the city's effort to be transparent, Sheboygan will continue to provide quarterly financial information including revenue and expenditures. In addition to financial information, the city also presents key departmental and fund benchmarks.
19

The 2020 Annual Program Budget is the first Sheboygan budget document created from a budget software module which directly utilizes information from Munis, the city’s enterprise resource planning (ERP)software. With the new electronic enhancements, this 2020 Annual Program Budget maintains consistency with the city’s Strategic Plan’s focus area regarding Governing and Fiscal Management.
In an effort to streamline the 2020 Budget document for the reader, the financial information including all revenues and expenditures contained within the 2020 Annual Program Budget book is reported in its category format. All complete account level detail formerly contained within the 2017 to 2019 Annual Program Budget documents’ is now located in the 2020 Annual Program Budget Revenue and Expenditures Detail – Addendum.
I want to thank all of the city’s Management Team and their support staff, especially Finance Director/Treasurer Marty Halverson and Assistant to the City Administrator Carrie Arenz for their assistance in developing the “next generation” 2020 Annual Program Budget.
Respectively submitted,
Darrell Hofland City Administrator
20

21

Marc A . Ott IC MA Exec utive Director
M A O Karen Pinkos IC MA Pres ident
Sheboygan, WI
This
Certificate of Distinction is presented to
for exemplifying the standards established by the International City/County Management Association in the application of performance data to local government management,
including training, verification, public reporting, planning and decision making, networking and accountability.
Presented at the 105th ICMA Annual Conference in Nashville/Davidson County, Tennessee
21 October 2019
22

STRATEGIC PLAN
INTRODUCTION
The City of Sheboygan is committed to its 2015 mission statement,
"The City is dedicated to providing residents, the business community and visitors with fiscally-responsible municipal services in an effective and responsive manner to meet the needs of our diverse community”
and its vision statement,
“The City of Sheboygan will be a family oriented and prosperous community with a wide-variety of housing, business, cultural and recreational opportunities in safe and attractive neighborhoods.”
To accomplish these statements, the city conducted strategic planning in 2016. The strategic planning process involved the public, elected officials and city staff. In addition to a community survey, a retreat by the Common Council and the city’s management team was held. The planning process resulted in the following:
Identified six goals that will enable the city to move forward in accomplishing its mission statement;
Determined how it will respond to these goals through development of key strategies and related objectives;
Developed 2017 and 2018 action items to address the most critical issues facing the community. These action items were revised and added for 2019 and 2020;
Identified critical measures to use as a “scorecard” in measuring results; and Sought to improve city residents’ confidence and trust that their city leaders are
working on the issues that residents believe are key to improving the quality of their lives.
STRATEGIC PRIORITIES
Based on data analysis and elected officials, City staff and community input, the city has developed six focus areas. These focus areas (and their goal statements) serve as the foundation for the Strategic Plan. 1. Quality of Life 2. Infrastructure and Public Facilities 3. Economic Development
4. Neighborhood Revitalization 5. Governing and Fiscal Management 6. Communication
In summer 2016, the city conducted its first annual community survey to rate resident satisfaction with some of the city’s goals, key strategies and related objectives. The community survey continues annually. The following table is a sampling of the 2019 survey results which relate to the Strategic Plan’s objectives:
23

Provide comprehensive,
timely and accurate
information
Improve the overall performance of the
city, focusing on economic and
business development
Continue to improve the quality of life
Crime reduction in our neighborhoods
Keeping citizen informed with a
rating of Good or Excellent
56%
Overall performance of the city rated as Good or Excellent
71%
Overall Quality of Life rated Good or
Excellent 87%
Police Department services with rating of
Good or Excellent 86%
City website as useful source of
information 62%
Attracting and keeping businesses
in Sheboygan is rated as Important or Very Important
82%
Overall direction the city is headed
with a rating of Steady or Improving
78%
Support for the neighborhoods in
Sheboygan rated as Important or Very
Important 92%
STRATEGIC INITIATIVES
The series of tables that follow provide examples of several City’s Focus Areas, Goals, Key Strategies, and some of the 2020 Budgeted Programs, Services or Capital Improvements Projects that support these initiatives and priorities.
Focus Area - Quality of Life
Goal Key Strategies Budgeted Programs, Services
or Capital Projects
Provide citizens with a safe and
secure community which invests in
outstanding recreation, libraries,
and open spaces maximizing the natural environ-
ment, which delivers transpor-
tation choices, elevates culture,
arts, education, and ensures solutions
that are sustainable and
environmentally responsible.
Refurbish, maintain, develop, and/or expand public use places and spaces.
Support and enhance programming and activities that encourage increased guardianship and crime reduction in our neighborhoods.
Improve local parks including ADA accessibility updates, completion of Moose Park playground construction - $25,000, Roosevelt Park tennis court resurfacing - $90,000, Evergreen Park Bridge construction - $180,000.
Allocate Community Block Grant funds to non-profit public service entities - $158,000.
Continue focus on the use and expansion of neighborhood associations to strengthen and empower residents to improve the community.
Continue funding of north and south side neighborhood beat officer positions - $211,434.
24

Focus Area – Infrastructure and Public Facilities
Goal Key Strategies Budgeted Programs, Services
or Capital Projects
Improve the quality of life by effectively developing, maintaining and improving the infrastructure, natural resources and community services.
Provide quality infrastructure that conveys safe, efficient delivery of essential goods and services.
Continue focus on city street resurfacing projects, including Superior Avenue - $5,629,000.
Begin design phase for “Smart City” traffic light coordination project for construction in 2021 for Taylor Drive, 14th Street and Kohler Memorial Drive / Erie Avenue - $399,400.
Renovate the former Van Der Vaart site and surrounding infrastructure in anticipation of future residential expansion - $2,000,000.
Preserve and maintain city buildings and/or facilities in a manner that provides a safe environment for the facilities’ functions and occupants.
Begin repairs to Fire Station 2 - $317,644.
Install ADA accessible walkways within local parks - $25,000.
Continue sanitary sewer maintenance and relining program - $750,000.
Invest in operational upgrades to the Wastewater Treatment Facility to extend the working lifetime of this regional facility - $800,000.
Focus Area – Neighborhood Revitalization
Goal Key Strategies Budgeted Programs, Services
or Capital Projects
Encourage reinvestment in the city’s housing stock
and create solid neighborhoods with strong leadership and ensure quality
new housing developments.
Preserve historic housing, neighborhood elements, safety, security and support initiatives that improve rental housing stock in the city.
Continue to issue new façade and landscaping grants to qualifying applicants - $712,964.
Continue annual community partnership / volunteering events to provide light home repair, landscaping and clean-up services.
25

Focus Area – Economic Development
Goal Key Strategies Budgeted Programs, Services
or Capital Projects
Actively pursue economic and
business development strategies to
support a growing and sustainable economic base,
ensuring the financial resources needed to improve the quality of life, fund services and
provide diverse job opportunities for city residents.
Support existing manufacturing businesses and offer opportunities for attraction and expansion.
Contribute to Sheboygan County Economic Development Corporation - $100,000.
Continue development of the Innovation District by completing numerous infrastructure improvements including street improvements ($3,500,000) and parking lot expansion ($300,000) to leverage private sector development - $30 million.
Coordinate with Sheboygan County and Village of Kohler for the construction of infrastructure to support the future $324 million Advocate Aurora medical center - $500,000.
Support implementation of the Sheboygan master plan including revitalization of commercial districts: Harbor Centre, Michigan Avenue, Indiana Avenue, Taylor Drive, and South Business Drive.
Continue expansion of Indiana Avenue corridor and trail project to further improve revitalization efforts - $1,300,000.
Install downtown LED street lighting upgrade - $171,400.
Offer low interest business loans with job creation commitment.
Establish the design and construction of new wayfinding signage throughout the city to create a connected community - $50,000.
26

Focus Area – Governing and Fiscal Management
Goal Key Strategies Budgeted Programs, Services
or Capital Projects
Implement innovative and responsible policies and business practice to effectively manage its fiscal and human resources and maintain an outstanding quality of life for our citizens.
Develop efficient, transparent processes/systems to provide financial information and foster sustainability.
Create 2020 Annual Program Budget which complies with criteria of Government Finance Officers Association for the Distinguish Budget Presentation award.
Create 2020 Comprehensive Annual Financial Report and Popular Annual Financial Report which complies with criteria of Government Finance Officers Association for award.
Continue improvement on performance measurement throughout the year in an effort to receive the third ICMA Certificate of Distinction in Performance Management award.
Utilize ClearGov to improve transparency and analysis of financial and benchmark information.
Provide a safe, healthy, and supportive work environment valuing employee contribution to the community.
Maintain the robust employee wellness program to increase awareness of health and wellness issues and provide an interactive mechanism for employees to achieve their healthiest possible lifestyle.
Continue to coordinate with Friends of Library and Friends of Senior Activities Center groups to leverage use of volunteers to supplement the core levels of service needed.
Continue partnering and educational opportunities between various city departments and Sheboygan Area School District.
27

Focus Area – Communication
Goal Key Strategies Budgeted Programs, Services
or Capital Projects
Ensure effective and consistent communication using new technologies, innovative approaches, and brand identity that ensure transparency and encourage dialogue amongst residents and governmental agencies.
Maximize the use of electronic communication to provide comprehensive, timely and accurate information.
Continue to use of social media, (Facebook, Nextdoor, Twitter), email and text (Nixle) communication, and The Sheboygan Insider, an online community newsletter.
Maintain transparency and improved communication to the community by continuing to provide information in the documents such as the Performance Scorecard, Certified Annual Financial Report, and Popular Annual Financial Report.
Continue annual community survey.
Manage GIS system to improve communication to residents relative to Public Works projects.
Inform citizens of news, services, programs and events with unique and compelling video productions.
Continue live broadcasts of Common Council and Committee of the Whole meetings.
Maintain collaborative relationships with the Sheboygan Area School District, Sheboygan County, and UW Green Bay, Sheboygan Campus.
Create public service announcement of topics that are important to the city government and its residents.
Utilize new audio-visual system in Council Chambers to improve quality and transmission of meeting recordings.
In order to achieve the above strategies, the city has created core values which are a guide for all action and reflect what the city requires of its employees and expects from its elected officials. The following core values set the high standard of which the city government expects to be measured:
Respect Accountability Teamwork
Fiscal Responsibility Service Innovation
28

PLANNING CYCLE To further the city's planning process, the city utilizes data and input from elected officials, residents, and businesses to identify community needs and requirements. Once the community needs and requirements are confirmed, each department develops objectives and action items to address those needs. Those action items are then prioritized and incorporated into the annual budget process to be funded. The resulting action items are annual revisited and refined based on citizen-generated input through meetings and citizen requests, etc. In addition, the city conducts an annual community survey, which is used to rate residents’ satisfaction with current services. In each subsequent year, the cycle will begin again with data analysis and community input (see Figure 1 below).
Figure 1: Strategic Planning Cycle
STRATEGIC SCORECARD With the goals and key strategies determined, the city has identifies objectives and related benchmarks (or critical measurements) to implement these strategic initiatives and to monitor progress throughout the year. Benchmarks are located in each program budget section. Most of the budgetary objectives are represented with outcome measures (lag indicators) and performance drivers (lead indicators). Each measurement has a target goal, which was determined based on benchmarking of the city’s historical data, and the
1) Analyze Data and Community Input
2) Develop Objectives and
Action Items
3) Prioritize and Fund Action Items
4) Implement Action Items
5) Review progress throughout the
year
29

city's desired outcome. The measurements will represent the effectiveness of accomplishing the respective objective.
ACCOLADES*
The city’s ongoing commitment to its residents has been recognized by outside agencies and organizations through the presentation of various awards and certificates over the past five years, including the following:
1. SolSmart Bronze Designee: U.S. Department of Energy-Solar Technology (November 2019) 2. America’s Most Unique Art Towns: Sheboygan ranked #7 (cubesmart.com, July 2019) 3. Best Cities to Live in Wisconsin: Sheboygan ranked #10 (chamberofcommerce.org, June
2019) 4. Best Cities for Older Americans in Retirement: Sheboygan ranked #9, 24/7 Wall Street, April
2019. 5. Best Places for Millennials to Move: Sheboygan ranked #5 , reviews.org, March, 2019 6. Best Small Cities for Business, chamberofcommerce.org, 2019 7. Government Finance Officers Association of the United States and Canada (GFOA) Award
for Outstanding Achievement in Popular Annual Financial Reporting (2017 PAFR), gfoa.org, 2019
8. Government Finance Officers Association of the United States and Canada (GFOA) Certificate of Achievement for Excellence in Financial Reporting and Comprehensive al Financial Reporting for the Comprehensive Annual Financial Report (2017 CAFR) gfoa.org, 2019
9. Government Finance Officers Association of the United States and Canada (GFOA) Distinguished Budget Presentation Award, gfoa.org, 2018 and 2017
10. International City / County Management Association (ICMA) Certificate of Distinction in Performance Management, icma.org, 2019 and 2018
11. Number 2 – Top ten most Livable U.S communities – small community population size, AARP, 2018
12. Number 15 – Best Places to Retire – 30 Best Cities for Older Americans, USA Today, 2018 13. Number 6 – National Corporate Facility Project Development, WEDC.org, 2018 14. Number 6 – Leading Metropolitan Areas for Corporate Facility Investment with Population
less than 200,000, siteselection.com, 2018 15. Number 23 – Safest Cities for Families, securitychoice.com, 2018 16. Number 34 – Safest Cities to Retire, securitychoice.com, 2018 17. Bronze level – Bicycle Friendly Community, The League of American Bicyclists, 2018 - 2022 18. Harbor Center Marina, Elite Fleet Boaters’ Choice Award – Marinas.com, 2019, 2018 19. Number 1 – Cities with the Lowest Poverty Rate of 5.4%, 247wallst.com, 2017 20. One of three AARP Age Friendly / Livable Communities in Wisconsin, 2017 21. Runner Friendly Community, Road Runners Club of America, August 2017 22. Engineering Excellence Award for UV Water Purification Process, American Council of
Engineering Consultants, 2017 23. International City/County Management Association’s Certificate of Achievement in
Performance Management, ICMA, 2017 24. 30 Small Towns with the Best Festivals – Bratwurst Days, Top Value Reviews, 2017 25. Number 23 – America’s 25 Most Affordable Housing Markets, 247wallst.com, 2017 26. Top 10 ranking – Great Places to Live on Less than $40,000, AARP, 2016 27. Top 10 ranking for Downtown Sheboygan – Most Walkable Neighborhoods in the Midwest
for Mid-Sized Cities, Redfin, 2016 28. Number 9 – Top 10 Safest Metros in the Midwest, lawstreetmedia.com, 2015
*For a complete list of accolades received by the City of Sheboygan, please visit our website, www.sheboyganwi.gov.
30

FUND STRUCTUREBy Budgetary Basis
Government Fund Types Proprietary Fund Types
General Fund Special Revenue Funds
Debt Service Funds
Capital Improvement
Funds
Fiduciary Funds
MEG Unit Fund
General Obligation Debt Fund
Capital Project Fund
Cemetery Perpetual Care Fund
Com. Develop. Block Grant
Fund Convention Center Debt
Fund
Capital Improvement
Fund
Housing Revolving Loan
Fund Industrial Park Fund
Business Revolving Loan
Fund TID 6 Capital Project Fund
Mead Public Library Fund
TID 12 Capital Project Fund
Tourism Fund
TID 14 Capital Project Fund
Park, Forestry and Open
Space Fund
Park Impact Fee Fund
Cable TV Fund
Municipal Court Fund
Wastewater Fund
Boat Facilities Fund
Recycling Fund
TID 5 Debt Service Fund
TID 6 Debt Service Fund
TID 10 Debt Service Fund
TID 11 Debt Service Fund
TID 12 Debt Service Fund
TID 13 Debt Service Fund
TID 14 Debt Service Fund
TID 15 Debt Service Fund
TID 16 Debt Service Fund
TID 18 Debt Service Fund
TID 19 Debt Service Fund
Ambulance Fund
Special Assessment
Fund
Harbor Centre Fund
Redevelopment Authority Fund
Storm Water Fund
Mead Public Library Trust
Fund
Parking Utility Fund
Transit Utility Fund
Water Utility Fund
Motor Vehicle Fund
Health Insurance Fund
Liability Insurance Fund
Workers Compensation Fund
Modified Accrual Basis of Budgeting Accrual Basis of Budgeting
TID 16 Capital Project Fund
TID 17 Capital Project Fund
Maywood Park Fund
TID 18 Capital Project Fund
TID 19 Capital Project Fund
Information Technology Fund
Environmental TID Debt Service
Neighborhood Revitalization
Fund
31

BUDGETARY BASIS Budgetary Basis refers to the point in time at which revenues and expenditures are recognized in the accounts and reported in the financial statements. Modified Accrual is the method under which revenues and other financial resource increments are recognized when they become susceptible to accrual; that is, when they become both "measurable" and "available to finance expenditures of the current period." "Available" means collectible in the current period or soon enough thereafter to be used to pay the liabilities of the current period. The Governmental Funds (General, Special Revenue, Debt Service, and Capital Improvement) and Fiduciary Funds are budgeted and accounted for using the modified accrual basis of accounting. Property taxes are recorded in the year levied as receivable and deferred revenues. They are recognized as revenues in the succeeding year when services financed by the levy are being provided. Property taxes are levied and billed in December; payment in full or the first installment payment due date is January 31; the second installment payment due date is July 31. Intergovernmental aids and grants are recognized as revenues in the period the related expenditures are incurred, if applicable, or when the city is entitled to the aids. Special assessments are recorded as revenues when collected. Annual installments due in future years are reflected as receivables and deferred revenues. Other general revenues such as fines and forfeitures, inspection fees, recreation fees, and miscellaneous revenues are recognized when received in cash or when measurable and available under the criteria described above. Accrual Basis indicates revenues are recorded when they are earned (whether or not cash is received at the time) and expenditures are recorded when goods and services are received (whether cash disbursements are made at the time or not). Financing reporting for the Proprietary Funds is on the accrual basis of accounting. Depreciation is budgeted as a separate capital and debt activity and is identified as part of the balance sheet for presentation.
FUND DESCRIPTIONS Governmental accounting systems should be organized and operated on a fund basis. Individual resources are allocated to, and accounted for, in separate accounting entities, identified as funds, based upon the purposes for which they are to be spent and the means by which spending activities are legally controlled.
32

Governmental units should establish and maintain those funds required by law and sound financial administration. Only the minimum number of funds consistent with legal and operating requirements should be established because unnecessary funds result in inflexibility, undue complexity, and inefficient financial administration. Individual funds are classified into three broad categories: Governmental, Proprietary, and Fiduciary. All funds are appropriated.
Governmental Fund Types Governmental Fund Types are subdivided into four sections: General Fund, Special Revenue Funds, Debt Service Funds and Capital Improvement Funds. General Fund: The general operating fund used to account for most of the day to day
activities of the city. Special Revenue Funds: Account for the proceeds of specific revenue sources that
are legally restricted to expenditures for specified purposes. Debt Service Funds: Account for the accumulation of resources for the payment of
general long-term debt principal, interest and related costs. Capital Improvement Funds: Account for the financing and expenses associated
with major equipment purchases, land purchases or infrastructure projects
Fund 101 – General Fund (Major Fund)
The General Fund of a government unit serves as the primary reporting vehicle for current government operations. The General Fund, by definition, accounts for all current financial resources not required by law or administrative action to be accounted for in another fund. The major sources of revenue for the General Fund include Property taxes and Intergovernmental revenue. The major departments funded are: Office of the Mayor, Office of the City Administrator, Office of the City Clerk, Finance, Human Resources, Office of the City Attorney, Police, Fire, Public Works and City Development. This fund is considered a major fund. Fund 202 – Police MEG Unit Fund (Non-Major Fund) The Police MEG Unit Fund is a Special Revenue Fund used to account for the operation of a multi-jurisdictional drug unit in Sheboygan County. This fund is considered a non-major fund. Fund 218 – Block Grant Fund (Non-Major Fund) The Block Grant Fund is a Special Revenue Fund used to account for expenditures within the Community Block Grant entitlement funds. Annually, the City of Sheboygan receives entitlement from the U S Department of Housing and Urban Development to benefit residents living within low to moderate income levels in the city. The allocation of the grant funds are recommended annually by the Finance and Personnel Committee after review of the programs within the parameters of the federal funding and approved by the Common Council. This fund is considered a non-major fund.
33

Fund 223 – Housing Revolving Loan Fund (Non-Major Fund) The Housing Revolving Loan Fund is a Special Revenue Fund used to account for costs associated with operating the loan program which offers low interest and/or deferred principal payments for owner-occupied and owner-investor properties that house low to moderate income persons to provide safe and affordable housing opportunities in the city. This fund is considered a non-major fund. Fund 224 – Business Revolving Loan Fund (Non-Major Fund) The Business Revolving Loan Fund is a Special Revenue Fund used to account for costs associated with operating the loan program which offers low interest financing to companies that are unable to obtain loans solely from financial institutions and the Small Business Administration. The loan program is predicated upon job creation for low to moderate income individuals. This fund is considered a non-major fund. Fund 250 – Neighborhood Revitalization Fund (Non-Major Fund) The Neighborhood Revitalization Fund is a Special Revenue Fund use to account for activities associated with programs to benefit affordable housing. This fund is considered a non-major fund. Fund 255 – Mead Library Fund (Non-Major Fund) The Mead Library Fund is a Special Revenue Fund used to account for current operations and capital costs associated with the Mead Library. This fund is considered a non-major fund. Fund 260 – Tourism Fund (Non-Major Fund) The Tourism Fund is a Special Revenue Fund used to account for the collection of room tax revenue and the use of the funds. This fund is considered a non-major fund. Fund 265 – Park, Forestry and Open Space Fund (Non-Major Fund) The Park, Forestry and Open Space Fund is a Special Revenue Fund used to account for activities and capital costs associated with implementing park and forestry related projects to improve the quality of life in the city. This fund is considered a non-major fund. Fund 266 – Park Impact Fee Fund (Non-Major Fund) The Park Impact Fee Fund is a Special Revenue Fund used to account for costs associated with the increased demand for new, expanded or improved park facilities relative to new development. This fund is considered a non-major fund.
34

Fund 270 – Cable TV Fund (Non-Major Fund) The Cable TV Fund is a Special Revenue Fund used to account for all cable television franchise fees and the operation of WSCS, the city’s cable channel. This fund is considered a non-major fund. Fund 275 – Municipal Court Fund (Non-Major Fund) The Municipal Court Fund is a Special Revenue Fund used to account for the collection of fines and forfeitures of the City of Sheboygan and Village of Kohler. This fund is considered a non-major fund. Fund 280 – Ambulance Fund (Non-Major Fund) The Ambulance Fund is a Special Revenue Fund used to account for the collection and expenses relating to the Fire Department-provided ambulance service. This fund is considered a non-major fund. Fund 285 – Special Assessment Fund (Non-Major Fund) The Special Assessment Fund is a Special Revenue Fund used to account for special assessment outstanding to property owners where infrastructure projects resulted in assessments. This fund is considered a non-major fund. Fund 290 – Harbor Centre Marina Fund (Non-Major Fund) The Harbor Centre Marina Fund is a Special Revenue Fund used to account for activities associated with the operation of the marina in conjunction with a management agreement. This fund is considered a non-major fund. Fund 295 – Redevelopment Authority Fund (Non-Major Fund) The Redevelopment Authority Fund is a Special Revenue Fund used to account for activities relating to the prevention and elimination of blight and slum conditions in the city. This fund is considered a non-major fund. Fund 605 – Storm Water Fund (Non-Major Fund) The Storm Water Fund is a Special Revenue Fund used to account for activities relating to erosion control activity in the city. This fund is considered a non-major fund. Fund 301 – G. O. Debt Service Fund (Major Fund) The G.O. Debt Service Fund is a Debt Service Fund used to account for the accumulation of resources for the payment of general long term debt principal, interest and related costs. This fund is considered a major fund.
35

Fund 304 – TID 6 Debt Service Fund (Non-Major Fund) The TID 6 Debt Service Fund is a Debt Service Fund used to account for the accumulation of resources for the payment of general obligation long term debt principal, interest and related costs for Tax Incremental District 6. This fund is considered a non-major fund. Fund 305 – TID 5 Debt Service Fund (Non-Major Fund) The TID 5 Debt Service Fund is a Debt Service Fund used to account for the accumulation of resources for the payment of general obligation long term debt principal, interest and related costs for Tax Incremental District 5. This fund is considered a non-major fund. Fund 307 – TID 7 Debt Service Fund (Non-Major Fund) The TID 7 Debt Service Fund is a Debt Service Fund used to account for the accumulation of resources for the payment of general obligation long term debt principal, interest and related costs for Tax Incremental District 7. This fund is considered a non-major fund Fund 310 – TID 10 Debt Service Fund (Non-Major Fund) The TID 10 Debt Service Fund is a Debt Service Fund used to account for the accumulation of resources for the payment of general obligation long term debt principal, interest and related costs for Tax Incremental District 10. This fund is considered a non-major fund. Fund 311 – TID 11 Debt Service Fund (Non-Major Fund) The TID 11 Debt Service Fund is a Debt Service Fund used to account for the accumulation of resources for the payment of general obligation long term debt principal, interest and related costs for Tax Incremental District 11. This fund is considered a non-major fund. Fund 312 – TID 12 Debt Service Fund (Non-Major Fund) The TID 12 Debt Service Fund is a Debt Service Fund used to account for the accumulation of resources for the payment of general obligation long term debt principal, interest and related costs for Tax Incremental District 12. This fund is considered a non-major fund. Fund 313 – Environmental TID Debt Service Fund (Non-Major Fund) The Environmental TID Debt Service Fund is a Debt Service Fund used to account for the accumulation of resources for the payment of general obligation long term debt principal, interest and related costs for Environmental Tax Incremental District. This fund is considered a non-major fund.
36

Fund 314 – Convention Center Debt Service Fund (Major Fund) The Convention Center Debt Service Fund is a Debt Service Fund used to account for the accumulation of resources for the payment of general obligation long term debt principal, interest and related costs of the Convention Center. This fund is considered a major fund. Fund 316 – TID 13 Debt Service Fund (Non-Major Fund) The TID 13 Debt Service Fund is a Debt Service Fund used to account for the accumulation of resources for the payment of general obligation long term debt principal, interest and related costs for Tax Incremental District 13. This fund is considered a non-major fund. Fund 317 – TID 14 Debt Service Fund (Non-Major Fund) The TID 14 Debt Service Fund is a Debt Service Fund used to account for the accumulation of resources for the payment of general obligation long term debt principal, interest and related costs for Tax Incremental District 14. This fund is considered a non-major fund. Fund 318 – TID 15 Debt Service Fund (Non-Major Fund) The TID 15 Debt Service Fund is a Debt Service Fund used to account for the accumulation of resources for the payment of general obligation long term debt principal, interest and related costs for Tax Incremental District 15. This fund is considered a non-major fund. Fund 319 – TID 16 Debt Service Fund (Non-Major Fund) The TID 16 Debt Service Fund is a Debt Service Fund used to account for the accumulation of resources for the payment of general obligation long term debt principal, interest and related costs for Tax Incremental District 16. This fund is considered a non-major fund. Fund 320 – TID 17 Debt Service Fund (Non-Major Fund) The TID 17 Debt Service Fund is a Debt Service Fund used to account for the accumulation of resources for the payment of general obligation long term debt principal, interest and related costs for Tax Incremental District 17. This fund is considered a non-major fund. Fund 321 – TID 18 Debt Service Fund (Non-Major Fund) The TID 18 Debt Service Fund is a Debt Service Fund used to account for the accumulation of resources for the payment of general obligation long term debt principal, interest and related costs for Tax Incremental District 18. This fund is considered a non-major fund.
37

Fund 322 – TID 19 Debt Service Fund (Non-Major Fund) The TID 19 Debt Service Fund is a Debt Service Fund used to account for the accumulation of resources for the payment of general obligation long term debt principal, interest and related costs for Tax Incremental District 19. This fund is considered a non-major fund. Fund 400 – Capital Project Fund (Non-Major Fund) The Capital Project Fund is a Capital Improvement Fund used to account for the costs associated with projects, major equipment purchases and land purchases included in the tax levy and funded through State and Federal grants as well as contributions to the city. This fund is considered a non-major fund. Fund 407 – Industrial Park Fund (Non-Major Fund) The Industrial Park Fund is a Capital Improvement Fund used to account for the costs associated with the development of land for industrial park development. This fund is considered a non-major fund. Fund 411 – TID 6 Capital Project Fund (Non-Major Fund) The TID 6 Capital Project Fund is a Capital Improvement Fund used to account for the costs associated with the project plan for development. This fund is considered a non-major fund. Fund 422 – TID 12 Capital Project Fund (Non-Major Fund) The TID 12 Capital Project Fund is a Capital Improvement Fund used to account for the costs associated with the project plan for development. This fund is considered a non-major fund. Fund 424 – TID 14 Capital Project Fund (Non-Major Fund) The TID 14 Capital Project Fund is a Capital Improvement Fund used to account for the costs associated with the project plan for development. This fund is considered a non-major fund. Fund 426 – TID 16 Capital Project Fund (Non-Major Fund) The TID 16 Capital Project Fund is a Capital Improvement Fund used to account for the costs associated with the project plan for development. This fund is considered a non-major fund. Fund 427 – TID 17 Capital Project Fund (Non-Major Fund) The TID 17 Capital Project Fund is a Capital Improvement Fund used to account for the costs associated with the project plan for development. This fund is considered a non-major fund.
38

Fund 428 – TID 18 Capital Project Fund (Non-Major Fund) The TID 18 Capital Project Fund is a Capital Improvement Fund used to account for the costs associated with the project plan for development. This fund is considered a non-major fund. Fund 429 – TID 19 Capital Project Fund (Non-Major Fund) The TID 19 Capital Project Fund is a Capital Improvement Fund used to account for the costs associated with the project plan for development. This fund is considered a non-major fund. Fund 479 – Capital Improvement Fund (Non-Major Fund) The Capital Improvement Fund is a Capital Improvement Fund used to account for projects in the 2020-2024 Capital Improvements Program approved for funding. Projects include infrastructure improvements and equipment purchases. This fund is considered a non-major fund. Fiduciary Fund Types Fiduciary Funds: Accounts for activities which the principal asset is permanently reserved. Fund 805 – Cemetery Perpetual Care Fund (Non-Major Fund) The Cemetery Perpetual Care Fund is a Fiduciary Fund established by city ordinance to aid in the maintenance of Wildwood Cemetery. Revenues, derived principally from interest on the trust balance, are used to pay a certain portion of the maintenance costs of the cemetery. This fund is considered a non-major fund. Fund 850 – Mead Public Library Trust Fund (Non-Major Fund) The Mead Public Library Trust Fund is a Fiduciary Fund established through private donations for the purpose of benefiting the library. Expenditures are restricted to library programs and repairs. On August 25, 2016, the Mead Public Library Board of Trustees changed the name of the funds from the Everhard-Forrer 850 funds to the Mead Public Library Trust Fund. This fund is considered a non-major fund. Proprietary Fund Type
Proprietary Fund Type is subdivided into two sections: Enterprise Funds and Internal Service Funds. Enterprise Funds: Account for the operations that are financed and operated in a
manner similar to private business, where the intent of the governing body is that the cost (expenses, including depreciation) of providing goods or services to the general public on a continuing basis be financed or recovered primarily through user charges, or where the governing body has decided that periodic determination of revenues
39

earned, expenses incurred, and/or net income is appropriate for capital maintenance, public policy, management control, accountability or other purposes.
Internal Service Funds: Account for the financing of goods or services provided by one department or agency to other departments or agencies of the city or to other governments on a cost reimbursement basis.
Fund 601 – Wastewater Utility Fund (Major Fund) The Wastewater Utility Fund is an Enterprise Fund that accounts for segregated costs associated with the Wastewater System in order to establish fair and equitable sewer service rates, providing service to residential, municipal and commercial customers and bills customers on either a monthly or quarterly basis. This fund is considered a major fund. Fund 611 – Boat Facilities Fund (Non-Major Fund) The Boat Facilities Fund is an Enterprise Fund established to segregate revenues and expenditures for the purpose of determining adequate user fees for the riverfront boat mooring facilities. This fund is considered a non-major fund. Fund 620 – Recycling Utility Fund (Non-Major Fund) The Recycling Utility Fund is an Enterprise Fund established to segregate revenues and expenditures for the purpose of determining adequate user fees for the recycling program. This fund is considered a non-major fund. Fund 650 – Parking Utility Fund (Non-Major Fund) The Parking Utility Fund is an Enterprise Fund established to account for revenues derived from parking meters, permits and other revenues attributable to parking. The revenues are used to defray administrative and operational costs related to parking operations and to acquire, landscape, beautify and construct parking lots and structures. This fund is considered a non-major fund. Fund 651 – Transit Utility Fund (Major Fund) The Transit Utility Fund is an Enterprise Fund established to segregate revenues and expenditures of the Transit System for the purpose of determining adequate user fees giving consideration to additional funding from the Federal, State and City government. This fund is considered a major fund. Fund 804 – Water Utility Fund (Major Fund) The Water Utility Fund is an Enterprise Fund established to account for all activities necessary to provide water services to residents of the city and outlying areas. Fund activities include administration, billing and collection, operations, maintenance, financing and related debt service. This fund is considered a major fund.
40

Fund 701 – Motor Vehicle Fund (Non-Major Fund) The Motor Vehicle Fund is an Internal Service Fund established to account for central automotive equipment operations. Operations include the repair and maintenance of vehicles and motorized equipment used by the city. This fund is considered a non-major fund. Fund 704 – Health Insurance Fund (Non-Major Fund) The Health Insurance Fund is an Internal Service Fund established to account for the risk management program established for health insurance. This fund is considered a non-major fund. Fund 705 – Liability Insurance Fund (Non-Major Fund) The Liability Insurance Fund is an Internal Service Fund established to account for the joint venture between the City of Sheboygan and the Wisconsin Mutual Insurance Commission (WMIC) and the Cities and Villages Mutual Insurance Company (CVMIC). This fund is considered a non-major fund. Fund 706 – Workers Compensation Fund (Non-Major Fund) The Workers Compensation Fund is an Internal Service Fund established to account for worker’s compensation payments made by the city since it became self-insured for worker’s compensation as of June 1, 1992. All departments are charged similarly to if the city was insured by an outside entity. This fund is considered a non-major fund. Fund 707 – Information Technology Fund (Non-Major Fund) The Information Technology Fund is an Internal Service Fund established to account for use of computer time, service and maintenance of computer equipment for all city departments. This fund is considered a non-major fund. Major Fund Definition A Major Fund is defined as a fund that reports at least 10 percent of total governmental assets, liabilities, revenues or expenditures and at least five percent of combined city assets, liabilities, revenues or expenditures. A government agency may choose to classify a fund as a major fund if that fund has particular importance to financial users. By definition, the General Fund is always considered a major fund. The remaining major funds are Debt Service Fund, Transit Utility Fund, Wastewater Utility Fund and Water Utility Fund. The non-major funds consist of:
Special Revenue Funds: Police MEG Unit Fund, Block Grant Fund, Housing Revolving Loan Fund, Business Revolving Loan Fund, Neighborhood Revitalization Fund, Mead Library Fund, Tourism Fund, Park, Forestry and Open Space Fund, Park Impact Fee Fund, Cable TV Fund, Municipal Court Fund,
41

Ambulance Fund, Special Assessment Fund, Harbor Centre Marina Fund, Redevelopment Authority Fund and Storm Water Fund.
Capital Improvement Funds: Capital Project Fund, Industrial Park Fund, TID 6 Capital Project Fund, TID 12 Capital Project Fund, TID 14 Capital Project Fund, TID 16 Capital Project Fund, TID 17 Capital Project Fund, TID 18 Capital Project Fund, TID 19 Capital Project Fund and Capital Improvement Fund.
Fiduciary Funds: Cemetery Perpetual Care Fund and Mead Public Library Trust Fund.
Proprietary Funds / Enterprise Funds: Boat Facilities Fund, Recycling Fund, and Parking Utility Fund.
Proprietary Funds / Internal Service Funds: Motor Vehicle Fund, Health Insurance Fund, Liability Insurance Fund, Workers Compensation Fund and Information Technology Fund.
Relationship between Budgeting and Accounting This budget is adopted on a basis consistent with GAAP, except for certain items that are adjusted on the city’s accounting system at fiscal year-end. During the year the city’s accounting system reflects changes in the budget approved by the Common Council, typically an increase in estimated revenue and appropriation upon notification of grants or gifts. Department heads monitor budget to actual expenses via accounting system reports on a monthly basis. The major differences between this budget and GAAP for governmental funds are: a) certain revenues and expenditures, (e.g., compensated absences) not recognized for budgetary purposes are accrued (GAAP); b) supply inventory and self-insurance contributions are recognized as expenditures for budgetary purposes only. Proprietary Fund differences consist of the following: a) certain items, e.g., principal expense and depreciation, are recorded as expenditures for budgetary purposes as opposed to adjustments of the appropriate balance sheet accounts (GAAP); b) capital outlay expenditures are recorded to the appropriate balance sheet accounts (GAAP) and not recognized for budgetary purposes.
42

**See 2020 Annual Program Budget Revenue and Expenditures Detail – Addendum for account level detail.
OVERVIEW OF FISCAL POLICIES, PRESENTATION, AND PROCESS
1. FISCAL POLICIES
Introduction
The City of Sheboygan program budget serves as a comprehensive, rational guide for financial decision-making and operations management throughout the fiscal year.
This is accomplished by the existence of policies and procedures that apply uniformly throughout all city funds, all departments and all programs and services.
A. Forecasting Policy - Projection of Revenues and Expenditures
Each year, the city must develop a plan of action, utilizing its Forecasting Policy for projecting its revenue and expenditures.
The Forecasting Policy helps provides an estimate of how much revenue will be available and the resources required for current service levels and programs over the forecast period, along with an understanding of how the total financial program will be affected by the demographic and economic factors driving these forecasts. The value of forecasts is in estimating whether, given assumptions about local financial policies and economic trends, Sheboygan will have sufficient resources to meet the requirements of ongoing, planned, or mandated programs. Forecast models have the added value of providing a planning tool for capital improvement projects and/or whether bonded indebtedness will be necessary for capital funding. The Forecasting Policy provides an estimate of the financial flexibility of the city, as well as insight into property value, revenue, and service options for the Common Council to address.
The city’s Forecasting Policy reflects a combination of internal analysis and locally generated consensus forecasts covering such factors as: population growth, real estate property values, income per capita, and inflation. Specifically, for the revenue forecasts, the process begins with models including prior year actual collections and project the balance of the current fiscal year based on prior year patterns. For the remaining years of the revenue forecast, consensus forecasts (such as the Wisconsin Department of Revenue) serve as a tool for indication of the expected trends in key economic and demographic indicators. Typically, these forecasts cover the state as a whole, so adjustments to reflect unique conditions in Sheboygan are sometimes necessary.
In general, Sheboygan seeks to match revenue sources with the economic and/or demographic variables that most directly affect year-to-year changes in those revenues. For example, major revenue such as the city’s property taxes will reflect consensus forecasts related to real estate property values; whereas, revenue from construction-related permits and plan reviews will be tied to the anticipated trends in development and re-development. By identifying and utilizing as many revenue-related variables as possible in the forecast, Sheboygan hopes to minimize the risks of overstating or understating revenues that could arise from using only a few variables to forecast all revenue sources.
The City of Sheboygan’s approach to forecasting in general is to apply a conservative philosophy that will produce its long-term goal of not overstating revenues nor understating expenditures. Sheboygan recognizes that economic forecasting is not an exact science and at times relies upon the best professional judgment of the forecaster. To reduce the risks of
43

**See 2020 Annual Program Budget Revenue and Expenditures Detail – Addendum for account level detail.
miscalculating revenues or expenditures, city staff attempts to identify as many factors as possible that may contribute to changes in revenues and expenditures. The city’s revenue and expenditure budgets are comprised of many unique elements that respond to a variety of external factors such as population growth, development, inflation, and interest rates. The following provides our assumptions relating to major revenues and expenditures.
For expenditures, increases are closely linked to inflation (including general inflation, market adjustments to salaries, union settlements of wages, and changes in benefit costs). As with its revenue forecasts, Sheboygan considers consensus forecasts related to general inflation (particularly the trends projected). For certain expenditure categories (such as fuel and utilities), city staff applies inflationary factors that reflect the historical rate of price inflation in these categories relative to overall inflation as identified and forecasted by the U.S. Department of Commerce. For utilities, the city tracks the local utility (natural gas and electricity) company’s (Alliant Energy and WI Public Service Corporation) rate increase or decrease application to the Wisconsin Public Service Commission to make projections.
The outlook for local economic growth in Sheboygan is positive. Sheboygan County unemployment levels continue to remain low in light of job growth of local companies. The job growth has increased the demand for housing within the city. This is reflected in higher housing prices.
Two large employers – Acuity Insurance and Aurora Health Care, recently announced large construction projects totaling almost $350 million. Two hotels – Fairfield Inn and Suites and Hampton Inn, with a total of 201 rooms are under construction. The city has several multifamily apartment or condominium projects under construction or anticipated to commence construction within the next 6 months: The Luxe, 7Penn, Kingsbury Village, Oscar, Water’s Edge, Badger State Lofts, and South Pier. The construction costs will total $117.5 million and the number of additional residential units will total 549.
State of Wisconsin payments to local governments experienced declines in Shared Revenue related to Utility Aids due to the closure of a power generating facility within the city limits. Connecting Highway Payments, Computer Aids and Expenditure Restraint Program are anticipated to remain stable. General Transportation Aids are expected to increase to reflect the city’s increased street reconstruction expenses and an increase in state funding levels.
On a federal level, the duration of the economic expansion may largely be a function of low inflation and moderate rate of economic growth. After the Federal Reserve increased interest rates eight times since 2016, it decreased three times in 2019 in anticipation of slowing economic activity.
B. Resource Allocation and Planning Policy
This policy outlines the allocation of available resources among various city programs and services. The disbursement of these resources may vary each year in response to the current community needs as well as Strategic Plan goals. The goals, in turn, are identified throughout each fiscal year by city management with final approval by the Common Council.
To support the policy, the city annually updates its five year Capital Improvements Program (CIP) in anticipation of the upcoming budget development. Following a review by the Common Council’s standing committees, the Management Team submits their CIP requests to the City Administrator. The City Administrator coordinates the requests and submits a recommendation to the Capital Improvements Commission, which reviews and rates the CIP
44

**See 2020 Annual Program Budget Revenue and Expenditures Detail – Addendum for account level detail.
requests. Recommendations of the Capital Improvements Commission are then forwarded to the Plan Commission and ultimately the Capital Improvements Projects are included in the annual budget are approved by the Common Council.
C. Debt Management Policy
The debt management policy provides the financial management tools to guide the Common Council with the city’s overall debt financing structure. Primary objectives of the policy are to:
Establish the appropriate use of debt. Find alternative methods to pay debt service costs other than property tax. Minimize the city’s debt service and issuance costs. Retain the highest practical credit rating. Provide complete financial reporting and disclosure. Maintain level and affordable annual debt service payments.
The city may use long term financing for the acquisition, maintenance, replacement, or expansion of capital assets and infrastructure. The city will not issue long term debt to fund current operations. Debt will be structured to provide for the shortest repayment period, while minimizing large fluctuations in property tax or other revenue requirements for debt retirement. Generally, the city issues promissory notes with a ten year amortization for capital improvement projects. Tax increment financing projects, and significant facility projects may warrant a longer term debt schedule, but in most cases not to exceed a 20 year repayment schedule. The city will maintain outstanding debt in an amount not exceeding 60 percent of the city’s aggregate statutory borrowing limit prescribed by State Statute 67.03(1)(a), in order to maintain a borrowing appropriate with our credit rating objectives, and the city’s desire to preserve its financial flexibility by maintaining an adequate unused margin to be available for extreme emergencies.
D. Investment Policy
The investment policy applies to activities of the City of Sheboygan with regard to investing the financial assets of all funds. Funds of the city will be invested in accordance with Wisconsin State Statutes and the city investment policies. By Wisconsin Statute, the city can invest in any security which matures or which may be tendered for purchase at the option of the holder within not more than seven years of the date on which it is acquired, if that security is rated the highest or second highest rating category assigned by a nationally recognized rating agency.
E. Capital Improvements Policy
Annually, the city develops a five year CIP. The policy outlines the basis for the CIP. The policy will examine the long range implications of future debt issues on debt outstanding, annual principal and interest requirements and the general property tax levy required for debt service payments. Capital expenditures and capital improvement projects included are defined as follows:
Capital Expenditures – Charges for the acquisition at the delivered price including transportation, costs of equipment, land, buildings, or improvements of land or
45

**See 2020 Annual Program Budget Revenue and Expenditures Detail – Addendum for account level detail.
buildings, fixtures, and other permanent improvements with a value in excess of $25,000 and a useful life expectancy of at least two years. Capital Improvement Projects – An undertaking that has a specific objective, can be easily distinguishable from other work being performed, has a definite beginning and end, does not occur annually, and has a total cost in excess of $50,000.
Annually, the city’s budget includes capital expenditures in two funds, borrowed funds are appropriated in the Capital Improvements Fund and non-borrowed funds are appropriated in the Capital Project Fund.
The approved list of CIP projects is included in the Appendix of the Annual Program Budget.
F. Executive Policy
Included each year in the City Administrator’s preliminary budget instructions to department heads includes a statement of budget parameters approved by the Finance and Personnel Committee and Common Council. The parameters serve as a guide for the upcoming fiscal year.
General Fund Budget that retains eligibility for Wisconsin’s Expenditure Restraint Program.
Equalized tax rate to increase no more than inflationary levels. Maintain city services with no decrease in service level. Leverage city resources through partnerships and shared services / facilities with
other entities. Leverage intergovernmental money to help offset city cost for projects or programs
that promote the Strategic Plan’s Focus Areas. Funding for 2% increase in wages for city workforce. Review user fees including utility rates. Identify planned borrowed funds which will not affect city’s current Aa2 bond rating. Continue Garbage User and Vehicle Registration fees which allows property tax levy
to be reallocated to fund street improvement projects. Balance all Fund budgets, if necessary utilize applied fund balance or planned
borrowed funds proceeds Incorporate 2020 projects, equipment and vehicles identified in the 2020 – 2024
Capital Improvements Program. Continue use of donations between Tax Incremental Districts. Maintain a minimum of 25% uncommitted Fund Balance in the General Fund budget.
G. Fund Policy
In municipal budgeting, a “fund” is a self-balancing set of accounts with revenues earmarked for specific programs or purposes. The city’s Annual Program Budget consists of the following types of funds:
Governmental Funds:
General Fund: Account for the general activities of the city. The principal sources are property taxes and state aids. All departments are financed through this fund with public safety and public works as the largest expenditures.
46

**See 2020 Annual Program Budget Revenue and Expenditures Detail – Addendum for account level detail.
Special Revenue Funds: Account for proceeds from specific revenue sources that are restricted to expenditures for specific purposes. The funds include: Police MEG Unit Fund, Block Grant Fund, Housing Revolving Loan Fund, Business Revolving Loan Fund, Mead Library Fund, Tourism Fund, Park, Forestry and Open Space Fund, Park Impact Fee Fund, Cable TV Fund, Municipal Court Fund, Ambulance Fund, Special Assessment Fund, Harbor Centre Marina Fund, Redevelopment Authority Fund, and Storm Water Fund. A new fund in 2020 is Neighborhood Revitalization Fund.
Debt Service Funds: Account for the accumulation of resources for the payment of general long-term debt principal, interest and related costs. The funds include debt service payments for General Obligation Debts of the city and debt of the Tax Incremental Districts. Two new funds in 2020 are TID 17 and TID 19 Debt Service Fund.
Capital Improvement Funds: Account for the financing and expenses associated with major equipment purchases, land purchases and infrastructure projects for the city and Tax Incremental Districts. The funds include: Capital Project Fund, Industrial Park Fund, TID 6 Capital Project Fund, TID 12 Capital Project Fund, TID 14 Capital Project, Fund, TID 16 Capital Project Fund, TID 17 Capital Project Fund, TID 18 Capital Project Fund, TID 19 Capital Project Fund, and Capital Improvement Fund.
Proprietary Funds: Account for operations that are financed and operated in a manner similar to private business enterprises – where the intent of the governing body is that the cost (expenses including depreciation) of providing goods or services to the general public on a continuing basis be financed or recovered primarily through user charges. The City of Sheboygan has two types of Proprietary Funds: Enterprise Funds and Internal Service Funds. The Enterprise Funds are the Parking Utility Fund, Boat Facility Fund, Transit Utility Fund, Water Utility Fund, Recycling Utility Fund, and Wastewater Utility Fund. The Internal Service Funds are the Motor Vehicle Fund, Health Insurance Fund, Liability Insurance Fund, Workers Compensation Fund, and Information Technology Fund. A new Enterprise fund in 2020 is Recycling Fund.
Fiduciary Funds: Account for activities in which the principal assets are permanently reserved (Cemetery Perpetual Care Fund and Mead Public Library Trust Fund).
Throughout the upcoming fiscal year, the city budget may be amended as needed to reflect new sources of revenue or changes in appropriations for any fund.
Any proposed change in a fund budget must be processed through the city’s financial accounting and reporting systems in accordance with existing city policies and procedures.
H. Policy on Carry-Forward Balances
The policy outlines the restrictions regarding monies appropriated but not expended within a given fiscal year are carried forward into the next fiscal year as either obligated or surplus revenue. The following carry-forward procedures vary according to the fund in which the balance is accrued:
General Fund – Monies are allocated each year in the city budget to various departments, programs and activities. However, if those monies have not been expended at the end of each fiscal year, they automatically revert to the General Fund’s fund balance rather than being carried forward as a departmental surplus. Two exceptions to this rule are encumbered
47

**See 2020 Annual Program Budget Revenue and Expenditures Detail – Addendum for account level detail.
amounts (see section H) and unassigned fund balances. At year end, if the city’s unassigned fund balance is below the policy minimum, any unused contingency funds will be used to increase the city’s unassigned fund balance.
Proprietary Fund – Revenues may accrue positive fund balances from year to year without loss of those monies to other funds or programs. At the end of each fiscal year, Enterprise Funds and Internal Service Funds balance is carried forward as surplus (Net Position).
Special Revenue Funds and the Capital Improvement Funds are earmarked for specific programs or purposes. Balances in these funds are carried forward to the next fiscal year as unobligated surplus, unless monies are encumbered for a project in process. In that case, the encumbrance amount is carried forward as obligated surplus revenue.
Donations, which are received and are not spent, are carried forward from one year to another.
I. Policy on Encumbrances
An encumbrance is a method of obligating monies for future expenditures. Specifically, in city budgeting, the policy ensures an encumbrance is used to keep unexpended monies from reverting back to their source at the end of each fiscal year.
Monies may be encumbered by either of two methods: A purchase order, approved and issued before the close of a fiscal year, will
encumber monies to pay for goods and services ordered, upon delivery. A contract for goods or services, drawn up and approved in accordance with the city’s
contracting policy, may also encumber funds for payment in the fiscal year, provided the amount and source of funds have been clearly identified in the approving motion.
J. Chart of Account Policy
This policy dictates the expense categories used in the city’s Annual Program Budget and its supporting system are established in a master list known as the Chart of Accounts. This list establishes uniform expenditures/cost titles and corresponding account numbers for use by all city departments. The Appendix of the 2020 Annual Program Budget includes the list and definition of commonly used accounts.
The policy indicates the Chart of Accounts may be expanded or reduced. Requests for amendments to the Chart of Accounts must be initiated by a Department Head and approved by the Finance Director.
K. Contingency Policy
The Contingency Policy ensures budgeting for contingencies in each fiscal year is the City Administrator’s responsibility. This policy ensures that departmental budgets are prohibited from containing planned contingencies.
L. Cost Allocation Policy
For various reasons, the city may wish to identify overhead or administrative costs associated (directly or indirectly) with a specific program or activity. The most common uses of this information are in inter-departmental charging for shared personnel, equipment, and materials.
48

**See 2020 Annual Program Budget Revenue and Expenditures Detail – Addendum for account level detail.
The Cost Allocation Policy outlines the process of identifying, computing, and assigning these costs to the appropriate fund or department, which is known as cost allocation. The Finance Department performs this function to ensure adherence to the policy.
2. BUDGET PRESENTATION
Most funds are divided by cost centers. The cost center can be a fund, major program, department or other activity for which control of expenditures is considered desirable.
Each fund budget is discussed in the Budget Message as well as in each fund section of the budget document. For each program budget, a summary sheet identifies the following information:
Department or Fund Purpose: explains the mission for the program budget or fund. Department or Fund Description: identifies the background and purpose of the
program budget or fund. 2020 Budget Highlights: lists the significant budgetary changes involving personnel or
project cost in comparison to prior budgets. Permanent Staffing: identifies, if any, the number of permanent staff by position. Revenue**: lists, if any, four fiscal years of revenues which are summarized by
categories. Expenditures**: lists four fiscal years of budgets which are summarized by personal
services (related to personnel costs), non-personal services (related to operational costs), and capital outlay.
Strategic Plan Focus Area(s): identifies one or more of the city’s 2017 – 2021 Strategic Plan’s Six Focus Area(s).
Goal: the achievement toward which effort is directed to meet the needs of the Focal Area(s).
Objective: the precise actions for accomplishment of a specific measureable, attainable task or meet the Goal(s).
Measurements: identifies quantifiable resource, workload, and efficiency or effectiveness measurements of meeting the Objectives. (Please note that the benchmark measurements for 2019 Estimated are annualized estimates).
Significant Capital Projects: the major 2020 capital projects.
Appendix
The Appendix contains several features, i.e. lists, tables and graphs, designed to aid understanding of the 2020 Annual Program Budget and general city information.
3. EXPLANATION OF BUDGETARY PROCESS
Although the administration of the existing budget is a constant process, the preparation of the next year’s budget begins with the establishment of an Executive Policy of written goals and parameters by the City Administration and approved by the Common Council, and the distribution of budget instructions by the City Administrator. The pre-cursor to the budget cycle is the adoption of the five-year Capital Improvement Program.
The city uses the following procedures when establishing budgetary data reflected in this document:
Finance and Personnel Committee reviews recommendations by the City Administrator to develop a framework for the budget development.
49

**See 2020 Annual Program Budget Revenue and Expenditures Detail – Addendum for account level detail.
Common Council approves recommendation from the Finance and Personnel Committee regarding guidelines for the budget development.
City Administrator informs Management Team of Common Council’s approved recommendations for budget development.
Management Team submits to the City Administrator proposed operating budgets for the fiscal year which commences the following January 1. The operating budget includes proposed expenditures and means of financing them.
The City Administrator submits the Executive Budget to the Common Council. Copies of the budget are made available for public use on the city’s website.
In accordance with Wisconsin Statutes Section 65.0(3), a Class 1 public notice is published at least 15 days prior to a public hearing.
A public hearing is held concerning the proposed budget. The Common Council approves by resolution the proposed budget and sets the
associated tax levy.
2020 BUDGET SCHEDULE
May City Administrator and Finance and Personnel Committee meet to establish budget goals and objectives for 2020 budget.
City Administrator communicates to Management Team goals and objectives
for 2020 budget submittals. Capital Improvements Commission finalizes recommendations for the 2020 –
2024 Capital Improvements Program for review by City Plan Commission. June Common Council adopts 2020 – 2024 Capital Improvements Program July Departmental budget submittals and reviews. City Administrator review of departmental budgets. September City Administrator submits budget to the Common Council. Standing Committee reviews and submits recommendations to the Finance
Committee. September/ October Publication of Notice of Public Hearing on 2020 Proposed Budget October Public Hearing on 2020 Proposed Budget Committee of the Whole reviews reports of Standing Committees on
departmental budgets. November Common Council to adopt the Budget Resolutions
50

**See 2020 Annual Program Budget Revenue and Expenditures Detail – Addendum for account level detail.
Procedures for Amending City Budgets
Following the adoption of the annual budget, budget transfers and supplemental appropriations are made based on the following:
Intra-Program Category Amendment Since the annual city budget is adopted at the functional level of expenditures
(program categories, i.e. Public Works and Public Safety), the Finance Director may authorize any intra-program line item change.
Inter-Program Category or Inter-Fund Amendment At the Finance and Personnel Committee, the Department Head, along with the
City Administrator’s approval, identifies the need to transfer funds and make a recommendation of specific amounts and accounts involved in the transfer. The Finance and Personnel Committee recommends to the Common Council for or against the transfer.
Following the recommendation of the committee, the Common Council, in accordance with Wisconsin Statutes Section 65.90 (5)(a), must approve of the transfer by the two-thirds vote of the Common Council membership. Subsequently, the City Clerk must publish a Class 1 notice within ten days of the action taken.
Similarly, all transfers of funds from the contingency account must be approved by two-thirds of the Common Council membership (per Wisconsin Statutes Section 65.90(5)(a).
Failure to obtain a two-third approval vote by the Common Council on the transfer of funds results in the Department Head’s inability to spend the additional funds for the recommended purpose.
Explanations of Budgetary Basis
Basis of budgeting and accounting refers to the point in time at which revenues and expenditures are recognized in the accounts and reported in the financial statements.
The Governmental Funds (General, Special Revenue, Debt Service, and Capital Improvement) and Fiduciary Fund are budgeted and accounted for using the modified accrual basis of accounting. Under the modified accrual basis, revenues are recorded when susceptible to accrual, i.e., both measureable and available. Available means collectible within the current period or soon enough thereafter to be used to pay liabilities of the current period.
Property taxes are recorded in the year levied as receivable and deferred revenues. They are recognized as revenues in the succeeding year when services financed by the levy are being provided. Property taxes are levied and billed in December; payment in full or the first installment payment due date is January 31: the second installment payment due date is July 31.
Intergovernmental aids and grants are recognized as revenues in the period the related expenditures are incurred, if applicable, or when the city is entitled to the aids.
The City of Sheboygan annually receives an entitlement from the US Department of Housing and Urban Development Community Development Block Grant Program. The funds are recognized as revenues in the period the related expenditures are incurred.
51

**See 2020 Annual Program Budget Revenue and Expenditures Detail – Addendum for account level detail.
Special assessments are recorded as revenues when collected. Annual installments due in future years are reflected as receivables and deferred revenues.
Other general revenues such as fines and forfeitures, charges for services and miscellaneous revenues are recognized when received in cash or when measurable and available under the criteria described above.
Financing reporting for the Proprietary Funds is on the accrual basis of accounting. Revenues such as user fees are recognized in the accounting period in when they are earned; expenses are recognized in the period incurred. Depreciation is budgeted as a separate expenditure. Capital outlay and debt-related principal payment activity are identified as part of the balance sheet for presentation.
52
City of Sheboygan 2020 Budget Facts
Amended Adopted CHANGE2019 2020 $ %
Governmental Funds Expenses:General Fund Expenses $38,545,378 $39,294,527 $749,149 1.94%Levy Required $16,435,705 $16,609,115 $173,410 1.06%
Special Revenue Funds Expenses $10,649,705 $11,264,142 $614,437 5.77%Levy Required $2,509,321 $2,533,314 $23,993 0.96%
Debt Service Funds Expenses $15,851,930 $8,862,198 ($6,989,732) (44.09%)
Levy Required $3,421,889 $3,541,758 $119,869 3.50% Capital Improvement Funds Expenses $30,997,118 $13,239,378 ($17,757,740) (57.29%)
Levy Required $892,025 $892,025 $0 0.00% Fiduciary Fund Expenses $2,000 $166,000 $164,000 8200.00%
Levy Required $0 $0 $0 0.00%
Proprietary Funds Expenses** $35,040,914 $36,753,631 $1,712,717 4.89%Levy Required $511,547 $516,662 $5,115 1.00%
Total Expense $131,087,045 $109,579,876 ($21,507,169) (16.41%)
Total Tax Levy $23,770,487 $24,092,874 $322,387 1.36%
Non-TID Property Tax Base
Equalized $2,650,921,700 $2,724,220,600 $73,298,900 2.77%
Equalized Tax Rate* $8.967 $8.844 ($0.12) (1.37%)
Equalized/Assessed Ratio 90.48% 88.07% (2.41%)
Assessed Tax Rate* $9.910 $10.042 $0.13 1.33%
*per $1,000 property valuation**Includes Water Utilty for informational purposes only. The Board of Water Commission has authority for review and approval.
53

2020 BUDGET SUMMARY BUDGET SUMMARY
GOVERNMENTAL FUNDS <>605
605 850 804
101 200 - 299 300 - 399 400 - 499 805 600 - 799
General Special Debt Capital Fiduciary Proprietary
Fund Revenue Service Improvement Funds Funds
Revenue
Taxes $16,812,638 $4,302,078 $8,542,409 $1,600,242 $0 $516,662
Licenses and Permits $992,740 $642,475 $0 $0 $0 $30,700
Intergovernmental Revenue $14,233,373 $2,174,662 $52,472 $1,181,056 $0 $3,786,219
Intergovernmental Charges for Services $258,000 $0 $0 $0 $0 $9,081,868
Charges for Services $1,601,322 $2,168,641 $0 $0 $9,400 $20,928,466
Fines and Forfeitures $271,000 $900,000 $0 $0 $0 $5,000
Miscellaneous Revenue $356,650 $361,550 $679,532 $121,300 $30,500 $1,382,930
Other Financing Sources $2,878,924 $942,964 $1,127,142 $6,551,946 $0 $257,026
Total Revenue $37,404,647 $11,492,370 $10,401,555 $9,454,544 $39,900 $35,988,871
Expenditures
General Government $4,207,724 $1,849,996 $165,696 $0 $0 $9,235,520
Public Safety $22,315,691 $870,061 $0 $765,944 $0 $0
Public Works $8,825,441 $937,643 $0 $4,948,430 $0 $20,215,575
Health and Human Services $201,331 $0 $0 $0 $1,000 $0
Culture and Recreation $2,837,589 $4,075,246 $0 $886,770 $150,000 $3,038
Conservation and Development $368,721 $1,502,433 $0 $5,541,234 $0 $7,996
Transfers and other expenses $538,030 $2,028,764 $8,696,502 $1,097,000 $15,000 $7,291,501
Total Expenditures $39,294,527 $11,264,142 $8,862,198 $13,239,378 $166,000 $36,753,631
Excess of revenues over (under) expenditures -$1,889,880 $228,228 $1,539,357 -$3,784,834 -$126,100 -$764,760
Fund Balance, January 1 $19,893,989 $1,939,736 $10,627,320 $7,166,592 $2,239,632 $0
Fund Balance, December 31 $18,004,109 $2,167,964 $12,166,677 $3,381,758 $2,113,532 $0
Net Position, January 1 $0 $0 $0 $0 $0 $88,381,737
Net Position, December 31 $0 $0 $0 $0 $0 $87,616,977
Net Property Tax Required $16,609,115 $2,533,314 $3,541,758 $892,025 $0 $516,662
Assessed Valuation
ASSESSED TAX RATE
Equalized Valuation*
EQUALIZED TAX RATE
*Valuation does not include Tax Incremental District Valuation
54

BUDGET SUMMARY
2020 2019 2018 2017
Adopted Estimated Actual Actual
Revenue
$31,774,029 $30,251,732 $29,403,745 $27,989,396 Taxes
$1,665,915 $1,982,186 $1,806,082 $1,744,147 Licenses and Permits
$21,427,782 $21,570,432 $20,793,432 $21,894,629 Intergovernmental Revenue
$9,339,868 $8,837,035 $9,659,001 $8,894,419 Intergovernmental Charges for Services
$24,707,829 $22,838,073 $22,603,020 $20,783,225 Charges for Services
$1,176,000 $1,026,000 $1,197,563 $1,078,718 Fines and Forfeitures
$2,932,462 $2,971,766 $5,612,812 $4,177,248 Miscellaneous Revenue
$11,758,002 $21,333,863 $44,739,257 $13,677,746 Other Financing Sources
$104,781,887 $110,811,087 $135,814,911 $100,239,529 Total Revenue
Expenditures
$15,458,937 $18,560,910 $20,803,862 $14,019,118 General Government
$23,951,696 $23,214,931 $24,471,918 $21,481,633 Public Safety
$34,927,089 $32,404,841 $30,465,718 $29,555,614 Public Works
$202,331 $194,205 $205,785 $234,960 Health and Human Services
$7,952,643 $7,790,159 $7,102,525 $7,167,105 Culture and Recreation
$7,420,384 $3,979,555 $16,223,927 $7,729,672 Conservation and Development
$19,666,797 $33,367,464 $23,842,251 $20,394,270 Transfers and other expenses
$109,579,877 $119,512,065 $123,115,987 $100,582,372 Total Expenditures
-$4,797,990 -$8,700,977 $12,698,924 -$342,843 Excess of revenues over (under) expenditures
$41,867,269 $53,308,769 $42,767,814 $43,456,422 Fund Balance, January 1
$37,814,709 $41,847,938 $53,308,769 $42,767,814 Fund Balance, December 31
$88,381,737 $88,046,287 $85,924,256 $88,381,737 Net Position, January 1
$87,616,977 $88,381,737 $88,046,287 $87,616,977 Net Position, December 31
$24,092,874 $23,770,487 $23,324,477 $22,150,349 Net Property Tax Required
$2,399,221,082 $2,398,553,954 $2,523,820,400 $2,318,618,801 Assessed Valuation
10.0420 9.9100 9.7413 9.7413 ASSESSED TAX RATE
$2,724,220,600 $2,650,921,700 $2,488,723,200 $2,326,529,000 Equalized Valuation*
8.844 8.967 9.372 9.521 EQUALIZED TAX RATE
55

FUND BALANCE SUMMARY The 2020 Adopted Program Budget identifies material changes to most of the fund balances of the various funds. The combined summary of changes in fund balance table that follows shows the impact of budget decisions on fund balance for all funds. Decreases in fund balances reflect planned use of fund balance to address projected budget shortfalls between revenues and expenditures. Governmental Funds:
General Fund
The General Fund budget plans for the use of $1,889,880 of fund balance. This represents 4.81 percent of the budget as a revenue source. The 2020 budget strategically utilizes fund balance in order to maximize the 2020 expenditure amount required to maintain eligibility for the Wisconsin Expenditure Restraint Program in future years.
The 2020 Budget continues to fund a Reserve for Contingency within the General Fund which was established in 2017. The reserve will be available for unanticipated expenses and requires Common Council approval to be appropriated.
The projected unassigned fund balance in the General Fund at year-end 2020 is 39 percent of the 2020 budgeted expenditures. The Common Council identifies a policy maintaining a minimum of 25 percent level of its fund balance in relationship to its expenditure level. During 2020, utilization of a larger portion of fund balance resulted from an unexpected $527,888 reduction in State shared revenue-utility aids.
Special Revenue Funds
A one-time transfer of funds will be used as a source for the newly created Neighborhood Revitalization Fund, debuting in 2020. This fund will utilize excess TID 11 Debt Service Fund increment to offer a lower cost improvement funding source to homeowners and business owners as well. Existing business owners will have the ability maximize empty space above their respective properties for rentals in an effort to increase the availability of downtown housing options. In future years, the fund balance will be applied as a revenue source until all funds are expended for the residential rehabilitation program-related expenses. The Cable TV Fund will utilize $50,000 of fund balance resulting from reduced revenues experienced from declining viewership as the State of Wisconsin regulated a decrease in franchise fees accordingly. Measures have been taken to reduce expenditures in anticipation of the declining revenues. The usage of fund balance is anticipated to increase each year resulting from planned decline in franchise fees. The Harbor Centre Marina Fund negative fund balance is projected to decrease by $194,857, of which $225,000 was funded by the Convention Center Debt Service Fund. At the end of 2020, the negative fund balanced associated with Harbor Center Marina will diminish by $1,071,263 within a three year period.
56

. The MEG Unit Fund, Block Grant Fund, Housing Revolving Loan Fund, Business Revolving Loan Fund, Mead Library Fund, Tourism Fund, Park, Forestry and Open Space Fund, Park Impact Fee Fund, Cable TV Fund, Municipal Court Fund, Ambulance Fund, Special Assessment Fund, Redevelopment Authority Fund and Storm Water Fund have no significant changes in fund balance.
Debt Service Funds
The G.O. Debt Service Fund budget’s fund balance is expected to increase by $181,086 from 2019 Estimated to 2020 Adopted totals resulting from additional Property tax levy and Interfund transfer from the Tourism Fund. The Convention Center Debt Service Fund’s fund balance is anticipated to decrease by $480,486 in 2020. $225,000 in fund balance will be transferred to the Harbor Centre Marina Fund, and $274,486 to Tax Incremental District 16 Debt Service Fund. The fund has no future financial obligations. Overall, Tax Incremental Districts 6, 10, 14, 15, 16, and 17 will experience significant growth in fund balance. The Tax Incremental District 16 and 17 Debt Service Funds’ are expected to increase by $264,041 and $444,900, respectively, resulting from donations from the Convention Center Debt Service Fund and the Tax Incremental Debt Service Funds 12 and 13. However, Tax Incremental District 18 and 19 the fund balances remain negative. It is anticipated that additional one year of increment will bring both of the fund balances positive. The Tax Incremental Districts 11 and 12 have no significant changes in fund balance.
Capital Improvement Funds
The Capital Project Fund (Property tax levy-funded portion) fund balance is expected to decrease by $621,000, in part, due to a decrease in Federal Subsidy with the continued focus on street improvements in support of the Strategic Plan Focus Area – Infrastructure and Public Facilities. The Tax Incremental District 17 Capital Projects Fund budget’s fund balance is anticipated to decrease by $3,052,639 resulting from planned 2020 infrastructure improvements associated with the Badger State Lofts redevelopment, Indiana Avenue trail project, and the Innovation District surface parking lot. The Capital Improvement Fund (Borrowed), Industrial Park Fund and Tax Incremental Districts 6, 12, 14, 16, 17, 18 and 19 Capital Project Funds have no significant changes in fund balance.
57

Fiduciary Fund
The Wildwood Cemetery Perpetual Care Fund and the Mead Public Library Trust Fund continue to show the same trends utilizing a small portion, $126,100, in fund balance.
Proprietary Fund
The Water Utility Fund net position is expected to increase $442,822. Plant improvements of $3,685,000 are included in the budget as capital asset investments. The Wastewater Utility Fund net position is anticipated to decrease by $286,494 in 2020. The Wastewater Treatment Plant is a regional facility with customers within the city and in outlying communities as well. A rate increase was implemented for city sewerage customers in 2019, with another rate increase for outlying communities planned in the 2020 Budget. The Motor Vehicle Fund net position is expected to decrease $44,181 or 0.55 percent. Vehicle Rental rates were increased by 10 percent in the 2020 budget for the first time in a number of years. The rate increases will allow the fund to increase its reserves. The Information Technology Fund net position experienced a slight decrease of $112,346 for 2020. IT Service charges were increased by six percent in the 2020 budget for the first time in a number of years. The rate increases will allow the fund to increase its reserves. Capital asset investments are not considered as a budgetary expenditure, but rather reflected in balance sheet accounts. The Health Insurance Fund net position is expected to decrease $217,474 or five percent from 2019 Estimated to 2020 Adopted due to anticipated increase in claims and Stop Loss Insurance Premium cost. The Recycling Utility Fund is newly established in 2020. This fund will account for collection of recyclable materials banned from landfills by the State of Wisconsin Department of Natural Resources (WDNR). Due to the implementation of the new fee resulting from 11 months versus 12 months of revenue, 2020 will experience a small negative fund balance. The Parking Utility Fund, Liability Insurance Fund, and Workers Compensation Fund have no significant changes in net position. Capital asset investments in these funds are not considered as a budgetary expenditure, but rather reflected in balance sheet accounts.
58

COMBINED SUMMARY OF CHANGES IN FUND BALANCES
2017 2018 2019 2019 2020Actual Actual Amended Estimated Adopted
GOVERNMENTAL FUNDS GENERAL FUND Fund Balance (Jan. 1) $22,527,096 $23,900,905 $19,974,871 $19,974,871 $19,893,989 Revenues 33,675,320 35,111,472 34,594,189 34,405,949 34,525,723 Expenditures 34,994,340 36,332,697 38,114,301 37,687,640 38,756,497 Other Sources/(Uses) 2,692,829 -2,704,809 2,286,528 3,200,809 2,340,894 Fund Balance (Dec. 31) 23,900,905 19,974,871 18,741,188 19,893,989 18,004,109
SPECIAL REVENUE FUNDS Fund Balance (Jan. 1) 2,598,113 2,246,913 2,388,479 2,388,479 1,939,735 Revenues 10,596,629 10,251,094 9,937,248 10,432,560 10,549,406 Expenditures 8,023,628 7,706,826 8,445,183 8,617,603 9,235,378 Other Sources/(Uses) -2,924,201 -2,402,702 -1,979,522 -2,263,701 -1,085,800 Fund Balance (Dec. 31) 2,246,913 2,388,479 1,901,022 1,939,735 2,167,963
DEBT SERVICE FUNDS Fund Balance (Jan. 1) 9,926,648 9,077,445 19,172,959 19,172,959 10,627,320 Revenues 7,060,851 8,158,415 7,951,117 8,530,378 9,274,413 Expenditures 733,323 725,082 201,419 165,196 165,696 Other Sources/(Uses) -7,176,731 2,662,181 -14,566,025 -16,910,821 -7,569,360 Fund Balance (Dec. 31) 9,077,445 19,172,959 12,356,632 10,627,320 12,166,677
CAPITAL IMPROVEMENT FUNDS Fund Balance (Jan. 1) 6,749,570 5,498,870 9,346,308 9,346,308 7,166,592 Revenues 4,321,236 3,927,158 10,519,188 3,379,046 2,902,598 Expenditures 12,394,555 29,960,740 28,342,301 13,149,458 12,142,378 Other Sources/(Uses) 6,822,619 29,881,020 8,273,709 7,590,696 5,454,946 Fund Balance (Dec. 31) 5,498,870 9,346,308 -203,096 7,166,592 3,381,758
FIDUCIARY FUNDS Fund Balance (Jan. 1) 2,175,632 2,026,974 2,445,482 2,445,482 2,239,632 Revenues 177,140 527,749 33,400 39,900 39,900 Expenditures 325,743 108,319 750 230,750 151,000 Other Sources/(Uses) -55 -922 -1,250 -15,000 -15,000 Fund Balance (Dec. 31) 2,026,974 2,445,482 2,476,882 2,239,632 2,113,532
COMBINED TOTALS Fund Balance (Jan. 1) 43,456,422 42,767,814 53,308,769 53,308,769 41,867,269 Revenues 55,831,176 57,975,888 63,035,142 56,787,833 57,292,040 Expenditures 56,471,589 74,833,664 75,103,954 59,850,647 60,450,949 Other Sources/(Uses) -585,539 27,434,768 -5,986,560 -8,398,017 -874,320 Fund Balance (Dec. 31) $42,767,814 $53,308,769 $35,272,628 $41,847,938 $37,814,709
59

2017 2018 2019 2019 2020SUMMARY Actual Actual Amended Estimated Adopted
Office of the Mayor* 2.00 2.00 2.00 2.00 2.00Office of the City Clerk 3.56 3.75 3.75 3.75 3.75Office of the City Administrator* 2.00 2.00 2.00 2.00 2.00Finance Department 6.50 5.90 5.90 6.90 6.90Human Resources Department 4.00 4.60 4.60 4.60 4.60Office of the City Attorney 4.00 4.00 4.40 4.40 4.40Police Department 104.40 104.40 104.40 104.40 104.40Fire Department 74.50 74.50 74.50 74.50 74.50Public Works Department 84.00 84.00 84.00 79.50 77.50Senior Services Department* 2.28 2.28 2.28 2.28 2.28City Development Department 12.00 12.00 12.00 12.00 13.00Mead Public Library 39.50 39.50 39.75 39.50 39.50Municipal Court* 2.50 2.50 2.50 2.50 2.50Cable Television* 1.50 1.50 1.25 1.25 1.25Recycling Utility* 0.00 0.00 0.00 0.00 2.00Transit Utility 51.20 51.20 51.45 51.45 51.45Parking Utility* 2.30 2.30 2.30 2.30 2.30Water Utility** 30.00 30.00 30.00 30.00 31.00Wastewater Utility 13.00 13.00 13.00 15.00 15.00Information Technology Department 5.00 5.00 6.00 5.00 5.00Motor Vehicle 8.00 6.00 6.00 6.00 6.00 TOTAL CITY PERSONNEL 452.24 450.43 452.08 449.33 451.33
* Office of the Mayor, Office of the City Administrator, Senior Services Department, Municipal Court, Cable Television, Recycling Utility, and Parking Utility are all zero percent.
** Approval authorized by Board of Water Commissioners
PERSONNEL SCHEDULE SUMMARYPERMANENT POSITIONS (FTE)
Office of the City Clerk
Human Resources Department
Finance Department
Office of the City Attorney
Police Department
Fire Department
Public Works Department
City Development Department
Transit Utility
Mead Public Library
Wastewater Utility
Motor Vehicle Information Technology Department
Water Utility**
60

SUMMARY OF REVENUES AND EXPENDITURES BY FUND TYPE AND CATEGORY
2020 REVENUES
Governmental Funds
Special Debt Capital 2020 Percent of
Revenue Category General Revenue Service Improvements Fiduciary Proprietary Adopted Total Budget
Taxes $16,812,638 $4,302,078 $8,542,409 $1,600,242 $0 $516,662 $31,774,029 30.32%
Licenses and Permits 992,740 642,475 0 0 0 30,700 1,665,915 1.59%
Intergovernmental Revenue 14,233,373 2,174,662 52,472 1,181,056 0 3,786,219 21,427,782 20.45%
Intergovernmental Charges for Services 258,000 0 0 0 0 9,081,868 9,339,868 8.91%
Charges for Services 1,601,322 2,168,641 0 0 9,400 20,928,466 24,707,829 23.58%
Fines and Forfeitures 271,000 900,000 0 0 0 5,000 1,176,000 1.12%
Miscellaneous Revenue 356,650 361,550 679,532 121,300 30,500 1,382,930 2,932,462 2.80%
Other Financing Sources 2,878,924 942,964 1,127,142 6,551,946 0 257,026 11,758,002 11.22%
Total Revenue $37,404,647 $11,492,370 $10,401,555 $9,454,544 $39,900 $35,988,871 $104,781,887 100.00%
2020 EXPENDITURES
Governmental Funds
Special Debt Capital 2020 Percent of
Expenditure Category General Revenue Service Improvements Fiduciary Proprietary Adopted Total Budget
Personal Services $29,921,222 $3,766,414 $0 $86,543 $0 $10,872,520 $44,646,699 40.74%
Non-Personal Services 8,712,972 $4,359,134 $165,696 $87,592 $151,000 $20,267,827 33,744,221 30.79%
Capital Outlay/Other Financing 660,333 $3,138,594 $1,735,477 $13,065,244 $15,000 $4,904,291 23,518,939 21.46%
Debt Service 0 $0 $6,961,025 $0 $0 $708,994 7,670,019 7.00%
Total Expenditures $39,294,527 $11,264,142 $8,862,198 $13,239,379 $166,000 $36,753,632 $109,579,878 100.00%
General Fund - 36%
Special Revenue - 10%
Debt Service - 8%
Capital Improvements -
12%
Fiduciary - 0%
Proprietary - 36% 2020 Expenditures
61

Departments by Fund Classification
Department / Fund
Matrix
Admin
istra
tion
Police
Fire
Insp
ectio
n
Public W
orks
Libra
ry
Parks a
nd
Recreatio
n
Plannin
g and
Develo
pment
Utility
General Fund
MEG Unit Fund
Block Grant Fund
Housing Revolving
Loan Fund
Business Revolving
Loan Fund
Neighborhood
Revitalization Fund
Mead Public Library
Fund
Tourism Fund
Park, Forestry and
Open Space Fund
Park Impact Fee Fund
Cable TV Fund
Municipal Court Fund
Ambulance Fund
Special Assessment
Fund
Harbor Centre Marina
Fund
Redevelopment
Authority Fund
Storm Water Fund
G O Debt Service Fund
TID Debt Service
Funds
Capital Project Fund
Capital Improvement
Fund
Industrial Park Fund
TID Capital Project
Funds
Recycling Fund
Motor Vehicle Fund
Health Insurance Fund
Liability Insurance
Fund
Workers
Compensation Fund
62

Departments by Fund Classification
Department / Fund
Matrix
Admin
istra
tion
Police
Fire
Insp
ectio
n
Public W
orks
Libra
ry
Parks a
nd
Recreatio
n
Plannin
g and
Develo
pment
Utility
Information
Technology Fund
Wastewater Utility
Fund
Transit Utility Fund
Parking Utility Fund
Boat Facilities Fund
Cemetery Perpetual
Care Fund
Mead Public Library
Trust Fund
63

LONG TERM FINANCIAL PLAN AND FISCAL POLICIES The City of Sheboygan, at the Common Council direction, annually prepares a comprehensive Long Term Financial Plan (LTFP), consistent with the city’s Strategic Plan focus area of Governing and Fiscal Management. The LTFP is intended to serve as a tool, providing Common Council and the public with the insight required to address issues impacting the city’s financial condition.
Long Term Financial Plan Process Financial strategies have been identified to contribute to the five financial goals. Ensure adequate funding: obtain adequate funding from multiple sources for requirements related to day-to-day operating commitments, capital equipment life cycle and infrastructure needs, as well as managing growth and development. This would encompass a balanced approach between understanding the timing and nature of operating expenditures to ensure they are matched with reliable and stable funding sources and capital funding related to infrastructure needs and maintaining capital assets. This strategy includes identifying costs and maintaining or increasing funding from existing and new revenue sources. Achieving diverse sources of funding: identify actions related to alternative and innovative funding sources that will
The LTFP is a financial strategic plan
STEP 5
Monitor the Plan
STEP 4
Implement the Plan
STEP 3
Develop the Plan
STEP 2
Identify Critical Issues
STEP 1
Build the Foundation
64

help the city respond to the pressures of growth and redevelopment and reduce the reliance on property taxes. Property taxes, user fees and intergovernmental revenue are the traditional inelastic revenue sources used to meet expenditure requirements that are continually under upward pressure which can place stress on the city’s financial position. Managing expenditures: containing costs in order to limit pressure on revenue requirements maintain market competitiveness and/or reserve capacity to maintain service levels. This can be accomplished by increasing efficiencies in service delivery, setting spending priorities to ensure the most important areas are funded, and positioning the city as an efficient provider of services and infrastructure. Providing for contingencies: prepare the city to manage risk and to be resilient when dealing with unforeseen circumstances while limiting the impact on services. This can be accomplished by monitoring economic and operational factors and forecasts in order to be able to respond to changing circumstances and ensuring that the city has access to enough funds to meet unforeseen urgent needs and manage risk appropriately. Using debt strategically: providing capital funding flexibility by allowing infrastructure to be built and used before sufficient revenue has accumulated to offset needed investment. This can be accomplished by managing the level of debt and strategically making essential assets available as well as examining a wider range of debt financing instruments. Operating with foresight: taking into account the current and future impacts of decisions on services and infrastructure. This includes maintaining or extending existing practices regarding a long-term approach in decision making. Maintaining sufficient cash flow: allowing the city to pay the costs of supplying services and infrastructure throughout the year to match expenditure requirements, including debt service. Promoting and enabling integration of priorities and resources: identifying and encouraging awareness of the financial implications of policy making and decision making on the city’s financial position. This can be accomplished by linking needs and actions to resources, responsibilities and timeliness among stakeholders, promoting greater efficiency by reducing duplication of effort or working at cross purposes and managing growth and development.
65

The city’s LTFP begins by identifying several critical areas which have, or are expected to have, an impact on the financial condition of the city over the next five years. Once the critical issues are identified, specific goals and objectives are developed for each project designed to meet the overall goal of the project. To provide a clear and concise Long Term Financial Plan, identifying the city’s current and projected financial condition, and proposing specific alternatives to address identified problems. The Management Team is responsible for keeping the process on track and on schedule. In addition, the Team identifies their goals and objectives are met. The key message expressed to the Management Team is that the LTFP must be clear and concise while providing very specific and practical recommendations. The LTFP is presented in detail to the Common Council. The Finance and Personnel Committee reviewed the initial proposal in February, 2019. The next section contains the schedule followed by the Common Council as they develop or update an action plan that the city will implement as a part of the annual budget process: The chart on the following page graphically depicts the process involved in developing the city’s LTFP. This project is largely conducted by the city’s Management Team.
The Long Term Financial Plan process
66

Long Term FinancialProcess
Identify Critial Issues
Develop Financial Goals
Develop Objectives for Each Critical Issue
Develop Long Term Financial Plan
Common Council Deliberation and Action
Implementation
Monitor
Long Term Financial
Plan
Financial Trends
Financial Forecast
Financial Trend Analysis
Reserves
Use of Fund Balance
Capital Improvement Program
Expenditure Restraint Program
Review of User Fees
Review of Utility Rates
Property Tax Levy Increases
Use of Donations between TIDs
Debt Policy
February or March: LTFP provided to the Finance and Personnel Committee. March or April: Public input and Common Council adoption The LTFP for the City of Sheboygan represents the ongoing commitment to implement its Strategic Plan focus area of Governing and Fiscal Management. On an annual basis, the LTFP has been incorporated into the development, deliberation and approval of the Annual Program Budget. The plan is intended to be a well thought-out analysis of the issues that may affect the finances of the City of Sheboygan.
The LTFP represents elements of the city’s Fiscal Policy.
Schedule
67

The LTFP uses financial trends and forecasts to identify future financial challenges and opportunities, and then identifies strategies to secure financial sustainability within these same challenges and opportunities. The trends and forecast must identify how, from a financial perspective, the city will provide a consistent level of public services and also addresses special issues of concern to the community. Funding sufficiency: having sufficient resources to support the delivery of services. This goal not only refers to the amount of funding but also to the consistency in funding level changes relative to changes in expenditures and the diversity of funding sources. Integration: ensuring that the financial constraints under which the city operates are fully considered when engaged in policy-making and decision-making. Credibility: achieving financial performance in a way that maintains public confidence in the city’s ability to provide services and infrastructure at expected levels. Financial decisions should be consistent with the overall goal of financial sustainability. Services must be valuable to citizens and the benefits provided must be perceived that the services are in proportion to the taxes and fees paid.
Common Council-approved multi-year Capital Improvements Program is included in the Long Term Financial Plan as it will impact the finances of the city over the next five years. From a fiscal perspective, the city’s financial picture is positive. The General Fund’s fund balance exceeds the city’s policy of a minimum 25 percent of expenditures, largely due to significant expenditure savings experienced over the last few years. Due to the Common Council’s 2018 decision to utilize $5.5 million of General Fund uncommitted fund balance to reduce the amount of borrowed funds for the $10.5 million City Hall Renovation Project, the percent of uncommitted fund balance will decrease from 60 percent to 40 percent of expenditures. Overall, the city is in excellent financial shape and should be able to accommodate the expenditure growth that is anticipated over the next ten years. External factors imposed by the State of Wisconsin have played a key role in shaping the city’s financial picture. These factors include restrictions on property tax levy increases and restrictions on new or increase in existing user fees without corresponding reductions in property tax level.
Trends & Forecast are the foundation of the LTFP
Financial Sustainability
Input from Multi-Year City Plans
State of Wisconsin restrictions on local governments
68

Several city funds are tied directly to development and consequently, are expanding. The active Tax Incremental Districts (TIDs) all have a positive financial outlook, as the increment is sufficient to meet obligations, or serve to donate funds to other districts. The city also has capacity to develop additional TIDs within the 12 percent capacity limit established by the WI Department of Revenue. The LTFP provides a framework from which the Common Council and city staff can frame future financial decisions. As outlined in the 2019 Annual Program Budget the recommendations from the city’s multi-year plans are included in the LTFP as they impact the finances of the city. All of the plans were utilized in LTFP analysis of the General Fund, tax levy and TID’s. The fiscal related issues include:
Financial Trend Analysis - All operating position and debt indicators were favorable.
Reserves - The General Fund target is maintaining a minimum of 25 percent uncommitted fund balance. The LTFP indicates that a 25 percent uncommitted fund balance is attainable through the ten year period.
Use of Fund Balance as a revenue source – The city policy restricts the amount of undesignated fund balance for the General Fund that is applied to the budget for the ensuing year shall not reduce the undesignated fund balance below an amount equal to 25 percent of the ensuing year’s General Fund expenditures.
Capital Improvements Program – The Five Year Capital Improvements Program includes requests from all city departments for assets and infrastructure improvements, including TIDs. The Five Year Capital Improvements Program is funded from tax levy, debt issuance, contributions and federal, state and local grant funding.
Expenditure Restraint Program – The analysis presumes the city will remain eligible for this State of Wisconsin program which rewards operating (funds affected by the tax levy) budgets who budget annually at or below inflation plus a percentage of net new construction. The LTFP projects expenditures based on projected inflation.
Review of User Fees – The city’s Management Team reviews existing fees for consideration of increases annually.
Review of Utility User Fee Rates – Rates are reviewed annually for possible adjustments. Rates were increased for water on May 1, 2018, and sewer on January 1, 2018, by 4.92 and 10.00 percent respectively. Sewer rates increased by 7 percent on January 1, 2019. Water
69

rates will be reviewed in 2019 for a possible rate increase in late 2019 or early 2020.
Property tax levy Increases – Increases in the property tax levy should not result in an equalized tax rate increase more than inflationary levels. The city’s equalized tax rate in 2018 (to fund the 2019 budget) of $8.97 is a decrease of 4.32 percent over the previous year’s rate of $9.37.
Use of Donations between TIDs – The city has a number of well performing Tax Incremental District (TID) with capacity to donate to other underperforming TIDs.
Debt Policy – This policy establishes parameters for issuing and managing debt. No more than 60 percent of the State of Wisconsin’s limit of 5 percent of equalized value.
A financial projection of the General Fund, Debt Service Fund and tax levy requirements is included in the LTFP. An analysis of the TIDs is conducted annually. An analysis of General Fund revenues and expenditures as well as the General Fund’s fund balance is conducted annually. Based on actual and current budgeted revenues and expenditures as well as annual CPI changes, a five year forecast was developed. Revenue Assumptions:
Property Tax Levy – Current State limits continue. Tax levy increases for all funds limited to net new construction (floor of zero percent), adjustments to debt service, and additional adjustments due to annexations, transfer of services to/from another municipality, adjustments due to increases of fees for tax levy supported services and amounts approved by referendum. The levy is projected to increase slightly due to a majority of net new construction development occurring in TIDs. For the benefit of the 2019 debt service expenses, $225,000 of additional property taxes was included in the 2019 budget.
Intergovernmental Revenue – Current State funding continued. Mostly stable continuation of transportation aids, expenditure restraint program, state shared revenue program and recycling grant. This revenue category is projected to remain stable. The exception is Transportation Aids which will continue to increase based upon the State formula which recognizes the city’s increase in transportation-related expenses.
All Other Revenue – Includes Permits and Licenses, Fines and Forfeitures, Charges for Services, and Miscellaneous Revenue. Slight increase anticipated in construction-related permits due to construction activity
General Fund Revenue Assumptions
70

of multi-family housing units. All other revenues in this classification anticipated to remain stable.
Other Financing Sources – Conservatively estimated with slight change or no change.
Expenditure Assumptions
Personnel Expenditures (Personal Services) - Wages and benefits, including Wisconsin Retirement System (rates determined by the state) and health insurance (self-insured by the City of Sheboygan). A major portion of expenditures are wage related. Consistent with collective bargaining agreements for wage increases, a 2.25 percent wage increase is included in the 2019 budget. For the second consecutive year, a 10 percent increase in health insurance rates is included in the 2019 budget.
Non-Personnel Expenditures (Non-Personal Services) – Contracted services, office supplies, utilities, gasoline, liability and property insurance, training and conferences and communication are the main expenses.
Based upon these assumptions, the 2020 General Fund budget will utilize approximately $1,165,778 in fund balance. Due to conservation budget assumptions, it is anticipated that little to no actual use of these funds will be necessary. Regardless, the General Fund budget projects a fund balance which will exceed the fund balance policy of maintaining a minimum of 25 percent.
Tax Levy Revenue – Tax levy revenue is the largest revenue source for city services and projects. Tax levy revenue is collected for the following funds:
General – Largest tax levy portion is allocated to this fund which is the operating fund of the city. Increases in the property tax allocation are expected to increase slightly.
Library – Tax levy portion allocated to Mead Public Library Fund will increased in 2019 slightly for the second consecutive year.
Park, Forestry and Open Space – Tax levy funding, which was first allocated in 2017, will continue to be $110,000 to fund capital items.
G.O. Debt Service – Tax levy portion allocated to G.O. Debt Service Fund will continue to increase to accommodate the increase in annual debt service payments, which are the result of an aggressive street improvement plan.
Capital Projects – Tax levy for capital projects has been allocated to the Capital Project Fund, starting with the
General Fund Expenditures Assumptions
Tax Levy Revenue
71

2017 Annual Program Budget. In the 2019 budget, the amount allocated has declined slightly.
Transit – Tax levy portion allocated to the Transit Utility Fund has remained stable for the past seven years.
Tax levy limits under current state law may change with future legislation. Changes to the law will require adjustments to future long-range forecasts as necessary. Future limitations could impact the ability of the city to deliver services.
The LTFP is designed to be a dynamic document that is modified based on current or new conditions. External factors play a key role in determining the financial picture of the city. The external factors include legislation approved by the State of Wisconsin, development and the economy. These factors may impact the financial picture positively or negatively. The current financial situation reflects a strong financial position, prudent fiscal practices and solid reserves for the funds included on the LTFP.
Summary
72

MAJOR REVENUE SOURCES, TRENDS, AND ASSUMPTIONS
Incorporating all city funds, the city’s major revenue sources are: Property tax levy, State shared revenue, Water Utility sales of water and Wastewater Utility sewer service charges. These four revenues represent $43,791,453 or 48 percent of the overall 2020 revenue. Property tax levy – Property tax levy is the major revenue source for the General Fund, Mead Library Fund, Park, Forestry and Open Space Fund, G. O. Debt Service Fund and Capital Project Fund. Property tax levy is a non-major revenue source for the Transit Utility Fund as well. Property tax levy will increase $322,387 overall in 2020, or 1.3 percent. The minimal increase in 2020 is a result of limited net new construction. It is anticipated net new construction will increase moderately in 2020 and beyond. The State of Wisconsin has enacted tax levy limits on municipalities limiting property tax increases to percentage increase of net new construction with limited adjustments based on debt service, referendum approval, fee adjustments, annexations, etc. State shared revenue – State shared revenue is funding received from shared revenue and expenditure restraint programs. The shared revenue program is based on population and equalized property values, while the expenditure restraint program rewards municipalities that limit growth in spending. In 2020, the city is experiencing a significant reduction of $527,888 in state shared revenue-related Utility Aids resulting from the closure of power generating facilities within the city limits. Sales of water – Sales of water service is provided for residential, commercial, industrial and public customers within the City of Sheboygan limits, and as well as the Village of Kohler and City of Sheboygan Falls. A 4.92 percent rate increase was implemented on May 1, 2018. The Water Utility is governed by the Public Service Commission, who approves rate increases. The Water Utility anticipates no rate increase in 2020. However, significant water rate increases are expected in future years to pay for a planned $28 million fresh water intake pipe replacement project. Sewer service charges – Sewer service charges service residential, commercial, industrial and public customers within the City of Sheboygan, as well as to the Village of Kohler and City of Sheboygan Falls. A rate increase of two percent for non-city customers is reflected in the 2020 Budget. GENERAL FUND The top four major revenue sources ranked in descending order include Property tax levy, State shared revenue, Transportation aids and Water Utility in lieu of tax. These four categories comprise 81 percent of the 2020 General Fund revenue sources. The table on the following page shows a four year history of the top four major revenue sources.
73

Property Tax Levy
In the State of Wisconsin, property tax levy is based upon value of real estate property and business-related personal property. Property tax levy is the city’s largest source of revenue at 42 percent. The property tax amount generated to fund the 2020 General Fund Budget is $16,609,115 as compared to $16,435,705 for the 2019 budget. (Please note that in addition to the General Fund, the Mead Library Fund ($2,423,314), the Park, Forestry and Open Space Fund ($110,000), G.O. Debt Service Fund ($3,541,758), Capital Project Fund ($892,025), and the Transit Utility Fund ($516,662) also receive property taxes as a revenue source.) Below is a 10 year history of the property tax levy applied to the General Fund from 2011 through 2020. The amount has fluctuated from $15,191,503 in 2011 to $16,609,115 in 2020.
Property Tax Levy*
*For the Property Tax Levy graph as well as all other graphs, please note that years 2011 – 2019 are actual, 2020 reflects the adopted budget.
TOP FOUR MAJOR REVENUE SOURCES
2017 2018 2019 2019 2020Actual Actual Amended Estimated Adopted
Property tax levy $15,406,665 $16,240,705 $16,435,705 $16,435,705 $16,609,115State shared revenue (excluding ERP) $11,076,023 $11,111,400 $11,070,318 $10,549,384 $10,542,420Transportation aids $1,327,634 $1,526,779 $1,612,103 $1,612,103 $1,853,068Water Utility in lieu of tax $1,166,477 $1,158,106 $1,201,833 $1,136,477 $1,170,000
74

(In 2020, the city’s property tax base increased by $109,336,800 or four percent. The net new construction increased by $9,411,900 or 0.33 percent. Factors affecting the allocation of property tax levy to the General Fund in the near future are additional net new construction.
State Shared Revenue
State shared revenue recognizes funding received from the State of Wisconsin based on population and equalized property values. A component of the State shared revenue is the Expenditure Restraint Program (ERP) which rewards municipalities with TID-out property tax rates above five mills that keep the General Fund expenditure increases below a limit of CPI increases and a growth factor based on net new construction. The city anticipates a 2020 payment of $10,542,420, from State shared revenue. This funding is excluding the ERP. This amount reflects a significant decrease from the 2019 budgeted amount of $11,070,318. Below is a 10 year history of the State shared revenue received by the city from 2011 through 2020. Funding has decreased steadily since 2011 which was $12,426,200, a decrease of $1,883,780 or 15 percent.
State Shared Revenue
Transportation Aids
Transportation aids recognizes local government’s past costs for constructing and maintaining local streets. Funding for Transportation aids is based on a formula that
75

includes actual expenditures of eligible expenditures for local street maintenance and number of street miles. The chart below reflects a 10 year history of the Transportation aids received by the city from 2011 through 2020.
Transportation Aids
The 2020 projected revenues for Transportation aids are all assigned to the General Fund. The overall amount has decreased since 2011. The slight increase in aids since 2018 is a direct result of the increase in expenditures for street maintenance and construction resulting from support of the Strategic Plan Focus Area of Infrastructure and Public Facilities. The increase in Transportation aids since 2019 is due to a mileage rate increase by 10 percent from $2,389 per mile to $2,628 per mile The 2020 Capital Improvement Program increases the expenditures for road maintenance for the period of 2020 through 2024. It is anticipated these additional expenditures will augment the annual Transportation aids payment.
Water Utility in Lieu of Tax
Wisconsin Statute 66.0811 stipulates a city owning a public utility is entitled to the same rate of return as permitted for privately owned utilities. Chapter 109 of the Public Service Commission defines the calculation of the maximum tax equivalent to be determined by applying the local and school tax rates for the calendar year to the gross book value for the calendar year of plant plus materials and supplies multiplied by the assessment ratio for the municipality involved.
76

The 2020 Water Utility in lieu of tax is $1,170,000, a slight reduction from 2019. Overall, the amount has increased steadily from $954,120 in 2011. Due to a planned significant infrastructure investment of $28 million for a fresh water intake system, an additional rate increase is anticipated within the next several years. The chart below depicts the 10 year history of the Water Utility in lieu of tax received by the City from 2011 through 2020.
Water Utility in Lieu of Tax
SPECIAL REVENUE FUNDS
Police MEG Unit Fund
The revenue source for the Police MEG Unit Fund is State of Wisconsin Department of Justice Edward Byrne Memorial Justice Assistance Grant funds. The table below shows a four year history of the major revenue source.
Funding from all sources is based on actual expenditures of the Sheboygan County Multi-Jurisdictional Enforcement Group (MEG). The reimbursement not funded by the State of
$0
$200,000
$400,000
$600,000
$800,000
$1,000,000
$1,200,000
$1,400,000
2011 2012 2013 2014 2015 2016 2017 2018 2019 2020
MAJOR REVENUE SOURCE
2017 2018 2019 2019 2020Actual Actual Amended Estimated Adopted
Intergovernmental revenue $29,638 $40,063 $53,827 $53,827 $53,827
77

Wisconsin is contributed in equal amounts by the City of Sheboygan and Sheboygan County. No material change in revenue in future years is expected. The program is administered by the Sheboygan Police Department. Block Grant Fund
The revenue source for the Block Grant Fund is the U. S. Department of Housing and Urban Development’s Community Block Grant program. The program is funded on an April 1 through March 31-fiscal year. The 2020 budget is $892,414, reflecting a slight increase of $24,416, or three percent, from the 2019 Amended Budget. Future grant amounts are not anticipated to increase. The City of Sheboygan receives funding as a designated entitlement community. The funds support activities that benefit low and moderate-income persons in the community. The program is administered by the Department of City Development. Housing Revolving Loan Fund
The revenue source for the Housing Revolving Loan Fund is principal payments on loans for owner-occupied and owner-investor properties that house low to moderate income persons in an effort to provide safe and affordable housing opportunities in the city. The low interest loans are typically repaid over a ten year period. The table below shows a four year history of the top two major revenue sources.
The program is administered by the Department of City Development. Loans applications are reviewed and approved by the Housing Rehabilitation Committee to eligible home owners. The program is administered by the Department of City Development. Business Revolving Loan Fund
The revenue source for the Business Revolving Loan Fund are principal and interest payments on loans to companies that are unable to obtain loans solely from financial institutions and the Small Business Administration. The low interest loans are typically repaid over a ten year period. The table on the following page shows a four year history of the top two major revenue sources.
TOP TWO MAJOR REVENUE SOURCES
2017 2018 2019 2019 2020Actual Actual Amended Estimated Adopted
Principal repayment $175,004 $93,791 $120,000 $120,000 $120,000Federal grant $0 $0 $127,753 $127,753 $127,753
78

The program is administered by the Department of City Development. Loans applications are reviewed and approved by the Redevelopment Authority. Neighborhood Revitalization Fund
The revenue source for the Neighborhood Revitalization Fund is an interfund transfer of excess increment from TID 11 – Debt Service Fund. This fund is new in 2020. Program funds will be used to improve affordable housing opportunities within the city’s neighborhoods, as well as make necessary infrastructure enhancements within the core areas of the city. The Neighborhood Revitalization Fund directly supports one of the key six focus areas of the city’s Strategic Plan. The 2020 budgeted revenue is $712,964, a one-time transfer from TID 11, during this inaugural year of the fund. The program is administered by the Department of City Development. Mead Public Library Fund
The top two major revenue sources are the Property tax levy and Intergovernmental revenue. Mead Public Library serves as the regional resource library for the Monarch Library System. The table below shows a four year history of the top two major revenue sources.
The Property tax levy accounts for 70 percent of the funding, while Monarch Library System provides 24 percent of the funding for Mead Public Library. Reimbursement from Monarch Library System is based on a formula which takes into account library materials loaned to County residents not served by a local library and operating expenditures. This program is administered by the Mead Public Library Board. Tourism Fund
Room taxes were formerly collected from two sources, room taxes collected at the Blue Harbor Resort and hotelkeepers, motel operators and other persons furnishing accommodations that are available to the public. As of 2019, all room taxes are accounted for collectively.
TOP TWO MAJOR REVENUE SOURCES
2017 2018 2019 2019 2020Actual Actual Amended Estimated Adopted
Principal repayment $238,304 $276,904 $150,000 $150,000 $150,000Interest Income $56,389 $56,053 $40,000 $40,000 $40,000
TOP TWO MAJOR REVENUE SOURCES
2017 2018 2019 2019 2020Actual Actual Amended Estimated Adopted
Property tax levy $2,305,741 $2,335,829 $2,399,321 $2,399,321 $2,423,314Intergovernmental revenue $689,879 $692,023 $786,593 $786,593 $821,668
79

The table below shows a four year history of the top two major revenue sources.
The room tax rate is eight percent of revenue derived from the sale of rooms. Beginning in 2019, all motel taxes, including taxes received from Blue Harbor Resort, are available for tourism development and attraction. Prior to 2019, funds received from the Blue Harbor room tax were retained by the City of Sheboygan and transferred to the G.O. Debt Service Fund for debt payment on the Convention Center at the resort. The Convention Center debt payments were completed in 2018. As a result of a change in Wisconsin State Statute, the city became part of a Tourism Commission Zone as of January 1, 2017. With two new hotels under construction, 201 additional rooms will be available by mid-2020. Significant added revenue is projected for 2020 and beyond. The program is administered by the Department of City Development. Park, Forestry and Open Space Fund
The Park, Forestry and Open Space Fund will receive nearly all of its funding in 2020 from the Property tax levy. The allocation of $110,000 includes funding for the urban forestry management program to combat the Emerald Ash Borer beetle infestation. The funding level is consistent with the cost of the projects identified in the Five Year Capital Improvements Program. No property tax levy change is projected in future years. The program is administered by the Department of Public Works Parks Division. Park Impact Fee Fund The Park Impact Fee Fund receives nearly 100 percent of its funding from the impact fees which account for the expenditures associated with the increased demand for new, expanded or improved park facilities related to new housing development. The impact fee was established in 2017 by the Common Council. In addition to the annual inflationary increase in the fee, revenue amounts are projected to remain consistent due to anticipated strong demand for increased housing development, in particular, multi-family housing construction. The program is administered by the Department of Public Works Parks Division. Cable TV Fund
The major revenue source for the Cable TV Fund is the State of Wisconsin regulated franchising fee for wireline-based video services provided by cable television companies. The table on the following page shows a four year history of the major revenue source.
TOP TWO MAJOR REVENUE SOURCES
2017 2018 2019 2019 2020Actual Actual Amended Estimated Adopted
Motel taxes $723,288 $798,808 $650,000 $1,450,066 $1,746,264Blue Harbor room tax $849,778 $827,405 $810,000 $0 $0
80

Wisconsin Act 42, effective January 9, 2008, requires video service providers pay a “video service provider fee” to the municipalities in which they provide service. The amount of the fee is a percentage of the provider’s gross receipts generated within the municipality. In 2020, the state law was modified to continue decreases in Franchise fee revenue by 20 percent each year for over a five year period. The program is administered by the Information Technology Department. Municipal Court Fund
The major revenue source for the Municipal Court Fund is court penalty fines. The City of Sheboygan, in cooperation with the Village of Kohler established the Municipal Court in 2006. The table below shows a four year history of the major revenue source.
Court penalty fines have increased as a revenue source due to the city’s participation in the State of Wisconsin Debt Collection system. This program is administered by the Municipal Court. Ambulance Fund
The major revenue source for the Ambulance Fund is public charges for services. The Common Council approved Ambulance Fund operations as part of the Sheboygan Fire Department effective January 1, 2008. The table below page shows a four year history of the major revenue source.
The Common Council establishes the fees for emergency medical and related services as well as the geographic area of coverage. Traditionally, the city is conservative in budgeting
MAJOR REVENUE SOURCE
2017 2018 2019 2019 2020Actual Actual Amended Estimated Adopted
Franchise fee $569,961 $554,735 $570,000 $554,735 $486,000
MAJOR REVENUE SOURCE
2017 2018 2019 2019 2020Actual Actual Amended Estimated Adopted
Court penalty fines $705,457 $922,128 $750,000 $750,000 $900,000
MAJOR REVENUE SOURCE
2017 2018 2019 2019 2020Actual Actual Amended Estimated Adopted
Public charges for service $1,317,886 $1,396,874 $1,150,000 $1,300,000 $1,250,000
81

revenue for this fund. Future revenue is anticipated to increase slightly due to the addition of new medical equipment and related higher billing. The program is administered by the Fire Department. Special Assessment Fund
The major revenue source for the Special Assessment Fund is from property owners who have benefited from improvement to infrastructure. The table below shows a four year history of the major revenue source.
Property owners are assessed for sewer and sidewalk improvements. The Water Utility assesses for improvements to water mains and laterals. Annually, an interfund transfer is budgeted to the G.O. Debt Service Fund. No charges for street paving and resurfacing projects have been assessed since 2017. Consequently, the revenue associated with installment payments of prior projects will decrease over the next several years. The program is administered by the Finance Department. Harbor Centre Marina Fund
The major revenue source for the Harbor Centre Marina Fund is marina operations. The City contracts with an agent, F3 Marina, to manage and operate the marina. The current contract was renewed for five years in effective January, 2019. The table below shows a four year history of the major revenue source.
The Marina was established as part of TID 6 in 1992 and opened for operations in 1994. As a result of unusually cold weather in spring 2019, reduced boating activity caused a decrease in revenue. The program is administered by the Department of Public Works. Redevelopment Authority Fund
The major revenue source for the Redevelopment Authority Fund is principal payments on a business loan.
MAJOR REVENUE SOURCE
2017 2018 2019 2019 2020Actual Actual Amended Estimated Adopted
Special assessments $465,170 $249,624 $152,719 $187,399 $155,900
MAJOR REVENUE SOURCE
2017 2018 2019 2019 2020Actual Actual Amended Estimated Adopted
Marina operations $816,946 $897,717 $815,000 $739,900 $846,700
82

The table below shows a four year history of the major revenue source.
The Redevelopment Authority Fund assists with projects and acquisition of properties enhancing redevelopment. The program is administered by the Department of City Development. Storm Water Fund
The major revenue source for the Storm Water Fund is collection of erosion control permit fees to review storm water drainage plans and inspect soil erosion measures at construction site. The table below shows a four year history of the major revenue source.
Funds are accumulated and utilized for expansion of storm sewers in the city. No material change in revenue is projected. The program is administered by the Department of Public Works. DEBT SERVICE FUNDS
G.O. Debt Service Fund
The major revenue sources for the G.O. Debt Service Fund are Property tax levy and interfund transfers. Transfers to the G.O. Debt Service Fund are from the Tourism Fund. The table below shows a four year history of the top two major revenue sources.
MAJOR REVENUE SOURCE
2017 2018 2019 2019 2020Actual Actual Amended Estimated Adopted
Loan principal payment $100,000 $100,000 $100,000 $100,000 $0
MAJOR REVENUE SOURCE
2017 2018 2019 2019 2020Actual Actual Amended Estimated Adopted
Erosion control fee $19,949 $19,991 $18,500 $18,500 $18,500
TOP TWO MAJOR REVENUE SOURCES
2017 2018 2019 2019 2020Actual Actual Amended Estimated Adopted
Property tax levy $2,886,889 $3,196,889 $3,421,889 $3,421,889 $3,541,758Interfund transfers $1,101,426 $915,434 $810,000 $308,105 $329,629
83

The amount of Property tax levy represents $1.29 per $1,000 of equalized property valuation. In 2020, the Property tax levy of $3,541,758 represents 78 percent of the G.O. Debt Service Fund revenues. The amount of Property tax levy is anticipated to increase over the next several years in light of higher debt service expenses. The program is administered by the Finance Department. Convention Center Debt Service Fund
The Convention Center Debt Service Fund was established for repayment of the construction of a convention center located within the Blue Harbor Resort on South Pier Drive. The contract with the original owners, Great Wolf Resort, included a guarantee for repayment of the outstanding debt. At the time of assignment of the resort to the current owners, the guarantee terminated. In 2015, an audit entry of $2,000,000 was recorded for a prior period adjustment. As a result, the ending fund balance in the Convention Center Debt Service Fund of the governmental fund financial statements and the ending net position of the government-wide financial statements increased by $2,000,000. The debt has since then been repaid. Interest on investment serves as the fund’s sole revenue source and will decline in light of decreasing fund balances. The program is administered by the Finance Department. TID Debt Service Funds
The major revenue sources for the TID Debt Service Funds are TID increments. TID increments are property taxes paid by the property owners on the valuation of their development and value above the base year for each individual district. The table below shows a four year history of the increment by district.
TID 10, 11, 12, 13, 15 and the Environmental TID Debt Service Funds are anticipated to experience steady increases in TID increment in 2020. TID 14 Debt Service Fund is
TID INCREMENTS
2017 2018 2019 2019 2020Actual Actual Amended Estimated Adopted
TID 5 Debt Service Fund $513 $2,320 $0 $0 $0TID 6 Debt Service Fund $1,199,924 $1,241,979 $1,419,017 $1,454,782 $1,402,676TID 10 Debt Service Fund $257,794 $262,607 $263,377 $252,155 $290,814TID 11 Debt Service Fund $577,391 $614,115 $621,818 $637,485 $712,964TID 12 Debt Service Fund $152,379 $164,337 $170,102 $174,704 $221,752TID 13 Debt Service Fund $292,614 $331,434 $378,303 $387,841 $420,602TID 14 Debt Service Fund $419,635 $424,523 $467,432 $479,226 $864,774TID 15 Debt Service Fund $184,477 $153,191 $164,251 $168,392 $191,646TID 16 Debt Service Fund $920 $79,485 $255,819 $262,268 $544,335TID 17 Debt Service Fund $0 $0 $0 $0 $48,983TID 18 Debt Service Fund $0 $0 $0 $0 $100,372TID 19 Debt Service Fund $0 $0 $0 $0 ($1,490)Environmental TID $113,880 $114,765 $114,953 $114,953 $122,003
Total $3,199,527 $3,388,756 $3,855,072 $3,931,806 $4,919,431
84

experiencing significant growth with the completion of the Meijer store redevelopment. TID 16 Debt Service Fund is anticipated to experience significant growth as well. TID 18 and 19 Debt Service Funds were both created in 2018. The program is administered by the Finance Department. CAPITAL IMPROVEMENT FUNDS
Capital Project Fund The top two revenue sources for the Capital Project Fund in 2020 are Property tax levy and Vehicle registration fees. The table below shows a four year history of the top two major revenue sources.
The allocation of Property tax levy is not expected to change due to a greater need for the levy to fund the city’s operational budget (General Fund). Vehicle registration fees are expected to increase slightly due to an increase in the number of vehicles resulting from additional housing units under construction. The program is administered by the Finance Department. Capital Improvement Fund
General obligation debt proceeds are the largest revenue source for the Capital Improvements Fund. The budget includes debt for capital improvements projects, representing 100 percent of the funding source. The table below shows a four year history of the top two major revenue source.
Future General obligation debt service will be more consistent with the 2020 Adopted Budget amount in light of the approved Five Year Capital Improvements Program. The program is administered by the Finance Department.
TOP TWO MAJOR REVENUE SOURCES
2017 2018 2019 2019 2020Actual Actual Amended Estimated Adopted
Property tax levy $929,507 $929,507 $892,025 $892,025 $808,492Vehicle registration fees $745,372 $724,799 $791,750 $791,750 $791,750
MAJOR REVENUE SOURCE
2017 2018 2019 2019 2020Actual Actual Amended Estimated Adopted
General obligation debt $5,000,000 $10,020,000 $5,397,126 $5,190,370 $3,580,546
85

Industrial Park Fund The Industrial Park Fund was established in the 1980’s to administer expenditures associated with the development of an industrial park. In 2020, the major revenue source for this fund continues to be Interest on investments. No future changes in revenue amounts are anticipated. The program is administered by the Department of City Development. TID 14 Capital Project Fund With no projects planned for 2020, no related revenue is estimated. No future change in revenue is expected. The program is administered by the Department of City Development. TID 16 Capital Project Fund The major revenue source for TID 16 Capital Project Fund is a general obligation note to support infrastructure upgrades within the district. Future General obligation notes are expected to meet Capital Improvements Program needs. The program is administered by the Department of City Development. TID 17 Capital Project Fund The major revenue source for TID 17 Capital Project Fund is a general obligation note to support several improvements within the district including infrastructure improvements in the area adjacent to the Badger State Lofts redevelopment, the Indiana Avenue Trail project land acquisition, and the Innovation District surface parking lot. Future general obligation notes are expected to diminish to a minimal amount. The program is administered by the Department of City Development. TID 18 Capital Project Fund No projects are planned for 2020 or beyond. As future development occurs in TID 18, transfers of increment from TID 18 Debt Service Fund will be used to reduce negative fund balances. The program is administered by the Department of City Development. TID 19 Capital Project Fund The major revenue source for TID 19 Capital Project Fund is a general obligation note to support the reconstruction of Niagara Avenue as the area is redeveloped. Additional general obligation notes are expected in future years as upgrades to street infrastructure will be necessary to leverage more private development within the TID. The program is administered by the Department of City Development. PROPRIETARY FUNDS
Proprietary Funds are subdivided into two sections: Internal Service Funds and Enterprise Funds.
86

Internal Service Funds
The major revenue source for all Internal Revenue Funds are intergovernmental revenues received from other funds, as internal services are responsibilities a government provides to support its own internal operation. The table below shows a four year history of the Intergovernmental Revenue by fund.
Related charges to the General Fund serve as the major contributor of intergovernmental revenue for these internal service funds. Increase in charges on behalf of the Motor Vehicle Fund and Information Technology Fund are planned to reduce reliance on borrowed funds and applied fund balance, respectively. Enterprise Funds Water Utility Fund The major revenue source for the Water Utility Fund is sales of water. Water sales constitute 97 percent of the fund’s revenue source. The table below shows a four year history of the major revenue source.
Sales of water include revenue from residential, commercial, industrial and public customers, as well as Fire Protection and sales to other municipalities. No water rate increase is expected for 2020; however, significant water rate increases are anticipated in future years to pay for a $28 million fresh water intake pipe replacement project. Recycling Utility Fund
The Recycling Utility Fund is newly created within the 2020 Budget. The major revenue source is the recycling fee. In 2021 and beyond, the fee will increase slightly due to 2020
INTERGOVERNMENTAL REVENUE
2017 2018 2019 2019 2020Actual Actual Amended Estimated Adopted
Motor Vehicle Fund $1,810,774 $1,814,268 $1,814,020 $1,814,020 $1,995,422Health Insurance Fund $6,037,898 $6,608,964 $6,863,265 $6,729,710 $6,770,405Liability Insurance Fund $258,621 $230,470 $525,200 $180,000 $410,000Workers Compensation Fund $610,360 $610,752 $610,000 $610,000 $610,000Information Technology Fund $853,477 $880,618 $936,625 $936,628 $992,310
MAJOR REVENUE SOURCE
2017 2018 2019 2019 2020Actual Actual Amended Estimated Adopted
Sales of water $8,484,209 $9,094,682 $8,735,000 $8,469,035 $9,061,868
87

revenue amounts representing only 11 months of service, rather than a 12 month billing cycle. The table below shows the major revenue source.
Wastewater Utility Fund
The two major revenue sources for the Wastewater Fund are sewer service charges to city residents and outlying municipalities. These two categories comprise 97 percent of the fund’s revenue sources. The table below shows a four year history of the two major revenue sources.
Sewer Service charges are derived from calculated user fees utilizing a three year average of usage by the various categories of customers. Only inflationary rate increases are anticipated in future years. A rate increase in sewer user fees for other municipalities is projected for 2020. Transit Utility Fund
The major revenue sources for the Transit Fund are subsidy payments received from the federal government and State transit subsidy. The subsidy payments comprise 52 percent of the fund’s revenue source. The table below shows a four year history of the two major revenue sources.
MAJOR REVENUE SOURCE
2017 2018 2019 2019 2020Actual Actual Amended Estimated Adopted
Recycling Fee $0 $0 $0 $0 $809,468
TOP TWO MAJOR REVENUE SOURCES
2017 2018 2019 2019 2020Actual Actual Amended Estimated Adopted
Sewer service - city $5,669,042 $6,830,151 $7,200,000 $7,124,065 $7,696,466Sewer service - other municipalities $1,188,629 $1,232,149 $1,086,500 $1,162,653 $1,263,189
TOP TWO MAJOR REVENUE SOURCES
2017 2018 2019 2019 2020Actual Actual Amended Estimated Adopted
Federal subsidy $1,206,561 $1,170,891 $1,176,711 $1,225,789 $1,153,325State transit subsidy $949,408 $917,899 $979,029 $902,540 $959,573
88
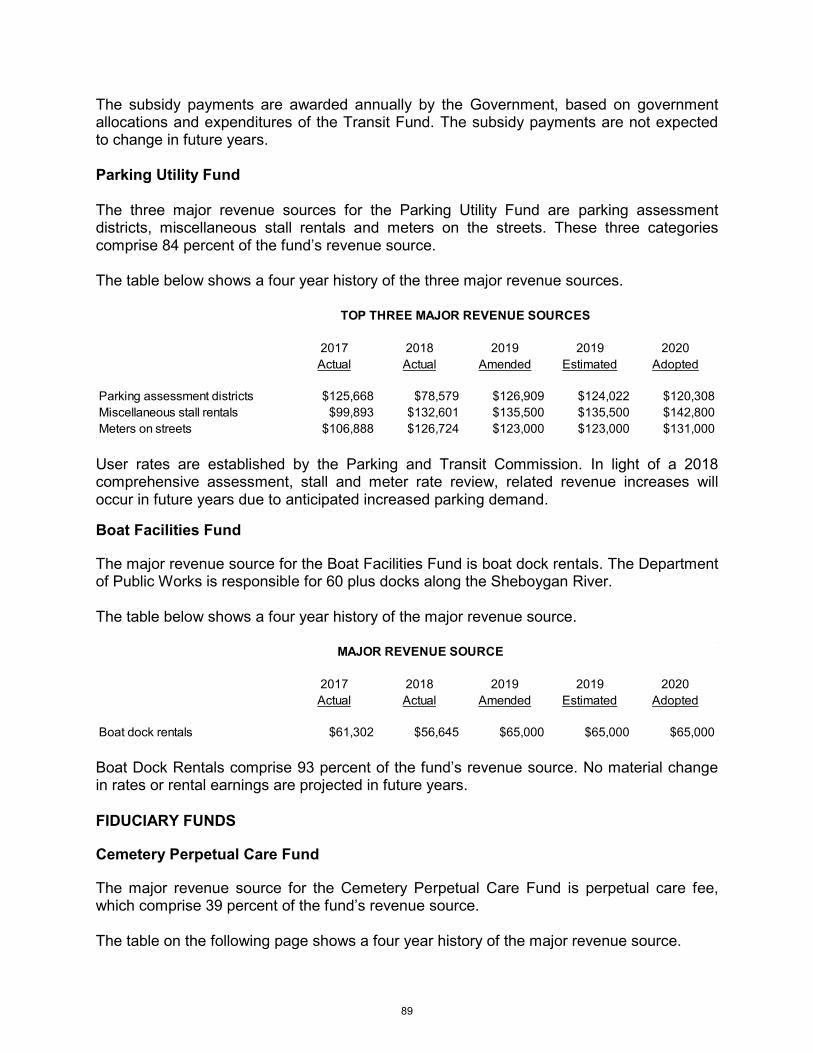
The subsidy payments are awarded annually by the Government, based on government allocations and expenditures of the Transit Fund. The subsidy payments are not expected to change in future years. Parking Utility Fund The three major revenue sources for the Parking Utility Fund are parking assessment districts, miscellaneous stall rentals and meters on the streets. These three categories comprise 84 percent of the fund’s revenue source. The table below shows a four year history of the three major revenue sources.
User rates are established by the Parking and Transit Commission. In light of a 2018 comprehensive assessment, stall and meter rate review, related revenue increases will occur in future years due to anticipated increased parking demand.
Boat Facilities Fund
The major revenue source for the Boat Facilities Fund is boat dock rentals. The Department of Public Works is responsible for 60 plus docks along the Sheboygan River. The table below shows a four year history of the major revenue source.
Boat Dock Rentals comprise 93 percent of the fund’s revenue source. No material change in rates or rental earnings are projected in future years. FIDUCIARY FUNDS
Cemetery Perpetual Care Fund
The major revenue source for the Cemetery Perpetual Care Fund is perpetual care fee, which comprise 39 percent of the fund’s revenue source. The table on the following page shows a four year history of the major revenue source.
TOP THREE MAJOR REVENUE SOURCES
2017 2018 2019 2019 2020Actual Actual Amended Estimated Adopted
Parking assessment districts $125,668 $78,579 $126,909 $124,022 $120,308Miscellaneous stall rentals $99,893 $132,601 $135,500 $135,500 $142,800Meters on streets $106,888 $126,724 $123,000 $123,000 $131,000
MAJOR REVENUE SOURCE
2017 2018 2019 2019 2020Actual Actual Amended Estimated Adopted
Boat dock rentals $61,302 $56,645 $65,000 $65,000 $65,000
89

Annually, interest earnings are transferred to the General Fund for maintenance of Wildwood Cemetery. No material change in earnings is projected in future years. Mead Public Library Trust Fund
The major revenue source for the Mead Public Library Trust Fund is interest earnings. The table below shows a four year history of the major revenue source.
The Mead Public Library Board controls the investment of the funds and use of the interest. No material change in earnings is projected in future years.
MAJOR REVENUE SOURCE
2017 2018 2019 2019 2020Actual Actual Amended Estimated Adopted
Perpetual care fee $11,611 $14,836 $9,400 $9,400 $9,400
MAJOR REVENUE SOURCE
2017 2018 2019 2019 2020Actual Actual Adopted Estimated Adopted
Interest on investments $139,314 ($34,682) $15,000 $15,000 $15,000
90

GENERAL FUND BUDGET SUMMARY
2017 2018 2019 2019 2020
Actual Actual Amended Estimated Adopted
Revenue
Taxes 15,617,078 16,469,774 16,639,228 16,639,608 16,812,638
Licenses and Permits 1,070,035 1,206,900 921,240 1,236,480 992,740
Intergovernmental Revenue 14,258,857 14,637,627 14,482,474 13,985,466 14,233,373
Intergovernmental Charges for Services 212,174 259,067 258,000 258,000 258,000
Charges for Services 1,721,996 1,625,706 1,679,822 1,599,604 1,601,322
Fines and Forfeitures 354,853 275,390 271,000 271,000 271,000
Miscellaneous Revenue 440,329 637,008 342,425 415,889 356,650
Other Financing Sources 2,811,255 2,900,078 2,717,605 3,287,291 2,878,924
Total Revenue 36,486,578 38,011,550 37,311,794 37,693,339 37,404,647
Expense
General Government 3,200,019 3,482,747 4,024,030 3,609,017 4,207,724
Public Safety 20,153,964 21,258,537 21,784,550 21,712,789 22,315,691
Public Works 8,270,129 8,464,170 9,069,716 9,131,312 8,825,441
Health and Human Services 221,626 188,887 201,337 193,455 201,331
Culture and Recreation 2,502,124 2,589,441 2,681,942 2,687,117 2,837,589
Conservation and Development 646,480 348,915 352,725 353,951 368,721
Transfers and other expenses 118,427 5,604,986 431,077 86,482 538,030
Total Expenditures 35,112,769 41,937,683 38,545,378 37,774,122 39,294,527
Excess of revenue over (under) expenditures 1,373,809 -3,926,133 -1,233,584 -80,783 -1,889,880
Fund Balance, Beginning Year 22,527,096 23,900,905 19,974,772 19,974,772 19,893,989
Fund Balance, Ending Year* 23,900,905 19,974,772 18,741,188 19,893,989 18,004,109
*Ending Fund Balance consists of:
Uncommitted 20,954,275 17,431,687 16,189,596 17,342,397 15,452,517
Committed 2,946,630 2,543,085 2,551,592 2,551,592 2,551,592
23,900,905 19,974,772 18,741,188 19,893,989 18,004,109
91

GENERAL FUND BUDGET SUMMARY
2017 2018 2019 2019 2020
Actual Actual Amended Estimated Adopted
Committed
Inventory 155,185 151,571 150,000 150,000 150,000
Prepaid postage and other 31,602 11,294 13,500 13,500 13,500
Advance to TID 10 Debt Fund 611,908 419,728 419,728 419,728 419,728
Advance to TID 13 Debt Fund 112,175 112,175 112,175 112,175 112,175
Advance to Envrironmental TID Debt Fund 174,504 0 0 0 0
Advance to TID 16 Capital Fund 542,255 542,255 542,255 542,255 542,255
Advance to TID 17 Capital Fund 14,500 14,500 14,500 14,500 14,500
Advance to TID 18 Capital Fund 791,562 791,562 791,562 791,562 791,562
Advance to Harbor Centre Marina Fund 8,783 0 0 0 0
Advance to Redevelopment Authority Fund 500,000 500,000 500,000 500,000 500,000
Due from TID 18 Capital Fund 4,156 0 7,872 7,872 7,872
2,946,630 2,543,085 2,551,592 2,551,592 2,551,592
92

GENERAL FUNDFUND 101
2017
Actual
2018
Actual
2019
Amended
2019
Estimated
2020
Adopted
REVENUES
TAXES411100 PROPERTY TAX LEVY 15,406,665 16,240,705 16,435,705 16,435,705 16,609,115
411300 PAYMENT IN LIEU OF TAX 7,219 7,320 7,000 7,000 7,000
412300 MOBILE HOME FEES 106,604 128,113 105,000 105,000 105,000
414100 MOTEL TAXES 400 - - - -
414106 STATE SALES TAX COMMISSION 131 128 - 62 -
419120 HOUSING AUTH.IN LIEU OF TAX 56,380 57,828 56,380 56,380 56,380
419130 PARK PLAZA IN LIEU OF TAX 21,144 21,946 21,143 21,143 21,143
419140 B'NAI BRITH IN LIEU OF TAX 10,000 10,000 10,000 10,000 10,000
419200 PERS. PROPERTY PENALTIES 8,936 3,734 4,000 4,318 4,000
TOTAL 15,617,478$ 16,469,774$ 16,639,228$ 16,639,608$ 16,812,638$
LICENSES & PERMITS421101 INTOXICATING LIQUOR LICENSE 61,322 71,770 65,000 65,000 65,000
421106 MALT BEVERAGE LICENSE 25,071 25,077 23,000 23,000 23,000
421111 WINE LICENSE (CLASS C) 1,330 2,535 500 500 500
421206 NON-INTOXICATING LIQUOR 245 250 200 200 200
421601 BEVERAGE OPERATOR LICENSE 37,325 34,415 36,000 36,000 36,000
421606 CIGARETTE LICENSE 6,600 6,200 5,000 5,000 5,000
421611 TAXI CAB OPERATOR LICENSE 1,605 1,495 1,200 1,200 1,200
421616 LANDSCAPING LICENSE 1,895 1,390 1,000 1,000 1,000
421621 ALARM SYSTEM LICENSE 650 675 500 500 500
421626 ROOMING HOUSE PERMIT 590 650 800 500 800
421630 CONTRACTOR LICENSE 78,315 77,505 80,000 77,000 75,000
421638 MOTEL TAX PERMIT - 500 400 400 400
421641 MASSAGE ESTABLISHMENT 2,400 2,500 2,000 2,000 2,000
421666 SECONDHAND DEALER LICENSE 598 513 400 400 400
421676 SIDEWALK CAFE LICENSE 2,071 2,001 2,000 2,000 2,000
421699 OTHER PROF/OCCUP LICENSE 250 250 300 300 300
421701 MUSIC LICENSE 1,100 1,150 1,100 1,100 1,100
421706 DANCE HALL LICENSE 110 120 150 150 150
421711 BOWLING ALLEY LICENSE 1,980 2,040 2,100 2,100 2,100
421716 CARNIVAL LICENSE 1,575 1,050 600 600 600
421721 CIRCUS LICENSE 175 175 350 350 350
421726 THEATRE LICENSE 650 650 650 650 650
421741 AMUSEMENTS 9,400 9,400 10,200 10,200 10,200
422101 BUILDING PERMITS 381,705 391,057 350,000 541,717 375,000
422106 PROJECTING SIGN FEES 6,675 5,475 8,500 5,670 8,500
422111 BUILDING PERMITS/STATE SEALS 1,120 (474) 400 200 600
422116 ELECTRICAL PERMITS 153,970 246,045 120,000 211,000 150,000
422121 HEATING PERMITS 152,685 128,855 120,000 125,000 120,000
422126 PLUMBING PERMITS 79,160 82,790 40,000 66,850 60,000
422136 OCCUPANCY PERMITS 19,850 11,150 15,000 15,000 10,000
422701 DOG LICENSE 15,065 14,774 15,000 15,000 15,000
422706 CAT LICENSE 4,531 4,648 - 4,500 4,500
422711 PIG LICENSE 3 8 - 3 -
422716 PET FANCIER PERMIT FEE 51 20 - - -
422721 DANGEROUS DOG REGISTRATION - 10 - - -
422801 RESIDENTAL PARKING PERMITS 210 216 150 150 150
422901 ALARM SYSTEM USER PERMIT 11,355 10,640 10,000 10,000 10,000
422906 BICYCLE LICENSE 504 1,648 1,000 1,000 1,000
422913 TRANSIENT MERCHANT LICENSE 2,303 2,461 3,000 3,000 3,000
422914 MOBILE FOOD VENDOR 3,046 4,741 2,200 4,400 4,000
422916 ENCROACHMENT FEES 459 59,380 1,200 1,500 1,200
93

GENERAL FUNDFUND 101
2017
Actual
2018
Actual
2019
Amended
2019
Estimated
2020
Adopted
REVENUES422926 GARNISHED FEES 286 346 500 500 500
422936 ZONING CHANGE & VACATION 1,400 800 840 840 840
TOTAL 1,069,635$ 1,206,900$ 921,240$ 1,236,480$ 992,740$
INTERGOVERNMENTAL REVENUE431246 STATE GRANT 12,273 - - - -
434101 STATE AID GENERAL GOVERNMENT - - - - 55,474
434201 POLICE TRAINING AIDS - STATE - 24,564 - - 45,000
434211 STATE GRANT 219,377 188,174 181,434 211,434 211,434
434216 FEDERAL GRANT - 88,422 - - -
434301 CONNECTING HIGHWAY AIDS 217,694 218,891 218,740 218,740 218,740
434306 TRANSPORTATION AIDS 1,327,634 1,526,779 1,612,103 1,612,103 1,853,068
434316 MUNICIPAL RECYCLING GRANT 192,921 192,905 192,920 192,920 110,085
435100 STATE SHARED REVENUE 11,076,023 11,111,400 11,070,318 10,549,384 10,542,420
435101 EXPENDITURE RESTRAINT 743,141 696,447 738,759 743,811 728,952
435201 STATE AID - EXEMPT PROPERTY 254,514 258,255 250,000 250,000 250,000
435901 FIRE INSURANCE FROM STATE 107,998 110,542 107,000 107,000 107,000
436101 MUNICIPAL SERVICE PAYMENTS 107,282 221,248 111,200 100,074 111,200
TOTAL 14,258,857$ 14,637,627$ 14,482,474$ 13,985,466$ 14,233,373$
CHARGES FOR SERVICES - - - - -
437206 SCHOOL LIAISON AGREEMENT 212,174 259,067 258,000 258,000 258,000
437506 WEIGHTS/MEASURES INSPECT 31,623 33,290 35,000 33,000 35,000
441116 JURY & WITNESS FEES 888 816 800 800 800
441206 ADMINISTRATIVE SERVICES - - 1,500 1,500 -
441301 BOARD OF APPEALS 5,475 4,525 5,000 5,000 5,000
441316 CONDITIONAL USE PERMIT 13,750 13,250 13,000 11,000 13,000
441321 SITE PLAN REVIEW 1,400 11,400 1,000 4,000 4,000
441405 EXAMINING/INPSECTION FEE 8,700 10,650 9,000 8,000 5,000
441406 HUD REIMBURSEMENT 30,000 - 30,000 - -
441411 EROSION CONTROL FEE 2,800 1,300 1,000 500 1,500
441501 SALE OF CITY MAPS 500 669 - 284 500
441611 PUBLIC INFORMATION REQUEST 309 18 300 100 100
441801 INDUSTRIAL REVENUE BOND FEE - - 1,000 1,000 1,000
442206 FIRE EXTINGUISHER TRAINING 881 - 800 400 800
442501 ACCIDENT REPORTS 2,145 1,551 2,000 2,000 2,000
442506 POLICE AUCTION SALES 2,492 3,765 3,000 3,000 3,000
442511 ADMINISTRATIVE SERVICES 1,053 952 500 500 500
442516 POLICE COMMUNICATION SERV 1,500 475 - - -
442521 FALSE ALARM FEES 4,940 3,985 5,000 5,000 5,000
442546 FINGERPRINT SERVICE 1,320 1,391 1,500 1,500 1,500
442556 PUBLIC INFORMATION ACCESS 9,025 10,063 8,040 8,040 8,040
442621 FIRE REPORT PHOTOCOPIES 116 7 50 40 50
442626 HAZARDOUS MATERIAL HANDLNG 70 760 350 350 350
442641 RESPIRATORY MASK 795 720 750 - 350
442646 EXTRICATION FEES - - - 2,000 -
443101 STREET PERMITS 56,750 37,375 50,600 50,600 50,600
443506 SNOW SHOVELING-RESIDENTIAL 839 579 1,120 2,324 1,120
443906 MAILING PLANS & SPECS 25 - - - -
444321 RECYCLING ORDINANCE VIOLATION - - 500 500 500
444401 GARBAGE FEE 1,094,057 1,091,261 1,087,552 1,087,552 1,087,552
444501 WEED CUTTING 9,823 10,528 8,500 8,500 8,500
444511 DAMAGE FEES 220,999 165,761 200,000 150,000 150,000
447401 PARK RESERVATION PERMITS 96,942 83,711 110,000 110,000 113,300
447411 PARK EQUIPMENT RENTALS 21,044 16,745 20,750 20,750 20,750
94

GENERAL FUNDFUND 101
2017
Actual
2018
Actual
2019
Amended
2019
Estimated
2020
Adopted
REVENUES447499 MISC.PARK & RECREATION 736 401 1,000 1,000 1,000
449101 PHOTOCOPIES 3,693 7,263 3,085 3,185 3,385
449305 LOT SALES/BURIALS/CHARGES 63,590 62,120 61,050 61,050 61,050
449801 STATION CONCESSIONS 502 578 475 475 475
449901 VENDING MACHINE COMMISSION 221 130 - 54 -
449911 RECYCLED MATERIALS 32,993 49,665 15,600 15,600 15,600
TOTAL 1,934,171$ 1,884,773$ 1,937,822$ 1,857,604$ 1,859,322$
FINES & FORFEITURES451101 COURT PENALTY FINES 35,014 34,695 40,000 40,000 40,000
451111 FORFEITURE 18,761 11,098 - - -
451301 DAMAGE FEES - 250 - - -
451406 PARKING VIOLATIONS 292,488 223,747 225,000 225,000 225,000
451411 PENALTY FEES 8,590 5,790 6,000 6,000 6,000
451416 BICYCLE VIOLATIONS - (190) - - -
TOTAL 354,853$ 275,390$ 271,000$ 271,000$ 271,000$
MISCELLANEOUS REVENUE461101 INTEREST ON INVESTMENTS 217,091 387,557 210,000 210,000 210,000
461126 INTEREST ON DELQ SEWER FEE 10,510 10,424 10,000 10,000 10,000
461131 MISCELLANEOUS INTEREST 6,777 14,310 5,000 5,000 5,000
461199 INTEREST ON SPECIAL ASSESS 2,395 1,179 475 1,000 1,000
462115 OTHER CITY RENTALS 108,942 100,051 99,550 100,001 100,550
462130 FISH SHANTY RENTALS 13,064 13,053 13,100 13,100 13,100
467101 CONTRIBUTIONS 32,302 57,486 300 9,601 10,300
469101 SALE OF EQUIPMENT 10,054 23,940 500 452 500
469106 SALE OF PROPERTY - 1,408 - - -
469111 SALE OF LAND 10 - - - -
469121 CITY PROPERTY RESTITUTION 6,201 2,971 - 21 -
469501 CASH OVER/SHORT 29 (21) - 0 -
469600 ABANDONED VEHICLE STORAGE 764 690 - - -
469906 SALE OF WASTE OIL - - 1,500 1,500 1,500
469999 OTHER MISCELLANEOUS REV 32,190 23,960 2,000 65,214 4,700
TOTAL 440,329$ 637,008$ 342,425$ 415,889$ 356,650$
OTHER FINANCING SOURCES492255 INTER TRANSF FROM MEAD FUND - 31,967 - - -
492260 INTER TRANSF FROM TOURISM FUND 57,930 57,930 65,000 145,067 174,626
492270 INTER TRANSF FROM CABLE TV 425,000 425,000 425,000 425,000 304,549
492275 INTER TRANSF FROM MUNI COURT 274,197 424,723 260,823 296,077 401,389
492280 INTER TRANSF FROM AMBULANCE 536,401 451,102 413,699 919,670 463,360
492601 INTERFUND TRANS-WASTEWATER 225,000 225,000 225,000 225,000 225,000
492701 INTER TRANSFER - MOTOR VEHICLE 125,000 125,000 125,000 125,000 125,000
492805 INTER TRANSFER-CEMETERY 1,250 1,250 1,250 15,000 15,000
419110 WATER UTILITY IN LIEU OF TAX 1,166,477 1,158,106 1,201,833 1,136,477 1,170,000
TOTAL 2,811,255$ 2,900,078$ 2,717,605$ 3,287,291$ 2,878,924$
TOTAL GENERAL FUND 36,486,578$ 38,011,550$ 37,311,794$ 37,693,339$ 37,404,647$
95

GENERAL FUND EXPENDITURE SUMMARY
2017 2018 2019 2019 2020
Actual Actual Amended Estimated Adopted
General Government
Office of the Mayor 165,033 187,274 185,804 186,440 188,445
Office of the City Administrator 257,697 271,167 297,011 295,592 313,282
Council 126,089 111,417 103,110 116,690 142,006
Clerk 326,388 338,461 366,338 365,358 357,090
Elections 56,121 107,123 64,362 43,810 150,278
Finance 820,963 843,572 953,522 939,194 959,949
Assessing 338,333 336,091 334,233 332,147 351,565
Human Resources 240,555 314,210 366,861 354,517 355,414
Office of the City Attorney 400,030 462,830 493,925 493,286 526,015
City Hall 198,395 229,661 207,296 230,559 245,808
Insurance 270,416 285,509 311,565 250,824 277,809
Employee Benefits 0 0 340,003 0 340,063
Total General Government 3,200,019 3,487,315 4,024,030 3,608,417 4,207,724
Public Safety
Police 11,601,950 12,019,301 12,398,646 12,427,591 12,875,964
Fire 7,862,462 8,523,038 8,569,818 8,497,902 8,690,746
Building Inspection 684,174 715,195 811,250 782,460 744,108
Civil Defense 5,379 1,003 4,836 4,836 4,873
Total Public Safety 20,153,964 21,258,537 21,784,550 21,712,789 22,315,691
Public Works
Administration 292,793 360,896 373,120 379,080 405,354
Engineering 648,871 746,141 794,933 805,586 816,000
Streets/Alleys/Sidewalks 5,051,952 4,972,758 5,551,305 5,597,184 5,460,847
Sanitation 2,276,513 2,384,375 2,350,358 2,349,461 2,143,239
Total Public Works 8,270,129 8,464,170 9,069,716 9,131,312 8,825,441
Health and Human Services
Cemetery 221,626 188,887 201,337 193,455 201,331
Total Health and Human Services 221,626 188,887 201,337 193,455 201,331
Culture and Recreation
Parks 2,333,766 2,413,536 2,478,451 2,495,451 2,628,885
Senior Services 168,358 175,905 203,491 191,666 208,704
Total Culture and Recreation 2,502,124 2,589,441 2,681,942 2,687,117 2,837,589
Conservation and Development
City Development 646,480 348,915 352,725 353,951 368,721
Total City Development 646,480 348,915 352,725 353,951 368,721
96

GENERAL FUND EXPENDITURE SUMMARY
2017 2018 2019 2019 2020
Actual Actual Amended Estimated Adopted
Transfers and Other Expenses
Interfund Transfers 7,860 5,477,575 7,682 6,482 8,030
Unclassified 110,567 127,274 423,395 80,000 530,000
Total Transfer and Other Expenses 118,427 5,604,850 431,077 86,482 538,030
Total Expenditures 35,112,769 41,942,115 38,545,378 37,773,522 39,294,527
97

CITY OF SHEBOYGAN
NOTES
98

GENERAL GOVERNMENT OFFICE OF THE MAYOR
Total Employees: 2.00
Department Purpose The Mayor works cooperatively with the administration and Common Council to ensure that the best interests of the city are always of primary importance. The Mayor provides input and cooperates with the City Administrator in the development of the annual budget and to implement short and long-term strategic plans for the city. Department Description The Mayor actively works with economic development organizations to see local businesses grow, attract new businesses, and attract good jobs to the city. The Mayor is also an active, enthusiastic representative for the city’s best economic interests. He/she is the city’s goodwill ambassador and the face of city government, spending significant time meeting with concerned residents and addressing constituent questions. He/she participates in community activities and events such as parades, festivals, events, and ceremonies which enhances visibility and economic well-being of the city. The Mayor makes all required and necessary appointments to special and standing committees of the council and other boards and commissions as required by statute. This program is administered by the Office of the Mayor. 2020 Budget Highlight There are no notable changes for 2020.
Permanent Staffing 2017 Actual
2018 Actual
2019 Amended
2019 Estimated
2020 Adopted
Mayor 1.00 1.00 1.00 1.00 1.00 Administrative Assistant / Communications Specialist 1.00 1.00 1.00 1.00 1.00
Total Staffing 3.00 2.00 2.00 2.00 2.00
Expenditures 2017 Actual
2018 Actual
2019 Amended
2019 Estimated
2020 Adopted
Personal Services 147,016 171,519 167,258 167,621 169,971 Non-Personal Services 18,016 15,755 18,546 18,818 18,475
Total Expenditures 165,032 187,274 185,804 186,440 188,445 Strategic Plan Focus Areas: Economic Development. Communication. Goal: Promote quality and sustainable economic and community development. Ensure stakeholders are well informed and engaged in municipal matters. Objective: 1. Provide courteous service and timely, accurate information to people who
contact the Mayor’s Office. 2. Represent the city at community events including charity events, service
organization meetings, ground breakings, and ribbon cuttings.
Office of the Mayor
Administration
99

GENERAL GOVERNMENT OFFICE OF THE MAYOR
3. Build our community image and engender a fuller public appreciation of the city’s value.
4. Retain and attract quality businesses and commerce segments to support our local economy.
5. Advance the safety and security of all segments of our community. 6. To achieve an 80% or greater satisfaction (fair, good, or excellent) survey rating
from residents of the City of Sheboygan.
Measurements
2017 Actual
2018 Actual
2019 Amended
2019 Estimated
2020 Adopted
Workload Publish quarterly employee newsletter 4 4 4 4 4 Publish monthly “Sheboygan Insider” newsletter 12 12 12 12 12 Mayor’s blog posts 52 43 52 40 40 Meetings with State and Federal Representatives 12 18 15 15 15 Meetings with neighborhood groups and associations 12 14 15 12 12 Meetings with auxiliary city committees 50 55 55 55 55 Proclamations issued 35 26 40 30 30 New business ribbon cuttings and ground breakings 40 27 40 30 30 Efficiency Percent phone calls returned in 36 hours 98% 98% 98% 98% 98% Percent of emails replied to in 36 hours 96% 96% 98% 98% 98% Percent of letters replied to in 4 working days 97% 97% 98% 98% 98% Effectiveness Resident satisfaction rating 82% 81% 80% 90% 80%
100

GENERAL GOVERNMENT OFFICE OF THE CITY ADMINISTRATOR
Department Purpose To professionally implement all Common Council policy decisions, efficiently direct the city operations, and creates an organizational culture that results in the delivery of excellent municipal services to constituents of Sheboygan. Department Descriptions Working with the Common Council, the community and city staff, the Office of the City Administrator’s responsibility is to professionally implement all Common Council policy decisions and efficiently direct the city operations and activities in accordance with sound management principals. In addition, the City Administrator prepares, reviews, and monitors the annual operating budget for the city. The City Administrator also collaborates with the Mayor, City Attorney, and City Clerk. This program is administered by the Office of the City Administrator. 2020 Budget Highlights There are no notable changes in 2020.
Permanent Staffing 2017 Actual
2018 Actual
2019 Amended
2019 Estimated
2020 Adopted
City Administrator 1.00 1.00 1.00 1.00 1.00 Budget Analyst 1.00 1.00 1.00 0.00 0.00 Assistant to the City Administrator 0.00 0.00 0.00 1.00 1.00
Total Staffing 2.00 2.00 2.00 2.00 2.00
Expenditures 2017 Actual
2018 Actual
2019 Amended
2019 Estimated
2020 Adopted
Personal Services 237,736 257,685 266,685 269,284 282,956 Non-Personal Services 19,962 13,482 30,326 26,308 30,326
Total Expenditures 257,698 271,167 297,011 295,592 313,282 Strategic Plan Focus Areas: Quality of Life. Governing and Fiscal Management. Communication. Goal: To keep city residents, the general public, city employees, and the media informed about city issues, programs, and community events. To provide high quality services to the residents and businesses in the City of Sheboygan. Objective: 1. To attain 80% or greater satisfaction (fair, good or excellent) survey rating
regarding the availability of information about city program and services. 2. To achieve an 80% or greater satisfaction (fair, good or excellent) survey rating
Police
Office of the City Administrator
Public Works
Finance Senior Services
Information Technology
Fire Shoreline Metro
Human Resources
City Development
ning and
101

GENERAL GOVERNMENT OFFICE OF THE CITY ADMINISTRATOR
regarding service efficiency. 3. To achieve an 80% or greater satisfaction (fair, good or excellent) survey rating
regarding overall performance. 4. To receive the GFOA Distinguished Budget Presentation Award. 5. To continue receipt of the ICMA Certificate of Distinction in Performance
Management. 6. To receive the GFOA Award for Outstanding Achievement in Popular Annual
Financial Reporting (PAFR). 7. Report Strategic Plan Action Items and Critical Measures on a quarterly basis to
the Common Council. Measurements
2017 Actual
2018 Actual
2019 Amended
2019 Estimated
2020 Adopted
Effectiveness Resident satisfaction rating with
service efficiency 87% 85% 80% 91% 80%
Resident satisfaction rating with communication
97% 87% 80% 91% 80%
Resident satisfaction rating with city performance
94% 95% 80% 98% 80%
GFOA Budget Award Yes Yes Yes Yes Yes ICMA CPM Award Yes Yes Yes Yes Yes GFOA PAFR Award No No Yes Yes Yes Number of Strategic Plan
quarterly updates 4 4 4 4 4
102

GENERAL GOVERNMENT COMMON COUNCIL
Total Employees: 10.00
Department Purpose To represent the residents of the City of Sheboygan as the legislative body responsible for setting the governing policies of the city. Department Description The Common Council is comprised of 10 part-time elected officials representing 10 districts. They have the responsibility to establish policy by legislation, to adopt a spending plan, and to carry out the duties as defined by State Statutes and City Ordinances in a manner consistent with their Strategic Plan. This program is administered by the Office of the City Clerk. 2020 Budget Highlight The Adopted Budget includes the following changes:
An increase of $6,500 in Contracted Services for Diversity and Inclusion programming. An increase of $20,698 in Software Maintenance resulting from a reallocation of
expenditures previously captured in the Office of the City Clerk. An increase of $2,000 in Training and Conferences for additional Alderperson training
and seminar opportunities.
Permanent Staffing 2017 Actual
2018 Actual
2019 Amended
2019 Estimated
2020 Adopted
Alderpersons 16.00 10.00 10.00 10.00 10.00 Total Staffing 16.00 10.00 10.00 10.00 10.00
Expenditures 2017 Actual
2018 Actual
2019 Amended
2019 Estimated
2020 Adopted
Personal Services 77,158 66,851 48,280 48,280 58,728 Non-Personal Services 48,931 44,566 54,830 68,410 83,278 Capital Outlay 0 0 0 0 0
Total Expenditures 126,089 111,417 103,110 116,690 142,006 Strategic Plan Focus Areas: Quality of Life. Infrastructure and Public Facilities. Economic Development. Governing and Fiscal Management. Communication. Goal: Promote quality and sustainable economic and community development. Ensure residents are well informed and engaged in municipal matters. Objective: 1. Provide commitment to supporting the advancement of the Strategic Plan. 2. Represent the city residents at city meetings and other community events. 3. Build our community image and engender a fuller public appreciation of the city’s
value.
Common Council
Citizens of Sheboygan
103

GENERAL GOVERNMENT COMMON COUNCIL
4. Help retain and attract quality businesses and commerce segments to support
our local economy. Objective: 5. Advance the safety and security of all segments of our community. 6. To achieve an 80% or greater satisfaction (fair, good or excellent) survey rating
from residents of the City of Sheboygan. Measurements
2017 Actual
2018 Actual
2019 Amended
2019 Estimated
2020 Adopted
Effectiveness Resident satisfaction rating 76% 73% 80% 86% 80%
104

GENERAL GOVERNMENT OFFICE OF THE CITY CLERK
Total Employees: 3.75
Department Purpose To fulfill role as elections administrator, legislative administrator and records manager for the city in an efficient, professional and friendly manner in adherence with the International Clerk’s Code of Conduct; to provide excellent support to the Common Council and Departments throughout the legislative process; and to serve the residents of the City of Sheboygan as an accessible and responsive representative of transparent and open government. Department Description The City Clerk’s Department has multiple responsibilities including administering local, state and federal elections; processes and issues various municipal licenses; updates the Municipal Code Book; maintains the City Seal; carries out the duties and responsibilities required by Wisconsin State Statutes and City Ordinances and policies. This program is administered by the Office of the City Clerk. 2020 Budget Highlight There are notable changes in 2020.
Permanent Staffing 2017 Actual
2018 Actual
2019 Amended
2019 Estimated
2020 Adopted
City Clerk 1.00 1.00 1.00 1.00 1.00 Deputy City Clerk 0.81 1.00 1.00 1.00 1.00 Council/Licensing Clerk 1.00 1.00 1.00 1.00 1.00 Elections Specialist 0.75 0.75 0.75 0.75 0.75
Total Staffing 3.56 3.75 3.75 3.75 3.75
Expenditures 2017 Actual
2018 Actual
2019 Amended
2019 Estimated
2020 Adopted
Personal Services 253,270 272,785 275,607 275,607 285,620 Non-Personal Services 71,985 65,676 90,731 89,751 71,470 Capital Outlay 1,129 0 0 0 0
Total Expenditures 326,384 338,461 366,338 365,358 357,090
City Clerk
Elections Records Management
Public Information Licensing
105

GENERAL GOVERNMENT CITY CLERK
Strategic Plan Focus Area: Quality of Life. Goal: To provide quality services in a friendly, welcoming atmosphere, to the Common Council, the city’s departments and to the general public. Objectives: 1. To offer a central location for disseminating information to general public. 2. To continue to promote transparency and integrity in all of our tasks. 3. To provide prompt and respectful service. 4. To achieve an 80% or greater satisfaction (fair, good or excellent) survey rating from residents of the City of Sheboygan.
Measurements
2017 Actual
2018 Actual
2019 Amended
2019 Estimated
2020 Adopted
Effectiveness Resident satisfaction rating 92% 94% 80% 98% 80%
106

GENERAL GOVERNMENT ELECTIONS
Division Purpose To administer elections for the City of Sheboygan involving registering voters, issuing absentee ballots, hiring and training hundreds of poll workers, setting up polling locations, testing election equipment to ensure accurate vote counts, certifying local nomination papers, certifying local election results and managing the quality of data on the Statewide Voter Registration System. Division Description The Elections budget accounts for costs associated with city held elections. In coordination with Sheboygan County, the City Clerk is responsible for administering all election activities in the City of Sheboygan. This program is administered by the Office of the City Clerk. 2020 Budget Highlight The Adopted Budget includes the following change:
• An increase of $74,586 in Personal Services due to increase from two elections in 2019 to four elections in 2020.
Expenditures 2017 Actual
2018 Actual
2019 Amended
2019 Estimated
2020 Adopted
Personal Services 30,559 79,840 37,242 23,580 111,828 Non-Personal Services 25,562 27,283 27,120 20,230 38,450
Total Expenditures 56,121 107,123 64,362 43,810 150,278 Strategic Plan Focus Areas: Quality of Life. Communication. Goal: To ensure stakeholders are well informed and engaged on municipal matters. Objective: 1. To increase voter participation in all elections by promoting voting-related options,
i.e. take advantage of pre-registration and absentee ballot voting, while assisting residents with correct proof-of-residence and photo I.D.
2. Establish good communication and guidance while providing residents all available opportunities to vote in a fair and impartial manner.
Measurements
2017 Actual
2018 Actual
2019 Amended
2019 Estimated
2020 Adopted
Workload Number of elections 2 4 2 1 4 Total votes cast 9,897 34,740 10,000 6,421 51,000 Percent of votes cast by
absentee ballot 16% 16% 18% 17% 18%
Registrants 329 3,866 300 1,000 7,500 Percent of voters who were new
registrants 58% 16% 25% 25% 25%
Efficiency Cost per vote $5.67 $3.08 $6.43 $6.82 $2.95
107

GENERAL GOVERNMENT FINANCE
Total Employees 6.90
Department Purpose To provide administration of the accounting system, purchasing, investment, cash management, cash receipting, accounts payable, debt management, and assessing. Maintains fixed asset inventory and property insurance replacement value, prepare and publish Annual Financial Report and Budget Report. The division also is responsible for the Debt Service Fund, TID Funds, Capital Funds and Special Assessment Fund. Department Description Under the direction of the Finance Director, the Finance Department coordinates and controls all financial transactions of the city; prepares work papers and coordinates annual audit, coordinates payments of all city invoices and cash receipting, maintains compliance with all state and federal laws; supplies meaningful and timely financial data that will inform and assist departments and city management; oversees the Assessing Division, and oversees purchasing agent shared with Sheboygan County. This program is administered by the Finance Department. 2020 Budget Highlights The Adopted Budget includes the following change:
An increase in Personal Services of $47,751 due to the addition of 1.00 FTE Senior Accountant position.
Permanent Staffing 2017 Actual
2018 Actual
2019 Amended
2019 Estimated
2020 Adopted
Finance Director/Treasurer 1.00 1.00 1.00 1.00 1.00 Senior Accountant 0.00 0.00 0.00 1.00 1.00 Comptroller/Treasurer 1.00 0.00 0.00 0.00 0.00 Auditor/Analyst 1.00 1.00 1.00 1.00 1.00 Accountant 1.00 1.00 1.00 1.00 1.00 Accountant I 0.00 0.40 0.40 0.40 0.40 Clerk I 1.00 1.00 1.00 1.00 1.00 Confidential Secretary 1.00 0.00 0.00 0.00 0.00 Accounts Payable Clerk 0.00 1.00 1.00 1.00 1.00 Purchasing Agent 0.50 0.50 0.50 0.50 0.50
Total Staffing 6.50 5.90 5.90 6.90 6.90
Expenditures 2017 Actual
2018 Actual
2019 Amended
2019 Estimated
2020 Adopted
Personal Services 545,414 555,026 565,407 565,679 606,238 Non-Personal Services 282,553 288,546 388,115 373,516 353,711 Capital Outlay (7,004) 0 0 0 0
Total Expenditures 820,963 843,572 953,522 939,194 959,949
Investments & Cash
Management
Finance Department
Assessing Accounting System
Purchasing
108

GENERAL GOVERNMENT FINANCE
Strategic Plan Focus Area: Governing and Fiscal Management. Goal: To provide financial information accurately and timely for management decisions. Objective: 1. To disburse monthly revenue and expenditure reports by the 15th of the following
month. 2. To complete reconciliation by the 20th of the following month. 3. Update all policies and procedures to conform to Uniform Grant Guidance. 4. To retain the Certificate of Achievement for Excellence in Financial Reporting
Award and the Popular Annual Financial Report Award from the Government Finance Officers Association.
5. To receive an unqualified audit opinion.
Measurements
2017 Actual
2018 Actual
2019 Amended
2019 Estimated
2020 Adopted
Workload Vendor checks issued 6,038 5,930 5,500 6,244 5,500 Accounts receivable invoices 1,223 1,459 1,250 1,394 1,250 Receipts processed 27,758 23,166 24,500 23,626 24,500 Journal entries posted 4,712 4,259 4,200 4,331 4,200 Effectiveness Percent of reports available by the 15th 50% 0% 50% 0% 50% Percent of reconciliations completed by
the 20th 25% 0% 50% 25% 50%
Percent of receipts processed within one business day
95% 93% 95% 95% 95%
Uniform Grant Guidance Policies Yes Yes Yes Yes Yes Received GFOA CAFR Award No Yes Yes Yes Yes Received unqualified audit opinion Yes Yes Yes Yes Yes Strategic Plan Focus Area: Governing and Fiscal Management. Goal: To ensure competitive rate of return and ensure maximum safety of invested funds. Objective: 1. To achieve investment income 25 basis points over the Wisconsin Local
Government Investment Pool. Measurements
2017 Actual
2018 Actual
2019 Amended
2019 Estimated
2020 Adopted
Effectiveness Rate of Return on investment 1.38% 1.70% 1.50% 3.03% 2.00% Basis points above LGIP 0.17% -0.18% 0.25% 1.40% 0.25%
Strategic Plan Focus Area: Governing and Fiscal Management. Goal: To increase the use of alternative payment options to increase efficiency of staff time and increase customer service to city customers. Objective: 1. To maintain all in person payments at city financial institutions accepting property tax
payments.
109

GENERAL GOVERNMENT FINANCE
Measurements
2017 Actual
2018 Actual
2019 Amended
2019 Estimated
2020 Adopted
Efficiency % of taxes collected at financial institutions 38% 36% 40% 36% 35% Strategic Plan Focus Area: Governing and Fiscal Management. Goal: Expand use of technology to improve service and its effectiveness. Objective: 1. To implement Munis software technology in all departments collecting customer
receipts.
Measurements
2017 Actual
2018 Actual
2019 Amended
2019 Estimated
2020 Adopted
Workload City Clerk No No No No Yes Finance Department Yes Yes Yes Yes Yes Police Department Yes Yes Yes Yes Yes Building Inspection Division Yes Yes Yes Yes Yes Park Division No No Yes Yes Yes Effectiveness Percent of receipts in Munis 75% 85% 85% 85% 85%
Strategic Plan Focus Area: Governing and Fiscal Management. Goal: To provide high quality services to the residents and businesses of the City of Sheboygan. Objective: 1. To achieve an 80% or greater satisfaction (fair, good or excellent) survey rating
from residents who live in the City of Sheboygan. Measurements
2017 Actual
2018 Actual
2019 Amended
2019 Estimated
2020 Adopted
Effectiveness Resident satisfaction rating 78% 80% 80% 91% 80%
110

GENERAL GOVERNMENT ASSESSING
Department Purpose To maintain equitable, market value property assessments in a cost effective manner. Department Description The Assessing Division contracts for the service of performing assessment-related valuation of all personal and real property. Since 2016, the city has contracted with Grota Appraisals LLC for assessing services. This program is administered by the Finance Department. 2020 Budget Highlights The Adopted Budget includes the following change:
An increase of $3,210 in IT Small Equipment for new computers.
Expenditures 2017 Actual
2018 Actual
2019 Amended
2019 Estimated
2020 Adopted
Personal Services 19,909 15,980 5,146 4,608 4,608 Non-Personal Services 318,424 320,111 329,087 327,539 346,957
Total Expenditures 338,333 336,091 334,233 332,147 351,565 Strategic Plan Focus Area: Governing and Fiscal Management. Goal: To maintain in a fair and equitable manner property values with approximately fair market valuation. Objective: 1. To maintain property values in compliance with Wisconsin Statutes 70.05 (5)
within 10 percent of fair market value (assessment ratio)
Measurements
2017 Actual
2018 Actual
2019 Amended
2019 Estimated
2020 Adopted
Workload Cases presented/cases upheld
by Board of Review 0/0 0/0 5/5 3/3 5/5
Efficiency Cost of assessment per parcel $19.72 $19.81 $19.93 $20.37 $20.37 Effectiveness Assessment ratio .9620 .9048 .9048 .8807 .8807 Strategic Plan Focus Area: Governing and Fiscal Management. Goal: To Provide high quality service to the residents and businesses of the City of Sheboygan. Objective: 1. To achieve an 80% or greater satisfaction (fair, good or excellent) survey
rating from residents who live in the City of Sheboygan Measurements
2017 Actual
2018 Actual
2019 Amended
2019 Estimated
2020 Adopted
Effectiveness Resident satisfaction rating 78% 80% 80% 89% 80%
111

GENERAL GOVERNMENT HUMAN RESOURCES
`
Total Employees: 4.60 Department Purpose To provide qualified applicants and employees to various departments to successfully serve the City of Sheboygan. In addition, to provide employees with appropriate compensation and benefits programs both during employment and into retirement. Department Description The Human Resources Department is responsible for recruitment of qualified applicants, employee orientation, maintenance of personnel records, administration of employee benefits, retirement processing, compensation administration, job classification and labor market research, employee relations, labor negotiations, health and wellness administration, and regulatory compliance. This program is administered by the Human Resources Department. 2020 Budget Highlights The Adopted Budget includes the following changes:
A decrease in Contracted Services of $28,500 resulting from a realignment of services. A decrease in Training and Conferences of $6,684.
Permanent Staffing 2017 Actual
2018 Actual
2019 Amended
2019 Estimated
2020 Adopted
Director of Human Resources 1.00 1.00 1.00 1.00 1.00 Payroll Administrator 1.00 1.00 1.00 1.00 1.00 Benefits Administrator/Analyst 1.00 1.00 1.00 1.00 1.00 Confidential Secretary 1.00 0.00 0.00 0.00 0.00 Human Resources Generalist 0.00 1.00 1.00 1.00 1.00 Accountant I 0.00 0.60 0.60 0.60 0.60 Total Staffing 4.00 4.60 4.60 4.60 4.60
Expenditures 2017 Actual
2018 Actual
2019 Amended
2019 Estimated
2020 Adopted
Personal Services 165,700 185,243 203,304 217,557 231,072 Non-Personal Services 74,854 128,967 163,557 136,959 124,342 Total Expenditures 240,555 314,210 366,861 354,517 355,414
Administration
Benefits Administration
Department of Human Resources
Payroll Administration
112

GENERAL GOVERNMENT HUMAN RESOURCES
Strategic Plan Focus Area: Governing and Fiscal Management. Goal: Ensure quality employee and labor relation services. Objective: 1. To review policies and procedures for relevancy, outlined expectations and
consistent execution. 2. To analyze benefit vendors for optimal quality of service, location for our
employees, and competitive pricing. 3. To monitor reliability and affordability of service for customers. 4. To research, evaluate and pursue additional funding opportunities through
partnerships, relationships and grants. Measurements
2017 Actual
2018 Actual
2019 Amended
2019 Estimated
2020 Adopted
Effectiveness Resident satisfaction rating 90% 90% 80% 96% 80%
113

GENERAL GOVERNMENT OFFICE OF THE CITY ATTORNEY
Total Employees: 4.40
Department Purpose To provide legal services to city staff and alderpersons in an efficient manner to assist them in making fully informed decisions. This includes providing guidance, training, and information. Department Description The City Attorney, who is elected by the residents of Sheboygan, is the legal advisor and attorney for the City of Sheboygan. The Office of the City Attorney performs professional legal work, represents the city in legal proceedings, conducts the city’s legal business and related work, prosecutes all violations of City Ordinances, and provides legal advice as appropriate to the Mayor, Common Council, various committees, and city’s management team. This program is administered by the Office of the City Attorney. 2020 Budget Highlights The 2020 Adopted Budget includes the following changes:
An increase of $15,000 in Contracted Services for the acquisition of case management software.
Permanent Staffing 2017 Actual
2018 Actual
2019 Amended
2019 Estimated
2020 Adopted
City Attorney 1.00 1.00 1.00 1.00 1.00 Assistant City Attorney I 1.00 1.00 1.00 1.00 1.00 Assistant City Attorney II 0.00 0.00 0.40 0.40 0.40 Legal Assistant 2.00 2.00 2.00 2.00 2.00
Total Staffing 4.00 4.00 4.40 4.40 4.40
Expenditures
2017 Actual
2018 Actual
2019 Amended
2019 Estimated
2020 Adopted
Personal Services 358,673 417,373 444,952 444,952 462,026 Non-Personal Services 41,357 45,456 48,973 48,334 63,989
Total Expenditures 400,030 462,830 493,925 493,286 526,015
Administration
Office of the City Attorney
114

GENERAL GOVERNMENT OFFICE OF THE CITY ATTORNEY
Strategic Plan Focus Area: Governing and Fiscal Management. Goal: To provide prompt legal services and excellent customer service. Objective: 1. To achieve a rating of 80% or higher satisfaction (fair, good or excellent) rating from the residents who live in the City of Sheboygan. Measurements
2017 Actual
2018 Actual
2019 Amended
2019 Estimated
2020 Adopted
Workload Municipal Court cases
prosecuted 801 640 832 832 832
Circuit Court cases prosecuted 8 2 6 6 6 Abatements 2 1 2 2 2 Inspection warrants 3 1 4 4 4 Raze orders 1 7 4 4 4 Business Development loans 1 1 5 5 5 Real estate closings 9 7 6 6 6 Lawsuits against city 5 6 3 3 3 Foreclosures 4 3 4 4 4 Bankruptcies 12 12 18 18 18 Effectiveness Departments indicating a
positive response to promptness
91% 88% 80% 98% 80%
Departments indicating a positive response to court as an approachable service
94% 85% 80% 95% 80%
Resident satisfaction rating 83% 85% 80% 89% 80%
115

GENERAL GOVERNMENT CITY HALL
Division Purpose To sustainably maintain the 36,000 square-foot City Hall building, constructed in 1915 and fully renovated in 2018 – 2019. Division Description The City Hall budget provides funding to maintain the facility and offices of the City Administrator, Mayor, Finance, City Attorney, Human Resources, Information Technology, Assessing, City Development, and City Clerk at 828 Center Avenue. This program is administered by the Department of Public Works. 2020 Budget Highlights The Adopted Budget includes the following change:
The addition of 0.50 FTE Maintenance Worker I for facilities maintenance at City Hall.
Expenditures 2017 Actual
2018 Actual
2019 Amended
2019 Estimated
2020 Adopted
Personal Services 89,943 93,950 96,243 108,756 105,750 Non-Personal Services Capital Outlay
95,801 12,650
135,711 0
101,053 10,000
111,803 10,000
130,058 10,000
Total Expenditures 198,394 229,661 207,296 230,559 245,808 Strategic Plan Focus Area: Infrastructure and Public Facilities. Goal: To reduce utility costs and to maintain the integrity of City Hall.
Objectives: 1. To provide a safe environment for city hall functions and occupants. 2. To reduce facility depreciation, equipment and structural failures and maintenance costs through preventative maintenance programs.
Measurements Workload
2017 Actual
2018 Actual
2019 Amended
2020 Estimated
2020 Adopted
Amount of therms used* 19,957 19,957 N/A N/A N/A Utility costs $42,801 $45,695 $58,100 $58,100 $59,636 Number of work orders* 15 15 N/A N/A N/A
*Due to the renovation of City Hall during 2018 – 2019, key benchmark setting is on hold.
116

GENERAL GOVERNMENT INSURANCE
Division Purpose To maintain funding for general government related insurance coverage. Division Description The city maintains coverage for liability, automobiles, buildings, contractors’ equipment, flood, monies and securities. This program is administered by the Finance Department. 2020 Budget Highlights There are no notable changes for 2020.
Expenditures 2017 Actual
2018 Actual
2019 Amended
2019 Estimated
2020 Adopted
Non-Personal Services 270,417 285,509 311,565 250,824 277,809 Total Expenditures 270,417 285,509 311,565 250,824 277,809
117

GENERAL GOVERNMENT EMPLOYEE BENEFITS
Division Purpose To maintain funding for general government employee benefits. Division Description The city annually budgets for employee benefits, primarily payments to employees who retire. This program is administered by the Finance Department. 2020 Budget Highlights There are no notable changes in 2020.
Expenditures 2017 Actual
2018 Actual
2019 Amended
2019 Estimated
2020 Adopted
Personal Services 0 0 340,003 0 340,063 Non-Personal Services 0 0 0 0 0
Total Expenditures 0 0 340,003 0 340,063
118

PUBLIC SAFETY POLICE - ADMINISTRATION
Total Employees: 104.40
Department Purpose To provide the leadership and vision necessary to provide law enforcement services that reflect our community’s needs and expectations, while incorporating national best practices. Department Description The Police Administration / Management is responsible for the administration and general supervision of all police operations. Services provided include: 1) provide vision, leadership, management and administration for the Police Department; 2) conduct planning and research studies; 3) administer the departmental operating and capital improvement budgets; 4) administer, review and revise departmental policies and procedures; 5) coordinate the selection, retention and training of employees; and 6) store and retrieve departmental criminal justice information. This program is administered by the Police Department. 2020 Budget Highlights The Adopted Budget includes the following changes:
An increase of $10,000 in Program Services for enhanced outreach programming. An increase of $45,000 in Training and Conferences for training reimbursable by the
State of Wisconsin.
Permanent Staffing 2017 Actual
2018 Actual
2019 Amended
2019 Estimated
2020 Adopted
Chief of Police 1.00 1.00 1.00 1.00 1.00 Captain 1.00 1.00 1.00 1.00 1.00 Sergeant 1.00 1.00 1.00 1.00 1.00 Office Supervisor 1.00 1.00 1.00 1.00 1.00 Crime Analyst 1.00 1.00 1.00 1.00 1.00 Department Secretary 1.00 1.00 1.00 1.00 1.00 Court Services Secretary 2.00 2.00 2.00 2.00 2.00
Police Department
Patrol
Administration / Management
Criminal Investigation
Administration
Fleet Facility Parking Enforcement
119

PUBLIC SAFETY POLICE - ADMINISTRATION
Permanent Staffing - continued 2017 Actual
2018 Actual
2019 Amended
2019 Estimated
2020 Adopted
Record Specialist Clerk 8.00 8.00 8.00 8.00 8.00 TIME System Coordinator 1.00 1.00 1.00 1.00 1.00 Communication Technician 1.00 1.00 1.00 1.00 1.00
Total Staffing 18.00 18.00 18.00 18.00 18.00
Expenditures 2017 Actual
2018 Actual
2019 Amended
2019 Estimated
2020 Adopted
Personal Services 1,466,814 1,563,572 1,563,915 1,557,213 1,621,425 Non-Personal Services 587,376 678,461 654,950 655,086 758,836 Capital Outlay 5,052 3,277 0 0 0
Total Expenditures 2,059,243 2,245,310 2,218,965 2,212,299 2,380,261 Strategic Plan Focus Areas: Quality of Life. Communication. Goal: To maintain and disperse accurate records of law enforcement activities. Objective: 1. To process and maintain police records. 2. To prepare documentation for prosecution. 3. To offer resources to assist children in school. 4. To provide a centralized repository for all reports created by law enforcement
personnel. 5. To maintain a working relationship with surrounding communities that allows the
sharing of law enforcement records.
Measurements
2017 Actual
2018 Actual
2019 Amended
2019 Estimated
2020 Adopted
Workload Open Records requests 3,778 4,804 4,000 6,546 4,000 District Attorney requests for digital
evidence discovery. 1,008 1,321 2,750 1,326 2,750
Strategic Plan Focus Areas: Quality of Life. Neighborhood Revitalization. Communication. Goal: To provide real time tactical intelligence to assist supervisors in most efficiently and effectively deploying resources. Objective: 1. To increase police visibility in neighborhoods where crime is occurring. 2. To provide supervisors with information to help them make informed decisions. 3. To provide residents with information so they can protect themselves and their
property. 4. To increase the community’s knowledge about how to prevent themselves from
becoming a victim of crime. 5. To provide accurate and timely information to police officers. 6. To offer increased opportunities for civic engagement. 7. Timely dissemination of information to the public. 8. To achieve a rating of 80% or higher satisfaction (average, good or excellent) rating from the residents who live in the City of Sheboygan.
120

PUBLIC SAFETY POLICE - ADMINISTRATION
Measurements
2017 Actual
2018 Actual
2019 Amended
2019 Estimated
2020 Adopted
Workload Nixle messages sent 263 236 250 239 250 Press releases 25 41 50 28 50 Tweets 298 273 350 224 300 Facebook “Likes” 8,045 10,042 11,000 12,164 13,000 Reported crime pin maps 104 104 104 85 104 Crime Comparison Reports 44 36 26 25 26 Intel report 52 52 52 52 52 Monthly crime overview 12 12 12 12 12 Uniform crime reports 12 12 12 12 12 Effectiveness Resident satisfaction rating 95% 88% 80% 97% 80%
121

PUBLIC SAFETY POLICE - PATROL
Division Purpose To work in partnership with the community to preserve and improve the quality of life as it relates to public safety. Division Description The Police Patrol responds to requests from the community, provides resident education, promotes safe vehicular and pedestrian travel, and coordinates with emergency government officials and other public service agencies to enhance the effectiveness of service delivery. This program is administered by the Police Department. 2020 Budget Highlights There are no notable changes in 2020.
Permanent Staffing 2017 Actual
2018 Actual
2019 Amended
2019 Estimated
2020 Adopted
Captain 1.00 1.00 1.00 1.00 1.00 Lieutenant 3.00 3.00 3.00 3.00 3.00 Sergeant 7.00 7.00 7.00 7.00 7.00 Police Officer 53.00 53.00 53.00 53.00 53.00
Total Expenditures 64.00 64.00 64.00 64.00 64.00
Expenditures 2017 Actual
2018 Actual
2019 Amended
2019 Estimated
2020 Adopted
Personal Services 7,083,532 7,041,561 7,343,085 7,378,596 7,619,779 Non-Personal Services (1,285) 610 1,000 1,000 1,000
Total Expenditures 7,082,247 7,042,171 7,344,085 7,379,596 7,620,779
Strategic Plan Focus Area: Quality of Life. Goal: To provide effective police services to facilitate the safe movement of vehicular and pedestrian traffic. Objective: 1. To conduct hot-spot-patrol areas in identified high-density traffic accidents. 2. To effectively deploy the speed trailer to slow down traffic and gather data for
more efficient and effective enforcement activity. 3. To deploy the high visibility enforcement and education task force during high risk
times to reduce driving while intoxicated.
Measurements
2017 Actual
2018 Actual
2019 Amended
2019 Estimated
2020 Adopted
Workload Accidents 1,736 1,677 1,500 1,592 1,500 Speed trailer deployments 7 17 20 17 20 HVEE deployments 6 14 12 31 12
122

PUBLIC SAFETY POLICE - PATROL
Strategic Plan Focus Area: Quality of Life. Goal: To facilitate the development of collaborative efforts between the police and community partners by encouraging officers to apply problem-oriented policing to their everyday work experience. Objective: 1. To maintain neighborhood contacts and outreach activities during non-crisis situations. 2. To increase neighborhood meetings to build community and strengthen
relationships. 3. To facilitate problem solving. 4. To increase guardianship by encouraging citizens to occupy public spaces. 5. To increase foot patrol in neighborhoods impacted by crime. 6. To achieve a rating of 80% or higher satisfaction (average, good or excellent) rating from the residents who live in the City of Sheboygan. Measurements
2017 Actual
2018 Actual
2019 Amended
2019 Estimated
2020 Adopted
Effectiveness Percentage of residents feeling
very safe/safe walking alone during the day
91% 94% 80% 94% 80%
Percentage of residents feeling very safe/safe walking alone after dark
58% 69% 80% 69% 80%
123

PUBLIC SAFETY POLICE - FLEET
Division Purpose To acquire, equip and maintain vehicles for the Police Department. Division Description The Police - Fleet Division budget provides for the costs associated with equipping and maintaining a fleet of 47 vehicles for the Police Department, fuel charges and maintenance expenses. The vehicles include squad cars, a motorcycle, all-terrain vehicle, a patrol wagon, emergency response team vehicle, as well as vehicles used for other specialized duties. This program is administered by the Police Department. 2020 Budget Highlights There are no notable changes in 2020.
Permanent Staffing 2017 Actual
2018 Actual
2019 Amended
2019 Estimated
2020 Adopted
Fleet Operation Mechanic 1.00 1.00 1.00 1.00 1.00 Total Staffing 1.00 1.00 1.00 1.00 1.00
Expenditures 2017 Actual
2018 Actual
2019 Amended
2019 Estimated
2020 Adopted
Personal Services 81,462 83,294 86,024 86,024 88,505 Non-Personal Services 146,463 154,525 180,000 180,000 179,000
Total Expenditures 227,925 237,819 266,024 266,634 267,505 Strategic Plan Focus Area: Infrastructure and Public Facilities. Goal: To ensure equipment is satisfactorily maintained in a cost efficient manner and meets the requirements of the Police Department. Objective: 1. To ensure vehicles are satisfactorily maintained while keeping expenses within
budgetary limits. 2. To maintain a 100% completion rate on preventative maintenance. 3. To set up new vehicles at a rate that does not negatively impact operations.
124

PUBLIC SAFETY POLICE – PARKING ENFORCEMENT
Division Purpose To improve the quality of life by providing effective enforcement of parking and nuisance related offenses. Division Description The Police - Parking Enforcement budget provides funds for activities related to code enforcement of abandoned vehicles, recovering stolen and abandoned bicycles, assisting with disabled motorists and traffic control. This program is administered by the Police Department. 2020 Budget Highlights There are no notable changes for 2020.
Permanent Staffing 2017 Actual
2018 Actual
2019 Amended
2019 Estimated
2020 Adopted
Community Service Officer 1.00 1.00 1.00 1.00 1.00 Community Service Officer Trainee 1.00 1.00 1.00 1.00 1.00
Total Staffing 2.00 2.00 2.00 2.00 2.00
Expenditures 2017 Actual
2018 Actual
2019 Amended
2019 Estimated
2020 Adopted
Personal Services 87,606 87,625 90,569 90,569 91,301 Non-Personal Services 7,295 6,800 7,000 7,000 7,000
Total Expenditures 94,901 94,425 97,569 97,569 98,301 Strategic Plan Focus Areas: Quality of Life. Governing and Fiscal Management. Goal: To create a more efficient parking ticketing process. Objective: 1. To transfer ticketing data from the AS400 to the MUNIS software. 2. To transition the parking ticket mobile application from a written (pen/paper) to a
digital system. Goal: To provide opportunities for enhanced recruitment and development of sworn personnel. Objective: 1. To use part-time CSO positions as a pathway for recruitment and development of
future sworn personnel.
Measurements Workload
2017 Actual
2018 Actual
2019 Amended
2019 Estimated
2020 Adopted
Parking tickets issued 10,476 9,032 9,500 7,840 11,500 Bicycles recovered 139 158 125 168 150
125

PUBLIC SAFETY POLICE - FACILITY
Division Purpose To provide for the operation and maintenance of the Police Facility.
Division Description The Police Facility budget provides for the operation and maintenance of the Police Station, which is a 30,000 square foot building constructed in 2007. This program is administered by the Police Department.
2020 Budget Highlights There are no notable changes in 2020.
Expenditures 2017 Actual
2018 Actual
2019 Amended
2019 Estimated
2020 Adopted
Non-Personal Services 161,910 181,197 179,500 179,500 179,500 Total Expenditures 161,910 181,197 179,500 179,500 179,500
Strategic Plan Focus Area: Infrastructure and Public Facilities. Goal: To provide a clean and safe environment for employees and residents who utilize the building 24 hours per day. Objective: 1. To promote the use of the police facility in partnership with the community for
community education and problem solving. Measurements Workload
2017 Actual
2018 Actual
2019 Amended
2019 Estimated
2020 Adopted
Community education events at police facility 20 20 20 20 20
126

PUBLIC SAFETY POLICE - CRIMINAL INVESTIGATION
Division Purpose To develop crime prevention strategies, investigate major crimes and arrest suspects who commit crimes while also minimizing the impact of major crimes by supporting the community and victims. Division Description The Criminal Investigation Division provides major case investigative support and expertise to the Patrol Division. The division provides expertise and conducts investigation of high tech crimes and Internet crimes against children. The division also supports a strong collaborative relationship with the Sheboygan Area School District through the School Resource Officers. The division is responsible for oversight of the MEG unit and the processing and retention of recovered property and evidence. This program is administered by the Police Department. 2020 Budget Highlights There are no notable changes for 2020.
Permanent Staffing 2017 Actual
2018 Actual
2019 Amended
2019 Estimated
2020 Adopted
Captain 1.00 1.00 1.00 1.00 1.00 Lieutenant 1.00 1.00 1.00 1.00 1.00 Sergeant 1.00 1.00 1.00 1.00 1.00 Detective 7.00 7.00 7.00 7.00 7.00 Police Officer 6.00 6.00 6.00 6.00 6.00 Property Officer 1.00 1.00 1.00 1.00 1.00 Digital Evidence Manager 1.00 1.00 1.00 1.00 1.00 Department Secretary 1.00 1.00 1.00 1.00 1.00
Total Staffing 19.00 19.00 19.00 19.00 19.00
Expenditures 2017 Actual
2018 Actual
2019 Amended
2019 Estimated
2020 Adopted
Personal Services 1,961,875 2,199,942 2,269,303 2,269,303 2,306,318 Non-Personal Services 14,361 18,426 23,300 23,300 23,300
Total Expenditures 1,975,722 2,218,368 2,292,603 2,292,603 2,329,618 Strategic Plan Focus Area: Quality of Life. Goal: To build collaborative relationships to prevent crime. Objective: 1. To partner with residents and businesses to identify areas of risk, share
information and implement crime prevention strategies. 2. To relentlessly follow up on criminal investigations to increase clearances, arrest
repeat offenders and recover stolen property. 3. To organize regular meetings to share information with retail security group.
127

PUBLIC SAFETY POLICE - CRIMINAL INVESTIGATION
Measurements
2017 Actual
2018 Actual
2019
Amended
2019
Estimated
2020
Adopted Workload Uniform crime statistics Violent crimes 120 160 125 125 125 Property crimes 837 820 1,050 1,050 1,050 Recovery of stolen property $184,216 $179,946 $150,000 $150,000 $150,000 Strategic Plan Focus Area: Quality of Life. Goal: Identify, collect, process and preserve evidence to assist in successful prosecution of offenders. Objective: 1. To properly identify, collect and package items of evidence. 2. To identify items of evidence needing further analysis and send the items to the
Wisconsin Regional Crime Lab for examination and analysis. 3. To Identify, collect and process potential sources of digital evidence. 4. To obtain consent or search warrant to lawfully recover items of evidence.
Measurements
2017 Actual
2018 Actual
2019 Amended
2019 Estimated
2020 Adopted
Workload Property and evidence inventoried 3,594 3,525 4,000 3,600 4,000 Evidence purged or returned 2,492 1,545 2,000 1,850 2,000 Items processed at Crime Lab 500 423 550 500 500 Forensic examination of handheld devices 373 693 400 725 700 Search warrants served 71 126 100 120 100 Child interviews at Advocacy Center 48 42 60 70 75 Cases assigned to CID 633 1,161 600 1,100 900 Cases assigned Cleared by arrest 299 477 300 420 450 Cases assigned unfounded 25 25 20 20 20 Cases assigned closed other 163 188 150 150 150
128

PUBLIC SAFETY FIRE
Inspection/Prevention Safety/Education Emergency Services/EMS
Total Employees: 70.5
Department Purpose The Sheboygan Fire Department is dedicated to providing quality professional services to those who live, work, invest or visit our community; protecting lives and property from fire and harm through continuous code enforcement, education, emergency services, and non-emergency services. Department Description The Fire Suppression program provides the resources and procedures required to carry out the department’s emergency mitigation mission, as well as the pursuit of the goals and initiatives stated in the city’s Strategic Plan. Components of this program include emergency response, emergency communications, incident command, and strategy and tactics necessary for the extinguishment of all types of fires. Operational (fire suppression) activities include, but are not limited to: 1) Fire Suppression (scene size up and assessment), 2) Rescue and extrication, 3) Daily maintenance of vehicles, equipment, facilities, and grounds, 4) Pre-fire planning, 5) Multi-family residential inspections, 6) Public education and public relations, 7) Tactical planning, 8) Tactical training, 9) Safety (personnel and scene), 10) Testing and evaluation and 11) Research and development (of equipment and resources). This program is administered by the Fire Department. 2020 Budget Highlights There are no notable changes for 2020.
Permanent Staffing 2017 Actual
2018 Actual
2019 Amended
2019 Estimated
2020 Adopted
Chief 1.00 1.00 1.00 1.00 1.00 Assistant Chief 1.00 1.00 1.00 2.00 2.00 Deputy Chief 1.00 1.00 1.00 0.00 0.00 Battalion Chief 4.00 4.00 4.00 4.00 4.00 Captain 5.00 5.00 5.00 5.00 5.00 Lieutenant 10.00 10.00 10.00 10.00 10.00 Fire Equipment Operator 15.00 15.00 15.00 15.00 15.00 Firefighter 18.00 18.00 18.00 18.00 18.00 Firefighter/Paramedic 14.00 14.00 14.00 14.00 14.00
Fire Department
Administration
129

PUBLIC SAFETY FIRE
Permanent Staffing - continued
2017 Actual
2018 Actual
2019 Amended
2018 Estimated
2020 Adopted
Administrative Coordinator/Supervisor 0.00 0.00 0.00 1.00 1.00 Confidential Secretary 1.00 1.00 1.00 1.00 0.00 Office Assistant 0.50 0.50 0.50 0.50 0.50
Total Staffing 70.50 70.50 70.50 70.50 70.50
Expenditures 2017 Actual
2018 Actual
2019 Amended
2019 Estimated
2020 Adopted
Personal Services 7,397,246 7,886,919 7,986,946 7,917,419 8,054,043 Non-Personal Services Capital Outlay
446,708 18,508
602,306 33,812
562,872 20,000
560,483 20,000
615,703 21,000
Total Expenditures 7,862,462 8,523,038 8,569,818 8,497,902 8,690,746 Strategic Plan Focus Area: Quality of Life. Goal: To provide efficient response to fire emergencies. To provide high quality services to the residents and businesses of the City of Sheboygan. Objective: 1. To respond safely to emergency responses in under 380 seconds 2. To achieve a satisfaction rating of 90 percent or higher (Good, and excellent)
from the residents who live in the City of Sheboygan 3. Improve ISO (Insurance Service Office) rating from 2 to 1
Measurements
2017 Actual
2018 Actual
2019 Amended
2019 Estimated
2020 Adopted
Workload Fire calls 1,126 1,149 1,100 1,200 1,199 Fire inspections 1,850 1,926 1,878 1,987 1,880 Home fire safety programs for
students grade K-4 182 173 183 149 183
Fires 134 94 125 89 99 Total fire loss reduction $403,562 $978,985 $400,000 $525,665 $400,000 Fire related deaths 0 0 0 0 0 Number of training hours 11,868 10,483 12,250 12,827 12,250 Efficiency Fire response 380 seconds or
less per NFRIS standards 83% 89% 86% 88% 86%
Effectiveness Resident satisfaction rating 99% 99% 80% 99% 80% ISO rating 2 2 2 2 2 Number of community events 38 51 38 46 45
130

PUBLIC SAFETY BUILDING INSPECTION
Total Employees: 8.00 Division Purpose The Building Inspection Division is dedicated to the public safety in the construction environment throughout the city through area development, promotion of uniform codes/standards, administration, and in education/instruction for the facilitation of a safe and secure home or business. Division Description Under the direction of the City Development Department, the Building Inspection Division adopts all of the Department of Commerce, State of Wisconsin, Building, Mechanical, Electrical and Plumbing Codes. Through the adoption of these codes, the city ensures that all construction in the city is compliant with all codes and requirements of the State. The Building Inspection Division also works closely with Planning and Zoning, Engineering, Utilities, Streets, Police and during the final inspection phase of the project. All inspections are scheduled with the building inspectors. This program is administered by the City Development Department. 2020 Budget Highlights There are no notable changes for 2020.
Permanent Staffing 2017 Actual
2018 Actual
2019 Amended
2019 Estimated
2020 Adopted
Building Inspector 2.00 2.00 2.00 2.00 2.00 Plumbing/Environmental Inspector 1.00 1.00 1.00 1.00 1.00 Electrical/Heating Inspector 1.00 1.00 1.00 1.00 1.00 Housing/Environmental Inspector 1.00 1.00 1.00 0.00 0.00 Code Enforcement Officer 1.00 1.00 1.00 1.00 1.00 Building Inspection Specialist 1.00 1.00 1.00 1.00 1.00 Permit Clerk 1.00 1.00 1.00 1.00 1.00 Building Inspection Licensing Clerk 0.00 0.00 0.00 1.00 1.00
Total Staffing 8.00 8.00 8.00 8.00 8.00
Expenditures 2017 Actual
2018 Actual
2019 Amended
2019 Estimated
2020 Adopted
Personal Services 600,606 577,719 663,184 635,656 600,050 Non-Personal Services Capital Outlay
78,043 5,524
137,476 0
148,066 0
146,804 0
144,058 0
Total Expenditures 684,173 715,195 811,250 782,460 744,108 Strategic Plan Focus Areas: Quality of Life. Neighborhood Revitalization. Goal: Ensure quality and safe buildings for residents and the public through consistent code programs.
Building Inspection
Administration
131

PUBLIC SAFETY BUILDING INSPECTION
Objective: 1. Maintain compliance with Wisconsin statutes and codes as they related to
residential, commercial, and industrial projects. 2. Provide inspection services in a timely manner. Goal: To provide complete neighborhood revitalization strategies related to code enforcement to stabilize neighborhoods. Objective: 1. Code compliant properties across the city. 2. Strong neighborhoods including new neighborhood associations, new
commercial development, and great quality of life for the residents and tourists. 3. To achieve an 80% or greater (fair, good or excellent) survey rating from
residents who live in the City of Sheboygan.
Measurements
2017 Actual
2018 Actual
2019 Amended
2019 Estimated
2020 Adopted
Workload Number of inspections
performed 11,000 7,179 7,500 7,500 7,500
Number of building permits 2,126 1,987 2,000 2,000 2,000 Number of electrical permits 338 318 250 318 150 Number of plumbing permits Number of contractor licenses Number of occupancy
inspections
540 69 24
436 79 32
250 370 40
450 100 40
250 370 40
Number of housing code violations
1,333 677 1,200 700 700
Efficiency Percent of residential permits
processed in 10 working days 100% 100% 100% 100% 100%
Percent of non-residential permits processed in 15 working days
100% 100% 100% 100% 100%
Effectiveness Resident satisfaction rating
75%
75%
80%
83%
80%
132

PUBLIC SAFETY CIVIL DEFENSE
Division Purpose To maintain the Civil Defense System: Emergency Outdoor Warning Siren System in a workable fashion. Division Description The Civil Defense program maintains the sirens, structures, and controls at eight sites throughout the City of Sheboygan. This program is managed by the Public Works Department. 2020 Budget Highlights There are no notable changes in 2020.
Expenditures 2017 Actual
2018 Actual
2019 Amended
2019 Estimated
2020 Adopted
Non-Personal Services 5,379 1,003 4,836 4,836 4,873 Total Expenditures 5,379 1,003 4,836 4,836 4,873
Strategic Plan Focus Area: Quality of Life. Goal: To preserve and maintain the Emergency Outdoor Warning Siren System in a manner that provides an audible tone signifying an emergency alert. Objective: 1. To provide a modern sirens and controls in a systematized and cost effective
manner. 2. To reduce facility depreciation, equipment and structural failures, and
maintenance costs through improved preventive maintenance programs and scheduling of work.
Measurements Workload
2017 Actual
2018 Actual
2019 Amended
2019 Estimated
2020 Adopted
Sirens operational percentage 75% 100% 100% 100% 100%
133

CITY OF SHEBOYGAN
NOTES
134

PUBLIC WORKS ADMINISTRATION
Department Purpose Provide a professional Public Works organization that will offer quality infrastructure and services, in a sustainable way that will contribute to making Sheboygan a desirable place to work, live and play. Department Description Public Works Administration provides support services to all the divisions within the department by managing the budget, personnel transactions, customer requests and public information. The objectives of the administration are to support the necessary divisions in order for their personnel to effectively concentrate on accomplishing their objectives. In addition, the administration manages required reports to State and Federal agencies, grants, and the majority of permits and requests for service. Examples include: park permits, street right-of-way excavation permits, permits to occupy (dumpster permits), facility rentals, and dive permits (quarry). This program is administered by the Department of Public Works. 2020 Budget Highlights There are no notable changes for 2020.
Permanent Staffing 2017 Actual
2018 Actual
2019 Amended
2019 Estimated
2020 Adopted
Director of Public Works 1.00 1.00 1.00 1.00 1.00 Business Manager 0.00 0.00 0.00 1.00 1.00 Management Analyst 1.00 1.00 1.00 0.00 0.00 Clerk II 2.00 2.00 2.00 2.00 2.00
Total Staffing 2.00 4.00 4.00 4.00 4.00
Department of Public Works
Streets & Sanitation
Parks & Forestry
Buildings Grounds & Electrical
Engineering Motor
Vehicle & Equipment
Wastewater Treatment
Plant
Administration
Street Repair Snow & Ice
Control
Stormwater Management
Solid Waste & Recycling Services
Bridges Traffic Signs &
Pavement Marking
Sanitary Sewer & Collection
System
Weed & Nuisance Control
Forestry
Cemetery
Building Maintenance
Traffic Signals
Street Lighting
Pre-Treatment
Plant Operations
Pump & Lift Stations
Regulatory Compliance
135

PUBLIC WORKS ADMINISTRATION
Expenditures 2017 Actual
2018 Actual
2019 Amended
2019 Estimated
2020 Adopted
Personal Services 213,448 276,319 289,589 289,589 316,007 Non-Personal Services 73,900 82,227 83,531 89,491 89,347 Capital Outlay 5,444 2,350 0 0 0
Total Expenditures 292,792 360,896 373,120 379,080 405,354 Strategic Plan Focus Area: Quality of Life. Goal: To retain, develop, and recruit individuals with self-motivation and personal responsibility while embracing diversity and overall understanding of our mission. Provide training and acquire skills to allow individuals to succeed and grow. Provide a safe, healthy, and supportive work valuing employee contributions to the community. Improve the effectiveness, efficiency, and quality of Public Works service delivery through employee development, technology and equipment. Leverage the use of volunteers and public/private contractors to supplement the core levels of service needed. Establish quality customer service mentality. Treat all with respect, equity and fairness. Develop time management principals, scheduling – prioritization of activities through communication within the organization. Objective: 1. To achieve balanced budgets supporting the levels of services the Department
of Public Works provides to the community while improving the quality of life. 2. To achieve a rating of 80% or higher satisfaction (fair, good or excellent) rating from the residents who live in the City of Sheboygan.
Measurements
2017 Actual
2018 Actual
2019 Amended
2019 Estimated
2020 Adopted
Efficiency Budget Expenditures vs. Actual
Expenditures Effectiveness Resident satisfaction rating
90%
92%
90%
92%
80%
80%
80%
97%
80%
80%
136

PUBLIC WORKS ENGINEERING
Division Purpose To provide engineering services, construction management and consultant management on all capital improvement projects for the city. Division Description The Engineering Division provides engineering and management services for the city including in-house and consultant design; development and management of the Capital Improvements Program projects; traffic engineering; construction management and inspection; miscellaneous engineering studies and reports; and maintenance of plans, maps, surveys and records. This program is administered by the Department of Public Works. 2020 Budget Highlights The Adopted Budget includes the following change:
An increase of $15,000 in Communication Equipment Maintenance for additional GIS software licensing to accommodate more users.
Permanent Staffing 2017 Actual
2018 Actual
2019 Amended
2019 Estimated
2020 Adopted
City Engineer 1.00 1.00 1.00 1.00 1.00 Civil Engineer / Project Manager 1.00 1.00 1.00 1.00 1.00 Assistant Engineer / Surveyor 1.00 1.00 1.00 1.00 1.00 Senior Engineering Technician 1.00 1.00 1.00 1.00 1.00 Engineering Technician 2.00 2.00 2.00 2.00 2.00 GIS Project Specialist 0.00 1.00 1.00 1.00 1.00
Total Staffing 6.00 7.00 7.00 7.00 7.00
Expenditures 2017 Actual
2018 Actual
2019 Amended
2019 Estimated
2020 Adopted
Personal Services 557,758 632,630 641,619 646,055 662,029 Non-Personal Services Capital Outlay
82,387 8,698
93,511 20,000
143,314 10,000
149,531 10,000
150,971 3,000
Total Expenditures 648,871 746,141 794,933 805,586 816,000 Strategic Plan Focus Area: Infrastructure and Public Facilities.
Goal: To provide engineering and inspection services to the city in a timely manner.
Objective: 1. To provide review of plans within two weeks of submission to the Engineering Division.
2. To provide inspection services for the city’s public projects and, as time allows, other municipalities and private development.
3. To update city maps once per year.
Measurements Workload
2017 Actual
2018 Actual
2019 Amended
2019 Estimated
2020 Adopted
Budget Expenditures vs Actual Expenditures 80% 110% 90% 107% 90% Number of plans reviewed within two weeks
of submission 150 150 150 150 150
City maps updated annually 14 18 14 14 14
137

PUBLIC WORKS MSB - ADMINISTRATION
Division Purpose To account for the cost of Administrative staff assigned to the Municipal Service Building (MSB), which is the largest of all city-owned buildings. It houses the operational divisions for the Department of Public Works. Division Description The MSB Administration Division provides for staff support for critical Public Works programs such as Sanitation, Streets, Electrical, Motor Vehicle, Buildings and Grounds, Parks, Cemetery and Forestry. The Municipal Service Building was constructed in 1966. This program is administered by the Department of Public Works. 2020 Budget Highlights There are no notable changes in 2020.
Expenditures 2017 Actual
2018 Actual
2019 Amended
2019 Estimated
2020 Adopted
Personal Services 327,897 356,557 363,516 356,444 349,760 Non-Personal Services 10,278 11,971 17,166 17,166 17,392 Capital Outlay 26 66 0 0 0
Total Expenditures 338,199 368,594 380,682 373,610 367,152 Strategic Plan Focus Area: Infrastructure and Public Facilities. Goal: Regardless of the facility, the MSB Administration goals are: 1. Continue to fund the necessary resources to provide preventative maintenance. 2. Develop a needs assessment that identifies the future space and facility requirements for the MSB site including energy conservation programs. Objective: 1. Establish an effective energy conservation program. 2. Oversee major and minor repairs, including mechanical systems.
138

PUBLIC WORKS MSB - MAINTENANCE
Division Purpose To sustainably maintain the 121,050 square foot Municipal Service Building, constructed in 1966. Division Description The Municipal Service Building - Maintenance budget provides funding to maintain the facility, shops, and offices of the Director of Public Works, Engineering, Streets and Sanitary, Parks and Forestry, Motor Vehicle, and Building, Grounds, and Electrical Division’s at 2026 New Jersey Avenue. This program is administered by the Department of Public Works. 2020 Budget Highlights The Adopted Budget includes the following change:
A decrease in Personal Services of $33,318 resulting from the reallocation of staff to City Hall facility operations maintenance.
Permanent Staffing
2017 Actual
2018 Actual
2019 Amended
2019 Estimated
2020 Adopted
Superintendent-Facilities/Traffic 1.00 1.00 1.00 1.00 1.00 Leadman – Construction 1.00 1.00 1.00 1.00 1.00 Maintenance Worker V-Electrical Lighting 1.00 1.00 1.00 1.00 1.00 Maintenance Worker V-Electrical Signals 1.00 1.00 1.00 1.00 1.00 Maintenance Worker IV-Lead Signs 1.00 1.00 1.00 1.00 1.00 Maintenance Worker III-Craftsman 3.00 3.00 3.00 3.00 3.00 Maintenance Worker II-Signs 1.00 1.00 1.00 3.00 3.00 Maintenance Worker II-City Hall 1.00 1.00 1.00 1.50 1.50 Maintenance Worker I-MSB 1.00 1.00 1.00 1.00 1.00 Maintenance Worker 1-City Hall 0.00 0.00 0.00 0.50 0.50
Total Staffing 11.00 11.00 11.00 13.50 13.50
Expenditures 2017 Actual
2018 Actual
2019 Amended
2019 Estimated
2020 Adopted
Personal Services 360,953 307,066 369,843 337,455 353,387 Non-Personal Services 152,007 170,660 194,813 196,466 199,128 Capital Outlay 0 9,800 15,000 15,000 15,000 Total Expenditures 512,960 487,526 579,656 548,921 567,515 Strategic Plan Focus Area: Infrastructure and Public Facilities. Goal: To reduce facility depreciation, equipment and structural failures, and maintenance costs through improved preventive maintenance programs.
Objective: 1. To provide a safe environment for the facility’s functions and occupants. 2. To reduce facility depreciation, equipment and structural failures and maintenance costs through preventative maintenance programs.
139

PUBLIC WORKS MSB - MAINTENANCE
Measurements Workload
2017 Actual
2018 Actual
2019 Amended
2019 Estimated
2020 Adopted
Amount of therms used 43,343 44,803 N/A 47,500 44,500 Utility costs $60,522 $78,150 $36,000 $78,150 $76,123 Annual Maintenance costs $27,158 $32,500 $57,310 $32,500 $32,500 Number of work orders 11 21 11 11 11
140

PUBLIC WORKS STREETS, ALLEYS AND SIDEWALK
Division Purpose To perform necessary street maintenance and repairs with the least amount of related disruptions to traffic flow and neighborhoods. Division Description The Streets, Alleys, and Sidewalk budget funds the operations and maintenance activities for streets and related facilities. The City of Sheboygan has over 200 center-line miles of streets to manage. This program is administered by the Department of Public Works. 2020 Budget Highlights There are no notable changes in 2020.
Permanent Staffing 2017 Actual
2018 Actual
2019 Amended
2019 Estimated
2020 Adopted
Superintendent-Streets/Sanitation 1.00 1.00 1.00 1.00 1.00 Supervisor-Streets/Sanitation 1.00 1.00 1.00 1.00 1.00 Maintenance Worker IV-Streets 1.00 1.00 1.00 4.00 4.00 Maintenance Worker III-Streets 7.00 7.00 7.00 2.00 2.00 Maintenance Worker II-Streets 14.00 14.00 14.00 11.00 9.00 Maintenance Worker I-Streets 5.00 5.00 5.00 3.00 3.00 Maintenance Worker IV-Sanitation 1.00 1.00 1.00 1.00 1.00 Maintenance Worker III-Sanitation 8.00 8.00 8.00 8.00 8.00 Maintenance Worker IV-Sewer Maintenance 1.00 1.00 1.00 1.00 1.00 Maintenance Worker III-Sewer Maintenance 1.00 1.00 1.00 1.00 1.00 Maintenance Worker II-Sewer Maintenance 2.00 2.00 2.00 2.00 2.00 Maintenance Worker I-Sewer Maintenance 1.00 1.00 1.00 1.00 1.00 Maintenance Worker II-Street Sweeping 2.00 2.00 2.00 2.00 2.00
Total Staffing 45.00 45.00 45.00 38.00 36.00
Expenditures 2017 Actual
2018 Actual
2019 Amended
2019 Estimated
2020 Adopted
Personal Services 717,576 945,532 1,010,628 1,009,628 973,931 Non-Personal Services 903,793 660,999 720,299 719,445 708,848 Capital Outlay 0 0 40,000 0 40,000
Total Expenditures 1,621,369 1,606,531 1,770,927 1,729,073 1,722,779 Strategic Plan Focus Area: Infrastructure and Public Facilities. Goal: To properly maintain streets to maximize safe travel and extend the life of city streets. Objective: 1. To crack fill 90% of the streets on the crack filling schedule. 2. To responded to pothole requests within two business days. 3. To increase the overall PASER rating for the City of Sheboygan. 4. To achieve a rating of 80% or higher satisfaction (fair, good or excellent) rating from the residents who live in the City of Sheboygan. 141

PUBLIC WORKS STREETS, ALLEYS AND SIDEWALK
Measurements
2017 Actual
2018 Actual
2019 Amended
2019 Estimated
2020 Adopted
Workload Crack and joint filling footages (LF) 36,534 33,084 25,000 35,551 30,000 Yards of concrete installed 1,230 1,348 1,200 1,200 1,200 Tons of asphalt installed 13,510 11,269 9,000 9,000 9,000 Potholes – cold mix (Tons) 124 73 130 100 100 Potholes – hot mix (Tons) 525 232 170 300 300 Linear feet of streets improved 32,313 38,016 26,400 15,840 26,400 Effectiveness Resident satisfaction rating 92% 92% 80% 97% 80% Increase PASER rating 6.01 6.01 6.25 6.25 6.25 Response to pothole repair requests
within 2 days 1.6 2 2 2 2
142

PUBLIC WORKS STORM WATER MANAGEMENT
Division Purpose To protect, maintain and enhance the natural environment, diversity of fish and wildlife, human life, property, and the recreational use of waterways within the greater Sheboygan area. Division Description The Storm Water Management budget provides funding to maintain over 102 miles of storm sewer, 91 outfalls, 3,322 storm sewer manholes and 7,000 corner inlets and catch basins. This program is administered by the Department of Public Works. 2020 Budget Highlights The Adopted Budget includes the following change:
An increase of $10,000 in Contracted Services for algae prevention treatment.
Expenditures 2017 Actual
2018 Actual
2019 Amended
2019 Estimated
2020 Adopted
Personal Services 356,403 237,272 353,248 353,248 329,742 Non-Personal Services 268,365 262,715 294,393 301,700 308,825
Total Expenditures 624,768 499,988 647,641 654,948 638,567 Strategic Plan Focus Area: Infrastructure and Public Facilities. Goal: To continue efforts to implement storm water management plans, goals, and objectives and requirements of the WDNR-mandated storm water permit Objective: 1. To economically meet all requirements of the Department of Natural Resources
permit. 2. To maintain the current levels of televising and cleaning of the storm sewer
system. 3. To achieve an 80% or greater satisfaction (fair, good or excellent) survey rating
from residents who live in the City of Sheboygan.
Measurements Workload
2017 Actual
2018 Actual
2019 Amended
2019 Estimated
2020 Adopted
Catch basins debris removed (Tons) 186 338 200 400 400 Storm sewer jetting footages (LF) 74,375 15,143 35,000 15,000 15,000 Storm sewer televising footages (LF) 34,665 12,245 20,000 10,000 10,000 Number of catch basins replaced 45 22 30 30 30 Effectiveness Resident satisfaction rating 92% 92% 80% 97% 80%
143

PUBLIC WORKS STREET LIGHTS
Division Purpose To maintain the street lighting infrastructure and all city-owned outdoor lighting in a sustainable fashion. Division Description The Street Lighting budget provides funding to maintain the city’s owned and leased street lighting network. The leased lighting is maintained and serviced by Alliant Energy. This program is administered by the Department of Public Works. 2020 Budget Highlights The Adopted Budget includes the following change:
An increase of $9,000 in Non-Personal Services - Electrical resulting from additions and updates to the street lighting infrastructure including anticipated utility rate increase.
Expenditures 2017 Actual
2018 Actual
2019 Amended
2019 Estimated
2020 Adopted
Personal Services 73,479 83,564 81,824 81,827 87,147 Non-Personal Services 333,272 403,255 381,620 381,620 391,832 Total Expenditures 406,751 486,819 463,444 462,747 478,979 Strategic Plan Focus Areas: Infrastructure and Public Facilities. Neighborhood Revitalization. Goal: To maintain the 2,500 city-owned street and outdoor lighting infrastructure in a manner that provides safety for both vehicular and pedestrian traffic as well as acting as a crime deterrent. Objective: 1. To reduce energy consumption by upgrading to energy efficient LED lighting by
10 percent annually. 2. To work with law enforcement to identify lighting needs as a crime-prevention
strategy.
Measurements Workload
2017 Actual
2018 Actual
2019 Amended
2019 Estimated
2020 Adopted
Utility costs $277,435 $276,067 $300,000 $300,000 $309,000
144

PUBLIC WORKS BRIDGES
Division Purpose To provide for the operations and maintenance of the city-owned bridges. Division Description The Bridges Division provides for the operations and maintenance of 16 bridges, seven on the north side, and nine on the south side of the city, representing 153,393 square feet of bridge deck. The division oversees required bridge inspections every two years per the Federal Highway Administration and Wisconsin Department of Transportation regulations. The division works with the Sheboygan County Highway Department to perform all of these inspections, with the exception of the Eighth Street Bridge, due to its highly specialized design. Maintenance for this bridge is contracted directly with a third-party engineering consulting firm. This program is administered by the Department of Public Works. 2020 Budget Highlights There are no notable changes for 2020.
Expenditures 2017 Actual
2018 Actual
2019 Amended
2019 Estimated
2020 Adopted
Personal Services 34,963 45,401 38,081 38,081 38,085 Non-Personal Services 43,306 32,489 44,559 119,944 45,454
Total Expenditures 78,269 77,890 82,680 158,025 83,539 Strategic Plan Focus Area: Infrastructure and Public Facilities. Goal: To properly maintain bridges to maximize safe travel and extend the life of bridge structures. Objective: 1. Maintain compliance inspections to DOT requirements. 2. Maintain bridge deck sealing program alternating north and south side annually.
Measurements
2017 Actual
2018 Actual
2019 Amended
2019 Estimated
2020 Adopted
Workload Number of bridges inspected 16 16 16 16 16 Number of bridges sealed 7 9 7 7 9
145

PUBLIC WORKS SNOW AND ICE CONTROL
Division Purpose To provide safe passage on city roads, sidewalks and parking lots during snow and ice events. Division Description The Snow and Ice Control budget provides for the costs associated with the control and removal of snow and ice on over 200 miles of streets, miles of sidewalks and city-owned parking lots. This program is administered by the Department of Public Works. 2020 Budget Highlights There are no notable changes in 2020.
Expenditures 2017 Actual
2018 Actual
2019 Amended
2019 Estimated
2019 Adopted
Personal Services 269,328 236,891 393,214 450,854 351,719 Non-Personal Services 555,881 486,218 538,900 543,900 568,140
Total Expenditures 825,209 723,109 932,114 994,754 919,859 Strategic Plan Focal Area: Infrastructure and Public Facilities. Goal: To provide safe roads for the public during and following snow and ice events. To timely
remove snow from business districts in order to provide convenient parking. Objective: 1. To reduce the amount of salt by 15% during the snow and ice season. 2. To achieve a rating of 80% or higher satisfaction (fair, good or excellent) rating from residents who live in the City of Sheboygan.
Measurements
2017 Actual
2018 Actual
2019 Amended
2019 Estimated
2020 Adopted
Workload Number of operations 17 26 25 25 25 Salt used (Tons) 3,630 4,180 3,840 3,840 3,840 Average snowfall per event (Inches) 2.50 2.50 2.00 2.00 2.00 Efficiency Average hours per event 19 17 9 9 9 Effectiveness Resident satisfaction rating 92% 92% 80% 97% 80% Reduce amount of salt used by 15% 21% 20% 9.7% 9.7% 9.7% Percentage of operations in which snow
is removed within 24 hours after the event
80% 92% 80% 80% 80%
146

PUBLIC WORKS TRAFFIC CONTROL SIGNS
Division Purpose To provide road signage for the city in compliance with the Federal Highway Administration’s Manual on Uniform Traffic Control Devices (MUTCD). Division Description The City of Sheboygan has approximately 30,000 signs under the division’s management. This division is responsible for pavement markings such as centerline, edge line, bike lane and crosswalk painting. This program is administered by the Department of Public Works. 2020 Budget Highlights There are not notable changes in 2020.
Expenditures 2017 Actual
2018 Actual
2019 Amended
2019 Estimated
2020 Adopted
Personal Services 325,317 340,259 330,558 318,764 327,026 Non-Personal Services 134,775 205,529 148,209 146,700 152,700 Capital Outlay 15,320 0 12,000 12,000 0
Total Expenditures 475,412 545,788 490,767 477,464 479,726 Strategic Plan Focus Area: Infrastructure and Public Facilities. Goal: To provide traffic control in an efficient manner. Objective: 1. To improve safety within the public right of way. 2. To ensure traffic control signage is highly visible and installed in accordance
with MUTCD.
Measurements
2017 Actual
2018 Actual
2019 Amended
2019 Estimated
2020 Adopted
Workload Number of signs replaced 538 847 1,000 1,000 1,000 Number of new signs 1,008 689 1,300 1,300 1,300 Damaged mailboxes repaired/replaced 37 46 50 50 50 Traffic Arrow/Stop-Bars/Crosswalk painted 1,565 1,618 1,730 1,730 1,730
147

PUBLIC WORKS TRAFFIC CONTROL SIGNALS
Division Purpose To maintain and install the appropriate traffic control devices to provide a safe and sufficient transportation system throughout the entire city, including four Sheboygan County intersections located within city limits, keeping all equipment in compliance with national and state traffic control standards. Division Description The Traffic Control Signal budget provides funding to maintain a total of 40 signalized intersections and all traffic signage within the city. Four intersections are owned by Sheboygan County and serviced by City of Sheboygan electricians under a municipal agreement. This program is administered by the Department of Public Works. 2020 Budget Highlights There are no notable changes for 2020.
Expenditures 2017 Actual
2018 Actual
2019 Amended
2019 Estimated
2020 Adopted
Personal Services 81,292 95,272 91,427 92,042 95,181 Non-Personal Services 87,722 81,238 111,968 105,600 107,550
Total Expenditures 169,014 176,511 203,395 197,642 202,731 Strategic Plan Focus Area: Infrastructure and Public Facilities. Goals: To provide traffic control in an efficient manner.
Objectives: 1. To ensure personal safety. 2. To minimize congestion and over-saturation. 3. To improve safety within the public right-of-way by analyzing recommendations
from traffic accident reports and sign visibility surveys. 4. To accommodate long term variability. 5. To manage incidents and special events. 6. To reduce traffic signal faults and failures.
148

PUBLIC WORKS SOLID WASTE
Division Purpose To ensure a clean and healthy community through the collection and disposal of yard waste and solid waste in a safe, cost effective and environmentally responsible manner. Division Description The Solid Waste Division provides curbside pick-up of garbage for residential units of four units or less. Every week, eight city sanitation operators make over 18,000 stops. This program is administered by the Department of Public Works. 2020 Budget Highlights The Adopted Budget includes the following change:
Recycling revenues and expenditures are reallocated to the newly created Proprietary Recycling Utility Fund 620.
Expenditures 2017 Actual
2018 Actual
2019 Amended
2019 Estimated
2020 Adopted
Personal Services 659,388 758,569 738,017 735,574 416,585 Non-Personal Services 948,383 969,777 996,284 996,284 998,256
Total Expenditures 1,607,771 1,728,345 1,734,301 1,731,858 1,414,841 Strategic Plan Focus Area: Quality of Life. Goal: To provide cost effective and safe means for city residents to dispose of yard and other solid waste. Objective: 1. To achieve a rating of 80% or higher satisfaction (fair, good or excellent) rating from residents who live in the City of Sheboygan.
Measurements
2017 Actual
2018 Actual
2019 Amended
2019 Estimated
2020 Adopted
Workload Garbage collected (Tons) 11,260 12,820 10,000 10,000 10,000 Effectiveness Resident satisfaction rating 92% 92% 80% 92% 80%
149

PUBLIC WORKS STREET CLEANING
Division Purpose To keep the city’s public streets swept and clean in accordance with storm water management goals and objectives to prevent solids or pollutants from entering Lake Michigan and the Sheboygan River. Division Description The Street Cleaning budget provides for the costs to clean approximately 200 center-line miles of streets. Sweepers also play an important role in the collection of leaves in the fall. This program is administered by the Department of Public Works. 2020 Budget Highlights There are no notable changes in 2020.
Expenditures 2017 Actual
2018 Actual
2019 Amended
2019 Estimated
2020 Adopted
Personal Services 246,791 231,922 166,941 165,388 234,965 Non-Personal Services 206,186 213,502 215,200 215,200 237,700
Total Expenditures 452,977 445,424 382,141 380,588 472,665 Strategic Plan Focus Area: Infrastructure and Public Facility. Goal: To keep the city streets clear of debris and dirt and reduce the amount of debris and dirt from entering into the storm water system and local waterways. Objectives: 1. To sweep city streets once every six weeks during the spring, summer and fall. 2. To provide leaf collection as needed during the fall. 3. To achieve a rating of 80% or higher satisfaction (fair, good or excellent) rating from residents who live in the City of Sheboygan.
Measurements
2017 Actual
2018 Actual
2019 Amended
2019 Estimated
2020 Adopted
Workload Miles swept 5,132 8,483 5,000 6,300 8,000 Tons of debris collected 651 871 750 800 750 Efficiency Percent of streets swept every 6 weeks 100% 100% 100% 100% 100% Effectiveness Resident satisfaction rating 92% 92% 80% 97% 80%
150

PUBLIC WORKS WEED CONTROL
Division Purpose The purpose of the weed control program is to improve the quality of life within the city by enforcing the weed ordinance in a fast and responsive manner. Division Description Under City Ordinance and provided for through the Wisconsin State Statutes, weeds and grasses over 12 inches must be cut by the property owner or the city will cut it with proper notification. The city contracts with a private lawn service to perform the entire private property weed cutting. This program is administered by the Department of Public Works. 2020 Budget Highlights There are no notable changes in 2020.
Expenditures 2017 Actual
2018 Actual
2019 Amended
2019 Estimated
2020 Adopted
Non-Personal Services 7,450 8,025 14,000 16,163 14,400 Total Expenditures 7,450 8,025 14,000 16,163 14,400
Strategic Plan Focus Area: Quality of Life. Goal: To keep private property from becoming overgrown, to reduce the spread of invasive species and weeds. Objective: 1. To respond to residents’ complaints in a timely manner. 2. To reduce the number on noncompliant report offenders.
Measurements
2017 Actual
2018 Actual
2017 Amended
2019 Estimated
2020 Adopted
Workload Nuisance notices issued 326 275 200 200 200 Number of non-compliant lots
cut by city staff 27 38 25 20 25
151

PUBLIC WORKS RESIDENTIAL DROP-OFF
Division Purpose The Department of Public Works manages an Integrated Solid Waste Management Program (ISWMP) to ensure a clean and healthy community. The residential customer-only drop-off site compliments the curbside collection program by providing an alternative to manage items that cannot be collected at the curbside. Items such as grass clippings, branches, and other yard wastes; metals, batteries and waste oil are accepted at the drop-off site. Division Description The Residential Drop Off program budget accounts for costs associated with the drop-off site located at 20th Street and New Jersey Avenue. Yard wastes are banned from land filling; as a result, the waste must be collected separately and eventually composted. The Public Works Department collects an average total of 2,500 tons of yard waste (including fall leaf collection). On average the drop-off site collects 5,000 gallons of waste oil annually. In addition, the drop-off site collects metals that are also not collected at the curbside. This program is administered by the Department of Public Works. 2020 Budget Highlights There are no notable changes in 2020.
Expenditures 2017 Actual
2018 Actual
2019 Amended
2019 Estimated
2020 Adopted
Personal Services 100,470 93,033 84,585 85,521 81,319 Non-Personal Services 107,845 109,548 135,331 135,331 160,014
Total Expenditures 208,315 202,581 219,916 220,852 241,333 Strategic Plan Focus Area: Quality of Life. Goal: To improve the quality of life through the efficient collection and management of special wastes not collected at the curbside. Objective: 1. Improve efficiency of operation by increased monitoring of ineligible haulers and related dropped off materials. 2. To achieve a rating of 80% or higher satisfaction (fair, good or excellent) from residents who live in the City of Sheboygan.
Measurements
2017 Actual
2018 Actual
2019 Amended
2019 Estimated
2020 Adopted
Workload Yard waste hauled (Tons) 2,755 2,830 2,500 2,500 2,500 Tire disposal 153 182 95 100 100 Scrap metals collected (Tons) 196 235 140 140 140 Oil collected (Gallons) 6,750 10,700 5,000 5,000 5,000 Branch grinding (Dollars) $8,850 $17,890 $12,000 $20,000 $20,000 Effectiveness Resident satisfaction rating 92% 92% 80% 80% 80%
152

HEALTH AND HUMAN SERVICES CEMETERY
Division Purpose To provide quality non-sectarian burials to residents and their families at an affordable cost. Division Description The Cemetery budget provides funding to operate the Wildwood Cemetery. The city has owned and operated the cemetery since the 1850’s. The cemetery is located on 62 acres of land with over 25,000 graves in perpetual care, and an additional 20,000 burial lots remaining. Of the 62 acres, 40 acres are fully maintained. The remaining 22 acres are reserved for future use. This program is administered by the Department of Public Works. 2020 Budget Highlights There are no notable changes in 2020.
Expenditures 2017 Actual
2018 Actual
2019 Amended
2019 Estimated
2020 Adopted
Personal Services 174,292 134,225 140,807 132,925 131,626 Non-Personal Services 47,334 53,428 60,530 60,530 64,605 Capital Outlay 0 1,234 0 0 5,000
Total Expenditures 221,626 188,887 201,337 193,455 201,331 Strategic Plan Focus Area: Quality of Life. Goal: To maintain and, when necessary, expand the cemetery’s inventory of 25,000 graves and 20,000 remaining lots. Objective: 1. To continue to improve facilities within the cemetery. 2. To maintain cemetery trees and plan for those which are dying. 3. Re-pave all of the cemetery roads over the next 10 years. 4. Provide back-up to aid the caretaker.
Measurements
2017 Actual
2018 Actual
2019 Amended
2019 Estimated
2020 Adopted
Workload Linear feet of road re-paved 1,270 0 1,270 1,270 1,270 Number of trees removed 14 10 10 10 10 Number of trees planted 14 6 10 10 10
153

CITY OF SHEBOYGAN
NOTES
154

CULTURE AND RECREATION PARKS AND FORESTRY
Division Purpose To maintain, improve and make accessible all park facilities while implementing the Comprehensive Outdoor Recreation Plan; to oversee the city’s urban forest areas as outlined in the Urban Forestry Management Plan; and to provide leisure opportunities for the benefit of its present and future citizens. Division Description The Parks and Forestry Division is responsible for the overall management of the city’s 36 parks totaling over 705 acres, 19 playgrounds, six enclosed rentable shelters, 12 open rentable shelters, two miles of beaches, 24 miles of public sidewalks, 9.6 miles of multi-use paved trails, two miles of river board walk, three Splash Pads, 10 parking lots, and several miles of street boulevards. The forestry program involves the maintenance of approximately 23,000 trees within the city street right-of-way in addition to park trees. This program is administered by the Department of Public Works. 2020 Budget Highlights The Adopted Budget includes the following changes:
An increase of $30,000 in Personal Services due to additional Overtime expenditures. An increase of $4,000 in Transfer Station Tipping due to increased costs.
Permanent Staffing 2017 Actual
2018 Actual
2019 Amended
2019 Estimated
2020 Adopted
Superintendent – Parks-Forestry 1.00 1.00 1.00 1.00 1.00 Forester 0.00 0.00 0.00 1.00 1.00 Maintenance Worker IV-Arborist 0.00 0.00 0.00 1.00 1.00 Maintenance Worker IV-Parks 1.00 1.00 1.00 2.00 2.00 Maintenance Worker III-Parks 6.00 6.00 6.00 6.00 6.00 Maintenance Worker II-Parks 6.00 6.00 6.00 6.00 6.00 Maintenance Worker I-Parks 3.00 3.00 3.00 0.00 0.00 Administrative Assistant 1.00 0.00 0.00 0.00 0.00
Total Staffing 18.00 17.00 17.00 17.00 17.00
Expenditures 2017 Actual
2018 Actual
2019 Amended
2019 Estimated
2019 Adopted
Personal Services 1,473,985 1,563,384 1,600,419 1,620,419 1,701,332 Non-Personal Services 710,916 719,216 759,102 756,102 798,534 Capital Outlay 56,441 40,000 25,000 25,000 25,000
Total Expenditures 2,241,342 2,322,600 2,384,521 2,401,521 2,524,866 Strategic Plan Focus Areas: Quality of Life. Infrastructure and Public Facilities. Goal: To maintain, improve and make accessible all park facilities while implementing the Comprehensive Outdoor Recreation Plan. Objective: 1. Maintain or replace park facilities when needed. 2. Keep park areas free of garbage, hazards and unwanted activity. 3. Improve accessibility to all park facilities. 4. Keep all park and boulevard turf mowed and in good condition. 5. Improve informing the public about our parks and park rules.
155

CULTURE AND RECREATION PARKS AND FORESTRY
Measurements
2017 Actual
2018 Actual
2019 Amended
2019 Estimated
2020 Adopted
Workload Number of parks 36 36 36 36 36 Acres of mowed public land 119 119 119 119 119 Miles of paved off-road trails 6.5 2.5 9.6 1.5 0 New trees planted in parks 77 50 10 10 10 Strategic Plan Focus Areas: Quality of Life. Infrastructure and Public Facilities. Goal: To provide a consistent street tree canopy made up of a diverse Genus and Species. To efficiently manage our Ash trees upon the finding of Emerald Ash Borer beetle in the city in 2016. Strive for a proactive approach, rather than reactive approach in managing the city’s Urban Forestry. Objective: 1. Remove one half of the Ash tree population over the next five years. 2. Chemically treat all remaining Ash trees over the next five years. 2. Remove all hazardous trees. 4. Trim all city trees once every eight years. 5. Continue to be the longest running Tree City USA municipality in Wisconsin. 6. Plant a minimum of 200 trees annually. 7. To achieve a rating of 80% or higher satisfaction (fair, good or excellent) rating from residents who live in the City of Sheboygan.
Measurements
2017 Actual
2018 Actual
2019 Amended
2019 Estimated
2020 Adopted
Workload Trees planted (Street) 448 21 500 542 500 Trees removed (Street) 531 610 600 600 600 Trees elevated (Street) 2,365 1,872 2,000 1,500 1,500 Efficiency Percent of trees trimmed once every 8 years 100% 100% 100% 100% 100% Effectiveness Tree City USA designation Yes Yes Yes Yes Yes Resident satisfaction rating 92% 92% 80% 97% 80%
156

CULTURE AND RECREATION PARKS - MAYWOOD
Division Purpose To provide a unique natural park with environment focus educational programs through a partnership with the Ellwood H. May Environmental Park Association of Sheboygan County and the Maywood Trust. Division Description The city provides a caretaker for maintenance, financial support for the facilities, and a Maywood Trust Director. The park also receives private individual and corporate donations. Maywood Park is a 135 acre city-owned natural area offering a diverse ecosystem with trails and interpretive displays for an interactive learning environment. This program is administered by the Department of Public Works. 2020 Budget Highlights There are no notable changes for 2020.
Expenditures 2017 Actual
2018 Actual
2019 Amended
2019 Estimated
2020 Adopted
Non-Personal Services 92,423 90,936 93,900 93,900 104,019 Total Expenditures 92,423 90,936 93,900 93,900 104,019
Strategic Plan Focus Area: Quality of Life. Goal: To keep the Maywood Park viable and open to the public. Objectives: 1. To continue financial and maintenance support. 2. To contribute the expertise of the city’s superintendent of parks.
157

CULTURE AND RECREATION SENIOR SERVICES
Total Employees: 2.28
Department Purpose To provide a dynamic community center encouraging wellness, learning and recreation for Sheboygan’s diverse semi-retired and retired residents. Department Descriptions In collaboration with the Friends of the Senior Activity Center, a private 501c3 organization, city staff coordinates programs, oversees volunteers and manages operations. This program is administered by Senior Services. 2020 Budget Highlights The Adopted Budget includes the following changes:
An increase of $2,500 in Training and Conferences for the Director to attend a national training conference.
An increase of $3,300 in Capital Outlay for the purchase of additional conference tables.
Permanent Staffing
2017 Actual
2018 Actual
2019 Amended
2019 Estimated
2020 Adopted
Director of Senior Services 0.00 0.00 0.00 1.00 1.00 Senior Center Supervisor 1.00 1.00 1.00 0.00 0.00 Assistant Supervisor 0.00 1.00 1.00 0.00 0.00 Coordinator 0.00 0.00 0.00 1.00 1.00 Wellness Coordinator 1.00 0.00 0.00 0.00 0.00 Custodian 0.28 0.28 0.28 0.28 0.28
Total Staffing 2.28 2.28 2.28 2.28 2.28
Expenditures 2017 Actual
2018 Actual
2019 Amended
2019 Estimated
2020 Adopted
Personal Services 136,498 137,849 163,424 154,366 163,689 Non-Personal Services Capital Outlay
31,860 0
38,056 0
40,067 0
37,300 0
41,715 3,300
Total Expenditures 168,358 175,905 203,491 191,666 208,704 Strategic Plan Focus Areas: Quality of Life. Governing and Fiscal Management. Communication. Goal: To engage the community as work continues on the Livable Sheboygan initiative.
Department of the Senior Services
Administration
Operations
158

CULTURE AND RECREATION SENIOR SERVICES
Objective: 1. Offer programs and opportunities which promote health, wellness and social engagement for older adults.
2. Maintain and develop community partnerships. 3. Develop opportunities for intergenerational experiences with local youth and older
adults. 4. Engage Senior Activity Center members in Livable Sheboygan implementation
process. 5. To achieve a rating of 80% or higher satisfaction (fair, good or excellent) from
residents who live in the City of Sheboygan. Measurements Workload
2017 Actual
2018 Actual
2019 Amended
2019 Estimated
2020 Adopted
Total Check-Ins 43,052 43,052 18,150 18,850 19,500 Average daily Check-Ins 169 169 90 90 100 Total membership 653 653 709 709 730 Active members N/A N/A 278 278 300 Volunteer program leaders 20 20 20 20 20 Number of facility rentals 3 3 4 4 5 Community partnerships 17 17 17 17 17 Intergenerational events 5 5 5 5 5 Number of volunteers participating
in Livable Sheboygan initiative N/A N/A 25 25 25
Effectiveness
Resident satisfaction rating 98% 98% 80% 97% 80% Member satisfaction rating 100% 100% 80% 80% 80%
159

CITY OF SHEBOYGAN
NOTES
160

CONSERVATION AND DEVELOPMENT PLANNING AND DEVELOPMENT
Total Employees: 5.00
Division Purpose To actively promote a diverse, safe and dynamic community and enhance the living, working and recreational choices for all Sheboygan residents and visitors. Division Description Under the direction of the City Development Department, the Planning and Development Division (PDD) serves as the principal planning agency for the City of Sheboygan, promotes the comprehensive growth and well-being of the city and its neighborhoods. In addition to its planning functions, the PDD oversees the city’s zoning and land use policies, and also assists with economic development and housing opportunities that employs a variety of resources to encourage business and real estate development, as well as a diverse and stable housing stock throughout the city. PDD also administers Federal, State and Local grants including the city’s Community Development Block Grant (CDBG) program. PDD manages a number of special projects throughout the city to enhance the quality of life for both residents and visitors alike. This program is administered by the City Development Department. 2020 Budget Highlights The Adopted Budget includes the following change:
The addition of 1.00 FTE Grant Coordinator at a cost of $53,000 to provide support to oversee the Community Development Block Grant program and redevelopment within Tax Incremental Financing Districts.
Permanent Staffing 2017 Actual
2018 Actual
2019 Amended
2019 Estimated
2020 Adopted
Director 1.00 1.00 1.00 1.00 1.00 Manager of Zoning and Planning 1.00 1.00 1.00 1.00 1.00 Community Development Planner 1.00 1.00 1.00 1.00 1.00 Neighborhood Development Planner 1.00 1.00 0.00 0.00 0.00 Community and Economic Development Planner 0.00 0.00 1.00 1.00 1.00 Grant Coordinator 0.00 0.00 0.00 0.00 1.00
Total Staffing 4.00 4.00 4.00 4.00 5.00
Expenditures 2017 Actual
2018 Actual
2019 Amended
2019 Estimated
2020 Adopted
Personal Services 234,533 241,610 248,281 248,281 267,310 Non-Personal Services 117,442 107,305 104,444 105,670 101,411 Capital Outlay 294,505 0 0 0 0
Total Expenditures 646,480 348,915 352,725 353,951 368,721
Planning and Development Division
Administration
161

CONSERVATION AND DEVELOPMENT PLANNING AND DEVELOPMENT
Strategic Plan Focus Areas: Quality of Life. Economic Development. Neighborhood Revitalization. Goal: To provide quality customer service to residents and developers and provide recommendations to Boards and Committees regarding future developments. To monitor and update the Zoning Code as needed to meet mission. Objective: 1. Review development plans accurately and effectively to ensure quality
development in the community and make informative recommendations. 2. Provide reviews within two weeks of plan submittal. 3. Recommend amendments to the Zoning Code to promote quality development
and redevelopment. 4. To achieve an 80% or greater satisfaction (fair, good or excellent) survey rating
from residents who live in the City of Sheboygan. Goal: To provide complete neighborhood revitalization strategies to stabilize neighborhoods, increase property values and create new low to moderate income positions. Objective: 1. Promote the city’s revolving loan funds for housing rehabilitation activities and
new job creation programs to facilitate new investment in Sheboygan. 2. Strong neighborhoods including new neighborhood associations, new
commercial development, and great quality of life for the residents and tourists. 3. To achieve an 80% or greater satisfaction (fair, good or excellent) survey rating
from residents who live in the city.
Measurements
2017 Actual
2018 Actual
2019 Amended
2019 Estimated
2020 Adopted
Workload Existing businesses assisted Start-up businesses assisted Commission applications approved Comprehensive plan/ordinance amendments adopted Special projects Sign permits issued New neighborhood associations created
N/A N/A 88
N/A N/A N/A N/A
38 24 93 4
28 141
3
40 35
125 10 10
800 2
60 25 75 1
42 100
2
60 30
100 1
45 100
2
Effectiveness Percent of administration applications reviewed within two
weeks 100% 100% 100% 100% 100%
Percent of complaints received on commission applications Resident satisfaction rating
0% 84%
0% 75%
0% 80%
0% 83%
0% 80%
162

OTHER INTERFUND TRANSFERS
Division Purpose To transfer funds to other funds. Division Description This fund accounts for transfer of funds to other funds. This program is administered by the Finance Department. 2020 Budget Highlights There are no notable changes in 2020.
Expenditures 2017 Actual
2018 Actual
2019 Amended
2019 Estimated
2020 Adopted
Non-Personal Services 7,859 5,477,575 7,682 6,482 8,030 Total Expenditures 7,859 5,477,575 7,682 6,482 8,030
163

GENERAL GOVERNMENT UNCLASSIFIED
Division Purpose To maintain funding for uncollectible debts, wage adjustment reserve and reserve for contingency Division Description Uncollectible debts in the General Fund typically result when the County Treasurer forecloses on properties which have outstanding delinquent special charges which were placed on the tax roll. The reserve for contingency will be utilized for unanticipated expenditures not budgeted. This program is administered by the Finance Department. 2020 Budget Highlight There are no notable changes in 2020.
Expenditures 2017 Actual
2018 Actual
2019 Amended
2019 Estimated
2020 Adopted
Non-Personal Services 110,567 127,274 423,395 80,000 530,000 Total Expenditures 110,567 127,274 423,395 80,000 530,000
164

SPECIAL REVENUE FUNDS BUDGET SUMMARY
2017 2018 2019 2019 2020
Actual Actual Amended Estimated Adopted
Revenue
Taxes 4,010,842 4,094,226 3,991,321 3,981,887 4,302,078
Licenses and Permits 642,712 564,581 610,000 715,006 642,475
Intergovernmental Revenue 2,438,478 1,918,342 2,261,618 2,428,071 2,174,662
Intergovernmental Charges for Services 0 0 0 0 0
Charges for Services 2,202,507 2,359,534 2,034,740 2,165,538 2,168,641
Fines and Forfeitures 705,477 922,173 750,000 750,000 900,000
Miscellaneous Revenue 596,613 392,238 289,569 392,058 361,550
Other Financing Sources 750,844 229,368 225,000 230,000 942,964
Total Revenue 11,347,473 10,480,462 10,162,248 10,662,560 11,492,370
Expenditures
General Government 961,653 1,076,765 1,057,624 1,538,244 1,849,996
Public Safety 721,085 651,650 823,944 829,636 870,061
Public Works 982,378 1,028,440 974,799 898,719 937,643
Health and Human Services 0 0 0 0 0
Culture and Recreation 3,969,292 3,638,642 4,157,540 4,241,790 4,075,246
Conservation and Development 1,389,219 1,311,330 1,431,276 1,109,213 1,502,433
Transfers and other expenses 3,675,045 2,632,070 2,204,522 2,493,701 2,028,764
Total Expenditures 11,698,673 10,338,896 10,649,705 11,111,304 11,264,142
Excess of revenues over (under) expenditures -351,199 141,566 -487,458 -448,743 228,228
Fund Balance, Beginning Year 2,598,113 2,246,914 2,388,480 2,388,480 1,939,736
Fund Balance, Ending Year 2,246,914 2,388,480 1,901,022 1,939,736 2,167,964
165

SPECIAL REVENUE FUNDS POLICE MEG UNIT FUND
Fund Purpose To provide joint drug investigations with city and county agencies and task forces at the local, state, and federal level. Fund Description The Police MEG Unit Funds provides for funding for Sheboygan County Multi-Jurisdictional Enforcement Group (MEG), which conducts undercover operations while investigating major drug dealing operations. It consists of officers from the Sheboygan Police Department, Sheboygan County Sheriff’s Department, and Plymouth Police Department. Other county agencies provide additional resources, and the group may also work with the Wisconsin Department of Justice, the U.S. Drug Enforcement Administration and the US Postal Service. The Sheboygan Police Department is the lead agency for the MEG Unit and provides a supervisor and investigator. MEG investigators are also an integral part of the Sheboygan County community’s education and prevention efforts regarding drug use and associated problems. This program is administered by the Police Department. 2020 Budget Highlights There are no notable changes in 2020.
Permanent Staffing 2017 Actual
2018 Actual
2019 Amended
2019 Estimated
2020 Adopted
Unit Secretary 0.40 0.40 0.40 0.40 0.40 Total Staffing 0.40 0.40 0.40 0.40 0.40
Revenues 2017 Actual
2018 Actual
2019 Amended
2019 Estimated
2020 Adopted
Intergovernmental Revenue 29,638 40,063 53,827 53,827 53,827 Miscellaneous Revenue 314 93 0 0 0 Other Financing Sources 4,931 4,147 0 5,000 5,000
Total Revenues 34,883 44,303 53,827 58,827 58,827
Expenditures 2017 Actual
2018 Actual
2019 Amended
2019 Estimated
2020 Adopted
Personal Services 17,271 17,696 21,822 21,822 26,260 Non-Personal Services 12,728 16,442 32,005 35,005 24,346 Capital Outlay 457 10,612 0 0 0
Total Expenditures 29,996 44,750 53,827 53,827 50,605 Strategic Plan Focal Areas: Quality of Life. Neighborhood Revitalization. Goal: To arrest and prosecute organized and independent drug offenders, with emphasis on importation, distribution and cultivation offenses. Objective: 1. To arrest individuals involved in the distribution of heroin and opiate based
pharmaceuticals. 2. To arrest individuals involved in the distribution and cultivation of marijuana. 3. To arrest individuals involved in the distribution of methamphetamine.
166

SPECIAL REVENUE FUNDS POLICE MEG UNIT FUND
Goal: To provide drug abuse prevention and education service to local groups and schools within the enforcement group’s jurisdiction. Objective: 1. To provide and support educational programs to civic groups, schools, and others. Goal: To identify and respond to emerging drug problems within the enforcement group area. Objective: 1. To work with the law enforcement and other community partners to eradicate the
increase in opiate abuse within the country. 2. To inform law enforcement and other community partners of current trends in the
abuse of illegal substances within the county. 3. To train newly assigned enforcement group officers in basic and advanced drug
investigations and drug identification. 4. To provide drug identification training for all member agencies. 5. To hold regular target team meetings with the Street Crimes Unit Supervisor to
exchange information on active cases, community problems and strategies.
Measurements Workload
2017 Actual
2017 Actual
2019 Amended
2019 Estimated
2020 Adopted
Opiate Arrests 15 15 15 15 15 Marijuana Arrests 10 10 10 10 10 Methamphetamine Arrests 5 5 5 5 5 Educational Presentations 15 39 15 15 15 Search Warrants 10 19 10 10 10 Target Team Meetings 24 24 24 24 24
167

SPECIAL REVENUE FUNDS BLOCK GRANT FUND
Department Purpose To provide funding to assist low to moderate income persons in the City of Sheboygan. Department Descriptions The Community Development Block Grant program is administered by the Department of City Development. Annually, the city issues a request for proposals from interested parties including non-profits that serve the low to moderate income population. Prior allocations have funded public service agencies, economic development projects, city administration and public works projects including streets, infrastructure and park enhancements. Most of the funds are passed through the city to other organizations and activities as identified in the HUD 5-year Consolidated Plan. 2020 Budget Highlights There are no notable changes in 2020.
Revenues 2017 Actual
2018 Actual
2019 Amended
2019 Estimated
2020 Adopted
Intergovernmental Revenue 1,122,418 673,404 867,998 867,998 892,414 Total Revenues 1,122,418 673,404 867,998 867,998 892,414
Expenditures 2017 Actual
2018 Actual
2019 Amended
2019 Estimated
2020 Adopted
Non-Personal Services 329,044 307,176 386,401 343,381 328,683 Capital Outlay 793,374 277,361 567,800 549,307 610,932
Total Expenditures 1,122,418 584,536 954,201 892,688 939,615 Strategic Plan Focus Areas: Infrastructure and Public Facilities. Economic Development. Neighborhood Revitalization. Goal: Allocating up to 95 percent of the yearly block grant allocation to service low to moderate income persons. Objective: 1. Funding decent housing, suitable living environments, and expanded economic
opportunities for low to moderate income persons in the City of Sheboygan.
168

SPECIAL REVENUE FUNDS HOUSING REVOLVING LOAN FUND
Fund Purpose To provide low-interest and deferred loans to eligible properties to complete housing rehabilitation activities. Fund Description The Housing Revolving Loan Fund provides low interest financing for owner-occupied and owner-investor properties that house low to moderate income persons to provide safe and affordable housing opportunities in the city. The housing revolving loan fund depends on payments of outstanding loans to replenish the fund. The balance of the fund varies but ranges from about $100,000 to $300,000. The Housing Revolving Loan Fund is administered by the Department of City Development. The Historic/Housing Rehabilitation Commission is the approving entity of the disbursement of the funds. 2020 Budget Highlights There are no notable changes for 2020.
Revenues 2017 Actual
2018 Actual
2019 Amended
2019 Estimated
2020 Adopted
Intergovernmental Revenue 188,398 101,287 256,753 256,753 256,753 Total Revenues 188,398 101,287 256,753 256,753 256,753
Expenditures 2017 Actual
2018 Actual
2019 Amended
2019 Estimated
2019 Adopted
Personal Services 126,475 127,753 127,753 127,734 132,048 Non-personal Services 112,282 105,000 105,000 115,000 115,000
Total Expenditures 238,757 232,753 232,753 242,734 247,048 Strategic Plan Focus Area: Neighborhood Revitalization. Goal: To stabilize neighborhoods by providing safe and affordable housing. Objective: 1. To provide an alternate funding source to complete repairs ordered by the Building Inspection Division. 2. To issue new deferred and low interest loans to qualifying applicants. Measurements
2017 Actual
2018 Actual
2019 Amended
2019 Estimated
2020 Adopted
Resource Loan funds available (as of
December 31) $180,000 $180,000 $180,000 $180,000 $180,000
Outstanding loan amount (as of December 31)
$2,890,000 $3,240,539 $3,240,539 $3,240,539 $3,240,539
Number of new loans 7 0 1 0 5
169

SPECIAL REVENUE FUNDS BUSINESS REVOLVING LOAN FUND
Fund Purpose To create new full-time equivalent (FTE) low to moderate income jobs through issuance of low interest loans. Fund Description The Business Revolving Loan Fund provides low interest financing for companies that are unable to obtain loans solely from financial institutions and the Small Business Administration. The loan program is predicated upon job creation for low to moderate-income individuals. The business revolving loan fund depends on payments of outstanding loans to replenish the fund. The balance of the fund varies but ranges from about $400,000 to $1,000,000. The Revolving Loan Fund is administered by the Department of City Development. The Redevelopment Authority is the approving entity of the disbursement of the funds. 2020 Budget Highlights There are no notable changes in 2020.
Revenues 2017 Actual
2018 Actual
2019 Amended
2019 Estimated
2020 Adopted
Intergovernmental Revenue 238,304 276,904 150,000 150,000 150,000 Miscellaneous Revenue 56,389 56,053 40,000 40,000 40,000
Total Revenues 294,693 332,957 190,000 190,000 190,000
Expenditures 2017 Actual
2018 Actual
2019 Amended
2019 Estimated
2020 Adopted
Non-Personal Services 75,000 500,000 450,000 190,000 190,000 Total Expenditures 75,000 500,000 450,000 190,000 190,000
Strategic Plan Focus Area: Economic Development. Goal: To assist local businesses through issuance of new low interest rate loans to create new FTE jobs. Objective: 1. To meet with interested individuals and businesses to review and approve, as
appropriate, loans. 2. To monitor existing loans to verify financial condition and creation of new positions
. as pledged. Measurements
2017 Actual
2018 Actual
2019 Amended
2019 Estimated
2020 Adopted
Workload Number of new loans 1 1 2 1 2 Number of new jobs created 10 29 10 3 10
170

SPECIAL REVENUE FUNDS NEIGHBORHOOD REVITALIZATION FUND
Department Purpose To provide funding to increase/improve the supply of safe, quality, affordable housing and revitalize central city neighborhoods. Department Descriptions The Neighborhood Revitalization fund is administered by the Department of City Development. Neighborhood revitalization is a collaborative approach to improve the quality of life for all residents in a neighborhood. Program funds will be used to improve affordable housing opportunities within Sheboygan’s neighborhoods as well as funding for quality of life improvements to create strong neighborhoods. 2020 Budget Highlights This fund is new in 2020.
Revenues 2017 Actual
2018 Actual
2019 Amended
2019 Estimated
2020 Adopted
Other Financing Sources 0 0 0 0 712,964 Total Revenues 0 0 0 0 712,964
Expenditures 2017 Actual
2018 Actual
2019 Amended
2019 Estimated
2020 Adopted
Personal Services 0 0 0 0 30,993 Non-Personal Services 0 0 0 0 90,000 Capital Outlay 0 0 0 0 172,000
Total Expenditures 0 0 0 0 292,993 Strategic Plan Focus Areas: Infrastructure and Public Facilities. Economic Development. Neighborhood Revitalization. Goal: To offer an alternative funding source for home improvements to residents. Objective: 1. Funding decent housing, suitable living environments, and expanded economic
opportunities for residents in the City of Sheboygan. 2. Support neighborhood revitalization efforts within the city.
171

Total Employees: 39.75
SPECIAL REVENUE FUNDS MEAD PUBLIC LIBRARY FUND
Department Purpose To connect people with ideas, resources and technology to educate, entertain and empower. The Mead Public Library also serves as the regional resource library for the Monarch Library System. Department Description The Mead Public Library is an integral component of the local community’s educational system, delivering high-quality education through the following three approaches:
1. Self-directed education through vast collections of items in print, audio, video and digital formats; specialized online research tools; and the creation of content and materials via the library makerspace.
2. Research assistance and instruction for individuals and groups, which includes classes, seminars, and workshops for all ages, taught by library staff.
3. Instructive and enlightening experiences through cultural and community center concepts, events and partnerships, taught by local, regional and national experts.
2020 Budget Highlights The Mead Public Library Board’s Adopted Budget includes no significant changes in 2020.
Permanent Staffing 2017 Actual
2018 Actual
2019 Amended
2019 Estimated
2020 Adopted
Director 1.00 1.00 1.00 1.00 1.00 Business Manager 1.00 1.00 1.00 1.00 1.00 Manager 2.00 2.00 2.00 2.00 2.00 Librarian II 2.00 2.00 0.00 0.00 0.00 Librarian I 5.75 5.75 0.00 0.00 0.00 Librarian 0.00 0.00 8.00 7.75 9.00 Page Supervisor 1.00 1.00 1.00 1.00 0.00 Maintenance Supervisor 1.00 1.00 0.00 0.00 0.00 Public Information Specialist II 1.00 1.00 0.00 0.00 0.00 IT Specialist 1.00 1.00 1.00 1.00 1.00 Communications Specialist 0.00 0.00 1.00 1.00 1.00 Maintenance Technician 0.00 0.00 2.00 2.00 2.00 Administrative Assistant/ Volunteer Coordinator 0.00 0.00 1.00 1.00 1.00 Administrative Assistant I 1.00 1.00 0.00 0.00 0.00
Administration
Support Services
Public Services
Management
Mead Public Library Board of Trustees
172

SPECIAL REVENUE FUNDS MEAD PUBLIC LIBRARY FUND
Permanent Staffing-continued
2017 Actual
2018 Actual
2019 Amended
2019 Estimated
2020 Adopted
Maintenance Technician I 1.00 1.00 0.00 0.00 0.00 Library Assistant III 5.00 5.00 0.00 0.00 0.00 Library Assistant II 1.00 1.00 0.00 0.00 0.00 Library Assistant I 5.75 5.75 0.00 0.00 0.00 Cataloger 0.00 0.00 3.00 3.00 3.00 Public Safety Specialist 0.00 0.00 1.00 1.00 1.00 Library Assistant 0.00 0.00 9.25 9.25 9.25 Cleaner 1.50 1.50 2.00 2.00 2.00 Library Page 9.50 9.50 6.50 6.50 6.50 Total Staffing 39.50 39.50 39.75 39.50 39.75
Revenues 2017 Actual
2018 Actual
2019 Amended
2019 Estimated
2020 Adopted
Taxes 2,305,741 2,335,829 2,399,321 2,399,321 2,423,314 Intergovernmental Revenue 689,879 692,023 786,593 786,593 821,668 Charges for Services 43,669 44,027 47,800 47,800 47,801 Miscellaneous Revenue 51,389 77,311 80,000 150,000 150,000
Total Revenues 3,090,678 3,149,190 3,313,714 3,383,714 3,442,783
Expenditures 2017 Actual
2018 Actual
2019 Amended
2019 Estimated
2020 Adopted
Personal Services 2,145,494 2,319,898 2,401,446 2,401,446 2,425,879 Non-Personal Services 893,738 924,022 886,768 1,039,401 991,404 Capital Outlay Interfund Transfers
35,884 0
19,471 31,967
25,500 0
25,491 0
25,500 0
Total Expenditures 3,075,116 3,295.359 3,313,714 3,466,338 3,442,783 Our Mission: To connect people with ideas, resources and technology to educate, entertain and empower. Our Vision: Mead Public Library aspires to create a vibrant, informed and cohesive community. Our Values: Service: To hold our staff to the highest standards and deliver exceptional experiences. Inclusiveness: To welcome and serve everyone. Innovation: To embrace Mead’s role as a community leader and empower staff to adapt to emerging needs. Enrichment: To provide resources and experiences that cultivate curiosity discovery and lifelong learning. Our Goals: Mead Public Library provides resources and experiences that cultivate curiosity, discovery and lifelong learning. Lifelong Education Objective: Mead Public Library provides public education for all that is social, interest-driven, experiential and timely so that individuals can learn, grow and make a difference in their community. Foster a culture of reading for all ages Promote financial, civic, information, health, and digital literacy
173

SPECIAL REVENUE FUNDS MEAD PUBLIC LIBRARY FUND
Partner with educators to ensure student success Provide opportunities for social and cultural enrichment Community Hub Objective: Mead Public Library serves as a community hub that connects people and offers a safe and welcoming place to relax, socialize and pursue personal enrichment. Create safe, welcoming and vibrant spaces Engage underserved audiences and reflect the diversity of our community Support positive community conversations and civic engagement Develop easily accessible places for people to meet, study and learn Leadership Objective: Mead Public Library acts as a catalyst for community enhancement and a key partner in efforts that improve quality of life. Increase staff engagement in the community Embrace innovation and risk-taking Serve as a key partner and advocate for literacy and critical community issues Collaborate with businesses, nonprofits, educators and other community partners Measurements
2017 Actual
2018 Actual
2019 Amended
2019 Estimated
2020 Adopted
Workload Visits (gate count) Mead Public Library card holders
319,693 41,514
346,746 47,503
304,728 49,453
304,728 49,453
327,087 49,453
Checkout of physical materials Checkout of digital content
561,312 78,272
615,494 76,913
563,524 79,121
580,348 79,759
586,151 87,335
Internet sessions - via library computers Internet sessions - via wireless network
47,818
156,659
52,478
174,727
49,726
71,193
52,000
75,000
57,200
82,500
Classes and events – number held Classes and events – attendance
748
19,285
1,217 29,726
1,390
38,328
1,425
42,000
1,375
46,200
Number of youth enrichment classes/events N/A N/A N/A N/A TBD
Number of adult enrichment classes/events N/A N/A N/A N/A TBD
Efficiency FTE Library staff per 1,000 population .78 .81 .81 .81 .81
Check out per FTE staff hours worked 21,738 28,797 21,840 21,840 21,840
Square feet of library flooring replacements N/A 22,000 32,800 32,800 18,000
Effectiveness Resident satisfaction rating 97% 97% 97% 98% 98%
174

SPECIAL REVENUE FUNDS TOURISM FUND
Fund Purpose To account for the collection of Room Tax and use of the funds as determined by the City of Sheboygan within the parameters of Wisconsin Statute 66.0615. Fund Description The Tourism Fund accounts for the collection of eight percent Room Tax and use of the funds for the purpose of funding tourism promotion as well as activities within the public works and police department as determined by the Common Council. Consistent with Wisconsin Act 55 enacted changes to Wisconsin Statute 66.0615, regional tourism commission is recommended to oversee 70 percent of Motel taxes. This program is administered by the Finance Department. 2020 Budget Highlights There are no notable changes for 2020.
Revenues 2017 Actual
2018 Actual
2018 Amended
2019 Estimated
2020 Adopted
Taxes 1,572,735 1,626,213 1,460,000 1,450,666 1,746,264 Fines and Forfeitures 20 45 0 0 0 Miscellaneous Revenue 9,528 0 5,000 5,000 5,000
Total Revenues 1,582,283 1,626,258 1,465,000 1,455,666 1,751,264
Expenditures 2017 Actual
2018 Actual
2019 Amended
2019 Estimated
2020 Adopted
Personal Services 54,709 61,581 88,210 89,710 80,366 Non-Personal Services 533,435 585,704 526,250 1,085,262 1,265,035 Capital Outlay 0 0 50,000 2,300 91,600 Interfund Transfers 1,519,222 885,335 875,000 453,172 504,255
Total Expenditures 2,107,366 1,532,620 1,539,460 1,630,444 1,941,256 Strategic Plan Focus Area: Economic Development. Goal: To coordinate with adjoining municipalities to provide tourism promotion within the zone area. Objective: 1. To maintain 70% of room tax collections for tourism promotion in accordance with
Wisconsin Statutes 66.0615.
Measurements
2017 Actual
2018 Actual
2019 Amended
2019 Estimated
2020 Adopted
Effectiveness Percentage spent on promotion
133% 90% 99% 103% 70%
175

SPECIAL REVENUE FUNDS PARK, FORESTRY AND OPEN SPACE FUND
Fund Purpose To cover the capital expenses related to maintenance, acquisition, and development of parks, forestry and open spaces not eligible for impact fees. Fund Description The Park, Forestry, and Open Space Fund accommodates park land acquisition, park land development and support of related activities identified in the city’s Comprehensive Outdoor Recreation Plan 2016 - 2020 and Urban Forest/EAB Management Plan. This fund was created in 2017. This program is administered by the Department of Public Works. 2020 Budget Highlights There are no notable changes for 2020.
Revenues 2017 Actual
2018 Actual
2019 Amended
2019 Estimated
2020 Adopted
Taxes 110,000 110,000 110,000 110,000 110,000 Intergovernmental Revenue 25,000 0 0 205,000 0 Miscellaneous Revenue 701 (4,162) 500 500 500
Total Revenues 135,701 105,838 110,500 315,500 110,500
Expenditures 2017 Actual
2018 Actual
2019 Amended
2019 Estimated
2020 Adopted
Capital Outlay 72,414 122,630 110,000 110,000 315,000 Total Expenditures 72,414 122,630 110,000 110,000 315,000
Strategic Plan Focus Area: Quality of Life. Goal: To continue efforts to follow goals of Comprehensive Outdoor Recreation Plan 2016 - 2020. Objective: 1. Support the construction of a Splash Pads.
Measurements
2017 Actual
2018 Actual
2019 Amended
2019 Estimated
2020 Adopted
Workload Number of parks with Splash Pads 2 3 3 3 3 Strategic Plan Focus Area: Infrastructure and Public Facilities. Goal: To increase the census of healthy trees in the City. Objective: 1. Plant street trees to eliminate “gaps” by 2027. 2. Remove 100 percent of Ash trees with less than a 12” DBH and replace them
between 2017 - 2027.
Measurements 2017 Actual
2018 Actual
2019 Amended
2019 Estimated
2020 Adopted
Workload Number of non-Ash gap street trees planted 500 25 500 620 500 Number of non-Ash street trees removed 500 125 500 500 500 Number of Ash trees removed 300 467 750 750 750 Number of Ash trees treated 1,200 1,000 800 800 800
176

SPECIAL REVENUE FUNDS PARK IMPACT FEE FUND
Fund Purpose To account for the expenditures associated with the increased demand for new, expanded or improved park facilities relative to new development. Fund Description The city completed a public facilities needs assessment to identify new facilities and improvements to existing facilities required to serve new development. The needs assessment defines service areas and service standards as required by WI Statutes 66.0617. The study forecast future new development that will drive the need for new, expanded or improved park facilities. This fund was new in 2017. This program is administered by the Department of Public Works. 2020 Budget Highlights There are no notable changes in 2020.
Revenues 2017 Actual
2018 Actual
2019 Amended
2019 Estimated
2020 Adopted
Licenses and Permits 72,751 9,846 40,000 160,271 156,475 Miscellaneous Revenue 73 265 50 50 50
Total Revenues 72,824 10,111 40,050 160,321 156,525
Expenditures 2017 Actual
2018 Actual
2019 Amended
2019 Estimated
2020 Adopted
Capital Outlay 0 0 40,000 40,000 60,000 Total Expenditures 0 0 40,000 40,000 60,000
Strategic Plan Focus Area: Quality of Life. Goal: To provide adequate park facilities to serve new development. Objective: 1. To adequately address the current facilities for expansion or improvements to
enhance and maintain new development by adding to the quality of parks and trails.
2. To identify new facilities to serve new development.
177

SPECIAL REVENUE FUNDS CABLE TV FUND
Total Employees: 1.25
Fund Purpose To provide cable television services, video products, and services that meet the requirements of the City of Sheboygan, the affiliated organizations and the public in a quality and cost effective manner. Fund Description This program is administered by the Information Technology Department. As a customer service based and quality focused department, the Cable TV Division provides media production and distribution services to support goals and strategic directions of its customers within the parameters of the core values in the following manner:
1. Research and implementation of current technologies in the broadcasting industry. 2. Form partnerships with other media organization(s) to work in a collaborative manner. 3. Leverage underwriting and video production capabilities as a service to provide for other
organizations. 4. Broadcast live city meetings and events along with other events requested. 5. Produce a variety of informational video productions.
2020 Budget Highlights The Adopted Budget includes the following change:
A decrease of $55,473 in Franchise Fee per the new State law.
Permanent Staffing 2017 Actual
2018 Actual
2019 Amended
2019 Estimated
2020 Adopted
Program Director 1.00 1.00 1.00 1.00 1.00 Production Technician 0.50 0.50 0.25 0.25 0.25
Total Staffing 1.50 1.50 1.25 1.25 1.25
Revenues 2017 Actual
2018 Actual
2019 Amended
2019 Estimated
2020 Adopted
Licenses and Permits 569,961 554,735 570,000 554,735 486,000 Charges for Service 707 924 640 338 640 Miscellaneous Revenue 5,883 6,010 5,000 5,000 7,000
Total Revenues 576,551 561,670 575,640 560,073 493,640
Programming
Cable TV
178

SPECIAL REVENUE FUNDS CABLE TV FUND
Expenditures 2017 Actual
2018 Actual
2019 Amended
2019 Estimated
2020 Adopted
Personal Services 133,034 133,210 129,255 122,003 117,007 Non-Personal Services 25,772 34,158 82,134 79,914 82,084 Capital Outlay 49,541 47,968 419,914 369,914 40,000 Interfund Transfers 425,000 425,000 425,000 425,000 304,549
Total Expenditures 633,347 640,336 1,056,303 996,831 543,640 Strategic Plan Focus Area: Communication. Goal: To provide open and transparent coverage of municipal meetings, and quality community programs to viewers. Objective: 1. Maintain the number of programs produced. 2. Maintain Internet viewership.
Measurements
2017 Actual
2018 Actual
2019 Amended
2019 Estimated
2020 Adopted
Workload Number of programs produced Number of PSAs Produced
338 5
622 0
500 9
500 9
500 9
Number of televised Common Council and Committee of the Whole meetings
N/A 29 29 29 29
Effectiveness On-Demand viewing 8,298 3,778 8,400 8,400 8,400 On-Demand unique visitors 3,500 3,254 3,500 3,500 3,500 Strategic Plan Focus Area: Communication. Goal: To ensure quality TV programming is provided to its viewers. Objective: 1. Replace aging intercom system in studio.
179

SPECIAL REVENUE FUNDS MUNICIPAL COURT FUND
Administration
Total Employees: 2.50
Fund Purpose To account for the collection of forfeitures owed to the City of Sheboygan and Village of Kohler. Fund Description The Municipal Court Fund accounts for the collection of court penalty costs and use of the funds for the purpose of funding the court operations and distribution of funds to the City of Sheboygan State of Wisconsin and Sheboygan County per Wisconsin Statute 800. This program is administered by the Municipal Court Department. 2020 Budget Highlights The Adopted Budget includes the following change:
An increase in Fines and Forfeitures of $150,000 realized from continued participation in the State of Wisconsin Debt Collection system.
Permanent Staffing 2017 Actual
2018 Actual
2019 Amended
2019 Estimated
2020 Adopted
Municipal Court Judge 0.50 0.50 0.50 0.50 0.50 Municipal Court Clerk 1.00 1.00 1.00 1.00 1.00 Office Clerk 1.00 1.00 1.00 1.00 1.00
Total Revenues 2.50 2.50 2.50 2.50 2.50
Revenues 2017 Actual
2018 Actual
2019 Amended
2019 Estimated
2020 Adopted
Charges for Services 3,300 0 2,800 5,000 5,000 Fines and Forfeitures 705,457 922,128 750,000 750,000 900,000 Miscellaneous Revenue 545 437 0 1,609 0
Total Revenues 709,302 922,565 752,800 756,609 905,000
Expenditures 2017 Actual
2018 Actual
2019 Amended
2019 Estimated
2020 Adopted
Personal Services 171,853 179,711 187,089 187,237 175,774 Non-Personal Services 262,877 317,864 305,885 271,445 325,587 Capital Outlay 0 1,264 0 0 0 Interfund Transfers 274,197 424,723 260,823 296,077 401,389
Total Revenues 708,909 923,563 753,797 754,759 902,750
Municipal Court
Judge
180

SPECIAL REVENUE FUNDS MUNICIPAL COURT FUND
Strategic Plan Focus Area: Quality of Life. Goal: To operate the Municipal Court in an efficient and effective manner for the residents of the City of Sheboygan and Village of Kohler. Objective: 1. Fairly address cases in a timely manner. 2. Achieve annual customer satisfaction rating at or above 80%.
Measurements Workload
2017 Actual
2018 Actual
2019 Amended
2019 Estimated
2020 Adopted
Number of cases Effectiveness
7,074 6,931 7,000 7,000 7,000
Resident satisfaction rating 89% 81% 80% 94% 80%
181
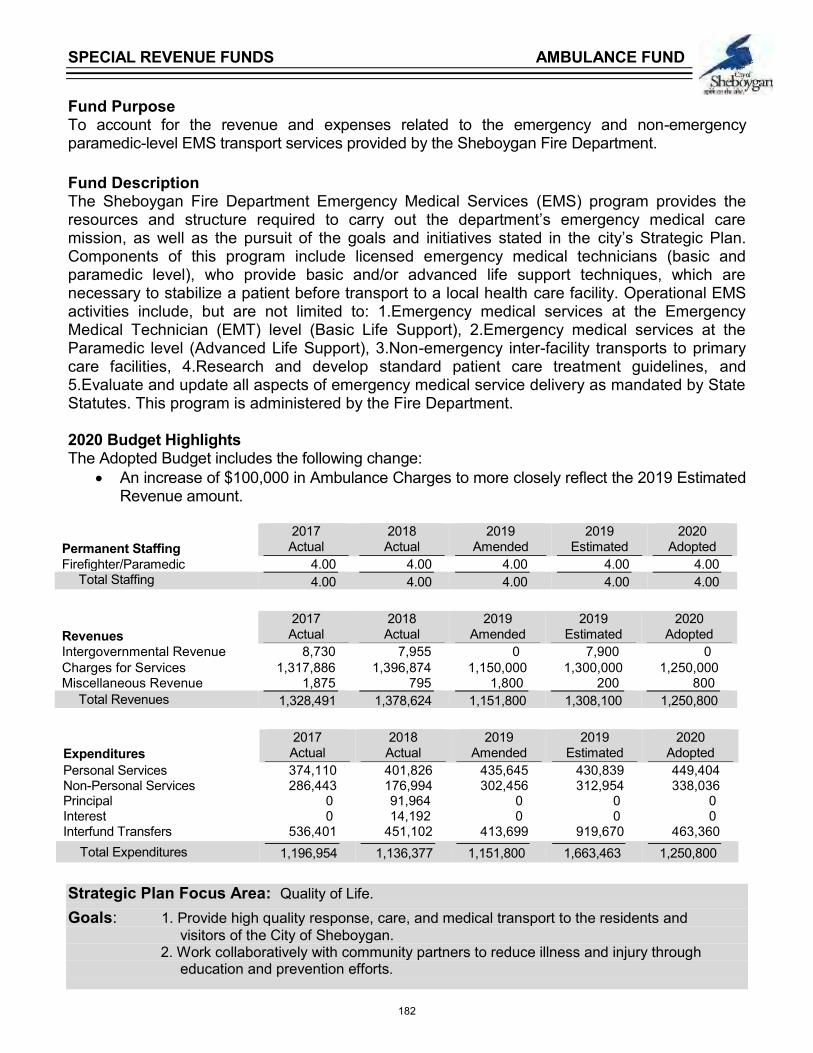
SPECIAL REVENUE FUNDS AMBULANCE FUND
Fund Purpose To account for the revenue and expenses related to the emergency and non-emergency paramedic-level EMS transport services provided by the Sheboygan Fire Department. Fund Description The Sheboygan Fire Department Emergency Medical Services (EMS) program provides the resources and structure required to carry out the department’s emergency medical care mission, as well as the pursuit of the goals and initiatives stated in the city’s Strategic Plan. Components of this program include licensed emergency medical technicians (basic and paramedic level), who provide basic and/or advanced life support techniques, which are necessary to stabilize a patient before transport to a local health care facility. Operational EMS activities include, but are not limited to: 1.Emergency medical services at the Emergency Medical Technician (EMT) level (Basic Life Support), 2.Emergency medical services at the Paramedic level (Advanced Life Support), 3.Non-emergency inter-facility transports to primary care facilities, 4.Research and develop standard patient care treatment guidelines, and 5.Evaluate and update all aspects of emergency medical service delivery as mandated by State Statutes. This program is administered by the Fire Department. 2020 Budget Highlights The Adopted Budget includes the following change:
An increase of $100,000 in Ambulance Charges to more closely reflect the 2019 Estimated Revenue amount.
Permanent Staffing 2017 Actual
2018 Actual
2019 Amended
2019 Estimated
2020 Adopted
Firefighter/Paramedic 4.00 4.00 4.00 4.00 4.00 Total Staffing 4.00 4.00 4.00 4.00 4.00
Revenues 2017 Actual
2018 Actual
2019 Amended
2019 Estimated
2020 Adopted
Intergovernmental Revenue 8,730 7,955 0 7,900 0 Charges for Services 1,317,886 1,396,874 1,150,000 1,300,000 1,250,000 Miscellaneous Revenue 1,875 795 1,800 200 800
Total Revenues 1,328,491 1,378,624 1,151,800 1,308,100 1,250,800
Expenditures
2017 Actual
2018 Actual
2019 Amended
2019 Estimated
2020 Adopted
Personal Services 374,110 401,826 435,645 430,839 449,404 Non-Personal Services 286,443 176,994 302,456 312,954 338,036 Principal 0 91,964 0 0 0 Interest 0 14,192 0 0 0 Interfund Transfers 536,401 451,102 413,699 919,670 463,360
Total Expenditures 1,196,954 1,136,377 1,151,800 1,663,463 1,250,800 Strategic Plan Focus Area: Quality of Life.
Goals: 1. Provide high quality response, care, and medical transport to the residents and visitors of the City of Sheboygan. 2. Work collaboratively with community partners to reduce illness and injury through education and prevention efforts.
182

SPECIAL REVENUE FUNDS AMBULANCE FUND
Objective: 1. Respond safely to 90% of emergent medical responses at or less than 360 seconds. 2. Achieve annual customer satisfaction rating at or above 80%.
Measurements
2017 Actual
2018 Actual
2019 Amended
2019 Estimated
2020 Adopted
Workload Total calls 4,040 3,312 4,050 4,600 4,650 Efficiency Average of EMS response
time (Seconds) 261 261 261 261 261
EMS emergent responses under 360 seconds
78% 90% 90% 90% 90%
Effectiveness Resident satisfaction rating 96% 96% 80% 99% 80%
183

SPECIAL REVENUE FUNDS SPECIAL ASSESSMENT FUND
Fund Purpose To accurately maintain special assessments charged for improvements to benefitting properties. Fund Description At the direction of the Engineering Department, the Finance Department will bill properties benefiting from improvements to infrastructure. Per city Municipal Code, options to properties owners for payment of the special assessments are within 30 days, prior to tax roll transfer without interest or installment payments over five or ten years depending on the amount of the improvement. In 2018, the Common Council eliminated the Special Assessment Program for paving and resurfacing projects. This program is administered by the Finance Department. 2020 Budget Highlights The Adopted Budget includes the following change:
A decrease in Interfund Transfer of $25,000 to Capital Projects Fund for reduced sidewalk improvements in 2020.
Revenue 2017 Actual
2018 Actual
2019 Amended
2019 Estimated
2020 Adopted
Miscellaneous Revenue 465,170 249,627 152,720 187,399 155,900 Total Revenues 465,170 249,627 152,720 187,399 155,900
Expenditures 2017 Actual
2018 Actual
2019 Amended
2019 Estimated
2020 Adopted
Interfund Transfers 698,822 300,529 125,000 125,000 100,000 Total Expenditures 698,822 300,529 125,000 125,000 100,000
Strategic Plan Focus Areas: Infrastructure and Public Facilities. Governing and Fiscal Management. Goal: To bill benefitting properties in a timely manner for public infrastructure projects. Objective: 1. To bill 100% of benefitting properties in the year of improvements.
Measurements
2017 Actual
2018 Actual
2019 Amended
2019 Estimated
2020 Adopted
Workload Sidewalks 100 100 100 100 75 Paving 50 N/A N/A N/A N/A Resurfacing 150 N/A N/A N/A N/A Efficiency Timely billing – same year 35% 100% 100% 100% 100%
184

SPECIAL REVENUE FUNDS HARBOR CENTRE MARINA FUND
Fund Purpose To provide a first-class marina with superior boating experiences and quality customer service. Fund Description The Harbor Centre Marina opened in 1994 with 281 boat slips, 10,000 square foot marina administration building, including a 1200 square foot store, outdoor swimming pool, fuel dock and pump-out facility, 300-car parking lot for marina users, 6-lane public boat launch facility and park-like landscaped setting and pedestrian promenade. The marina is currently managed by F3 Marina. 2020 Budget Highlights There are no notable changes for 2020.
Revenues 2017 Actual
2018 Actual
2019 Amended
2019 Estimated
2020 Adopted
Taxes 144 0 0 0 0 Charges for Services 816,946 897,717 815,000 739,900 846,700 Miscellaneous Revenue 1,887 5,047 1,800 1,800 1,800 Other Financing Sources 745,913 225,000 225,000 225,000 225,000
Total Revenues 1,564,890 1,127,764 1,041,800 966,700 1,073,500
Expenditures 2017 Actual
2018 Actual
2019 Amended
2019 Estimated
2020 Adopted
Non-Personal Services 740,608 995,336 783,680 836,600 878,643 Capital Outlay 225,892 33,104 126,655 1,655 0 Interest 3,753 0 4,000 0 0
Total Expenditures 970,253 1,028,440 914,335 838,255 878,643 Strategic Plan Focus Area: Economic Development. Goal: Expand the experience and perception of the marina as a first-class operation. Objective: 1. Make necessary repairs on the facilities and the infrastructure to minimize future expenditures. 2. Increase the number of slip rentals over last year.
Measurements
2017 Actual
2018 Actual
2019 Amended
2019 Estimated
2020 Adopted
Workload Increase the number of slip rentals 8 -4 10 -3 10
185

SPECIAL REVENUE FUNDS REDEVELOPMENT AUTHORITY FUND
Fund Purpose To assist preventing and eliminating blighted areas, slum clearance and urban renewal programs and projects. Fund Description The Redevelopment Authority was developed under State Statute 66.1333. Revenues are provided into this fund from ground lease payments on the Riverfront and South Pier. The fund was developed to assist with redevelopment projects and acquisition of properties for redevelopment. This program is administered by the Department of City Development. 2020 Budget Highlights The Adopted Budget includes the following change:
A decrease of $100,000 in loan principal payment revenue.
Revenues 2017 Actual
2018 Actual
2019 Amended
2019 Estimated
2020 Adopted
Taxes 22,222 22,185 22,000 22,500 22,500 Intergovernmental Revenue 100,000 100,000 100,000 100,000 0 Charges for Services 50 0 0 0 0
Total Revenues 124,378 122,644 124,000 123,000 23,000
Expenditures
2017 Actual
2018 Actual
2019 Amended
2019 Estimated
2019 Adopted
Non-Personal Services 27,769 44,770 51,275 46,500 50,000 Capital Outlay 69 110,200 0 0 0
Total Expenditures 27,838 145,970 51,275 46,500 50,000 Strategic Plan Focus Area: Economic Development. Goal: Establish funding mechanisms through local and federal funds to complete the revitalization plan. Continue to implement downtown revitalization through the elimination of blight and slum properties. Objective: 1. Purchase and redevelop up to four properties in the identified redevelopment
area.
Measurements
2017 Actual
2018 Actual
2019 Amended
2019 Estimated
2020 Adopted
Workload Redevelopment of existing
properties
4
1
2
1
1
186

SPECIAL REVENUE FUNDS STORM WATER FUND
Fund Purpose To account for the collection of erosion control fees. Fund Description The Storm Water Fund accounts for the collection of permit fees to review storm water drainage plans and inspect soil erosion control measures at construction sites. This program is administered by the Department of Public Works. 2020 Budget Highlights There are no notable changes in 2020.
Revenues 2017 Actual
2018 Actual
2019 Amended
2019 Estimated
2020 Adopted
Charges for Services 19,949 19,991 18,500 18,500 18,500 Miscellaneous Revenue 754 306 700 0 0
Total Revenues 20,703 20,297 19,200 18,500 18,500
Expenditures 2017 Actual
2018 Actual
2019 Amended
2019 Estimated
2020 Adopted
Non-Personal Services 8,342 0 9,000 9,000 9,000 Capital Outlay 7,536 0 51,464 51,464 50,000
Total Expenditures 15,878 0 60,464 60,464 59,000 Strategic Plan Focus Area: Infrastructure and Public Facilities. Goal: Implement 2015 Storm Water Management Plan Goals as well as WI DNR mandated 2013 Storm Water Permit requirements. Objective: 1. Installation of joint storm water project with surrounding municipalities.
187

CITY OF SHEBOYGAN
NOTES
188

DEBT SERVICE FUNDS BUDGET SUMMARY
2017 2018 2019 2019 2020
Actual Actual Amended Estimated Adopted
Revenue
Taxes 6,167,634 6,666,863 7,358,181 7,434,915 8,542,409
Licenses and Permits 0 0 0 0 0
Intergovernmental Revenues 53,639 54,429 52,471 52,471 52,472
Intergovernmental Charges for Services 0 0 0 0 0
Charges for Services 0 0 0 0 0
Fines and Forfeitures 0 0 0 0 0
Miscellaneous Revenue 839,577 1,437,124 540,465 1,042,992 679,532
Other Financing Sources 1,366,425 9,702,434 1,084,486 5,782,591 1,127,142
Total Revenue 8,427,276 17,860,849 9,035,603 14,312,969 10,401,555
Expenditures
General Government 733,323 725,083 201,419 165,196 165,696
Public Safety 0 0 0 0 0
Public Works 0 0 0 0 0
Health and Human Services 0 0 0 0 0
Culture and Recreation 0 0 0 0 0
Conservation and Development 0 0 0 0 0
Transfers and other expenses 8,543,156 7,040,253 15,650,511 22,693,412 8,696,502
Total Expenditures 9,276,479 7,765,335 15,851,930 22,858,608 8,862,198
Excess of revenues over (under) expenditures -849,203 10,095,514 -6,816,327 -8,545,639 1,539,357
Fund Balance, Beginning Year 9,926,648 9,077,445 19,172,959 19,172,959 10,627,320
Fund Balance, Ending Year 9,077,445 19,172,959 12,356,632 10,627,320 12,166,677
189

DEBT SERVICE FUNDS G.O. DEBT SERVICE FUND
Fund Purpose To account for the accumulation of resources for the payment of general long-term debt principal, interest and related costs. It is the city’s mission to manage debt in order to allow for necessary purposes of capital equipment and capital improvement projects. Fund Description The Debt Service Fund serves to administer debt service for all projects approved within the Capital Improvements Program. City capital needs not financed by the annual property tax levy or user fees are included in the Debt Service Fund. This program is administered by the Finance Department. 2020 Budget Highlights There are no notable changes in 2020.
Revenues 2017 Actual
2018 Actual
2019 Amended
2019 Estimated
2020 Adopted
Taxes 2,886,889 3,196,889 3,421,889 3,421,889 3,541,758 Miscellaneous Revenue 624,106 5.820,467 517,965 5,382,992 621,032 Other Financing Sources 1,101,426 915,434 810,000 308,105 329,629
Total Revenues 4,612,421 9,932,789 4,749,854 9,112,986 4,492,419
Expenditures 2017 Actual
2018 Actual
2019 Amended
2019 Estimated
2020 Adopted
Non-Personal Services 41,950 24,900 0 0 0 Principal 3,438,666 3,452,996 8,167,502 12,752,502 3,107,189 Interest 753,315 839,888 1,206,852 1,272,951 1,204,144
Total Expenditures 4,233,931 4,317,784 9,374,354 14,025,453 4,311,333 Strategic Plan Focus Area: Governing and Fiscal Management. Goal: To comply with the Wisconsin Statute 67.03 limit and City policy regarding debt service. Objective: 1. To maintain outstanding debt at or below 60% of the state statutory limit – five
percent of property base. 2. To maintain or improve rating, and if necessary make presentation to rating
service.
Measurements
2017 Actual
2018 Actual
2019 Amended
2019 Estimated
2020 Adopted
ResSource Outstanding GO Debt at year end $35,174,579 $44,854,631 $50,508,249 $33,284,454 $33,905,000 Percent of statutory debt capacity 20.85% 20.85% 29.57% 29.62% 29.00% Percent of non-TID debt 70.36% TBD 70.43% TBD TBD Equalized tax rate of needed tax levy $1.24 $1.28 $1.29 $1.29 $1.30 Advances $2,811,581 $2,811,581 $2,811,581 $2,811,581 $2,811,581 Effectiveness Moody’s Investors Service Rating Aa2 Aa2 Aa2 Aa2 Aa2
190

COMPUTATION OF LEGAL DEBT MARGIN AS OF DECEMBER 31, 2019
Equalized Value of Real and Personal Property $2,919,239,300
Real Property $2,835,198,200 Personal Property $84,041,100
Debt Limit, 5% of Equalized Valuation $145,961,965 (Wisconsin Statutory Limitation)
Amount of Debt Applicable to Debt Limitation:
Total General Obligation Bonds, Notes Outstanding December 31, 2019 $49,084,679
Less: Amounts available for financing $10,627,320
Net outstanding general obligation debt $38,457,359
Remaining Legal Debt Margin $107,504,606
Percent of Legal Debt Used 26.35%Percent of Legal Debt Available 73.65%
191

DEBT SERVICE FUNDS Debt service funds account for the accumulation of resources for, and the payment of, general long term debt principal, interest, and related costs. GENERAL OBLIGATION CORPORATE BONDS, SERIES 2019A The proceeds of the $6,630,0000 funded the 2019 Capital Improvement Program including the acquisition of garbage and recycling trucks, fire vehicles, road reconstruction and bridge refurbishing, fire station and library improvements, traffic control projects, tennis court refurbishing and urban forest management. A portion of the proceeds from the 2019A Bonds ($1,430,000) will be used to refund the callable maturities (April 1, 2020 – April 1, 2022) of the General Obligation Promissory Notes, Series 2012A. GENERAL OBLIGATION TAXABLE REFUNDING BONDS, SERIES 2019C The proceeds of the $2,960,000 bond will be used to refund the callable maturities (April 1, 2020 – April 1, 2027) of the Taxable General Obligation Refunding Bonds, Series 2010B (unfunded pension liability). GENERAL OBLIGATION PROMISSORY NOTES, SERIES 2018 The proceeds of the $5,000,000 note funded the 2018 Capital Improvement Program including the acquisition of motor vehicles and fire truck, fire station improvements, street improvements and transit rolling stock. GENERAL OBLIGATION REFUNDING BONDS, SERIES 2018 The proceeds of the $5,015,000 bond will be used to refund a portion of the Taxable Note Anticipation Notes dated July 2018 issued to provide interim financing for City Hall renovations. GENERAL OBLIGATION PROMISSORY NOTES, SERIES 2017A The proceeds of the $5,000,000 note funded the 2017 Capital Improvement Program including the acquisition of motor vehicles, fire truck, sirens and controllers, bridge and street improvements, and transit rolling stock. GENERAL OBLIGATION PROMISSORY NOTES, SERIES 2016A The proceeds for the $3,000,000 note funded the 2016 Capital Improvement Program including the acquisition of motor vehicles, fire department equipment, sirens and controllers, city hall consultants, bridge and street improvements, and transit rolling stock.
192

GENERAL OBLIGATION PROMISSORY NOTES, 2015 The proceeds of the $4,310,000 note funded the 2015 Capital Improvement Program in the amount of $3,035,000 including acquisition of mobile radio equipment, technology upgrades in the Fire Department, sirens and controllers, acquisition of motor vehicles, street improvement and storm sewer beach outfalls; refunded $300,0000 of the General Obligation Promissory Notes, Series 2007A dated April 15, 2007 Capital Improvement Program; refunding $975,000 of the General Obligation Promissory Notes, dated May 15, 2008 Capital Improvement Program. GENERAL OBLIGATION PROMISSORY NOTES, SERIES 2010A The proceeds of the $2,045,000 noted funded the 2010 Capital Improvement Program including building improvements at city hall and municipal service building, sidewalks, mini storm sewers and street improvements projects. GENERAL OBLIGATION CORPORATE BONDS, SERIES 2007B The proceeds of the $8,000,000 bond financed the construction of the police facility.
193

Revenues Expenditures
2020 2020Property Other Principal Interest
Issue Taxes Sources Total Payment Payment Total
G.O. Corporate Bonds - 2007B $1,043,563 $0 $1,043,563 $775,000 $268,563 $1,043,563G.O. Promissory Notes - 2010A 234,830 0 234,830 230,000 4,830 234,830G.O. Promissory Notes - 2015 360,225 0 360,225 325,000 35,225 360,225G.O. Promissory Notes - 2016A 286,500 0 286,500 250,000 36,500 286,500G.O. Promissory Notes - 2017A 203,063 0 203,063 100,000 103,063 203,063G.O. Promissory Notes - 2018 417,500 0 417,500 275,000 142,500 417,500G.O. Refunding Bonds - 2018 373,600 0 373,600 200,000 173,600 373,600G.O. Promissory Notes - 2019A 622,477 188,828 811,305 545,000 266,305 811,305G.O. Promissory Notes - 2019C 446,489 446,489 280,000 166,489 446,489Lease - Rescue Vehicle 0 58,762 58,762 56,012 2,750 58,762Lease - Fire Truck 0 75,497 75,497 71,177 4,320 75,497
$3,541,758 $769,576 $4,311,334 $3,107,189 $1,204,145 $4,311,334
GENERAL OBLIGATION DEBT SERVICE FUNDRevenues and Expenditures
194

DEBT SERVICE REQUIREMENTS OF OUTSTANDING G.O. BONDS AND NOTES
$8,000,000
$2,045,000 G.O. Corp. Bonds G. O.Prom. Notes
Series 2007B Series 2010A Year
Principal
Principal Due (10/01) Interest (04/01) Interest
2020 775,000 268,563 230,000 4,830 2021 775,000 229,813 2022 800,000 193,000 2023 800,000 155,000 2024 800,000 117,000 2025 800,000 78,000 2026 800,000 39,000 2027
$5,550,000 $1,080,376 $230,000 $4,830
$4,310,000 $3,000,000
G. O. Prom. Notes G.O. Prom. Notes
Series 2015 Series 2016A Year Principal
Interest Principal Due (10/01) (10/01) Interest
2020 325,000 35,225 250,000 36,500 2021 350,000 28,725 300,000 31,500 2022 350,000 21,725 300,000 25,500 2023 375,000 14,725 375,000 19,500 2024 340,000 7,225 375,000 12,000 2025 375,000 6,188
$1,740,000 $107,625 $1,975,000 $131,188
195

$5,000,000
$5,000,000
G. O. Prom. Notes
G. O. Prom. Notes
Series 2017A
Series 2018
Year Principal
Principal Due
(04/01) Interest
(12/01) Interest
2020
100,000 103,062
275,000 142,500 2021
225,000 99,813
350,000 134,250
2022
225,000 95,312
375,000 123,750 2023
575,000 86,594
500,000 112,500
2024
650,000 72,813
500,000 97,500 2025
800,000 56,500
750,000 82,500
2026
1,000,000 35,000
900,000 60,000 2027
900,000 11,250
1,100,000 33,000
$4,475,000 $560,344
$4,750,000 $786,000
196

$5,015,000 $6,630,000
$2,960,000
G.O. Ref. Bonds
G. O. Corp Bonds
G. O. Corp Bonds
Series 2018
Series 2019A
Series 2019C
Principal
Principal
Principal
Interest
(12/01) Interest
(04/01) Interest
2020
200,000 175,627
545,000 266,305
280,000 166,489
2021
200,000 173,600
545,000 182,550
325,000 125,875 2022
200,000 167,600
545,000 166,200
340,000 109,250
2023
200,000 161,600
250,000 149,850
360,000 91,750 2024
200,000 155,600
400,000 142,350
380,000 73,250
2025
200,000 143,600
320,000 130,350
405,000 53,625 2026
200,000 137,600
400,000 120,750
425,000 32,875
2027
200,000 131,600
400,000 108,750
445,000 11,125 2028
300,000 125,600
500,000 96,750
2029
300,000 116,600
400,000 81,750
2030
300,000 104,600
400,000 69,750
2031
300,000 92,600
400,000 57,750
2032
300,000 80,600
400,000 45,750
2033
300,000 68,600
550,000 33,750
2034
300,000 56,600
575,000 17,250
2035
300,000 44,600
2036
300,000 32,600
2037
300,000 20,600
2038
215,000 8,600
$4,815,000 $1,998,427
$6,630,000 $1,669,855
$2,960,000 $664,239
197

DEBT SERVICE FUNDS CONVENTION CENTER DEBT SERVICE FUND
Fund Purpose To account for the accumulation of resources for the payment of general long-term debt principal, interest and related costs. It is the city’s mission to manage debt in order to allow for repayment of outstanding debt of the Convention Center Debt. Fund Description The Convention Center Debt Service Fund was established to account for the tourism receipts generated by the resort on the South Pier in relation to the debt service associated with the construction of the conference center. The original developer agreement included a guarantee for any shortfalls in room tax receipts. This program is administered by the Finance Department. 2020 Budget Highlights There are no notable changes in 2020.
Revenues 2017 Actual
2018 Actual
2019 Amended
2019 Estimated
2020 Adopted
Miscellaneous Revenue 21,320 28,193 0 24,000 19,000 Total Revenues 21,320 28,193 0 24,000 19,000
Expenditures 2017 Actual
2018 Actual
2019 Amended
2019 Estimated
2020 Adopted
Interfund transfers 745,913 225,000 499,486 499,486 499,486 Total Expenditures 745,913 225,000 499,486 499,486 499,486
Strategic Plan Focus Area: Governing and Fiscal Management. Goal: To comply with the Wisconsin Statute 67.03 limit and City policy regarding debt service. Objective: 1. To fund the debt on the convention center.
198

DEBT SERVICE FUNDS TID 5 DEBT SERVICE FUND
Fund Purpose To account for the accumulation of resources for the payment of general long-term debt principal, interest and related costs. It is the city’s mission to manage debt in order to allow for repayment of outstanding debt of the Tax Increment District prior to the district closing in 2018. Fund Description The TID 5 Debt Service Fund serves to administer debt service for all projects approved within the project plan for Sheboygan Paper Box. The district includes a local industry and was created in 1991. The 1991 base value of the TID was $1,279,300 and was adjusted in 1993 to a base value of $1,050,600. This program is administered by the Finance Department. 2020 Budget Highlights The mandatory close out date of the district was May 6, 2018.
Revenues 2017 Actual
2018 Actual
2019 Amended
2019 Estimated
2020 Adopted
Taxes 513 2,320 0 0 0 Intergovernmental Revenue 1,168 1,186 0 0 0 Miscellaneous Revenue 4 15,115 0 0 0
Total Revenues 1,685 18,621 0 0 0
Expenditures 2017 Actual
2018 Actual
2019 Amended
2019 Estimated
2020 Adopted
Non-Personal Services 150 2,850 2,850 0 0 Interest 147 0 0 0 0
Total Expenditures 297 2,850 2,850 0 0 Strategic Plan Focus Area: Economic Development. Goal: To promote quality and sustainable economic and community development in the Sheboygan Paper Box area. Objective: 1. To increase the tax base by encouraging commercial development. Measurements
2017 Actual
2018 Actual
2019 Amended
2019 Estimated
2020 Adopted
Resource District Current Value $1,069,800 $0 $0 $0 $0 Value Increment $89,000 $0 $0 $0 $0 Strategic Plan Focus Area: Governing and Fiscal Management. Goal: To repay outstanding debt prior to the district closing in 2018. Objective: 1. To repay outstanding debt as scheduled. Measurements
2017 Actual
2018 Actual
2019 Amended
2019 Estimated
2020 Adopted
Resource Advances $15,802 $0 $0 $0 $0
199

DEBT SERVICE FUNDS TID 6 DEBT SERVICE FUND
Fund Purpose To account for the accumulation of resources for the payment of general long-term debt principal, interest and related costs for Tax Increment District No. 6. It is the city’s mission to manage debt in order to allow for repayment of outstanding debt of the District prior to the district mandatory closing date in 2023. Fund Description The Debt Service Fund serves to administer debt service for all projects approved within the TID 6, which was established for the revitalization of the Harbor Centre area resulting in significant economic and development benefits to the community. The district was created in 1992 and amended in 1994, 2001 and 2015. The revised base value of the District is $19,579,000. The District receives revenue from TID 11. This program is administered by the Finance Department. 2020 Budget Highlights There are no notable changes in 2020.
Revenues 2017 Actual
2018 Actual
2019 Amended
2019 Estimated
2020 Adopted
Taxes 1,281,141 1,323,137 1,500,237 1,536,002 1,483,896 Intergovernmental Revenue 2,914 2,957 2,914 2,914 2,915 Miscellaneous Revenue 150,744 16,128 5,000 5,000 5,000 Other Financing Sources 264,999 0 0 0 0
Total Revenues 1,699,798 1,342,222 1,508,151 1,543,916 1,491,811
Expenditures 2017 Actual
2018 Actual
2019 Amended
2019 Estimated
2020 Adopted
Non-Personal Services 650 650 150 650 650 Principal 1,254,951 1,264,952 1,244,951 1,244,951 1,209,952 Interest 116,454 77,020 65,373 64,971 52,585 Intergovernmental Transfers 125,000 0 0 0 0
Total Expenditures 1,497,055 1,342,621 1,310,474 1,310,572 1,263,187 Strategic Plan Focus Area: Economic Development. Goal: To promote quality and sustainable economic and community development in the Harbor Centre area. Objective: 1. To increase the tax base by encouraging commercial development. Measurements
2017 Actual
2018 Actual
2019 Amended
2019 Estimated
2020 Adopted
Resource District Current Value $70,092,900 $78,098,400 $78,098,400 $75,418,900 $75,418,900 Value Increment $50,000,000 $58,519,400 $58,519,400 $55,839,900 $55,839,900
200

DEBT SERVICE FUNDS TID 6 DEBT SERVICE FUND
Focal Area: Governing and Fiscal Management. Goal: To repay outstanding debt prior to the district closing in 2023. Objective: 1. To repay outstanding debt as scheduled. 2017
Actual 2018 Actual
2019 Amended
2019 Estimated
2020 Adopted
Measurements Resource Outstanding TID 6 Debt at year
end:
Land Recycling Loan 2002 $400,645 $320,517 $240,387 $240,387 $160,258 Land Recycling Loan 2004 $238,934 $199,112 $159,289 $159,289 $119,467 GO Prom Note 2016B $3,475,000 $2,720,000 $1,995,000 $1,995,000 $1,295,000 GO Refunding Bond 2016C $1,930,000 $1,540,000 $1,140,000 $1,140,000 $750,000
201

TID 6 DEBT SERVICE FUND Debt service funds account for the accumulation of resources for, and the payment of, general long term debt principal, interest, and related costs. GENERAL OBLIGATION REFUNDING BONDS, SERIES 2016C The proceeds of the $2,300,000 bond refinanced General Obligation Refunding Bonds, Series 2006C which refinanced General Obligation Corporate Purposes Bonds dated October 1, 1994; General Obligation Bond Anticipation Notes, Series 2003A and General Obligation Anticipation Notes, Series 2003B. GENERAL OBLIGATION PROMISSORY NOTES, SERIES 2016B The proceeds of the $4,240,000 bond refinanced General Obligation Refunding Bonds, Series 2006E which financed General Obligation Taxable Bond Anticipation Notes, Series 2003C. LAND RECYLCING LOAN, 2004 The proceeds of the $756,625 Land Recycling Loan financed land remediation. LAND RECYCLING LOAN, 2002 The proceeds of the $1,982,324 Land Recycling Loan financed land remediation.
202

$1,982,324
$756,625
Land Recycling
Land Recycling Year
Principal
Principal
Due (05/01)
(05/01)
2020 80,129
39,823
2021 80,129
39,822 2022 80,129
39,822
2023
39,822 $240,387
$159,289
$4,240,000
$2,300,000 Promissory Notes Refunding Bonds
Series 2016B Series 2016C Year
Principal
Interest Principal
Due (10/01) (10/01) Interest
2020 700,000 31,085 390,000 18,950 2021 670,000 21,635 380,000 13,100 2022 625,000 11,250 370,000 7,400 2023
$1,995,000 $63,970 $1,140,000 $39,450
203

DEBT SERVICE FUNDS TID 10 DEBT SERVICE FUND
Fund Purpose To account for the accumulation of resources for the payment of general long-term debt principal, interest and related costs for TID No. 10. It is the city’s mission to manage debt in order to allow for repayment of outstanding debt of the District prior to the district mandatory closing date in 2024. Fund Description The TID 10 Debt Service Fund serves to administer debt service for all projects approved within the TID 10, which was established for the revitalization of Water Street Neighborhood Redevelopment area resulting in riverfront residential development. The district was created in 1997 and amended in 2000. The 1997 base value of the district was $3,250,600. This program is administered by the Finance Department. 2020 Budget Highlights There are no notable changes in 2020.
Revenues 2017 Actual
2018 Actual
2019 Amended
2019 Estimated
2020 Adopted
Taxes 257,794 262,607 263,377 252,155 290,814 Intergovernmental Revenue 406 412 406 406 406 Miscellaneous Revenue 690 1,340 500 500 500
Total Revenues 258,890 264,359 264,283 253,061 291,720
Expenditures 2017 Actual
2018 Actual
2019 Amended
2019 Estimated
2020 Adopted
Non-Personal Services 650 650 150 650 650 Principal 40,000 40,000 0 0 0 Interest 9,004 760 6,000 6,000 0
Total Expenditures 49,654 41,410 6,150 6,650 650 Strategic Plan Focus Area: Economic Development. Goal: To promote quality and sustainable economic and community development in the Water Street area. Objective: 1. To increase the tax base by encouraging commercial development. Measurements
2017 Actual
2018 Actual
2019 Amended
2019 Estimated
2020 Adopted
Resource District Current Value $12,892,300 $13,393,100 $14,112,100 $14,827,900 $16,827,900 Value Increment $9,641,700 $10,142,500 $10,861,500 $11,577,300 $13,577,300
Strategic Plan Focus Area: Governing and Fiscal Management. Goal: To repay outstanding debt prior to the district closing in 2024. Objective: 1. To repay outstanding debt as scheduled.
204

DEBT SERVICE FUNDS TID 10 DEBT SERVICE FUND
2017 Actual
2018 Actual
2019 Amended
2019 Estimated
2020 Adopted
Measurements Resource Outstanding TID 10 Debt at
year end:
GO Bonds Series 2010A $40,000 $0 $0 $0 $0 Advances $611,908 $419,728 $419,728 $419,728 $419,728
205

DEBT SERVICE FUNDS TID 11 DEBT SERVICE FUND
Fund Purpose To account for the accumulation of resources for the payment of general long-term debt principal, interest and related costs. It is the city’s mission to manage debt in order to allow for repayment of outstanding debt of the Tax Increment District prior to the district closing in 2021. Fund Description The TID 11 Debt Service Fund serves to administer debt service for all projects approved within the project plan for Washington Square. The district includes commercial structures and uses. The TID was created in 1999 amended in 2012 to share revenue. The 1999 base value of the TID was $3,386,200. The district shares revenue with TID 6. This program is administered by the Finance Department. 2020 Budget Highlights The Adopted Budget includes the following changes:
A decrease in Principal and Interest expenditures of $146,450 as the outstanding debt is paid.
An increase in Interfund Transfers of $712,964 to transfer funding to provide support for the newly created Neighborhood Revitalization Special Revenue Fund.
Revenues 2017 Actual
2018 Actual
2019 Amended
2019 Estimated
2020 Adopted
Taxes 577,391 614,115 621,818 637,485 712,964 Intergovernmental Revenue 4,853 4,924 4,853 4,853 4,853 Miscellaneous Revenue 24,407 29,178 10,000 10,000 10,000 Other Financing Sources 0 (28,000) 0 0 0
Total Revenues 606,652 620,217 636,671 652,338 727,817
Expenditures 2017 Actual
2018 Actual
2019 Amended
2019 Estimated
2020 Adopted
Non-Personal Services 650 5,378 150 650 650 Principal 130,000 145,000 145,000 145,000 0 Interest 4,620 17,210 1,450 1,450 0 Intergovernmental Transfer 0 0 0 0 712,964
Total Expenditures 1,273,088 167,588 146,600 147,100 713,614 Strategic Plan Focus Area: Economic Development. Goal: To promote quality and sustainable economic and community development in the Washington Square area. Objective: 1. To increase the tax base by encouraging commercial development. Measurements
2017 Actual
2018 Actual
2019 Amended
2019 Estimated
2020 Adopted
Resource District Current Value $27,104,800 $29,029,600 $29,029,600 $31,667,300 $31,667,300 Value Increment $23,718,600 $25,643,400 $25,643,400 $28,281,100 $28,281,100 Strategic Plan Focus Area: Governing and Fiscal Management. Goal: To repay outstanding debt prior to the district closing in 2021.
206

DEBT SERVICE FUNDS TID 11 DEBT SERVICE FUND
Objective: 1. To repay outstanding debt as scheduled.
Measurements
2017 Actual
2018 Actual
2019 Amended
2019 Estimated
2020 Adopted
Resource Outstanding TID 11 Debt at
year end:
GO Bonds Series 2010C $0 $0 $0 $0 $0 GO Ref Bonds Series 2016C $290,000 $145,000 $145,000 $145,000 $0
207

DEBT SERVICE FUNDS TID 12 DEBT SERVICE FUND
Fund Purpose To account for the accumulation of resources for the payment of general long-term debt principal, interest and related costs. It is the city’s mission to manage debt in order to allow for repayment of outstanding debt of the Tax Increment District prior to the district closing in 2027. Fund Description The TID 12 Debt Service Fund serves to administer debt service for all projects approved within the project plan to provide a development incentive to a private developer to construct a new major downtown office building. TID 12 also includes the public-owned parking lot 14. The TID was created in 2000 with an amendment in 2008 to include a development incentive to Grand Stay Residential Suites. The revised base value was $3,825,900. This program is administered by the Finance Department. 2020 Budget Highlights The Adopted Budget includes the following change:
An increase of $223,027 in Interfund Transfers to provide financial support to TID 17.
Revenues 2017 Actual
2018 Actual
2019 Amended
2019 Estimated
2020 Adopted
Taxes 152,379 164,337 170,102 174,704 221,752 Intergovernmental Revenue 1,925 1,953 1,925 1,925 1,925 Miscellaneous Revenue 3,438 1,957 2,500 2,500 0
Total Revenues 157,742 168,247 174,527 179,129 223,677
Expenditures 2017 Actual
2018 Actual
2019 Amended
2019 Estimated
2020 Adopted
Non-Personal Services 650 650 150 650 650 Principal 155,000 90,000 0 0 0 Interest 6,134 1,710 0 0 0 Intergovernmental Transfers 300,000 0 0 174,704 223,027
Total Expenditures 461,784 92,360 150 175,354 223,677 Strategic Plan Focus Area: Economic Development. Goal: To promote quality and sustainable economic and community development in the downtown area. Objective: 1. To increase the tax base by encouraging commercial development. Measurements
2017 Actual
2018 Actual
2019 Amended
2019 Estimated
2020 Adopted
Resource District Current Value $10,172,800 $10,840,600 $10,840,600 $11,650,400 $11,650,400 Value Increment $6,347,100 $7,014,900 $7,014,900 $7,824,700 $7,824,700
Strategic Plan Focus Area: Governing and Fiscal Management. Goal: To repay outstanding debt prior to the district closing in 2027. Objective: 1. To repay outstanding debt as scheduled.
208

DEBT SERVICE FUNDS TID 12 DEBT SERVICE FUND
Measurements
2017 Actual
2018 Actual
2019 Amended
2019 Estimated
2019 Adopted
Resource Outstanding TID 12 Debt at
year end:
GO Bonds Series 2010B $90,000 $0 $0 $0 $0
209

DEBT SERVICE FUNDS TID 13 DEBT SERVICE FUND
Fund Purpose To account for the accumulation of resources for the payment of general long-term debt principal, interest and related costs. It is the city’s mission to manage debt in order to allow for repayment of outstanding debt of the Tax Increment District prior to the district closing in 2032. Fund Description The TID 13 Debt Service Fund serves to administer debt service for all projects approved within the project plan to encompass the former Sheboygan Senior Community and the property where Landmark Square development is constructed. The TID was created in 2006 and has no amendments to date. The base value was $294,400. TID 13 was amended in 2017 to include the Founder’s Club development incentive. This program is administered by the Finance Department. 2020 Budget Highlights There are no notable changes for 2020.
Revenues 2017 Actual
2018 Actual
2019 Amended
2019 Estimated
2020 Adopted
Taxes 292,614 331,434 378,303 387,841 420,602 Miscellaneous Revenue 1,184 1,782 1,000 1,000 1,000
Total Revenues 293,798 333,216 379,303 388,841 421,602
Expenditures 2017 Actual
2018 Actual
2019 Amended
2019 Estimated
2020 Adopted
Non-Personal Services 263,643 390,650 42,332 650 650 Intergovernmental Transfers 0 0 0 387,985 300,000
Total Expenditures 263,643 390,650 42,332 388,635 300,650 Strategic Plan Focus Areas: Economic Development. Governing and Fiscal Management. Goal: To promote quality and sustainable economic and community development in the Sheboygan Senior Community area. Objective: 1. To increase the tax base by encouraging commercial development. Measurements
2017 Actual
2018 Actual
2019 Amended
2019 Estimated
2020 Adopted
Resource District Current Value $13,095,200 $15,895,400 $15,895,400 $17,038,100 $17,038,100 Value Increment $12,800,800 $15,601,000 $15,601,000 $16,743,700 $16,743,700 Strategic Plan Focus Areas: Governing and Fiscal Management. Goal: To repay outstanding debt prior to the district closing in 2032. Objective: 1. To repay outstanding debt as scheduled.
210

DEBT SERVICE FUNDS TID 13 DEBT SERVICE FUND
Measurements
2017 Actual
2018 Actual
2019 Amended
2019 Estimated
2020 Adopted
Resource Outstanding TID 13 Debt at
year end: $0 $0 $0 $0 $0
Outstanding development incentive
$0 $0 $0 $42,832 $42,832
Advances $112,175 $112,175 $112,175 $112,175 $112,175
211

DEBT SERVICE FUNDS TID 14 DEBT SERVICE FUND
Fund Purpose To account for the accumulation of resources for the payment of incentive obligations and related costs. It is the city’s mission to manage obligations of the Tax Increment District prior to the district closing in 2031. Fund Description The TID 14 Debt Service Fund serves to administer debt service for all projects approved within the project plan of the Taylor Heights Shopping Center on N. Taylor Drive, the right-of-way of the Erie Avenue and N. Taylor Drive and Sunny Ridge Assisted Living and residential properties. This district was created as a mixed use district in April 2012 with a base value of $8,922,700. In 2018, the amended base value was $21,193,800, resulting from inclusion of the former Memorial Mall property. This program is administered by the Finance Department. 2020 Budget Highlights The Adopted Budget includes the following change:
An increase in Revenues of $397,342 due to an increase in Tax Increment.
Revenues 2017 Actual
2018 Actual
2019 Amended
2019 Estimated
2020 Adopted
Taxes 419,635 424,523 467,432 479,226 864,774 Intergovernmental Revenue 5,305 5,383 5,305 5,305 5,305 Miscellaneous Revenue 4,787 27,299 2,500 6,000 12,000
Total Revenues 429,727 457,205 475,237 490,531 882,079
Expenditures 2017 Actual
2018 Actual
2019 Amended
2019 Estimated
2020 Adopted
Non-Personal Services 307,672 167,768 150 650 650 Principal 0 0 80,000 80,000 80,000 Interest 0 0 32,449 32,449 20,550 Intergovernmental Transfers 0 0 0 735,000 0
Total Expenditures 307,672 167,768 112,599 848,099 101,200 Strategic Plan Focus Area: Economic Development. Goal: To promote quality and sustainable economic and community development in the Taylor Drive Shopping area. Objective: 1. To increase the tax base by encouraging commercial development. Measurements
2017 Actual
2018 Actual
2019 Amended
2019 Estimated
2020 Adopted
Resource District Current Value $25,318,800 $40,470,400 $40,470,400 $55,619,500 $59,000,000 Value Increment $16,396,100 $19,276,600 $19,276,600 $34,425,700 $39,806,200 Strategic Plan Focus Area: Governing and Fiscal Management. Goal: To repay outstanding obligations prior to the district closing in 2031. Objective: 1. To repay outstanding obligations as scheduled.
212

DEBT SERVICE FUNDS TID 14 DEBT SERVICE FUND
Measurements
2017 Actual
2018 Actual
2019 Amended
2019 Estimated
2020 Adopted
Resource Outstanding TID 14 Debt at
year end: $0 $0 $765,000 $685,000 $605,000
Outstanding development incentive
$159,160 $0 $0 $0 $0
213

TID 14 DEBT SERVICE FUND Debt service funds account for the accumulation of resources for, and the payment of, general long term debt principal, interest, and related costs. GENERAL OBLIGATION PROMISSORY NOTES, SERIES 2018 The proceeds of the $765,000 notes financed a portion of the street improvements on Taylor Drive.
$765,000
Promissory Notes Series 2018
Year
Principal Interest Due (12/01)
2020 80,000 20,550 2021 80,000 18,150 2022 85,000 15,750 2023 85,000 13,200 2024 85,000 10,650 2025 90,000 8,100 2026 90,000 5,400 2027 90,000 2,700
$685,000 $94,500
214

DEBT SERVICE FUNDS TID 15 DEBT SERVICE FUND
Fund Purpose To account for the accumulation of resources for the payment of incentive obligations and related costs. It is the city’s mission to manage obligation of the Tax Increment District prior to the district closing in 2031. Fund Description The TID 15 Debt Service Fund serves to administer debt service for all projects approved within the project plan of the commercial area around Pick ‘n Save and the adjacent commercial properties from Mead Avenue to one parcel south of Wilson Avenue. This district was created as a mixed use district in April 2012 with a base value of $12,434,900. There have been no amendments to this district. This program is administered by the Finance Department. 2020 Budget Highlights There are no notable changes for 2020.
Revenues 2017 Actual
2018 Actual
2019 Amended
2019 Estimated
2020 Adopted
Taxes 184,477 153,191 164,251 168,392 191,646 Intergovernmental Revenue 3,802 3,858 3,802 3,802 3,802 Miscellaneous Revenue 1,712 1,539 1,000 1,000 1,000
Total Revenues 189,991 158,588 169,053 173,194 196,448
Expenditures 2017 Actual
2018 Actual
2019 Amended
2019 Estimated
2020 Adopted
Non-Personal Services 158,508 155,536 155,037 159,046 159,046 Total Expenditures 158,508 155,536 155,037 159,046 159,046
Strategic Plan Focus Area: Economic Development. Goal: To promote quality and sustainable economic and community development in the Southside Pick ‘n Save area. Objective: 1. To increase the tax base by encouraging commercial development. Measurements
2017 Actual
2018 Actual
2019 Amended
2019 Estimated
2020 Adopted
Resource District Current Value $18,351,500 $19,208,500 $19,208,500 $20,164,100 $17,164,100 Value Increment $5,916,600 $6,773,600 $6,773,600 $7,629,200 $4,629,200 Strategic Plan Focus Area: Governing and Fiscal Management. Goal: To repay outstanding obligations prior to the district closing in 2031. Objective: 1. To repay outstanding obligations as scheduled. 215

DEBT SERVICE FUNDS TID 15 DEBT SERVICE FUND
Measurements
2017 Actual
2018 Actual
2019 Amended
2019 Estimated
2020 Adopted
Resource Outstanding TID 15 Debt at
year end:
Outstanding development incentive
$962,469 $801,745 $643,349 $643,349 $484,953
216

DEBT SERVICE FUNDS TID 16 DEBT SERVICE FUND
Fund Purpose To account for the accumulation of resources for the payment of general long-term debt principal, interest and related costs. It is the city’s mission to manage debt in order to allow for repayment of outstanding debt of the Tax Increment District prior to the district closing in 2035. Fund Description The TID 16 Debt Service Fund serves to administer debt service for all projects approved within the project plan of the development of market rate housing in Downtown Sheboygan as well as other public improvements. The district also includes a possible parking structure, transportation enhancements, development of the arts/cultural greenspace and environmental audits. The district boundaries are from Wisconsin Avenue on the north, North Ninth Street on the west, Riverfront Drive on the south and North Seventh Street on the east. The district was created in January 2015 with a base value of $22,459,200. There have been no amendments. This program is administered by the Finance Department. 2020 Budget Highlights There are no notable changes for 2020.
Revenues 2017 Actual
2018 Actual
2019 Amended
2019 Estimated
2020 Adopted
Taxes 920 79,485 255,819 262,268 544,335 Intergovernmental Revenue 32,646 33,126 32,646 32,646 32,646 Miscellaneous Revenue 7,168 14,489 0 0 0 Other Financing Sources 0 0 274,486 521,797 274,486
Total Revenues 40,751 127,100 562,951 816,711 851,467
Expenditures 2017 Actual
2018 Actual
2019 Amended
2019 Estimated
2020 Adopted
Non-Personal Services 150 150 150 650 650 Principal 86,641 435,000 505,000 505,000 505,000 Interest 0 61,956 102,840 128,490 81,776 Intergovernmental Transfers 0 0 0 247,311 0
Total Expenditures 86,791 497,106 607,990 881,451 587,426 Strategic Plan Focus Area: Economic Development. Goal: To promote quality and sustainable economic and community development in the Downtown area. Objective: 1. To increase the tax base by encouraging commercial development. Measurements
2017 Actual
2018 Actual
2019 Amended
2019 Estimated
2020 Adopted
Resource District Current Value $25,529,100 $33,009,000 $33,009,000 $44,128,600 $44,128,600 Value Increment $3,069,900 $10,549,800 $10,549,800 $21,669,400 $22,669,400 Strategic Plan Focus Area: Governing and Fiscal Management. Goal: To repay outstanding debt prior to the district closing in 2035.
217

DEBT SERVICE FUNDS TID 16 DEBT SERVICE FUND
Objective: 1. To repay outstanding debt as scheduled. Measurements
2017 Actual
2018 Actual
2019 Amended
2019 Estimated
2020 Adopted
Resource Outstanding TID 16 Debt at year
end:
GO Prom Notes Series 2016A $400,000 $355,000 $305,000 $305,000 $255,000 GO Prom Notes Series 2016B $3,285,000 $2,895,000 $2,500,000 $2,500,000 $2,105,000 State Trust Fund Loan $0 $400,000 $400,000 $400,000 $400,000 GO Prom Notes Series 2018 $0 $570,000 $510,000 $510,000 $450,000 Advances $85,543 $467,913 $467,913 $467,913 $467,913
218

TID 16 DEBT SERVICE FUND Debt service funds account for the accumulation of resources for, and the payment of, general long term debt principal, interest and related costs. GENERAL OBLIGATION PROMISORRY NOTES, SERIES 2018 The proceeds of the $570,000 notes funded street lighting LED upgrade and renovation of the Halprin Fountain and adjacent plaza including sidewalks and lighted bollards at the Mead Public Library. STATE TRUST FUND LOAN, 2017 The proceeds of the $400,000 loan funded developer incentives for market rate housing. GENERAL OBLIGATION PROMISSORY NOTES, SERIES 2016A The proceeds of the $400,000 notes funded the green space on South Eighth Street. GENERAL OBLIGATION PROMISSORY NOTES, SERIES 2016B The proceeds of the $3,285,000 notes funded developer incentives for market rate housing.
$400,000
$3,285,000
Promissory Notes Promissory Notes Series 2016A Series 2016B
Year
Principal Interest
Principal Interest Due (10/01) (10/01)
2020 50,000 5,683 395,000 46,755 2021 50,000 4,682 405,000 41,422 2022 50,000 3,683 410,000 35,146 2023 50,000 2,682 420,000 27,764 2024 50,000 1,683 430,000 19,366 2025 55,000 908 440,000 10,120
$305,000 $19,321 $2,500,000 $180,573
219

$400,000 $570,000
State Trust Fund Promissory Notes Series 2017 Series 2018
Year
Principal Interest
Principal Interest
Due (10/01) (12/01)
2020 0 14,038 60,000 15,300 2021 200,000 14,000 60,000 13,500 2022 0 7,000 65,000 11,700 2023 0 7,000 65,000 9,750 2024 0 7,019 65,000 7,800 2025 0 7,000 60,000 5,850 2026 0 7,000 65,000 4,050 2027 200,000 7,000 70,000 2,100
$400,000 $70,057 $510,000 $70,050
220

DEBT SERVICE FUNDS TID 17 DEBT SERVICE FUND
Fund Purpose To account for the accumulation of resources for the payment of general long-term debt principal, interest and related costs. It is the city’s mission to manage debt in order to allow for repayment of outstanding debt of the Tax Increment District. Fund Description The TID 17 Debt Service Fund serves to administer debt service for all projects approved within the project plan of the development of the Indiana Avenue corridor, including the creation of the Innovation district. The district was created in January 2018 with a base value of $34,021,700. There have been no amendments. This program is administered by the Finance Department. 2020 Budget Highlights There are no notable changes for 2020.
Revenues 2017 Actual
2018 Actual
2019 Amended
2019 Estimated
2020 Adopted
Taxes 0 0 0 0 48,983 Miscellaneous Revenue 0 0 0 0 8,000 Other Financing Sources 0 0 0 562,689 523,027
Total Revenues 0 0 0 562,689 580,010
Expenditures 2017 Actual
2018 Actual
2019 Amended
2019 Estimated
2020 Adopted
Non-Personal Services 0 0 0 150 150 Principal 0 0 0 0 0 Interest 0 0 0 0 134,960 Intergovernmental Transfers 0 0 0 110,000 0
Total Revenues 0 0 0 110,150 135,110 Strategic Plan Focus Area: Economic Development. Goal: To promote quality and sustainable economic and community development in the Indiana Avenue corridor, including the Innovation District. Objective: 1. To increase the tax base by encouraging commercial development. Measurements
2017 Actual
2018 Actual
2019 Amended
2019 Estimated
2020 Adopted
Resource District Current Value $0 $0 $34,021,700 $36,021,000 $44,128,600 Value Increment $0 $0 $0 $1,999,300 $4,999,300 Strategic Plan Focus Area: Governing and Fiscal Management. Goal: To repay outstanding debt prior to the district closing. Objective: 1. To repay outstanding debt as scheduled.
221

DEBT SERVICE FUNDS TID 17 DEBT SERVICE FUND
Measurements
2017 Actual
2018 Actual
2019 Amended
2019 Estimated
2020 Adopted
Resource Outstanding TID 17 Debt at year
end:
GO Promissory Bond 2019 $0 $0 $0 $3,350,000 $3,350,000
222

TID 17 DEBT SERVICE FUND Debt service funds account for the accumulation of resources for, and the payment of, general long term debt principal, interest, and related costs. GENERAL OBLIGATION COMMUNITY DEVELOPMENT BONDS, SERIES 2019B The proceeds of the $3,360,000 bond funded land acquisitions and infrastructure improvements.
$3,360,000
G.O. Comm Dev Bonds
Series 2019B
Principal
(12/01) Interest
2020
134,960
2021 100,800
2022
50,000 100,800 2023
160,000 99,300
2024
165,000 94,500 2025
170,000 89,550
2026
175,000 84,450 2027
180,000 79,200
2028
190,000 73,800 2029
195,000 68,100
2030
200,000 62,250 2031
210,000 56,250
2032
215,000 49,950 2033
225,000 43,500
2034
230,000 36,750 2035
240,000 29,850
2036
245,000 22,650 2037
250,000 15,300
2038
260,000 7,800
$3,360,000 $1,249,760
223

DEBT SERVICE FUNDS TID 18 DEBT SERVICE FUND
Fund Purpose To account for the accumulation of resources for the payment of general long-term debt principal, interest and related costs. It is the city’s mission to manage debt in order to allow for repayment of outstanding debt of the Tax Increment District prior to the district closing in 2023. Fund Description The TID 18 Debt Service Fund serves to administer debt service for all projects approved within the project plan of the expansion of the SouthPointe Enterprise Campus as well as other public improvements. The district was created in 2018 and the base value was $12,444,400. The eligible expenditure period ends in January, 2043. There have been no amendments. This program is administered by the Finance Department. 2020 Budget Highlights The Adopted Budget includes the following changes:
A decrease of $3,395,000 in Principal due to refinancing of 2018-issued Note Anticipation Notes (NAN’s) in 2019.
An increase of $199,426 in Interest Expenditures due to refinancing of 2018-issued NAN’s in 2019.
Revenues 2017 Actual
2018 Actual
2019 Amended
2019 Estimated
2020 Adopted
Taxes 0 0 0 0 100,372 Miscellaneous Revenue 0 4,294,512 0 0 2,000
Total Revenues 0 4,294,512 0 0 102,372
Expenditures 2017 Actual
2018 Actual
2019 Amended
2019 Estimated
2020 Adopted
Non-Personal Services 0 43,585 150 650 650 Principal 0 0 3,395,000 3,395,000 0 Interest 0 157,386 198,108 460,163 547,397
Total Expenditures 0 200,971 3,593,258 3,855,813 548,047 Strategic Plan Focus Area: Economic Development. Goal: To promote quality and sustainable economic development opportunities in the business park area. Objective: 1. To increase the tax base by encouraging commercial development. Measurements
2017 Actual
2018 Actual
2019 Amended
2019 Estimated
2020 Adopted
Resource District Current Value $0 $0 $16,440,100 $16,440,100 $17,440,100 Value Increment $0 $0 $3,995,700 $3,995,700 $4,995,700
224

DEBT SERVICE FUNDS TID 18 DEBT SERVICE FUND
Strategic Plan Focus Area: Governing and Fiscal Management. Goal: To repay outstanding debt prior to the district closing in 2039. Objective: 1. To repay outstanding debt as scheduled. Measurements
2017 Actual
2018 Actual
2019 Amended
2019 Estimated
2020 Adopted
Resource Outstanding TID 18 Debt at year
end: $0 $3,800,000 $0 $4,230,000 $4,230,000
Taxable NAN’s $0 $3,395,000 $3,395,000 $0 $0 NAN’s $0 $10,490,000 $10,490,000 $10,490,000 $10,490,000
225

TID 18 DEBT SERVICE FUND Debt service funds account for the accumulation of resources for, and the payment of, general long term debt principal, interest, and related costs. NOTE ANTICIPATION NOTES, SERIES 2018 The proceeds of the $10,490,000 Note Anticipation Notes (NANs) funded the land acquisition, road and public utilities, grading, engineering, inspection landscaping and signage for SouthPointe Enterprise Campus. GENERAL OBLIGATION REFUNDING BONDS, SERIES 2018 The proceeds of the $3,800,000 bond refinanced Note Anticipation Note, Series 2018. GENERAL OBLIGATION DEVELOPMENT BONDS, SERIES 2019B The proceeds of the $430,000 bond funded signage and storm water improvements.
226

$10,490,000 Note Anticipation Notes
Series 2018
$3,800,000 G.O. Ref Bonds
Series 2018 Year
Principal
Interest
Principal Due (6/01)
(12/01) Interest
2020 0 380,262
149,862 2021 0 380,263
155,000 149,863 2022 0 380,263
160,000 144,980 2023 10,490,000 190,131
165,000 139,780 2024
170,000 134,252 2025
175,000 128,388 2026
185,000 122,175 2027
190,000 115,422 2028
195,000 108,298 2029
200,000 100,790 2030
210,000 92,990 2031
215,000 84,695 2032
225,000 76,095 2033
235,000 66,982 2034
245,000 57,348 2035
255,000 47,057 2036
260,000 36,093 2037
275,000 24,782 2038
285,000 12,683 $10,490,000 $1,330,919
$3,800,000 $1,792,535
227

$430,000
G.O. Comm Dev Bonds
Series 2019B
Principal
(12/01) Interest
2020
17,272 2021
12,900
2022
12,900 2023
12,900
2024
20,000 12,900 2025
25,000 12,300 2026
25,000 11,550 2027
25,000 10,800 2028
25,000 10,050 2029
25,000 9,300 2030
30,000 8,550 2031
30,000 7,650 2032
30,000 6,750 2033
30,000 5,850 2034
30,000 4,950 2035
30,000 4,050 2036
35,000 3,150 2037
35,000 2,100 2038
35,000 1,050
$430,000 $166,972
228

DEBT SERVICE FUNDS TID 19 DEBT SERVICE FUND
Fund Purpose To account for the accumulation of resources for the payment of general long-term debt principal, interest and related costs. It is the city’s mission to manage debt in order to allow for repayment of outstanding debt of the Tax Increment District prior to the district closing in 2024. Fund Description The TID 19 Debt Service Fund serves to administer debt service for all projects approved within the project plan of the redevelopment of the west side of the Sheboygan River and any related public improvements. The boundaries associated within this area are Pennsylvania Avenue north to Niagara Avenue and the Sheboygan River west to North 15th Street. The district was created in 2018 and the base value was $3,399,200. The eligible expenditure period ends in January, 2024. There have been no amendments. This program is administered by the Finance Department. 2020 Budget Highlights There are no notable changes in 2020.
Revenues 2017 Actual
2018 Actual
2019 Amended
2019 Estimated
2020 Adopted
Taxes 0 0 0 0 (1,490) Total Revenues 0 0 0 0 (1,490)
Expenditures 2017 Actual
2018 Actual
2019 Amended
2019 Estimated
2020 Adopted
Non-Personal Services 0 0 0 150 650 Interest 0 0 0 0 17,473 Intergovernmental Transfers 0 0 0 450,000 0
Total Expenditures 0 0 0 450,150 18,123 Strategic Plan Focus Area: Economic Development. Goal: To promote quality and sustainable economic development opportunities in the business park area. Objective: 1. To increase the tax base by encouraging commercial development. Measurements
2017 Actual
2018 Actual
2019 Amended
2019 Estimated
2020 Adopted
Resource District Current Value $0 $0 $3,339,900 $3,339,900 $7,339,900 Value Increment $0 $0 ($59,300) ($59,300) $4,000,000 Strategic Plan Focus Area: Governing and Fiscal Management. Goal: To repay outstanding debt prior to the district closing in 2039. Objective: 1. To repay outstanding debt as scheduled.
229

DEBT SERVICE FUNDS TID 19 DEBT SERVICE FUND
Measurements
2017 Actual
2018 Actual
2019 Amended
2019 Estimated
2020 Adopted
Resource Outstanding TID 19 Debt at
year end:
GO Bonds 2019 $0 $0 $0 $435,000 $435,000
230

TID 19 DEBT SERVICE FUND Debt service funds account for the accumulation of resources for, and the payment of, general long term debt principal, interest, and related costs. GENERAL OBLIGATION COMMUNITY DEVELOPMENT BOND, SERIES 2019B The proceeds of the $435,000 bond funded a master plan to redevelop River West and a street reconstruction project.
$435,000
G.O. Comm Dev Bonds
Series 2019B
Principal
(12/01) Interest
2020
17,473
2021 13,050
2022
60,000 13,050 2023
70,000 11,250
2024
70,000 9,150 2025
75,000 7,050
2026
80,000 4,800 2027
80,000 2,400
$435,000 $78,223
231

DEBT SERVICE FUNDS ENVIRONMENTAL TID DEBT SERVICE FUND
Fund Purpose To account for the accumulation of resources for the payment of general long-term debt principal, interest and related costs. It is the City’s mission to manage debt in order to allow for repayment of outstanding debt of the Tax Increment District prior to the district closing in 2025. Fund Description The Environmental TID Debt Service Fund serves to administer debt service for all projects approved within the project plan to remediate environmental problems, construct the required infrastructure and develop commercial structures and uses. The district was created in August 2002 with a base value of $1,864,600. There have been no amendments. This program is administered by the Finance Department. 2020 Budget Highlights There are no notable changes in 2020.
Revenues 2017 Actual
2018 Actual
2019 Amended
2019 Estimated
2020 Adopted
Taxes 113,880 114,765 114,953 114,953 122,003 Intergovernmental Revenue 620 629 620 620 620 Miscellaneous Revenue 0 124 0 0 0
Total Revenues 114,500 115,518 115,573 115,753 122,623
Expenditures 2017 Actual
2018 Actual
2019 Amended
2019 Estimated
2020 Adopted
Non-Personal Services 150 650 150 650 650 Principal 155,000 160,000 0 0 0 Interest 9,301 3,040 500 0 0
Total Expenditures 164,451 163,690 650 650 650 Strategic Plan Focus Area: Governing and Fiscal Management. Goal: To repay outstanding debt prior to the district closing in 2025. Objective: 1. To repay outstanding debt as scheduled. Measurements
2017 Actual
2018 Actual
2019 Amended
2019 Estimated
2020 Adopted
Resource District Current Value $6,297,100 $6,605,200 $6,897,300 $6,897,300 $6,897,300 Value Increment $4,462,500 $4,740,600 $114,953 $5,032,700 $5,032,700 Due to General Fund $174,504 $0 $0 $0 $0 Advances $110,227 $110,227 $110,227 $110,227 $110,227
232

CAPITAL IMPROVEMENT FUNDSBUDGET SUMMARY
2017 2018 2019 2019 2020
Actual Actual Amended Estimated Adopted
Revenue
Taxes 1,681,879 1,661,306 1,690,775 1,683,775 1,600,242
Licenses and Permits 0 0 0 0 0
Intergovernmental Revenue 1,640,314 760,683 8,359,913 1,574,310 1,181,056
Intergovernmental Charges for Services 0 0 0 0 0
Charges for Services 0 0 0 0 0
Fines and Forfeitures 0 0 0 0 0
Miscellaneous Revenue 999,043 1,505,168 468,500 120,960 121,300
Other Financing Sources 7,790,207 30,952,500 10,928,526 10,927,681 6,551,946
Total Revenue 12,111,443 34,879,658 21,447,714 14,306,727 9,454,544
Expenditures
General Government 359,046 6,721,251 7,709,894 4,261,436 0
Public Safety 606,584 2,561,731 767,689 672,506 765,944
Public Works 5,361,688 5,344,146 10,756,843 5,077,149 4,948,430
Health and Human Services 0 0 0 0 0
Culture and Recreation 380,351 779,258 1,236,638 629,770 886,770
Conservation and Development 5,686,887 14,554,353 7,871,237 2,508,596 5,541,234
Transfers and other expenses 967,588 1,071,479 2,654,817 3,336,985 1,097,000
Total Expenditures 13,362,143 31,032,219 30,997,118 16,486,443 13,239,378
Excess of revenues over (under) expenditures -1,250,701 3,847,439 -9,549,404 -2,179,716 -3,784,834
Fund Balance, Beginning Year 6,749,570 5,498,869 9,346,308 9,346,308 7,166,592
Fund Balance, Ending Year 5,498,869 9,346,308 -203,096 7,166,592 3,381,758
233

CAPITAL IMPROVEMENT FUNDS CAPITAL PROJECT FUND
Fund Purpose To account for the expenditures associated with capital projects funded through sources other than borrowing. Fund Description The Capital Project Fund serves to administer expenditures of capital projects included in the review process of the Capital Improvements Commission. Typically, projects included are department requests which include funding from tax levy, vehicle registration fees, grants, County sales tax, contributions and interfund projects. This program is administered by the Finance Department. 2020 Budget Highlights The Adopted Budget includes the following changes:
See project listing below.
Revenues 2017 Actual
2018 Actual
2019 Amended
2019 Estimated
2020 Adopted
Taxes 1,674,879 1,654,306 1,683,775 1,683,775 1,600,242 Intergovernmental Revenue 790,314 728,783 8,359,913 1,574,310 1,181,056 Miscellaneous Revenue 74,637 548,922 446,000 80,959 109,300 Other Financing Sources 1,058,688 5,712,500 125,000 125,000 100,000
Total Revenues 3,598,518 8,644,511 10,614,688 3,464,044 2,990,598
Expenditures 2017 Actual
2018 Actual
2019 Amended
2019 Estimated
2020 Adopted
Non-Personal Services 38,102 486,081 30,000 30,000 0 Capital Outlay 2,543,286 4,482,706 17,209,206 6,361,144 3,611,598
Total Expenditures 2,581,388 4,968,787 17,239,206 6,391,144 3,611,598 Strategic Plan Focus Area: Governing and Fiscal Management. Goal: To fund projects utilizing sources other than borrowing. Objective: 1. To maximize grants and contributions. Measurements
2019 Actual
2018 Actual
2019 Amended
2019 Estimated
2020 Adopted
Resource Grants $790,314 $728,783 $7,933,323 $1,130,000 $770,056 Miles of street improvement 6.25 7.20 3.75 2.30 1.75
Significant Capital Projects The following is a list of the projects for 2020:
1. Butzen Sports Complex**
Project Description: This project promotes development of a recreational facility operated by a local nonprofit organization.
234
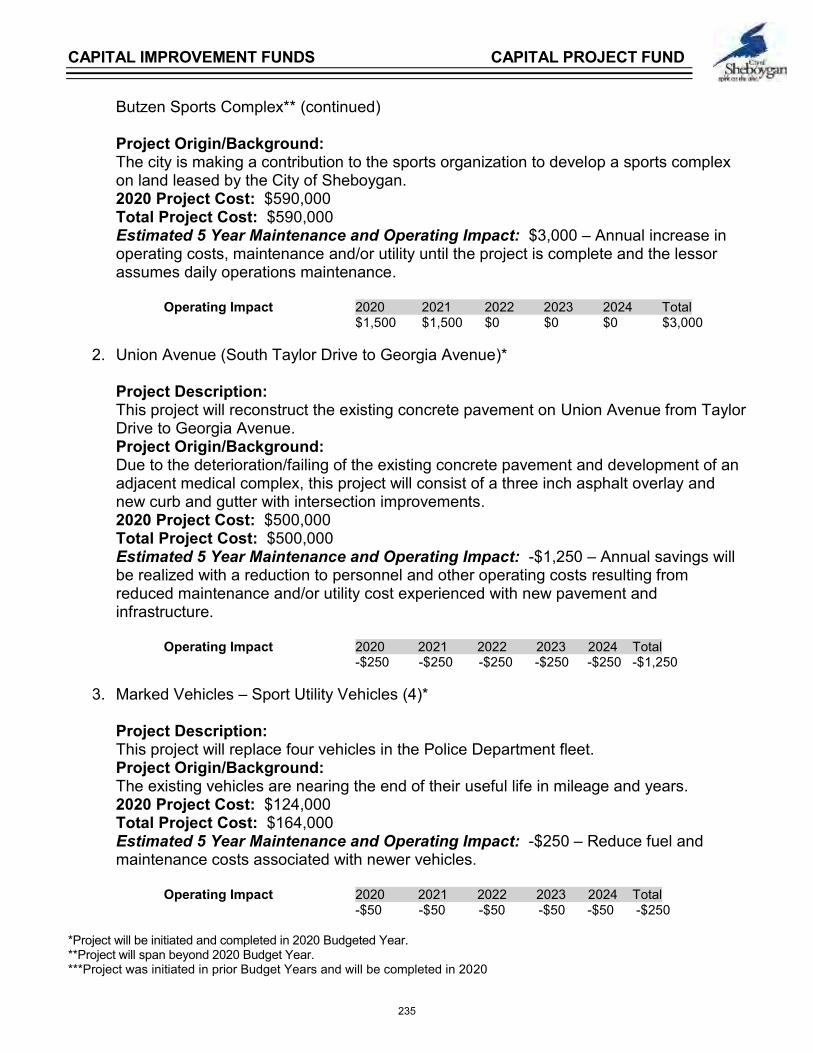
CAPITAL IMPROVEMENT FUNDS CAPITAL PROJECT FUND
Butzen Sports Complex** (continued) Project Origin/Background: The city is making a contribution to the sports organization to develop a sports complex on land leased by the City of Sheboygan. 2020 Project Cost: $590,000 Total Project Cost: $590,000 Estimated 5 Year Maintenance and Operating Impact: $3,000 – Annual increase in operating costs, maintenance and/or utility until the project is complete and the lessor assumes daily operations maintenance. Operating Impact 2020 2021 2022 2023 2024 Total $1,500 $1,500 $0 $0 $0 $3,000
2. Union Avenue (South Taylor Drive to Georgia Avenue)* Project Description: This project will reconstruct the existing concrete pavement on Union Avenue from Taylor Drive to Georgia Avenue. Project Origin/Background: Due to the deterioration/failing of the existing concrete pavement and development of an adjacent medical complex, this project will consist of a three inch asphalt overlay and new curb and gutter with intersection improvements. 2020 Project Cost: $500,000 Total Project Cost: $500,000 Estimated 5 Year Maintenance and Operating Impact: -$1,250 – Annual savings will be realized with a reduction to personnel and other operating costs resulting from reduced maintenance and/or utility cost experienced with new pavement and infrastructure. Operating Impact 2020 2021 2022 2023 2024 Total -$250 -$250 -$250 -$250 -$250 -$1,250
3. Marked Vehicles – Sport Utility Vehicles (4)* Project Description: This project will replace four vehicles in the Police Department fleet. Project Origin/Background: The existing vehicles are nearing the end of their useful life in mileage and years. 2020 Project Cost: $124,000 Total Project Cost: $164,000 Estimated 5 Year Maintenance and Operating Impact: -$250 – Reduce fuel and maintenance costs associated with newer vehicles. Operating Impact 2020 2021 2022 2023 2024 Total -$50 -$50 -$50 -$50 -$50 -$250
*Project will be initiated and completed in 2020 Budgeted Year. **Project will span beyond 2020 Budget Year. ***Project was initiated in prior Budget Years and will be completed in 2020
235

CAPITAL IMPROVEMENT FUNDS CAPITAL IMPROVEMENT FUND
Fund Purpose To account for the expenditures associated with capital projects funded through borrowing. Fund Description The Capital Improvement Fund serves to administer expenditures of capital projects included in the review process of the Capital Improvements Commission and funded through General Obligation Bonds. This program is administered by the Finance Department. 2020 Budget Highlights The Adopted Budget includes the following changes:
See project listing below.
Revenues 2017 Actual
2018 Actual
2019 Amended
2019 Estimated
2020 Adopted
Intergovernmental Revenue 600,000 31,899 0 0 0 Miscellaneous Revenue 5,000,000 10,324,971 5,412,126 5,205,370 3,580,546
Total Revenues 5,600,000 10,374,870 5,412,126 5,207,370 3,580,546
Expenditures 2017 Actual
2018 Actual
2019 Amended
2019 Estimated
2020 Adopted
Non-Personal Services 304,350 107,618 32,615 0 0 Capital Outlay 3,839,050 9,578,343 5,349,703 5,650,853 3,334,546 Intergovernmental Transfers 949,000 949,000 1,097,000 1,097,000 246,000
Total Expenditures 5,092,399 10,634,961 6,479,318 6,747,853 3,580,546 Significant Capital Projects The following is a list of the projects for 2020:
1. Superior Avenue (North 29th Street to North Taylor Drive)* Project Description: This project will reconstruct concrete pavement on Superior Avenue from North 29th Street to Taylor Drive. Project Origin/Background: The complete urban reconstruction involves new concrete pavement, sidewalk, curb and gutter, new street lighting and an upgraded trunk storm sewer. 2020 Project Cost: $1,000,000 Total Project Cost: $2,000,000 Estimated 5 Year Maintenance and Operating Impact: -$1,250 – Annual savings will be realized with a reduction to personnel and/or utility cost experienced with new pavement and infrastructure. Operating Impact 2020 2021 2022 2023 2024 Total -$250 -$250 -$250 -$250 -$250 -$1,250
* Project will be initiated and completed in 2020 Budgeted Year. **Project will span beyond 2020 Budget Year. ***Project was initiated in prior Budget Years and will be completed in 2020.
236

CAPITAL IMPROVEMENT FUNDS CAPITAL IMPROVEMENT FUND
2. Roof Replacement - Transit Administration Building*
Project Description: This improvement involves the replacement of the roof on the Transit Administration Building. Project Origin/Background: The roof on the Transit Administration Building is over 40 years old, requiring replacement. Nearly half of the project cost is funded by a federal grant. 2020 Project Cost: $399,494 - net city cost Total Project Cost: $750,000 Estimated 5 Year Maintenance and Operating Impact: -$2,500 – A reduction in maintenance and utility cost will be realized as a result of new infrastructure. Operating Impact 2020 2021 2022 2023 2024 Total -$500 -$500 -$500 -$500 -$500 -$2,500
3. Geele Avenue (Calumet Drive to North 23rd Street)* Project Description: This project will resurface pavement on Geele Avenue from Calumet Drive to North 23rd Street. Project Origin/Background: This resurfacing involves new pavement surface, sidewalk, curb and gutter, and an upgraded storm sewer. 2020 Project Cost: $397,250 Total Project Cost: $700,000 Estimated 5 Year Maintenance and Operating Impact: -$1,250 – Annual savings will be realized with a reduction to personnel and/or utility cost experienced with new pavement and infrastructure. Operating Impact 2020 2021 2022 2023 2024 Total -$250 -$250 -$250 -$250 -$250 -$1,250
4. Georgia Avenue (South Ninth Street to South 14th Street)* Project Description: This project will resurface Georgia Avenue from South Ninth Street to South 14th Street. Project Origin/Background: This resurfacing involves new pavement surface, sidewalk, curb and gutter, and an upgraded storm sewer. 2020 Project Cost: $354,000 Total Project Cost: $354,000
* Project will be initiated and completed in 2020 Budgeted Year. **Project will span beyond 2020 Budget Year. ***Project was initiated in prior Budget Years and will be completed in 2020.
237

CAPITAL IMPROVEMENT FUNDS CAPITAL IMPROVEMENT FUND
4. Georgia Avenue (South Ninth Street to South 14th Street)* - continued
Estimated 5 Year Maintenance and Operating Impact: -$1,250 – Annual savings will be realized with a reduction to personnel and/or utility cost experienced with new pavement and infrastructure.
Operating Impact 2020 2021 2022 2023 2024 Total -$250 -$250 -$250 -$250 -$250 -$1,250
5. Fire Station Number Two Repair*** Project Description: This improvement involves necessary repairs to Fire Station Number Two. Project Origin/Background: The City contracted with ZS, LLC for an assessment report on the repairs needed at Fire Station 2. This project will occur in three phases. 2020 Project Cost: $317,644 Total Project Cost: $656,144 Estimated 5 Year Maintenance and Operating Impact: $-2,500 – Updates will improve operating efficiencies, reduce maintenance and energy costs. Operating Impact 2020 2021 2022 2023 2024 Total -$500 -$500 -$500 -$500 -$500 -$2,500
6. Police Facility HVAC Upgrade and Secure Entry System* Project Description: This project provides necessary upgrades to the HVAC and facility entry system. Project Origin/Background: The existing HVAC system and entry system at the Police Department Facility requires upgrades for to extend the longevity of the building and provide adequate security. 2020 Project Cost: $195,000 Total Project Cost: $195,000 Estimated 5 Year Maintenance and Operating Impact: -$200 savings in maintenance or utility costs. Operating Impact 2020 2021 2022 2023 2024 Total -$40 -$40 -$40 -$40 -$40 -$200 * Project will be initiated and completed in 2020 Budgeted Year. **Project will span beyond 2020 Budget Year. ***Project was initiated in prior Budget Years and will be completed in 2020.
238

CAPITAL IMPROVEMENT FUNDS INDUSTRIAL PARK FUND
Fund Purpose To account for the expenditures associated with the industrial park. Fund Description The Industrial Park Fund serves to administer expenditures associated with an industrial park developed by the City of Sheboygan in the 1980’s. Currently, the available land is 150 acres resulting from additional land purchased in 2018 for expansion. The industrial park has been rebranded as SouthPointe Enterprise Campus. This program is administered by the Department of City Development. 2020 Budget Highlights There are no notable changes in 2020.
Revenues 2017 Actual
2018 Actual
2019 Amended
2019 Estimated
2020 Adopted
Taxes 7,000 7,000 7,000 0 0 Miscellaneous Revenue 718,614 503,435 7,500 20,000 12,000
Total Revenues 725,611 510,435 14,500 20,000 12,000
Expenditures 2017 Actual
2018 Actual
2019 Amended
2019 Estimated
2020 Adopted
Non-Personal Services 36,630 0 0 0 0 Capital Outlay 445,484 631 1,768 1,768 0 Intergovernmental Transfers 7,086 4,669 7,817 6,000 6,000
Total Expenditures 489,200 5,301 9,585 7,768 6,000 Strategic Plan Focus Area: Economic Development. Goal: To provide a business park where businesses can locate and expand. Objective: 1. To sell land at a rate of 10 acres annually. 2. To encourage business park businesses to collectively construct 50,000 square feet of building space annually.
239

CAPITAL IMPROVEMENT FUNDS TID 6 CAPITAL PROJECT FUND
Fund Purpose To account for the expenditures associated with TID 6 eligible expenditures. Fund Description The TID 6 Capital Project Fund serves to administer expenditures associated with the revitalization of the Harbor Centre area. The eligible expenditure period ends in December, 2017. This program is administered by the Department of City Development. 2020 Budget Highlights Not applicable.
Revenues 2017 Actual
2018 Actual
2019 Amended
2019 Estimated
2020 Adopted
Other Financing Sources 997,819 0 0 0 0 Total Revenues 997,819 0 0 0 0
Expenditures 2017 Actual
2018 Actual
2019 Amended
2019 Estimated
2020 Adopted
Non-Personal Services 819,744 0 0 0 0 Capital Outlay 280,135 0 0 0 0
Total Expenditures 1,099,879 0 0 0 0 Strategic Plan Focus Area: Governing and Fiscal Management. Goal: To maximize expenditures recovered through increment. Objective: 1. To maintain updated schedules of eligible dates.
240

CAPITAL IMPROVEMENT FUNDS TID 12 CAPITAL PROJECT FUND
Fund Purpose To account for the expenditures associated with TID 12 eligible expenditures. Fund Description The TID 12 Capital Project Fund serves to administer expenditures associated with the revitalization of Niagara Avenue which included a downtown office building. The eligible expenditure period ends in February, 2022. This program is administered by the Department of City Development. 2020 Budget Highlights There are no notable changes for 2020.
Revenues 2017 Actual
2018 Actual
2019 Amended
2019 Estimated
2020 Adopted
Miscellaneous Revenue 0 338 0 0 0 Other Financing Sources 300,000 0 0 0 0
Total Revenues 300,000 338 0 0 0
Expenditures 2017 Actual
2018 Actual
2019 Amended
2019 Estimated
2020 Adopted
Capital Outlay 305,829 0 9,305 0 0 Total Expenditures 305,829 0 9,305 0 0
Strategic Plan Focus Area: Governing and Fiscal Management. Goal: To maximize expenditures recovered through increment. Objective: 1. To maintain updated schedules of eligible dates.
241

CAPITAL IMPROVEMENT FUNDS TID 14 CAPITAL PROJECT FUND
Fund Purpose To account for the expenditures associated with TID 14 eligible expenditures. Fund Description The TID 14 Capital Project Fund serves to administer expenditures associated with the revitalization of Taylor Heights development which includes the Meijer development. The eligible expenditure period ends in January, 2026. This program is administered by the Department of City Development. 2020 Budget Highlights No notable changes in 2020.
Revenues 2017 Actual
2018 Actual
2019 Amended
2019 Estimated
2020 Adopted
Miscellaneous Revenue 0 783,670 50,000 50,000 0 Other Financing Sources 33,700 0 0 735,000 0
Total Revenues 33,700 783,670 50,000 785,000 0
Expenditures 2017 Actual
2018 Actual
2018 Amended
2019 Estimated
2020 Adopted
Non-Personal Services 13,517 47,948 0 0 0 Capital Outlay 0 1,052,813 449,540 401,840 57,000
Total Expenditures 13,517 1,100,761 449,540 401,840 57,700
Strategic Plan Focus Area: Governing and Fiscal Management. Goal: To maximize expenditures recovered through increment. Objective: 1. To maintain updated schedules of eligible dates.
242

CAPITAL IMPROVEMENT FUNDS TID 16 CAPITAL PROJECT FUND
Fund Purpose To account for the expenditures associated with TID 16 eligible expenditures. Fund Description The TID 16 Capital Project Fund serves to administer expenditures associated with the project plan of the development of market rate housing in downtown Sheboygan as well as public improvements. The district was created in 2015 and the eligible expenditure period ends in December, 2029. This program is administered by the Department of City Development. 2020 Budget Highlights The Adopted Budget includes the following change:
See project listing below.
Revenues 2017 Actual
2018 Actual
2019 Amended
2019 Estimated
2020 Adopted
Intergovernmental Revenue 250,000 0 0 0 0 Miscellaneous Revenue 605,796 577,361 171,400 0 171,400 Other Financing Sources 0 0 0 247,311 0
Total Revenues 855,796 577,361 171,400 247,311 171,400
Expenditures 2017 Actual
2018 Actual
2019 Amended
2019 Estimated
2020 Adopted
Personal Services 12,729 0 0 0 0 Non-Personal Services 2,265,455 7,475 0 25,092 17,592 Capital Outlay 1,005,080 390,085 575,875 637,933 209,400
Total Expenditures 3,283,264 397,559 575,875 663,026 226,992 Strategic Plan Focus Area: Governing and Fiscal Management. Goal: To maximize expenditures recovered through increment. Objective: 1. To maintain updated schedules of eligible dates. Significant Capital Projects
1. Street Lighting LED Upgrade** Project Description: This project involves replaces and upgrade of current light poles to Lumec LED light poles in the downtown. Project Origin/Background: A multi-year project to upgrade aging Sternberg light poles. 2020 Project Cost: $171,400 Total Project Cost: $857,000 Estimated 5 Year Maintenance and Operating Impact: -$18,500 – A cost savings of $3,700 annually in utility costs will be realized. Operating Impact 2020 2021 2022 2023 2024 Total $-3,700 $-3,700 $-3,700 $-3,700 $-3,700 -$18,500
* Project will be initiated and completed in 2020 Budgeted Year. **Project will span beyond 2020 Budget Year. ***Project was initiated in prior Budget Years and will be completed in 2020.
243
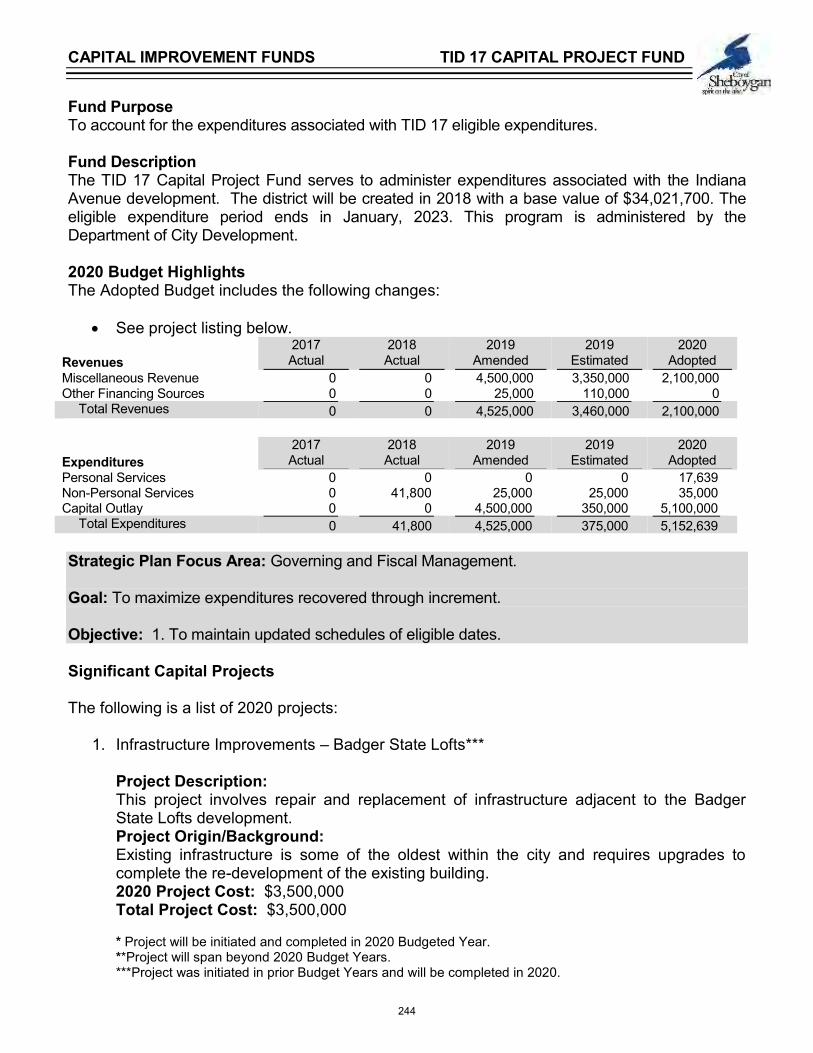
CAPITAL IMPROVEMENT FUNDS TID 17 CAPITAL PROJECT FUND
Fund Purpose To account for the expenditures associated with TID 17 eligible expenditures. Fund Description The TID 17 Capital Project Fund serves to administer expenditures associated with the Indiana Avenue development. The district will be created in 2018 with a base value of $34,021,700. The eligible expenditure period ends in January, 2023. This program is administered by the Department of City Development. 2020 Budget Highlights The Adopted Budget includes the following changes:
See project listing below.
Revenues 2017 Actual
2018 Actual
2019 Amended
2019 Estimated
2020 Adopted
Miscellaneous Revenue 0 0 4,500,000 3,350,000 2,100,000 Other Financing Sources 0 0 25,000 110,000 0
Total Revenues 0 0 4,525,000 3,460,000 2,100,000
Expenditures 2017 Actual
2018 Actual
2019 Amended
2019 Estimated
2020 Adopted
Personal Services 0 0 0 0 17,639 Non-Personal Services 0 41,800 25,000 25,000 35,000 Capital Outlay 0 0 4,500,000 350,000 5,100,000
Total Expenditures 0 41,800 4,525,000 375,000 5,152,639 Strategic Plan Focus Area: Governing and Fiscal Management. Goal: To maximize expenditures recovered through increment. Objective: 1. To maintain updated schedules of eligible dates. Significant Capital Projects The following is a list of 2020 projects:
1. Infrastructure Improvements – Badger State Lofts*** Project Description: This project involves repair and replacement of infrastructure adjacent to the Badger State Lofts development. Project Origin/Background: Existing infrastructure is some of the oldest within the city and requires upgrades to complete the re-development of the existing building. 2020 Project Cost: $3,500,000 Total Project Cost: $3,500,000 * Project will be initiated and completed in 2020 Budgeted Year. **Project will span beyond 2020 Budget Years. ***Project was initiated in prior Budget Years and will be completed in 2020.
244

CAPITAL IMPROVEMENT FUNDS TID 17 CAPITAL PROJECT FUND
1. Infrastructure Improvements – Badger State Lofts*** - continued
Estimated 5 Year Maintenance and Operating Impact: -$1,250 – Annual savings will be realized with a reduction to personnel and operating costs resulting from reduced maintenance and/or utility cost experienced with new pavement and infrastructure. Operating Impact 2020 2021 2022 2023 2024 Total -$250 -$250 -$250 -$250 -$250 -$1,250
2. Indiana Avenue Trail Project – Phase 1***
Project Description: This project involves the acquisition of vacated railroad property to expand the Shoreland 400 trail. Project Origin/Background: This project extends westbound on Indiana Avenue from the former Sprecher property to South 13th Street, then southbound to South Business Drive and Union Avenue. Surveying work for this project was completed in 2019. 2020 Project Cost: $1,300,000 Total Project Cost: $1,350,000 Estimated 5 Year Maintenance and Operating Impact: $2,500 – Additional operating costs for snow removal and maintenance. Operating Impact 2020 2021 2022 2023 2024 Total $500 $500 $500 $500 $500 $2,500
3. Innovation District Surface Parking Lot*
Project Description: This project involves design and construction of a surface parking lot to serve the Innovation District. Project Origin/Background: The updated master plan for the Innovation District includes a surface parking lot in lieu of construction of a parking structure. 2020 Project Cost: $300,000 Total Project Cost: $300,000 Estimated 5 Year Maintenance and Operating Impact: $2,500 – Additional operating costs for snow removal and maintenance. Operating Impact 2020 2021 2022 2023 2024 Total $500 $500 $500 $500 $500 $2,500 * Project will be initiated and completed in 2020 Budgeted Year. **Project will span beyond 2020 Budget Years. ***Project was initiated in prior Budget Years and will be completed in 2020.
245

CAPITAL IMPROVEMENT FUNDS TID 18 CAPITAL PROJECT FUND
Fund Purpose To account for the expenditures associated with TID 18 eligible expenditures. Fund Description The TID 18 Capital Project Fund serves to administer expenditures associated with the expansion of SouthPointe Enterprise Campus. The district was created in 2018 with a base value of $12,444,400 and the eligible expenditure period ends in January, 2023. This program is administered by the Department of City Development. 2020 Budget Highlights There are notable changes for 2020.
Revenues 2017 Actual
2018 Actual
2019 Amended
2019 Estimated
2020 Adopted
Miscellaneous Revenue 0 13,988,474 600,000 235,001 0 Total Revenues 0 13,988,474 600,000 235,001 0
Expenditures 2017 Actual
2018 Actual
2019 Amended
2019 Estimated
2020 Adopted
Personal Services 4,816 22,173 36,517 36,517 51,265 Non-Personal Services 491,785 591,952 34,400 25,274 35,000 Capital Outlay 67 12,905,954 1,578,373 1,278,373 0
Total Expenditures 496,668 13,520,080 1,649,290 1,340,164 86,265 Strategic Plan Focus Area: Governing and Fiscal Management. Goal: To maximize expenditures recovered through increment. Objective: 1. To maintain updated schedules of eligible dates.
246

CAPITAL IMPROVEMENT FUNDS TID 19 CAPITAL PROJECT FUND
Fund Purpose To account for the expenditures associated with TID 19 eligible expenditures. Fund Description The TID 19 Capital Project Fund serves to administer expenditures associated with the redevelopment of the west side of the Sheboygan River. The boundaries associated with this area are Pennsylvania Avenue north to Niagara Avenue and the Sheboygan River west to North 15th Street. The district was created in 2018 with a base value of $3,399,200. The eligible expenditure period ends in January, 2024. This program is administered by the Department of City Development. 2020 Budget Highlights The Adopted Budget includes the following change:
See project listing below.
Revenues 2017 Actual
2018 Actual
2019 Amended
2019 Estimated
2020 Adopted
Miscellaneous Revenue 0 0 60,000 440,000 600,000 Other Financing Sources 0 0 0 450,000 0
Total Revenues 0 0 60,000 890,000 600,000
Expenditures 2017 Actual
2018 Actual
2019 Amended
2019 Estimated
2020 Adopted
Personal Services 0 0 0 0 17,639 Non-Personal Services 0 362,970 60,000 75,937 0 Capital Outlay 0 0 0 483,712 500,000
Total Expenditures 0 362,970 60,000 559,649 517,639 Strategic Plan Focus Area: Governing and Fiscal Management. Goal: To maximize expenditures recovered through increment. Objective: 1. To maintain updated schedules of eligible dates. Significant Capital Projects The following is a list of the projects for 2020:
1. Niagara Avenue Reconstruction*** Project Description: This project involves design and construction of Niagara Avenue east of North 14th Street to Commerce Street, excluding sanitary sewer reconstruction costs. Project Origin/Background: This project is necessary resulting from redevelopment of the adjacent area. 2020 Project Cost: $500,000 Total Project Cost: $546,000 Estimated Year Maintenance and Operating Impact: -$1,250 – Annual savings will be realized with a reduction to personnel and operating cost resulting from reduced maintenance and/or utility cost experienced with new pavement and infrastructure. Operating Impact 2020 2021 2022 2023 2024 Total -$250 -$250 -$250 -$250 -$250 -$1,250 * Project will be initiated and completed in 2020 Budgeted Year. **Project will span beyond 2020 Budget Years. ***Project was initiated in prior Budget Years and will be completed in 2020.
247

CITY OF SHEBOYGAN
NOTES
248

PROPRIETARY FUNDS BUDGET SUMMARY
2017 2018 2019 2019 2020Actual Actual Amended Estimated Adopted
Revenue
Taxes 511,562 511,576 511,547 511,547 516,662
Licenses and Permits 31,800 34,600 34,200 30,700 30,700
Intergovernmental Revenue 3,471,718 3,389,061 3,849,794 3,497,114 3,786,219
Intergovernmental Charges for Services 8,682,245 9,399,934 8,955,000 8,579,035 9,081,868
Charges for Services 16,878,734 18,636,235 19,198,586 19,096,530 20,928,466
Fines and Forfeitures 18,388 0 5,000 5,000 5,000
Miscellaneous Revenue 1,136,157 1,128,362 1,479,822 969,367 1,382,930
Other Financing Sources 959,015 954,877 1,107,499 1,106,300 257,026
Total Revenue 31,689,618 34,054,644 35,141,448 33,795,593 35,988,871
Expenditures
General Government 8,765,077 8,798,016 9,833,896 8,987,017 9,235,520
Public Safety 0 0 0 0 0
Public Works 14,941,419 15,628,962 17,928,326 17,297,661 20,215,575
Health and Human Services 0 0 0 0 0
Culture and Recreation 2,929 3,764 2,682 1,482 3,038
Conservation and Development 7,086 9,329 7,817 7,796 7,996
Transfers and other expenses 7,089,999 7,492,542 7,268,193 7,166,187 7,291,501
Total Expenditures 30,806,511 31,932,613 35,040,914 33,460,143 36,753,631
Excess of revenues over (under) expenditures 883,108 2,122,032 100,534 335,450 -764,760
*
Net Position, Beginning Year 86,007,204 85,924,256 88,046,287 88,046,287 88,381,737
*Accounting principle change
Net Position, Ending Year 86,890,312 88,046,287 88,146,821 88,381,737 87,616,977
249

PROPRIETARY FUNDS MOTOR VEHICLE FUND
Fund Purpose To acquire and maintain 146 major pieces of equipment and approximately 150 pieces of secondary equipment for the Department of Public Works to a high degree of readiness as economically as possible. Fund Description The Motor Vehicle Fund accounts for rental charges of each piece of equipment on a monthly basis to city departments. Included in the rental rate is the replacement cost of the vehicle over its life cycle including interest, fuel charges and operational expenses of vehicle maintenance. The Motor Vehicle Division has the responsibility of maintaining the vehicles for the other divisions of the Public Works Department as well as the Fire Department. This program is administered by the Department of Public Works. 2020 Budget Highlights The Adopted Budget includes in the following changes:
An increase in Equipment Rental Charges of $181,402 to financially support purchases for equipment replenishment. A decrease of $851,000 in borrowed funds (Interfund Transfer) as part of a multi-year strategy to reduce the Motor Vehicle Fund’s reliance on borrowed fund to meet its mission.
Permanent Staffing 2017 Actual
2018 Actual
2019 Amended
2019 Estimated
2020 Adopted
Equipment Service Supervisor 1.00 1.00 1.00 1.00 1.00 Maintenance Worker V 0.00 1.00 1.00 1.00 1.00 Maintenance Worker IV 6.00 3.00 3.00 3.00 3.00 Maintenance Worker II 1.00 1.00 1.00 1.00 1.00
Total Staffing 8.00 6.00 6.00 6.00 6.00
Revenues 2017 Actual
2018 Actual
2019 Amended
2019 Estimated
2020 Adopted
Charges for Services 1,811,338 1,814,594 1,815,220 1,815,220 1,996,622 Miscellaneous Revenue 110,083 100,284 83,000 83,000 226,000 Other Financing Sources 949,000 949,000 1,097,000 1,097,000 246,000
Total Revenues 2,870,421 2,863,879 2,995,220 2,995,220 2,468,622
Expenditures 2017 Actual
2018 Actual
2017 Amended
2019 Estimated
2020 Adopted
Personal Services 531,296 527,749 544,664 526,920 543,766 Non-Personal Services 970,033 964,634 988,910 988,550 1,010,990 Capital Outlay 585 3,562 505,103 224,177 0 Intergovernmental Transfers 125,000 125,000 125,000 125,000 125,000 Depreciation 833,047 910,640 833,047 833,047 833,047
Total Expenditures 2,459,961 2,531,585 2,996,724 2,697,694 2,512,803 Strategic Plan Focus Area: Infrastructure and Public Facilities. Goal: Ensure equipment is adequately supplied and maintained in a cost effective manner. Objective: 1. Maintain an 85% completion rate on equipment preventative maintenance.
250

PROPRIETARY FUNDS MOTOR VEHICLE FUND
Measurements
2017 Actual
2018 Actual
2019 Amended
2019 Estimated
2020 Adopted
Workload Preventive maintenance
completion rate 65.5% 69.3% 85.0% 96.0% 85.0%
Age of fleet (Years) 9.7 9.2 9.5 9.5 9.5 Significant Capital Projects The following is a list of the projects for 2020:
1. Single Axle Dump Truck* Project Description: This improvement replaces a single axle truck with slide-in salter/spray bar. Project Origin/Background: The current 14 year old International model 7400 is older and requires more maintenance. 2020 Project Cost: $235,000 Total Project Cost: $235,000 Estimated 5 Year Maintenance and Operating Impact: -$30,000 – Reduced operating costs, i.e. maintenance or utility savings, during the initial year. Operating Impact 2020 2021 2022 2023 2024 Total -$30,000 -$0 -$0 -$0 -$0 -$30,000
2 Replacement Dump Box and Salter* Project Description: This improvement replaces a dump box slide-in salter. Project Origin/Background: The current equipment is nearing the end of its working lifetime. The equipment is used in first response in snow and ice removal as well as in road repair and construction. 2020 Project Cost: $85,000 Total Project Cost: $85,000 Estimated 5 Year Maintenance and Operating Impact: -$15,500 – Reduced operating costs increasing over the five-year period as a result of a significant decrease in maintenance related expenses with this new equipment. Operating Impact 2020 2021 2022 2023 2024 Total -$1,500 -$2,500 -$3,500 -$3,500 -$5,000 - $15,500
* Project will be initiated and completed in 2020 Budgeted Year. **Project will span beyond 2020 Budget Year. ***Project was initiated in prior Budget Years and will be completed in 2020.
251

PROPRIETARY FUNDS HEALTH INSURANCE FUND
Fund Purpose To provide qualified employees, retirees and their families a health insurance plan that provides coverage in the event medical care is needed, and a program that complies with the requirements of the Affordable Care Act. Fund Description The City of Sheboygan provides a self-insured, health insurance program, administered through UMR, a third-party administrator (“TPA”). The benefit costs are shared with the employees. This program is administered by the Human Resources Department. 2020 Budget Highlights The Adopted Budget includes the following change:
A decrease of $229,000 in HSA Contributions to employees.
Revenues 2017 Actual
2018 Actual
2019 Amended
2019 Estimated
2020 Adopted
Charges for Services 6,037,898 6,608,964 6,863,265 6,729,710 6,770,405 Miscellaneous Revenue 40,726 66,925 50,000 50,000 40,000
Total Revenues 6,078,624 6,675,889 6,913,265 6,779,710 6,810,405
Expenditures 2017 Actual
2018 Actual
2019 Amended
2019 Estimated
2020 Adopted
Personal Services 124,005 128,261 154,379 139,676 146,778 Non-Personal Services 7,090,980 7,316,926 7,405,737 6,609,900 6,881,100
Total Expenditures 7,214,984 7,445,187 7,560,116 6,749,576 7,027,878 Strategic Plan Focus Area: Governing and Fiscal Management. Goal: To ensure quality employee and labor relations services. Objective: 1. Review policies and procedures for relevancy, outlined expectations and
consistent execution. 2. Analyze benefit vendors for optimal quality of service, location for our
employees, and competitive pricing. 3. Monitor reliability and affordability of service for customers. 4. Research, evaluate and pursue additional funding opportunities through
partnerships, relationships and grants.
252

PROPRIETARY FUNDS LIABILITY INSURANCE FUND
Fund Purpose To accurately maintain charges to departments for general liability insurance coverage. Fund Description The city contracts for general liability insurance for all city buildings, automobiles and contractor’s equipment, as well as boiler coverage, monies and securities, flood coverage and umbrella coverage. Premiums payments are recorded as prepaid insurance and charged monthly to the appropriate funds and departments. This program is administered by the Finance Department. 2020 Budget Highlights There are no notable changes in 2020.
Revenues 2017 Actual
2018 Actual
2019 Amended
2019 Estimated
2020 Adopted
Intergovernmental Revenue 258,621 230,470 525,200 180,000 410,000 Miscellaneous Revenue 64,414 65,032 63,000 95,999 73,889
Total Revenues 323,035 295,502 588,200 275,999 483,889
Expenditures 2017 Actual
2018 Actual
2018 Amended
2019 Estimated
2020 Adopted
Non-Personal Services 265,788 175,942 588,200 284,500 484,436 Total Expenditures 265,788 175,942 588,200 284,500 484,436
Strategic Plan Focus Area: Governing and Fiscal Management. Goal: To provide a guarantee of compensation for specified loss, and damage in return for payment of premiums. Objective:1. To receive the best coverage at reasonable prices.
253

PROPRIETARY FUNDS WORKERS COMPENSATION FUND
Fund Purpose To provide employees a reputable workers compensation program that assists in the training and prevention of injuries, as well as a program that navigates the process in the event of a workers compensation injury. Fund Description The City of Sheboygan partners with Cities and Villages Mutual Insurance Company (“CVMIC) to provide employees with workers compensation insurance that is compliant with state and federal regulations. This program is administered by the Human Resources Department. 2020 Budget Highlights There are no notable changes for 2020.
Revenues 2017 Actual
2018 Actual
2019 Amended
2019 Estimated
2020 Adopted
Intergovernmental Revenue 610,360 610,752 610,000 610,000 610,000 Miscellaneous Revenue 13,884 29,622 13,871 13,871 13,871
Total Revenues 624,244 640,374 623,871 623,871 623,871
Expenditures 2017 Actual
2018 Actual
2019 Amended
2019 Estimated
2020 Adopted
Personal Services 139,975 94,109 140,640 143,321 146,228 Non-Personal Services 318,151 264,998 509,000 509,000 509,000
Total Expenditures 458,126 359,107 649,640 652,321 655,228 Strategic Plan Focus Area: Governing and Fiscal Management.
Goal: To ensure quality employee and labor relations services.
Objective: 1. Review policies and procedures for relevancy, outlined expectations and consistent execution.
2. Analyze benefit vendors for optimal quality of service, location for our employees, and competitive pricing.
3. Monitor reliability and affordability of service for customers. 4. Research, evaluate and pursue additional funding opportunities through
partnerships, relationships and grants.
254

PROPRIETARY FUNDS INFORMATION TECHNOLOGY FUND
Applications Infrastructure
Total Employees 5.00 Fund Purpose: To provide products and services that meet the requirements of the City of Sheboygan, the affiliated organizations, and the public in such a manner that is easy to understand, access, and use. Fund Description: As a customer service based, and quality focused department, the Information Technology Department provides a vibrant infrastructure, an integrated tool set of applications and information access services to support current and future technology goals and the strategic plan focus areas of the City of Sheboygan. This program is administered by the Information Technology Department. 2020 Budget Highlights The Adopted Budget includes the following changes:
A decrease of 1.00 FTE Network Administrator position (6 months) for a cost savings of $56,045 in Personal Services.
An increase of $55,685 in Revenues - Charges for Services resulting from increased charges for internal support services.
An increase of Capital Outlay – Other Equipment of $100,000 for the purchase of a Digital Evidence Storage Solution.
Permanent Staffing 2017 Actual
2018 Actual
2019 Amended
2019 Estimated
2020 Adopted
IT Director 1.00 1.00 1.00 1.00 1.00 Systems Analyst 2.00 2.00 2.00 2.00 2.00 Network Administrator 1.00 1.00 2.00 1.00 1.00 PC Specialist 1.00 1.00 1.00 1.00 1.00
Total Staffing 5.00 5.00 6.00 5.00 5.00
Revenues 2017 Actual
2018 Actual
2019 Amended
2019 Estimated
2020 Adopted
Intergovernmental Revenue 0 0 8,116 24,348 8,116 Charges for Services 853,477 880,618 936,625 936,625 992,310
Information Technology
Administrator
255

PROPRIETARY FUNDS INFORMATION TECHNOLOGY FUND
Revenues - continued 2017 Actual
2018 Actual
2019 Amended
2019 Estimated
2020 Adopted
Miscellaneous Revenue 6,946 18,587 6,000 6,000 6,000 Total Revenues 860,423 899,205 950,741 966,973 1,006,426
Expenditures 2017 Actual
2018 Actual
2019 Amended
2019 Estimated
2020 Adopted
Personal Services 503,621 539,109 648,153 597,612 584,657 Non-Personal Services 284,973 280,894 327,612 355,438 358,321 Capital Outlay 37,513 777 60,175 347,570 125,000 Depreciation 24,958 50,794 24,958 50,794 50,794
Total Expenditures 851,137 871,574 1,060,898 1,351,414 1,118,772
Strategic Plan Focus Area: Governing and Fiscal Management. Goal: To deliver technical services in a timely manner. Objective: 1. Close all Critical/High IT Help Request tickets within a 5 day window.
Measurements
2017 Actual
2018 Actual
2019 Amended
2019 Estimated
2020 Adopted
Workload Average days to close for
critical/high IT help request types
N/A 4.8 5 5 5
Efficiency Percent of IT help request N/A 75% 90% 90% 90% Strategic Plan Focus Area: Governing and Fiscal Management. Goal: Keep technology components current. Objective: 1. Maintain the firmware and software on all core servers and network switches to be the most current level or one revision back from what is publicly available.
Measurements
2017 Actual
2018 Actual
2019 Amended
2019 Estimated
2020 Adopted
Workload Core servers/network switches
maintained N/A 98% 100% 100% 100%
Strategic Plan Focus Area: Governing and Fiscal Management. Goal: To reduce the areas of risk where a security breach may occur. Objective: 1. Deploy the FortiClient anti-virus on city computers. 2. Conduct regular security assessments by an outside firm. 3. Implement SANS top 20 Security Controls.
256

PROPRIETARY FUNDS INFORMATION TECHNOLOGY FUND
Measurements
2017 Actual
2018 Actual
2019 Amended
2019 Estimated
2020 Adopted
Workload Percentage of antivirus
software installed 100% 100% 100% 100% 100%
Number of security assessments performed
Number of SANS Security Controls Implemented
2
N/A
2
N/A
2
6
1
6
2
12
Strategic Plan Focus Area: Governing and Fiscal Management. Goal: To provide employees and residents access to city applications. Objective: Provide availability of 99 percent.
Measurements
2017 Actual
2018 Actual
2019 Amended
2019 Estimated
2020 Adopted
Workload System availability N/A 97% 99% 99% 99.5% Significant Capital Projects The following is a list of the projects for 2020:
1. Digital Evidence Storage Solution*
Project Description: This project will allow video to be stored on an enterprise system with reduced costs. Project Origin/Background: Video storage is accomplished by utilizing several applications. The additional capacity is getting increasingly more costly. This solution will reduce costs and consolidate storage. 2020 Project Cost: $100,000 Total Project Cost: $100,000 Estimated 5 Year Maintenance and Operating Impact: $0 – No additional personnel and other operating costs, i.e. maintenance or utility as this is an entirely new storage solution. Operating Impact 2020 2021 2022 2023 2024 Total $0 $0 $0 $0 $0 $0
* Project will be initiated and completed in 2020 Budgeted Year. **Project will span beyond 2020 Budget Year. ***Project was initiated in prior Budget Years and will be completed in 2020.
257

PROPRIETARY FUNDS WATER UTILITY FUND
Administration Infrastructure
Total Employees 31.00 Fund Purpose: To provide potable water, exceeding all standards, to the community at an economical price. Fund Description: This program is administered by the Water Utility. Under governance by the Board of Waterworks Commissioners, the Sheboygan Water Utility is a public utility regulated by the Wisconsin Public Service Commission. The Utility performs several core activities: Water Treatment:
The Water Treatment Plant, located at 72 Park Avenue, produces all of the potable water for Sheboygan, Sheboygan Falls and Kohler. On average, more than 15 million gallons of water are produced per day. Increased consumption in summer requires production of up to 27 million gallons of water. The treatment process includes conventional flocculation/coagulation/sedimentation followed by filtration and ultraviolet disinfection.
Water Distribution:
The Utility maintains and operates the municipal water distribution system. This consists of more than 205 miles of water mains; 3,000 valves; 2,000 fire hydrants; three booster stations; and six storage tanks or reservoirs. Staff performs water main design and record-keeping on system components using the latest GIS technology. Staff installs some water main projects and performs emergency repairs around the clock.
Water Metering:
Staff manages all aspects of 19,252 water meters for both residential and industrial customers, including reading, installation, testing, repair, and cross connections.
Billing and Collecting:
Staff performs billing, account maintenance and collections for approximately 19,000 accounts, including water, sanitary sewer, and garbage collection charges.
2020 Budget Highlights The 2020 Approved Budget includes the following change:
Board of Water Commissioners
Water Utility
258

PROPRIETARY FUNDS WATER UTILITY FUND
An increase of $54,120 in Personal Services resulting from the addition of 1.00 FTE Distribution Technician.
Permanent Staffing 2017 Actual
2018 Actual
2019 Amended
2019 Estimated
2020 Approved
Superintendent 1.00 1.00 1.00 1.00 1.00 Utility Accountant 1.00 1.00 1.00 1.00 1.00 Distribution Supervisor 1.00 1.00 1.00 1.00 1.00 Operations Supervisor 1.00 1.00 1.00 1.00 1.00 Customer Relations/Fiscal
Supervisor 1.00 1.00 1.00 1.00 1.00 Utility Engineer 1.00 1.00 1.00 1.00 1.00 Engineer Technician 1.00 1.00 1.00 1.00 1.00 Lead Distribution Technician 0.00 0.00 1.00 1.00 1.00 Distribution Technician 6.00 6.00 5.00 5.00 6.00 Lead Operations Technician 1.00 1.00 1.00 1.00 1.00 Operator 5.00 5.00 5.00 5.00 5.00 Operations Technician 2.00 2.00 2.00 2.00 2.00 Utility Support Specialist 4.00 4.00 4.00 4.00 4.00 Lab Technician 1.00 1.00 1.00 1.00 1.00 Lead Service Technician 1.00 1.00 1.00 1.00 1.00 Service Technician 3.00 3.00 3.00 3.00 3.00
Total Staffing 30.00 30.00 30.00 30.00 31.00
Revenues 2017 Actual
2018 Actual
2019 Amended
2019 Estimated
2020 Approved
Charges for Services 8,484,209 9,094,682 8,735,000 8,469,035 9,061,868 Intergovernmental Revenue 198,036 305,252 220,000 110,000 20,000 Miscellaneous Revenue 435,658 303,793 826,000 220,486 233,940
Total Revenues 9,117,903 9,703,727 9,781,000 8,799,521 9,315,808
Expenditures 2017 Actual
2018 Actual
2019 Amended
2019 Estimated
2020 Approved
Personal Services 3,285,879 3,579,377 3,475,238 3,572,310 3,665,011 Non-Personal Services 3,536,026 3,640,188 3,765,139 3,572,003 4,899,614 Debt Service 301,998 365,872 335,000 334,452 308,362
Total Expenditures 7,123,903 7,585,437 7,575,377 7,478,765 8,872,986
Significant Capital Projects The following is a list of the projects for 2020:
1. Water Mains * Project Description: This project includes the ongoing replacement of aging, critical water distribution infrastructure according to the general guidelines of the Wisconsin Public Service Commission.
* Project will be initiated and completed in 2020 Budgeted Year. **Project will span beyond 2020 Budget Year. ***Project was initiated in prior Budget Years and will be completed in 2020.
259

PROPRIETARY FUNDS WATER UTILITY FUND
1. Water Mains* - continued Project Origin/Background: This project serves to replace aging water distribution infrastructure. 2020 Project Cost: $1,275,000 Total Project Cost: $1,275,000 Estimated 5 Year Maintenance and Operating Impact: -$1,250 – Annual savings will be realized with a reduction to personnel and operating cost resulting from reduced maintenance and/or utility cost experienced with new infrastructure. Operating Impact 2020 2021 2022 2023 2024 Total -$250 -$250 -$250 -$250 -$250 -$1,250
2. Georgia Avenue Reservoir Painting* Project Description: This project will restore the surface of the Georgia Avenue Reservoir. Project Origin/Background: The steel tank structure needs to be stripped to the bare metal surface and be re-coated to extend the life of the reservoir. 2020 Project Cost: $700,000 Total Project Cost: $700,000 Estimated 5 Year Maintenance and Operating Impact: -$500 – Annual savings will be realized with a reduction to personnel and operating cost resulting from reduced maintenance and/or utility cost experienced with new infrastructure. Operating Impact 2020 2021 2022 2023 2024 Total -$100 -$100 -$100 -$100 -$100 -$500
3. Gateway Drive Water Tower Painting* Project Description: This project will restore the surface of the Gateway Drive Water Tower. Project Origin/Background: The steel tank structure needs to be stripped to the bare metal surface and be re-coated to extend the life of the Water Tower. 2020 Project Cost: $600,000 Total Project Cost: $600,000 Estimated 5 Year Maintenance and Operating Impact: -$500 – Annual savings will be realized with a reduction to personnel and operating cost resulting from reduced maintenance and/or utility cost experienced with new infrastructure. Operating Impact 2020 2021 2022 2023 2024 Total -$100 -$100 -$100 -$100 -$100 -$500
* Project will be initiated and completed in 2020 Budgeted Year. **Project will span beyond 2020 Budget Year. ***Project was initiated in prior Budget Years and will be completed in 2020.
260

PROPRIETARY FUNDS RECYCLING UTILITY FUND
Total Employees: 2.00
Fund Purpose To protect public health and the environment by providing reliable and cost efficient recycling collection and disposal services through sustainable and fiscally responsible recovery practices. Fund Description The Recycling Utility Fund accounts for the activity of the curbside collection of recyclable materials banned from land filling by the State of Wisconsin DNR. This program is administered by the Public Works Department. This fund is new in 2020. 2020 Budget Highlights This fund is new in 2020.
Permanent Staffing 2017 Actual
2018 Actual
2019 Amended
2019 Estimated
2020 Adopted
Maintenance Worker II 0 0 0 0 2 Total Staffing 0 0 0 0 2
Revenues 2017 Actual
2018 Actual
2019 Amended
2019 Estimated
2020 Adopted
Intergovernmental Revenue 0 0 0 0 86,035 Charges for Services 0 0 0 0 809,968 Miscellaneous Revenue 0 0 0 0 296,000 Total Revenues 0 0 0 0 1,192,003
Expenditures 2017 Actual
2018 Actual
2019 Amended
2019 Estimated
2020 Adopted
Personal Services 0 0 0 0 232,822 Non-Personal Services 0 0 0 0 985,304
Total Expenditures 0 0 0 0 1,218,127 Strategic Plan Focus Areas: Infrastructure and Public Facilities. Quality of Life. Goal: To enrich life through a clean community and resource recovery. Objective: 1. Maintain environmental compliance below regulatory requirements. 2. Operate the recycling system in a sustainable, fiscally responsible manner. 3. Effectively use innovative conservation leadership, and recovery expertise to
reduce the amount of waste in landfill disposal. 4. Achieve maximum collection levels on recyclable waste. 5. To achieve a rating of 80% or higher satisfaction (average, good or excellent)
rating from residents who live in the City of Sheboygan.
Recycling Utility Fund
Operations
261

PROPRIETARY FUNDS RECYCLING UTILITY FUND
Measurements
2017 Actual
2018 Actual
2019 Amended
2019 Estimated
2020 Adopted
Effectiveness Recycling collected (Tons) 3,037 4,138 3,000 3,000 3,000 Material recovery rate 27% 28% 30% 30% 30% Resident satisfaction rating 80% 80% 80% 80% 80% Significant Capital Projects The following is a list of the projects for 2020:
1. Automated Recycling Collection Vehicles***
Project Description: Transitioning into the Automated Garbage and Recycling Collection Program in May, 2020. Project Origin/Background: Due to industry standards and best practices current collection methods are cost effective. 2020 Project Cost: $1,097,000 Total Project Cost: $1,097,000 Estimated 5 Year Maintenance and Operating Impact: $1,051,266 - This program includes costs for operations maintenance, fuel, and depreciation as well as future replacement cost. Operating Impact 2020 2021 2022 2023 2024 Total $200,000 $205,000 $210,125 $215,378 $220,763 $1,051,266
* Project will be initiated and completed in 2020 Budgeted Year. **Project will span beyond 2020 Budget Year. ***Project was initiated in prior Budget Years and will be completed in 2020.
262

PROPRIETARY FUNDS WASTEWATER UTILITY FUND
Total Employees: 15.00
Fund Purpose To protect public health and the environment by providing reliable and cost efficient wastewater collection and treatment services through sustainable and fiscally responsible resource recovery practices. Fund Description The Wastewater Utility Fund accounts for the activity of the Sheboygan Regional Wastewater Treatment Plant (WWTP), which is owned by the City of Sheboygan and operated by the Department of Public Works. It provides wastewater collection and treatment for the City of Sheboygan, City of Sheboygan Falls, Village of Kohler, Town of Sheboygan, Town of Wilson, and portions of Town of Sheboygan Falls and Lima. This program is administered by the Public Works Department. 2020 Budget Highlights The Adopted Budget includes the following changes:
An increase of $6,000 in Laboratory Supplies to purchase a new still to ensure production of laboratory grade water.
A decrease of $35,000 in Hauling Services due to improved dryer operation. An increase of $5,000 in Electrical Maintenance and Repair to eliminate an obsolete
motor control center. A net decrease of $700,000 Replacement Costs. An increase of $333,516 in Sewer Service charges to area communities to more
accurately reflect allocation of costs.
Permanent Staffing 2017 Actual
2018 Actual
2019 Amended
2019 Estimated
2020 Adopted
Superintendent 1.00 1.00 1.00 1.00 1.00 Industrial- Wastewater Supervisor 1.00 1.00 1.00 1.00 1.00 Environmental Engineer 1.00 1.00 1.00 1.00 1.00 Maintenance Supervisor 1.00 1.00 1.00 1.00 1.00 Process System/OPCO 1.00 1.00 1.00 1.00 1.00 Electromechanical Technician 1.00 1.00 1.00 1.00 1.00 Laboratory Technician 1.00 1.00 1.00 1.00 1.00 Plant Maintenance Mechanic 3.00 3.00 3.00 3.00 3.00 Operator III 1.00 1.00 1.00 2.00 2.00 Operator I 1.00 1.00 1.00 2.00 2.00 Engineering Technician 1.00 1.00 1.00 1.00 1.00
Administration & Plant
Compliance
Wastewater Utility
Pretreatment Plant Operations &
Pump/Lift Stations
Energy Conservation
263

PROPRIETARY FUNDS WASTEWATER UTILITY FUND
Permanent Staffing - continued
2017 Actual
2018 Actual
2019 Amended
2019 Estimated
2020 Adopted
Clerk IV/ Administrative Assistant 0.00 1.00 1.00 1.00 1.00 Clerk/Typist 1.00 0.00 0.00 0.00 0.00 Total Staffing 13.00 13.00 13.00 15.00 15.00
Revenues 2017 Actual
2018 Actual
2019 Amended
2019 Estimated
2020 Adopted
Licenses and Permits 31,800 34,600 34,200 30,700 30,700 Charges for Services 7,081,497 8,285,471 8,496,600 8,512,600 9,258,136 Miscellaneous Revenue 194,427 287,437 167,137 201,521 199,727 Total Revenues 7,307,724 8,607,508 8,697,937 8,744,821 9,488,563
Expenditures 2017 Actual
2018 Actual
2019 Amended
2019 Estimated
2020 Adopted
Personal Services 2,074,624 2,062,124 2,268,176 2,224,943 2,291,583 Non-Personal Services 3,301,546 3,469,557 3,722,751 3,695,415 3,757,481 Capital Outlay 567,445 715,583 1,945,772 1,818,557 1,875,000 Interest 213,849 216,262 233,118 195,878 400,631 Intergovernmental Transfers 225,000 225,000 225,000 225,000 325,000 Depreciation 1,125,361 736,843 1,125,362 1,125,362 1,125,362
Total Expenditures 7,507,824 8,288,072 9,520,179 9,285,155 9,775,057 Strategic Plan Focus Areas: Infrastructure and Public Facilities. Quality of Life. Goal: To enrich life through clean water and resource recovery. Objective: 1. Maintain environmental compliance below regulatory requirements. 2. Operate the wastewater system in a sustainable, fiscally responsible manner. 3. Effectively use innovative engineering, conservation leadership, and recovery
expertise to produce clean water. 4. Evaluate wastewater infrastructure (collection system and treatment facilities) for
areas of insufficiency and develop and action plan to correct and improve areas of concern.
5. Develop and implement a 20-year facility plan and a five-year capital improvements plan to address the maintenance needs of the wastewater treatment facility and collection system and plan for future regulatory requirements.
6.To achieve a rating of 80% or higher satisfaction (average, good or excellent) rating from residents who live in the City of Sheboygan.
Measurements
2017 Actual
2018 Actual
2019 Amended
2019 Estimated
2020 Adopted
Effectiveness Resident satisfaction rating 96% 92% 80% 92% 80% Strategic Plan Focus Area: Infrastructure and Public Facilities. Goal: Maintain environmental compliance below the regulations of the Wisconsin Department of Natural Resources (WDNR) and the facility’s Wisconsin Pollution Discharge Elimination System (WPDES) permit limits.
264

PROPRIETARY FUNDS WASTEWATER UTILITY FUND
Objective: 1. Maintain compliance with the WWTP’s WPDES Permit and achieve zero
violations.
Measurements
2017 Actual
2018 Actual
2019 Amended
2019 Estimated
2020 Adopted
Effectiveness Number of violations of WPDES
permit limits 0 1 0 0 0
Strategic Plan Focus Area: Infrastructure and Public Facilities. Goal: Provide and maintain the wastewater infrastructure (collection system and treatment facilities) to achieve compliance with all environmental regulations. Objective: 1. Achieve a Compliance Maintenance Annual Report (CMAR) score of A (range is
A-D).
Measurements
2017 Actual
2018 Actual
2019 Amended
2019 Estimated
2020 Adopted
Effectiveness CMAR score A B A A A Significant Capital Projects The following is a list of the projects for 2020:
1. Sewer Line Reconstruction/Relining Program**
Project Description: Ongoing annual sanitary server maintenance program. Project Origin/Background: Maintenance includes lining sanitary sewers or relays sanitary sewer repairs. 2020 Project Cost: $750,000 Total Project Cost: $750,000 Estimated 5 Year Maintenance and Operating Impact: -$2,500 – Annual savings will be realized with a reduction in personnel and operating cost resulting from reduced maintenance and/or utility cost experienced with new infrastructure. Operating Impact 2020 2021 2022 2023 2024 Total -$500 -$500 -$500 -$500 -$500 -$2,500
* Project will be initiated and completed in 2020 Budgeted Year. **Project will span beyond 2020 Budget Year. ***Project was initiated in prior Budget Years and will be completed in 2020.
265

PROPRIETARY FUNDS WASTEWATER UTILITY FUND
2. Anaerobic Digestion Cover*
Project Description: Improvements are required to aging infrastructure. Project Origin/Background: This project includes rebuilding the floating cover on the secondary digester number six. 2020 Project Cost: $450,000 Total Project Cost: $450,000 Estimated 5 Year Maintenance and Operating Impact: -$500 – Annual savings will be realized with a reduction in personnel and operating cost resulting from reduced maintenance and/or utility cost experienced with new infrastructure. Operating Impact 2020 2021 2022 2023 2024 Total -$100 -$100 -$100 -$100 -$100 -$500
3. Digester Heat Exchangers*
Project Description: The existing heat exchangers are obsolete and require replacement. Project Origin/Background: The existing equipment is 28 years old. The tubes can be replaced but the fittings are corroded and no longer adequately seal. 2020 Project Cost: $150,000 Total Project Cost: $150,000 Estimated 5 Year Maintenance and Operating Impact: -$2,500 – Operating costs for energy will experience a reduction due to the installation of a more efficient heat exchanger. Operating Impact 2020 2021 2022 2023 2024 Total -$500 -$500 -$500 -$500 -$500 -$2,500 4. Digester System Infrastructure*
Project Description: The roof in the east digester complex is experiencing water leaks. Project Origin/Background: The original roof was installed in 1978 and leaks during rain events. Efforts were made to repair, but the roof is past the point where repairs are effective. 2020 Project Cost: $100,000 Total Project Cost: $100,000 Estimated 5 Year Maintenance and Operating Impact: -$500 – Operating cost saving would include reduced repair costs and damage expenses for replacement items. Operating Impact 2020 2021 2022 2023 2024 Total -$100 -$100 -$100 -$100 -$100 -$500
* Project will be initiated and completed in 2020 Budgeted Year. **Project will span beyond 2020 Budget Year. ***Project was initiated in prior Budget Years and will be completed in 2020.
266

PROPRIETARY FUNDS TRANSIT UTILITY FUND
Paratransit Bus Operations
Maintenance Fixed Route Bus Operations
Total Employees: 51.45
Purpose To provide the Sheboygan Urbanized Area with a safe, reliable, affordable and courteous alternative to transportation to increase the quality of life and complement economic growth. Fund Description Shoreline Metro is a fixed route public transit system servicing a metropolitan area of 70,000 including the cities of Sheboygan and Sheboygan Falls and the Village of Kohler. Annually, over 530,000 rides are provided covering over 500,000 service miles on 11 fixed routes and five school day “tripper” routes. Metro Connection, a division of Shoreline Metro, provides demand-responsive trips to individuals with disabilities or over 60 years of age. Over 37,000 rides are provided annually covering over 150,000 miles. This program is administered by the Transit Utility. 2020 Budget Highlights There are no notable changes in 2020.
Permanent Staffing 2017 Actual
2018 Actual
2019 Amended
2019 Estimated
2020 Adopted
Director 0.70 0.70 0.70 0.70 0.70 Operations Supervisor 2.00 2.00 2.00 2.00 2.00 SET Supervisor 0.00 0.00 0.00 1.00 1.00 Lead Support–ADA Coordinator 2.00 2.00 2.00 1.00 1.00 Lead Dispatcher 1.00 1.00 1.00 1.00 1.00 Fill-In Dispatcher 1.00 1.00 1.00 1.00 1.00 Lead Mechanic 1.00 1.00 1.00 1.00 1.00 Administrative Coordinator 1.00 1.00 1.00 1.00 1.00 Fixed Route Operator 28.00 28.00 28.00 28.00 28.00 Paratransit Operator 12.00 12.00 12.00 12.00 12.00 Hostler 1.25 1.25 1.50 1.50 1.50 Cleaner 1.25 1.25 1.25 1.25 1.25
Total Staffing 51.20 51.20 51.45 51.45 51.45
Revenues 2017 Actual
2018 Actual
2019 Amended
2019 Estimated
2020 Adopted
Taxes 511,547 511,547 511,547 511,547 516,662 Intergovernmental Revenue 2,602,736 2,547,839 2,706,478 2,682,766 2,672,068 Charges for Services 772,933 673,550 709,901 724,900 704,900 Fines and Forfeitures 18,388 0 5,000 5,000 5,000
Administration
Department of Transit
267

PROPRIETARY FUNDS TRANSIT UTILITY FUND
Revenues - continued 2017 Actual
2018 Actual
2019 Amended
2019 Estimated
2020 Adopted
Miscellaneous Revenue 126,317 164,420 127,232 159,595 159,595 Total Revenues 4,031,923 3,897,357 4,060,128 4,083,808 4,058,225
Expenditures 2017 Actual
2018 Actual
2019 Amended
2019 Estimated
2020 Adopted
Personal Services 2,964,240 2,932,437 3,028,525 3,014,909 3,064,593 Non-Personal Services 966,146 929,944 1,035,525 886,834 996,484 Capital Outlay 0 81 0 0 0 Depreciation 352,204 235,856 355,597 355,597 355,597
Total Expenditures 4,282,590 4,098,318 4,419,647 4,257,340 4,416,674 Strategic Plan Focus Areas: Infrastructure and Public Facilities. Quality of Life. Goal: To provide an exceptional public transit service that is safe, reliable and affordable for customers and encourages a stronger economy for employers and their employees, residents and visitors alike. Objective: 1. To review policies and procedures for relevancy, outlined expectations and consistent execution. 2. To analyze productivity of routes and forecast future demands and trends. 3. To monitor reliability and affordability of service for customers. 4. To evaluate route productivity for employment purposes and monitor economic changes and employment habits of customers. 5. To research, evaluate and pursue additional funding opportunities through
partnerships, relations and grants. 6.To achieve a rating of 80% or higher satisfaction (fair, good or excellent) rating
from residents who live in the City of Sheboygan.
Shoreline Metro - Measurements 2017 Actual
2018 Actual
2019 Amended
2019 Estimated
2020 Adopted
Workload Revenue trips 529,726 599,714 540,000 625,000 640,000 Revenue miles 543,561 536,426 550,000 540,000 540,000 Revenue hours 37,679 38,611 37,000 38,000 38,000 Efficiency Trips per revenue hour 14.11 15.55 14.50 17.00 18.00 Expense per revenue hour $84.00 $100.61 $82.00 $100.00 $100.00 Cost per revenue trip $6.00 $6.47 $6.50 $6.22 $6.00 Effectiveness Resident satisfaction rating 91% 91% 80% 96% 96%
Metro Connection - Measurements
2017 Actual
2018 Actual
2019 Amended
2019 Estimated
2020 Adopted
Workload Revenue trips 35,589 34,658 36,000 35,000 35,000 Revenue miles 155,464 163,145 155,000 160,000 160,000 Revenue hours 12,539 12,761 12,000 12,800 12,800 Efficiency Trips per revenue hour 2.84 2.72 2.75 2.75 2.75 Expense per revenue hour $60.63 $60.10 $60.00 $60.00 $62.00 Cost per revenue trip $21.35 $22.13 $21.00 $22.25 $23.00
268

PROPRIETARY FUNDS PARKING UTILITY FUND
Total Employees: 2.30
Fund Purpose To provide convenient, affordable and reliable parking solutions for residents and visitors. Fund Description The Parking Utility is under the authority of the Sheboygan Transit Commission and is a division of the Transit and Parking Department. The Parking Utility maintains all public parking in downtown, Riverfront, South Pier and Heritage Square including on- and off-street metered, reserved parking and off-street free parking options. The Parking Utility maintains over 15 public parking lots, 20 blocks of on-street parking meters, 100 off-street parking meters, several acres of lawn maintenance at the Industrial Park, weed control in downtown, and flower planter watering and maintenance. This program is administered by the Transit Department. 2020 Budget Highlights There are no notable changes for 2020.
Permanent Staffing 2017 Actual
2018 Actual
2019 Amended
2019 Estimated
2020 Adopted
Director 0.30 0.30 0.30 0.30 0.30 Parking Lead Worker I 1.00 1.00 1.00 1.00 1.00
Maintenance Worker I 1.00 1.00 1.00 1.00 1.00 Total Staffing 2.30 2.30 2.30 2.30 2.30
Revenue 2017 Actual
2018 Actual
2019 Amended
2019 Estimated
2020 Adopted
Taxes 15 16 0 0 0 Charges for Services 259,170 315,854 311,475 311,475 330,125 Miscellaneous Revenue 139,869 92,071 139,682 134,995 130,008 Other Financing Sources 10,015 5,877 10,499 9,300 11,026
Total Revenues 409,069 413,821 461,656 455,770 471,159
Expenditures 2017 Actual
2018 Actual
2019 Amended
2019 Estimated
2020 Adopted
Personal Services 181,427 191,732 197,466 198,716 197,082 Non-Personal Services 240,132 230,782 239,721 270,715 240,085 Capital Outlay 20,731 3,635 33,000 34,000 34,000 Depreciation 9,532 11,347 22,000 22,000 22,000
Total Expenditures 451,822 437,496 492,187 525,431 493,167
Parking Utility
Administration
Operations
269

PROPRIETARY FUNDS PARKING UTILITY FUND
Strategic Plan Focus Area: Economic Development. Goal: To work with other departments, city leaders and businesses to provide parking options that are attractive, convenient, reliable and affordable for customers. Objective: 1. To inspect blighted areas and create an improvement plan. 2. To monitor reliability, affordability and convenience of parking for customers. 3. To evaluate habits of customers and create action plan according to needs.
Measurements
2017 Actual
2018 Actual
2019 Amended
2019 Estimated
2020 Adopted
Workload Dollars spent per parking stall $298 $192 $200 $200 $200
270

PROPRIETARY FUNDS BOAT FACILITIES FUND
Fund Purpose: To provide quality marine mooring and dockage facilities to the general public located along the Sheboygan River downstream from the Eighth Street Bridge. Fund Description: The Boat Facilities Division of the Department of Public Works is responsible for the installation and removal of 60+ docks annually. This division also covers maintenance and repairs to dock facilities as well as utility costs to provide water and electric to boats. The majority of this work is contracted with a firm that has provided these services for several years. This program is administered by the Public Works Department. 2020 Budget Highlights There are no notable changes in 2020.
Revenues 2017 Actual
2018 Actual
2019 Amended
2019 Estimated
2020 Adopted
Taxes 0 13 0 0 0 Charges for Services 62,421 57,185 65,500 66,000 66,000 Miscellaneous Revenue 3,834 189 3,900 3,900 3,900
Total Revenues 66,255 57,387 69,400 69,900 69,900
Expenditures 2017 Actual
2018 Actual
2019 Amended
2019 Estimated
2020 Adopted
Non-Personal Services 156,883 87,874 144,456 144,456 145,012 Depreciation 33,491 55,021 33,491 33,491 33,491
Total Expenditures 190,374 142,895 177,947 177,947 178,503 Strategic Plan Focus Area: Infrastructure and Public Facilities. Goal: Continue improving the quality of life by providing the community quality boat facilities along the Sheboygan Riverfront. Maintain and repair any defects prior to installation. Objective: 1. Maintain boat docks and repair any defects prior to installation.
2. Maintain 50% lease agreement occupancy and a 50% level of dock availability for transient occupancy.
Measurements
2017 Actual
2018 Actual
2019 Amended
2019 Estimated
2020 Adopted
Workload Effectiveness Repair Requests 3 3 3 3 3 Occupancy rate of boat docks 80% 80% 50% 50% 50%
271

CITY OF SHEBOYGAN
NOTES
272

FIDUCIARY FUNDSBUDGET SUMMARY
2017 2018 2019 2019 2020Actual Actual Amended Estimated Adopted
Revenue
Taxes 0 0 0 0 0
Licenses and Permits 0 0 0 0 0
Intergovernmental Revenue 0 0 0 0 0
Intergovernmental Charges for Services 0 0 0 0 0
Charges for Services 11,611 14,836 9,400 9,400 9,400
Fines and Forfeitures 0 0 0 0 0
Miscellaneous Revenue 165,529 512,912 24,000 30,500 30,500
Other Financing Sources 0 0 0 0 0
Total Revenue 177,140 527,747 33,400 39,900 39,900
Expenditures
General Government 0 0 0 0 0
Public Safety 0 0 0 0 0
Public Works 0 0 0 0 0
Health and Human Services 13,334 16,898 750 750 1,000
Culture and Recreation 312,409 91,420 0 230,000 150,000
Conservation and Development 0 0 0 0 0
Transfers and other expenses 55 922 1,250 15,000 15,000
Total Expenditures 325,797 109,241 2,000 245,750 166,000
Excess of revenues over (under) expenditures -148,657 418,507 31,400 -205,850 -126,100
Fund Balance, Beginning Year 2,175,632 2,026,975 2,445,482 2,445,482 2,239,632
Fund Balance, Ending Year 2,026,975 2,445,482 2,476,882 2,239,632 2,113,532
273

FIDUCIARY FUNDS CEMETERY PERPETUAL CARE FUND
Fund Purpose To account for the portion of the sale of lots for continuous care of Wildwood Cemetery. Fund Description The Cemetery Perpetual Care Fund accounts for the collection of the portion of lot sales retained by the city for continuous care of Wildwood Cemetery. The trust funds are invested at the State of Wisconsin Local Government Investment Pool. The annual interest earnings are transferred to the General Fund for maintenance of Wildwood Cemetery. This program is administered by the Finance Department. 2020 Budget Highlights There are no notable changes in 2020.
Revenues 2017 Actual
2018 Actual
2019 Amended
2019 Estimated
2020 Adopted
Charges for Services 11,611 14,836 9,400 9,400 9,400 Miscellaneous Revenue 9,164 34,856 8,500 15,000 15,000
Total Revenues 20,775 49,691 17,900 24,400 24,400
Expenditures 2017 Actual
2018 Actual
2019 Amended
2019 Estimated
2020 Adopted
Non-Personal Services Intergovernmental Transfers
12,138 1,250
16,570 1,250
750 1,250
750 15,000
1,000 15,000
Total Expenditures 13,388 17,820 2,000 15,750 16,000
274

FIDUCIARY FUNDS MEAD PUBLIC LIBRARY TRUST FUND
Fund Purpose To account for contributions to the Mead Public Library which is received with restrictions regarding use of funds. Fund Description The Trust Fund was established upon receipt of a donation from the Everhard-Forrer Trust, which included restrictions regarding the investment of the funds and utilization of the interest. In addition to the initial funds, other donations and estate gifts are received in this account. These additions may include restrictions regarding the funds’ addition to this investment account. The Mead Public Library Board of Trustees on August 25, 2016 changed the name of the funds from the Everhard-Forrer 850 funds to the Mead Public Library Trust Funds. The Mead Public Library Board controls the investment of the funds, along with the use of restricted principal and interest. 2020 Budget Highlights There are no notable changes for 2020.
Revenues 2017 Actual
2018 Actual
2019 Executive
2019 Estimated
2020 Adopted
Miscellaneous Revenue 156,365 478,054 15,500 15,500 15,500 Total Revenues 156,365 478,054 15,500 15,500 15,500
Expenditures 2017 Actual
2018 Actual
2019 Executive
2019 Estimated
2020 Adopted
Non-Personal Services 312,409 91,420 0 230,000 150,000 Total Expenditures 312,409 91,420 0 230,000 150,000
275

CITY OF SHEBOYGAN
NOTES
276

2018 2019 Amount PercentSheboygan County $5.66 $5.74 $0.08 1.4%Lakeshore Technical College $0.88 $0.90 $0.02 2.3%Sheboygan Area School Dist. $11.03 $11.08 $0.05 0.5%City of Sheboygan $9.91 $10.03 $0.12 1.2%Gross total $27.48 $27.75 $0.27 0.98%Less: State Credit ($1.97) ($1.90) $0.07 -3.55%Assessed Tax Rate* $25.51 $25.85 $0.34 1.33%Assessment Ratio 0.9048 0.8807 (0.02) -2.66%Equalized Rate* $23.08 $22.77 ($0.32) -1.37%
Lottery Credit $169.36 $192.00 $22.64 13.37%First Dollar Credit $69.74 $69.20 ($0.54) -0.77%
2018 2019 Amount PercentSheboygan County $5.66 $5.74 $0.08 1.4%Lakeshore Technical College $0.88 $0.90 $0.02 2.3%Kohler Area School Dist. $8.84 $9.31 $0.47 5.3%City of Sheboygan $9.91 $10.03 $0.12 1.2%Gross total $25.29 $25.98 $0.69 2.73%Less: State Credit -$1.97 -$1.90 $0.07 -3.55%Assessed Tax Rate* $23.32 $24.08 $0.76 3.26%Assessment Ratio 0.9048 0.8807 (0.02) -2.66%Equalized Rate* $21.10 $21.21 $0.11 0.51%
Lottery Credit $136.04 $161.81 $25.77 18.94%First Dollar Credit $56.02 $58.32 $2.30 4.11%
Assessed Tax Rate Changes
CITY OF SHEBOYGAN(SHEBOYGAN AREA SCHOOL DISTRICT)
Assessed Tax Rate Changes
(KOHLER AREA SCHOOL DISTRICT)
277

2017 2018 2019 2019 2020Actual Actual Amended Estimated Adopted
GENERAL FUND
GENERAL GOVERNMENTOffice of the Mayor Mayor 1.00 1.00 1.00 1.00 1.00 Administrative Assistant / Communications Specialist 1.00 1.00 1.00 1.00 1.00
Total Office of the Mayor 2.00 2.00 2.00 2.00 2.00No changes in 2020.
Office of the City Clerk City Clerk 1.00 1.00 1.00 1.00 1.00 Deputy City Clerk 0.81 1.00 1.00 1.00 1.00 Council/Licensing Clerk 1.00 1.00 1.00 1.00 1.00 Elections Specialist 0.75 0.75 0.75 0.75 0.75
Total Office of the City Clerk 3.56 3.75 3.75 3.75 3.75No changes in 2020.
Office of the City Administrator City Administrator 1.00 1.00 1.00 1.00 1.00 Budget Analyst 1.00 1.00 1.00 1.00 0.00 Assistant to the City Administrator 0.00 0.00 0.00 0.00 1.00
Total Office of the City Administrator 2.00 2.00 2.00 2.00 2.00No changes in 2020.
Finance Department Finance Director/Treasurer 1.00 1.00 1.00 1.00 1.00 Senior Accountant 0.00 0.00 0.00 1.00 1.00 Comptroller/Treasurer 1.00 0.00 0.00 0.00 0.00 Auditor/Analyst 1.00 1.00 1.00 1.00 1.00 Accountant 1.00 1.00 1.00 1.00 1.00 Accountant I 0.00 0.40 0.40 0.40 0.40 Clerk I 1.00 1.00 1.00 1.00 1.00 Confidential Secretary 1.00 0.00 0.00 0.00 0.00 Accounts Payable Clerk 0.00 1.00 1.00 1.00 1.00 Purchasing Agent 0.50 0.50 0.50 0.50 0.50
Total Finance Department 6.50 5.90 5.90 6.90 6.90No changes in 2020.
Human Resources Department Director of H.R. and Labor Relations 1.00 1.00 1.00 1.00 1.00 Payroll Administrator 1.00 1.00 1.00 1.00 1.00 Benefit Administrator / Analyst 1.00 1.00 1.00 1.00 1.00 Confidential Secretary 1.00 0.00 0.00 0.00 0.00 Human Resources Generalist 0.00 1.00 1.00 1.00 1.00 Accountant I 0.00 0.60 0.60 0.60 0.60
Total Human Resources Department 4.00 4.60 4.60 4.60 4.60No changes in 2020.
PERSONNEL SCHEDULEAUTHORIZED PERMANENT POSITIONS 2017 - 2020
278

2017 2018 2019 2019 2020Actual Actual Amended Estimated Adopted
PERSONNEL SCHEDULEAUTHORIZED PERMANENT POSITIONS 2017 - 2020
Office of the City Attorney City Attorney 1.00 1.00 1.00 1.00 1.00 Assistant City Attorney I 1.00 1.00 1.00 1.00 1.00 Assistant City Attorney II 0.00 0.00 0.40 0.40 0.40 Legal Assistant 2.00 2.00 2.00 2.00 2.00
Total City Attorney's Office 4.00 4.00 4.40 4.40 4.40No changes in 2020.
PUBLIC SAFETYPolice Department Chief 1.00 1.00 1.00 1.00 1.00 Captain 3.00 3.00 3.00 3.00 3.00 Lieutenant 4.00 4.00 4.00 4.00 4.00 Sergeant 9.00 9.00 9.00 9.00 9.00 Detective 7.00 7.00 7.00 7.00 7.00 Police Officer 59.00 59.00 59.00 59.00 59.00 Office Supervisor 1.00 1.00 1.00 1.00 1.00 Communication Technician 1.00 1.00 1.00 1.00 1.00 Court Services Secretary 2.00 2.00 2.00 2.00 2.00 Community Service Officer 1.00 1.00 1.00 1.00 1.00 Community Service Officer Trainee (FTE) 1.00 1.00 1.00 1.00 1.00 Record Specialist Clerk 8.00 8.00 8.00 8.00 8.00 Time System Coordinator 1.00 1.00 1.00 1.00 1.00 Department Secretary 2.00 2.00 2.00 2.00 2.00 Crime Analyst 1.00 1.00 1.00 1.00 1.00 Fleet Operation Mechanic 1.00 1.00 1.00 1.00 1.00 Property Officer 1.00 1.00 1.00 1.00 1.00 Digital Evidence Manager 1.00 1.00 1.00 1.00 1.00 MEG Unit Secretary 0.40 0.40 0.40 0.40 0.40
Total Police Department 104.40 104.40 104.40 104.40 104.40No changes in 2020.
Fire Department Chief 1.00 1.00 1.00 1.00 1.00 Assistant Fire Chief 1.00 1.00 1.00 1.00 2.00 Deputy Fire Chief 1.00 1.00 1.00 1.00 0.00 Battalion Chief 4.00 4.00 4.00 4.00 4.00 Captain 5.00 5.00 5.00 5.00 5.00 Lieutenant 10.00 10.00 10.00 10.00 10.00 Fire Equipment Operator 15.00 15.00 15.00 15.00 15.00 Firefighter 18.00 18.00 18.00 18.00 18.00 Firefighter/Paramedic 14.00 14.00 14.00 14.00 14.00 Administrative Coordinator/Supervisor 0.00 0.00 0.00 0.00 1.00 Confidential Secretary 1.00 1.00 1.00 1.00 0.00 Office Assistant 0.50 0.50 0.50 0.50 0.50
Total Fire Department 70.50 70.50 70.50 70.50 70.50No changes in 2020.
279

2017 2018 2019 2019 2020Actual Actual Amended Estimated Adopted
PERSONNEL SCHEDULEAUTHORIZED PERMANENT POSITIONS 2017 - 2020
Building Inspection Building/Housing Inspector 2.00 2.00 2.00 2.00 2.00 Electrical/Heating Inspector 1.00 1.00 1.00 1.00 1.00 Plumbing/Environmental Inspector 1.00 1.00 1.00 1.00 1.00 Housing/Environmental Inspector 1.00 1.00 1.00 0.00 0.00 Code Enforcement Officer 1.00 1.00 1.00 1.00 1.00 Building Inspection Specialist 1.00 1.00 1.00 1.00 1.00 Permit Clerk 1.00 1.00 1.00 1.00 1.00 Building Inspection Licensing Clerk 0.00 0.00 0.00 1.00 1.00
Total Building Inspection 8.00 8.00 8.00 8.00 8.00No changes in 2020.
PUBLIC WORKSDepartment of Public WorksAdministration Director of Public Works 1.00 1.00 1.00 1.00 1.00 Business Manager 0.00 0.00 0.00 0.00 1.00 Management Analyst 1.00 1.00 1.00 1.00 0.00 Clerk II 2.00 2.00 2.00 2.00 2.00
Total Public Works Administration 4.00 4.00 4.00 4.00 4.00
Engineering City Engineer 1.00 1.00 1.00 1.00 1.00 Civil Engineer / Project Manager 1.00 1.00 1.00 1.00 1.00 Assistant Engineer / Surveyor 1.00 1.00 1.00 1.00 1.00 Senior Engineering Technician 1.00 1.00 1.00 1.00 1.00 Engineering Technician 2.00 2.00 2.00 2.00 2.00 GIS Project Specialist 0.00 1.00 1.00 1.00 1.00
Total Engineering 6.00 7.00 7.00 7.00 7.00
Municipal Service Building Administration /Maintenance Superintendent - Facilities/Traffic 1.00 1.00 1.00 1.00 1.00 Leadman - Construction 1.00 1.00 1.00 1.00 1.00 Maintenance Worker V-Electric Lighting 1.00 1.00 1.00 1.00 1.00 Maintenance Worker V-Electric Signals 1.00 1.00 1.00 1.00 1.00 Maintenance Worker IV-Lead-Signs 1.00 1.00 1.00 1.00 1.00 Maintenance Worker III-Craftsman 3.00 3.00 3.00 3.00 3.00 Maintenance Worker II-Signs 1.00 1.00 1.00 3.00 3.00 Maintenance Worker II-City Hall 1.00 1.00 1.00 1.00 1.00 Maintenance Worker I-MSB 1.00 1.00 1.00 1.00 1.00 Maintenance Worker I-MSB 0.00 0.00 0.00 0.50 0.50
Total MSB Administration/Maintenance 11.00 11.00 11.00 13.50 13.50
Streets and Sanitation Superintendent - Streets/Sanitation 1.00 1.00 1.00 1.00 1.00 Supervisor - Streets/Sanitation 1.00 1.00 1.00 1.00 1.00 Maintenance Worker IV-Streets 1.00 1.00 1.00 4.00 4.00
280

2017 2018 2019 2019 2020Actual Actual Amended Estimated Adopted
PERSONNEL SCHEDULEAUTHORIZED PERMANENT POSITIONS 2017 - 2020
Streets and Sanitation - continued Maintenance Worker III-Streets 7.00 7.00 7.00 2.00 2.00 Maintenance Worker II-Streets 14.00 14.00 14.00 11.00 9.00 Maintenance Worker I-Streets 5.00 5.00 5.00 3.00 3.00 Maintenance Worker IV-Sanitation 1.00 1.00 1.00 1.00 1.00 Maintenance Worker III-Sanitation 8.00 8.00 8.00 8.00 8.00 Maintenance Worker IV-Sewer Maintenance 1.00 1.00 1.00 1.00 1.00 Maintenance Worker III-Sewer Maintenance 1.00 1.00 1.00 1.00 1.00 Maintenance Worker II-Sewer Maintenance 2.00 2.00 2.00 2.00 2.00 Maintenance Worker I-Sewer Maintenance 1.00 1.00 1.00 1.00 1.00 Maintenance Worker II-Street Sweeping 2.00 2.00 2.00 2.00 2.00
Total Streets and Sanitation 45.00 45.00 45.00 38.00 36.00
Parks and Cemetery Superintendent - Parks - Forestry 1.00 1.00 1.00 1.00 1.00 Forester 0.00 0.00 0.00 1.00 1.00 Maintenance Worker IV - Arborist 0.00 0.00 0.00 1.00 1.00 Maintenance Worker IV - Parks 1.00 1.00 1.00 2.00 2.00 Maintenance Worker III - Parks 6.00 6.00 6.00 6.00 6.00 Maintenance Worker II - Parks 6.00 6.00 6.00 6.00 6.00 Maintenance Worker I - Parks 3.00 3.00 3.00 0.00 0.00 Administrative Assistant 1.00 0.00 0.00 0.00 0.00
Total Parks and Cemetery 18.00 17.00 17.00 17.00 17.00Total Department of Public Works 84.00 84.00 84.00 79.50 77.50
2.00 FTE Streets and Sanitation Maintenance Worker II transferred to Recycling Utility Fund in 2020.
CULTURE AND RECREATIONSenior Services Director of Senior Services 0.00 0.00 0.00 1.00 1.00 Senior Center Supervisor 1.00 1.00 1.00 0.00 0.00 Assistant Supervisor 0.00 1.00 1.00 0.00 0.00 Coordinator 0.00 0.00 0.00 1.00 1.00 Wellness Coordinator 1.00 0.00 0.00 0.00 0.00 Custodian 0.28 0.28 0.28 0.28 0.28
Total Senior Services 2.28 2.28 2.28 2.28 2.28No changes in 2020.
CONSERVATION AND DEVELOPMENTPlanning and Development Director of Planning and Development 1.00 1.00 1.00 1.00 1.00 Planning/Zoning Manager 1.00 1.00 1.00 1.00 1.00 Community Development Planner 1.00 1.00 1.00 1.00 1.00 Neighborhood Development Planner 1.00 1.00 0.00 0.00 1.00 Community/Economic Development Planner 0.00 0.00 1.00 1.00 0.00 Grant Coordinator 0.00 0.00 0.00 0.00 1.00
Total Planning and Development 4.00 4.00 4.00 4.00 5.00The addition of a Grant Coordinator in 2020.
TOTAL GENERAL FUND 295.24 295.43 295.83 292.33 291.33
281

2017 2018 2019 2019 2020Actual Actual Amended Estimated Adopted
PERSONNEL SCHEDULEAUTHORIZED PERMANENT POSITIONS 2017 - 2020
SPECIAL REVENUE FUNDMead Public Library Director 1.00 1.00 1.00 1.00 1.00 Business Manager 1.00 1.00 1.00 1.00 1.00 Manager 2.00 2.00 2.00 2.00 2.00 Librarian II 2.00 0.00 0.00 0.00 0.00 Librarian I 4.75 0.00 0.00 0.00 0.00 Librarian 0.00 6.75 8.00 7.75 7.75 Page Supervisor 1.00 1.00 1.00 1.00 1.00 Maintenance Supervisor 1.00 1.00 0.00 0.00 0.00 Public Information Specialist II 1.00 1.00 0.00 0.00 0.00 IT Specialist 1.00 1.00 1.00 1.00 1.00 Communications Specialist 0.00 0.00 1.00 1.00 1.00 Maintenance Technician 0.00 0.00 2.00 2.00 2.00 Administrative Assistant/Volunteer Coordinator 0.00 0.00 1.00 1.00 1.00 Administrative Assistant I 1.00 1.00 0.00 0.00 0.00 Maintenance Technician I 1.00 1.00 0.00 0.00 0.00 Library Assistant III 5.00 5.00 0.00 0.00 0.00 Library Assistant II 1.00 1.00 0.00 0.00 0.00 Library Assistant I 5.75 5.75 0.00 0.00 0.00 Cataloger 0.00 0.00 3.00 3.00 3.00 Public Safety Specialist 0.00 0.00 1.00 1.00 1.00 Library Assistant 0.00 0.00 9.25 9.25 9.25 Cleaners 1.50 1.50 2.00 2.00 2.00 Library Page 9.50 9.50 6.50 6.50 6.50
Total Mead Public Library 39.50 39.50 39.75 39.50 39.50No changes in 2020
Municipal Court Municipal Court Judge 0.50 0.50 0.50 0.50 0.50 Municipal Court Clerk 1.00 1.00 1.00 1.00 1.00 Office Clerk 1.00 1.00 1.00 1.00 1.00
Total Municipal Court 2.50 2.50 2.50 2.50 2.50No changes in 2020.
Ambulance Firefighter/Paramedic 4.00 4.00 4.00 4.00 4.00
Total Ambulance 4.00 4.00 4.00 4.00 4.00No changes in 2020.
Cable Television TV Program Director 1.00 1.00 1.00 1.00 1.00 TV Production Technician 0.50 0.50 0.25 0.25 0.25
Total Cable Television 1.50 1.50 1.25 1.25 1.25No changes in 2020.
TOTAL SPECIAL REVENUE FUND 47.50 47.50 47.50 47.25 47.25
282

2017 2018 2019 2019 2020Actual Actual Amended Estimated Adopted
PERSONNEL SCHEDULEAUTHORIZED PERMANENT POSITIONS 2017 - 2020
PROPRIETARY FUNDSRecycling Utility Maintenance Worker II 0.00 0.00 0.00 0.00 2.00
Total Recycling Utility 0.00 0.00 0.00 0.00 2.00This fund is new in 2020.
Transit Utility Director 0.70 0.70 0.70 0.70 0.70 Operator Supervisor 2.00 2.00 2.00 2.00 2.00 SET Supervisor 0.00 0.00 0.00 1.00 1.00 Lead Support - ADA Coordinator 2.00 2.00 2.00 1.00 1.00 Lead Dispatcher 1.00 1.00 1.00 1.00 1.00 Fill-In Dispatcher 1.00 1.00 1.00 1.00 1.00 Lead Mechanic 1.00 1.00 1.00 1.00 1.00 Administrative Coordinator 1.00 1.00 1.00 1.00 1.00 Fixed Route Operator 28.00 28.00 28.00 28.00 28.00 Paratransit Operator 12.00 12.00 12.00 12.00 12.00 Hostler 1.25 1.25 1.50 1.50 1.50 Cleaner 1.25 1.25 1.25 1.25 1.25
Total Transit Utility 51.20 51.20 51.45 51.45 51.45No changes in 2020.
Parking Utility Director Parking and Transit 0.30 0.30 0.30 0.30 0.30 Lead Worker I 1.00 1.00 1.00 1.00 1.00 Maintenance Worker I 1.00 1.00 1.00 1.00 1.00
Total Parking Utility 2.30 2.30 2.30 2.30 2.30No changes in 2020.
Water Utility* Superintendent 1.00 1.00 1.00 1.00 1.00 Utility Accountant 1.00 1.00 1.00 1.00 1.00 Distribution Supervisor 1.00 1.00 1.00 1.00 1.00 Operations Supervisor 1.00 1.00 1.00 1.00 1.00 Customer Relations/Fiscal Supervisor 1.00 1.00 1.00 1.00 1.00 Utility Engineer 1.00 1.00 1.00 1.00 1.00 Engineer Technician 1.00 1.00 1.00 1.00 1.00 Lead Distribution Technician 0.00 0.00 1.00 1.00 1.00 Distribution Technician 6.00 6.00 5.00 5.00 6.00 Lead Operations Technician 1.00 1.00 1.00 1.00 1.00 Operator 5.00 5.00 5.00 5.00 5.00 Operations Technician 2.00 2.00 2.00 2.00 2.00 Utility Support Specialist 4.00 4.00 4.00 4.00 4.00 Lab Technician 1.00 1.00 1.00 1.00 1.00 Lead Service Technician 1.00 1.00 1.00 1.00 1.00 Service Technician 3.00 3.00 3.00 3.00 3.00
Total Water Utility 30.00 30.00 30.00 30.00 31.00An increase of 1.00 FTE in 2020. *Approval authorized by the Board of Water Commissioners.
283

2017 2018 2019 2019 2020Actual Actual Amended Estimated Adopted
PERSONNEL SCHEDULEAUTHORIZED PERMANENT POSITIONS 2017 - 2020
Wastewater Utility Superintendent 1.00 1.00 1.00 1.00 1.00 Industrial Wastewater Supervisor 1.00 1.00 1.00 1.00 1.00 Environmental Engineer 1.00 1.00 1.00 1.00 1.00 Maintenance Supervisor 1.00 1.00 1.00 1.00 1.00 Process System/OPCO 1.00 1.00 1.00 1.00 1.00 Electromechanical Technician 1.00 1.00 1.00 1.00 1.00 Laboratory Technician 1.00 1.00 1.00 1.00 1.00 Plant Maintenance Mechanic 3.00 3.00 3.00 3.00 3.00 Operator III 1.00 1.00 1.00 2.00 2.00 Operator I 1.00 1.00 1.00 2.00 2.00 Clerk IV / Administrative Assistant 0.00 1.00 1.00 1.00 1.00 Clerk Typist 1.00 0.00 0.00 0.00 0.00
Total Wastewater Utility 13.00 13.00 13.00 15.00 15.00No changes in 2020.
TOTAL PROPRIETARY FUND 96.50 96.50 96.75 98.75 101.75
INTERNAL SERVICE FUNDSInformation Technology IT Director 1.00 1.00 1.00 1.00 1.00 Systems Analyst 2.00 2.00 2.00 2.00 2.00 Network Administrator 1.00 1.00 2.00 1.00 1.00 PC Specialist 1.00 1.00 1.00 1.00 1.00
Total Information Technology 5.00 5.00 6.00 5.00 5.00A reduction of 1.00 FTE Network Administrator position (unfilled) in 2020.
MOTOR VEHICLE FUNDMotor Vehicle Equipment Service Supervisor 1.00 1.00 1.00 1.00 1.00 Master Certified Truck Mechanic 1.00 1.00 1.00 1.00 1.00 Certified Truck Mechanic 6.00 3.00 3.00 2.00 2.00 Truck Mechanic 0.00 1.00 1.00 1.00 1.00 Service Mechanic II 0.00 0.00 0.00 1.00 1.00
Total Motor Vehicle 8.00 6.00 6.00 6.00 6.00No changes in 2020.
TOTAL INTERNAL SERVICE FUNDS 13.00 11.00 12.00 11.00 11.00TOTAL PROPRIETARY FUNDS 109.50 107.50 108.75 109.75 112.75
TOTAL CITY FUNDS 452.24 450.43 452.08 449.33 451.33
284

CITY OF SHEBOYGAN
NOTES
285

TOTAL EXPENDITURES BY FUND AND DEPARTMENT 2020*
Special Debt CapitalGeneral Revenue Service Improvement Proprietary
Fund Funds Funds Funds Funds TotalGeneral GovernmentOffice of the Mayor 188,445 4,650 193,095Office of the City Administrator 313,282 313,282Council 142,006 142,006Clerk 357,090 357,090Elections 150,278 150,278Finance 959,949 100,000 7,192,144 8,252,093Assessing 351,565 351,565Human Resources 355,414 355,414Office of the City Attorney 526,015 526,015Municipal Court 902,750 902,750City Hall 245,808 245,808Insurance 277,809 277,809Employee Benefits 340,063 340,063 Sub-total General Government 12,407,268 Public SafetyPolice 10,495,703 82,621 Administration 2,380,261 2,380,261Fire 8,690,746 1,250,800 9,941,546Building Inspection 744,108 744,108Civil Defense 4,873 4,873 Sub-total Public Safety 13,070,788
Public WorksAdministration 405,354 405,354Engineering 816,000 816,000Streets/Alleys/Sidewalks 5,460,848 59,000 5,519,848Sanitation 2,143,239 2,143,239 Sub-Total Public Works 8,884,441
Health and Human ServicesCemetery 201,331 201,331 Sub-Total Health and Human Services 201,331
Parks and RecreationLibrary 3,442,783 3,442,783Parks 2,628,885 375,000 3,003,885Tourism 1,866,611 1,866,611
286

TOTAL EXPENDITURES BY FUND AND DEPARTMENT 2020*
Special Debt CapitalGeneral Revenue Service Improvement Proprietary
Fund Funds Funds Funds Funds Total
Senior Services 208,704 208,704Cable TV 543,640 543,640Marina 878,643 878,643 Sub-Total Parks and Recreation 9,944,266
City DevelopmentCity Development 368,721 1,757,644 6,047,234 8,173,599 Sub-Total City Development 8,173,599
Other Financing UsesInterfund Transfers 8,030 8,030Unclassified 530,000 530,000 Sub-Total Unclassified 538,030
Debt Service FundsDebt Service 8,862,198 8,862,198 Sub-Total Debt Service 8,862,198
Proprietary FundsWater Utility** 8,872,986 8,872,986Recycling Utility 1,218,127 1,218,127Wastewater Utility 9,775,057 9,775,057Boat Facilities 178,503 178,503Parking Utility 493,167 493,167Transit Utility 4,416,674 4,416,674Motor Vehicle Fund 2,512,803 2,512,803Health Insurance Fund 7,027,878 7,027,878Liability Insurance Fund 484,436 484,436Worker Compensation Fund 655,228 655,228Information Technology Fund 1,118,772 1,118,772 Sub-total Proprietary Funds 36,753,631
Total 39,294,527 11,264,142 8,862,198 13,239,378 36,753,631 109,413,876
* Does not include Fiduciary Fund
has authority for review and approval.
**Water Utility related information is included for informational purposes only. The Board of Water Commission
287

GENERAL FUNDSUMMARY OF EXPENSES BY CATEGORY
Actual Actual Actual2012 2013 2014
General GovernmentPersonal Services $2,596,210 $2,506,107 $2,709,899Non-Personal Services 1,199,084 1,165,671 1,287,951Capital Outlay 65,055 71,594 38,573 Total General Government 3,860,349 3,743,372 4,036,423
Public SafetyPersonal Services 17,751,822 18,413,139 19,113,170Non-Personal Services 1,448,407 1,386,100 1,451,756Capital Outlay 81,149 199,582 726,321 Total Public Safety 19,281,378 19,998,821 21,291,247
Public WorksPersonal Services 3,508,583 3,760,445 3,587,079Non-Personal Services 3,056,310 3,360,993 3,215,898Capital Outlay 0 7,255 6,364 Total Public Works 6,564,893 7,128,693 6,809,341
Health and Human ServicesPersonal Services 221,650 277,874 227,089Non-Personal Services 53,364 62,199 59,871Capital Outlay 0 0 14,993 Total Cemetery 275,014 340,073 301,953
Culture and RecreationPersonal Services 1,503,425 1,687,768 1,673,484Non-Personal Services 835,523 673,297 733,200Capital Outlay 2,106 7,465 108,438 Total Community Activities 2,341,054 2,368,530 2,515,122
City Development and UnclassifiedPersonal Services 200,107 196,580 208,240Non-Personal Services 34,991 34,126 38,569Capital Outlay 2,917 4,206 658,578 Total Conservation & Development 238,015 234,912 905,387
Total For All ProgramsPersonal Services 25,781,797 26,841,913 27,518,961Non-Personal Services 6,627,679 6,682,386 6,787,245Capital Outlay 151,227 290,102 1,553,267 Total For All Programs $32,560,703 $33,814,401 $35,859,473
288

GENERAL FUNDSUMMARY OF EXPENSES BY CATEGORY
Actual Actual Actual Actual Amended Adopted2015 2016 2017 2018 2019 2020
$2,592,763 $2,046,338 $1,925,382 $2,116,252 $2,450,127 $2,658,8601,227,534 1,465,923 $1,267,862 $1,366,495 $1,563,903 $1,538,865
65,802 125,427 $6,775 $0 $10,000 $10,0003,886,099 3,637,688 3,200,019 3,482,747 4,024,030 4,207,724
18,817,062 17,972,334 $18,678,629 $19,440,633 $20,003,026 $20,381,4211,415,441 3,863,788 $1,446,250 $1,780,815 $1,761,524 $1,913,270
249,140 44,764 $29,085 $37,089 $20,000 $21,00020,481,643 21,880,886 20,153,964 21,258,537 21,784,550 22,315,691
3,433,363 4,277,790 $4,325,090 $4,640,287 $4,953,090 $4,616,8843,217,395 3,653,680 $3,915,551 $3,791,667 $4,039,626 $4,150,556
60,499 8,039 $29,489 $32,216 $77,000 $58,0006,711,257 7,939,509 8,270,129 8,464,170 9,069,716 8,825,441
175,059 175,360 $174,292 $134,225 $140,807 $131,72644,805 58,091 $47,334 $53,428 $60,530 $64,60513,477 0 $0 $1,234 $0 $5,000
233,341 233,451 221,626 188,887 201,337 201,331
1,598,611 1,600,690 $1,610,484 $1,701,233 $1,763,843 $1,865,021782,754 832,927 $835,199 $848,208 $893,099 $944,26889,394 88,260 $56,441 $40,000 $25,000 $28,300
2,470,759 2,521,877 2,502,124 2,589,441 2,681,942 2,837,589
229,296 217,853 $234,533 $241,610 $248,281 $267,31034,397 633,803 $117,442 $107,305 $104,444 $101,411
301,432 3,782 $294,505 $0 $0 $0565,125 855,438 646,480 348,915 352,725 368,721
26,846,154 26,290,365 26,948,410 28,274,240 29,559,174 29,921,2226,722,326 10,508,212 7,629,638 7,947,918 8,423,127 8,712,975
779,744 270,272 534,721 5,715,524 563,077 660,330$34,348,224 $37,068,849 $35,112,769 $41,937,683 $38,545,378 $39,294,527
289

5 YEAR CAPITAL IMPROVEMENTS PROGRAM
2020 2021 2022 2023 2024Approved Recommended Recommended Recommended Recommended Total
REVENUES
Property Tax Levy: Capital Project Fund
Police $208,000 $212,000 $217,000 $190,000 $150,000 $977,000
Street Improvement and Sidewalks $500,000 $500,000 $500,000 $500,000 $500,000 $2,500,000
General Government Projects $100,492 $60,000 $60,000 $107,000 $100,000 $427,492
Fire $0 $0 $0 $0 $0 $0
Park, Forestry and Open Space Fund $110,000 $110,000 $110,000 $110,000 $110,000 $550,000
Park Impact Fee Fund $50,000 $40,000 $25,000 $25,000 $40,000 $180,000
Vehicle / Land Sales $111,000 $91,500 $136,000 $146,000 $105,500 $590,000
County / State / Federal Grants $1,205,026 $2,707,520 $3,032,000 $1,200,000 $2,850,000 $10,994,546
Other Municipality Contributions (County Sales Tax) $411,000 $411,000 $411,000 $411,000 $411,000 $2,055,000
G. O. Borrowed Funds $3,580,546 $4,013,158 $3,967,428 $3,628,250 $3,393,750 $18,583,132
Other Borrowed Funds $3,046,400 $18,671,400 $16,310,000 $1,793,000 $0 $39,820,800
Donations $45,300 $835,000 $0 $0 $0 $880,300
User Fees $5,181,000 $4,884,000 $4,127,000 $3,991,000 $3,059,000 $21,242,000
Special Assessment $100,000 $100,000 $100,000 $100,000 $16,500 $416,500
Vehicle Registration Fee $791,750 $791,750 $791,750 $791,750 $791,750 $3,958,750
Other/CDBG $0 $0 $0 $0 $0 $0
Fund Balance $499,000 $434,750 $559,500 $315,000 $886,250 $2,694,500
TOTAL REVENUE $15,939,514 $33,862,078 $30,346,678 $13,308,000 $12,413,750 $105,870,020
EXPENDITURES
City Buildings
Municipal Service Building - HVAC System $110,000 $0 $0 $0 $0 $110,000
Municipal Service Building - Office Improvements $25,000 $0 $0 $0 $0 $25,000
Municipal Service Building - Garage Drain Improvements $0 $90,000 $0 $0 $0 $90,000
Senior Activity Center - Roof Replacement $0 $275,000 $0 $0 $0 $275,000
Municipal Service Building - Vehicle Wash Facility Upgrade $0 $100,000 $0 $0 $0 $100,000
Municipal Service Building - Electrical and Generator Design $0 $0 $25,000 $0 $0 $25,000
Municipal Service Building - Generator Replacement $0 $0 $0 $185,000 $0 $185,000
Municipal Service Building - Main Electrical Panel Update $0 $0 $0 $80,000 $0 $80,000
Municipal Service Building - Engineering Office Windows $0 $0 $0 $0 $100,000 $100,000
Total - City Buildings $135,000 $465,000 $25,000 $265,000 $100,000 $990,000
Police
Marked K-9 Vehicle $45,300 $0 $0 $0 $0 $45,300 Unmarked Vehicle $43,000 $0 $0 $0 $0 $43,000
Marked Vehicles - Sport Utility Vehicles (4) $164,000 $0 $0 $0 $0 $164,000
Parking Lot - Impound Area Improvements $45,000 $0 $0 $0 $0 $45,000
HVAC Control - Secure Entry Systems $195,000 $0 $0 $0 $0 $195,000
Squad computers $0 $66,000 $0 $0 $0 $66,000
Unmarked Vehicles (2) $0 $86,000 $0 $0 $0 $86,000 Unmarked Vehicle - Sport Utility Vehicle $0 $43,000 $0 $0 $0 $43,000 Marked Vehicle - Sport Utility Vehicle $0 $43,000 $0 $0 $0 $43,000
Marked Vehicle - Sport Utility Vehicles (5) $0 $0 $225,000 $0 $0 $225,000
Unmarked Vehicle $0 $0 $44,000 $0 $0 $44,000
Patrol Wagon $0 $0 $0 $50,000 $0 $50,000
Marked Vehicles - Sport Utility Vehicles (4) $0 $0 $0 $184,000 $0 $184,000
Police Range Remediation $0 $0 $0 $45,000 $0 $45,000
Marked Vehicles - Sport Utility Vehicles (4) $0 $0 $0 $0 $190,000 $190,000
Total - Police $492,300 $238,000 $269,000 $279,000 $190,000 $1,468,300
290

5 YEAR CAPITAL IMPROVEMENTS PROGRAM
2020 2021 2022 2023 2024Approved Recommended Recommended Recommended Recommended Total
Fire
Station Two $317,644 $0 $0 $0 $0 $317,644
Engine $0 $620,000 $0 $0 $0 $620,000
Station Three - Phase 1 of 3 $0 $140,000 $0 $0 $0 $140,000
Training Facility $0 $835,000 $0 $0 $0 $835,000
Station Three - Phase 2 of 3 $0 $0 $200,000 $0 $0 $200,000
Ambulance $0 $0 $336,000 $0 $0 $336,000
Station Three - Phase 2 of 3 $0 $0 $0 $455,000 $0 $455,000
Ambulance $0 $0 $0 $350,000 $0 $350,000
Ambulance $0 $0 $0 $0 $360,500 $360,500 Total - Fire $317,644 $1,595,000 $536,000 $805,000 $360,500 $3,614,144
Public Works
Traffic Control
CMAQ Kohler Memorial Dr-Erie Av Traffic Flow Design $106,500 $0 $0 $0 $0 $106,500
CMAQ 14th Street Traffic Flow Design $155,900 $0 $0 $0 $0 $155,900
CMAQ Taylor Drive Traffic Flow Design $137,000 $0 $0 $0 $0 $137,000
LED Street Lighting Upgrade - Downtown $171,400 $0 $0 $0 $0 $171,400
LED Street Lighting Upgrade - Citywide $60,000 $0 $0 $0 $0 $60,000
Traffic Control Upgrade - Citywide $100,000 $0 $0 $0 $0 $100,000
CMAQ Kohler Memorial Dr-Erie Av Traffic Flow Construction $0 $411,600 $0 $0 $0 $411,600
CMAQ 14th Street Traffic Flow Construction $0 $602,900 $0 $0 $0 $602,900
CMAQ Taylor Drive Traffic Flow Construction $0 $529,900 $0 $0 $0 $529,900
Street Lighting LED Upgrade - TID 17 $0 $171,400 $0 $0 $0 $171,400
Street Lighting LED Upgrade-Citywide $0 $60,000 $0 $0 $0 $60,000
Traffic Control Upgrade - Citywide $0 $52,000 $0 $0 $0 $52,000
LED Street Lighting Upgrade - Downtown $0 $0 $171,400 $0 $0 $171,400
LED Street Lighting Upgrade - Citywide $0 $0 $60,000 $0 $0 $60,000
LED Street Lighting Upgrade - Citywide $0 $0 $0 $150,000 $0 $150,000
LED Street Lighting Upgrade - Citywide $0 $0 $0 $0 $50,000 $50,000
LED Street Lighting Upgrade - Blue Harbor $0 $0 $0 $0 $100,000 $100,000 Total - Traffic Control $730,800 $1,827,800 $231,400 $150,000 $150,000 $3,090,000
Streets
Superior Avenue (North 29th Street to Taylor Drive) $2,000,000 $0 $0 $0 $0 $2,000,000
Union Avenue (Taylor Drive to Georgia Avenue) $500,000 $0 $0 $0 $0 $500,000
Van Der Vaart Property Development Street Improvements $2,000,000 $0 $0 $0 $0 $2,000,000
North Commerce Street Design $75,000 $0 $0 $0 $0 $75,000
Geele Avenue (Calumet Drive to North 23rd Street) $700,000 $0 $0 $0 $0 $700,000
Georgia Avenue (North Ninth Street to North 23rd Street) $354,000 $0 $0 $0 $0 $354,000
Storm Water Management Plan $100,000 $0 $0 $0 $0 $100,000
Sidewalk Repair / Replacement Program (Citywide) $100,000 $0 $0 $0 $0 $100,000
Calumet Drive Panel Replacement (Sibley Court to NCL) $0 $500,000 $0 $0 $0 $500,000
North Commerce Street Construction $0 $2,500,000 $0 $0 $0 $2,500,000
South 10th Street (Indiana Avenue to Union Avenue) $0 $750,000 $0 $0 $0 $750,000
North Avenue (Calumet Drive to Taylor Drive) $0 $800,000 $0 $0 $0 $800,000
Geele Avenue (North Third Street to Calumet Drive) $0 $1,000,000 $0 $0 $0 $1,000,000
Storm Water Management Plan $0 $100,000 $0 $0 $0 $100,000
Sidewalk Repair / Replacement Program (Citywide) $0 $100,000 $0 $0 $0 $100,000
South 12th Street (Washington Avenue to Mead Avenue) $0 $0 $640,000 $0 $0 $640,000
Lakeshore Drive (Mead Av to Rail Road Tracks) $0 $0 $740,000 $0 $0 $740,000
Indiana Avenue (South 17th Street to South 24th Street) $0 $0 $3,000,000 $0 $0 $3,000,000
North 25th Street (Kohler Memorial Drive to North Avenue) $0 $0 $1,160,000 $0 $0 $1,160,000
Storm Water Management Plan $0 $0 $100,000 $0 $0 $100,000
Sidewalk Repair / Replacement Program (Citywide) $0 $0 $100,000 $0 $0 $100,000
291

5 YEAR CAPITAL IMPROVEMENTS PROGRAM
2020 2021 2022 2023 2024Approved Recommended Recommended Recommended Recommended Total
Streets (continued)
New Jersey Avenue (South 13th Street to Wildwood Drive) $0 $0 $0 $1,000,000 $0 $1,000,000
Calumet Drive Panel Replacement (Sibley Court to NCL) $0 $0 $0 $500,000 $0 $500,000
North 15th Street Design (Calumet Drive to Mayflower Avenue) $0 $0 $0 $500,000 $0 $500,000
Erie Avenue Design (North 19th Street to Taylor Drive) $0 $0 $0 $500,000 $0 $500,000
South 18th Street (Mead Avenue to Washington Avenue) $0 $0 $0 $760,000 $0 $760,000
Geele Avenue (North 29th Street to North Taylor Drive) $0 $0 $0 $936,000 $0 $936,000
Storm Water Management Plan $0 $0 $0 $100,000 $0 $100,000
Sidewalk Repair / Replacement Program (Citywide) $0 $0 $0 $100,000 $0 $100,000
Wilson Avenue (Lakeshore Drive to South Business Drive) $0 $0 $0 $0 $1,869,250 $1,869,250
Washington Avenue (Calumet Drive to Mayflower Avenue) $0 $0 $0 $0 $500,000 $500,000
North 15th Street (Calumet Drive to Mayflower Avenue) $0 $0 $0 $0 $4,000,000 $4,000,000
Storm Water Management Plan $0 $0 $0 $0 $100,000 $100,000
Sidewalk Repair / Replacement Program (Citywide) $0 $0 $0 $0 $100,000 $100,000 Total - Streets $5,829,000 $5,750,000 $5,740,000 $4,396,000 $6,569,250 $28,284,250
Parks and Forestry
Urban Forestry Management $210,000 $0 $0 $0 $0 $210,000
Park Sidewalk / ADA Accessibility Project $25,000 $0 $0 $0 $0 $25,000
Playground Renovations - Moose Park $25,000 $0 $0 $0 $0 $25,000
Roosevelt Park - Tennis Court Resurfacing $90,000 $0 $0 $0 $0 $90,000
Urban Forestry Management $0 $210,000 $0 $0 $0 $210,000
Park Sidewalk / ADA Accessibility Project $0 $25,000 $0 $0 $0 $25,000
Playground Renovations - Evergreen Park Area 1 and 2 $0 $50,000 $0 $0 $0 $50,000
Cleveland Park Splash Pad $0 $180,000 $0 $0 $0 $180,000
Urban Forestry Management $0 $0 $210,000 $0 $0 $210,000
Park Sidewalk / ADA Accessibility Project $0 $0 $25,000 $0 $0 $25,000
Vollrath Park - Bowl Lighting Replacement $0 $0 $30,000 $0 $0 $30,000
Playground Renovations - Deland Beach $0 $0 $50,000 $0 $0 $50,000
Urban Forestry Management $0 $0 $0 $210,000 $0 $210,000
Park Sidewalk / ADA Accessibility Project $0 $0 $0 $25,000 $0 $25,000
Playground Renovations - End Park $0 $0 $0 $50,000 $0 $50,000
End Park - Lighting Replacement $0 $0 $0 $30,000 $0 $30,000
Urban Forestry Management $0 $0 $0 $0 $210,000 $210,000
Park Sidewalk / ADA Accessibility Project $0 $0 $0 $0 $25,000 $25,000
Playground Renovations - Deland Park $0 $0 $0 $0 $50,000 $50,000
Lakeshore Drive Sidewalk $0 $0 $0 $0 $115,000 $115,000
South Shore Trail (Indiana Avenue to Clara Avenue) $0 $0 $0 $0 $165,000 $165,000
J.C. Quarryview Park Swimming Area Revitalization $0 $0 $0 $0 $250,000 $250,000 Total - Parks and Forestry $350,000 $465,000 $315,000 $315,000 $815,000 $2,260,000
Total - Public Works $6,909,800 $8,042,800 $6,286,400 $4,861,000 $7,534,250 $33,634,250
City Development
Playground Addition - Above and Beyond Children's Museum $30,000 $0 $0 $0 $0 $30,000
Surface Parking Lot - Innovation District $300,000 $0 $0 $0 $0 $300,000
Boat Extraction Well - Sheboygan River-Jefferson Av Launch $500,000 $0 $0 $0 $0 $500,000
Wayfinding Signage System Update - Citywide $50,000 $0 $0 $0 $0 $50,000
Indiana Avenue Trail Project - Phase 2 of 3 $0 $250,000 $0 $0 $0 $250,000
South Pier Street Expansion $0 $1,000,000 $0 $0 $0 $1,000,000
Indiana Avenue Streetscape Improvements-Phase 1 of 2 $0 $750,000 $0 $0 $0 $750,000
Indiana Avenue Streetscape Improvements-Phase 2 of 2 $0 $0 $750,000 $0 $0 $750,000
Pennsylvania Avenue - Streetscape Improvements $0 $0 $1,500,000 $0 $0 $1,500,000
Indiana Avenue Trail Project - Phase 3 of 3 $0 $0 $0 $2,250,000 $0 $2,250,000
Total - City Development $880,000 $2,000,000 $2,250,000 $2,250,000 $0 $7,380,000
292

5 YEAR CAPITAL IMPROVEMENTS PROGRAM
2020 2021 2022 2023 2024Approved Recommended Recommended Recommended Recommended Total
Wastewater Utility
Rebuild Floating Cover - Number Six Digester $450,000 $0 $0 $0 $0 $450,000
Anaerobic Digester Heat Exchanger Replacement $150,000 $0 $0 $0 $0 $150,000
East Digester Complex Roof Replacement $100,000 $0 $0 $0 $0 $100,000
Indiana Avenue Lift Station Corrosion Prevention $50,000 $0 $0 $0 $0 $50,000
Replace North Entrance Gates $50,000 $0 $0 $0 $0 $50,000
Sewer Line Reconstruction / Relining $1,000,000 $0 $0 $0 $0 $1,000,000
Mini Storm Sewer Program $50,000 $0 $0 $0 $0 $50,000
Primary Clarification Number Four Drive $0 $105,000 $0 $0 $0 $105,000
Secondary Clarification Number Three Drive $0 $90,000 $0 $0 $0 $90,000
South Aeration Upgrade $0 $450,000 $0 $0 $0 $450,000
Main Control Room HVAC Upgrade $0 $65,000 $0 $0 $0 $65,000
Kentucky Avenue Lift Station Corrosion Prevention $0 $60,000 $0 $0 $0 $60,000
Sewer Line Reconstruction / Relining $0 $1,000,000 $0 $0 $0 $1,000,000
Jet Truck $0 $215,000 $0 $0 $0 $215,000
Mini Storm Sewer Program $0 $50,000 $0 $0 $0 $50,000
Primary Clarification Number Three Drive $0 $0 $105,000 $0 $0 $105,000
North Aeration Upgrade $0 $0 $450,000 $0 $0 $450,000
Secondary Clarifier Number One Drive Replacement $0 $0 $90,000 $0 $0 $90,000
Grit Removal System Modifications $0 $0 $75,000 $0 $0 $75,000
Sewer Line Reconstruction / Relining $0 $0 $1,000,000 $0 $0 $1,000,000
Mini Storm Sewer Program $0 $0 $50,000 $0 $0 $50,000
Primary Clarifier Number One Drive Replacement $0 $0 $0 $105,000 $0 $105,000
Aeration Blower Number Five $0 $0 $0 $260,000 $0 $260,000
Raw Influent Pump Number Three Replacement $0 $0 $0 $185,000 $0 $185,000
Indiana Avenue Lift Station Upgrade $0 $0 $0 $175,000 $0 $175,000
Sewer Line Reconstruction / Relining $0 $0 $0 $1,000,000 $0 $1,000,000
Mini Storm Sewer Program $0 $0 $0 $50,000 $0 $50,000
Administrative Building Roof Replacements $0 $0 $0 $0 $400,000 $400,000
Administrative HVAC Upgrade and Controls $0 $0 $0 $0 $200,000 $200,000
Kentucky Avenue Lift Station Pump Upgrade $0 $0 $0 $0 $95,000 $95,000
North Avenue Lift Station Controls $0 $0 $0 $0 $75,000 $75,000
Mini Storm Sewer Program $0 $0 $0 $0 $50,000 $50,000
Total - Wastewater Utility $1,850,000 $2,035,000 $1,770,000 $1,775,000 $820,000 $8,250,000
Motor Vehicle
Single Axle Dump Truck with Slide-In Salter / Spray Bar $265,000 $0 $0 $0 $0 $265,000
Replacement Dump Box - Slide-In Salter $85,000 $0 $0 $0 $0 $85,000
One Ton Four Wheel Drive Dump Truck (2) $117,000 $0 $0 $0 $0 $117,000
One-Half Ton Two Wheel Drive Pickup Truck $33,000 $0 $0 $0 $0 $33,000
One-Half Ton Four Wheel Drive Pickup Truck $32,000 $0 $0 $0 $0 $32,000
Street Sweeper $0 $210,000 $0 $0 $0 $210,000
One Ton Four Wheel Drive Dump Truck $0 $53,000 $0 $0 $0 $53,000
Zero Turn Mower (2) $0 $27,000 $0 $0 $0 $27,000
Three-Quarter Ton Two Wheel Drive Pickup Truck $0 $31,000 $0 $0 $0 $31,000
One Ton Utility Box Truck (3) $0 $129,000 $0 $0 $0 $129,000
Skid Steer $0 $59,000 $0 $0 $0 $59,000
Passenger Van (Mayor) $0 $37,000 $0 $0 $0 $37,000
Tri-Axle Dump Truck $0 $0 $275,000 $0 $0 $275,000
Street Sweeper $0 $0 $213,000 $0 $0 $213,000
Three-Quarter Ton Two Wheel Drive Pickup Truck (2) $0 $0 $64,000 $0 $0 $64,000
Tandem Axle Dump Truck (2) $0 $0 $0 $580,000 $0 $580,000
Tri-Axle Dump Truck $0 $0 $0 $0 $305,000 $305,000
One Ton Four Wheel Drive Dump Truck (2) $0 $0 $0 $0 $118,000 $118,000
Three-Quarter Ton Four Wheel Drive Pickup Truck $0 $0 $0 $0 $36,500 $36,500
293

5 YEAR CAPITAL IMPROVEMENTS PROGRAM
2020 2021 2022 2023 2024Approved Recommended Recommended Recommended Recommended Total
Motor Vehicle (continued)
One-Half Ton Four Wheel Drive Pickup Truck $0 $0 $0 $0 $32,500 $32,500
Zero Turn Mower (2) $0 $0 $0 $0 $28,000 $28,000
Total - Motor Vehicle $532,000 $546,000 $552,000 $580,000 $520,000 $2,730,000
Mead Public Library
Carpet Replacement $40,492 $0 $0 $0 $0 $40,492
HVAC Control Replacement $66,278 $0 $0 $0 $0 $66,278
HVAC Control Replacement $0 $66,278 $0 $0 $0 $66,278
HVAC Control Replacement $0 $0 $66,278 $0 $0 $66,278
Total - Mead Public Library $106,770 $66,278 $66,278 $0 $0 $239,326
Parking Utility
Street Sweeper $70,000 $0 $0 $0 $0 $70,000
Utility Pickup Truck $0 $35,000 $0 $0 $0 $35,000
John Deere Pro Style Gator $0 $0 $20,000 $0 $0 $20,000
Coin Meter Replacement $0 $0 $250,000 $0 $0 $250,000
One and One-Half Ton Heavy Duty Pickup $0 $0 $0 $60,000 $0 $60,000
Riverfront Parking Lots $0 $0 $0 $0 $600,000 $600,000
Total - Parking Utility $70,000 $35,000 $270,000 $60,000 $600,000 $1,035,000
Transit Utility
Roof Replacement $750,000 $0 $0 $0 $0 $750,000
Fixed Route Revenue Bus (1) $475,000 $0 $0 $0 $0 $475,000
Fixed Route Revenue Buses (4) $0 $1,840,000 $0 $0 $0 $1,840,000
Paratransit Vehicle $0 $0 $75,000 $0 $0 $75,000
Fixed Route Revenue Buses (4) $0 $0 $1,840,000 $0 $0 $1,840,000
Transit Facility Maintenance Updates $0 $0 $0 $200,000 $0 $200,000
Total - Transit Utility $1,225,000 $1,840,000 $1,915,000 $200,000 $0 $5,180,000
Cable TV
Camera / Intercom System with IFB Communication Interface $40,000 $0 $0 $0 $0 $40,000
Teleprompter / Talent Monitor System $0 $45,000 $0 $0 $0 $45,000
TriCaster Replacement for OB Truck $0 $0 $25,000 $0 $0 $25,000
Studio TriCaster Replacement $0 $0 $25,000 $0 $0 $25,000
Outside Broadcast (OB) Truck Replacement $0 $0 $0 $0 $50,000 $50,000
Total - Cable TV $40,000 $45,000 $50,000 $0 $50,000 $185,000
Information Technology
Microsoft Server Licensing $25,000 $0 $0 $0 $0 $25,000
Digital Evidence Storage Solution $100,000 $0 $0 $0 $0 $100,000
Microsoft Office Upgrade $0 $110,000 $0 $0 $0 $110,000
Total - Information Technology $125,000 $110,000 $0 $0 $0 $235,000
Water Utility*
Gateway Drive Water Tower Painting $600,000 $0 $0 $0 $0 $600,000
Georgia Avenue Reservior Painting $700,000 $0 $0 $0 $0 $700,000
One-Half Ton Pickup Truck and Vacuum Excavation Trailer $76,000 $0 $0 $0 $0 $76,000
Radio Meter System $65,000 $0 $0 $0 $0 $65,000
Water Mains $1,275,000 $0 $0 $0 $0 $1,275,000
Facility Operations - Distribution Upgrade $520,000 $0 $0 $0 $0 $520,000
Raw Water Improvement Project - Phase 1 of 2 $0 $14,000,000 $0 $0 $0 $14,000,000
Taylor Hill Coating and Roof Repairs $0 $900,000 $0 $0 $0 $900,000
Utility Truck and Vehicle Replacements $0 $91,000 $0 $0 $0 $91,000
294

5 YEAR CAPITAL IMPROVEMENTS PROGRAM
2020 2021 2022 2023 2024Approved Recommended Recommended Recommended Recommended Total
Water Utility* (continued)
Radio Meter System $0 $103,000 $0 $0 $0 $103,000
Water Mains $0 $1,250,000 $0 $0 $0 $1,250,000
Facility Operations - Distribution Upgrade $0 $520,000 $0 $0 $0 $520,000
Raw Water Improvement Project - Phase 2 of 2 $0 $0 $14,000,000 $0 $0 $14,000,000
Utility Equipment and Vehicle Replacements $0 $0 $280,000 $0 $0 $280,000
Radio Meter System $0 $0 $57,000 $0 $0 $57,000
Water Mains $0 $0 $1,250,000 $0 $0 $1,250,000
Facility Operations - Distribution Upgrade $0 $0 $770,000 $0 $0 $770,000
Behrens Parkway Pit Pump Improvements $0 $0 $0 $300,000 $0 $300,000
Utility Equipment Replacement $0 $0 $0 $40,000 $0 $40,000
Radio Meter System $0 $0 $0 $73,000 $0 $73,000
Water Mains $0 $0 $0 $1,300,000 $0 $1,300,000
Facility Operations - Distribution Upgrade $0 $0 $0 $520,000 $0 $520,000
Wilgus Avenue Pump Station Improvements $0 $0 $0 $0 $100,000 $100,000
Utility Equipment and Vehicle Replacements $0 $0 $0 $0 $235,000 $235,000
Radio Meter System $0 $0 $0 $0 $84,000 $84,000
Water Mains $0 $0 $0 $0 $1,400,000 $1,400,000
Facility Operations - Distribution Upgrade $0 $0 $0 $0 $420,000 $420,000
Total - Water Utility $3,236,000 $16,864,000 $16,357,000 $2,233,000 $2,239,000 $40,929,000*For Informational Purposes Only.
TOTAL EXPENDITURES $15,919,514 $33,882,078 $30,346,678 $13,308,000 $12,413,750 $105,870,020
2020 2021 2022 2023 2024 Total
Total - City Buildings $135,000 $465,000 $25,000 $265,000 $100,000 $990,000
Total - Police $492,300 $238,000 $269,000 $279,000 $190,000 $1,468,300
Total - Fire $317,644 $1,595,000 $536,000 $805,000 $360,500 $3,614,144
Total - Public Works $6,909,800 $8,042,800 $6,286,400 $4,861,000 $7,534,250 $33,634,250
Total - City Development $880,000 $2,000,000 $2,250,000 $2,250,000 $0 $7,380,000
Total - Wastewater Utility $1,850,000 $2,035,000 $1,770,000 $1,775,000 $820,000 $8,250,000
Total - Motor Vehicle $532,000 $546,000 $552,000 $580,000 $520,000 $2,730,000
Total - Mead Public Library $106,770 $66,278 $66,278 $0 $0 $239,326
Total - Parking Utility $70,000 $35,000 $270,000 $60,000 $600,000 $1,035,000
Total - Transit Utility $1,225,000 $1,840,000 $1,915,000 $200,000 $0 $5,180,000
Total - Cable TV $40,000 $45,000 $50,000 $0 $50,000 $185,000
Total - Information Technology $125,000 $110,000 $0 $0 $0 $235,000
Total - Water Utility $3,236,000 $16,864,000 $16,357,000 $2,233,000 $2,239,000 $40,929,000
Total Capital Improvements $15,919,514 $33,882,078 $30,346,678 $13,308,000 $12,413,750 $105,870,020
295

296

297

NOTICE TO TAXPAYERS AND RESIDENTS OF THE CITY OF SHEBOYGAN, WISCONSIN
Pursuant to Chapter 65.90 of the Laws of Wisconsin, notice is hereby given that the annual budget hearing will beheld in the Common Council Chambers, City Hall, in the City of Sheboygan, on Monday, October 7, 2019 at6:00 p.m., at which time any taxpayer or resident of the governmental unit will have the opportunity to be heard on theproposed 2020 budget.Dated this 19th day of September, 2019 Darrell Hofland, City Administrator
2019 2020 Percent Revised Budget Proposed Budget Change
General Fund Revenue: Taxes (other than property) $203,523 $203,523 0.00%
Licenses and Permits $921,240 $992,740 7.76%Intergovernmental Revenue $14,482,474 $13,936,934 -3.77%Charges for Services $1,937,822 $1,859,322 -4.05%Fines and Forfeitures $271,000 $271,000 0.00%Interest on Investments $210,000 $210,000 0.00%Miscellaneous Revenue $132,425 $146,650 10.74%Other Financing Sources $2,717,605 $2,878,924 5.94% Total Revenue $20,876,089 $20,499,093 -1.81%
Expense: General Government $4,024,030 $4,207,724 4.56%
Public Safety $21,784,550 $22,315,691 2.44%Public Works $9,069,716 $8,825,441 -2.69%Health/Human Services $201,337 $201,331 0.00%Culture/Recreation $2,681,942 $2,837,589 5.80%Conservation/Development $352,725 $368,721 4.53%Miscellaneous Expenses $36,400 $130,000 257.14%Contingency $386,995 $400,000 3.36%Interfund Transfers $7,682 $8,030 4.53% Total Expense $38,545,377 $39,294,527 1.94%
2020 BUDGET/FUND BALANCE SUMMARY - ALL FUNDS
Estimated EstimatedFund Balance Budgeted Tax Levy Budgeted Fund BalanceDec. 31, 2019 Revenue Expenditures Dec. 31, 2020
General Fund $19,893,989 $20,499,093 $16,609,115 $39,294,527 $17,707,670Special Revenue $2,032,576 $8,959,056 $2,533,314 11,264,142 2,260,804Debt Service $10,515,149 $6,859,797 $3,541,758 8,862,198 12,054,506Capital Improvements $7,166,592 $8,562,519 $892,025 13,239,378 3,381,758Proprietary $84,929,405 $35,472,209 $516,662 41,447,124 79,471,152Fiduciary $2,239,632 $39,900 $0 166,000 2,113,532Total $126,777,343 $80,392,574 $24,092,874 $114,273,369 $116,989,422
Long Term Bonds Outstanding - December 31, 2019 $29,120,000Long Term Notes Outstanding - December 31, 2019 $19,564,679Long Term Loans Outstanding - December 31, 2019 $400,000
$49,084,679
298

CHART OF ACCOUNTS EXPENDITURE CLASSIFICATIONS – SEE ADDENDUM FOR ACCOUNT LEVEL DETAIL PERSONAL SERVICES 510110 Full time salaries-regular: Salaries and wages paid to full-time and part-time regular
employees. 510111 Full time salaries-overtime: Payments made to full-time and part-time employees for
overtime services. 510120 Part-time salaries–regular: Wages paid to long term part-time employees. 510130 Temporary salaries–regular: Wages paid to temporary and seasonal employees. 510310 Social Security–FICA: Employer’s social security contribution made on behalf of City
employees. 510311 Social Security–Medicare: Employer’s medical contribution made on behalf of City
employees. 510320 WI Retirement: Employer contribution to Wisconsin Retirement System net of any employee’s
contribution. 510340 Health Insurance: Employer health insurance premium net of employee’s contribution. 510350 Dental Insurance: Employer dental insurance premium net of employee’s contribution. 510351 Unfunded pension liability: Employer contribution to the Debt Service fund for repayment of
the debt issued for the unfunded pension liability of the city. 510360 Life insurance: Employer life insurance premium net of employee’s contribution. 510400 Workers compensation: Employer contribution to the self insurance Workers Compensation
Fund. NON-PERSONAL SERVICES 521100 Banking Fees: Cost of fee charged for additional services, overdrafts, stop payments, etc. 521110 Financial Services Fees: Audit fees charged by the outside accounting firm. 521150 Consulting Fees: Payments made to vendors for expertise work done for the city. 521200 Legal Services: Payments made to outside legal counsel. 521205 Witness Fees: Fees paid to individuals who are subpoenaed to appear in the City of
Sheboygan Municipal Court. 521206 Monies and Securities: Insurance coverage for fraud and theft. 521207 Surety Bonds: Fees for Notary Public renewal. 521210 Negotiation and Arbitration Services: Legal services for union contract negotiation. 521317 Locate Services: Fees for locating underground utilities. 521400 Advertising and Marketing: Fees paid to the media for advertising. 521420 Reproduction Services: Fees paid to vendors for scanning old documents for electronic
record retention. 521485 Hauling Services: Waste disposal fees. 521500 Administrative Services: Costs associated with providing services to the City of Sheboygan. 521510 Billing Services: Fees charged by third parties for billing services. 521550 Translating Services: Costs for translation services. 521560 Medical Services: Fees for medical tests for city employees and potential City employees. 521564 Laboratory Fees: Fees for laboratory tests for city employees and potential City employees. 521700 Security Services: Billing Fees for security services. 521720 Jail Services: Charges for detention by Sheboygan County. 521730 Investigative Services: Fees occurred as a result of investigations. 521790 Animal Control Services: Fees paid to the Humane Society for dog and cat licenses. 521800 Program Services: Fees associated with public and/or internal programs. 521900 Contracted Services: Services provided by vendors. 522110 Vehicle Maintenance: Vehicle repair charges. 522130 Heavy Equipment Maintenance: Parts and repair services for equipment. 523110 Office Equipment Maintenance: Maintenance and leasing of office equipment. 523120 Computer Maintenance: Hardware additions and updates for the city’s computers.
299

523121 PC Repayment: Charge backs for computers and computer equipment paid for by Information Technology.
523122 Software Maintenance: Fees for computer software. 523125 IT Services: Charge back to departments for IT services. 523210 Safety Equipment Maintenance: Parts and maintenance fees for safety equipment. 523310 Communication Equipment Maintenance: Parts and maintenance for radios and software. 523410 Recreation Equipment Maintenance: Costs associated with repair and maintenance of
recreational facilities. 524110 Building Exterior Maintenance: Materials and services used in the repair of building
exteriors. 524115 Building Equipment Maintenance: Materials and services used in the repair of building
interiors and mechanicals. 524120 Electrical Maintenance and Repair: Materials and services used in the electrical repair of
mechanicals. 524122 Plumbing Maintenance and Repair: Materials and services used in the plumbing repair of
mechanicals. 524124 Heating and Ventilation Maintenance: Materials and services used in the repair of heating
and cooling systems. 524126 Elevator Maintenance and Repair: Inspection services and material and services used in the
repair of elevators. 524130 Custodial Services: Contracted cleaning services and supplies. 524135 Janitorial Services: Contracted cleaning services and supplies. 524200 Landscaping Services: Contracted lawn service. 524210 Nuisance Property Control: Abstract company fees for raze orders. 524220 Snow Removal Services: Fees for snow plowing. 524230 Sidewalk and Trail Maintenance: Materials and services for maintenance of sidewalks and
trails. 524250 Lots and Ramps Maintenance: Materials and services for maintenance of lots and boat
ramps. 525100 Electric: Electric bills. 525105 Water: Water utility bills. 525110 Sewer: Sewer bills. 525120 Telephone: Telephone services. 525125 Mobile Telephone: Cell phone services. 525135 Internet: Internet services. 525140 Gas: Utility – Natural gas charges. 525145 Fuel Oil: Utility – Fuel oil charges. 525155 Professional Development: Conferences and memberships. 526100 Publications and Subscriptions: Professional magazine and newspaper subscriptions. 526105 Books-Reference: Professional books and guides. 526110 Professional Organizations: Fees for memberships for professional organizations. 526120 Licenses and Permits: Cost of required licenses and permits. 526125 Training and Conferences: Cost of professional conferences and/or training and education
classes and webinars and any associated costs. 526130 Training and Education: Costs associated with training and education classes and webinars. 526145 Codification Services: Fees for maintaining municipal and fire codes. 526150 Legal Notices: Fees for publishing legal notices. 526155 Filing and Recording Fees: Fees for filing and recording county documents. 527100 Car Allowance: Parking stall rental and mileage for employees. 527110 Travel: Expenses for hotels, meals, and other travel related expenses. 528150 Vehicle Rental: Charges and fees associated with city owned vehicles and equipment. 530100 Office Supplies: All supplies necessary for use in operating office. 530110 Printing Supplies: All supplies necessary for use with printers and copiers. 530115 Paper: Paper for office operations. 530127 Audio Visual Supplies: Cable charges and other supplies for audio and visual office needs.
300

530135 Shipping and Handling: Fees charged to ship supplies. 530200 Program Supplies: Supplies and services for city programs. 530202 Community Relations: Expenses associated with public communications and committees. 530205 Displays: Supplies used for displays at the library. 530210 Operating Supplies: Costs of supplies needed in the operations of the city’s departments. 530212 Development Incentive: Payments to developers based on agreement between the city and
developers. 530215 Medical Supplies: Cost of medical supplies for Police and Ambulance services. 530222 Janitorial Supplies: Cost of cleaning supplies. 530228 Laboratory Supplies: Laboratory expenses for the wastewater plant. 530230 Gasoline: Gasoline expense for vehicles and equipment. 530235 Diesel Fuel: Diesel expense for vehicles and equipment. 530240 Propane: Propane expense for fork lifts. 530245 Oils and Lubricants: Costs for oils and lubricants used for maintenance of vehicles and
equipment. 530250 Sand and Salt: Costs for sand and salt used in snow plowing operations. 530255 Tools and Equipment: Purchase or replacement of tools and equipment used to perform an
activity. 530256 Safety Equipment: Purchase or replacement of safety equipment used to perform and
activity. 530259 IT Small Equipment: Computer hardware costing less than $2,500. 530260 Safety Supplies: Purchase of safety supplies used in the city’s operations. 530267 Work Gear: Service parts purchased for repair and maintenance. 530270 Traffic Control Supplies: Materials and services for replacement and repair of traffic signs
and signals. 530275 Signage: Materials and supplies used for city signs. 530285 Parts: Purchase of repair parts for Transit buses. 530290 Construction Materials: Cost of supplies used for the construction and maintenance of City
infrastructure. 530295 Landscaping Supplies: Cost of landscaping supplies for city parking lots and parks. 530300 Gardening Supplies: Cost of flowers and gardening supplies for city parking lots, parks and
beautification projects. 530405 Wastewater Treatment: Fees for wastewater flow paid to the Town of Wilson. 530410 Wastewater Chemicals: Cost of chemicals used to treat wastewater. 530500 Fire Fighting Supplies: Cost of fire protection supplies and inspections. 530550 Tactical Team Supplies: Cost of special equipment used by the Police Department. 530995 Store Stock: Cost of store stock at the Harbor Centre Marina. 531115 Transfer Station Tipping: Fee to disposal facility for garbage collections. 531120 Tire Disposal: Fee to dispose of used tires 533102 Sanitary Landfill: Fee to disposal facility for Wastewater Treatment Plant waste. 538001 Donation Purchases: Cost to purchase materials at Mead Public Library with contributions. 538002 Materials – All Categories: Mead Public Library purchases. 538003 Young People’s Books: Mead Public Library young people’s book purchases. 538004 Juvenile Books: Mead Public Library juvenile book purchases. 538005 Juvenile Reference Books: Mead Public Library juvenile reference book purchases. 538006 Rental Collection: Mead Public Library rental collection book purchases. 538007 Professional Books: Mead Public Library professional book purchases. 538009 Books Rentals: Mead Public Library book purchases. 538010 Adult Fiction Books: Mead Public Library adult fiction book purchases. 538011 Adult Non-Fiction Books: Mead Public Library adult non-fiction book purchases. 538012 Large Print Books: Mead Public Library large print book purchases. 538099 Shipping and Handling: Mead Public Library book shipping and handling. 538100 Other Content: Mead Public Library other content purchases. 538101 Films: Mead Public Library film purchases. 538102 DVD’s: Mead Public Library DVD purchases.
301

538103 Recorded Music: Mead Public Library recorded music purchases. 538104 Digital Recording: Mead Public Library digital recording purchases. 538105 Audio Books: Mead Public Library audio book purchases. 538106 Juvenile Recordings: Mead Public Library juvenile recording purchases. 538107 CD Rom Circulating: Mead Public Library CD Rom purchases. 538108 Electronic Reference: Mead Public Library electronic reference purchases. 538109 Art Reproductions: Mead Public Library art reproduction purchases. 538199 Shipping and Handling: Mead Public Library audio recording expenses. 538301 Periodicals/Microfilm: Mead Public Library periodicals and microfilm purchases. 538351 Adult Pamphlets: Mead Public Library adult pamphlet purchases. 538352 Juvenile Pamphlets: Mead Public Library juvenile pamphlet purchases. 538399 Shipping and Handling: Mead Public Library pamphlet expenses. 538401 Bindings: Mead Public Library binding expenses. 538499 Shipping and Handling: Mead Public Library binding shipping and handling expenses. 538501 Anniversary Maps: Mead Public Library anniversary map purchases. 539998 Marina Operations: Harbor Centre Marina operations. 539999 Miscellaneous Expense: Cost of purchases not specified elsewhere. 540100 Business Loans: Loans to small business owners. 540110 Housing Rehabilitation Loans: Loans to residential homeowners and landlords. 540117 Issuance Expense: Costs paid to Bond Advisor. 540200 Insurance: Cost for insurance coverage not specified elsewhere. 540205 Claims: Self-insurance cost of claims, health, dental and workers compensation. 540206 Stop Loss: Cost of coverage for health claims over policy maximum. 540207 Prescriptions: Self-insurance cost of prescriptions. 540210 Insurance Deductible: Liability insurance deductible. 540212 Environmental Insurance: Insurance coverage for environmental issues. 540213 Information Systems: Insurance coverage for computers. 540214 Public Official Liability: Insurance coverage for public officials. 540215 General Public Officials and Auto: Insurance coverage for buildings, automobiles and
contractor’s equipment. 540216 Umbrella Liability: Insurance coverage for items not coverage elsewhere. 540218 Flood: Insurance for flood coverage 540712 Administration: Costs associated with administration of grants. 540826 TIF Overlying Districts: Distribution to overlying TIF districts. 543999 Winterization: Harbor Centre Marina winter ice damage expense. 550900 Flex Spending: Employees account per Internal Service Revenue code. 590100 Contributions: Payments to developers and non-profit organizations. 590200 Tax Increment Distribution: Distribution of increments as districts are closed. 590250 Tax Roll Adjustments: Adjustments to the tax roll due to errors. 590255 Special Assessments: Special assessments paid to Parking Utility. 590260 Inventory Adjustment: Cost of adjusting store stock to current value. 590270 Bad Debt Expense: Cost of bank fees and other expenses associated with bad debts. 590300 Unamortized Debt Expense: Expense write off of unrealized amounts. 590400 Judgments and Settlement Expense: Cost of payments for judgments and settlements.
302

GLOSSARY The annual budget contains specialized and technical terminology that is unique to public finance and budgeting. To assist the reader of the annual budget document in understanding these terms, a budget glossary has been included in the document.
ACCRUAL BASIS OF ACCOUNTING: The method of accounting that recognizes the financial effect of transactions, events, and interfund activity when they occur, regardless of the timing of related cash flows.
APPROPRIATED BUDGET: Expenditure authority and related revenues created through a resolution of the Common Council. The appropriation budget includes all reserves, transfers, allocations, supplemental appropriations and other legally authorized legislative and executive changes.
ASSESSED VALUATION: The valuation that a government sets on real estate or other property by the City Assessor as a basis for levying taxes.
ASSETS: Resources with present service capacity that the government controls.
ASSIGNED FUND BALANCE: The portion of the net position of a governmental fund that represents resources set aside (“earmarked’) by the government for a particular purpose.
AUDIT: A comprehensive examination of the manner in which the city’s resources were actually utilized. A financial audit is a review of the accounting system and financial information to determine how government funds were spent and whether expenditures were in compliance with the Common Council’s appropriations.
BALANCED BUDGET: A plan of financial operation where total revenues match total expenditures. It is a goal of the city to propose and approve a balanced budget annually.
BOND: (Debt Instrument): A written promise to pay a specified sum of money (called the principal amount or face value) at a specified future due date (called the maturity date) along with periodic interest paid at a specified percentage of the principal (called the interest rate). Bonds are typically used for long-term debt to pay for specific capital expenditures. The difference between a note and a bond is that the latter is issued for a longer period (over 10 years) and requires greater legal formality.
BOND ANTICIPATION NOTES (BAN’S): Short term note issued to finance projects on an interim basis which will be refunded by future bond issues.
BUDGET: A financial plan for a specified period of time (year) that matches with all planned revenues and expenditures with various city services.
BUDGET ADJUSTMENT: A legal procedure requiring Common Council action to revise a budget appropriation. (City staff has the prerogative to adjust certain expenditures within a department budget).
BUDGET CALENDAR: The schedule of key dates or milestones which the city departments follow in the preparation, adoption, and administration of the budget.
BUDGET MESSAGE: The opening section of the budget which provides the Common Council and the public with a general summary of the most important aspects of the budget, changes from the current and previous fiscal years, and the views and recommendations of the City Administrator.
BUDGET RESOLUTION: The official enactment by the Common Council establishing the legal authority for the obligation and expenditures of resources.
303

CAPITAL ASSETS: Land, improvements to land, easements, buildings, building improvements, vehicles machinery, equipment, works of art and historical treasures, infrastructure, and all other tangible or intangible assets that are used in operations and that have initial useful lives extending beyond a single reporting period.
CAPITAL EXPENDITURES: The amount spent to acquire or significantly improve the capacity or capabilities of a long-term asset such as equipment or buildings. The cost is recorded as a balance sheet account.
CASH BASIS: The method of accounting under which revenues are recorded when received in cash and expenditures are recorded when paid.
CITIZEN SELF-SERVE: A citizen request for service program that distributes request to the appropriate department, tracks timeliness and provides for citizen evaluation of services rendered.
COMMITTED FUND BALANCE: The portion of the net position of a governmental fund that represents resources whose use is subject to a legally binding constraint that is imposed by the government itself at its highest level of decision-making authority and that remains legally binding unless removed in the same manner.
CONSUMER PRICE INDEX: A measure that examines the weighted average of prices of a basket of consumer goods and services, such as transportation, food, and medical care It is calculated by taking price changes for each item in the predetermined basket of goods and averaging them.
CONTINGENCY ACCOUNT: A budgetary reserve set aside for emergencies or unforeseen expenditures not otherwise budgeted for.
DEBT: A financial obligation resulting from the borrowing of money. Debts of governments include bonds, notes, leases and land contracts.
DEBT CAPACITY: An amount the organization can borrow and repay in a timely manner without forfeiting its financial viability.
DEBT LIMIT: The maximum amount of gross or net debt which is legally permitted.
DEBT MARGIN: Margin debt refers to the amount of money borrowed.
DEBT SERVICE: Amount necessary for the payment of principal, interest and related costs of the general long-term debt of the city.
DEBT SERVICE FUND: Governmental fund type used to account for accumulations of resources that are restricted, committed, or assigned to expenditures for principal and interest.
DEFICIT: The excess of an entity’s liabilities over its assets (see Fund Balance). The excess of expenditures or expenses over revenues during a single accounting period.
DEFINED BENEFIT OPEB PLAN: Plan having terms that specify the amount of benefits to be provided at or after separation from employment. The benefits may be specified in dollars (a flat dollar payment or an amount based on one or more factors such as age, years of service, and compensation), or as a type or level of coverage (prescription drugs, a percentage of healthcare insurance premiums).
DEPARTMENT: A major administrative subset of the city which indicates overall management responsibility for an operation or a group of related operations within a functional area. A department is often comprised of several divisions.
304

DEPRECIATION: (1) Expiration in the service life of fixed assets, other than wasting assets, attributable to wear and tear, deterioration, action of the physical elements, inadequacy and obsolescence. (2) The portion of the cost of a fixed asset, other than a wasting asset, charged as an expense during a particular period. In accounting for depreciation, the cost of a fixed asset, less any salvage value, is prorated over the estimated service life of such an asset, and each period is charged with a portion of such cost. Through this process, the entire cost of the asset is ultimately charged off as an expense.
ENCUMBRANCES: Commitments related to unperformed (executory) contracts for goods or services.
ENTERPRISE FUND: In governmental accounting, a type of fund provides goods or services for a fee, making the entity self-supporting.
EQUALIZED VALUE: The State’s estimate of the full value of property, used to apportion property tax levies of counties, school districts, and municipalities among tax districts.
EXPENDITURES: Under the current financial resources measurement focus, decreases in net financial resources not properly classified as other financing uses.
EXPENDITURE RESTRAINT PROGRAM: This program provided by the State as a component of State shared revenue program rewards municipalities with TID-out property tax rates above five fills that keep General Fund expenditure increases below a limit of CPI increases and a growth factor which is derived from a formula based on the previous year’s net new construction.
FIDUCIARY FUNDS: A category of funds used to report assets held in a trustee or agency capacity for others and which therefore cannot be used to support the government’s own programs. The fiduciary fund category includes pension (and other employee benefits) trust funds, investment trust funds, private-purpose trust funds, and agency funds.
FIXED ASSETS: Assets of long-term character which are intended to continue to be held or used, such as land, buildings, machinery, furniture and other equipment.
FULL-TIME EQUIVALENT: A unity indicating the workload of an employed person in a manner allowing workloads to be comparable across various contexts.
FUND: Fiscal and accounting entity with a self-balancing set of accounts recording cash and other financial resources, together with all related liabilities and residual equities or balances, and changes therein, that are segregated for the purpose of carrying on specific activities or attaining certain objectives in accordance with special regulations, restrictions, or limitations.
FUND BALANCE: Net position of a governmental fund (difference between assets, liabilities, deferred outflows of resources, and deferred inflows of resources).
GENERAL FUND: One of five governmental fund types. The general fund typically serves as the chief operating fund of a government. The general fund is used to account for all financial resources not accounted for in some other fund.
GENERAL OBLIGATION BONDS/NOTES: Bonds/Notes that finance public projects such as streets, sewers, buildings and improvements. The repayment of these bonds are backed by the “full faith and credit” of the issuing government.
GENERALLY ACCEPTED ACCOUNTING PRINCIPLES (GAAP): Conventions, rules, and procedures that serve as the norm for the fair presentation of financial statements.
GOVERNMENT FINANCE OFFICERS ASSOCIATION OF THE UNITED STATES AND CANADA: Association of public finance professionals founded in 1906 as the Municipal Finance Officers
305

Association (MFOA). The GFOA has played a major role in the development and promotion of GAAP for state and local government since its inception and has sponsored the Certificate of Achievement for Excellence in Financial Reporting Program since 1946. It also publishes Governmental Accounting, Auditing, and Financial Reporting (GAAFR), commonly known as the “Blue Book.”
GOVERNMENTAL ACCOUNTING, AUDITING AND FINANCIAL REPORTING (GAAFR): Publication of the GFOA. Also known as the “Blue Book,” various editions have been published since the mid 1930’s.
GOVERNMENTAL FUNDS: Funds generally used to account for tax-supported activities. There are five different types of governmental funds: the general fund, special revenue funds, debt service funds, capital project funds, and permanent funds.
IN LIEU OF TAXES: A contribution by benefactors of city services who are tax exempt, i.e.: certain utilities, non-profit organizations, who chose or must pay a “tax equivalent amount.”
INTERFUND RECEIVABLE: Amount of fund balance that is not expected to be repaid within one year.
INTERGOVERNMENTAL REVENUE: Revenue received from another government in the form of grants and shared revenues. Typically, these contributions are made to local governments from the State and Federal governments and are made for specified purposes.
INTERNAL SERVICE FUND: In governmental accounting, a type of fund that primarily provides benefits, goods or services to other funds, departments or agencies on a cost–reimbursement basis.
INTRAFUND TRANSFER: Amounts transferred within a fund from one expenditure category to another, i.e., an adjustment to the appropriation.
INVENTORY: Fund balance amounts that are considered nonspendable.
INVESTMENT INCOME: Income earned on idle funds which are not immediately needed by the city.
LIABILITIES: Present obligations to sacrifice resources that the government has little or no discretion to avoid.
LINE ITEM: A basis for distinguishing types of revenues and expenditures.
MAJOR FUND: Funds in which the revenues, expenditures, assets or liabilities are at least ten percent of the total for their fund category and five percent of the aggregate for all governmental and enterprise funds in total.
MISCELLANEOUS REVENUE: Revenues which are not required to be accounted for elsewhere.
MODIFIED ACCRUAL BASIS OF ACCOUNTING: Basis of accounting used in conjunction with the current financial resources measurement focus that modifies the accrual basis of accounting in two important ways: 1) revenues are not recognized until they are measurable and available and 2) expenditures are recognized in the period in which governments in general normally liquidate the related liability rather than when that liability is first incurred (if earlier).
NET INVESTMENT IN CAPITAL ASSETS: One of three components of net position that must be reported in both government-wide and proprietary fund financial statements. It consists of capital assets, net of accumulated depreciation, reduced by the outstanding balances of borrowings attributable to the acquisition, construction, or improvement of those assets. Deferred outflows of resources and deferred inflows of resources attributable to the acquisition, construction, or improvement of those assets or related debt also should be included. If there are significant unspent
306

related debt proceeds or deferred inflows of resources at the end of the reporting period, the portion of the debt or deferred inflows of resources attributable to the unspent amount should not be included.
NET PENSION/OPEB OBLIGATION: A liability that can result from an employer’s failure to fully fund its annual required contribution.
NET POSITION: The residual of all other financial statement elements presented in a statement of financial position. NON-MAJOR FUND: Funds that do not meet the criteria of a Major Fund. These funds are segregated into four different fund types including special revenue, debit service, capital projects and permanent funds.
NON-PERSONAL SERVICES: Items of expenditures in the operating budget for all non-employee related operating expenditures.
NON-SPENDABLE FUND BALANCE: The portion of the net position of a governmental fund that cannot be spent either because the underlying resources are not in spendable form or because the government is legally or contractually required to maintain the resources intact. NOTE ANTICIPATION NOTE (NANS): A short-term interest-bearing security issued in advance of a larger, future note issue that is issued for temporary financing needs by a municipality. OPERATING TRANSFER: Routine and/or recurring transfers of assets between funds. PERSONAL SERVICES: Items of expenditures in the operating budget for salaries and wages paid for services performed by city employees, as well as the fringe benefit costs associated with city employment.
PROGRAM BUDGET: A budget which structures budget choices and information in terms of programs and their related work activities (i.e., repairing roads, treating water, etc), provides information on what each program is committed to accomplish in the long term (goals) and in the short term (objectives), and measures the degree of achievement of program objectives (performance measures).
PROPRIETARY FUNDS: Funds that focus on the determination of operating income, changes in net position (or cost recovery), financial position, and cash flows. There are two types of proprietary funds: enterprise funds and internal service funds.
RESERVED RETAINED EARNINGS: Accounts for the portion of funds not available for appropriation.
RESTRICTED FUND BALANCE: The portion of the net position of a governmental fund that represents resources subject to externally enforceable constraints.
RETAINED EARNINGS: The accumulated net earnings on an entity that are retained by the entity at the end of a designated reporting period.
REVENUE: Funds that the government receives as income. It includes such items as tax payments, fees from specific services, receipts from other governments, fines, forfeitures, grants, shared revenues and interest income.
SALARIES: Items of expenditure in the operating budget for salaries and wages paid for services performed by city employees.
307

SHARED REVENUE: Revenues levied by one government but shared on a predetermined basis, often in proportion to the amount collected at the local level, with another government or class of governments.
SPECIAL ASSESSMENT: Compulsory levy made against certain properties to defray all or part of the cost of a specific capital improvement or service deemed to benefit primarily those properties.
SPECIAL REVENUE FUND: Governmental fund type used to account for the proceeds of specific revenue sources that are restricted or committed to expenditure for specified purposes other than debt service or capital projects and exclusive of resources held in trust for individuals, private organizations, or other governments.
TAXES: Compulsory charges levied by a government for the purpose of financing services performed for the common benefit of the people.
TAX INCREMENTAL DISTRICT: A district created by local governments under State Statute whereby public improvement expenditures within the district are financed by the levy on the incremental increase in property values.
TAX LEVY: The total amount to be raised by general property taxes for operating and debt service purpose specified in the Common Council’s Adopted Budget.
TAX RATE: The amount of tax levied for each $1,000 of valuation. The equalized (full) value tax rate is calculated using the equalized value of the city. The assessed value tax rate is calculated using assessed value.
TRAINING/CONFERENCES: Items of expenditure for travel and training costs incurred by the city on behalf of employees. These include mileage, meals, conferences, conventions related to in and out of state travel.
UNASSIGNED FUND BALANCE: The difference between total fund balance in a governmental fund and its non-spendable, restricted, committed, and assigned components.
UNRESTRICTED FUND BALANCE: The difference between total fund balance in a governmental fund and its non-spendable and restricted components.
USER CHARGE/FEE: The payment for direct receipt of a public service by the party benefiting from the service.
WASTING ASSET: Asset which has a limited life and therefore decreases in value over time.
308

GLOSSARY
ACRONYMS
ADA: Americans with Disabilities Act CDBG: Community Development Block Grant CIP: Capital Improvement Program CPI: Consumer Price Index CMAQ: Congestion mitigation and air quality CMAQ: Compliance Maintenance Annual Report CVMIC: Cities and Villages Mutual Insurance Company DNR: Department of Natural Resources EMS: Emergency Medical Services EMT: Emergency Medical Technician ERP: Expenditure Restraint Program FTA: Federal Transit Administration FTE: Full-time equivalent GAAFR: Governmental Accounting, Auditing and Financial Reporting GAAP: Generally Accepted Accounting Principles GASB 54: Governmental Accounting Standards Board GFOA: Government Finance Officers Association G. O.: General Obligation HSA: Health Savings Account HUD: U S Department of Housing and Urban Development ISO: Insurance Service Office ISWMP: Integrated Solid Waste Management Program IT: Information Technology LTC: Lakeshore Technical College LTFP: Long Term Financial Plan MEG: Multi-Jurisdictional Enforcement Group MUTCD: Manual on Uniform Traffic Control Devices NFRIS: National Fire Incident Reporting System NOAA: National Oceanic and Atmospheric Administration O & M: Operations and Maintenance PDD: Planning and Development Division SASD: Sheboygan Area School District SET: Safety, Education and Training TID: Tax Incremental District TIME: Transaction of Information for Police Management of Enforcement WCMA: Wisconsin County/City Manager Association WDNR: Wisconsin Department of Natural Resources WDOT: Wisconsin Department of Transportation WMIC: Wisconsin Mutual Insurance Company WPDES: Wisconsin Pollution Discharge Elimination System WWTP: Waste Water Treatment Plant
309

CITY OF SHEBOYGAN
NOTES
310


City of Sheboygan 828 Center Avenue
Sheboygan, WI 53081 920-459-4000
www.sheboyganwi.gov