2020 AGM PRESENTATION
40
2020 AGM PRESENTATION 30 October 2020
Transcript of 2020 AGM PRESENTATION

2020 AGMPRESENTATION30 October 2020
DISCLAIMER AND NON-IFRS INFORMATION
Disclaimer
The material in this presentation has been
prepared by carsales.com Limited (ASX:
CAR) ABN 91 074 444 018 (“carsales") and
is general background information about
carsales’ activities current as at the date of
this presentation. The information is given
in summary form and does not purport to
be complete. In particular you are
cautioned not to place undue reliance on
any forward looking statements regarding
our belief, intent or expectations with
respect to carsales’ businesses, market
conditions and/or results of operations, as
although due care has been used in the
preparation of such statements, actual
results may vary in a material manner.
Information in this presentation, including
forecast financial information, should not
be considered advice or a
recommendation to investors or potential
investors in relation to holding, purchasing
or selling securities. Before acting on any
information you should consider the
appropriateness of the information having
regard to these matters, any relevant offer
document and in particular, you should
seek independent financial advice.
Non-IFRS Financial Information
carsales' results are reported under
International Financial Reporting
Standards (IFRS). This presentation also
includes certain non-IFRS measures
including “adjusted”, “underlying”
“proforma” and “look-through”. These
measures are used internally by
management to assess the performance
of our business and our associates, make
decisions on the allocation of resources
and assess operational management.
Non-IFRS measures have not been subject
to audit or review. All numbers listed as
reported comply with IFRS.
2

DELIVERING STRONG SHARHOLDER RETURNS
3
0%
100%
200%
300%
400%
500%
600%
14
-Oct
-09
14
-Ap
r-1
0
14
-Oct
-10
14
-Ap
r-1
1
14
-Oct
-11
14
-Ap
r-1
2
14
-Oct
-12
14
-Ap
r-1
3
14
-Oct
-13
14
-Ap
r-1
4
14
-Oct
-14
14
-Ap
r-1
5
14
-Oct
-15
14
-Ap
r-1
6
14
-Oct
-16
14
-Ap
r-1
7
14
-Oct
-17
14
-Ap
r-1
8
14
-Oct
-18
14
-Ap
r-1
9
14
-Oct
-19
14
-Ap
r-2
0
14
-Oct
-20
carsales S&P ASX200
556%
113%
Carsales (CAR) Total Shareholder Return (TSR) v S&P ASX200 Total Return Index (AXNT) 1
1 Total Shareholder Returns (TSR) includes dividend and share price appreciation from 10 September 2009 to 14 October 2020.
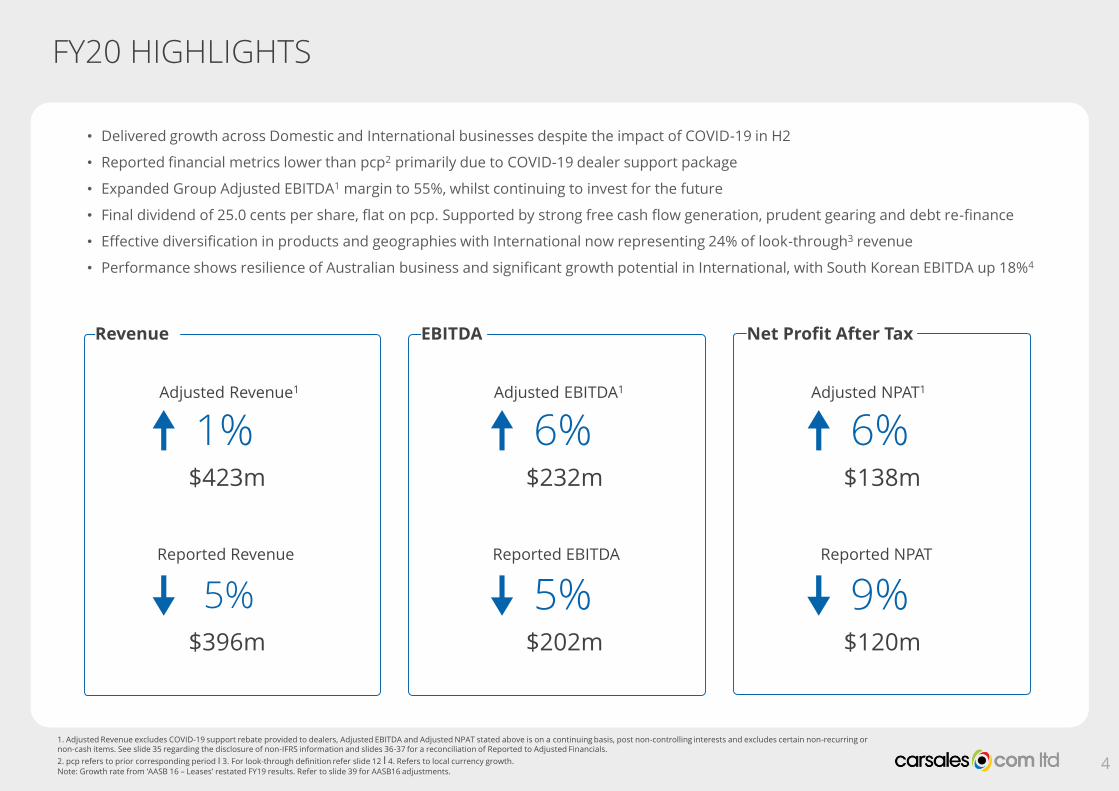
6%$138m
9%$120m
FY20 HIGHLIGHTS
1. Adjusted Revenue excludes COVID-19 support rebate provided to dealers, Adjusted EBITDA and Adjusted NPAT stated above is on a continuing basis, post non-controlling interests and excludes certain non-recurring or non-cash items. See slide 35 regarding the disclosure of non-IFRS information and slides 36-37 for a reconciliation of Reported to Adjusted Financials.
2. pcp refers to prior corresponding period I 3. For look-through definition refer slide 12 I 4. Refers to local currency growth.
Note: Growth rate from ‘AASB 16 – Leases’ restated FY19 results. Refer to slide 39 for AASB16 adjustments. 4
Reported NPAT
5%$396m
5%$202m
• Delivered growth across Domestic and International businesses despite the impact of COVID-19 in H2
• Reported financial metrics lower than pcp2 primarily due to COVID-19 dealer support package
• Expanded Group Adjusted EBITDA1 margin to 55%, whilst continuing to invest for the future
• Final dividend of 25.0 cents per share, flat on pcp. Supported by strong free cash flow generation, prudent gearing and debt re-finance
• Effective diversification in products and geographies with International now representing 24% of look-through3 revenue
• Performance shows resilience of Australian business and significant growth potential in International, with South Korean EBITDA up 18%4
1%$423m
6%$232m
Revenue EBITDA
Reported Revenue Reported EBITDA
Adjusted Revenue1 Adjusted EBITDA1 Adjusted NPAT1
Net Profit After Tax
1. Stock published for websites in Australia, South Korea, Brazil, Mexico, Argentina and Chile on 30 Jun 2020 v 30 Jun 2019. I 2. Median time to sell 30 June 2020 v 30 June 2019. I 3. Leads from websites in Australia, South Korea,
Brazil, Mexico, Argentina and Chile Jul-19 – Jun-20 v Jul-18 – Jun-19. I 4. Google Analytics, sessions for websites in Australia, South Korea, Brazil, Mexico, Argentina and Chile Jul-19 – Jun-20 v Jul-18 – Jun-19. 5 carsales internal data. 6 carsales internal data, cars inspected Jul-19 – Jun-20 v Jul-18 – Jun-19. 7 Study conducted by independent research agency Nature Pty Ltd Market brand health tracker. Jun-20. Reputation - Is Trustworthy (Rated 7-10). 8 Nielsen DCR, Monthly average Jul-19 – Jun-20.
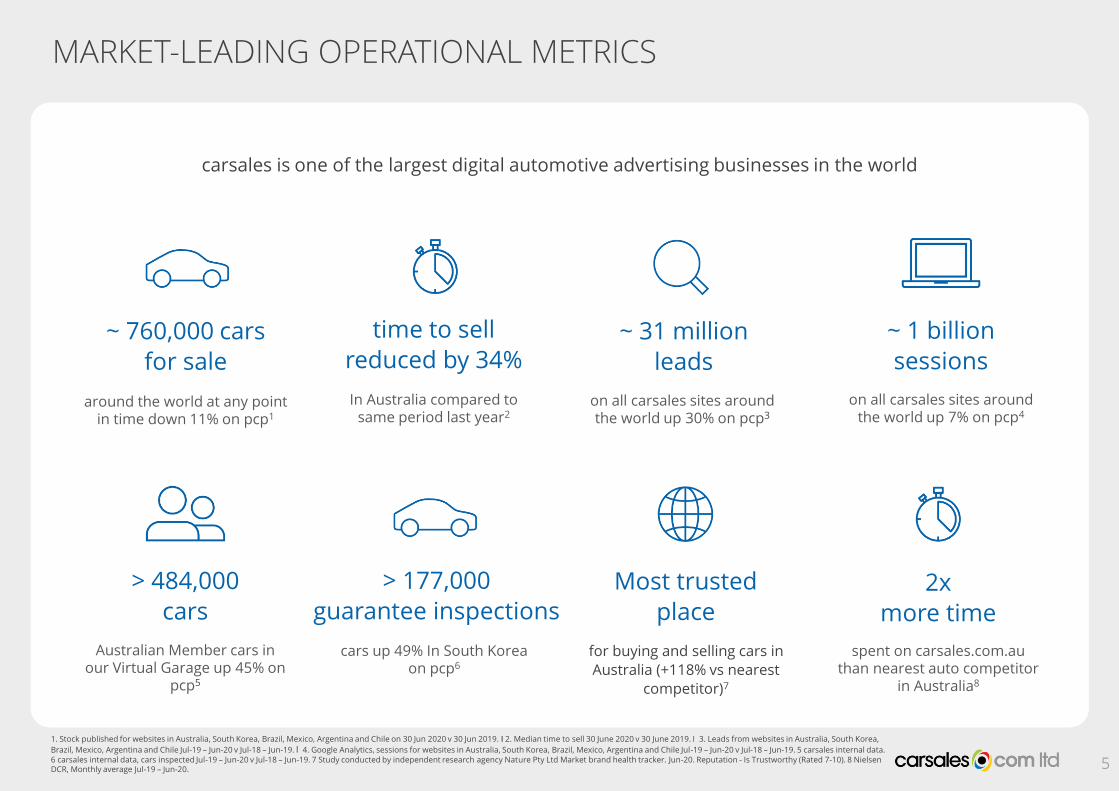
MARKET-LEADING OPERATIONAL METRICS
5
carsales is one of the largest digital automotive advertising businesses in the world
2x
more time
spent on carsales.com.au than nearest auto competitor
in Australia8
~ 1 billion
sessions
on all carsales sites around the world up 7% on pcp4
on all carsales sites around the world up 30% on pcp3
~ 31 million
leads
> 484,000
cars
Australian Member cars in our Virtual Garage up 45% on
pcp5
~ 760,000 cars
for sale
around the world at any point in time down 11% on pcp1
for buying and selling cars in
Australia (+118% vs nearest
competitor)7
Most trusted
place
In Australia compared to same period last year2
time to sell
reduced by 34%
> 177,000
guarantee inspections
cars up 49% In South Korea on pcp6
EXTENDING OUR AUSTRALIAN MARKET LEADERSHIP
6
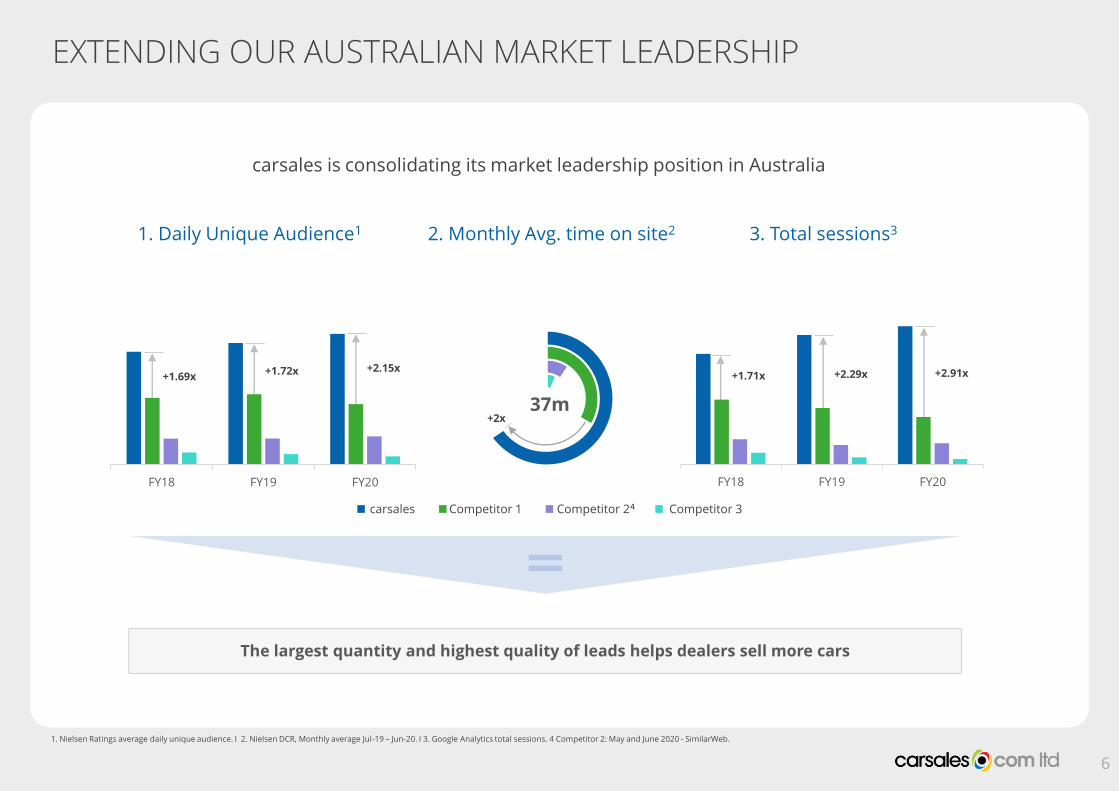
1. Nielsen Ratings average daily unique audience. I 2. Nielsen DCR, Monthly average Jul-19 – Jun-20. I 3. Google Analytics total sessions. 4 Competitor 2: May and June 2020 - SimilarWeb.
+1.69x
1. Daily Unique Audience1 2. Monthly Avg. time on site2 3. Total sessions3
+1.72x +2.15x+1.71x +2.29x +2.91x
The largest quantity and highest quality of leads helps dealers sell more cars
carsales is consolidating its market leadership position in Australia
+2x37m
carsales Competitor 1 Competitor 24 Competitor 3
FY18 FY19 FY20 FY18 FY19 FY20

7
RESPONSE TO COVID-19 AND EMERGING TRENDS
8
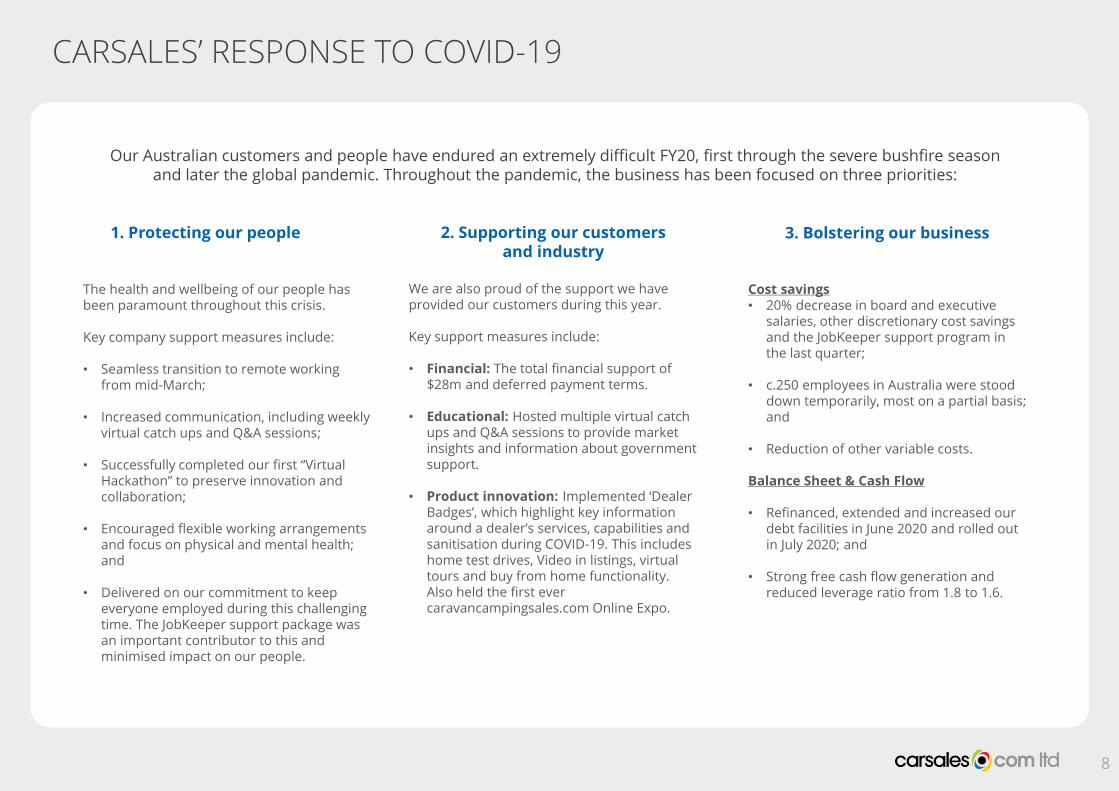
CARSALES’ RESPONSE TO COVID-19
Our Australian customers and people have endured an extremely difficult FY20, first through the severe bushfire season and later the global pandemic. Throughout the pandemic, the business has been focused on three priorities:
2. Supporting our customers and industry
1. Protecting our people 3. Bolstering our business
We are also proud of the support we have provided our customers during this year.
Key support measures include:
• Financial: The total financial support of $28m and deferred payment terms.
• Educational: Hosted multiple virtual catch ups and Q&A sessions to provide market insights and information about government support.
• Product innovation: Implemented ‘Dealer Badges’, which highlight key information around a dealer’s services, capabilities and sanitisation during COVID-19. This includes home test drives, Video in listings, virtual tours and buy from home functionality. Also held the first ever caravancampingsales.com Online Expo.
The health and wellbeing of our people has been paramount throughout this crisis.
Key company support measures include:
• Seamless transition to remote working from mid-March;
• Increased communication, including weekly virtual catch ups and Q&A sessions;
• Successfully completed our first “Virtual Hackathon” to preserve innovation and collaboration;
• Encouraged flexible working arrangements and focus on physical and mental health; and
• Delivered on our commitment to keep everyone employed during this challenging time. The JobKeeper support package was an important contributor to this and minimised impact on our people.
Cost savings• 20% decrease in board and executive
salaries, other discretionary cost savings and the JobKeeper support program in the last quarter;
• c.250 employees in Australia were stood down temporarily, most on a partial basis; and
• Reduction of other variable costs.
Balance Sheet & Cash Flow
• Refinanced, extended and increased our debt facilities in June 2020 and rolled out in July 2020; and
• Strong free cash flow generation and reduced leverage ratio from 1.8 to 1.6.
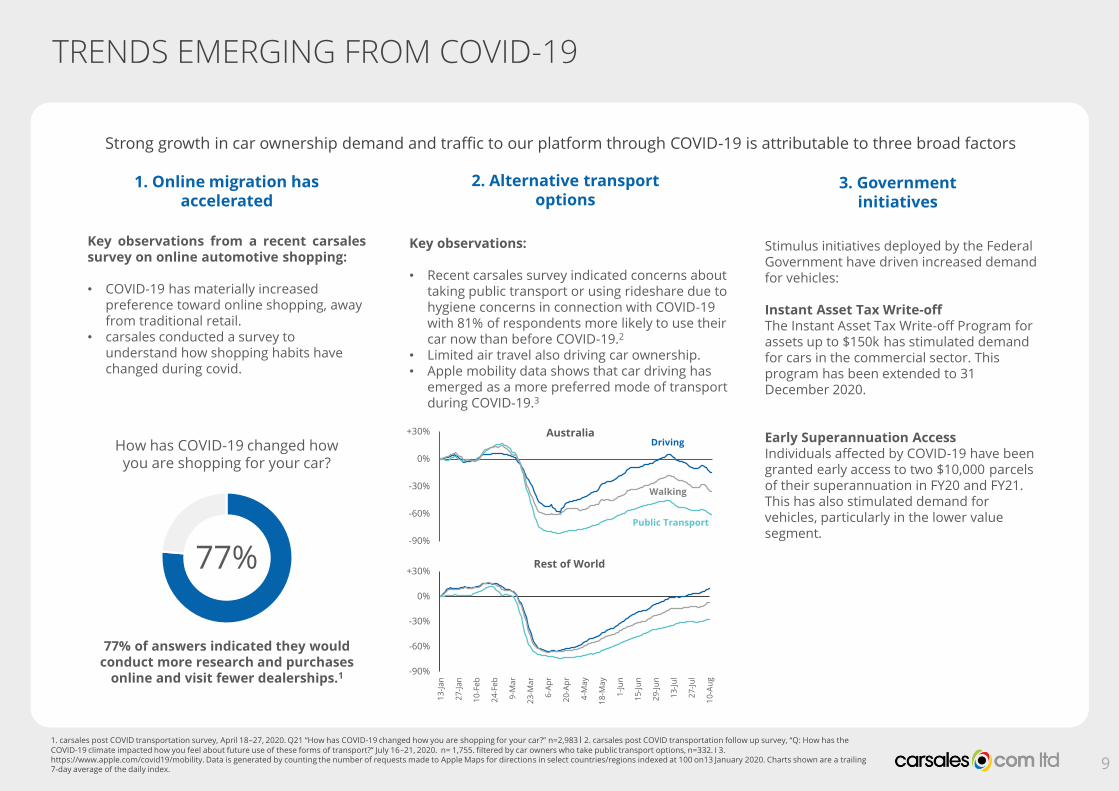
Key observations:
• Recent carsales survey indicated concerns about taking public transport or using rideshare due to hygiene concerns in connection with COVID-19 with 81% of respondents more likely to use their car now than before COVID-19.2
• Limited air travel also driving car ownership.• Apple mobility data shows that car driving has
emerged as a more preferred mode of transport during COVID-19.3
-90%
-60%
-30%
0%
+30%1
3-J
an
27
-Ja
n
10
-Fe
b
24
-Fe
b
9-M
ar
23
-Ma
r
6-A
pr
20
-Ap
r
4-M
ay
18
-Ma
y
1-J
un
15
-Ju
n
29
-Ju
n
13
-Ju
l
27
-Ju
l
10
-Au
g
9
TRENDS EMERGING FROM COVID-19
Strong growth in car ownership demand and traffic to our platform through COVID-19 is attributable to three broad factors
Stimulus initiatives deployed by the Federal Government have driven increased demand for vehicles:
Instant Asset Tax Write-off The Instant Asset Tax Write-off Program for assets up to $150k has stimulated demand for cars in the commercial sector. This program has been extended to 31 December 2020.
Early Superannuation AccessIndividuals affected by COVID-19 have been granted early access to two $10,000 parcels of their superannuation in FY20 and FY21. This has also stimulated demand for vehicles, particularly in the lower value segment.
3. Government initiatives
1. Online migration has accelerated
77% of answers indicated they would conduct more research and purchases
online and visit fewer dealerships.1
77%
Key observations from a recent carsalessurvey on online automotive shopping:
• COVID-19 has materially increased preference toward online shopping, away from traditional retail.
• carsales conducted a survey to understand how shopping habits have changed during covid.
How has COVID-19 changed how you are shopping for your car?
2. Alternative transport options
Australia
1. carsales post COVID transportation survey, April 18–27, 2020. Q21 “How has COVID-19 changed how you are shopping for your car?” n=2,983 I 2. carsales post COVID transportation follow up survey, “Q: How has the COVID-19 climate impacted how you feel about future use of these forms of transport?” July 16–21, 2020. n= 1,755. filtered by car owners who take public transport options, n=332. I 3. https://www.apple.com/covid19/mobility. Data is generated by counting the number of requests made to Apple Maps for directions in select countries/regions indexed at 100 on13 January 2020. Charts shown are a trailing 7-day average of the daily index.
Rest of World
Driving
Public Transport
Walking
-90%
-60%
-30%
0%
+30%
13
-Ja
n
27
-Ja
n
10
-Fe
b
24
-Fe
b
9-M
ar
23
-Ma
r
6-A
pr
20
-Ap
r
4-M
ay
18
-Ma
y
1-J
un
15
-Ju
n
29
-Ju
n
13
-Ju
l
27
-Ju
l
10
-Au
g

GROUP FINANCIAL REVIEW
10

105.9
116.2
127.1 130.2 138.2
FY16 FY17 FY18 FY19 FY20
283.1
319.0
376.9
417.5 423.1
FY16 FY17 FY18 FY19 FY20
STRONG TRACK RECORD OF SUSTAINED GROWTH
1. Adjusted Revenue, Adjusted EBITDA and Adjusted NPAT is on a continuing basis, post non-controlling interests and excludes certain non-recurring or non-cash items. See slide 35 regarding the disclosure of non-IFRS Information and slides 36-37 for a reconciliation of Reported to Adjusted Financials
Note: FY16 - FY19 financials have been restated to reflect the adoption of AASB16. Refer to slide 39 for AASB16 adjustments.
Adjusted EBITDA1 ($m)Adjusted Revenue1 ($m) Adjusted NPAT 1 ($m)
CAGR
7%CAGR
10%CAGR
11%
Well positioned to continue delivering long-term shareholder value through world-class capability, exposure to international growth markets and investment in new products and services.
157.7169.8
201.6
217.9231.8
FY16 FY17 FY18 FY19 FY20
11
92% 91%86% 83% 81%
8%9%
14% 17%19%
167.5181.2
211.7224.1
240.2
FY16 FY17 FY18 FY19 FY20
carsales Domestic carsales International
89% 87%83% 78% 76%
11%13%
17%22% 24%
300.2334.5
394.1424.7 436.6
FY16 FY17 FY18 FY19 FY20
carsales Domestic carsales International
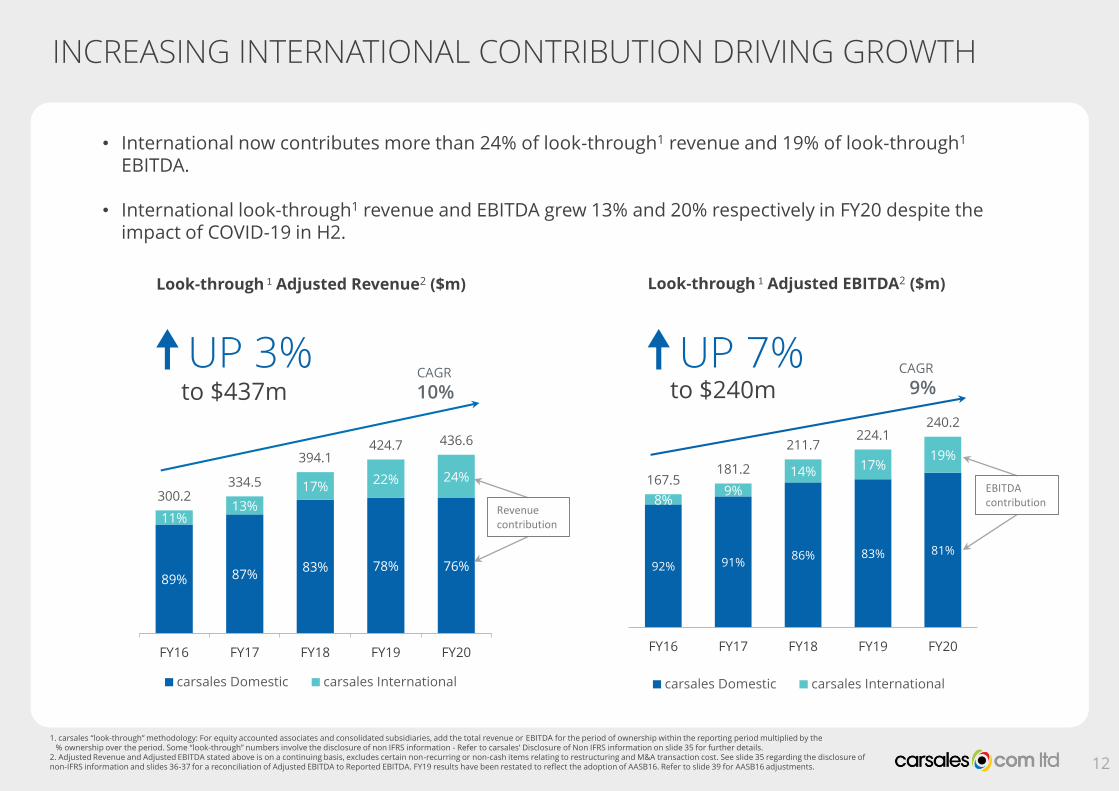
INCREASING INTERNATIONAL CONTRIBUTION DRIVING GROWTH
CAGR
10%
CAGR
9%
1. carsales “look-through” methodology: For equity accounted associates and consolidated subsidiaries, add the total revenue or EBITDA for the period of ownership within the reporting period multiplied by the % ownership over the period. Some “look-through” numbers involve the disclosure of non IFRS information - Refer to carsales’ Disclosure of Non IFRS information on slide 35 for further details.
2. Adjusted Revenue and Adjusted EBITDA stated above is on a continuing basis, excludes certain non-recurring or non-cash items relating to restructuring and M&A transaction cost. See slide 35 regarding the disclosure of non-IFRS information and slides 36-37 for a reconciliation of Adjusted EBITDA to Reported EBITDA. FY19 results have been restated to reflect the adoption of AASB16. Refer to slide 39 for AASB16 adjustments.
• International now contributes more than 24% of look-through1 revenue and 19% of look-through1
EBITDA.
• International look-through1 revenue and EBITDA grew 13% and 20% respectively in FY20 despite the impact of COVID-19 in H2.
12
UP 3%to $437m
Look-through 1 Adjusted Revenue2 ($m)
UP 7%to $240m
Look-through 1 Adjusted EBITDA2 ($m)
Revenue contribution
EBITDA contribution
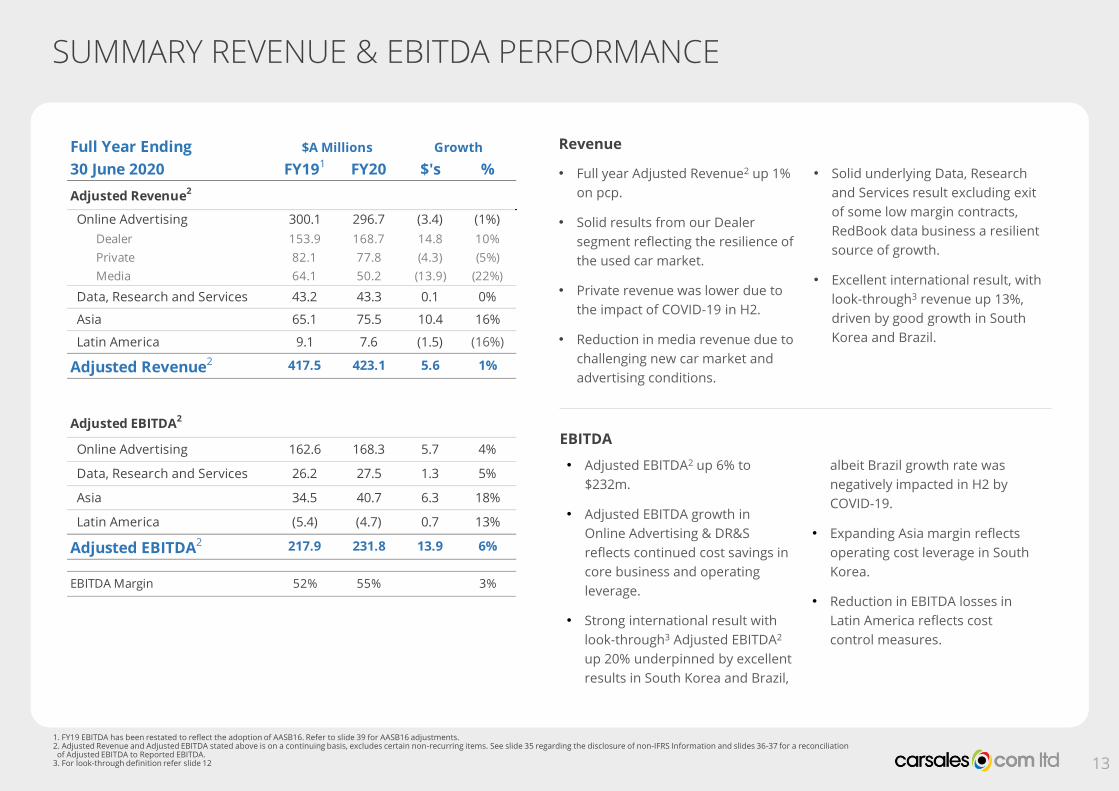
• Full year Adjusted Revenue2 up 1%
on pcp.
• Solid results from our Dealer
segment reflecting the resilience of
the used car market.
• Private revenue was lower due to
the impact of COVID-19 in H2.
• Reduction in media revenue due to
challenging new car market and
advertising conditions.
• Solid underlying Data, Research
and Services result excluding exit
of some low margin contracts,
RedBook data business a resilient
source of growth.
• Excellent international result, with
look-through3 revenue up 13%,
driven by good growth in South
Korea and Brazil.
SUMMARY REVENUE & EBITDA PERFORMANCE
EBITDA
Revenue
1. FY19 EBITDA has been restated to reflect the adoption of AASB16. Refer to slide 39 for AASB16 adjustments. 2. Adjusted Revenue and Adjusted EBITDA stated above is on a continuing basis, excludes certain non-recurring items. See slide 35 regarding the disclosure of non-IFRS Information and slides 36-37 for a reconciliation of Adjusted EBITDA to Reported EBITDA.
3. For look-through definition refer slide 12 13
• Adjusted EBITDA2 up 6% to
$232m.
• Adjusted EBITDA growth in
Online Advertising & DR&S
reflects continued cost savings in
core business and operating
leverage.
• Strong international result with
look-through3 Adjusted EBITDA2
up 20% underpinned by excellent
results in South Korea and Brazil,
albeit Brazil growth rate was
negatively impacted in H2 by
COVID-19.
• Expanding Asia margin reflects
operating cost leverage in South
Korea.
• Reduction in EBITDA losses in
Latin America reflects cost
control measures.
FY191 FY20 $'s %
Adjusted Revenue2
Online Advertising 300.1 296.7 (3.4) (1%)
Dealer 153.9 168.7 14.8 10%
Private 82.1 77.8 (4.3) (5%)
Media 64.1 50.2 (13.9) (22%)
Data, Research and Services 43.2 43.3 0.1 0%
Asia 65.1 75.5 10.4 16%
Latin America 9.1 7.6 (1.5) (16%)
Adjusted Revenue2 417.5 423.1 5.6 1%
Adjusted EBITDA2
Online Advertising 162.6 168.3 5.7 4%
Data, Research and Services 26.2 27.5 1.3 5%
Asia 34.5 40.7 6.3 18%
Latin America (5.4) (4.7) 0.7 13%
Adjusted EBITDA2 217.9 231.8 13.9 6%
EBITDA Margin 52% 55% 3%
Full Year Ending
30 June 2020
Growth$A Millions

GOOD EXPANSION IN DOMESTIC AND INTERNATIONAL MARGINS
1. Adjusted EBITDA stated above is on a continuing basis, excludes certain non-recurring or non-cash items relating to restructuring and M&A transaction cost. See slide 35 regarding the disclosure of non-IFRS information and slides 36-37 for a reconciliation of Reported to Adjusted Financials.
2. FY19 results have been restated to reflect the adoption of AASB16. Refer to slide 39 for AASB16 adjustments.14
Good growth in overall margin from 52% to 55%, driven by expansion across all segments, particularly in the Domestic core business.
Domestic highlights
• Domestic core business margin expanded from 62.4% to 65.2% in FY20, reflecting a range of cost control measures including reduced marketing spend, wages and other discretionary costs.
• Domestic investments of tyresales and RedBook Inspect improved EBITDA margin by 0.1%.
International highlights
• Asia growth reflects margin expansion in South Korea.
• Reduced losses in Latin America had a positive impact on overall margins.
Domestic Core BusinessFY192 Adjusted EBITDA1 Margin
Other Domestic Investments
2.0% 0.1%
52.2%
0.2%
Asia
0.4%
Latin America FY20 Adjusted EBITDA1 Margin
54.8%
ADJUSTED NET PROFIT AFTER TAX SUMMARY
1. FY19 results have been restated to reflect the adoption of AASB16. Refer to slide 39 for AASB16 adjustments.2. Adjusted Revenue, Adjusted EBITDA and Adjusted NPAT stated above is on a continuing operations basis, post non-controlling interests and excludes certain non-recurring or non-cash items. See slide 35 regarding the disclosure of
non-IFRS Information and slides 36-37 for a reconciliation of Reported to Adjusted Financials .
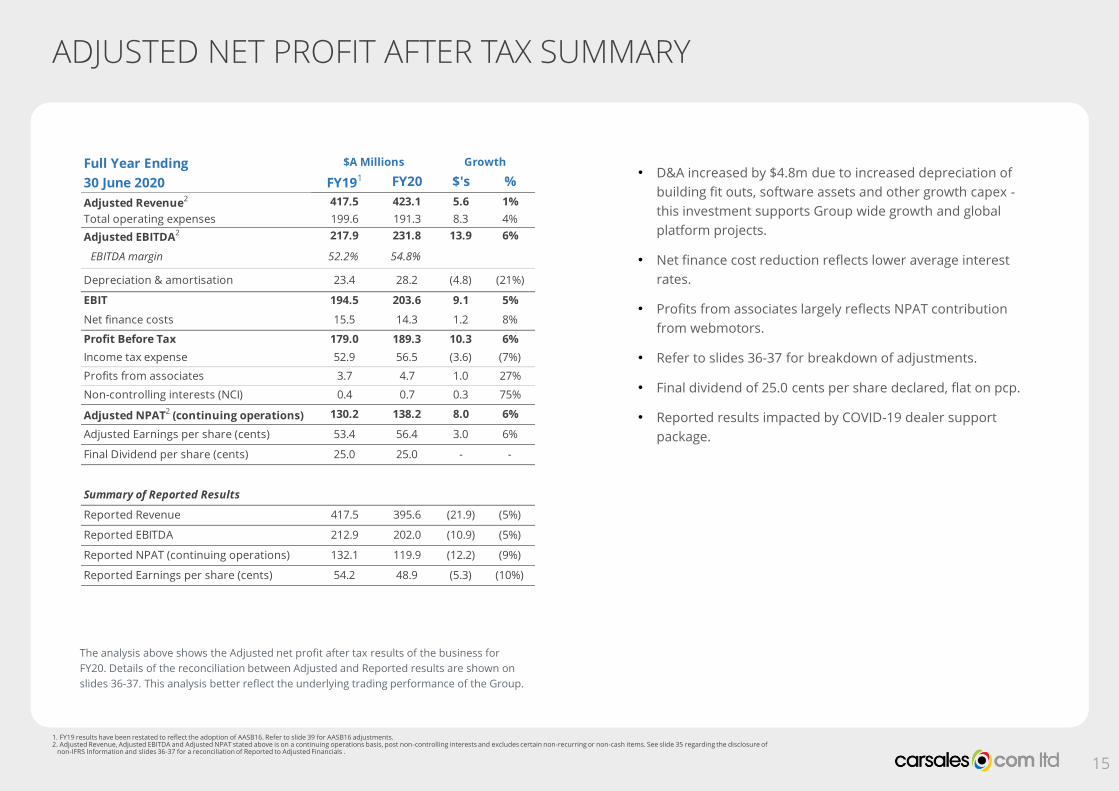
The analysis above shows the Adjusted net profit after tax results of the business for
FY20. Details of the reconciliation between Adjusted and Reported results are shown on
slides 36-37. This analysis better reflect the underlying trading performance of the Group.
15
• D&A increased by $4.8m due to increased depreciation of
building fit outs, software assets and other growth capex -
this investment supports Group wide growth and global
platform projects.
• Net finance cost reduction reflects lower average interest
rates.
• Profits from associates largely reflects NPAT contribution
from webmotors.
• Refer to slides 36-37 for breakdown of adjustments.
• Final dividend of 25.0 cents per share declared, flat on pcp.
• Reported results impacted by COVID-19 dealer support
package.
FY191 FY20 $'s %
Adjusted Revenue2 417.5 423.1 5.6 1%
Total operating expenses 199.6 191.3 8.3 4%
Adjusted EBITDA2 217.9 231.8 13.9 6%
EBITDA margin 52.2% 54.8%
Depreciation & amortisation 23.4 28.2 (4.8) (21%)
EBIT 194.5 203.6 9.1 5%
Net finance costs 15.5 14.3 1.2 8%
Profit Before Tax 179.0 189.3 10.3 6%
Income tax expense 52.9 56.5 (3.6) (7%)
Profits from associates 3.7 4.7 1.0 27%
Non-controlling interests (NCI) 0.4 0.7 0.3 75%
Adjusted NPAT2 (continuing operations) 130.2 138.2 8.0 6%
Adjusted Earnings per share (cents) 53.4 56.4 3.0 6%
Final Dividend per share (cents) 25.0 25.0 - -
Summary of Reported Results
Reported Revenue 417.5 395.6 (21.9) (5%)
Reported EBITDA 212.9 202.0 (10.9) (5%)
Reported NPAT (continuing operations) 132.1 119.9 (12.2) (9%)
Reported Earnings per share (cents) 54.2 48.9 (5.3) (10%)
Full Year Ending
30 June 2020
Growth$A Millions
24.527.5
2.2
10
15
20
25
30
35
FY19 FY20
Office Fitouts
Capex
157.7 171.3
185.5
210.0 216.1
100% 101%
92%
99%
107%
40%
50%
60%
70%
80%
90%
100%
110%
120%
130%
140%
(20.0)
30.0
80.0
130.0
180.0
230.0
FY16 FY17 FY18 FY19 FY20
($m)
STRONG CASH FLOW FROM OPERATIONS AND ROBUST BALANCE SHEET
1. Net debt includes total borrowings and cross currency interest swaps less total cash as at 30 June 2020 as per published balance sheet, excluding Stratton and lease liabilities. Ratios above are based on reported financial outcomes and may vary with bank covenant definitions.
2. Operating cash flow less tax (excluding Stratton). 3. Adjusted EBITDA stated above is on a continuing basis, excludes certain non-recurring items. See slide 35 regarding the disclosure of non-IFRS Information and slides 36-37 for a reconciliation of Adjusted EBITDA to
Reported EBITDA. FY16 - FY19 results have been restated to reflect the adoption of AASB16. Refer to slide 39 for AASB16 adjustments.
1.8
1.6
FY19
FY20
Leverage Ratio1
(Net Debt/Adjusted EBITDA3)
Net debt1
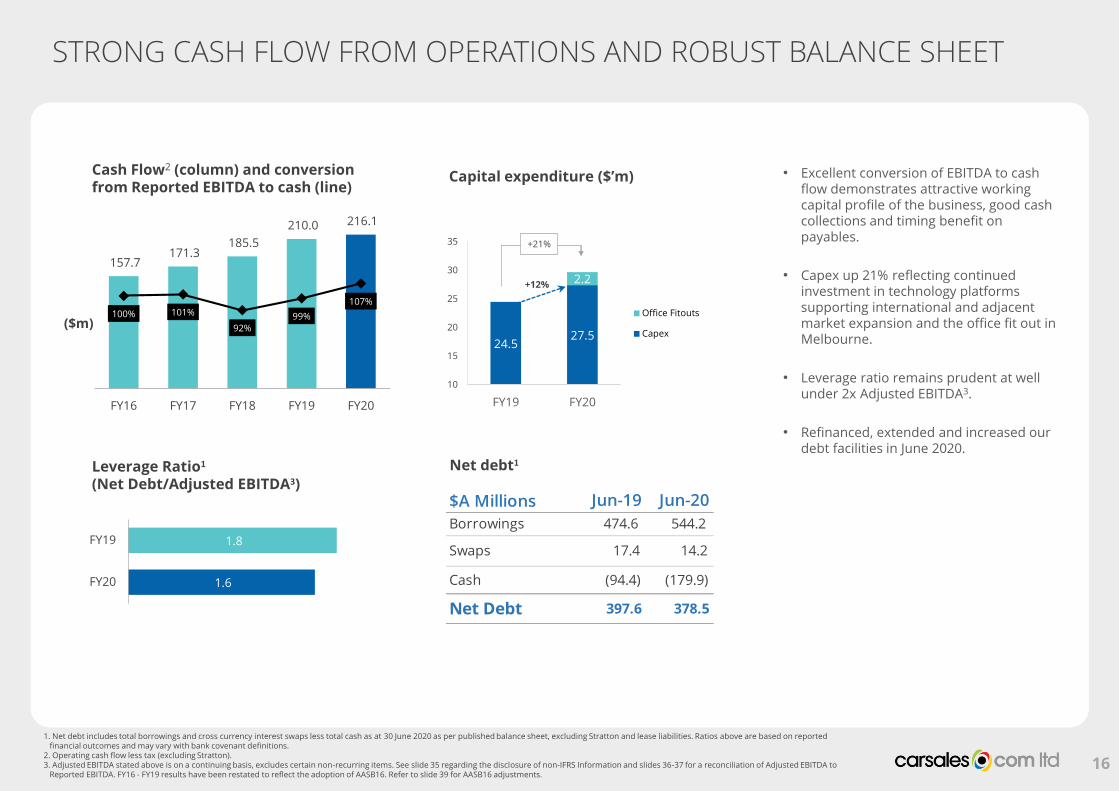
• Excellent conversion of EBITDA to cash flow demonstrates attractive working capital profile of the business, good cash collections and timing benefit on payables.
• Capex up 21% reflecting continued investment in technology platforms supporting international and adjacent market expansion and the office fit out in Melbourne.
• Leverage ratio remains prudent at well under 2x Adjusted EBITDA3.
• Refinanced, extended and increased our debt facilities in June 2020.
Capital expenditure ($’m)
16
+21%
Cash Flow2 (column) and conversion from Reported EBITDA to cash (line)
+12%
$A Millions Jun-19 Jun-20
Borrowings 474.6 544.2
Swaps 17.4 14.2
Cash (94.4) (179.9)
Net Debt 397.6 378.5

CARSALES AUSTRALIA
17

FY15 FY16 FY17 FY18 FY19 FY20
($m)
DEALER
18
• Breadth of product offering and resilience of used car business
underpinned solid Dealer performance.
• The used car lead volumes a key growth driver, reflecting
continued market leadership and strength of used car market.
Demand positively impacted in H2 by the car ownership trends
emerging from COVID-19 (refer slide 9 for further detail).
• Also observed pleasing growth in depth products, reflecting the
strong return on investment these products provide – refer
graph adjacent.
+10% Depth Revenue
CAGR
21%
Dealer Adjusted Revenue1 up 10% to $168.7m
Pleasing continued growth in depth products despite a tough discretionary spend environment, highlighting
the value of depth products.
1. Adjusted Revenue stated above excludes COVID-19 support rebate provided to dealers. See slide 35 regarding the disclosure of non-IFRS information and slides 36-37 for a reconciliation of Reported to Adjusted Financials.
153.9 168.7
FY19 FY20
146.4(reported)

PRIVATE
19
• Solid growth of 7% in H1 and a decline of 17% in H2. Growth in
H1 reflective of growth in core private business, Instant Offer
and tyresales.
• Decline in H2 largely reflects the negative impact from social
distancing measures. Pleasing to see good recovery in core
private business in the last quarter of the financial year as social
distancing measures were eased.
82.1 77.8
FY19 FY20
Private revenue down 5% to $77.8m
-5%
($m)
FY19 FY20FY19 FY20
+5.8x +33%
Net promoter score1 Lead to sale conversion1
Enhanced user experience and continued expansion of our supplier network resulted in a significant uplift in conversion
from offer to sale and customer satisfaction.
Instant Offer optimisation
1. carsales internal data

MEDIA
20
• Very challenging advertising environment due to significant
reduction in new car sales and associated reduction in OEM
advertising budgets. Declines accelerated in H2 due to the impact
of COVID-19 with new car sales down 20%.
• The media business increased its share of a contracted market.
This is testament to the continued attractiveness of our site as a
digital marketing channel, the strong growth in our audience
metrics and the benefits of our enhanced native and video product
offering.
Media Adjusted Revenue2 down 22% to $50.2m
-22%
($m)
In FY20, we increased our programmatic selling capability. This enables us to monetise a higher proportion of our site traffic in an environment in which we are strongly growing
our audience and site visits.
Jul
Au
g
Se
p
Oct
No
v
De
c
Jan
Fe
b
Ma
r
Ap
r
Ma
y
Jun
-20
+ 4.2x
Programmatic inventory sales volume2
1.13 1.18 1.18 1.201.10
0.95
FY15 FY16 FY17 FY18 FY19 FY20
VFACTS reported new car sales1
New car sales in FY20 declined 14% on pcp.
1. Reported new car sales, Federal Chamber of Automotive Industries. 2. carsales internal data2. Adjusted Revenue stated above excludes COVID-19 support discount provided to dealers. See slide 35 regarding the disclosure of non-IFRS information and
slides 36-37 for a reconciliation of Reported to Adjusted Financials.
-14%
64.150.2
FY19 FY20
49.0(reported)

43.2 43.3
FY19 FY20
DATA RESEARCH & SERVICES
21
• Revenue growth impacted by intentional exit of low margin
products and contracts. Underlying revenue growth of 5% in
FY20 excluding this impact reflects the resilience of this
segment.
• Our vehicle appraisals product continues to be a key growth
driver, as dealers have focused on growing their used car
inventory supply given challenges in other areas of their
businesses.
• RedBook business continues to record pleasing revenue
growth, consolidating its position as a market leading source of
vehicle specification, valuation and pricing data.
DR&S Adjusted Revenue1 flat on pcp to $43.3
+0%
($m)
Increasing the accuracy of the odometer readings of cars improves our personalisation capability. Over 16,000
odometers were updated2 and total cars in the virtual garage increased to over 484,000.2
We'll keep you updated on your car’s demand...
Update the odometer reading for your Mazda in your carsales garage to find out how much it's worth and more
It’s Odometer Day!
1. Adjusted Revenue stated above excludes COVID support discount provided to dealers. See slide 35 regarding the disclosure of non-IFRS information and slides 36-37 for a reconciliation of Reported to Adjusted Financials. 2. carsales internal data
39.3(reported)

CARSALES INTERNATIONAL

14.9
19.821.4
26.1
30.9
FY16 FY17 FY18 FY19 FY20
29.3
38.0
43.849.5
57.2
FY16 FY17 FY18 FY19 FY20
ASIA –ENCAR (SOUTH KOREA)
1. FY19 results have been restated to reflect the adoption of AASB16. Refer to slide 39 for AASB16 adjustments.2. Visits and leads generated for the period Jul-19 to Jun-20 compared with Jul-18 to Jun-19.
23
Revenue (KRW bn) EBITDA (KRW bn)
Impressive performance given challenging macroeconomic conditions
CAGR
18%CAGR
20%
FY191 FY20 $'s %
Revenue 61.0 71.2 10.1 17% 16%
EBITDA 32.2 38.5 6.3 20% 18%
$A Millions Constant
Currency (%)
Growth• While South Korea has clearly been impacted by COVID-19,
economic activity to date has been significantly less impacted than most other countries.
• Recorded growth in all its key operating metrics of inventory, listing volumes and traffic. The business has benefited from the accelerated migration of the car buying process towards online sources driven by COVID-19.
• The business also made a seamless transition away from the SK brand, with strong traffic growth demonstrating the underlying strength of the Encar brand.
• Key revenue growth drivers were:
• Guarantee vehicle inspection service, with the opening of 9 new branches and continued improvements in utilisation of existing branches.
• Standard dealer listing volume growth of 8% on pcp.
• Strong growth in the redesigned Dealer Direct product, which is similar to carsales’ Instant Offer product.
• Very good growth in key operational metrics of traffic and leads reflecting continued market leadership:
• 15% increase in visits2;
• 14% increase in leads2;
• Continuing to grow margins through operating leverage.

LATIN AMERICA – WEBMOTORS (BRAZIL)
1. Revenue and EBITDA stated is 100% of the revenue and EBITDA for the business.2. Adjusted NPAT stated above excludes intangible amortisation. The carsales share of earnings is based on owning the percentage set out above. See slide 35 regarding the disclosure of non-IFRS information and
slides 36-37 for a reconciliation of Reported to Adjusted Financials.3. Lead volume generated for the period Jul-19 to Jun-20 compared with Jul-18 to Jun-194. Dealer customer volume counts as at 30 June 2020 compared with 30 June 2019
carsales Share of Earnings (30% owned – equity accounted)
24
• Finance revenue now a material contributor to the business, comprising more than 15% of revenue and growing rapidly. Growth driven by Santander bank integration, which allows seamless credit integration into Cockpit (webmotors CRM).
• The business commenced its large scale regional expansion plan at the start of H2 that was showing very positive signs with a material uplift in dealer numbers, traffic and leads. Unfortunately, the onset of COVID-19 has delayed further rollout of this plan. Nevertheless, this highlights the opportunity for webmotors to continue growing organically as Brazil emerges from lockdown.
• The business adopted strong cost control measures in Q4 to mitigate the impact of revenue declines during the height of the lockdown in April.
• Key financial and non-financial operating metrics showed strong signs of recovery in June, albeit still lower than Q3 run rate.
• Outstanding growth in Leads3 up 57% on pcp in FY20. Dealer customer4 numbers up 7%.
Strong underlying growth rates as webmotorsconsolidates its no.1 market position. H2 impacted by COVID-19.
Revenue4 (BRLm) EBITDA4 (BRLm)
FY19 FY20 $'s %
Revenue1 67.8 74.6 6.8 10% 17%
EBITDA1 29.3 30.4 1.1 4% 10%
Pro-forma
100%
$A Millions Growth Constant
Currency (%)
26.9 29.1
52.6
80.889.1
FY16 FY17 FY18 FY19 FY20
99.4 108.3
138.5
186.8
219.4
FY16 FY17 FY18 FY19 FY20
CAGR
22%CAGR
35%
FY19 FY20 $'s %
Reported NPAT 5.1 5.1 (0.0) (1%) 4%
Adjusted NPAT2 5.7 5.6 (0.1) (2%) 4%
Growth$A Millions Constant
Currency (%)
CH
ILE
ME
XIC
O3
AR
GE
NT
INA
FY19 FY20
Visits 2
FY19 FY20
Visits 2
FY19 FY20
Visits 2
FY19 FY20
Leads 2
FY19 FY20
Leads 2
FY19 FY20
Leads 2
LATIN AMERICA
+14%
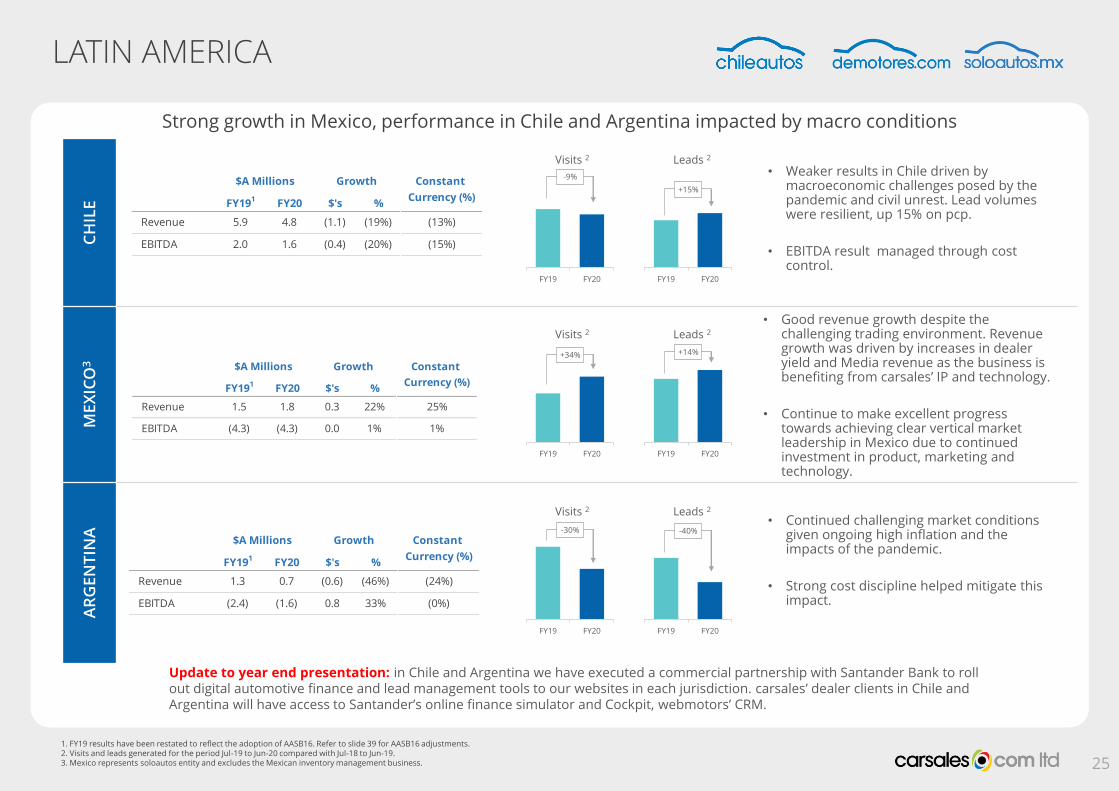
• Good revenue growth despite the challenging trading environment. Revenue growth was driven by increases in dealer yield and Media revenue as the business is benefiting from carsales’ IP and technology.
• Continue to make excellent progress towards achieving clear vertical market leadership in Mexico due to continued investment in product, marketing and technology.
• Continued challenging market conditions given ongoing high inflation and the impacts of the pandemic.
• Strong cost discipline helped mitigate this impact.
25
+15%
-9%
+34%
-40%-30%
• Weaker results in Chile driven by macroeconomic challenges posed by the pandemic and civil unrest. Lead volumes were resilient, up 15% on pcp.
• EBITDA result managed through cost control.
Strong growth in Mexico, performance in Chile and Argentina impacted by macro conditions
1. FY19 results have been restated to reflect the adoption of AASB16. Refer to slide 39 for AASB16 adjustments.2. Visits and leads generated for the period Jul-19 to Jun-20 compared with Jul-18 to Jun-19.3. Mexico represents soloautos entity and excludes the Mexican inventory management business.
FY191 FY20 $'s %
Revenue 5.9 4.8 (1.1) (19%) (13%)
EBITDA 2.0 1.6 (0.4) (20%) (15%)
$A Millions Growth Constant
Currency (%)
FY191 FY20 $'s %
Revenue 1.3 0.7 (0.6) (46%) (24%)
EBITDA (2.4) (1.6) 0.8 33% (0%)
$A Millions Growth Constant
Currency (%)
FY191 FY20 $'s %
Revenue 1.5 1.8 0.3 22% 25%
EBITDA (4.3) (4.3) 0.0 1% 1%
$A Millions Growth Constant
Currency (%)
Update to year end presentation: in Chile and Argentina we have executed a commercial partnership with Santander Bank to roll out digital automotive finance and lead management tools to our websites in each jurisdiction. carsales’ dealer clients in Chile and Argentina will have access to Santander’s online finance simulator and Cockpit, webmotors’ CRM.

STRATEGYUPDATE

Digital marketplacesTo grow our global leadership in digital automotive classified
solutions for consumer and commercial customers
We are focused on three strategic
priorities…
Value added servicesTo build a compelling ecosystem of services that support dealers,
OEMs, corporate and private consumers through the buying,
selling and ownership of vehicles
Future horizonsLeveraging consumer insights and
industry trends to explore new opportunities in core and adjacent
markets, and beyond
Data | To become a ‘best-in-class’ data-driven company, with unrivalled data and analytics to help customers understand their audience and commercial clients to grow their businesses
… supported by three enablers…
People | To be an employer of choice and destination for talent by continuously evolving our culture of inclusion, learning, leadership, performance and passion
Technology | To build ‘best-in-class’ global platform-based software services that exceed the expectations of our customers and drive continued growth in the carsales business
… and underpinned by our unique
culture
Our DNA
Innovation | Simplicity | Customer focus
Our Values
Enjoyment | Respect | Integrity | Communication | Honesty
CARSALES STRATEGY
OUR PURPOSE: We empower people to move freely through our world-leading marketplaces
27

INTRODUCING PLACIE
An app that helps customers seamlessly combine, compare, & book 8+ modes of transport to get from place to place faster, cheaper & smarter.
More than a regular journey planner:
• One stop (mobility) shop for consumers to save time, money and effort
• Real-time data for on-demand and scheduling multi modal journeys
• One account for all private partner bookings
• Transport partners all natively integrated (no need to leave the app)
28
8+ modes of transport integrated Compare, combine and book Cheaper or faster trip filter
29
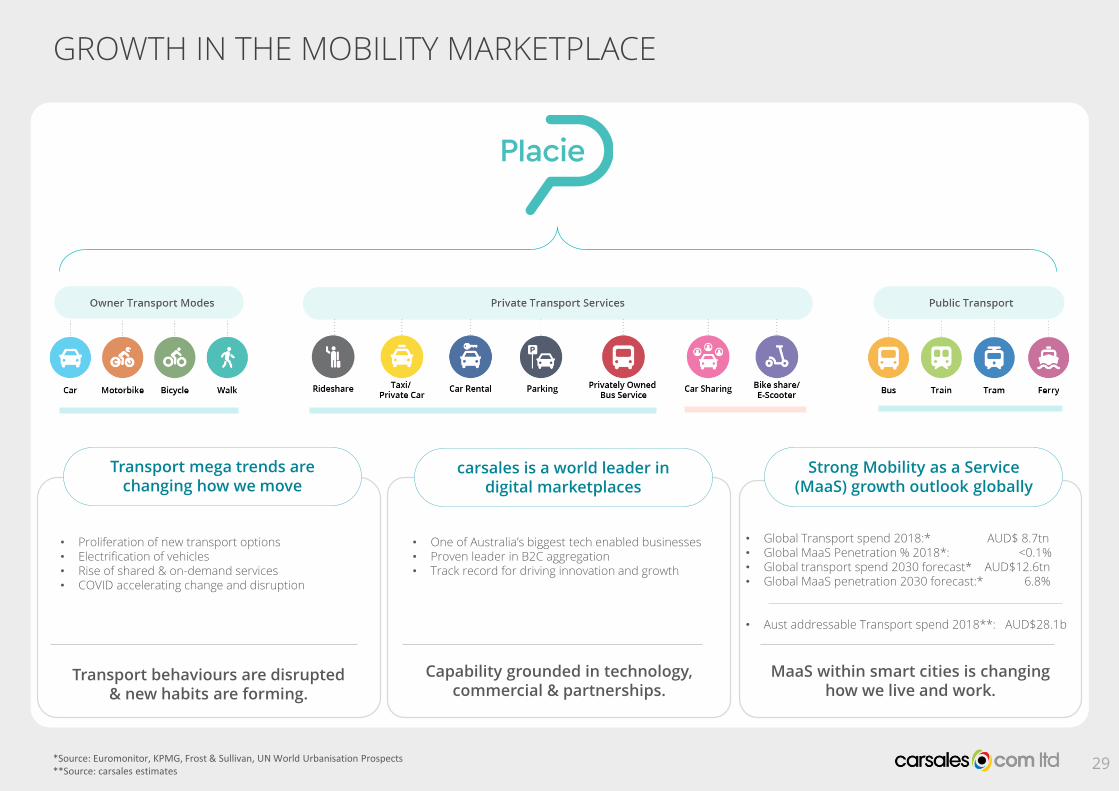
GROWTH IN THE MOBILITY MARKETPLACE
• One of Australia’s biggest tech enabled businesses • Proven leader in B2C aggregation• Track record for driving innovation and growth
carsales is a world leader in digital marketplaces
Capability grounded in technology, commercial & partnerships.
• Global Transport spend 2018:* AUD$ 8.7tn• Global MaaS Penetration % 2018*: <0.1%• Global transport spend 2030 forecast* AUD$12.6tn• Global MaaS penetration 2030 forecast:* 6.8%
• Aust addressable Transport spend 2018**: AUD$28.1b
Strong Mobility as a Service (MaaS) growth outlook globally
MaaS within smart cities is changing how we live and work.
• Proliferation of new transport options• Electrification of vehicles• Rise of shared & on-demand services• COVID accelerating change and disruption
Transport mega trends are changing how we move
Transport behaviours are disrupted & new habits are forming.
*Source: Euromonitor, KPMG, Frost & Sullivan, UN World Urbanisation Prospects**Source: carsales estimates
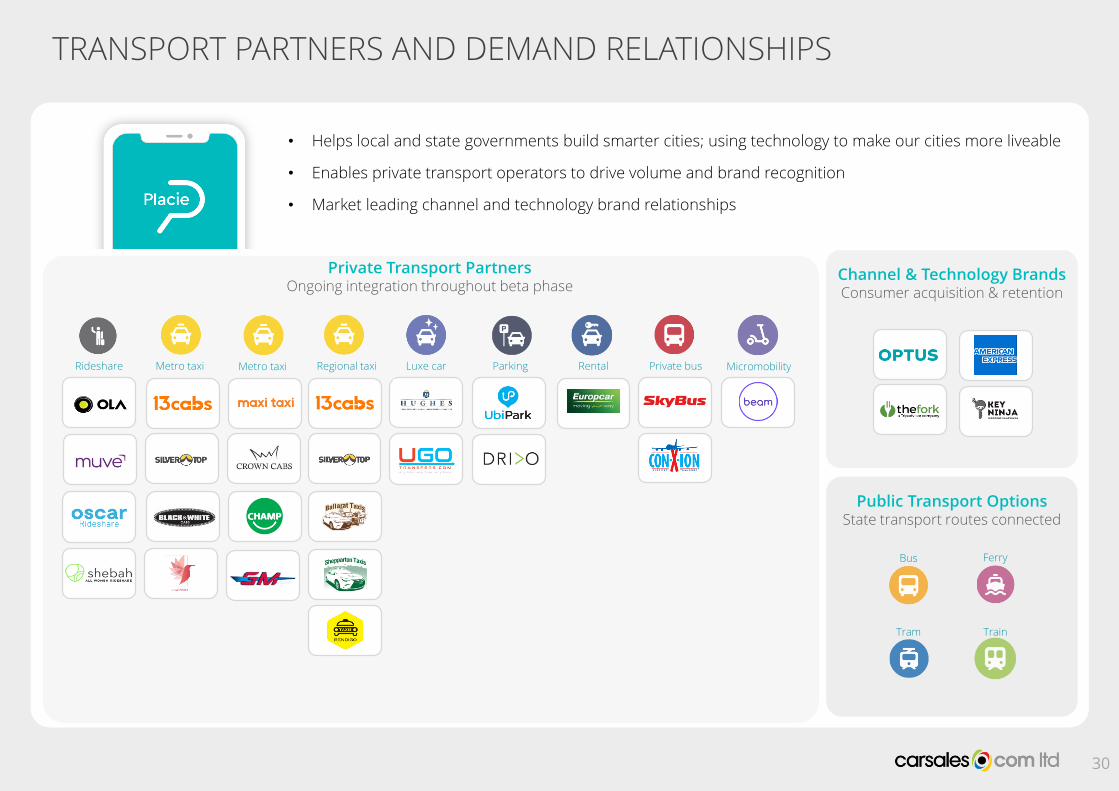
• Helps local and state governments build smarter cities; using technology to make our cities more liveable
• Enables private transport operators to drive volume and brand recognition
• Market leading channel and technology brand relationships
Private Transport PartnersOngoing integration throughout beta phase
Metro taxiRideshare Luxe car Parking Rental Private busRegional taxi Micromobility
Channel & Technology BrandsConsumer acquisition & retention
TRANSPORT PARTNERS AND DEMAND RELATIONSHIPS
30
Public Transport OptionsState transport routes connected
Tram Train
Bus Ferry
Metro taxi

FY21 TRADING OBSERVATIONS

32
FY21 TRADING OBSERVATIONS - UPDATE
Overall Summary
• COVID-19 continues to create uncertainty in our operating environment
• We will continue to focus on managing costs
• Remain committed to investing in product and market leading positions
• Business is well diversified across geography and product – international now represents 19% of total look-through1 EBITDA, significant diversification in Australia across states and territories
• Used car market has proven very resilient with volumes rebounding quickly after lockdowns have been lifted, business has limited exposure to new car market
• Trends coming out of COVID-19 very positive for carsales – continued digital adoption, increased propensity for car ownership
• Business is well funded with low gearing, strong liquidity and strong cash generation to fund growth capital and dividends
1. For look-through definition refer to slide 12.

33
SPECIFIC TRADING OBSERVATIONS - UPDATE
Given the continuing uncertainty due to COVID-19, we are not providing specific guidance on our financial expectations for FY21. We do, however provide the following current trading observations.
Australia
• Dealer:• Overall lead volumes in Q1 FY20 have been impacted by the closure of dealerships in Metro Melbourne. However, excluding Metro
Melbourne, overall lead volumes grew strongly on the prior corresponding period (pcp) in Q1 FY20. • carsales has provided a 100% rebate for all metro Melbourne dealers from the 6th of August 2020 until the 27th of October 2020 when
retail reopened. We estimate the quantum of this support to be ~$12m to date in FY21 which brings the total support provided to dealers since the start of the pandemic to approximately $40m. We have reverted to normal charging for our dealer customers from the 28th of October 2020.
• Private:• Excluding metro Melbourne, private listing volumes have largely recovered to pre-COVID levels in Q1 FY20. • Materially lower volumes in tyresales expected in FY21 reflecting COVID-19 impacts and metro Melbourne restrictions.
• Media and new car market:• Excluding metro Melbourne there have been improving signs in new car activity in Q1 FY20, with some recovery in media revenue run
rate against pcp. Expecting media revenue to be lower than pcp in the first half.
International
• South Korea:• Key operating metrics of inventory, listing volumes and traffic are all growing well reinforcing continued good growth in revenue and
EBITDA on pcp.• Brazil:
• In Q1 FY20 we have observed the continued rebound in the key metrics of the business. Traffic, leads, local currency revenue and local currency EBITDA all demonstrated good growth on pcp over this period. Depreciation of the BRL is negatively impacting pcp growth rates when translated into AUD.
• LATAM• Key operating metrics still impacted by continuing restrictions in Chile, Mexico and Argentina. Profitability being well managed through
strong cost control. In a good position to leverage unserviced consumer demand and recent product development investment as countries emerge from COVID19 restrictions.

APPENDIX

OVERVIEW OF CARSALES NON-IFRS FINANCIAL INFORMATION
What is IFRS and non-IFRS financial information?
• IFRS financial information is financial information that is presented in accordance with all relevant accounting standards.
• Non-IFRS financial information is financial information that is presented other than in accordance with all relevant accounting standards. For example:
o Revenue or profit information calculated on a basis other than under accounting standard definitions or calculated with accounting standards and then adjusted e.g. “adjusted”, “underlying” or “look-through”.
What non-IFRS financial information does carsales disclose in its half year and year end results presentations?
• carsales presents reported financial information for its business segments, associates and investments where applicable IFRS financial information exists. The financial
information presented is sourced directly from financial information prepared in accordance with all relevant accounting standards and has been subject to either review or audit by carsales’ external auditors (PwC).
• In carsales’ investor presentations the company aims to provide equal or greater prominence to IFRS financial information. However, we also present or refer to non-IFRS financial information. Please note, all information labelled “Reported” in this presentation complies with IFRS.
• Non-IFRS financial information is calculated based on statutory IFRS financial information and adjusted to show either a position excluding significant items which have been removed OR presented based on carsales’ effective equity ownership interest of an entity’s underlying revenue, EBITDA or NPAT.
• Any non-IFRS financial information is clearly labelled as “underlying”, “Adjusted” or “look-through” to differentiate it from reported/IFRS financial information.
• carsales provides reconciliations on the face of slides, appendices and in footnotes of
presentations in order to allow the reader to clearly reconcile between the IFRS and non-IFRS financial information.
Why does carsales disclose non-IFRS financial information in its half year and full year results presentations?
• carsales has invested in businesses in Malaysia, Thailand, Indonesia, South Korea, Mexico, Chile, Brazil and Argentina and has become a global portfolio of online automotive assets. Accordingly carsales management believes that the presentation of additional non-IFRS information in its half year and full year results presentations provides readers of these documents with a greater understanding into the way in which management analyses the business as well as meaningful insights into the financial conditions of carsales overall performance.
• The Australian Securities and Investment Commission (“ASIC”) acknowledges the relevance of non-IFRS financial information in providing “meaningful insight” as long as it does not mislead the reader.
35
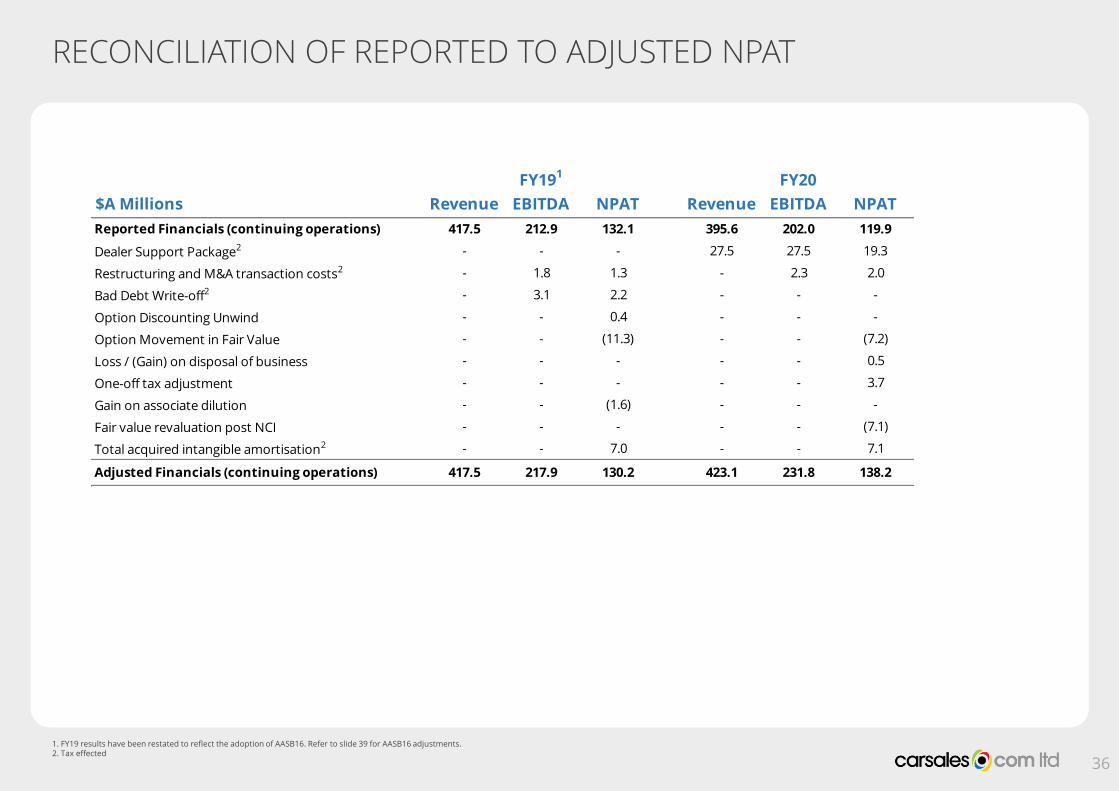
RECONCILIATION OF REPORTED TO ADJUSTED NPAT
1. FY19 results have been restated to reflect the adoption of AASB16. Refer to slide 39 for AASB16 adjustments.2. Tax effected
36
$A Millions Revenue EBITDA NPAT Revenue EBITDA NPAT
Reported Financials (continuing operations) 417.5 212.9 132.1 395.6 202.0 119.9
Dealer Support Package2 - - - 27.5 27.5 19.3
Restructuring and M&A transaction costs2 - 1.8 1.3 - 2.3 2.0
Bad Debt Write-off2 - 3.1 2.2 - - -
Option Discounting Unwind - - 0.4 - - -
Option Movement in Fair Value - - (11.3) - - (7.2)
Loss / (Gain) on disposal of business - - - - - 0.5
One-off tax adjustment - - - - - 3.7
Gain on associate dilution - - (1.6) - - -
Fair value revaluation post NCI - - - - - (7.1)
Total acquired intangible amortisation2 - - 7.0 - - 7.1
Adjusted Financials (continuing operations) 417.5 217.9 130.2 423.1 231.8 138.2
FY191 FY20
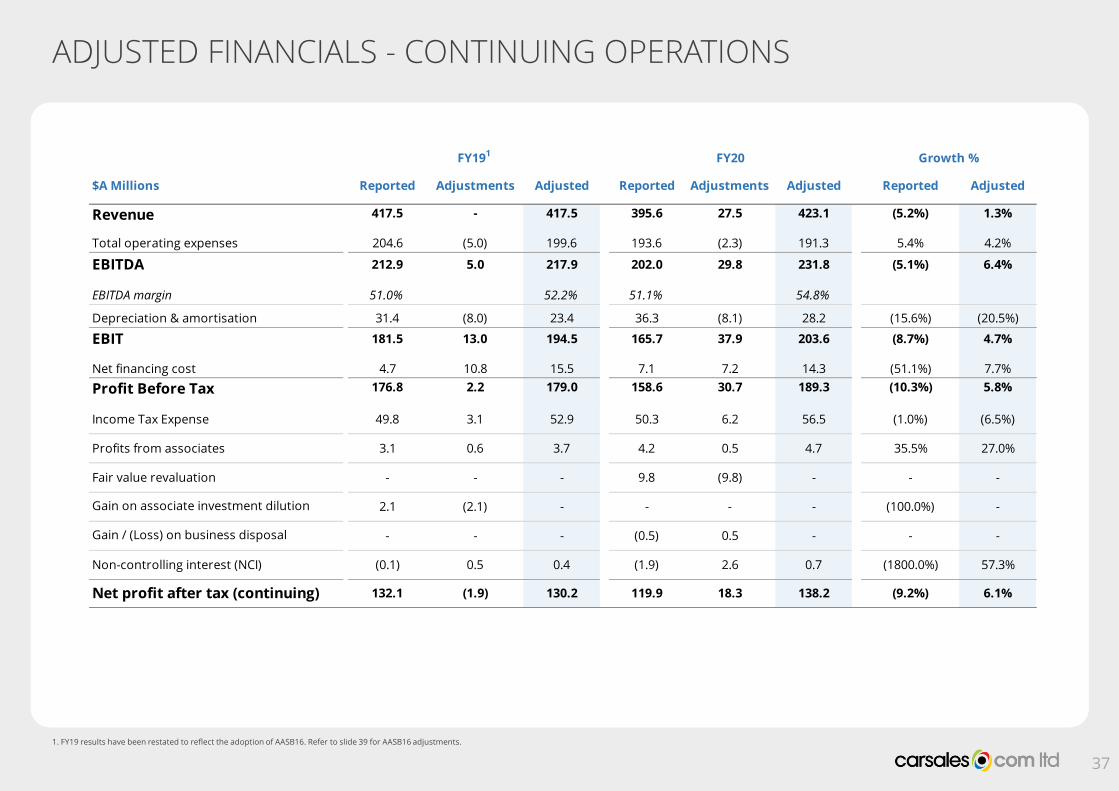
ADJUSTED FINANCIALS - CONTINUING OPERATIONS
37
1. FY19 results have been restated to reflect the adoption of AASB16. Refer to slide 39 for AASB16 adjustments.
$A Millions Reported Adjustments Adjusted Reported Adjustments Adjusted Reported Adjusted
Revenue 417.5 - 417.5 395.6 27.5 423.1 (5.2%) 1.3%
204.6 (5.0) 199.6 193.6 (2.3) 191.3 5.4% 4.2%
EBITDA 212.9 5.0 217.9 202.0 29.8 231.8 (5.1%) 6.4%
EBITDA margin 51.0% 52.2% 51.1% 54.8%
Depreciation & amortisation 31.4 (8.0) 23.4 36.3 (8.1) 28.2 (15.6%) (20.5%)
EBIT 181.5 13.0 194.5 165.7 37.9 203.6 (8.7%) 4.7%
Net financing cost 4.7 10.8 15.5 7.1 7.2 14.3 (51.1%) 7.7%
Profit Before Tax 176.8 2.2 179.0 158.6 30.7 189.3 (10.3%) 5.8%
Income Tax Expense 49.8 3.1 52.9 50.3 6.2 56.5 (1.0%) (6.5%)
Profits from associates 3.1 0.6 3.7 4.2 0.5 4.7 35.5% 27.0%
Fair value revaluation - - - 9.8 (9.8) - - -
2.1 (2.1) - - - - (100.0%) -
- - - (0.5) 0.5 - - -
Non-controlling interest (NCI) (0.1) 0.5 0.4 (1.9) 2.6 0.7 (1800.0%) 57.3%
Net profit after tax (continuing) 132.1 (1.9) 130.2 119.9 18.3 138.2 (9.2%) 6.1%
Gain / (Loss) on business disposal
FY20 Growth %
Total operating expenses
Gain on associate investment dilution
FY191
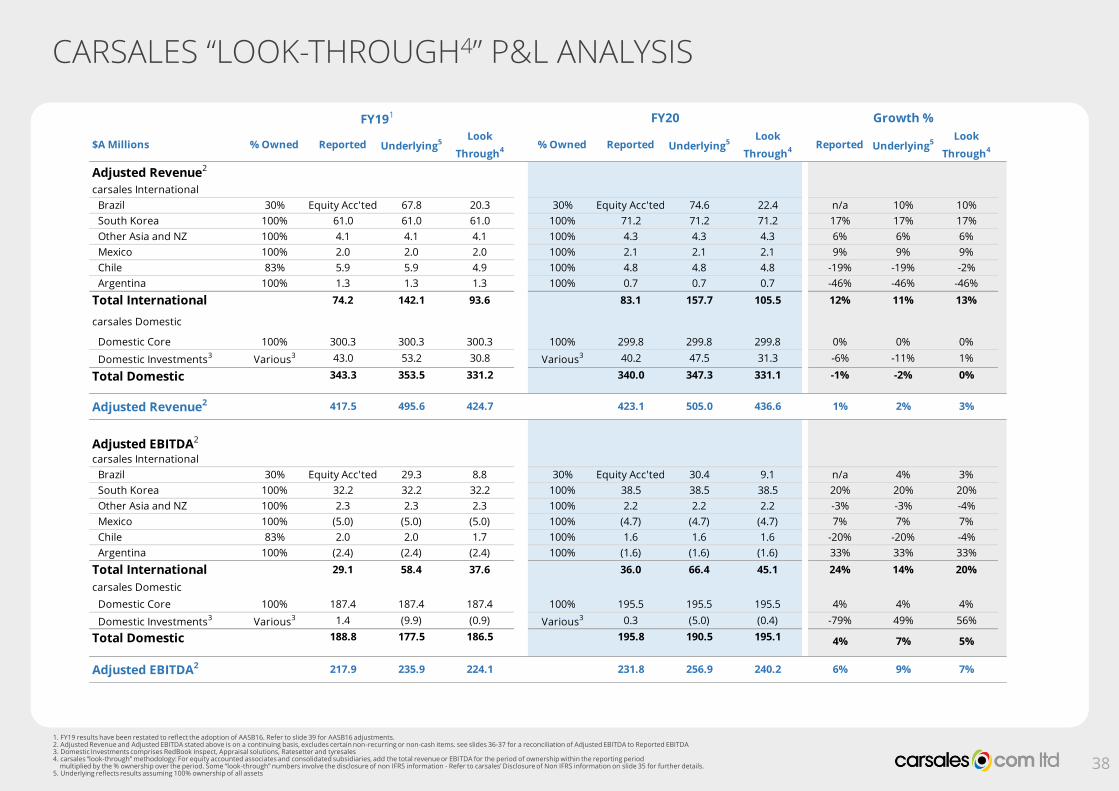
CARSALES “LOOK-THROUGH4” P&L ANALYSIS
1. FY19 results have been restated to reflect the adoption of AASB16. Refer to slide 39 for AASB16 adjustments.2. Adjusted Revenue and Adjusted EBITDA stated above is on a continuing basis, excludes certain non-recurring or non-cash items. see slides 36-37 for a reconciliation of Adjusted EBITDA to Reported EBITDA 3. Domestic Investments comprises RedBook Inspect, Appraisal solutions, Ratesetter and tyresales4. carsales “look-through” methodology: For equity accounted associates and consolidated subsidiaries, add the total revenue or EBITDA for the period of ownership within the reporting period
multiplied by the % ownership over the period. Some “look-through” numbers involve the disclosure of non IFRS information - Refer to carsales’ Disclosure of Non IFRS information on slide 35 for further details. 5. Underlying reflects results assuming 100% ownership of all assets
$A Millions % Owned Reported Underlying5Look
Through4% Owned Reported Underlying5
Look
Through4Reported Underlying5
Look
Through4
Adjusted Revenue2
carsales International
Brazil 30% Equity Acc'ted 67.8 20.3 30% Equity Acc'ted 74.6 22.4 n/a 10% 10%
South Korea 100% 61.0 61.0 61.0 100% 71.2 71.2 71.2 17% 17% 17%
Other Asia and NZ 100% 4.1 4.1 4.1 100% 4.3 4.3 4.3 6% 6% 6%
Mexico 100% 2.0 2.0 2.0 100% 2.1 2.1 2.1 9% 9% 9%
Chile 83% 5.9 5.9 4.9 100% 4.8 4.8 4.8 -19% -19% -2%
Argentina 100% 1.3 1.3 1.3 100% 0.7 0.7 0.7 -46% -46% -46%
Total International 74.2 142.1 93.6 83.1 157.7 105.5 12% 11% 13%
carsales Domestic
Domestic Core 100% 300.3 300.3 300.3 100% 299.8 299.8 299.8 0% 0% 0%
Domestic Investments3 Various3 43.0 53.2 30.8 Various3 40.2 47.5 31.3 -6% -11% 1%
Total Domestic 343.3 353.5 331.2 340.0 347.3 331.1 -1% -2% 0%
Adjusted Revenue2 417.5 495.6 424.7 423.1 505.0 436.6 1% 2% 3%
Adjusted EBITDA2
carsales International
Brazil 30% Equity Acc'ted 29.3 8.8 30% Equity Acc'ted 30.4 9.1 n/a 4% 3%
South Korea 100% 32.2 32.2 32.2 100% 38.5 38.5 38.5 20% 20% 20%
Other Asia and NZ 100% 2.3 2.3 2.3 100% 2.2 2.2 2.2 -3% -3% -4%
Mexico 100% (5.0) (5.0) (5.0) 100% (4.7) (4.7) (4.7) 7% 7% 7%
Chile 83% 2.0 2.0 1.7 100% 1.6 1.6 1.6 -20% -20% -4%
Argentina 100% (2.4) (2.4) (2.4) 100% (1.6) (1.6) (1.6) 33% 33% 33%
Total International 29.1 58.4 37.6 36.0 66.4 45.1 24% 14% 20%
carsales Domestic
Domestic Core 100% 187.4 187.4 187.4 100% 195.5 195.5 195.5 4% 4% 4%
Domestic Investments3 Various3 1.4 (9.9) (0.9) Various3 0.3 (5.0) (0.4) -79% 49% 56%
Total Domestic 188.8 177.5 186.5 195.8 190.5 195.1 4% 7% 5%
Adjusted EBITDA2 217.9 235.9 224.1 231.8 256.9 240.2 6% 9% 7%
Growth %FY191 FY20
38
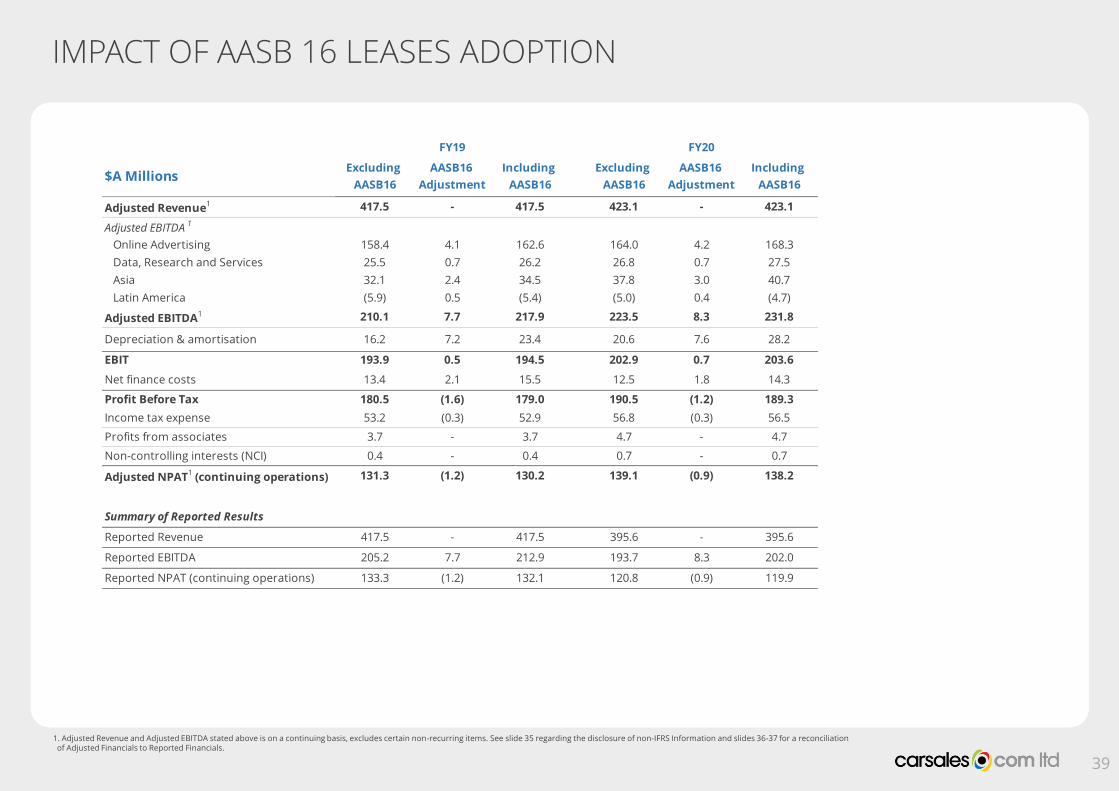
IMPACT OF AASB 16 LEASES ADOPTION
39
Excluding
AASB16
AASB16
Adjustment
Including
AASB16
Excluding
AASB16
AASB16
Adjustment
Including
AASB16
Adjusted Revenue1 417.5 - 417.5 423.1 - 423.1
Adjusted EBITDA 1
Online Advertising 158.4 4.1 162.6 164.0 4.2 168.3
Data, Research and Services 25.5 0.7 26.2 26.8 0.7 27.5
Asia 32.1 2.4 34.5 37.8 3.0 40.7
Latin America (5.9) 0.5 (5.4) (5.0) 0.4 (4.7)
Adjusted EBITDA1 210.1 7.7 217.9 223.5 8.3 231.8
Depreciation & amortisation 16.2 7.2 23.4 20.6 7.6 28.2
EBIT 193.9 0.5 194.5 202.9 0.7 203.6
Net finance costs 13.4 2.1 15.5 12.5 1.8 14.3
Profit Before Tax 180.5 (1.6) 179.0 190.5 (1.2) 189.3
Income tax expense 53.2 (0.3) 52.9 56.8 (0.3) 56.5
Profits from associates 3.7 - 3.7 4.7 - 4.7
Non-controlling interests (NCI) 0.4 - 0.4 0.7 - 0.7
Adjusted NPAT1 (continuing operations) 131.3 (1.2) 130.2 139.1 (0.9) 138.2
Summary of Reported Results
Reported Revenue 417.5 - 417.5 395.6 - 395.6
Reported EBITDA 205.2 7.7 212.9 193.7 8.3 202.0
Reported NPAT (continuing operations) 133.3 (1.2) 132.1 120.8 (0.9) 119.9
FY19 FY20
$A Millions
1. Adjusted Revenue and Adjusted EBITDA stated above is on a continuing basis, excludes certain non-recurring items. See slide 35 regarding the disclosure of non-IFRS Information and slides 36-37 for a reconciliation of Adjusted Financials to Reported Financials.

40