2020 ACTION PLAN - City of...
52
3 2020 ACTION PLAN 2016–2017 IMPLEMENTATION UPDATE
Transcript of 2020 ACTION PLAN - City of...

3
2020 ACTION PLAN
2016–2017 IMPLEMENTATION UPDATE

4
PROGRESS HIGHLIGHTS
311km OF BIKE NETWORK IN VANCOUVER
82,000 NEW TREES PLANTED
SINCE 2010
ELECTRICVEHICLE
ECOSYSTEMSTRATEGYAPPROVED
HECTARES OFNATURAL AREARESTORED OR
ENHANCED
DECREASE IN SOLID WASTE SENT TO LANDFILL AND INCINERATOR SINCE 2008
INCREASE IN NEIGHBOURHOOD
FOOD ASSETS SINCE 2010
42%
DECREASE -IN-
DISTANCE DRIVEN
PER PERSON SINCE 2007
32%
20
27% DECREASE IN
GREENHOUSE GASES FROM
CITY OPERATIONSSINCE 2007
NEW LOCAL FOOD AND GREEN JOBS
SINCE 2010
49%
56%

GOAL AND TARGETS INDICATOR BASELINE 2016
CHANGE FROM BASELINE
IMPROVED OVER BASELINE
2020 TARGET
CLIMATE LEADERSHIP
Target: Reduce community-based greenhouse gas
emissions by 33% from 2007 levels BY 2020.
Total tonnes of community CO2e emissions
from Vancouver
2,850,000 tCO2e
(2007)
2,410,000 tCO2e
(2015)1
-15%1 Yes 1,910,000 tCO2e
GREEN BUILDINGS
Target 1: Require all buildings constructed from 2020
onward to be carbon neutral in operations.
Kilograms of CO2e per square metre of
newly built floor area
20.7 kgCO2e/m2
(2007)
11.8 kgCO2e/m2
(2017)
-43% Yes carbon neutral
Target 2: Reduce energy use and GHG emissions in
existing buildings by 20% over 2007 levels.
Total tonnes of CO2e from all
community buildings
1,630,000 tCO2e
(2007)
1,295,000 tCO2e
(2015)1
-20%1 Yes 1,300,000 tCO2e
GREEN TRANSPORTATION
Target 1: Make the majority of trips (over 50%) by foot,
bicycle and public transit.
Per cent mode share by walk, bike and transit 40% 50% of trips +10% Yes 50% of trips
Target 2: Reduce average distance driven per resident by
20% from 2007 levels.
Total vehicle km driven per person 5,950 km (2007) 4,060 km -32% Yes 4,760 km
ZERO WASTE
Target: Reduce total solid waste going to the landfill or
incinerator by 50% from 2008 levels.
Annual solid waste disposed to landfill
or incinerator from Vancouver2
480,000 tonnes
(2008)
351,000 tonnes
(2015)
-27% Yes 240,000 tonnes
ACCESS TO NATURE
Target 1: Ensure that every person lives within a five-
minute walk of a park, greenway or other green space.
Per cent of city’s land base within a five-min walk
to a green space
92.6% (2010) 92.7% +0.1% Yes 95%3
Target 2: Plant 150,000 additional trees. Total number of additional trees planted4 - - (2010) 82,000 trees +82,000 Yes 150,000 trees
Target 3: Restore or enhance 25 hectares of natural areas
between 2010 and 2020.
Total hectares of natural areas restored
or enhanced
- - (2010) 20 hectares +20 Yes 25 hectares
Target 4: Increase canopy cover to 22% by 2050. Per cent of city’s land area covered by
tree-leaf canopies
18% (2013) Survey to be
conducted in 2018
- - - - 22% (2050)
CLEAN WATER
Target 1: Meet or beat the most stringent of British
Columbian, Canadian and appropriate international
drinking water quality standards and guidelines.
Total number of instances of not meeting
drinking water quality standards
0 instances
(2006)
0 instances 0 Yes 0 instances
Target 2: Reduce per-capita water consumption by 33%
from 2006 levels.
Total water consumption per capita 583 L/person/
day (2006)
476 L/person/day -18% Yes 390 L/person/
day
LOCAL FOOD
Target: Increase city-wide and neighbourhood food
assets by a minimum of 50% over 2010 levels.
Total number of neighbourhood food assets5
in Vancouver
3,344 food assets
(2010)
4,740 food
assets
+42% Yes 5,016 food
assets
CLEAN AIR
Target: Meet or beat the most stringent air quality
guidelines from Metro Vancouver, BC, Canada, and the
World Health Organization.
Total number of instances of not meeting of air
quality standards for ozone, particulate matter
(PM2.5), nitrogen dioxide and sulphur dioxide from
both the Kits and Downtown stations combined6
27 instances
(2008)
0 -100% Yes 0 instances
GREEN ECONOMY
Target 1: Double the number of green jobs over 2010
levels.
Total number of green jobs 16,700 jobs
(2010)
24,800 jobs +49% Yes 33,400 jobs
Target 2: Double the number of companies that are
actively engaged in greening their operations over
2011 levels.
Per cent of businesses engaged in
greening their operations
5% of businesses
engaged (2011)
Survey to be
conducted in 2017
- - - - 10% of
businesess
engaged
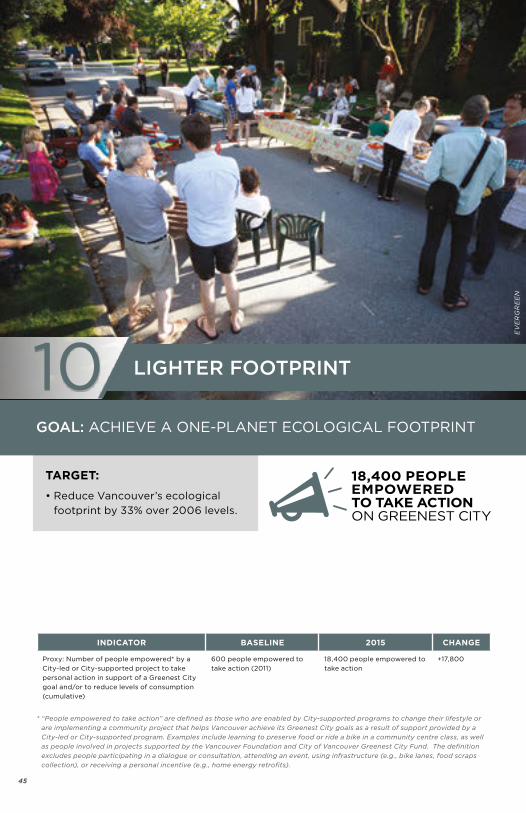
LIGHTER FOOTPRINT
Target: Reduce Vancouver’s ecological footprint by 33%
over 2006 levels.
Proxy: Number of people empowered7 by a City-
led or City-supported project to take personal
action in support of a Greenest City goal and/or
to reduce levels of consumption (cumulative)
600 people
(2011)
18,400 people +17,800 Yes To be
determined
GREEN OPERATIONS
Target Zero Carbon: 50% reduction in GHGs from City
operations from 2007 levels
Total tonnes of CO2e from City operations 495,000 tCO
2e
(2007)
220,000 tC02e -56% Yes 247,500 tCO
2e
Target Zero Waste: 70% waste diversion in public-facing
City facilities, and 90% waste diversion in all other
City-owned facilities
Total diversion rate (public) 65% (2013) 65% 0% Yes 70% diverted
Total diversion rate (other) 85% (2013) 91% +6% Yes 90% diverted
Target Healthy Ecosystems: Reduce water use in City
operations by 33% from 2006 levels
Total water use by City facilities (m3)8 2,680,000 m3
(2006)
2,065,000 m3 -23% Yes 1,340,000 m3
DASH- BOARD
1 2016 natural gas data were not available in time for the publication of this report. Emissions are given for the most recent year available (2015).
2 Solid waste data is compiled first at a regional level and then at the city level. As a result, Vancouver’s data is always one year behind the reporting period.
3 5% of the city’s land-base is industrial land area, and is not considered part of the target.
4 Private tree sales and community stewardship numbers were reassessed in 2016, resulting in an increase in total number of trees planted between 2010 and 2013.
5 Food assets include: number of community garden plots, farmers markets, community orchards, community composting facilities, community kitchens, community produce stands, and urban farms.
6 Air quality metrics are measured by Metro Vancouver from data from one monitoring station at Robson Square in Vancouver. The Kitsilano station is offline and awaiting relocation. Four indicators of air quality are used for comparison to world standards. They are: 24 hour average particulate matter (PM 2.5%) concentration >25 μg/m3 , one hour average nitrogen dioxide (NO
2 ) concentration >200 μg/m3, 24 hour average
sulphur dioxide (SO2) concentration >20 μg/m3,and eight hour
ground-level ozone (O3 ) concentration >52 ppb.
7 “People empowered to take action” are defined as those who are enabled by City-supported programs to change their lifestyle or are implementing a community project that helps Vancouver achieve its Greenest City goals as a result of support provided by a City-led or City-supported program. Examples include learning to preserve food or ride a bike in a community centre class, as well as people involved in projects supported by the Vancouver Foundation and City of Vancouver Greenest City Fund. The definition excludes people participating in a dialogue or consultation, attending an event, using infrastructure (e.g., bike lanes, food scraps collection), or receiving a personal incentive (e.g., home energy retrofits).
8 Without the benefit of universal water metering of our civic facilities, metric tracking is a best estimate only, based on available data and extrapolation. The accuracy of the metric will increase as water meters continue to be installed at prioritized City buildings.
6
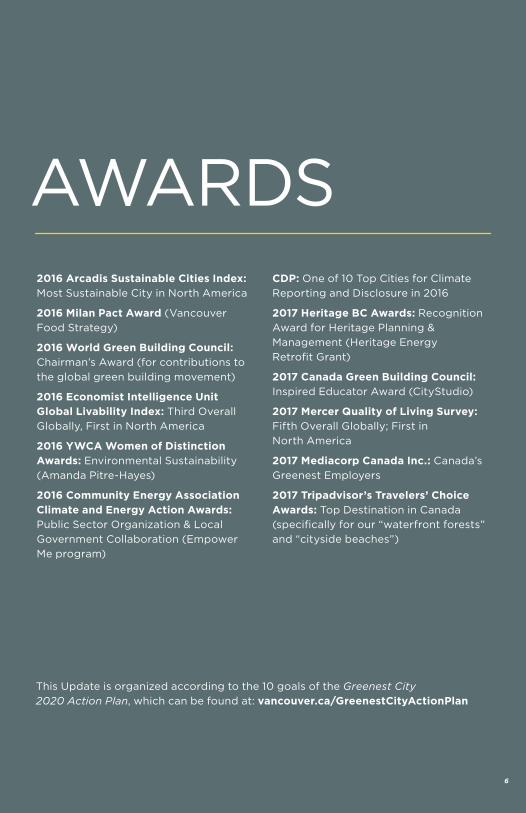
AWARDS
This Update is organized according to the 10 goals of the Greenest City 2020 Action Plan, which can be found at: vancouver.ca/GreenestCityActionPlan
2016 Arcadis Sustainable Cities Index: Most Sustainable City in North America
2016 Milan Pact Award (Vancouver
Food Strategy)
2016 World Green Building Council: Chairman’s Award (for contributions to
the global green building movement)
2016 Economist Intelligence Unit Global Livability Index: Third Overall
Globally, First in North America
2016 YWCA Women of Distinction Awards: Environmental Sustainability
(Amanda Pitre-Hayes)
2016 Community Energy Association Climate and Energy Action Awards: Public Sector Organization & Local
Government Collaboration (Empower
Me program)
CDP: One of 10 Top Cities for Climate
Reporting and Disclosure in 2016
2017 Heritage BC Awards: Recognition
Award for Heritage Planning &
Management (Heritage Energy
Retrofit Grant)
2017 Canada Green Building Council: Inspired Educator Award (CityStudio)
2017 Mercer Quality of Living Survey: Fifth Overall Globally; First in
North America
2017 Mediacorp Canada Inc.: Canada’s
Greenest Employers
2017 Tripadvisor’s Travelers’ Choice Awards: Top Destination in Canada
(specifically for our “waterfront forests”
and “cityside beaches”)
7
OVERVIEW
“Decades ago, Vancouver residents
decided that the way of the past was
not for us. We chose a different path.
Together, we’ve made the choices that
have turned our home into one of the
world’s most livable cities.”
From Greenest City 2020 Action Plan Part Two: 2015-2020
In 2011, Vancouver set a goal to become
the greenest city in the world by 2020.
You’re already living in a greener
Vancouver than it was back then. In the
last six years, the Greenest City 2020
Action Plan (GCAP) has helped make
our city a more vibrant community, with
a thriving green economy and a greener,
healthier way of living.
You’ve been with us the whole way.
Residents, community groups, and
businesses are all helping us make the
greenest city a reality.
We’ve come so far, and we still have a
ways to go. We have to start thinking
about what the Greenest City Action
Plan will look like after 2020. In the
meantime, this Update recaps some of
the work done in the past year by City
staff and residents to get us closer to
our goals.

8
CLIMATE CHANGE ADAPTATION
We’re not just reducing our impact on
climate change. We have to work on
preparing for climate change’s impact
on us. Being a coastal city, Vancouver
will be affected by sea level rise,
projected to be one metre within the
next 80 years. Sea level rise is caused
by the ocean expanding as it heats up
due to global warming, and as major
stores of ice from glaciers and ice
sheets melt. Around the world, sea level
rise, storms, drought and flood-related
events are already causing billions of
dollars in damage.
We have finished the Coastal Flood
Risk Assessment to better understand
flooding risk today and in the future,
and to develop some options to start
preparing the city. All new coastline
projects are taking these risks into
account, and new buildings in floodplain
areas are being built a metre higher,
thanks to a 2014 update to the
Vancouver Building Bylaw.
The climate is changing, but we have
time to prepare. Vancouver is planning
for this now, to prevent impacts and
to avoid major costs down the road.
Preparing our city can also provide
opportunities to make it even greener
and liveable than it is today. Meanwhile,
we’re launching a city-wide education
program this year around sea level
rise, and engaging with residents and
businesses in flood-vulnerable areas.
To learn more, go to
vancouver.ca/climateadaptation
9
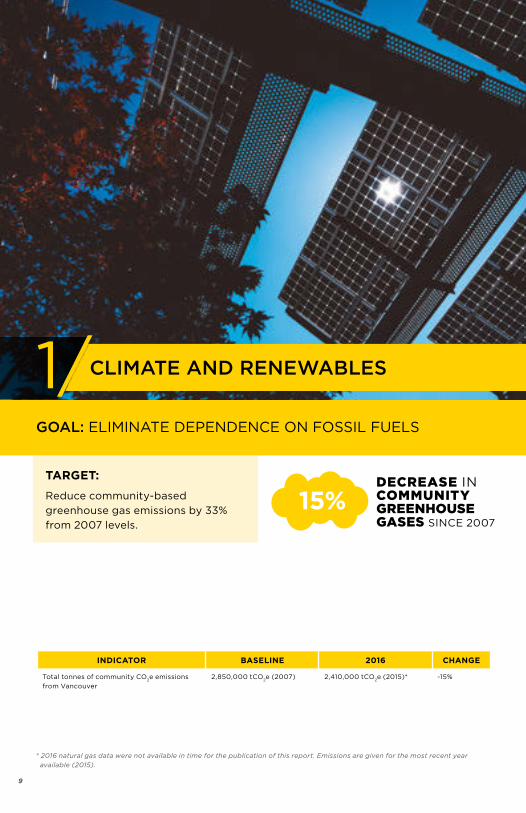
CLIMATE AND RENEWABLES 1/
INDICATOR BASELINE 2016 CHANGE
Total tonnes of community CO2e emissions
from Vancouver
2,850,000 tCO2e (2007) 2,410,000 tCO
2e (2015)* -15%
* 2016 natural gas data were not available in time for the publication of this report. Emissions are given for the most recent year
available (2015).
DECREASE IN COMMUNITY GREENHOUSE GASES SINCE 2007
15%TARGET:
Reduce community-based
greenhouse gas emissions by 33%
from 2007 levels.
GOAL: ELIMINATE DEPENDENCE ON FOSSIL FUELS
10
2016-2017 SUCCESSES:
STARTED DOWN THE PATH TO A RENEWABLE CITY
The world is moving towards a clean
energy future and we want to help lead
the way. Six years ago, the City set a
Greenest City goal to eliminate our
dependence on fossil fuels, starting with
cutting our carbon pollution by a third by
2020. Then in 2015, Council unanimously
approved the Renewable City Strategy,
committing Vancouver, community
wide, to draw 100% of its energy from
renewable sources before 2050. The
Strategy looks at two main areas:
Vancouver’s buildings and Vancouver’s
transportation. Achieving this goal
will help residents save money, ensure
cleaner air and a healthier environment,
and strengthen our economy.
Even though it’s a 35-year Strategy,
we’ve already made good progress. In
2016, we developed the Zero Emissions
Building Plan, the first step toward a
renewable city. The Plan sets targets
to eliminate carbon pollution from new
buildings by 2030. Building developers
can either meet a zero-emission
standard, which basically means much
better energy efficiency, or they can
connect to a neighbourhood energy
utility that uses renewable energy. Read
more about this in the Green Buildings
chapter of this Update.
Meanwhile, our efforts to improve
transit and make walking and cycling
an easy choice for people are paying
off. Residents are increasingly choosing
those options to get around the city.
For when people need to drive, we’re
now seeing more electric vehicles on
Vancouver streets than ever before. We
want to make it possible for even more
residents to go electric. To do that,
we’re making sure there are charging
stations where people need them.
Building a seamless vehicle-charging
network at homes, workplaces, and in
public spaces will make charging an
EV a hassle-free experience. Adopted
in 2016, the Electric Vehicle Ecosystem
Strategy sets out to do this. Learn more
in the Clean Air chapter of this Update.
The Renewable City Strategy looks first and foremost at cutting our energy use, so we can make the move to renewable forms of energy easier.
In December 2016, the prime minister and premiers agreed to the pan-Canadian Framework on Clean Growth and Climate Change – the first national climate change plan. The economic and environmental goals line up with Vancouver’s, and we are in a good position to support the Framework and benefit from the future opportunities it represents.

11
CAPTURED RENEWABLE NATURAL GAS AT THE LANDFILL
When organic waste decays in a landfill,
a gas containing biomethane is released.
Left on its own, biomethane contributes
to climate change and is twenty-five
times more damaging than CO2. The
good news is that biomethane—when
captured by our landfill gas recovery
system—is a form of renewable natural
gas and can be used just as we’d use
fossil-fuel natural gas. Annual upgrades
to our landfill gas recovery system
mean that we are able to capture more
and more renewable natural gas which
can be used to heat and to generate
power. These system upgrades also
let us better understand how much
biomethane is being released from the
landfill. In 2016, 74% of the biomethane
generated in the Landfill was captured,
up from 71% the year before.
CHALLENGES Between 2007 and 2016, the world’s
capacity to generate renewable energy
doubled, according to the International
Renewable Energy Agency. More
people now have jobs in renewable
energy worldwide than in oil and gas
combined. Those shifts present big
opportunities for the clean energy
sector, and big challenges for how
companies producing oil and natural gas
will continue to do business. We want
to grow and attract those clean energy
businesses, and help the companies (and
people) that rely on fossil fuels to shift
their business models over time.
Recent changes in US climate policy has
created a lot of concern, not just south
of the border, but here in Canada as well.
It’s a good reminder of how important
local action is on climate change.
Vancouver is one of 30 cities across
North America that have set some
form of 100% renewable energy target,
and that’s just the start. We’re also a
member of several global networks, like
C40 Cities and the Carbon Neutral Cities
Alliance, that are working together to
figure out what a clean-energy future
looks like, and how to get there.

AR
NA
UD
BO
UIS
SO
U
12
Biomethane gas capture at Vancouver Landfill
13
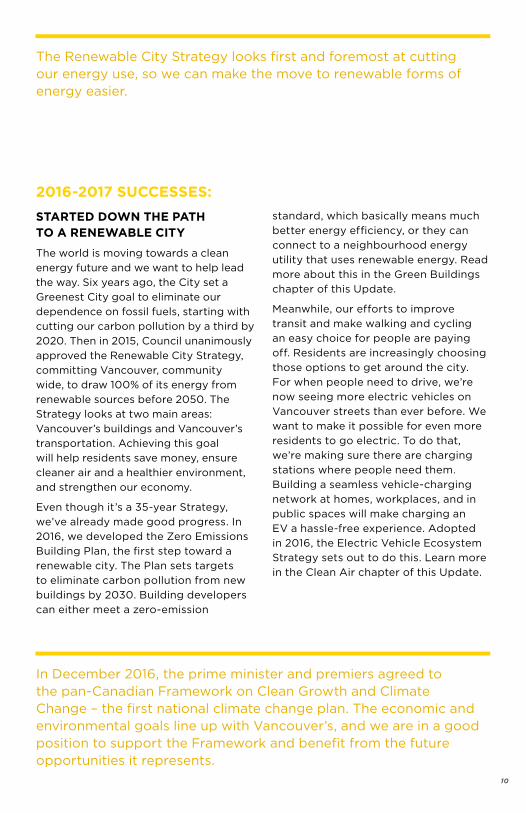
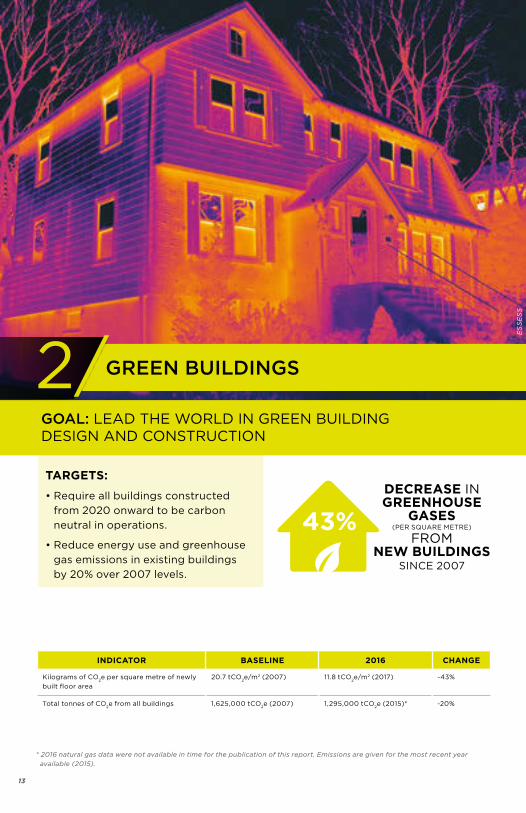
GREEN BUILDINGS2/
INDICATOR BASELINE 2016 CHANGE
Kilograms of CO2e per square metre of newly
built floor area
20.7 tCO2e/m2 (2007) 11.8 tCO
2e/m2 (2017) -43%
Total tonnes of CO2e from all buildings 1,625,000 tCO
2e (2007) 1,295,000 tCO
2e (2015)* -20%
* 2016 natural gas data were not available in time for the publication of this report. Emissions are given for the most recent year
available (2015).
DECREASE INGREENHOUSE
GASES (PER SQUARE METRE)
FROMNEW BUILDINGS
SINCE 2007
43%
TARGETS:
• Require all buildings constructed
from 2020 onward to be carbon
neutral in operations.
• Reduce energy use and greenhouse
gas emissions in existing buildings
by 20% over 2007 levels.
GOAL: LEAD THE WORLD IN GREEN BUILDING DESIGN AND CONSTRUCTION
ES
SE
SS

14
2016-2017 SUCCESSES:
APPROVED A PLAN TO ELIMINATE EMISSIONS FROM NEW BUILDINGS BY 2030
Over half of all the carbon pollution in
Vancouver comes from buildings—more
than transportation and waste combined.
In July 2016, Vancouver became the
first major city in North America to set
specific targets and actions to eliminate
greenhouse gas emissions from new
buildings by 2030, through the Zero
Emissions Building Plan. The Plan takes
a gradual approach, reducing emissions
from newly permitted buildings by 60%
by 2020 and 90% by 2025, and 100% by
2030. New buildings already produce
43% less carbon pollution today than they
did in 2007.
The Plan focusses on improving energy
efficiency first and foremost, and isn’t
a ban on any particular type of energy.
In fact, a lot of it is just about better
insulation, though standards like Passive
House and the Zero Carbon Building
Standard. Making sure your home is
well-insulated and air-tight is like putting
a sweater on a building. In winter, the
walls and windows do a better job of
keeping the heat in, where it belongs!
Some homes are so well insulated that
they’ll stay warm even if your power goes
out in the middle of winter. This same
principle works in reverse: in the summer,
your home will stay cooler, meaning less
need for air conditioning. The upshot
of this? Using less energy means lower
heating and cooling bills and a more
resilient home.
PUSHED NEW REZONINGS TO LEAD THE WAY
Building to zero-emission standards
isn’t just good news for our environment
but also for the people who live in these
spaces. These new changes will mean
better quality homes that are quieter, less
drafty, and have better indoor air quality.
The buildings themselves will need less
energy to heat, meaning they can use
smaller, simpler heating systems that
make them inexpensive to operate
and maintain.
Every year, 30 to 60 large new building
projects in Vancouver go through a
rezoning process, meaning they apply
to the City to change the use allowed
on that land (often this means increased
density and more revenue). As part of
negotiating a rezoning, the project must
be built to a higher energy standard. In
late 2016, Council approved an update to
the Green Building Policy for Rezonings,
the first step towards zero emission
buildings by 2030. Building projects
that fall under the updated Policy must
cut carbon pollution by 50% or more,
and meet new limits for heat loss and
energy use. Builders and developers
choose which type of heating system
to stay under those limits, often using
simple, locally developed approaches
and technologies. The Policy doesn’t ban
anything. Even with natural gas water
heaters and gas stoves, building projects
can meet the new requirements. Most
importantly, it won’t cost any more to
construct, maintain, or power such
a building.
Canada’s largest Passive House is being built in east Vancouver. Passive House-standard buildings use up to 90% less energy than typical buildings.

15
LIT UP THE NIGHT WITH LEAKY WINDOWS AND UNINSULATED ATTICS
A thermal image is a picture of the heat
that comes off of an object: hot shows
up bright yellow or white, while cold
shows up as blue. Thermal imaging is a
great way to easily find all the hidden
ways your home is leaking heat (and
money) into the cold outdoors. The City
launched a program to help homeowners
in single-family homes pinpoint their
energy losses. We took images in five
neighbourhoods throughout the month
of January 2017. City staff will follow-up
with homeowners later in the year. People
who participated get their thermal image,
plus information on available incentives to
save energy.
CHALLENGESWe had a record-setting cold winter
in late 2016 and early 2017. Heating
bills (and carbon pollution) went up,
as people used more energy to stay
warm. This is a great reminder that
we can’t change the weather, but we
can certainly design and retrofit our
buildings to use less energy.
In 2016, we saw the second highest
number of building permit applications
in the City’s history. While the City
pushes forward with world-leading
green building policies, we are also
working to simplify our zoning and
development regulations and reduce
permit processing times. For example,
we want to encourage Passive House-
standard buildings throughout the city,
but some of our existing requirements
in certain zones can get in the way. We
can make the process simpler and more
efficient for both applicants and staff by
allowing for more flexibility for things
like how floor space is used, building
height, and building setbacks for
buildings that meet the Certified Passive
House standard.
One way building designers measure comfort inside a home is “overheated hours”: the number of hours in a year the space is uncomfortably hot. A typical worst-case in Vancouver is currently 600 hours a year. The Green Building Policy for Rezonings cuts this by two-thirds, setting a limit of 200 hours.
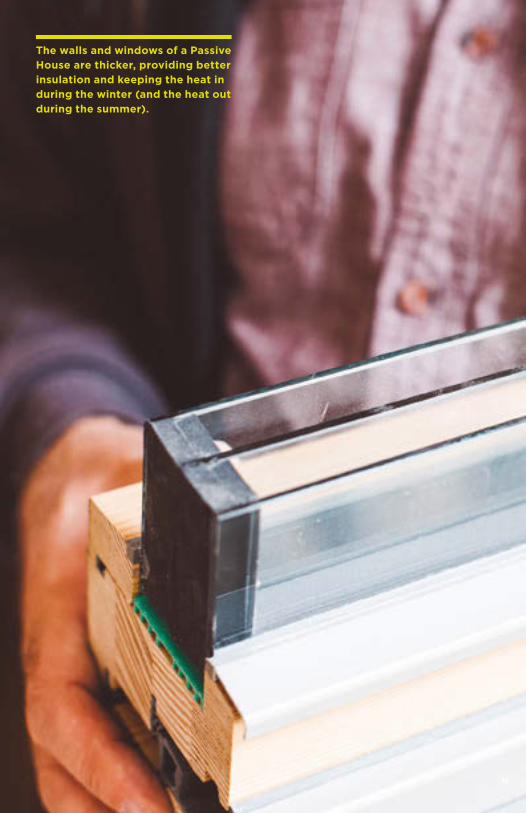
The walls and windows of a Passive House are thicker, providing better insulation and keeping the heat in during the winter (and the heat out during the summer).
16

17
GREEN TRANSPORTATION3/
* Mode share totals for baseline year (40% of trips in 2008) was based on data gathered through a TransLink “Trip Diary” survey that
is conducted about once every five years. To obtain more regular statistics, the City began an annual survey of Vancouver residents
that is slightly different in methodology but is believed to better capture the full range of travel by residents. This will be used to
measure Green Transportation indicators going forward.
INDICATOR BASELINE 2016 CHANGE
Per cent mode share by foot, bike and transit 40%* 50% of trips +10%
Total vehicle km driven per person 5,950 km/person/year 4,060 km/person/year -32%
32%
TARGETS:
• Make the majority (over 50%)
of trips by foot, bicycle and
public transit.
• Reduce average distance
driven per resident by 20%
from 2007 levels.
GOAL: MAKE WALKING, CYCLING AND PUBLIC TRANSIT PREFERRED TRANSPORTATION OPTIONS
DECREASE -IN-
DISTANCE DRIVEN PER
PERSON SINCE 2007

18
The City worked with TransLink to deliver the most significant expansion of the downtown bus network in decades, including connecting the West End to Yaletown and Gastown.
2016-2017 SUCCESSES:
TRAVELLED 30 TIMES AROUND THE WORLD ON MOBI
Mobi by Shaw Go (Vancouver’s public
bike share program) has installed
over 115 stations and 1,200 bikes since
launching in July 2016. Anticipated
challenges like helmets for all riders
and a sometimes hilly city didn’t slow
riders down. On a busy week Mobi
sees over 16,000 rides, and Mobi riders
have already covered over 1.2 million
kilometers: that’s 30 trips around the
world! Even during a cold, wet 2016
winter, people embraced Mobi. Ridership
numbers show that public bike share
isn’t just a leisurely summer activity, but
a great way to travel year-round. Staff
continue to work on adding additional
bikes and stations to the system.
BEGAN TRANSFORMING OUR ICONIC PUBLIC SPACES
There’s a bright future ahead for
exceptional public spaces in Vancouver.
In 2016, 800 Robson Street (aka Robson
Square) was closed to all motor vehicle
traffic to create the biggest public
space in downtown after Stanley Park
and the Seawall. Public and stakeholder
feedback helped us create a high-level
design for Robson Square, and staff will
continue to gather more input on the
plaza’s permanent design.
Meanwhile, VIVA Vancouver has been
innovating public spaces, transforming
road spaces into vibrant pedestrian
spaces, and encouraging community,
walking and cycling, and local businesses
since 2011. Looking ahead, the City will
refresh VIVA and produce a five year-
strategic plan for creative public spaces
where people can play, meet their
neighbours, relax and connect.
BEGAN REIMAGINING A HISTORIC RAIL CORRIDOR – THE ARBUTUS GREENWAY
The Arbutus Greenway now has a
temporary path for all to enjoy. The wide
pathway is separated from vehicle traffic
and promotes urban recreation, such as
walking, cycling and rolling, for people of
all ages and abilities. In addition to active
transportation and a future streetcar,
there are opportunities to incorporate
plaza space, public art, and urban
ecology into the final design.
In early 2017, the City asked Vancouver
residents about their vision for the future
greenway and heard from over 4,000
people. The values, ideas, and themes
we heard will be considered in the
context of broader City objectives, and
will help to guide the design process.
STARTED OUR JOURNEY TO BETTER REGIONAL TRANSIT
Transit service is continuing to improve
with increased off-peak SkyTrain
frequency, a 10% increase in frequency
on 50 bus routes across the region, and
a 15% increase in HandyDART service.
The City also worked with TransLink
to deliver a major trolley-bus network
expansion in 2016, including connecting
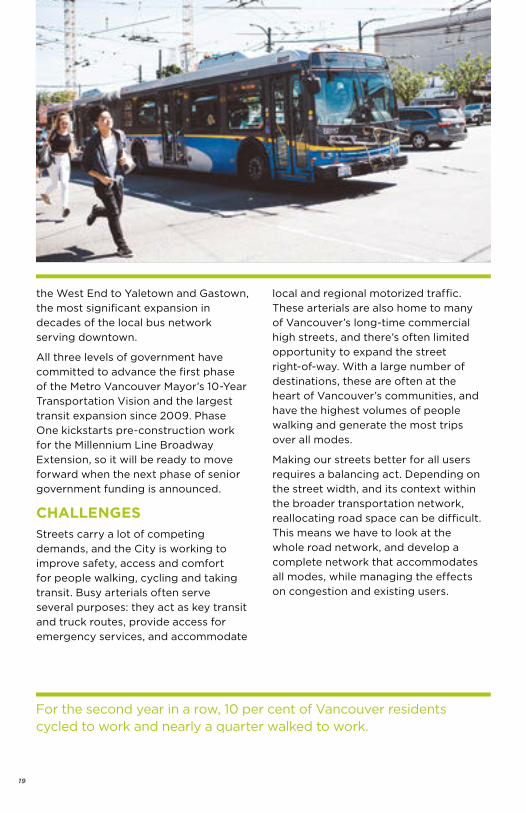
19
the West End to Yaletown and Gastown,
the most significant expansion in
decades of the local bus network
serving downtown.
All three levels of government have
committed to advance the first phase
of the Metro Vancouver Mayor’s 10-Year
Transportation Vision and the largest
transit expansion since 2009. Phase
One kickstarts pre-construction work
for the Millennium Line Broadway
Extension, so it will be ready to move
forward when the next phase of senior
government funding is announced.
CHALLENGESStreets carry a lot of competing
demands, and the City is working to
improve safety, access and comfort
for people walking, cycling and taking
transit. Busy arterials often serve
several purposes: they act as key transit
and truck routes, provide access for
emergency services, and accommodate
local and regional motorized traffic.
These arterials are also home to many
of Vancouver’s long-time commercial
high streets, and there’s often limited
opportunity to expand the street
right-of-way. With a large number of
destinations, these are often at the
heart of Vancouver’s communities, and
have the highest volumes of people
walking and generate the most trips
over all modes.
Making our streets better for all users
requires a balancing act. Depending on
the street width, and its context within
the broader transportation network,
reallocating road space can be difficult.
This means we have to look at the
whole road network, and develop a
complete network that accommodates
all modes, while managing the effects
on congestion and existing users.
For the second year in a row, 10 per cent of Vancouver residents cycled to work and nearly a quarter walked to work.

20
The Arbutus Greenway represents a once-in-a-generation opportunity to repurpose a transportation corridor.

21
ZERO WASTE4/
INDICATOR BASELINE 2015* CHANGE
Annual solid waste disposed to landfill and
incinerator from Vancouver
480,000 tonnes (2008) 351,000 tonnes -27%
* Solid waste data is compiled first at a regional level and then at the city level. As a result, Vancouver’s data is always one year behind
the reporting period.
DECREASE IN SOLID WASTE SENT TO LANDFILL AND INCINERATOR SINCE 2008
27%
TARGET:
Reduce solid waste going to
landfill and incinerator by 50%
from 2008 levels.
GOAL: CREATE ZERO WASTE

22
2016-2017 SUCCESSES:
SUPPORTED MICRO-CLEANING PROGRAMS AROUND THE CITY
Every day, micro-cleaning heroes work
tirelessly to keep our city safe, clean, and
litter-free. In 2016, micro-cleaning crews
supported through the City’s Street
Cleaning Grant Program cleaned 400
city blocks and collected over 12,000
bags of litter and 63,000 needles!
Micro-cleaning is different from the
sort of street cleaning typically done
by City crews and offers jobs and job
skills training for youth and adults with
barriers to traditional employment.
LAUNCHED STREET-LEVEL RECYCLING PROJECT IN THE WEST END
Finding a place to recycle while you’re
out and about can be difficult. Thanks
to the City and Recycle BC’s new on-
street recycling pilot, recycling in the
West End just got easier. In August
2016, 31 recycling stations were installed
throughout the West End on Denman,
Robson and Davie Streets and at
Second Beach. Stay tuned for more zero
waste progress as the City continues
to work with Recycle BC and product
producers to find creative solutions to
make recycling easier in Vancouver. A
map of the new recycling bin locations is
available at RecycleBC.ca.
REDEPLOYED RECYCLING CREWS TO KEEP STREETS CLEAN
In October 2016, Recycle BC took on full
responsibility for Vancouver’s residential
recycling program and the City ended its
term as their contracted service provider.
This means that taxpayers will no longer
have to pay a recycling utility fee. This
change freed up more staff and resources
to work on other important programs
that will get us to our Zero Waste Goal,
including preventing and collecting litter,
dealing with abandoned and illegally
dumped waste, and other work to help
keep our city clean and green.
CLOTHING DOESN’T BELONG IN THE LANDFILL
Every year 40,000 tonnes of textiles,
including 19,000 tonnes of clothing, is
sent to landfill or incinerator in Metro
Vancouver. To better understand how to
cut textile waste in the region, the City
partnered with the Leverage Lab, Metro
Vancouver, the Vancouver Economic
Commission, and industry. This group
worked together to understand why so
much clothing ends up in the garbage,
what happens to donated items, and how
to support reuse and recycling options.
Community groups and businesses are
also doing important work through local
repair and reuse markets. Upcycling
workshops hosted by Frameworq
included sewing and repair lessons
where people shared equipment and
materials – some even created entirely
new clothes! In addition, sorter-grader
companies like Trans-Continental Textile
Recycling are helping to keep textiles out
of the landfill and incinerator. Unwanted
clothing gets sorted into over 400
different categories for personal and
industrial reuse and recycling locally and
2.6 million coffee cups wind up as garbage in Vancouver each week. The City is looking at ways to deal with the waste from these and other single-use items.
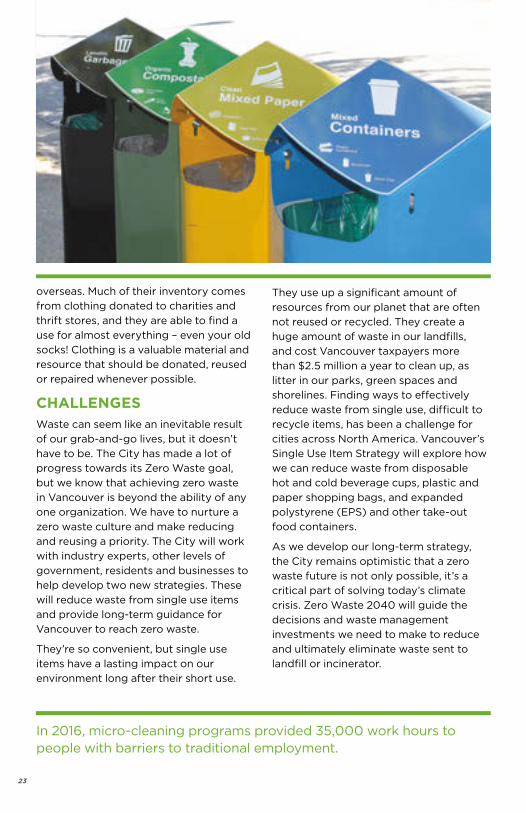
In 2016, micro-cleaning programs provided 35,000 work hours to people with barriers to traditional employment.
23
overseas. Much of their inventory comes
from clothing donated to charities and
thrift stores, and they are able to find a
use for almost everything – even your old
socks! Clothing is a valuable material and
resource that should be donated, reused
or repaired whenever possible.
CHALLENGESWaste can seem like an inevitable result
of our grab-and-go lives, but it doesn’t
have to be. The City has made a lot of
progress towards its Zero Waste goal,
but we know that achieving zero waste
in Vancouver is beyond the ability of any
one organization. We have to nurture a
zero waste culture and make reducing
and reusing a priority. The City will work
with industry experts, other levels of
government, residents and businesses to
help develop two new strategies. These
will reduce waste from single use items
and provide long-term guidance for
Vancouver to reach zero waste.
They’re so convenient, but single use
items have a lasting impact on our
environment long after their short use.
They use up a significant amount of
resources from our planet that are often
not reused or recycled. They create a
huge amount of waste in our landfills,
and cost Vancouver taxpayers more
than $2.5 million a year to clean up, as
litter in our parks, green spaces and
shorelines. Finding ways to effectively
reduce waste from single use, difficult to
recycle items, has been a challenge for
cities across North America. Vancouver’s
Single Use Item Strategy will explore how
we can reduce waste from disposable
hot and cold beverage cups, plastic and
paper shopping bags, and expanded
polystyrene (EPS) and other take-out
food containers.
As we develop our long-term strategy,
the City remains optimistic that a zero
waste future is not only possible, it’s a
critical part of solving today’s climate
crisis. Zero Waste 2040 will guide the
decisions and waste management
investments we need to make to reduce
and ultimately eliminate waste sent to
landfill or incinerator.

Frameworq Textile Fix-It Event
24

NIC
K P
AG
E
25
ACCESS TO NATURE5/
INDICATOR BASELINE 2016 CHANGE
Per cent of city’s land base within a 5 minute
walk to a green space*
92.6% (2010) 92.7% +0.1%
Total number of additional trees planted -- (2010) 82,000 trees +82,000**
Total hectares of natural areas restored or
enhanced
-- (2010) 20 hectares +20
Per cent of city’s land area covered by tree
leaf canopies
18% (2013) Survey to be conducted
in 2018
--
82,000 NEW TREES PLANTED SINCE 2010
TARGETS:
• All Vancouver residents live within a
five-minute walk of a park, greenway,
or other green space.
• Plant 150,000 new trees.
• Restore or enhance 25 hectares of
natural areas between 2010 and 2020.
• Increase canopy cover to 22% by 2050.
GOAL: VANCOUVER RESIDENTS ENJOY INCOMPARABLE ACCESS TO GREEN SPACES, INCLUDING THE WORLD’S MOST SPECTACULAR URBAN FOREST
26
2016-2017 SUCCESSES:
PLANTED A NEW BEE SANCTUARY AT FIFTH AND PINE
Urban bees and butterflies rely on our
gardens and green spaces for food and
shelter. One of the actions in the Park
Board’s Biodiversity Strategy is to make
our parks and gardens friendlier to
bees, butterflies, and other pollinators.
In return, these beneficial insects
pollinate our plants, crops, and fruit
trees, giving us beautiful flowers, fruits,
nuts, and honey. In late 2016, hundreds
of residents helped us plant 1,500 plants
in a new pop-up park at Pine Street and
West 5th Avenue. Diverse flowering
plants—much friendlier to pollinators
than normal lawn—will make this an
urban haven for pollen-carrying critters.
The new park is also home to a large
rainwater cistern that collects rainwater
in the wet season to use for watering in
the summertime. UBC design students
are using the park to test methods
(such as new types of bee houses) for
enhancing pollinators and teaching
residents about urban biodiversity.
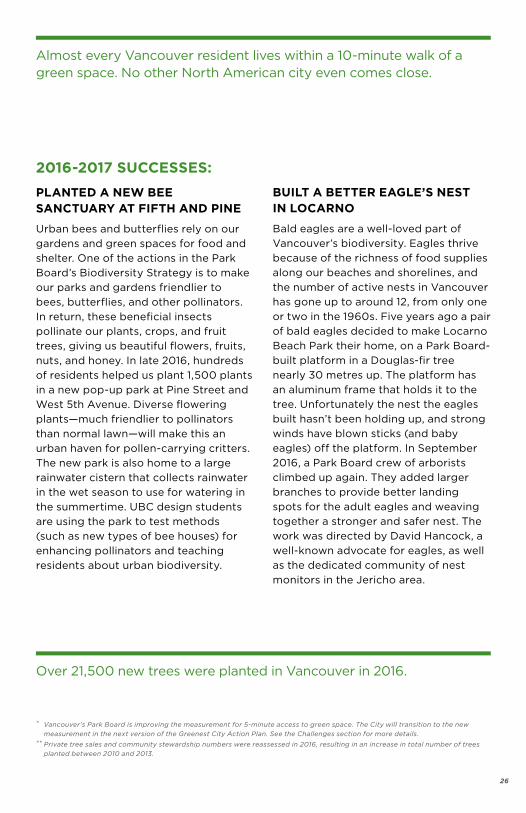
BUILT A BETTER EAGLE’S NEST IN LOCARNO
Bald eagles are a well-loved part of
Vancouver’s biodiversity. Eagles thrive
because of the richness of food supplies
along our beaches and shorelines, and
the number of active nests in Vancouver
has gone up to around 12, from only one
or two in the 1960s. Five years ago a pair
of bald eagles decided to make Locarno
Beach Park their home, on a Park Board-
built platform in a Douglas-fir tree
nearly 30 metres up. The platform has
an aluminum frame that holds it to the
tree. Unfortunately the nest the eagles
built hasn’t been holding up, and strong
winds have blown sticks (and baby
eagles) off the platform. In September
2016, a Park Board crew of arborists
climbed up again. They added larger
branches to provide better landing
spots for the adult eagles and weaving
together a stronger and safer nest. The
work was directed by David Hancock, a
well-known advocate for eagles, as well
as the dedicated community of nest
monitors in the Jericho area.
Almost every Vancouver resident lives within a 10-minute walk of a green space. No other North American city even comes close.
Over 21,500 new trees were planted in Vancouver in 2016.
** Vancouver’s Park Board is improving the measurement for 5-minute access to green space. The City will transition to the new
measurement in the next version of the Greenest City Action Plan. See the Challenges section for more details. ** Private tree sales and community stewardship numbers were reassessed in 2016, resulting in an increase in total number of trees
planted between 2010 and 2013.

The largest big-leaf maple tree in BC is located in Stanley Park: 29 metres tall with a trunk circumference of almost 11 metres.
27
STARTED A NEW PLAYBOOK FOR VANCOUVER’S PARKS
Almost 100% of Vancouver’s residents
live within a 10-minute walk to green
space, but we have 630,000 residents
living in what is already one of the
most densely populated cities in North
America. With another 150,000 people
expected in the next 25 years, we need
to start thinking about how we protect
and improve our parks and recreation
spaces. Starting in May 2017, the Park
Board launched VanPlay, a year-long
public conversation on a citywide
vision for 240 public parks and 55
recreation facilities in Vancouver.
Coming out of this will be Vancouver’s
Playbook, a new plan to guide how we
create vibrant parks and recreation
over the next 25 years. This is a chance
for all of us to imagine what kind of
future we want. You can get involved at
vancouver.ca/vanplay.
CHALLENGESOur five-minute walk target measures
how much land is close to green space,
not how many people. Also, how easy it
is for them to walk there? Are there big
hills or busy intersections on the way?
And what do you get at the end of your
walk? Is it a small patch of grass with a
tree or is it a swimming pool?
The Park Board wanted to fully
understand how to measure real
success, when the goal is really about
access to high-quality green space
for all residents. A new method now
looks at real human travel patterns,
a smarter measurement for smarter
planning. What did we find? In 2011,
99% of Vancouver residents lived within
a 10-minute walk of green space. 97%
lived within 8 minutes, and 80% lived
within 5 minutes. Now the Park Board
can look at where new parks can fill in
the gaps, how to help our high-demand
parks work more efficiently, and how to
improve access to existing parks.
WILLIAM VRABLE
NIC
K P
AG
E
28

18% DECREASE
-IN- TOTAL WATER CONSUMPTION
SINCE 2006
TARGETS:
• Meet or beat the strongest of
British Columbian, Canadian
and appropriate international
drinking water quality
standards and guidelines.
• Reduce per capita water
consumption by 33% from
2006 levels.
GOAL: VANCOUVER WILL HAVE THE BEST DRINKING WATER OF ANY CITY IN THE WORLD
29
CLEAN WATER6/
INDICATOR BASELINE 2016 CHANGE
Total number of instances of not meeting
drinking water quality standards
0 0 0
Total water consumption per capita 583 L/person/day (2006) 476 L/person/day -18%

30
2016-2017 SUCCESSES:
BEGAN PHASING OUT SINGLE-PASS SYSTEMS
Every year, nearly 4 billion litres of
Vancouver’s drinking water goes
through single-pass systems, where
water circulates once through a piece
of equipment and then, without any
recirculation or reuse, straight down
the drain. This is 50% more than the
total used by all City of Vancouver and
Park Board facilities combined, indoor
and outdoor!
Single-pass systems are already
banned in many North American cities.
In early 2017, City Council approved
a two-step approach to phase out
several types of single-pass systems,
new and existing, by 2020. This will
cut the water used per person in
Vancouver by 3% and help us get
closer to our Clean Water target. Using
less water also means we can meet
the water demands of a growing city
for longer, before expensive system
upgrades become necessary.
Replacing a single-pass system with an
alternative saves money. One local lab
installed a system to recirculate water
used in its fume-hood systems. This cut
their water usage by 100,000 litres a
day, and paid for itself in less than six
months through lower water and sewer
utility bills.
GETTING WATER USE UNDER PAR AT VANCOUVER GOLF COURSES
Maintaining high-quality greens on
golf courses can use up a lot of water.
Working with the City’s three public
golf courses and three private ones
within Vancouver, the City allocated
water “budgets” based on what they’ve
used in the past. All stayed “within
budget” in 2016. We are the only
municipality in the Lower Mainland that
have taken this approach with our golf
courses! Now they’re measuring how
much water they used, and trading best
practices (like better irrigation systems
and better maintenance) to become
more water-efficient and drought-
resistant in future summers.
FLUSHED OUT VANCOUVER’S LEAKY TOILETS
Silent but deadly (to water efficiency at
least), leaky toilets can be the biggest
water waster in the home. Finding and
repairing these leaks saves treated
drinking water for where it’s needed
most: cooking, cleaning and (of course)
drinking. In 2016, the City mailed test
kits to over 167,000 homes. People
could also enter a contest to show
they’d used the kits to detect leaks.
Winning a year’s supply of toilet paper
was nothing to sniff at either.
Water leaks account for about 14% of all water use in the average home. One leaky toilet can waste up to 135 litres a day.

31
CHALLENGESVancouver’s water system delivers
over 300 million litres of drinking water
to Vancouver homes and businesses
every day. With such a complex and
aging network, water mains and service
connections (the pipes that connect
from the mains to your building) can
occasionally leak and even break.
System pressure, disturbances from
construction, even cold weather can
cause this. Cutting these water losses
as quickly as possible is key to keeping
Vancouver’s water use down. The City
has dedicated crews that conduct leak
surveys using ultrasound. Crews listen
for noises that might mean a leaky pipe,
even if any water hasn’t surfaced yet.
This program so far has already saved
over $1.7 million worth of water. Plus, the
City’s capital replacement plan means
we proactively replace pipes, before
they break.
E. coli counts in False Creek can get
pretty high in the summertime. We
found the one main cause is boaters
who aren’t properly managing their
waste, such as by emptying their sewage
tanks at marinas. Speaking with them,
many people mentioned there were too
few of these services, or that they were
inconvenient to use. Going forward, the
City will tighten up requirements for
sewage management services, working
with marina and boat operators to make
that happen. Meanwhile, we’ll look at a
test project in summer 2017 for a mobile
pump-out service that can go right up to
the boats themselves.
Kids: “Dad, why is there a seal living in the toilet?”
Dad: “No kids, I said it’s important to have a good seal in the toilet tank. It’s slightly different.”
Actual feedback on the leaky toilet contest from one Vancouver resident

McCleery Golf Course in Vancouver
32

33
LOCAL FOOD7/
* Food assets include: number of community garden plots, farmers markets, community orchards, community composting facilities,
community kitchens, community food markets, and urban farms.
INDICATOR BASELINE 2016 CHANGE
Total number of neighbourhood food assets*
in Vancouver
3,340 food assets (2010) 4,740 food assets +42%
INCREASE IN NEIGHBOURHOOD FOOD ASSETS SINCE 2010
42%
TARGET:
• Increase city-wide and
neighbourhood food assets by a
minimum of 50% over 2010 levels.
GOAL: VANCOUVER WILL BECOME A GLOBAL LEADER IN URBAN FOOD SYSTEMS

34
2016-2017 SUCCESSES:
HELPED MAKE COMMUNITY GARDENS MORE BEAUTIFUL AND USABLE
Vancouver’s seen a surge in community
gardeners, with 4,450 garden plots
growing healthy local produce all across
the city. In addition to increasing the
amount of garden space, we want to
make sure existing gardens are the
safest, most beautiful and usable they
can be. In 2016, the City and the Park
Board provided nearly $30,000 in
small grants to 33 community gardens.
The money went towards buying new
equipment, laying down new pathways,
and rebuilding fences, garden boxes
and composters. Gardens bring
people together, to share skills, build
community, and improve access to local
food. A beautiful and well-equipped
garden can do that even better.
GETTING COOKS BACK INTO COMMUNITY KITCHENS
A community kitchen is a place for
people to gather and prepare meals
together. Often, participants learn
new healthy eating and cooking and
preparation skills. Community kitchens
provide spaces for people with common
interests, but different backgrounds or
health needs to come together to share
knowledge. In 2016, the City looked at
47 City-affiliated kitchens, and found
that some were not being used to their
full potential, even though they may be
in good condition. Now, the City, the
Park Board, and the YMCA are working
together, training staff to turn these
spaces back into active, well-used
kitchen spaces for everyone.
SUPPORTED MOBILE PRODUCE MARKETS
Everyone knows food brings people
together, but for some residents, limited
income or simply getting to a store
can be a barrier to getting nutritious,
affordable food. Neighbourhood Food
Networks are breaking down some of
those barriers, and every year the City
helps them through the Sustainable
Food System Grant. In 2016, we granted
$188,000 to organizations like the
Cedar Cottage Food Network. They
have been hosting mobile produce
markets every week for the last five
years, selling fresh fruit and vegetables
(local and organic wherever possible) to
people in the community at wholesale
cost. These markets also create a
welcoming gathering place, where
people can sample recipes and swap
stories with their neighbours.
In 2013, City Council adopted the Vancouver Food Strategy to become a global leader in urban food systems. In 2016, our Strategy won the first-ever Milan Pact Award for our work in sustainable food systems.

35
CHALLENGESOur Vancouver Food Strategy has
achieved a lot since 2013. The number
of community gardens is up 40%,
and we were one of the first cities in
Canada to adopt bylaws to permit and
legitimize urban farming. Community
food market guidelines help bring fresh
food to underserved neighbourhoods
and residents, but our Strategy could
be doing more, and we’re planning a
refresh of the Strategy. In developing it,
we will look at areas like better meeting
the food needs of children and families,
increasing food literacy opportunities,
and aligning food work with indigenous
food system goals.
“I’ve managed to kill every plant I’ve ever had. Gardening was out of the question. But with just the sheer number of gardens now, and all the friends we know who grow their own vegetables, this spring I finally got my own plot. Hope you like radishes, kids.”
Actual feedback on Greenest City from one Vancouver resident

36
37
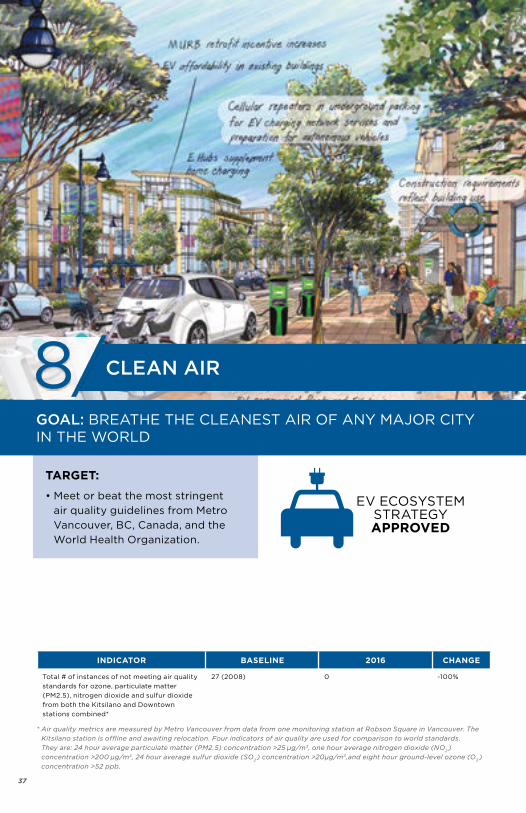
CLEAN AIR8/
INDICATOR BASELINE 2016 CHANGE
Total # of instances of not meeting air quality
standards for ozone, particulate matter
(PM2.5), nitrogen dioxide and sulfur dioxide
from both the Kitsilano and Downtown
stations combined*
27 (2008) 0 -100%
EV ECOSYSTEM STRATEGY APPROVED
TARGET:
• Meet or beat the most stringent
air quality guidelines from Metro
Vancouver, BC, Canada, and the
World Health Organization.
GOAL: BREATHE THE CLEANEST AIR OF ANY MAJOR CITY IN THE WORLD
* Air quality metrics are measured by Metro Vancouver from data from one monitoring station at Robson Square in Vancouver. The
Kitsilano station is offline and awaiting relocation. Four indicators of air quality are used for comparison to world standards.
They are: 24 hour average particulate matter (PM2.5) concentration >25 μg/m3, one hour average nitrogen dioxide (NO2 )
concentration >200 μg/m3, 24 hour average sulfur dioxide (SO2 ) concentration >20μg/m3,and eight hour ground-level ozone (O
3 )
concentration >52 ppb.
38
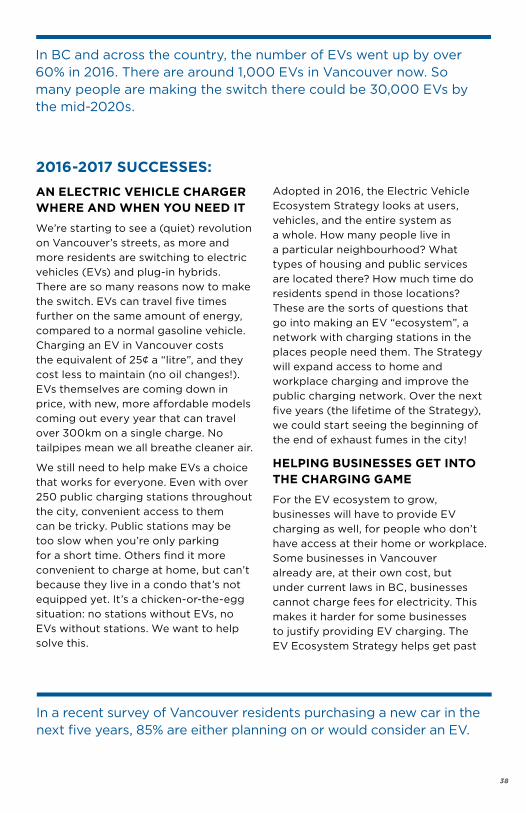
2016-2017 SUCCESSES:
AN ELECTRIC VEHICLE CHARGER WHERE AND WHEN YOU NEED IT
We’re starting to see a (quiet) revolution
on Vancouver’s streets, as more and
more residents are switching to electric
vehicles (EVs) and plug-in hybrids.
There are so many reasons now to make
the switch. EVs can travel five times
further on the same amount of energy,
compared to a normal gasoline vehicle.
Charging an EV in Vancouver costs
the equivalent of 25¢ a “litre”, and they
cost less to maintain (no oil changes!).
EVs themselves are coming down in
price, with new, more affordable models
coming out every year that can travel
over 300km on a single charge. No
tailpipes mean we all breathe cleaner air.
We still need to help make EVs a choice
that works for everyone. Even with over
250 public charging stations throughout
the city, convenient access to them
can be tricky. Public stations may be
too slow when you’re only parking
for a short time. Others find it more
convenient to charge at home, but can’t
because they live in a condo that’s not
equipped yet. It’s a chicken-or-the-egg
situation: no stations without EVs, no
EVs without stations. We want to help
solve this.
Adopted in 2016, the Electric Vehicle
Ecosystem Strategy looks at users,
vehicles, and the entire system as
a whole. How many people live in
a particular neighbourhood? What
types of housing and public services
are located there? How much time do
residents spend in those locations?
These are the sorts of questions that
go into making an EV “ecosystem”, a
network with charging stations in the
places people need them. The Strategy
will expand access to home and
workplace charging and improve the
public charging network. Over the next
five years (the lifetime of the Strategy),
we could start seeing the beginning of
the end of exhaust fumes in the city!
HELPING BUSINESSES GET INTO THE CHARGING GAME
For the EV ecosystem to grow,
businesses will have to provide EV
charging as well, for people who don’t
have access at their home or workplace.
Some businesses in Vancouver
already are, at their own cost, but
under current laws in BC, businesses
cannot charge fees for electricity. This
makes it harder for some businesses
to justify providing EV charging. The
EV Ecosystem Strategy helps get past
In BC and across the country, the number of EVs went up by over 60% in 2016. There are around 1,000 EVs in Vancouver now. So many people are making the switch there could be 30,000 EVs by the mid-2020s.
In a recent survey of Vancouver residents purchasing a new car in the next five years, 85% are either planning on or would consider an EV.

39
this early hurdle. Places like grocery
stores and coffee shops, where people
make quick stops, make great locations
for “Ehubs”, clusters of fast chargers
that can get you ready for your day’s
driving in less than 5 minutes. The City
will partner with businesses like these
to own and manage EHubs for the next
five to seven years. Local governments
are allowed to charge for electricity,
so we are more able to provide stable
funding to support these early stations.
At the same time, we’re working with
the provincial government to enable
businesses to recoup the costs of
charging stations, and with international
partners so that installers of EV stations
can sell carbon credits for their efforts.
CHALLENGESVancouver residents breathe some
of the cleanest air in the world. Other
cities and countries aren’t so lucky. Air
quality and urban pollution are quickly
becoming a global issue. Out of the 20
world cities with the most air pollution,
13 are in India, according to the World
Health Organization. Meanwhile,
everyone’s heard about Beijing’s “red
alerts”: near-total shutdowns of the city
due to smog.
China and India are taking huge steps
towards cleaning up. China is aiming
for 20% of vehicles sold annually to be
powered by alternative fuels by 2025. In
India, no gasoline or diesel cars will be
sold in the country by 2030. The world
is moving away from fossil fuel-burning
vehicles, and we need to move with
it. Reducing our dependence on fossil
fuels will keep our air clean, improve the
health of Vancouver residents, and set
us up for a world where gas guzzlers are
a thing of the past.
Between 2011 and 2014, the City’s
EV charging stations logged 13,000
charging sessions over a three-year
period. In 2016 alone, we logged over
33,000 sessions. At the same time, the
average charging session is twice as
long as needed to fully recharge the
battery, meaning that people are taking
up charging spots longer than they need
to. With EV demand growing quickly,
the City is working to speed up charger
deployment in a thoughtful way, and
looking at charging fees for station
users, to be ready before the next wave
of EVs arrives.

40
41
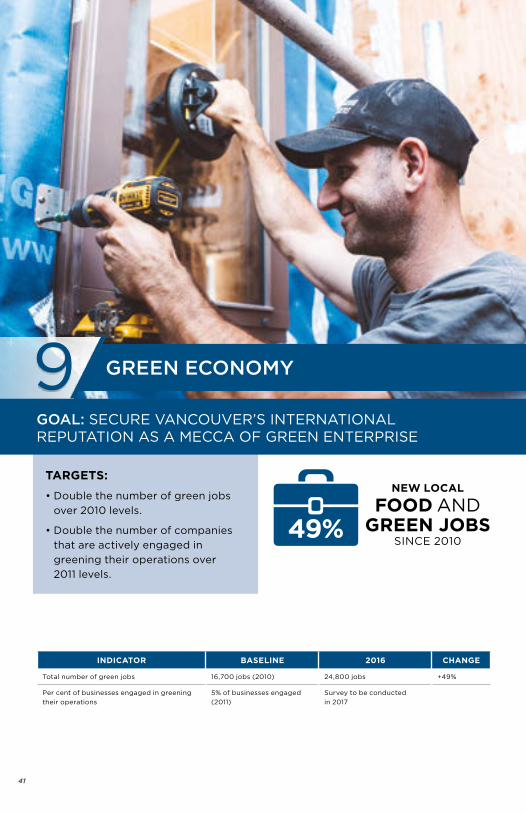
GREEN ECONOMY9/
TARGETS:
• Double the number of green jobs
over 2010 levels.
• Double the number of companies
that are actively engaged in
greening their operations over
2011 levels.
INDICATOR BASELINE 2016 CHANGE
Total number of green jobs 16,700 jobs (2010) 24,800 jobs +49%
Per cent of businesses engaged in greening
their operations
5% of businesses engaged
(2011)
Survey to be conducted
in 2017
GOAL: SECURE VANCOUVER’S INTERNATIONAL REPUTATION AS A MECCA OF GREEN ENTERPRISE
NEW LOCAL
FOOD AND GREEN JOBS
SINCE 201049%

42
2016-2017 SUCCESSES:
25,000 GREEN JOBS IN VANCOUVER
Green and local food jobs in Vancouver
surged between 2014 and 2016. Nearly
24% growth means almost 4,800
new and transitional green jobs over
the last three years, and over 8,000
since 2010. In part due to the City’s
green building policies, jobs in green
building design and construction, and
associated products, increased by 40%.
Employment in the local food sector,
which includes food processors and
beverage manufacturers, grew by 27%
as distribution systems improved and as
people continued to buy local. Materials
management and recycling jobs grew
15% as the business case for recovering
and reusing waste gets stronger.
USED THE CITY AS A TEST BED FOR INNOVATION
The City of Vancouver and the
Vancouver Economic Commission
(VEC) work together on the Green and
Digital Demonstration Program (GDDP)
program to support innovative local
entrepreneurs and startups by testing
their products or services on city-
owned assets. It helps businesses to
quickly grow, commercialize, and access
new markets, using the VEC’s support
and the City as a reference. As of early
2017, two companies have launched
since participating in the GDDP, while
11 more are in preparations. Bokoeco
makes a natural, probiotic-based
product that repels pests and controls
the smell and methane released by food
scrap and compost bins. Their test-run
with the bins at the Carnegie Centre
downtown was a success story that
let them engage other organizations.
Meanwhile, LoopShare’s involvement
in GDDP gave them the credibility
to raise millions in global investment
for their product: an electric scooter
share system that City staff will test in
summer 2017 while on City business.
GREEN SCREENS HAVE COME A LONG WAY
Vancouver is the third largest film and
TV production centre in North America,
and a world-class destination when it
comes to sustainable production. As
part of the 2016 Vancouver International
Film Festival, the Sustainable
Production Forum brought together
industry, studio executives, and global
and local sustainability organizations
for a day of learning about greening film
production. The VEC hosted training
workshops on reducing on-set and post-
production waste, and myth-busting
common misconceptions about the
cost and convenience of sustainable
production. As part of the VEC’s
long-term support of sustainability in
the industry, the VEC’s office of the
Vancouver Film Commissioner also
works to encourage local innovation
around greening of sets.
“[Since 2011,] by virtually every measure, BC’s cleantech sector shows dramatic growth: the number of cleantech companies is up 35% to 273, the number of BC-based employees is up 20% to 8,560, average wages have increased by 24% to $84,000 and the amount of equity raised is also up 25% to $6 billion.”
KPMG, British Columbia Cleantech 2016 Status Report
43
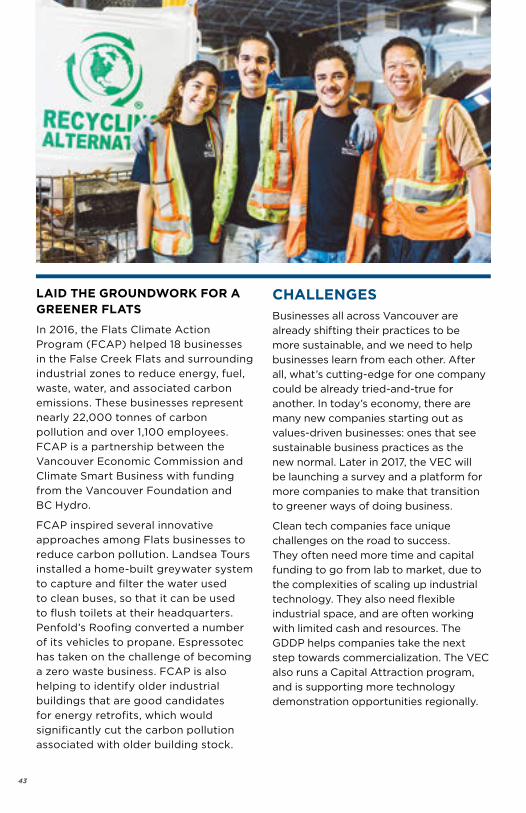
LAID THE GROUNDWORK FOR A GREENER FLATS
In 2016, the Flats Climate Action
Program (FCAP) helped 18 businesses
in the False Creek Flats and surrounding
industrial zones to reduce energy, fuel,
waste, water, and associated carbon
emissions. These businesses represent
nearly 22,000 tonnes of carbon
pollution and over 1,100 employees.
FCAP is a partnership between the
Vancouver Economic Commission and
Climate Smart Business with funding
from the Vancouver Foundation and
BC Hydro.
FCAP inspired several innovative
approaches among Flats businesses to
reduce carbon pollution. Landsea Tours
installed a home-built greywater system
to capture and filter the water used
to clean buses, so that it can be used
to flush toilets at their headquarters.
Penfold’s Roofing converted a number
of its vehicles to propane. Espressotec
has taken on the challenge of becoming
a zero waste business. FCAP is also
helping to identify older industrial
buildings that are good candidates
for energy retrofits, which would
significantly cut the carbon pollution
associated with older building stock.
CHALLENGESBusinesses all across Vancouver are
already shifting their practices to be
more sustainable, and we need to help
businesses learn from each other. After
all, what’s cutting-edge for one company
could be already tried-and-true for
another. In today’s economy, there are
many new companies starting out as
values-driven businesses: ones that see
sustainable business practices as the
new normal. Later in 2017, the VEC will
be launching a survey and a platform for
more companies to make that transition
to greener ways of doing business.
Clean tech companies face unique
challenges on the road to success.
They often need more time and capital
funding to go from lab to market, due to
the complexities of scaling up industrial
technology. They also need flexible
industrial space, and are often working
with limited cash and resources. The
GDDP helps companies take the next
step towards commercialization. The VEC
also runs a Capital Attraction program,
and is supporting more technology
demonstration opportunities regionally.

44
EV
ER
GR
EE
N
45
LIGHTER FOOTPRINT10/
18,400 PEOPLE EMPOWERED TO TAKE ACTION ON GREENEST CITY
TARGET:
• Reduce Vancouver’s ecological
footprint by 33% over 2006 levels.
GOAL: ACHIEVE A ONE-PLANET ECOLOGICAL FOOTPRINT
* “People empowered to take action” are defined as those who are enabled by City-supported programs to change their lifestyle or
are implementing a community project that helps Vancouver achieve its Greenest City goals as a result of support provided by a
City-led or City-supported program. Examples include learning to preserve food or ride a bike in a community centre class, as well
as people involved in projects supported by the Vancouver Foundation and City of Vancouver Greenest City Fund. The definition
excludes people participating in a dialogue or consultation, attending an event, using infrastructure (e.g., bike lanes, food scraps
collection), or receiving a personal incentive (e.g., home energy retrofits).
INDICATOR BASELINE 2015 CHANGE
Proxy: Number of people empowered* by a
City-led or City-supported project to take
personal action in support of a Greenest City
goal and/or to reduce levels of consumption
(cumulative)
600 people empowered to
take action (2011)
18,400 people empowered to
take action
+17,800

46
2016-2017 SUCCESSES:
STUDENTS AT CITYSTUDIO HELPED BUILD THE GREENEST CITY
Every year we invite CityStudio students
to unleash their creativity to make
Vancouver more livable, joyful and
sustainable. In 2016 student projects
were largely focused on Northeast False
Creek. Teams came up with projects
looking at Greenest City themes like
building social connections, reducing
wasted food, and making walking and
cycling safer and more fun. Umbrella
Taxi “drivers” (local artists, dancers, and
actors) helped pedestrians stay dry on
a rainy day while having a fun chat as
they walked them to their destination.
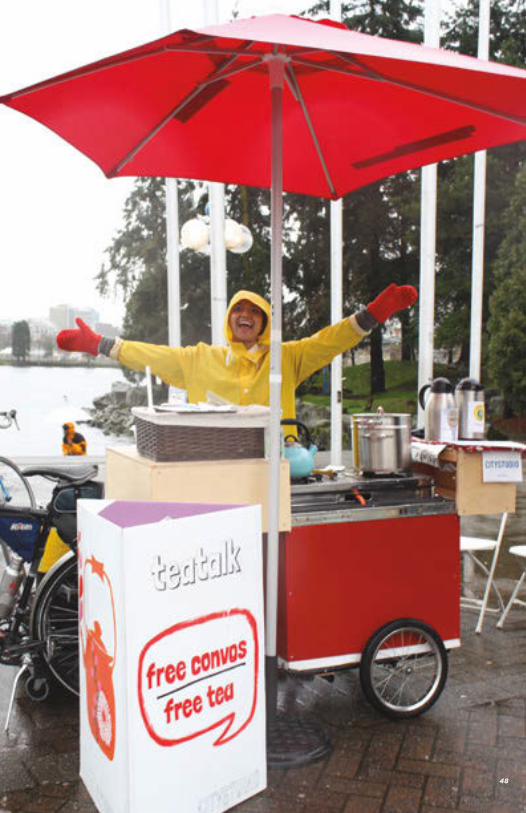
Teatalk brought total strangers together
to connect over free tea. The Food
Recovery Map highlighted grocery
stores and cafes in the neighbourhood
that sell food for less when it’s close to
the best-before date, meaning less food
gets thrown out. And Illumilane turned
a bike lane and walkway into interactive
art, using rainbow-patterned lights that
helped make the walking path more
visible at night. Pressure-sensitive lights
also rewarded cyclists who were riding
safely and warned them if they were
going too fast. These projects increased
engagement between residents of
Northeast False Creek and helped show
what a more sustainable and liveable
future neighbourhood could look like.
RELAUNCHED GREENEST CITY FUND
The first Greenest City Fund ran
in partnership with the Vancouver
Foundation over four successful
years. $1.9 million went out to support
nearly 600 amazing projects, all led
by residents and community groups
working to make the Greenest City
a reality. Now, a new version of the
Greenest City Fund launched in 2017
with two grant streams: the Greenest
City Grant and the Greenest City –
Neighbourhood Small Grant. In the
meantime, in 2016 the Fund supported
six projects with $250,000. These
projects looked at issues of recovering
wasted food, beekeeping, and helping
newly arrived residents make use of the
city’s bike networks.
HELPED NEIGHBOURHOODS FORM “GREEN BLOCS”
Neighbours working together can
accomplish amazing things. With
help from the Greenest City Fund,
Evergreen relaunched the Project
Green Bloc program, which helps
Vancouver residents band together to
measure and reduce their ecological
footprint through a community project.
Neighbours gather into teams to
learn new skills and develop ways to
gradually improve how they live and
In 2016, $250,000 of the Greenest City Fund went to support six great projects. Meanwhile, the Neighbourhood Small Grants program helped 123 smaller projects get off the ground, supporting and engaging over 1,000 people to improve their little slice of Vancouver.

47
function as a neighbourhood. As of
early 2017, the new and improved
Green Bloc has already signed up four
neighbourhoods, from South Cambie
to the West End.
Connecting with neighbours towards
a common goal is a great way to move
the dial: between 2013 and 2015, the
first Green Bloc Neighbourhood in
Riley Park reduced their collective
ecological footprint by 12%. These
pioneers showed that any resident
of Vancouver can make a difference.
Getting a bunch of your neighbours
together to make your neighbourhood
more beautiful, connected and
resilient? It’s an amazing feeling.
Contact Evergreen (evergreen.ca) to
get your own Project Green Bloc.
CHALLENGES
Vancouver is growing quickly.
How do we build a better sense of
community when everyone is new?
A great example is Northeast False
Creek (NEFC). With the viaducts
coming down and a whole new area
of Vancouver opening up, we are
looking at how future residents can
build personal connections to their
city and their new neighbourhood.
One CityStudio team explored this in
2016 with a historical plaque and video
project uncovering the hidden stories
for eight sites in NEFC and Chinatown.
This was part of the Imagination Zone,
a series of CityStudio projects focussed
on NEFC. The Imagination Zone will
also help in planning how we connect
with residents over the future of NEFC.
Measuring Vancouver’s ecological
footprint involves knowing how people
travel, where they live, and how much
they consume in terms of food and
materials. Much of the data we need
has been unavailable since 2006, but
this changed with the return of the
national long-form census in 2016.
The City can now use the data to
improve and re-measure Vancouver’s
ecological footprint, a big step towards
figuring out how to reduce our overall
environmental impact.
48

WALKING THE TALK
49
GREEN OPERATIONS
TARGETS:
• 50% reduction in GHGs from City operations from 2007 levels
• 70% waste diversion in public-facing City facilities, and 90% waste diversion
in all other City-owned facilities
• Reduce water use in City operations by 33% from 2006 levels
* Without the benefit of universal water metering of our civic facilities, metric tracking is a best estimate only, based on available data
and extrapolation. The accuracy of the metric will increase as water meters continue to be installed at prioritized City buildings.
INDICATOR BASELINE 2016 CHANGE
Total tonnes of CO2e emissions from
City operations
490,000 tCO2e (2007) 220,000 tCO
2e -49%
Total waste diversion rate in
City facilities and operations
65% (2013)
(public-facing facilities)
65% 0%
85% (2013)
(other City-owned facilities)
91% +6%
Total water use in City operations 2,680,000 m3 (2006) 2,065,000 m3 -23%*

50
2016-2017 SUCCESSES:
SET AMBITIOUS ENERGY TARGETS FOR CITY BUILDINGS
It’s important that the City walks the
talk. If we require buildings to be more
energy-efficient throughout Vancouver,
we’d better be doing the same with
our own buildings. The City owns or
operates nearly 600 buildings with over
11,000,000 square feet of floor space.
For years, we’ve been upgrading and
optimizing mechanical and electrical
systems in our facilities, and shifting
how our employees use energy. It’s
paid off: our carbon pollution from City
facilities has dropped 23% since 2007,
despite floor space going up 20% over
the same time.
Now we’re pushing it even further. In
2016, we set a target to derive 100% of
the energy used in our buildings from
renewable sources by 2040. This is 10
years ahead of the same community
target set out in the Renewable City
Strategy. Our new Renewable Energy
Strategy for City-Owned Buildings sets
out a plan to use our own buildings to
lead the way towards a clean-energy
future in the most cost-effective way.
One great example will be the new
Fire Hall #17 planned in Southeast
Vancouver. The current fire hall is 62
years old and in need of renewal. The
new one will be Vancouver’s first zero-
emissions fire hall, meaning energy used
by the building will be roughly equal
to the amount of renewable energy
created on-site. First, a more energy-
efficient Passive House-standard
building design drastically cuts down
its energy use. Then, solar panels on
the roof will generate enough on-site
renewable energy to offset its remaining
emissions. This fire hall will be more
resilient too: because it won’t require
natural gas, it will be much safer after
an earthquake.
CUT WATER USE IN CITY PARKS
Parks need water, but the Park Board
found some that could do with less. In
2016, Park Board staff found that Trout
Lake and three sites within Stanley Park
(the stream at the Zoo, the ponds at the
Trains, and the Water Park) were four
of the biggest water users in the park
system. In some cases, cutting water
use was as easy as installing a timer.
now the water wheel and waterfall at
the Stanley Park Train only comes on
when the train passes by. Together,
these four projects cut total water use
The Green Operations Plan is a collection of the City’s strategies to lead the way on green initiatives. It’s about how we do the work we do in a more sustainable way. The vision is for the City to become a world leader in environmentally responsible operations. Over the next few years Green Operations will also focus on reducing waste generation, continuing to improve the capture of landfill gas, reducing the use of toxic materials, and reducing water consumption in City operations.

51
in the entire park system in 2016 by 31%
compared to the 2012-2014 average,
saving $265,000 in water bills at the
same time. The City has set a target to
cut our City-operations water use by
33% between 2006 and 2020.
MADE OUR WASTE FLEET LESS POLLUTING
In 2016, 29 diesel powered refuse-
collection vehicles were replaced with
compressed natural gas ones. These
trucks now put out nearly 20% less
carbon pollution than the units they
replaced. Overall, the City’s goal is to
cut annual emissions from our fleet by
30% between 2007 and 2020.
DECONSTRUCTED CITY HALL’S EAST WING
The East Wing of City Hall was built
in 1970, but it was only ever intended
to be temporary, and it had a high risk
of collapsing in an earthquake. This
winter, it came down piece-by-piece:
no wrecking ball, no huge dust cloud.
Deconstruction is a process where a
building is carefully taken apart and the
waste material is reused or recycled as
much as possible. With the East Wing,
we aim to salvage or recycle 85% of the
building’s materials. Deconstruction also
means better air quality, better dust
control, and less noise.
Four water-saving projects in City parks cut water use in the whole park system by nearly a third in 2016.

52
The East Wing deconstruction project aimed to divert 85% of the material from landfill.
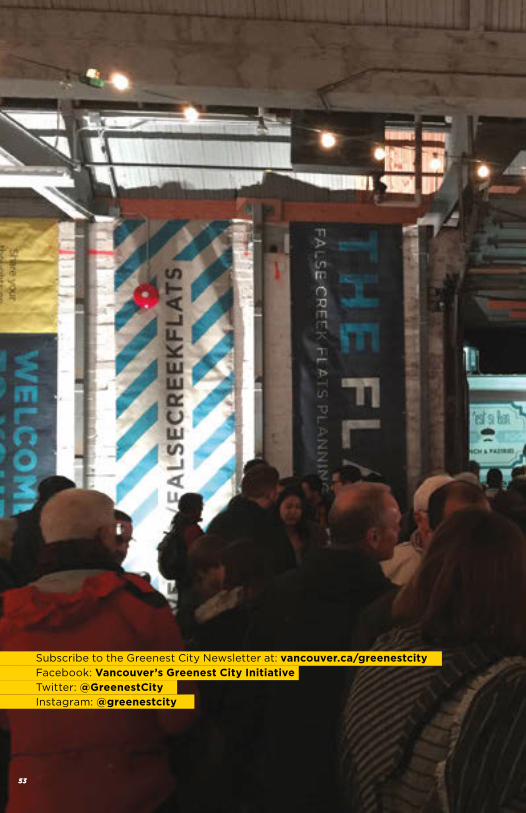
5353
Subscribe to the Greenest City Newsletter at: vancouver.ca/greenestcity Facebook: Vancouver’s Greenest City Initiative Twitter: @GreenestCity
Instagram: @greenestcity
55
Thank you to all staff and members of the community for your hard work and for
allowing us to share the stories of your success.
Vancouver has a long-term plan to be powered by 100% renewable energy
before 2050. What does that mean? Get the facts at vancouver.ca/renewablecity. And if you get a group of people together, we’ll come to you
and answer your questions in person. Go to vancouver.ca/100retalks to
find out more.
ACKNOWLEDGEMENTS
QUESTIONS? WE’VE GOT ANSWERS
GET INVOLVED!
We have only three years left until 2020.
A lot is going to happen, and there are
many ways to get involved. The City
wants to work together with residents,
businesses, and industry. Learning
together (and from each other) is the
only way we’ll succeed.
We’ll provide information so you can
understand what’s in store, around
things like zero waste, public spaces,
sea level rise, and renewable energy.
We’ll talk with you, so you can ask
questions and give us your ideas. And
through our Greenest City Fund, we’ll
support community groups, industry,
and of course residents, to help us
make the greenest city a reality.