2020-21 Migration Program Report - homeaffairs.gov.au
58
2020 – 21 Migration Program Report Program year to 30 June 2021
Transcript of 2020-21 Migration Program Report - homeaffairs.gov.au

2020 – 21 Migration Program Report
Program year to 30 June 2021
Page 2 of 582020 – 21 Migration Program Report
Table of Contents
About this report 5
Enquiries 5
Definition of terms 6
Background to the Migration Program 8
Calculating the Migration Program Outcome 8
Executive Summary 9
Skill Stream 9
Family Stream 12
Special Eligibility Stream 12
Child Stream 12
Migration Program Outcome - Further Information 13
Source countries 13 State/Territory of Intended Residence 13
1. Migration Program Outcome 2020–21 14
1.1. Migration Program Outcome by stream 14
1.2. Migration Program Outcome by stream and intended residence state/territory 15
1.2.1. Migration Program Outcome by intended residence state – comparison with previous years 16 1.2.2. Migration Program Outcome: Australian Capital Territory by stream and visa category 17 1.2.3. Migration Program Outcome: New South Wales by stream and visa category 18 1.2.4. Migration Program Outcome: Northern Territory by stream and visa category 19 1.2.5. Migration Program Outcome: Queensland by stream and visa category 20 1.2.6. Migration Program Outcome: South Australia by stream and visa category 21 1.2.7. Migration Program Outcome: Tasmania by stream and visa category 22 1.2.8. Migration Program Outcome: Victoria by stream and visa category 23 1.2.9. Migration Program Outcome: Western Australia by stream and visa category 24 1.2.10. Migration Program Outcome: State not specified by stream and visa category 25
1.3. Migration Program Outcome by client location at time of application 26
1.3.1. 2020–21 Migration Program Outcome by visa type and location of client at time of application 26 1.3.2. Migration Program Outcome (Skill stream): Location of client at time of application – comparison with previous years 27 1.3.3. Migration Program Outcome (Family stream): Location of client at time of applications – comparison with previous years 28
1.4. Migration Program Outcome by country and region of citizenship 29
1.4.1. 2020–21 Migration Program Outcome: top 10 countries of citizenship by stream 29 1.4.2. 2020–21 Migration Program Outcome: Top 10 countries of citizenship - comparison with previous years 30 1.4.3. 2020–21 Migration Program Outcome: Top 10 countries of citizenship – rank comparison with previous years 31 1.4.4. Migration Program Outcome 2010–11 to 2020–21 – by Region (Major) 32 1.4.5. Migration Program Outcome 2010–11 to 2020–21 – by Top 10 Region (Minor) and Percentage of Total 33 1.4.6. Migration Program Outcome 2010–11 to 2020–21 – by Top 10 Region (Minor) 34
Page 3 of 582020 – 21 Migration Program Report
2. Skill stream 35
2.1. Composition of Migration Program Outcome 2020-21 Skill Stream 35
2.2. Migration Program Outcome: Business Innovation and Investment Program (BIIP) Category
– by stream 36
2.3. Migration Program Outcome: Global Talent (Independent) Category – by priority growth
sector 37
2.4. Migration Program Outcome: Regional Category – by Subcategory and State/Territory of
Intended Residence 38
2.5. Migration Program Outcome: Top 10 ANZSCO Occupation Unit Groups (Skill stream -
primary applicants) 39
2.6. Migration Program Outcome: Top five ANZSCO Occupation Unit Groups – by visa category
(Skill stream – primary applicants) 40
2.7. Migration Program Outcome: Employer Sponsored Category – by Occupation 41
2.8. Migration Program Outcome: Skilled Independent Category – by Occupation 42
2.9. Migration Program Outcome: Regional Category – by Occupation 43
2.9.1. Regional Category by Top 10 ANZSCO Occupation Unit Groups (primary applicants) 43 2.9.2. Regional Subcategories by Top 10 ANZSCO Occupation Unit Groups (primary applicants) 44
2.10. Migration Program Outcome: State/Territory Nominated Category – by Occupation 45
2.11. Employer Sponsored Category: comparison of processing activity and program outcome 46
2.12. Skilled Independent Category: comparison of processing activity and program outcome 47
2.13. Regional Category: comparison of processing activity and program outcome 48
2.13.1. Regional – Skilled Employer Sponsored Regional subcategory: comparison of processing activity and program outcome 49 2.13.2. Regional – Skilled Work Regional subcategory: comparison of processing activity and program outcome 50
2.14. State / Territory Nominated Category: comparison of processing activity and program
outcome 51
2.15. Business Innovation and Investment Program (BIIP): comparison of processing activity and
program outcome 52
2.16. Distinguished Talent Category: comparison of processing activity and program outcome 53
2.17. Global Talent (Independent) Category: comparison of processing activity and program
outcome 54
3. Family stream 55
3.1. Partner Category: comparison of processing activity and program outcome 55
3.2. Parent Category: comparison of processing activity and program outcome 56
3.3. Other Family Category: comparison of processing activity and program outcome 57
4. Special Eligibility stream 58
4.1. Special Eligibility Category: comparison of processing activity and program outcome 58
5. Child stream 58
5.1. Child Category: comparison of processing activity and program outcome 58

Page 4 of 582020 – 21 Migration Program Report
(this page intentionally left blank)

Page 5 of 582020 – 21 Migration Program Report
About this report
This report provides data about the permanent Migration Program administered by the Department of Home
Affairs (the Department). This report does not include data on the permanent Humanitarian Program.
This report is published annually.
Data is sourced from several departmental visa processing and recording systems.
For privacy reasons, < 5 has been used where a number in a table is between 1 and 4.
Historical Migration Program reports are available on the Department of Home Affairs website
(https://www.homeaffairs.gov.au/research-and-statistics/statistics/visa-statistics/live/migration-program).
Enquiries
Any comments or enquiries concerning this report should be sent to
Page 6 of 582020 – 21 Migration Program Report
Definition of terms
Activity: For the purposes of Migration Program reporting, this refers to visa processing
activity status and includes counts of lodgements, finalisation types (grant, refusal,
withdrawal) and applications onhand. Activity data may also include second stage
permanent applications that do not count toward the Migration Program ceiling.
ANZSCO: Occupation data in this report utilises the Australian and New Zealand Standard
Classification of Occupations (ANZSCO). ANZSCO is a standardised classification
framework for collection, publication and analysis of occupation data. Further
information on ANZSCO is available on the Australian Bureau of Statistics website
(https://www.abs.gov.au).
Citizenship country: The country of citizenship of the visa applicant or visa holder. Where a visa applicant
or visa holder has more than one citizenship country, either the citizenship of the
travel document or the citizenship nominated by the visa applicant is used.
Decisions: A visa processing activity outcome where a decision-maker (including system-
generated decision-making) grants or refuses a visa application.
Finalisations: A visa processing activity outcome where a decision-maker grants or refuses a visa
application, or the application is otherwise finalised by client withdrawal.
In Australia: In this report, this term refers to the location of the client at the time the application
was lodged. An applicant in Australia may already hold a visa of the same kind or
may be applying for another type of visa.
Lodged: Lodged is the count of applications receipted in a departmental office or submitted
electronically.
Onhand: A visa application that has been lodged but has not been finalised at a point in time.
An application that is onhand may also be referred to as ‘in the pipeline’.
Outside Australia: In this report, this term refers to the location of the client at the time of lodging the
application.
Outcome: For the purposes of Migration Program reporting, outcome refers to the number of
visas granted that count toward the Migration Program. Outcome includes primary
applicants as well as secondary/dependant applicants.
Where a visa has a permanent residence pathway, eg from a provisional or ‘first
stage’ visa to a permanent or ‘second stage’ visa, the applicant is counted to the
Migration Program at grant of the provisional visa.
Some visas granted during a program year may not count toward the Migration
Program ceiling, for example:
If a person has been previously granted a visa which counted toward the
Migration Program, that person will not be counted again.
When a visa is granted and subsequently cancelled in the same program year,
the grant is excluded for the purposes of Migration Program outcome reporting.
When a Partner visa applicant does not progress to the second stage
(permanent) visa, a place is returned to the program.
If a Business Innovation and Investment visa (granted in an earlier year) is
cancelled, a place is returned to the program in the year of cancellation.
Page 7 of 582020 – 21 Migration Program Report
Places: In this report, each grant that counts toward the Migration Program outcome is a
place delivered against the ceiling of Migration Program places for the year. Where
referring to Migration Program outcome within the report, the terms ‘grant’ and
‘place’ may be used interchangeably.
Primary applicant: The primary applicant is the person who must satisfy the primary criteria for the grant
of a visa under the Migration Regulations. Also known as the principal applicant.
Secondary applicant: Secondary applicants must satisfy the secondary criteria for the grant of a visa under
the Migration Regulations. A secondary applicant is generally a dependant of the
primary applicant.
Region (major): The major geographical region in which the country of citizenship of the applicant is
located. Region groupings are determined based on the Australian Bureau of
Statistics Standard Classification of Countries (SACC), 2016.
Region (minor): The minor geographical region in which the country of citizenship of the applicant is
located. Region groupings are determined based on the Australian Bureau of
Statistics Standard Classification of Countries (SACC), 2016.

Page 8 of 582020 – 21 Migration Program Report
Background to the Migration Program
Australia’s Migration Program is set annually, and runs from 1 July to 30 June of each financial year. The
size and composition of the Migration Program is set each year through the Australian Government’s Budget
process.
There are four streams in the Migration Program:
The Skill stream is designed to improve the productive capacity of the economy and fill skill shortages in
the labour market, including those in regional Australia.
The Family stream is predominantly made up of Partner category visas, enabling Australian citizens and
permanent residents to reunite with family members from overseas.
The Special Eligibility stream covers visas for those in special circumstances that do not fit into the
other streams. This can include permanent residents returning to the country after a period away.
The Child stream provides migration avenues for children of Australian citizens and permanent residents
and is demand driven.
Calculating the Migration Program Outcome
The Skill and Family streams include ‘two-stage’ visas, which provide a permanent residence pathway for
visa holders from a provisional or ‘first stage’ visa to a permanent or ‘second stage’ visa. While such
pathways involve the grant of two visas, to avoid double counting, the visa holder is counted to the Migration
Program at grant of the provisional or ‘first stage’ visa only.
In addition to ‘second stage’ visas, some other visas granted may not count toward the Migration Program
outcome in the following circumstances:
if a person has been previously granted a visa which counted toward the Migration Program, that person
will not be counted again.
when a visa is granted and subsequently cancelled in the same program year.
when a Partner visa applicant does not progress to the second stage (permanent) visa, a place is
returned to the program.
if a Business Innovation and Investment visa (granted in an earlier year) is cancelled under certain
powers, a place is returned to the program in the year of cancellation.
Page 9 of 582020 – 21 Migration Program Report
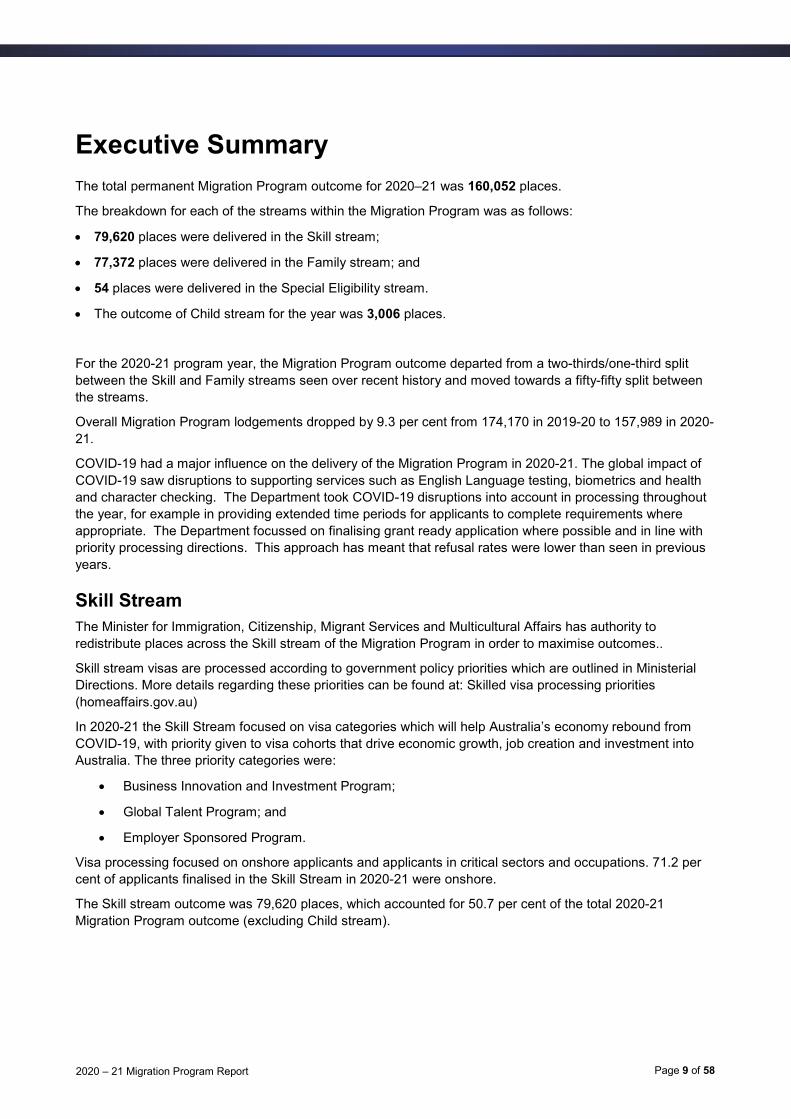
Executive Summary
The total permanent Migration Program outcome for 2020–21 was 160,052 places.
The breakdown for each of the streams within the Migration Program was as follows:
79,620 places were delivered in the Skill stream;
77,372 places were delivered in the Family stream; and
54 places were delivered in the Special Eligibility stream.
The outcome of Child stream for the year was 3,006 places.
For the 2020-21 program year, the Migration Program outcome departed from a two-thirds/one-third split
between the Skill and Family streams seen over recent history and moved towards a fifty-fifty split between
the streams.
Overall Migration Program lodgements dropped by 9.3 per cent from 174,170 in 2019-20 to 157,989 in 2020-
21.
COVID-19 had a major influence on the delivery of the Migration Program in 2020-21. The global impact of
COVID-19 saw disruptions to supporting services such as English Language testing, biometrics and health
and character checking. The Department took COVID-19 disruptions into account in processing throughout
the year, for example in providing extended time periods for applicants to complete requirements where
appropriate. The Department focussed on finalising grant ready application where possible and in line with
priority processing directions. This approach has meant that refusal rates were lower than seen in previous
years.
Skill Stream
The Minister for Immigration, Citizenship, Migrant Services and Multicultural Affairs has authority to
redistribute places across the Skill stream of the Migration Program in order to maximise outcomes..
Skill stream visas are processed according to government policy priorities which are outlined in Ministerial
Directions. More details regarding these priorities can be found at: Skilled visa processing priorities
(homeaffairs.gov.au)
In 2020-21 the Skill Stream focused on visa categories which will help Australia’s economy rebound from
COVID-19, with priority given to visa cohorts that drive economic growth, job creation and investment into
Australia. The three priority categories were:
Business Innovation and Investment Program;
Global Talent Program; and
Employer Sponsored Program.
Visa processing focused on onshore applicants and applicants in critical sectors and occupations. 71.2 per
cent of applicants finalised in the Skill Stream in 2020-21 were onshore.
The Skill stream outcome was 79,620 places, which accounted for 50.7 per cent of the total 2020-21
Migration Program outcome (excluding Child stream).

Page 10 of 582020 – 21 Migration Program Report
Within the Skill stream:
The Employer Sponsored category had an outcome of 23,503 places. Employer Sponsored visas
comprised 29.5 per cent of the Skill stream outcome in 2020–21;
The Skilled Independent category had an outcome of 7,213 places (9 per cent);
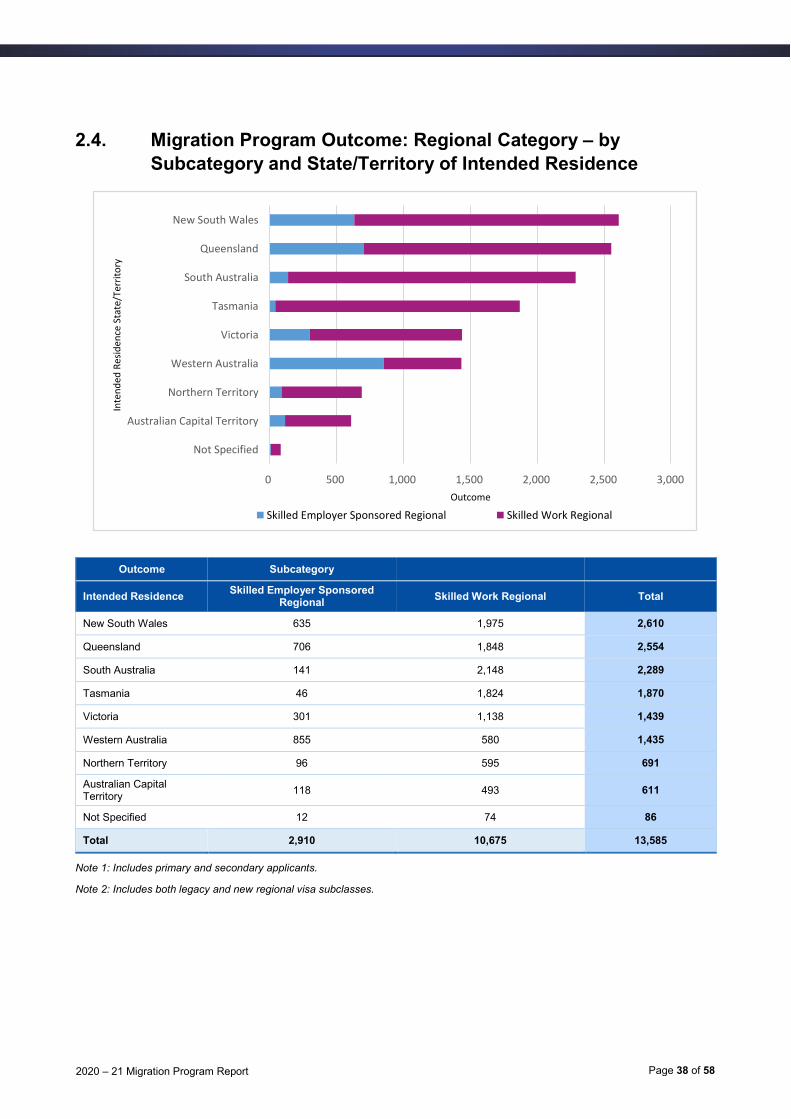
The Regional category had an outcome of 13,585 places (17 per cent of Skill outcome). Of this, 10,675
places were delivered in Skilled Work Regional and 2,910 places in Skilled Employer Sponsored
Regional;
The State/Territory Nominated category had an outcome of 14,268 places (17.9 per cent);
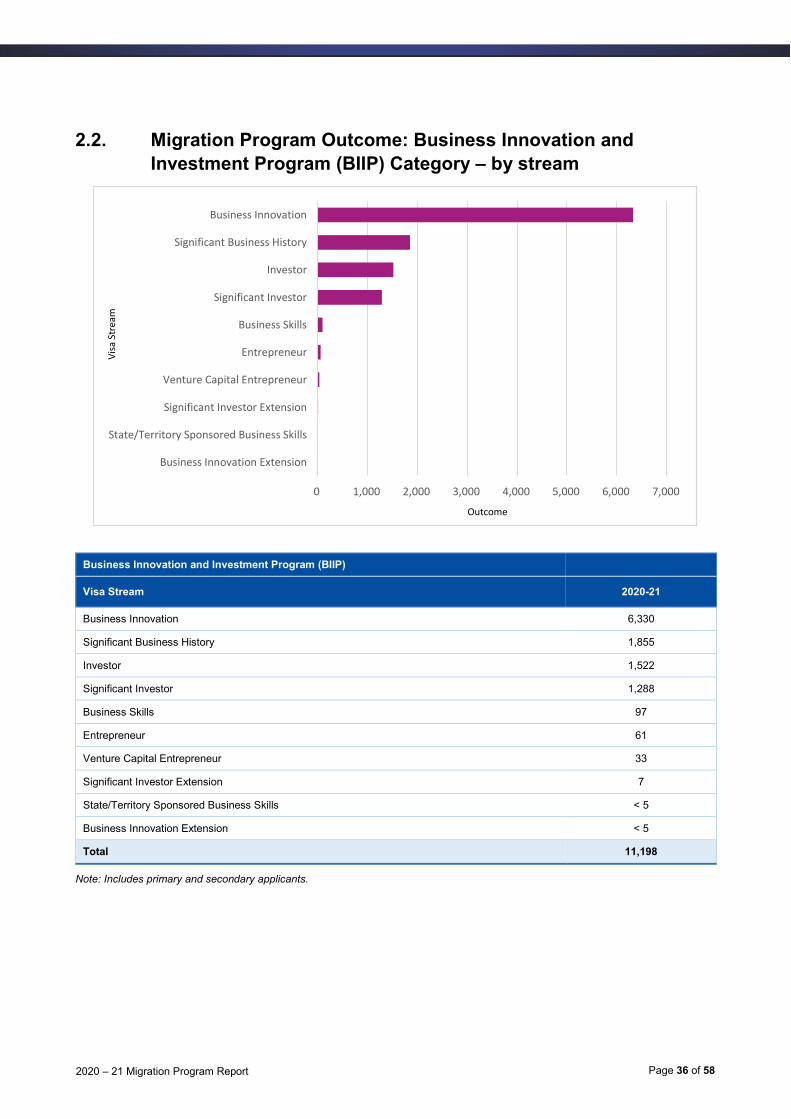
The Business Innovation and Investment Program (BIIP) had an outcome of 11,198 places (14 per cent);
The Global Talent category had an outcome of 9,584 places (12 per cent); and
The Distinguished Talent category had an outcome of 269 places (0.3 per cent).
The number of places delivered to Registered Nurses (3,670) was higher than any other occupation across
the Skill stream with the highest number of places delivered in the State/territory nominated (1,537) and
Regional (1,353) categories for this occupation.
Skill stream lodgements decreased by 9 per cent in the 2020-21 program year compared with 2019-20.
There were 94,872 first stage applications received in the Skill stream in 2020-21 compared to 104,354 first
stage applications in 2019-20. This decline was mainly attributed to the State/Territory nominated and Skilled
Independent categories. Lodgements increased in Global Talent category (49.3 per cent) and Distinguished
Talent category (42.3 per cent) in 2020-21, compared to lodgements in 2019-20.
As at 30 June 2021, there were 97,385 first stage Skill applicants in the pipeline, an increase of 12.3 per cent
compared to the pipeline as at 30 June 2020.
In the Skilled Independent category, there were 8,529 applications lodged in 2020-21 compared to 11,821
applications in 2019-20. In the Skilled Independent category, applicants located outside Australia accounted
for 10.9 per cent of the 2020-21 outcome.
State and Territory Governments were able to nominate skilled migration applicants through three categories
in 2020-21 – the State/Territory Nominated Category; the Business Innovation and Investment Category; and
the Regional Category, through the Skilled Work Regional visa. Across these categories, Migration Program
outcomes that involved a State or Territory Government nomination totalled 34,927 places, or 43.9 per cent
of the Skill Stream of the Migration Program, broken down as follows:
State/Territory Nominated – 14,268 places
BIIP – 11,198 places
Skilled Work Regional – 9,461 places1
There were 11,198 places delivered in the Business Innovation and Investment program (BIIP). Lodgements
increased by 0.2 per cent in 2020-21, with 15,818 first stage applications made compared to 15,784 first
stage applications made in 2019-20. The BIIP pipeline increased over the 2020-21 program year by
0.5 per cent, to 31,813 applicants as at 30 June 2021 compared to 31,661 applicants at 30 June 2020.
The Global Talent Visa Program made up 12 per cent of the Skill stream. The Global Talent application
process firstly requires the candidate to submit an Expression of Interest (EOI). EOI candidates who meet
relevant criteria, including demonstrating an international record of exceptional and outstanding
achievements within a target sector, are invited to lodge a Subclass 858 Global Talent visa (renamed from
Distinguished Talent on 27 February 2021).
1 Excludes the number of places delivered to family sponsored applicants in the Skilled Work Regional (Provisional) visa (subclass 491)
Page 11 of 582020 – 21 Migration Program Report
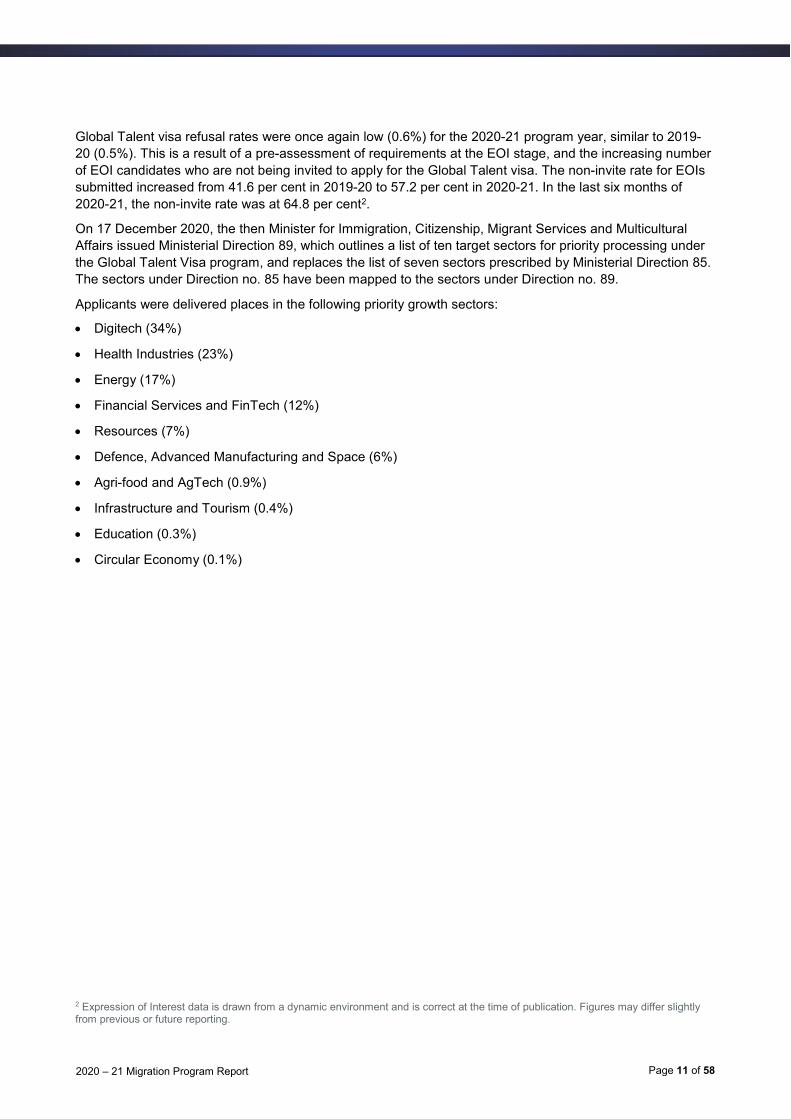
Global Talent visa refusal rates were once again low (0.6%) for the 2020-21 program year, similar to 2019-
20 (0.5%). This is a result of a pre-assessment of requirements at the EOI stage, and the increasing number
of EOI candidates who are not being invited to apply for the Global Talent visa. The non-invite rate for EOIs
submitted increased from 41.6 per cent in 2019-20 to 57.2 per cent in 2020-21. In the last six months of
2020-21, the non-invite rate was at 64.8 per cent2.
On 17 December 2020, the then Minister for Immigration, Citizenship, Migrant Services and Multicultural
Affairs issued Ministerial Direction 89, which outlines a list of ten target sectors for priority processing under
the Global Talent Visa program, and replaces the list of seven sectors prescribed by Ministerial Direction 85.
The sectors under Direction no. 85 have been mapped to the sectors under Direction no. 89.
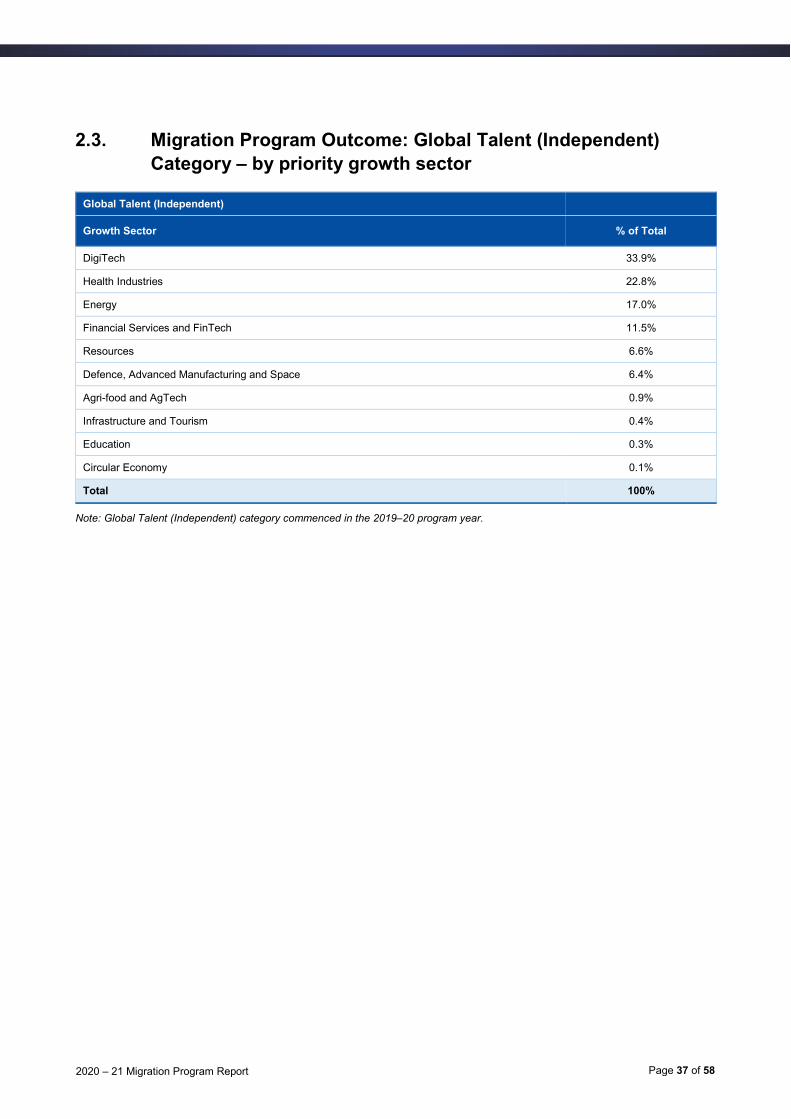
Applicants were delivered places in the following priority growth sectors:
Digitech (34%)
Health Industries (23%)
Energy (17%)
Financial Services and FinTech (12%)
Resources (7%)
Defence, Advanced Manufacturing and Space (6%)
Agri-food and AgTech (0.9%)
Infrastructure and Tourism (0.4%)
Education (0.3%)
Circular Economy (0.1%)
2 Expression of Interest data is drawn from a dynamic environment and is correct at the time of publication. Figures may differ slightly from previous or future reporting.
Page 12 of 582020 – 21 Migration Program Report
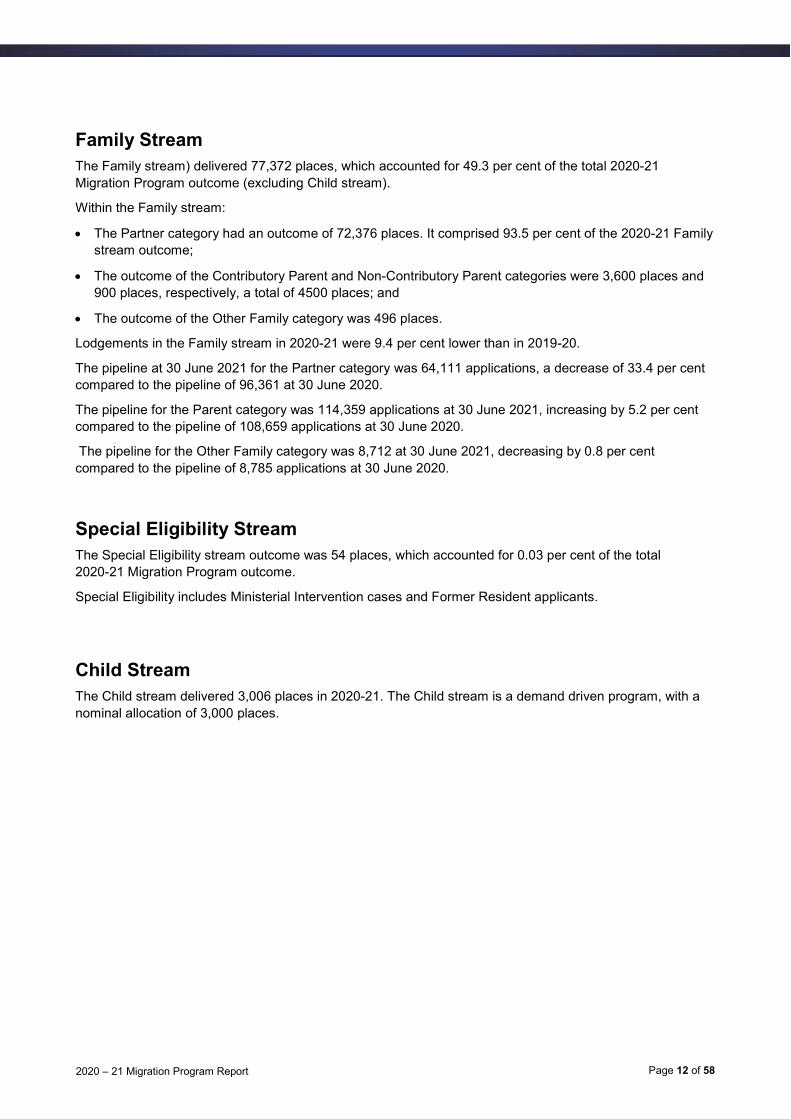
Family Stream
The Family stream) delivered 77,372 places, which accounted for 49.3 per cent of the total 2020-21
Migration Program outcome (excluding Child stream).
Within the Family stream:
The Partner category had an outcome of 72,376 places. It comprised 93.5 per cent of the 2020-21 Family
stream outcome;
The outcome of the Contributory Parent and Non-Contributory Parent categories were 3,600 places and
900 places, respectively, a total of 4500 places; and
The outcome of the Other Family category was 496 places.
Lodgements in the Family stream in 2020-21 were 9.4 per cent lower than in 2019-20.
The pipeline at 30 June 2021 for the Partner category was 64,111 applications, a decrease of 33.4 per cent
compared to the pipeline of 96,361 at 30 June 2020.
The pipeline for the Parent category was 114,359 applications at 30 June 2021, increasing by 5.2 per cent
compared to the pipeline of 108,659 applications at 30 June 2020.
The pipeline for the Other Family category was 8,712 at 30 June 2021, decreasing by 0.8 per cent
compared to the pipeline of 8,785 applications at 30 June 2020.
Special Eligibility Stream
The Special Eligibility stream outcome was 54 places, which accounted for 0.03 per cent of the total
2020-21 Migration Program outcome.
Special Eligibility includes Ministerial Intervention cases and Former Resident applicants.
Child Stream
The Child stream delivered 3,006 places in 2020-21. The Child stream is a demand driven program, with a
nominal allocation of 3,000 places.

Page 13 of 582020 – 21 Migration Program Report
Migration Program Outcome - Further Information
Source countries
The largest source citizenship countries of migrants in 2020-21 were:
China with 22,207 places
India with 21,791 places
United Kingdom with 12,703 places
Philippines with 11,058 places
Vietnam with 8,120 places
United States of America with 5,048 places
Nepal with 4,714 places
Hong Kong with 4,313 places
Pakistan with 4,121 places
Thailand with 4,002 places
State/Territory of Intended Residence3
Where applicants have specified where they intended to reside1, they have indicated (these are ordered from
highest to lowest):
New South Wales (NSW) – 51,279 places
Victoria (VIC) – 40,114 places
Queensland (QLD) – 23,640 places
Western Australia (WA) – 16,533 places
South Australia (SA) – 9,829 places
Australian Capital Territory (ACT) – 4,202 places
Tasmania (TAS) – 4,179 places
Northern Territory (NT) – 2,261 places
Not Specified – 8,015 places 4
3 Intended residence data has been updated since the original publication of the 2020-21 Migration Program report. 4 Not all visa classes require an applicant to declare at time of application where they intend to reside.
Page 14 of 582020 – 21 Migration Program Report
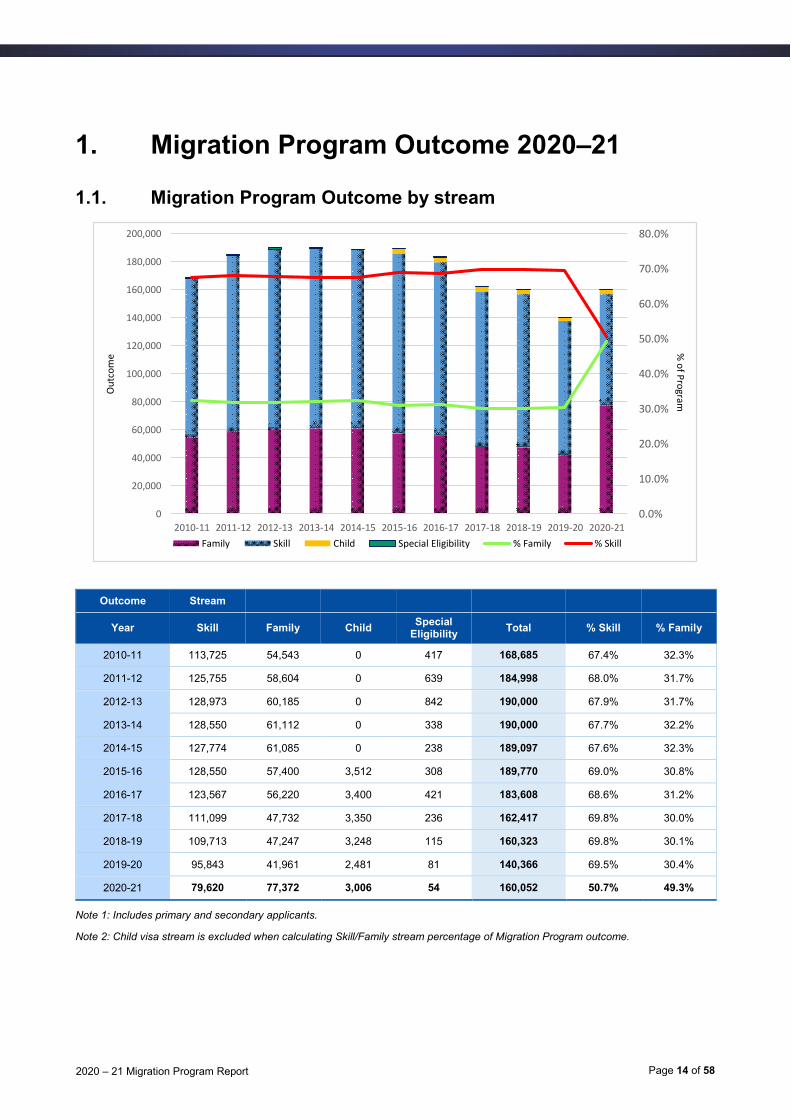
1. Migration Program Outcome 2020–21
1.1. Migration Program Outcome by stream
Outcome Stream
Year Skill Family Child Special
Eligibility Total % Skill % Family
2010-11 113,725 54,543 0 417 168,685 67.4% 32.3%
2011-12 125,755 58,604 0 639 184,998 68.0% 31.7%
2012-13 128,973 60,185 0 842 190,000 67.9% 31.7%
2013-14 128,550 61,112 0 338 190,000 67.7% 32.2%
2014-15 127,774 61,085 0 238 189,097 67.6% 32.3%
2015-16 128,550 57,400 3,512 308 189,770 69.0% 30.8%
2016-17 123,567 56,220 3,400 421 183,608 68.6% 31.2%
2017-18 111,099 47,732 3,350 236 162,417 69.8% 30.0%
2018-19 109,713 47,247 3,248 115 160,323 69.8% 30.1%
2019-20 95,843 41,961 2,481 81 140,366 69.5% 30.4%
2020-21 79,620 77,372 3,006 54 160,052 50.7% 49.3%
Note 1: Includes primary and secondary applicants.
Note 2: Child visa stream is excluded when calculating Skill/Family stream percentage of Migration Program outcome.
0.0%
10.0%
20.0%
30.0%
40.0%
50.0%
60.0%
70.0%
80.0%
0
20,000
40,000
60,000
80,000
100,000
120,000
140,000
160,000
180,000
200,000
2010-11 2011-12 2012-13 2013-14 2014-15 2015-16 2016-17 2017-18 2018-19 2019-20 2020-21
% o
f Pro
gramO
utc
om
e
Family Skill Child Special Eligibility % Family % Skill

Page 15 of 582020 – 21 Migration Program Report
1.2. Migration Program Outcome by stream and
intended residence state/territory
Outcome Stream
Intended Residence Skill Family Child Special
Eligibility 2020-21
Total 2019-20
Total %
Variation
New South Wales 25,216 25,254 809 0 51,279 44,182 16.1%
Victoria 19,469 20,064 581 0 40,114 34,189 17.3%
Queensland 11,613 11,575 452 0 23,640 18,743 26.1%
Western Australia 8,361 7,844 328 0 16,533 11,377 45.3%
South Australia 6,320 3,402 107 0 9,829 11,996 -18.1%
Australian Capital Territory
2,906 1,248 48 0 4,202 4,370 -3.8%
Tasmania 3,592 574 13 0 4,179 6,152 -32.1%
Northern Territory 1,523 702 36 0 2,261 2,558 -11.6%
Not Specified 620 6,709 632 54 8,015 6,799 17.9%
Total 79,620 77,372 3,006 54 160,052 140,366 14.0%
Note 1: Includes primary and secondary applicants.
Note 2: Intended residence state as recorded by applicant, otherwise grouped in ‘Not Specified’ (noting that not all visa classes require
an applicant to declare at time of application where they intend to reside).
Note 3: Intended residence data has been updated since the original publication of the 2020-21 Migration Program report
0 10,000 20,000 30,000 40,000 50,000 60,000
Not Specified
Northern Territory
Tasmania
Australian Capital Territory
South Australia
Western Australia
Queensland
Victoria
New South Wales
Outcome
Inte
nd
ed R
esid
ence
Sta
te/T
erri
tory
Family Skill Child Special Eligibility
Page 16 of 582020 – 21 Migration Program Report
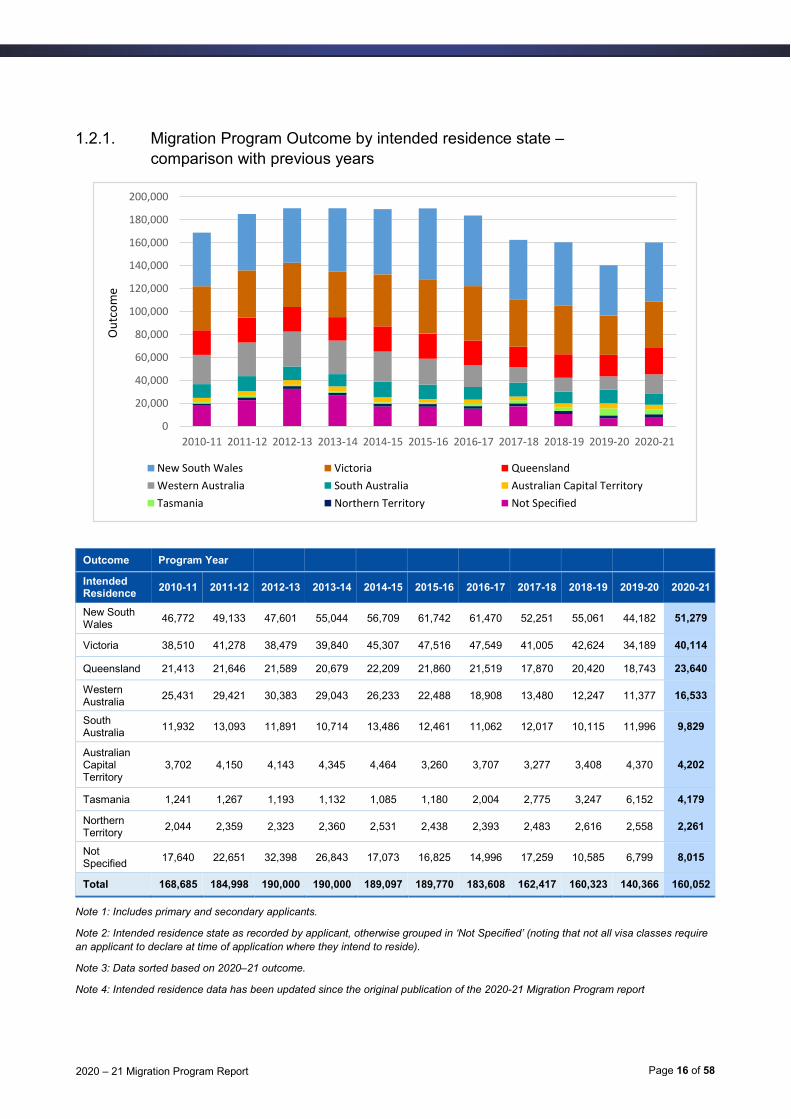
1.2.1. Migration Program Outcome by intended residence state –
comparison with previous years
Outcome Program Year
Intended Residence
2010-11 2011-12 2012-13 2013-14 2014-15 2015-16 2016-17 2017-18 2018-19 2019-20 2020-21
New South Wales
46,772 49,133 47,601 55,044 56,709 61,742 61,470 52,251 55,061 44,182 51,279
Victoria 38,510 41,278 38,479 39,840 45,307 47,516 47,549 41,005 42,624 34,189 40,114
Queensland 21,413 21,646 21,589 20,679 22,209 21,860 21,519 17,870 20,420 18,743 23,640
Western Australia
25,431 29,421 30,383 29,043 26,233 22,488 18,908 13,480 12,247 11,377 16,533
South Australia
11,932 13,093 11,891 10,714 13,486 12,461 11,062 12,017 10,115 11,996 9,829
Australian Capital Territory
3,702 4,150 4,143 4,345 4,464 3,260 3,707 3,277 3,408 4,370 4,202
Tasmania 1,241 1,267 1,193 1,132 1,085 1,180 2,004 2,775 3,247 6,152 4,179
Northern Territory
2,044 2,359 2,323 2,360 2,531 2,438 2,393 2,483 2,616 2,558 2,261
Not Specified
17,640 22,651 32,398 26,843 17,073 16,825 14,996 17,259 10,585 6,799 8,015
Total 168,685 184,998 190,000 190,000 189,097 189,770 183,608 162,417 160,323 140,366 160,052
Note 1: Includes primary and secondary applicants.
Note 2: Intended residence state as recorded by applicant, otherwise grouped in ‘Not Specified’ (noting that not all visa classes require
an applicant to declare at time of application where they intend to reside).
Note 3: Data sorted based on 2020–21 outcome.
Note 4: Intended residence data has been updated since the original publication of the 2020-21 Migration Program report
0
20,000
40,000
60,000
80,000
100,000
120,000
140,000
160,000
180,000
200,000
2010-11 2011-12 2012-13 2013-14 2014-15 2015-16 2016-17 2017-18 2018-19 2019-20 2020-21
Ou
tco
me
New South Wales Victoria Queensland
Western Australia South Australia Australian Capital Territory
Tasmania Northern Territory Not Specified

Page 17 of 582020 – 21 Migration Program Report
1.2.2. Migration Program Outcome: Australian Capital Territory by stream and visa
category
Intended Residence Stream Visa Category 2020-21 Total
Australian Capital Territory Skill Employer Sponsored 289
Skilled Independent 81
Regional 611
State/Territory Nominated 1,664
Business Innovation & Investment 36
Global Talent (Independent) 217
Distinguished Talent 8
Skill Total 2,906
Family Partner 1,156
Parent 84
Other Family 8
Family Total 1,248
Child Total 48
Australian Capital Territory Total
4,202
Note 1: Includes primary and secondary applicants.
Note 2: Intended residence data has been updated since the original publication of the 2020-21 Migration Program report
Australian Capital Territory by stream – comparison with previous years
Program Year
Stream 2010-11 2011-12 2012-13 2013-14 2014-15 2015-16 2016-17 2017-18 2018-19 2019-20 2020-21
Skill 2,790 3,146 3,093 3,386 3,450 2,317 2,755 2,501 2,619 3,664 2,906
Family 903 999 1,049 959 1,014 904 898 733 741 638 1,248
Child 0 0 0 0 0 39 54 43 48 68 48
Special Eligibility
9 5 < 5 0 0 0 0 0 0 0 0
ACT Total 3,702 4,150 4,143 4,345 4,464 3,260 3,707 3,277 3,408 4,370 4,202
% of Migration Program Total
2.2% 2.2% 2.2% 2.3% 2.4% 1.7% 2.0% 2.0% 2.1% 3.1% 2.6%
0.0%
0.5%
1.0%
1.5%
2.0%
2.5%
3.0%
3.5%
0
500
1,000
1,500
2,000
2,500
3,000
3,500
4,000
4,500
5,000
2010-11 2011-12 2012-13 2013-14 2014-15 2015-16 2016-17 2017-18 2018-19 2019-20 2020-21
% o
f Pro
gramOu
tco
me
Family Skill Child Special Eligibility % of Migration Program Total
Page 18 of 582020 – 21 Migration Program Report
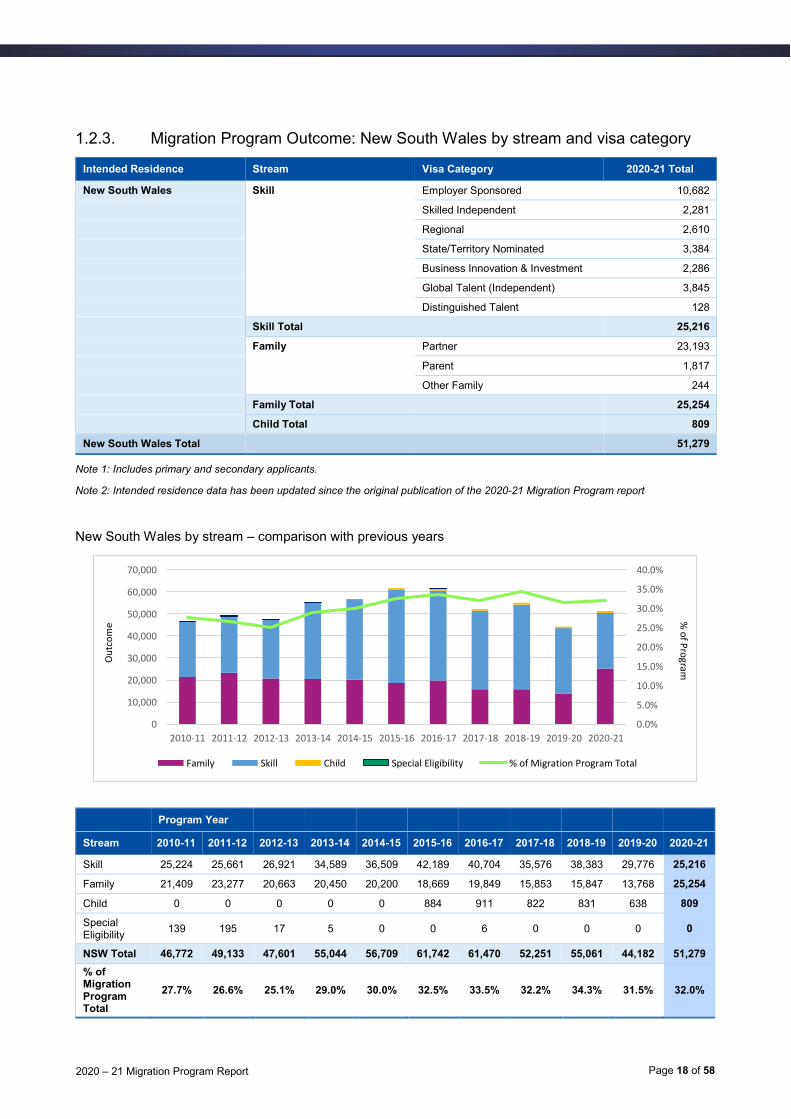
1.2.3. Migration Program Outcome: New South Wales by stream and visa category
Intended Residence Stream Visa Category 2020-21 Total
New South Wales Skill Employer Sponsored 10,682
Skilled Independent 2,281
Regional 2,610
State/Territory Nominated 3,384
Business Innovation & Investment 2,286
Global Talent (Independent) 3,845
Distinguished Talent 128
Skill Total 25,216
Family Partner 23,193
Parent 1,817
Other Family 244
Family Total 25,254
Child Total 809
New South Wales Total 51,279
Note 1: Includes primary and secondary applicants.
Note 2: Intended residence data has been updated since the original publication of the 2020-21 Migration Program report
New South Wales by stream – comparison with previous years
Program Year
Stream 2010-11 2011-12 2012-13 2013-14 2014-15 2015-16 2016-17 2017-18 2018-19 2019-20 2020-21
Skill 25,224 25,661 26,921 34,589 36,509 42,189 40,704 35,576 38,383 29,776 25,216
Family 21,409 23,277 20,663 20,450 20,200 18,669 19,849 15,853 15,847 13,768 25,254
Child 0 0 0 0 0 884 911 822 831 638 809
Special Eligibility
139 195 17 5 0 0 6 0 0 0 0
NSW Total 46,772 49,133 47,601 55,044 56,709 61,742 61,470 52,251 55,061 44,182 51,279
% of Migration Program Total
27.7% 26.6% 25.1% 29.0% 30.0% 32.5% 33.5% 32.2% 34.3% 31.5% 32.0%
0.0%
5.0%
10.0%
15.0%
20.0%
25.0%
30.0%
35.0%
40.0%
0
10,000
20,000
30,000
40,000
50,000
60,000
70,000
2010-11 2011-12 2012-13 2013-14 2014-15 2015-16 2016-17 2017-18 2018-19 2019-20 2020-21
% o
f Pro
gramO
utc
om
e
Family Skill Child Special Eligibility % of Migration Program Total

Page 19 of 582020 – 21 Migration Program Report
1.2.4. Migration Program Outcome: Northern Territory by stream and visa category
Intended Residence Stream Visa Category 2020-21 Total
Northern Territory Skill Employer Sponsored 148
Skilled Independent 32
Regional 691
State/Territory Nominated 608
Business Innovation & Investment 12
Global Talent (Independent) 31
Distinguished Talent < 5
Skill Total 1,523
Family Partner 690
Parent 10
Other Family < 5
Family Total 702
Child Total 36
Northern Territory Total 2,261
Note 1: Includes primary and secondary applicants.
Note 2: Intended residence data has been updated since the original publication of the 2020-21 Migration Program report
Northern Territory by stream – comparison with previous years
Program Year
Stream 2010-11 2011-12 2012-13 2013-14 2014-15 2015-16 2016-17 2017-18 2018-19 2019-20 2020-21
Skill 1,570 1,842 1,786 1,796 2,007 1,858 1,769 1,868 2,203 2,162 1,523
Family 474 517 537 564 524 539 583 556 360 365 702
Child 0 0 0 0 0 41 41 59 53 31 36
Special Eligibility
0 0 0 0 0 0 0 0 0 0 0
NT Total 2,044 2,359 2,323 2,360 2,531 2,438 2,393 2,483 2,616 2,558 2,261
% of Migration Program Total
1.2% 1.3% 1.2% 1.2% 1.3% 1.3% 1.3% 1.5% 1.6% 1.8% 1.4%
0.0%
0.2%
0.4%
0.6%
0.8%
1.0%
1.2%
1.4%
1.6%
1.8%
2.0%
0
500
1,000
1,500
2,000
2,500
3,000
2010-11 2011-12 2012-13 2013-14 2014-15 2015-16 2016-17 2017-18 2018-19 2019-20 2020-21
% o
f Pro
gramOu
tco
me
Family Skill Child Special Eligibility % of Migration Program Total

Page 20 of 582020 – 21 Migration Program Report
1.2.5. Migration Program Outcome: Queensland by stream and visa category
Intended Residence Stream Visa Category 2020-21 Total
Queensland Skill Employer Sponsored 3,205
Skilled Independent 1,155
Regional 2,554
State/Territory Nominated 1,485
Business Innovation & Investment 1,709
Global Talent (Independent) 1,465
Distinguished Talent 40
Skill Total 11,613
Family Partner 11,070
Parent 464
Other Family 41
Family Total 11,575
Child Total 452
Queensland Total 23,640
Note 1: Includes primary and secondary applicants.
Note 2: Intended residence data has been updated since the original publication of the 2020-21 Migration Program report
Queensland by stream – comparison with previous years
Program Year
Stream 2010-11 2011-12 2012-13 2013-14 2014-15 2015-16 2016-17 2017-18 2018-19 2019-20 2020-21
Skill 13,875 13,984 13,447 13,421 14,713 14,354 14,175 11,100 13,588 12,763 11,613
Family 7,516 7,651 8,138 7,258 7,496 7,134 6,936 6,359 6,374 5,671 11,575
Child 0 0 0 0 0 372 408 411 458 309 452
Special Eligibility
22 11 < 5 0 0 0 0 0 0 0 0
QLD Total 21,413 21,646 21,589 20,679 22,209 21,860 21,519 17,870 20,420 18,743 23,640
% of Migration Program Total
12.7% 11.7% 11.4% 10.9% 11.7% 11.5% 11.7% 11.0% 12.7% 13.4% 14.8%
0.0%
2.0%
4.0%
6.0%
8.0%
10.0%
12.0%
14.0%
16.0%
0
5,000
10,000
15,000
20,000
25,000
2010-11 2011-12 2012-13 2013-14 2014-15 2015-16 2016-17 2017-18 2018-19 2019-20 2020-21
% o
f Pro
gramOu
tco
me
Family Skill Child Special Eligibility % of Migration Program Total
Page 21 of 582020 – 21 Migration Program Report
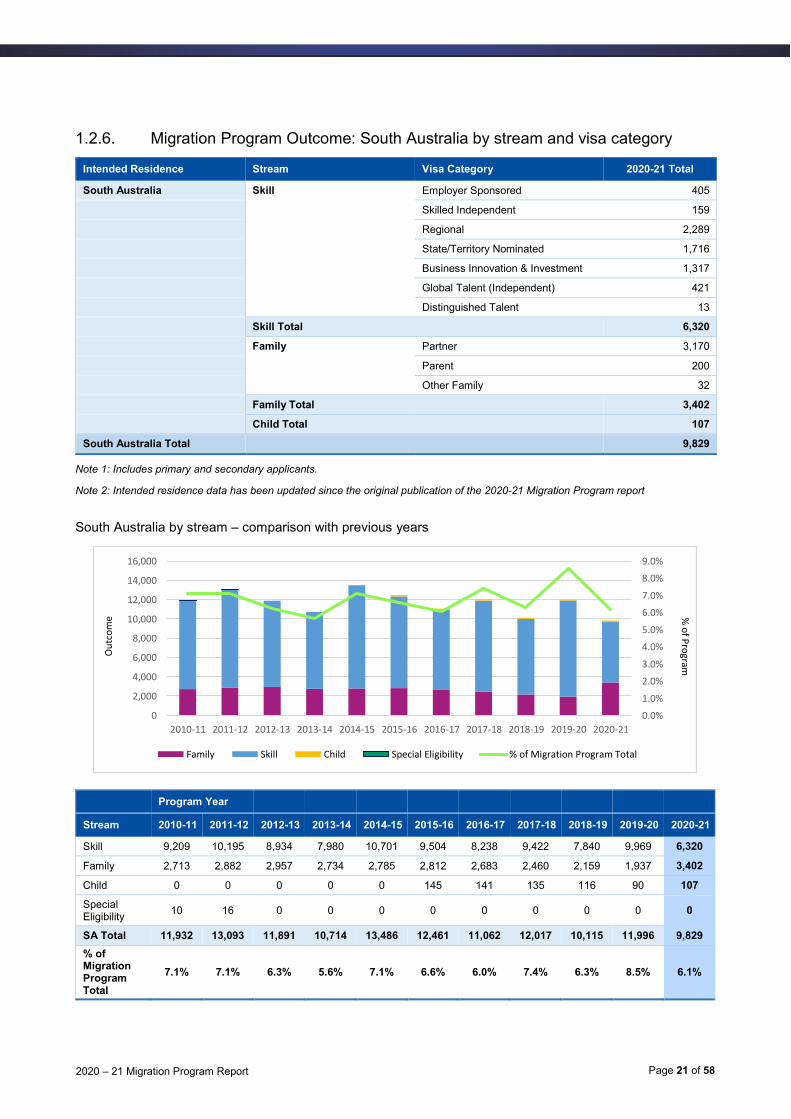
1.2.6. Migration Program Outcome: South Australia by stream and visa category
Intended Residence Stream Visa Category 2020-21 Total
South Australia Skill Employer Sponsored 405
Skilled Independent 159
Regional 2,289
State/Territory Nominated 1,716
Business Innovation & Investment 1,317
Global Talent (Independent) 421
Distinguished Talent 13
Skill Total 6,320
Family Partner 3,170
Parent 200
Other Family 32
Family Total 3,402
Child Total 107
South Australia Total 9,829
Note 1: Includes primary and secondary applicants.
Note 2: Intended residence data has been updated since the original publication of the 2020-21 Migration Program report
South Australia by stream – comparison with previous years
Program Year
Stream 2010-11 2011-12 2012-13 2013-14 2014-15 2015-16 2016-17 2017-18 2018-19 2019-20 2020-21
Skill 9,209 10,195 8,934 7,980 10,701 9,504 8,238 9,422 7,840 9,969 6,320
Family 2,713 2,882 2,957 2,734 2,785 2,812 2,683 2,460 2,159 1,937 3,402
Child 0 0 0 0 0 145 141 135 116 90 107
Special Eligibility
10 16 0 0 0 0 0 0 0 0 0
SA Total 11,932 13,093 11,891 10,714 13,486 12,461 11,062 12,017 10,115 11,996 9,829
% of Migration Program Total
7.1% 7.1% 6.3% 5.6% 7.1% 6.6% 6.0% 7.4% 6.3% 8.5% 6.1%
0.0%
1.0%
2.0%
3.0%
4.0%
5.0%
6.0%
7.0%
8.0%
9.0%
0
2,000
4,000
6,000
8,000
10,000
12,000
14,000
16,000
2010-11 2011-12 2012-13 2013-14 2014-15 2015-16 2016-17 2017-18 2018-19 2019-20 2020-21
% o
f Pro
gram
Ou
tco
me
Family Skill Child Special Eligibility % of Migration Program Total
Page 22 of 582020 – 21 Migration Program Report
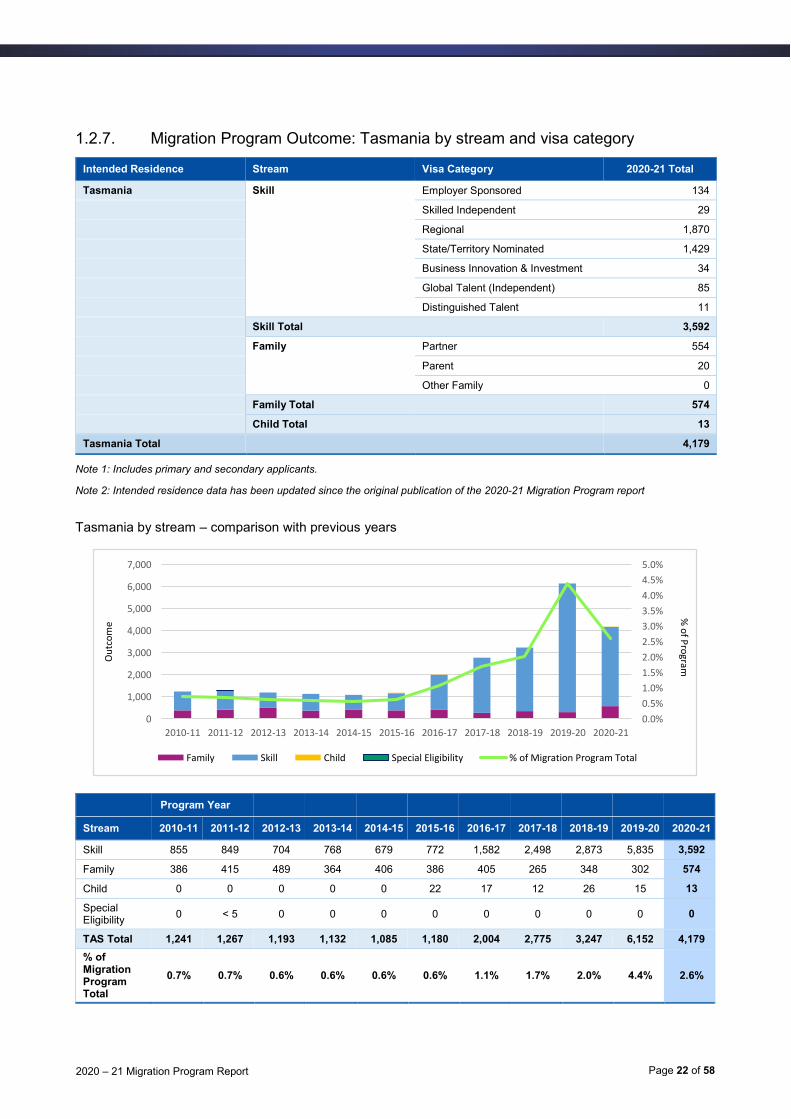
1.2.7. Migration Program Outcome: Tasmania by stream and visa category
Intended Residence Stream Visa Category 2020-21 Total
Tasmania Skill Employer Sponsored 134
Skilled Independent 29
Regional 1,870
State/Territory Nominated 1,429
Business Innovation & Investment 34
Global Talent (Independent) 85
Distinguished Talent 11
Skill Total 3,592
Family Partner 554
Parent 20
Other Family 0
Family Total 574
Child Total 13
Tasmania Total 4,179
Note 1: Includes primary and secondary applicants.
Note 2: Intended residence data has been updated since the original publication of the 2020-21 Migration Program report
Tasmania by stream – comparison with previous years
Program Year
Stream 2010-11 2011-12 2012-13 2013-14 2014-15 2015-16 2016-17 2017-18 2018-19 2019-20 2020-21
Skill 855 849 704 768 679 772 1,582 2,498 2,873 5,835 3,592
Family 386 415 489 364 406 386 405 265 348 302 574
Child 0 0 0 0 0 22 17 12 26 15 13
Special Eligibility
0 < 5 0 0 0 0 0 0 0 0 0
TAS Total 1,241 1,267 1,193 1,132 1,085 1,180 2,004 2,775 3,247 6,152 4,179
% of Migration Program Total
0.7% 0.7% 0.6% 0.6% 0.6% 0.6% 1.1% 1.7% 2.0% 4.4% 2.6%
0.0%
0.5%
1.0%
1.5%
2.0%
2.5%
3.0%
3.5%
4.0%
4.5%
5.0%
0
1,000
2,000
3,000
4,000
5,000
6,000
7,000
2010-11 2011-12 2012-13 2013-14 2014-15 2015-16 2016-17 2017-18 2018-19 2019-20 2020-21
% o
f Pro
gramO
utc
om
e
Family Skill Child Special Eligibility % of Migration Program Total

Page 23 of 582020 – 21 Migration Program Report
1.2.8. Migration Program Outcome: Victoria by stream and visa category
Intended Residence Stream Visa Category 2020-21 Total
Victoria Skill Employer Sponsored 5,893
Skilled Independent 2,269
Regional 1,439
State/Territory Nominated 2,384
Business Innovation & Investment 5,020
Global Talent (Independent) 2,418
Distinguished Talent 46
Skill Total 19,469
Family Partner 18,559
Parent 1,402
Other Family 103
Family Total 20,064
Child Total 581
Victoria Total 40,114
Note 1: Includes primary and secondary applicants.
Note 2: Intended residence data has been updated since the original publication of the 2020-21 Migration Program report
Victoria by stream – comparison with previous years
Program Year
Stream 2010-11 2011-12 2012-13 2013-14 2014-15 2015-16 2016-17 2017-18 2018-19 2019-20 2020-21
Skill 23,882 25,085 23,136 25,513 29,630 32,206 32,197 27,685 28,828 21,850 19,469
Family 14,577 16,091 15,337 14,325 15,677 14,689 14,741 12,703 13,235 11,841 20,064
Child 0 0 0 0 0 621 611 617 561 498 581
Special Eligibility
51 102 6 < 5 0 0 0 0 0 0 0
VIC Total 38,510 41,278 38,479 39,840 45,307 47,516 47,549 41,005 42,624 34,189 40,114
% of Migration Program Total
22.8% 22.3% 20.3% 21.0% 24.0% 25.0% 25.9% 25.2% 26.6% 24.4% 25.1%
0.0%
5.0%
10.0%
15.0%
20.0%
25.0%
30.0%
0
5,000
10,000
15,000
20,000
25,000
30,000
35,000
40,000
45,000
50,000
2010-11 2011-12 2012-13 2013-14 2014-15 2015-16 2016-17 2017-18 2018-19 2019-20 2020-21
% o
f Pro
gramO
utc
om
e
Family Skill Child Special Eligibility % of Migration Program Total
Page 24 of 582020 – 21 Migration Program Report
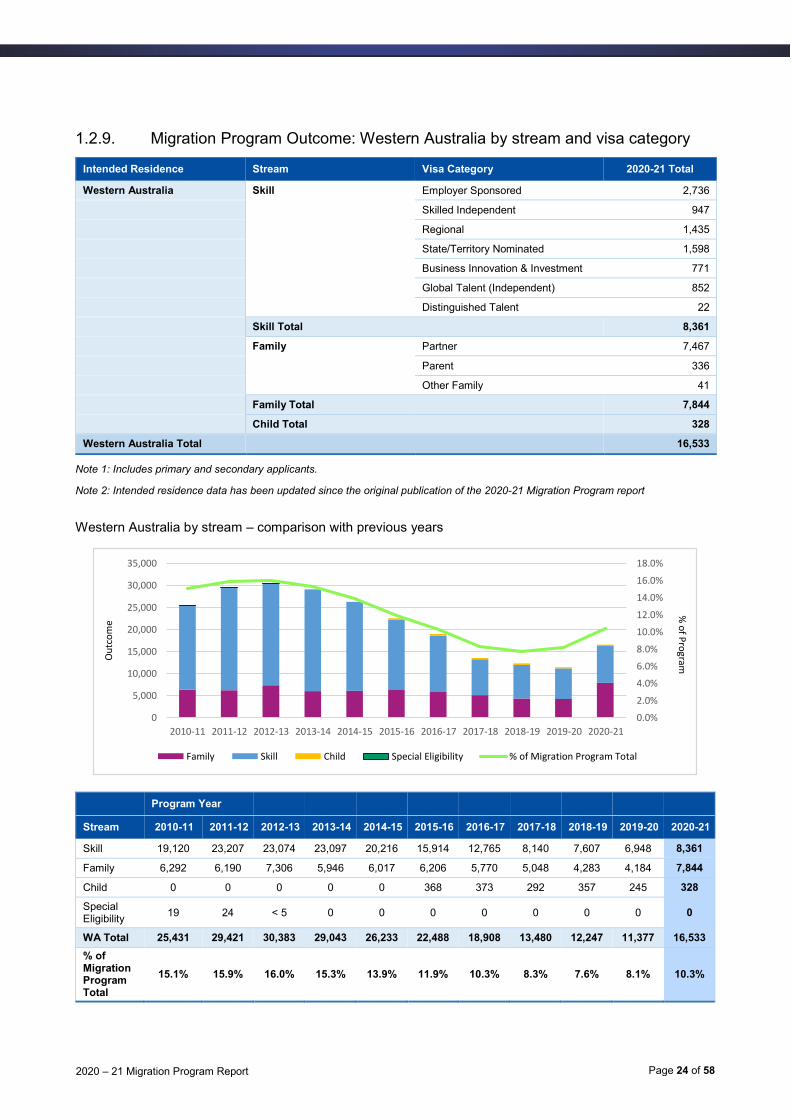
1.2.9. Migration Program Outcome: Western Australia by stream and visa category
Intended Residence Stream Visa Category 2020-21 Total
Western Australia Skill Employer Sponsored 2,736
Skilled Independent 947
Regional 1,435
State/Territory Nominated 1,598
Business Innovation & Investment 771
Global Talent (Independent) 852
Distinguished Talent 22
Skill Total 8,361
Family Partner 7,467
Parent 336
Other Family 41
Family Total 7,844
Child Total 328
Western Australia Total 16,533
Note 1: Includes primary and secondary applicants.
Note 2: Intended residence data has been updated since the original publication of the 2020-21 Migration Program report
Western Australia by stream – comparison with previous years
Program Year
Stream 2010-11 2011-12 2012-13 2013-14 2014-15 2015-16 2016-17 2017-18 2018-19 2019-20 2020-21
Skill 19,120 23,207 23,074 23,097 20,216 15,914 12,765 8,140 7,607 6,948 8,361
Family 6,292 6,190 7,306 5,946 6,017 6,206 5,770 5,048 4,283 4,184 7,844
Child 0 0 0 0 0 368 373 292 357 245 328
Special Eligibility
19 24 < 5 0 0 0 0 0 0 0 0
WA Total 25,431 29,421 30,383 29,043 26,233 22,488 18,908 13,480 12,247 11,377 16,533
% of Migration Program Total
15.1% 15.9% 16.0% 15.3% 13.9% 11.9% 10.3% 8.3% 7.6% 8.1% 10.3%
0.0%
2.0%
4.0%
6.0%
8.0%
10.0%
12.0%
14.0%
16.0%
18.0%
0
5,000
10,000
15,000
20,000
25,000
30,000
35,000
2010-11 2011-12 2012-13 2013-14 2014-15 2015-16 2016-17 2017-18 2018-19 2019-20 2020-21
% o
f Pro
gramOu
tco
me
Family Skill Child Special Eligibility % of Migration Program Total
Page 25 of 582020 – 21 Migration Program Report
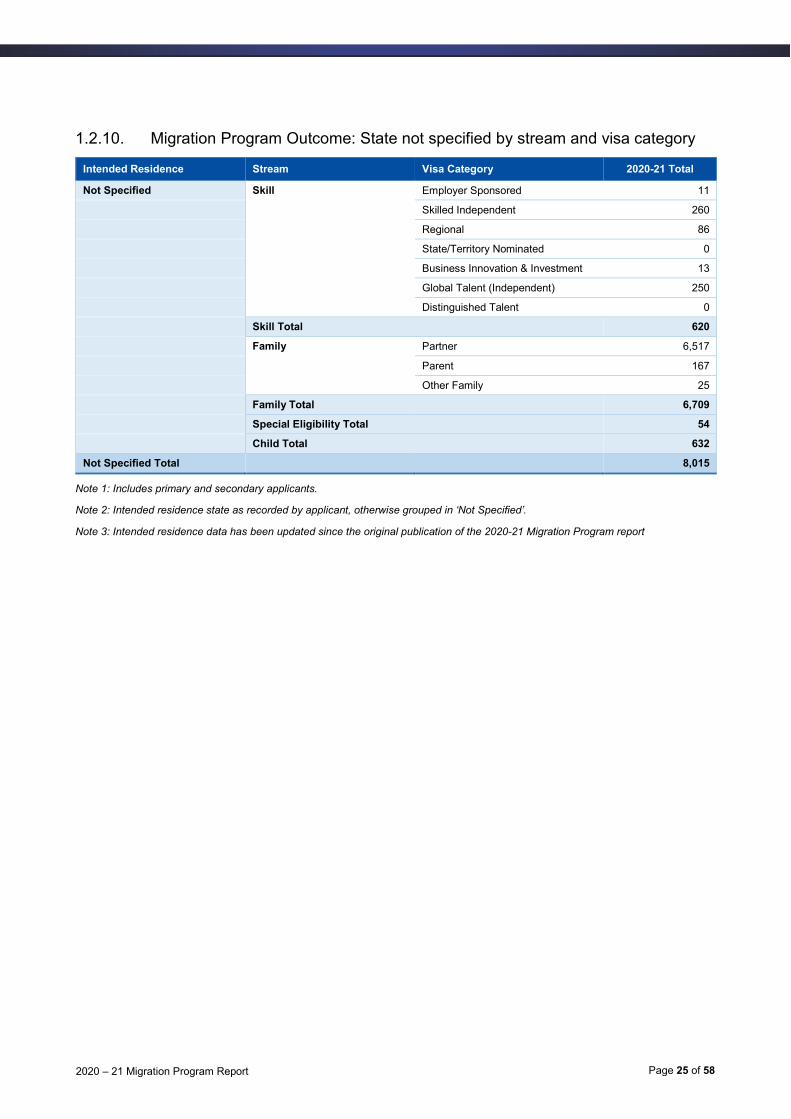
1.2.10. Migration Program Outcome: State not specified by stream and visa category
Intended Residence Stream Visa Category 2020-21 Total
Not Specified Skill Employer Sponsored 11
Skilled Independent 260
Regional 86
State/Territory Nominated 0
Business Innovation & Investment 13
Global Talent (Independent) 250
Distinguished Talent 0
Skill Total 620
Family Partner 6,517
Parent 167
Other Family 25
Family Total 6,709
Special Eligibility Total 54
Child Total 632
Not Specified Total 8,015
Note 1: Includes primary and secondary applicants.
Note 2: Intended residence state as recorded by applicant, otherwise grouped in ‘Not Specified’.
Note 3: Intended residence data has been updated since the original publication of the 2020-21 Migration Program report
Page 26 of 582020 – 21 Migration Program Report
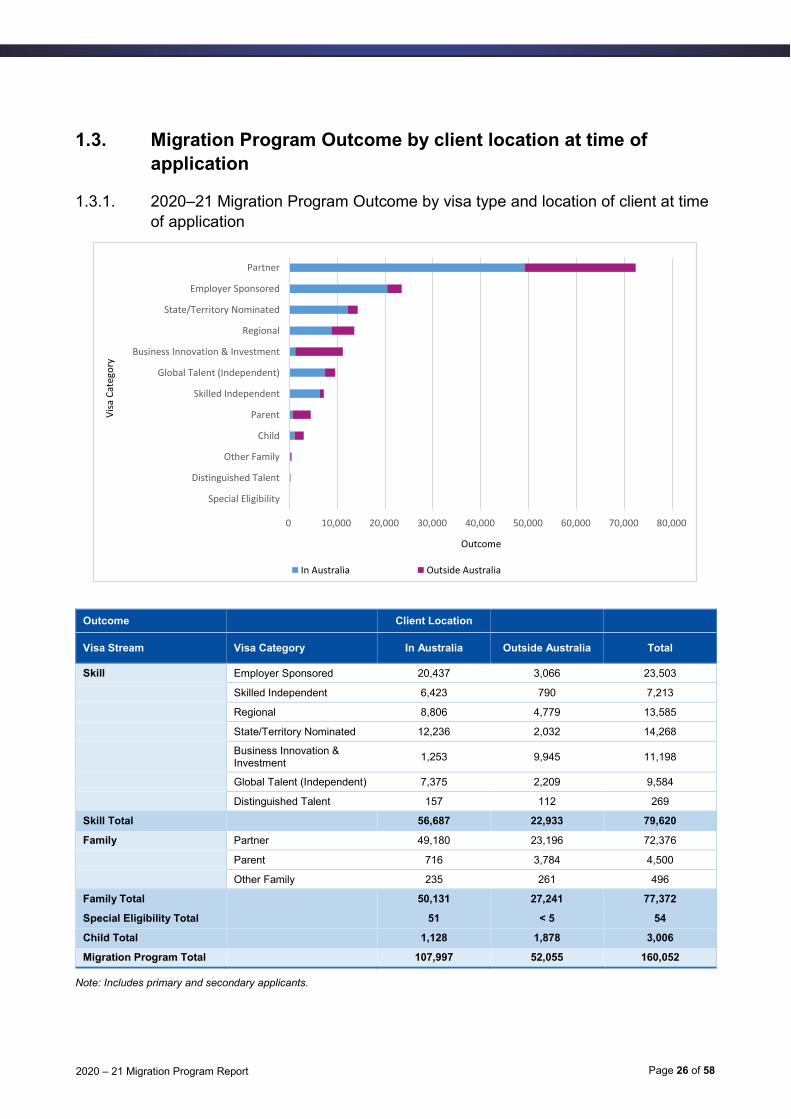
1.3. Migration Program Outcome by client location at time of
application
1.3.1. 2020–21 Migration Program Outcome by visa type and location of client at time
of application
Outcome Client Location
Visa Stream Visa Category In Australia Outside Australia Total
Skill Employer Sponsored 20,437 3,066 23,503
Skilled Independent 6,423 790 7,213
Regional 8,806 4,779 13,585
State/Territory Nominated 12,236 2,032 14,268
Business Innovation & Investment
1,253 9,945 11,198
Global Talent (Independent) 7,375 2,209 9,584
Distinguished Talent 157 112 269
Skill Total 56,687 22,933 79,620
Family Partner 49,180 23,196 72,376
Parent 716 3,784 4,500
Other Family 235 261 496
Family Total 50,131 27,241 77,372
Special Eligibility Total 51 < 5 54
Child Total 1,128 1,878 3,006
Migration Program Total 107,997 52,055 160,052
Note: Includes primary and secondary applicants.
0 10,000 20,000 30,000 40,000 50,000 60,000 70,000 80,000
Special Eligibility
Distinguished Talent
Other Family
Child
Parent
Skilled Independent
Global Talent (Independent)
Business Innovation & Investment
Regional
State/Territory Nominated
Employer Sponsored
Partner
Outcome
Vis
a C
ateg
ory
In Australia Outside Australia

Page 27 of 582020 – 21 Migration Program Report
1.3.2. Migration Program Outcome (Skill stream): Location of client at time of
application – comparison with previous years
Outcome Program Year 2
Client location at application
2010-11 2011-12 2012-13 2013-14 2014-15 2015-16 2016-17 2017-18 2018-19 2019-20 2020-21
In Australia 67,109 62,374 73,368 75,221 70,751 74,126 68,869 55,853 62,366 66,133 56,687
% In Australia 59% 50% 57% 59% 55% 58% 56% 50% 57% 69% 71%
Outside Australia 46,616 63,381 55,605 53,329 57,023 54,424 54,698 55,246 47,347 29,710 22,933
% Outside Australia 41% 50% 43% 41% 45% 42% 44% 50% 43% 31% 29%
Skill Stream Total 113,725 125,755 128,973 128,550 127,774 128,550 123,567 111,099 109,713 95,843 79,620
Note: Includes primary and secondary applicants.
0
20,000
40,000
60,000
80,000
100,000
120,000
140,000
2010-11 2011-12 2012-13 2013-14 2014-15 2015-16 2016-17 2017-18 2018-19 2019-20 2020-21
Ou
tco
me
Skill - In Australia Skill - Outside Australia

Page 28 of 582020 – 21 Migration Program Report
1.3.3. Migration Program Outcome (Family stream): Location of client at time of
applications – comparison with previous years
Outcome Program Year 2
Client location at application
2010-11
2011-12 2012-13 2013-14 2014-15 2015-16 2016-17 2017-18 2018-19 2019-20 2020-21
In Australia 13,624 16,371 20,708 20,180 20,446 18,639 22,406 18,918 20,958 23,515 50,131
% In Australia 25% 28% 34% 33% 33% 32% 40% 40% 44% 56% 65%
Outside Australia 40,919 42,233 39,477 40,932 40,639 38,761 33,814 28,814 26,289 18,446 27,241
% Outside Australia 75% 72% 66% 67% 67% 68% 60% 60% 56% 44% 35%
Family Stream Total 54,543 58,604 60,185 61,112 61,085 57,400 56,220 47,732 47,247 41,961 77,372
Note: Includes primary and secondary applicants.
0
10,000
20,000
30,000
40,000
50,000
60,000
70,000
80,000
90,000
2010-11 2011-12 2012-13 2013-14 2014-15 2015-16 2016-17 2017-18 2018-19 2019-20 2020-21
Ou
tco
me
Family - In Australia Family - Outside Australia

Page 29 of 582020 – 21 Migration Program Report
1.4. Migration Program Outcome by country and region of
citizenship
1.4.1. 2020–21 Migration Program Outcome: top 10 countries of citizenship by stream
Outcome Stream
Citizenship Country Skill Family Special
Eligibility Child Total
China, Peoples Republic of (excl SARs) 11,430 10,297 0 480 22,207
India 15,462 6,012 9 308 21,791
United Kingdom 5,660 6,942 < 5 97 12,703
Philippines 4,185 6,296 5 572 11,058
Vietnam 2,742 5,158 0 220 8,120
United States of America 1,323 3,372 < 5 81 4,780
Nepal 3,845 855 0 14 4,714
Hong Kong (SAR of the PRC) 3,265 1,009 0 38 4,312
Pakistan 2,248 1,843 0 30 4,121
Thailand 229 3,563 < 5 209 4,002
Other 29,231 32,025 31 957 62,244
Total 79,620 77,372 54 3,006 160,052
Note: Includes primary and secondary applicants.
0 5,000 10,000 15,000 20,000 25,000
Thailand
Pakistan
Hong Kong (SAR of the PRC)
Nepal
United States of America
Vietnam
Philippines
United Kingdom
India
China, Peoples Republic of (excl SARs)
Outcome
Co
un
try
of
citi
zen
ship
Family Skill Child Special Eligibility
Page 30 of 582020 – 21 Migration Program Report
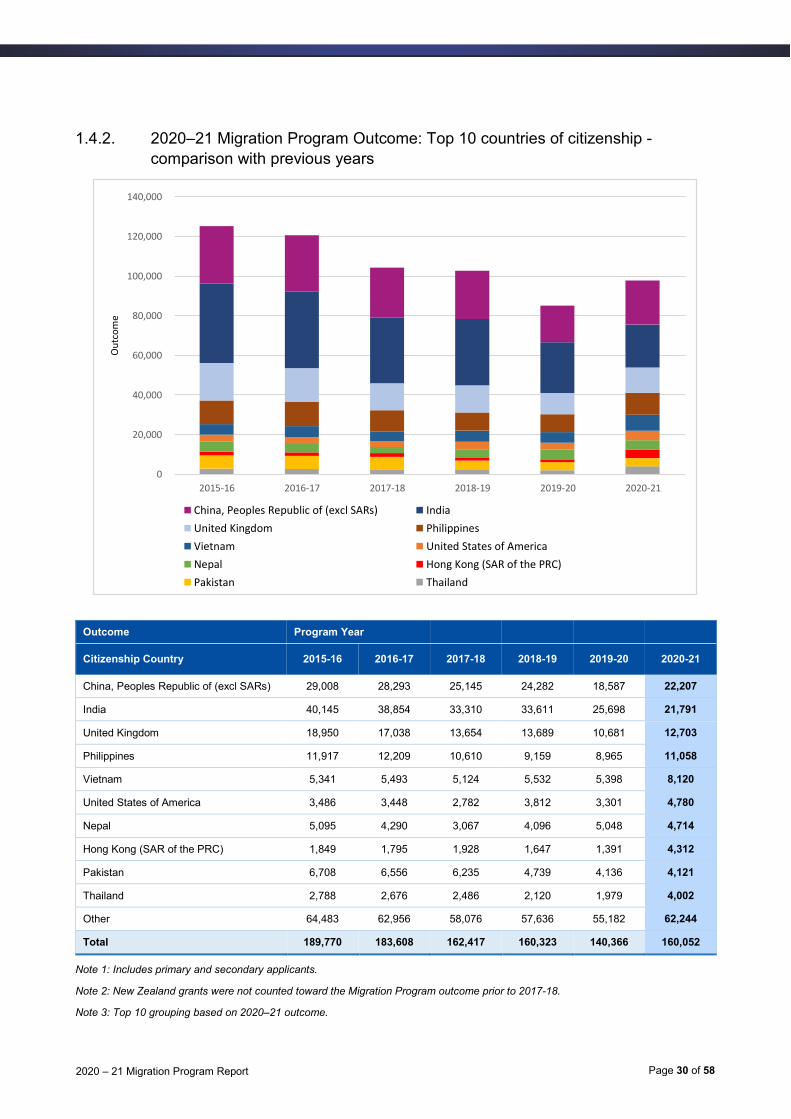
1.4.2. 2020–21 Migration Program Outcome: Top 10 countries of citizenship -
comparison with previous years
Outcome Program Year
Citizenship Country 2015-16 2016-17 2017-18 2018-19 2019-20 2020-21
China, Peoples Republic of (excl SARs) 29,008 28,293 25,145 24,282 18,587 22,207
India 40,145 38,854 33,310 33,611 25,698 21,791
United Kingdom 18,950 17,038 13,654 13,689 10,681 12,703
Philippines 11,917 12,209 10,610 9,159 8,965 11,058
Vietnam 5,341 5,493 5,124 5,532 5,398 8,120
United States of America 3,486 3,448 2,782 3,812 3,301 4,780
Nepal 5,095 4,290 3,067 4,096 5,048 4,714
Hong Kong (SAR of the PRC) 1,849 1,795 1,928 1,647 1,391 4,312
Pakistan 6,708 6,556 6,235 4,739 4,136 4,121
Thailand 2,788 2,676 2,486 2,120 1,979 4,002
Other 64,483 62,956 58,076 57,636 55,182 62,244
Total 189,770 183,608 162,417 160,323 140,366 160,052
Note 1: Includes primary and secondary applicants.
Note 2: New Zealand grants were not counted toward the Migration Program outcome prior to 2017-18.
Note 3: Top 10 grouping based on 2020–21 outcome.
0
20,000
40,000
60,000
80,000
100,000
120,000
140,000
2015-16 2016-17 2017-18 2018-19 2019-20 2020-21
Ou
tco
me
China, Peoples Republic of (excl SARs) India
United Kingdom Philippines
Vietnam United States of America
Nepal Hong Kong (SAR of the PRC)
Pakistan Thailand

Page 31 of 582020 – 21 Migration Program Report
1.4.3. 2020–21 Migration Program Outcome: Top 10 countries of citizenship –
rank comparison with previous years
Outcome Rank Total
Citizenship Country 2015-16 2016-17 2017-18 2018-19 2019-20 2020-21 2020-21
China, Peoples Republic of (excl SARs) 2 2 2 2 2 1 22,207
India 1 1 1 1 1 2 21,791
United Kingdom 3 3 3 3 3 3 12,703
Philippines 4 4 4 4 4 4 11,058
Vietnam 6 6 6 6 5 5 8,120
United States of America 12 11 11 10 10 6 4,780
Nepal 7 8 10 8 6 7 4,714
Hong Kong (SAR of the PRC) 19 20 18 22 23 8 4,312
Pakistan 5 5 5 7 8 9 4,121
Thailand 15 14 13 17 18 10 4,002
Note 1: Includes primary and secondary applicants.
Note 2: New Zealand grants were not counted toward the Migration Program outcome prior to 2017-18.
Note 3: Top 10 grouping based on 2020–21 outcome.

Page 32 of 582020 – 21 Migration Program Report
1.4.4. Migration Program Outcome 2010–11 to 2020–21 – by Region (Major)
Outcome Year
Region (Major) 2010-11 2011-12 2012-13 2013-14 2014-15 2015-16 2016-17 2017-18 2018-19 2019-20 2020-21
Southern and Central Asia
33,914 45,017 56,098 57,384 56,914 60,433 57,472 49,682 49,067 42,104 36,662
North-East Asia 37,347 33,910 36,698 34,321 34,983 36,525 35,759 31,315 30,601 24,941 32,707
South-East Asia 28,797 31,483 29,662 27,808 28,576 29,206 28,822 25,791 22,586 21,971 30,899
North-West Europe
32,691 35,896 32,494 34,817 32,461 28,801 25,943 20,005 21,056 16,844 20,764
Americas 7,674 9,157 9,549 9,910 9,096 9,437 9,681 8,095 10,099 9,708 14,008
Sub-Saharan Africa
13,392 12,309 9,937 9,442 8,939 8,755 8,795 7,528 7,012 7,056 7,199
Southern and Eastern Europe
5,457 6,563 6,764 7,088 7,476 7,314 7,689 6,251 6,386 6,214 6,777
North Africa and the Middle East
7,031 8,273 6,860 7,293 8,970 7,767 7,974 7,418 6,243 5,794 6,133
Oceania and Antarctica
2,288 2,275 1,848 1,771 1,570 1,442 1,343 6,275 7,194 5,680 4,811
Not Defined 94 115 90 166 112 90 130 57 79 54 92
Total 168,685 184,998 190,000 190,000 189,097 189,770 183,608 162,417 160,323 140,366 160,052
Note 1: Includes primary and secondary applicants.
Note 2: Region is determined based on the country of citizenship of the applicant, and grouped according to the Australian Bureau of
Statistics Standard Australian Classification of Countries (SACC) 2016.
0
20,000
40,000
60,000
80,000
100,000
120,000
140,000
160,000
180,000
200,000
2010-11 2011-12 2012-13 2013-14 2014-15 2015-16 2016-17 2017-18 2018-19 2019-20 2020-21
Ou
tco
me
Southern and Central Asia North-East AsiaSouth-East Asia North-West EuropeAmericas Sub-Saharan AfricaSouthern and Eastern Europe North Africa and the Middle EastOceania and Antarctica Not Defined

Page 33 of 582020 – 21 Migration Program Report
1.4.5. Migration Program Outcome 2010–11 to 2020–21 – by Top 10 Region (Minor)
and Percentage of Total
Outcome Year
Region (Minor) 2010-11 2011-12 2012-13 2013-14 2014-15 2015-16 2016-17 2017-18 2018-19 2019-20 2020-21
Southern Asia 19.4% 23.7% 29.2% 29.7% 28.9% 31.0% 30.2% 29.0% 29.2% 28.3% 21.9%
Chinese Asia (includes Mongolia)
18.7% 14.8% 15.7% 15.4% 16.1% 16.9% 17.1% 17.4% 17.0% 15.3% 17.7%
Maritime South-East Asia
12.1% 12.3% 10.7% 9.9% 10.5% 10.5% 10.7% 10.5% 8.7% 9.7% 10.9%
Mainland South-East Asia
4.9% 4.7% 5.0% 4.8% 4.6% 4.9% 5.0% 5.4% 5.4% 5.9% 8.4%
United Kingdom 14.2% 13.7% 11.4% 12.2% 11.1% 10.0% 9.3% 8.4% 8.5% 7.6% 7.9%
Northern America 2.7% 2.9% 3.0% 3.1% 2.9% 2.9% 2.9% 2.6% 3.5% 3.5% 4.4%
South America 1.6% 1.8% 1.8% 1.9% 1.7% 1.8% 2.1% 2.1% 2.6% 3.1% 4.1%
Southern and East Africa
7.4% 6.1% 4.7% 4.4% 4.2% 4.0% 4.1% 3.9% 3.7% 4.1% 3.6%
Middle East 3.4% 3.6% 2.8% 3.0% 3.8% 3.1% 3.4% 3.5% 3.0% 3.3% 3.3%
Western Europe 2.5% 2.6% 2.5% 2.4% 2.3% 2.2% 2.3% 2.1% 2.7% 2.5% 3.0%
Note 1: Includes primary and secondary applicants.
Note 2: New Zealand grants were not counted toward the Migration Program outcome prior to 2017-18.
Note 3: Region is determined based on the country of citizenship of the applicant. Terminology and grouping is according to the
Australian Bureau of Statistics Standard Australian Classification of Countries (SACC) 2016.
0.0%
5.0%
10.0%
15.0%
20.0%
25.0%
30.0%
35.0%
2010-11 2011-12 2012-13 2013-14 2014-15 2015-16 2016-17 2017-18 2018-19 2019-20 2020-21
% o
f O
utc
om
e
Southern Asia Chinese Asia (includes Mongolia)
Maritime South-East Asia Mainland South-East Asia
United Kingdom Northern America
South America Southern and East Africa
Middle East Western Europe

Page 34 of 582020 – 21 Migration Program Report
1.4.6. Migration Program Outcome 2010–11 to 2020–21 – by Top 10 Region (Minor)
Outcome Year
Region (Minor) 2010-11 2011-12 2012-13 2013-14 2014-15 2015-16 2016-17 2017-18 2018-19 2019-20 2020-21
Southern Asia 32,770 43,935 55,527 56,432 54,642 58,740 55,515 47,181 46,781 39,696 35,102
Chinese Asia (includes Mongolia)
31,539 27,372 29,746 29,260 30,506 32,057 31,433 28,272 27,208 21,446 28,369
Maritime South-East Asia
20,467 22,700 20,247 18,783 19,901 19,915 19,635 16,987 13,975 13,679 17,385
Mainland South-East Asia
8,330 8,783 9,415 9,025 8,675 9,291 9,187 8,804 8,611 8,292 13,514
United Kingdom 23,931 25,274 21,711 23,220 21,078 18,950 17,038 13,654 13,689 10,681 12,703
Northern America 4,598 5,364 5,656 5,893 5,441 5,458 5,381 4,298 5,566 4,938 7,000
South America 2,693 3,273 3,378 3,557 3,217 3,500 3,863 3,411 4,094 4,361 6,522
Southern and East Africa
12,560 11,343 9,011 8,419 7,937 7,599 7,451 6,372 5,854 5,732 5,817
Middle East 5,681 6,710 5,238 5,684 7,186 5,900 6,195 5,613 4,836 4,641 5,285
Western Europe 4,270 4,805 4,675 4,529 4,321 4,157 4,207 3,369 4,282 3,578 4,820
Other 21,846 25,439 25,396 25,198 26,193 24,203 23,703 24,456 25,427 23,322 23,535
Total 168,685 184,998 190,000 190,000 189,097 189,770 183,608 162,417 160,323 140,366 160,052
Note 1: Includes primary and secondary applicants.
Note 2: New Zealand grants were not counted toward the Migration Program outcome prior to 2017-18.
Note 3: Region is determined based on the country of citizenship of the applicant. Terminology and grouping is according to the
Australian Bureau of Statistics Standard Australian Classification of Countries (SACC) 2016

Page 35 of 582020 – 21 Migration Program Report
2. Skill stream
2.1. Composition of Migration Program Outcome 2020-21 Skill
Stream
Visa Category Total
Employer Sponsored 23,503
State/Territory Nominated 14,268
Regional 13,585
Business Innovation & Investment 11,198
Global Talent (Independent) 9,584
Skilled Independent 7,213
Distinguished Talent 269
Total 79,620
Note 1: Includes primary and secondary applicants.
29.5%
17.9%
17.1%
14.1%
12.0%
9.1%0.3%
Employer Sponsored
State/Territory Nominated
Regional
Business Innovation & Investment
Global Talent (Independent)
Skilled Independent
Distinguished Talent
Page 36 of 582020 – 21 Migration Program Report
2.2. Migration Program Outcome: Business Innovation and
Investment Program (BIIP) Category – by stream
Business Innovation and Investment Program (BIIP)
Visa Stream 2020-21
Business Innovation 6,330
Significant Business History 1,855
Investor 1,522
Significant Investor 1,288
Business Skills 97
Entrepreneur 61
Venture Capital Entrepreneur 33
Significant Investor Extension 7
State/Territory Sponsored Business Skills < 5
Business Innovation Extension < 5
Total 11,198
Note: Includes primary and secondary applicants.
0 1,000 2,000 3,000 4,000 5,000 6,000 7,000
Business Innovation Extension
State/Territory Sponsored Business Skills
Significant Investor Extension
Venture Capital Entrepreneur
Entrepreneur
Business Skills
Significant Investor
Investor
Significant Business History
Business Innovation
Outcome
Vis
a St
ream
Page 37 of 582020 – 21 Migration Program Report
2.3. Migration Program Outcome: Global Talent (Independent)
Category – by priority growth sector
Global Talent (Independent)
Growth Sector % of Total
DigiTech 33.9%
Health Industries 22.8%
Energy 17.0%
Financial Services and FinTech 11.5%
Resources 6.6%
Defence, Advanced Manufacturing and Space 6.4%
Agri-food and AgTech 0.9%
Infrastructure and Tourism 0.4%
Education 0.3%
Circular Economy 0.1%
Total 100%
Note: Global Talent (Independent) category commenced in the 2019–20 program year.
Page 38 of 582020 – 21 Migration Program Report
2.4. Migration Program Outcome: Regional Category – by
Subcategory and State/Territory of Intended Residence
Outcome Subcategory
Intended Residence Skilled Employer Sponsored
Regional Skilled Work Regional Total
New South Wales 635 1,975 2,610
Queensland 706 1,848 2,554
South Australia 141 2,148 2,289
Tasmania 46 1,824 1,870
Victoria 301 1,138 1,439
Western Australia 855 580 1,435
Northern Territory 96 595 691
Australian Capital Territory
118 493 611
Not Specified 12 74 86
Total 2,910 10,675 13,585
Note 1: Includes primary and secondary applicants.
Note 2: Includes both legacy and new regional visa subclasses.
0 500 1,000 1,500 2,000 2,500 3,000
Not Specified
Australian Capital Territory
Northern Territory
Western Australia
Victoria
Tasmania
South Australia
Queensland
New South Wales
Outcome
Inte
nd
ed R
esid
ence
Sta
te/T
erri
tory
Skilled Employer Sponsored Regional Skilled Work Regional
Page 39 of 582020 – 21 Migration Program Report
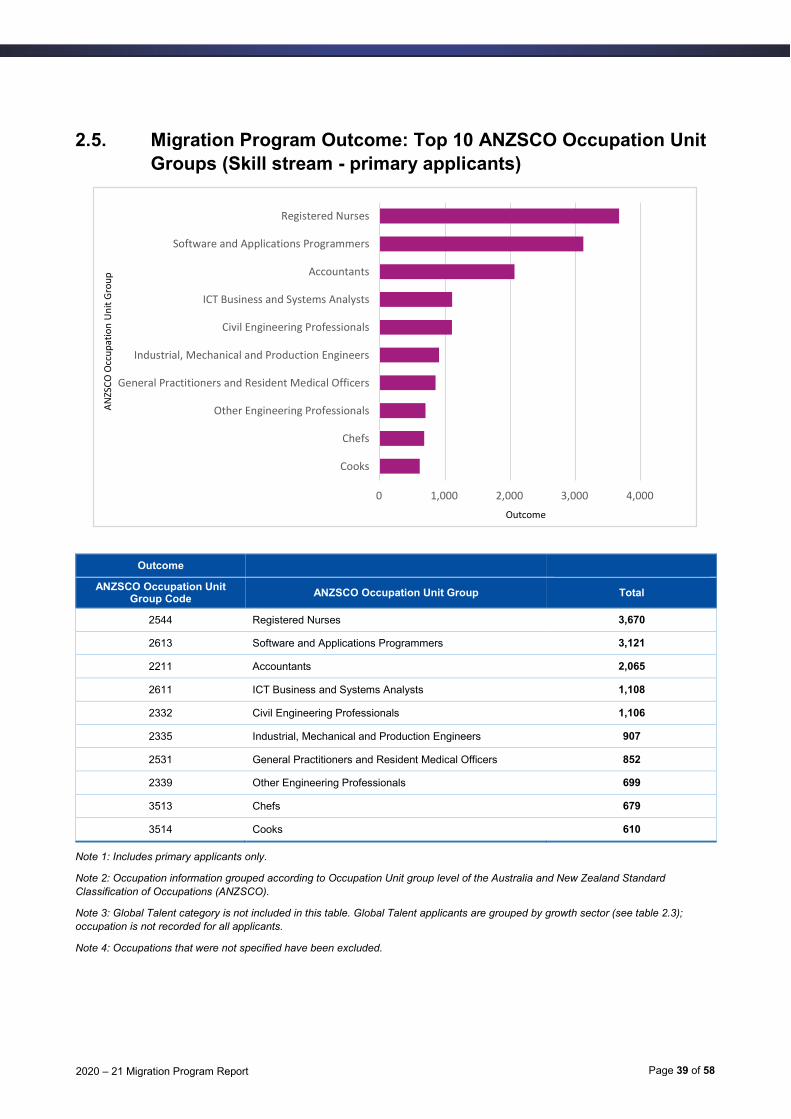
2.5. Migration Program Outcome: Top 10 ANZSCO Occupation Unit
Groups (Skill stream - primary applicants)
Outcome
ANZSCO Occupation Unit Group Code
ANZSCO Occupation Unit Group Total
2544 Registered Nurses 3,670
2613 Software and Applications Programmers 3,121
2211 Accountants 2,065
2611 ICT Business and Systems Analysts 1,108
2332 Civil Engineering Professionals 1,106
2335 Industrial, Mechanical and Production Engineers 907
2531 General Practitioners and Resident Medical Officers 852
2339 Other Engineering Professionals 699
3513 Chefs 679
3514 Cooks 610
Note 1: Includes primary applicants only.
Note 2: Occupation information grouped according to Occupation Unit group level of the Australia and New Zealand Standard
Classification of Occupations (ANZSCO).
Note 3: Global Talent category is not included in this table. Global Talent applicants are grouped by growth sector (see table 2.3);
occupation is not recorded for all applicants.
Note 4: Occupations that were not specified have been excluded.
0 1,000 2,000 3,000 4,000
Cooks
Chefs
Other Engineering Professionals
General Practitioners and Resident Medical Officers
Industrial, Mechanical and Production Engineers
Civil Engineering Professionals
ICT Business and Systems Analysts
Accountants
Software and Applications Programmers
Registered Nurses
Outcome
AN
ZSC
O O
ccu
pat
ion
Un
it G
rou
p

Page 40 of 582020 – 21 Migration Program Report
2.6. Migration Program Outcome: Top five ANZSCO Occupation
Unit Groups – by visa category (Skill stream – primary
applicants)
Outcome Visa Category
ANZSCO Occupation Unit
Group Code
ANZSCO Occupation Unit Group
Employer Sponsored
State/Territory Nominated
Regional Skilled
Independent Total
2544 Registered Nurses 557 1,537 1,353 223 3,670
2613 Software and Applications Programmers
1,298 1,141 264 418 3,121
2211 Accountants 520 863 480 202 2,065
2611 ICT Business and Systems Analysts
430 416 108 154 1,108
2332 Civil Engineering Professionals
328 372 223 183 1,106
Total 3,133 4,329 2,428 1,180 11,070
Note 1: Includes primary applicants only.
Note 2: Occupation information grouped according to Occupation Unit group level of the Australia and New Zealand Standard
Classification of Occupations (ANZSCO).
Note 3: Occupations that were not specified have been excluded.
0 1,000 2,000 3,000 4,000
Civil Engineering Professionals
ICT Business and Systems Analysts
Accountants
Software and Applications Programmers
Registered Nurses
Outcome
AN
ZSC
O O
ccu
pat
ion
Un
it G
rou
p
Employer Sponsored State/Territory Nominated Regional Skilled Independent
Page 41 of 582020 – 21 Migration Program Report
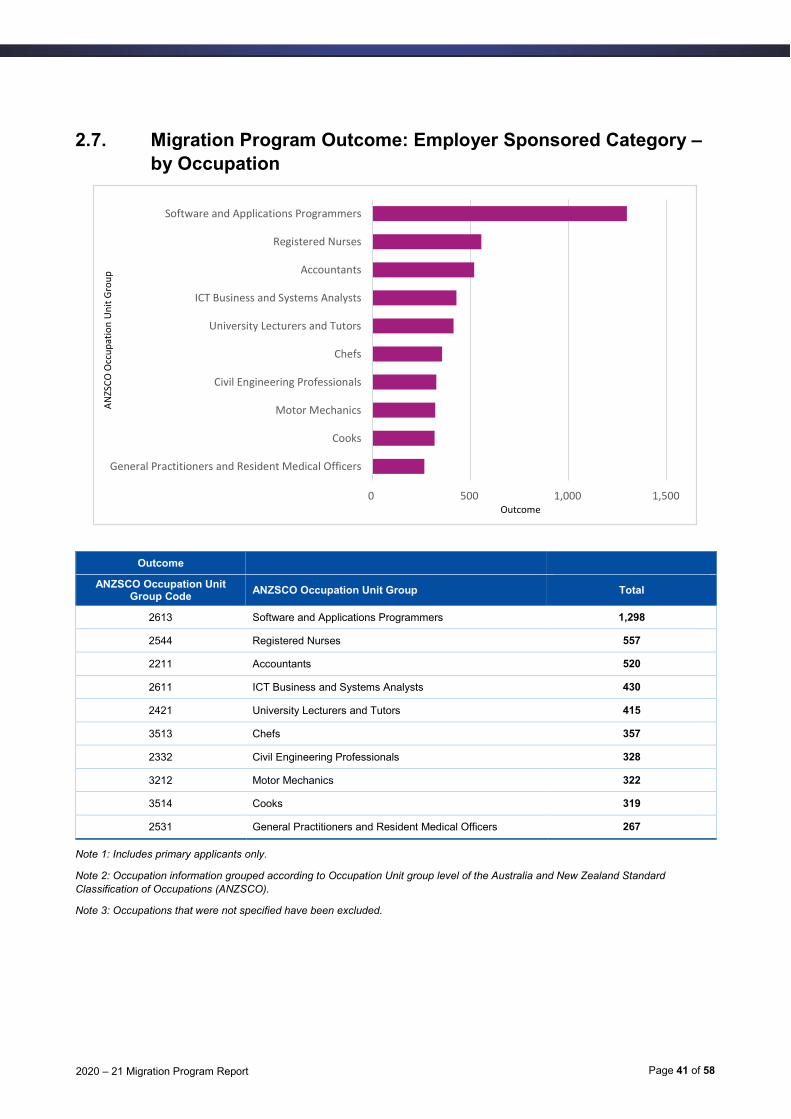
2.7. Migration Program Outcome: Employer Sponsored Category –
by Occupation
Outcome
ANZSCO Occupation Unit Group Code
ANZSCO Occupation Unit Group Total
2613 Software and Applications Programmers 1,298
2544 Registered Nurses 557
2211 Accountants 520
2611 ICT Business and Systems Analysts 430
2421 University Lecturers and Tutors 415
3513 Chefs 357
2332 Civil Engineering Professionals 328
3212 Motor Mechanics 322
3514 Cooks 319
2531 General Practitioners and Resident Medical Officers 267
Note 1: Includes primary applicants only.
Note 2: Occupation information grouped according to Occupation Unit group level of the Australia and New Zealand Standard
Classification of Occupations (ANZSCO).
Note 3: Occupations that were not specified have been excluded.
0 500 1,000 1,500
General Practitioners and Resident Medical Officers
Cooks
Motor Mechanics
Civil Engineering Professionals
Chefs
University Lecturers and Tutors
ICT Business and Systems Analysts
Accountants
Registered Nurses
Software and Applications Programmers
Outcome
AN
ZSC
O O
ccu
pat
ion
Un
it G
rou
p

Page 42 of 582020 – 21 Migration Program Report
2.8. Migration Program Outcome: Skilled Independent Category –
by Occupation
Outcome
ANZSCO Occupation Unit Group Code
ANZSCO Occupation Unit Group Total
2613 Software and Applications Programmers 418
2544 Registered Nurses 223
2211 Accountants 202
2332 Civil Engineering Professionals 183
2531 General Practitioners and Resident Medical Officers 163
2611 ICT Business and Systems Analysts 154
2539 Other Medical Practitioners 132
2335 Industrial, Mechanical and Production Engineers 119
2333 Electrical Engineers 118
2621 Database and Systems Administrators, and ICT Security Specialists
117
Note 1: Includes primary applicants only.
Note 2: Occupation information grouped according to Occupation Unit group level of the Australia and New Zealand Standard
Classification of Occupations (ANZSCO).
Note 3: Occupations that were not specified have been excluded.
0 100 200 300 400 500
Database and Systems Administrators, and ICT Security…
Electrical Engineers
Industrial, Mechanical and Production Engineers
Other Medical Practitioners
ICT Business and Systems Analysts
General Practitioners and Resident Medical Officers
Civil Engineering Professionals
Accountants
Registered Nurses
Software and Applications Programmers
Outcome
AN
ZSC
O O
ccu
pat
ion
Un
it G
rou
p

Page 43 of 582020 – 21 Migration Program Report
2.9. Migration Program Outcome: Regional Category – by
Occupation
2.9.1. Regional Category by Top 10 ANZSCO Occupation Unit Groups (primary
applicants)
Outcome
ANZSCO Occupation Unit Code
ANZSCO Occupation Unit Description Total
2544 Registered Nurses 1,353
2211 Accountants 480
2613 Software and Applications Programmers 264
2335 Industrial, Mechanical and Production Engineers 245
3514 Cooks 228
2332 Civil Engineering Professionals 223
4114 Enrolled and Mothercraft Nurses 215
1421 Retail Managers 173
2339 Other Engineering Professionals 160
3513 Chefs 142
Note 1: Includes primary applicants only.
Note 2: Includes both legacy and new regional visa subclasses.
Note 3: Occupation information grouped according to Occupation Unit group level of the Australia and New Zealand Standard
Classification of Occupations (ANZSCO).
0 500 1,000 1,500
Chefs
Other Engineering Professionals
Retail Managers
Enrolled and Mothercraft Nurses
Civil Engineering Professionals
Cooks
Industrial, Mechanical and Production Engineers
Software and Applications Programmers
Accountants
Registered Nurses
Outcome
AN
ZSC
O O
ccu
pat
ion
Un
it C
od
e
Skilled Employer Sponsored Regional Skilled Work Regional
Page 44 of 582020 – 21 Migration Program Report
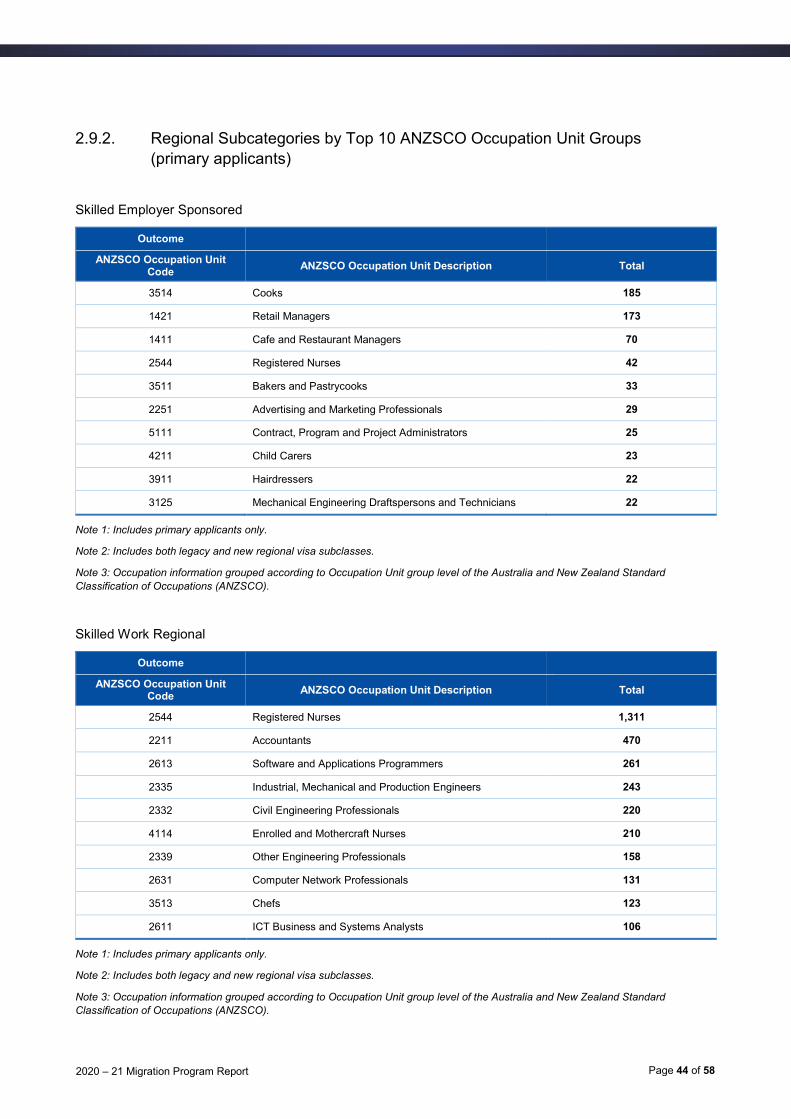
2.9.2. Regional Subcategories by Top 10 ANZSCO Occupation Unit Groups
(primary applicants)
Skilled Employer Sponsored
Outcome
ANZSCO Occupation Unit Code
ANZSCO Occupation Unit Description Total
3514 Cooks 185
1421 Retail Managers 173
1411 Cafe and Restaurant Managers 70
2544 Registered Nurses 42
3511 Bakers and Pastrycooks 33
2251 Advertising and Marketing Professionals 29
5111 Contract, Program and Project Administrators 25
4211 Child Carers 23
3911 Hairdressers 22
3125 Mechanical Engineering Draftspersons and Technicians 22
Note 1: Includes primary applicants only.
Note 2: Includes both legacy and new regional visa subclasses.
Note 3: Occupation information grouped according to Occupation Unit group level of the Australia and New Zealand Standard
Classification of Occupations (ANZSCO).
Skilled Work Regional
Outcome
ANZSCO Occupation Unit Code
ANZSCO Occupation Unit Description Total
2544 Registered Nurses 1,311
2211 Accountants 470
2613 Software and Applications Programmers 261
2335 Industrial, Mechanical and Production Engineers 243
2332 Civil Engineering Professionals 220
4114 Enrolled and Mothercraft Nurses 210
2339 Other Engineering Professionals 158
2631 Computer Network Professionals 131
3513 Chefs 123
2611 ICT Business and Systems Analysts 106
Note 1: Includes primary applicants only.
Note 2: Includes both legacy and new regional visa subclasses.
Note 3: Occupation information grouped according to Occupation Unit group level of the Australia and New Zealand Standard
Classification of Occupations (ANZSCO).
Page 45 of 582020 – 21 Migration Program Report
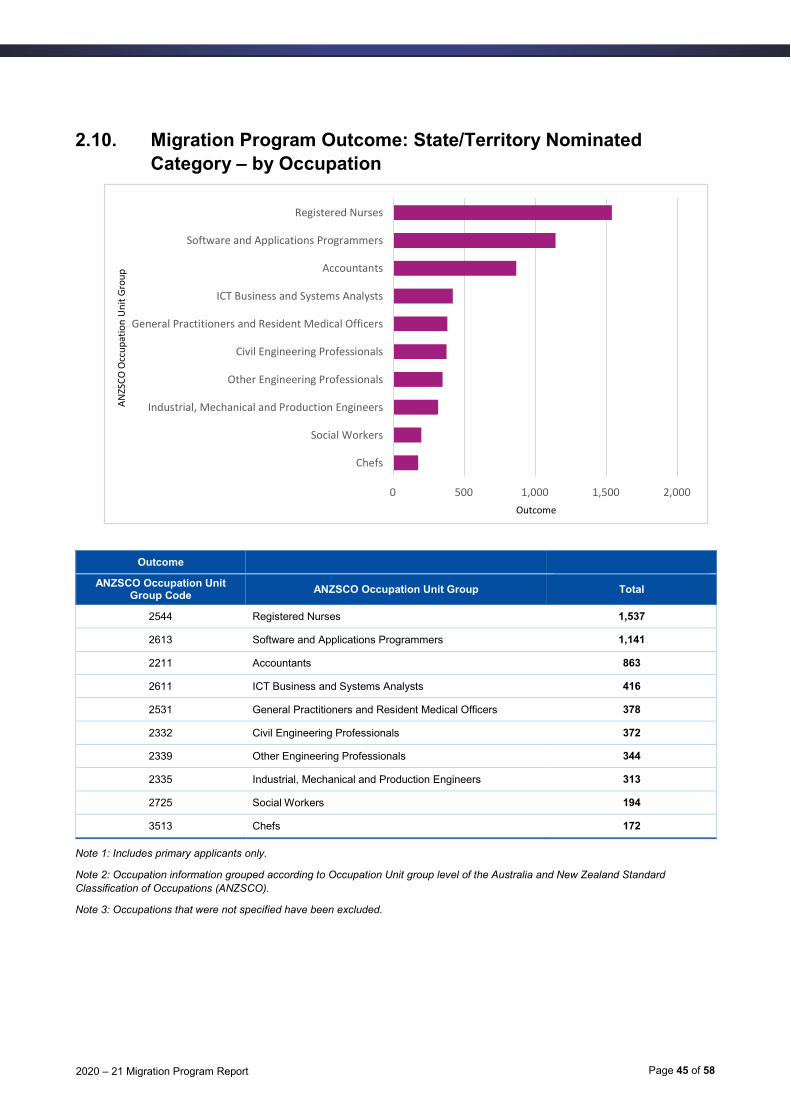
2.10. Migration Program Outcome: State/Territory Nominated
Category – by Occupation
Outcome
ANZSCO Occupation Unit Group Code
ANZSCO Occupation Unit Group Total
2544 Registered Nurses 1,537
2613 Software and Applications Programmers 1,141
2211 Accountants 863
2611 ICT Business and Systems Analysts 416
2531 General Practitioners and Resident Medical Officers 378
2332 Civil Engineering Professionals 372
2339 Other Engineering Professionals 344
2335 Industrial, Mechanical and Production Engineers 313
2725 Social Workers 194
3513 Chefs 172
Note 1: Includes primary applicants only.
Note 2: Occupation information grouped according to Occupation Unit group level of the Australia and New Zealand Standard
Classification of Occupations (ANZSCO).
Note 3: Occupations that were not specified have been excluded.
0 500 1,000 1,500 2,000
Chefs
Social Workers
Industrial, Mechanical and Production Engineers
Other Engineering Professionals
Civil Engineering Professionals
General Practitioners and Resident Medical Officers
ICT Business and Systems Analysts
Accountants
Software and Applications Programmers
Registered Nurses
Outcome
AN
ZSC
O O
ccu
pat
ion
Un
it G
rou
p
Page 46 of 582020 – 21 Migration Program Report
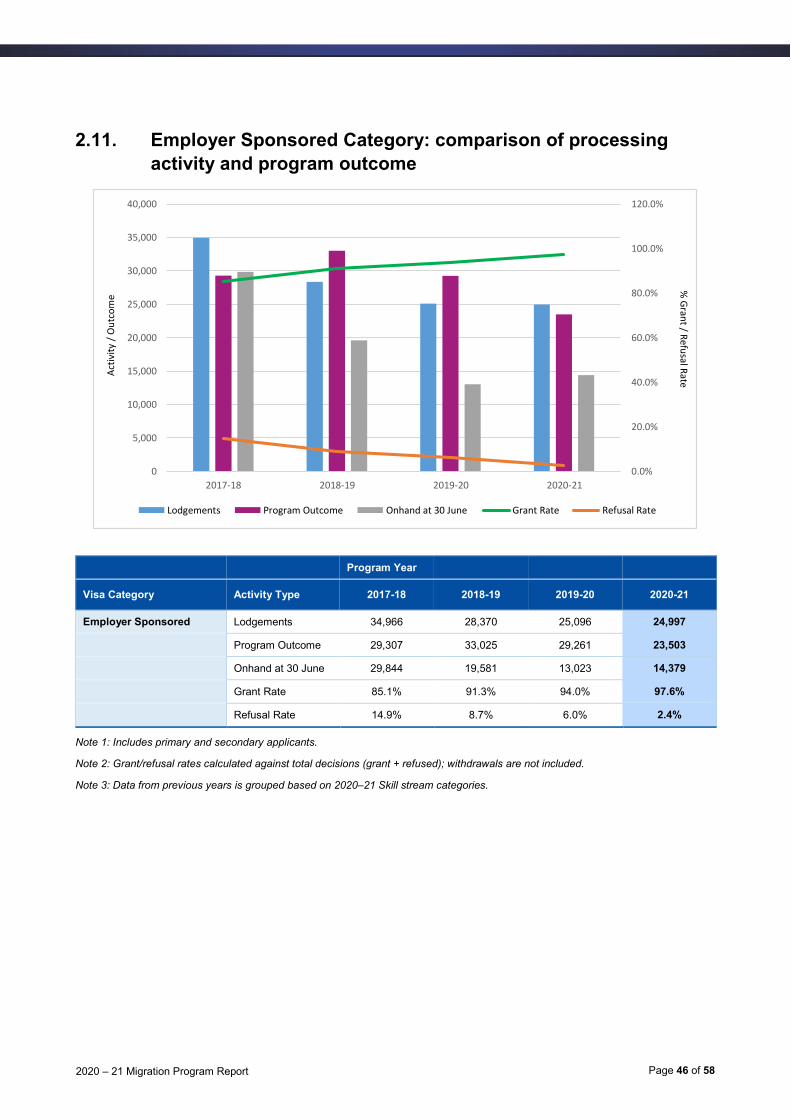
2.11. Employer Sponsored Category: comparison of processing
activity and program outcome
Program Year
Visa Category Activity Type 2017-18 2018-19 2019-20 2020-21
Employer Sponsored Lodgements 34,966 28,370 25,096 24,997
Program Outcome 29,307 33,025 29,261 23,503
Onhand at 30 June 29,844 19,581 13,023 14,379
Grant Rate 85.1% 91.3% 94.0% 97.6%
Refusal Rate 14.9% 8.7% 6.0% 2.4%
Note 1: Includes primary and secondary applicants.
Note 2: Grant/refusal rates calculated against total decisions (grant + refused); withdrawals are not included.
Note 3: Data from previous years is grouped based on 2020–21 Skill stream categories.
0.0%
20.0%
40.0%
60.0%
80.0%
100.0%
120.0%
0
5,000
10,000
15,000
20,000
25,000
30,000
35,000
40,000
2017-18 2018-19 2019-20 2020-21
% G
rant / R
efusal R
ateA
ctiv
ity
/ O
utc
om
e
Lodgements Program Outcome Onhand at 30 June Grant Rate Refusal Rate

Page 47 of 582020 – 21 Migration Program Report
2.12. Skilled Independent Category: comparison of processing
activity and program outcome
Program Year
Visa Category Activity Type 2017-18 2018-19 2019-20 2020-21
Skilled Independent Lodgements 35,107 36,206 11,821 8,529
Program Outcome 39,137 34,247 12,986 7,213
Onhand at 30 June 13,431 13,322 11,226 12,240
Grant Rate 96.9% 95.2% 94.0% 97.2%
Refusal Rate 3.1% 4.8% 6.0% 2.8%
Note 1: Includes primary and secondary applicants.
Note 2: Grant/refusal rates calculated against total decisions (grant + refused); withdrawals are not included.
Note 3: Data from previous years is grouped based on 2020–21 Skill stream categories.
0.0%
20.0%
40.0%
60.0%
80.0%
100.0%
120.0%
0
5,000
10,000
15,000
20,000
25,000
30,000
35,000
40,000
45,000
2017-18 2018-19 2019-20 2020-21
% G
rant / R
efusal R
ateA
ctiv
ity
/ O
utc
om
e
Lodgements Program Outcome Onhand at 30 June Grant Rate Refusal Rate
Page 48 of 582020 – 21 Migration Program Report
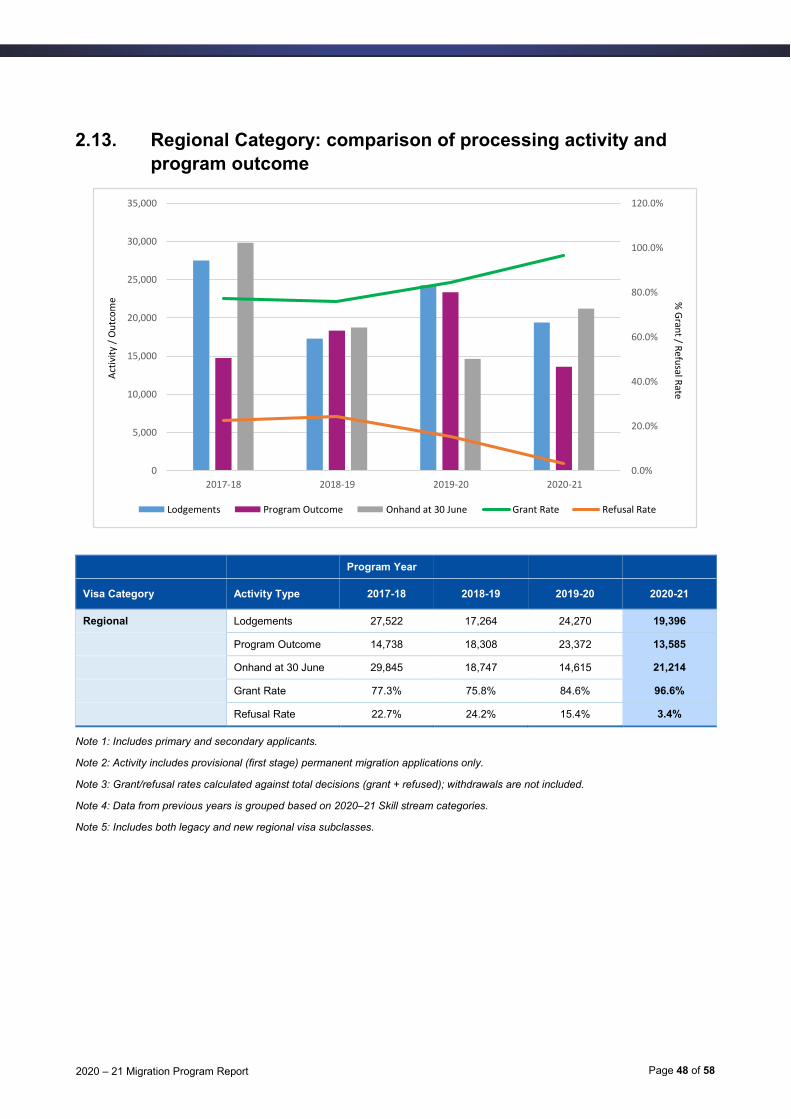
2.13. Regional Category: comparison of processing activity and
program outcome
Program Year
Visa Category Activity Type 2017-18 2018-19 2019-20 2020-21
Regional Lodgements 27,522 17,264 24,270 19,396
Program Outcome 14,738 18,308 23,372 13,585
Onhand at 30 June 29,845 18,747 14,615 21,214
Grant Rate 77.3% 75.8% 84.6% 96.6%
Refusal Rate 22.7% 24.2% 15.4% 3.4%
Note 1: Includes primary and secondary applicants.
Note 2: Activity includes provisional (first stage) permanent migration applications only.
Note 3: Grant/refusal rates calculated against total decisions (grant + refused); withdrawals are not included.
Note 4: Data from previous years is grouped based on 2020–21 Skill stream categories.
Note 5: Includes both legacy and new regional visa subclasses.
0.0%
20.0%
40.0%
60.0%
80.0%
100.0%
120.0%
0
5,000
10,000
15,000
20,000
25,000
30,000
35,000
2017-18 2018-19 2019-20 2020-21
% G
rant / R
efusal R
ateA
ctiv
ity
/ O
utc
om
e
Lodgements Program Outcome Onhand at 30 June Grant Rate Refusal Rate

Page 49 of 582020 – 21 Migration Program Report
2.13.1. Regional – Skilled Employer Sponsored Regional subcategory: comparison of
processing activity and program outcome
Program Year
Visa Category Activity Type 2017-18 2018-19 2019-20 2020-21
Regional - Skilled Employer Sponsored Regional
Lodgements 17,003 4,015 5,571 3,032
Program Outcome 6,221 8,987 8,372 2,910
Onhand at 30 June 24,362 9,932 2,393 3,144
Grant Rate 61.2% 63.2% 69.2% 93.1%
Refusal Rate 38.8% 36.8% 30.8% 6.9%
Note 1: Includes primary and secondary applicants.
Note 2: Grant/refusal rates calculated against total decisions (grant + refused); withdrawals are not included.
Note 3: Data from previous years is grouped based on 2020–21 Skill stream categories.
Note 4: Includes both legacy and new regional visa subclasses.
0.0%
10.0%
20.0%
30.0%
40.0%
50.0%
60.0%
70.0%
80.0%
90.0%
100.0%
0
5,000
10,000
15,000
20,000
25,000
30,000
2017-18 2018-19 2019-20 2020-21
% G
rant / R
efusal R
ateAct
ivit
y /
Ou
tco
me
Lodgements Program Outcome Onhand at 30 June Grant Rate Refusal Rate
Page 50 of 582020 – 21 Migration Program Report
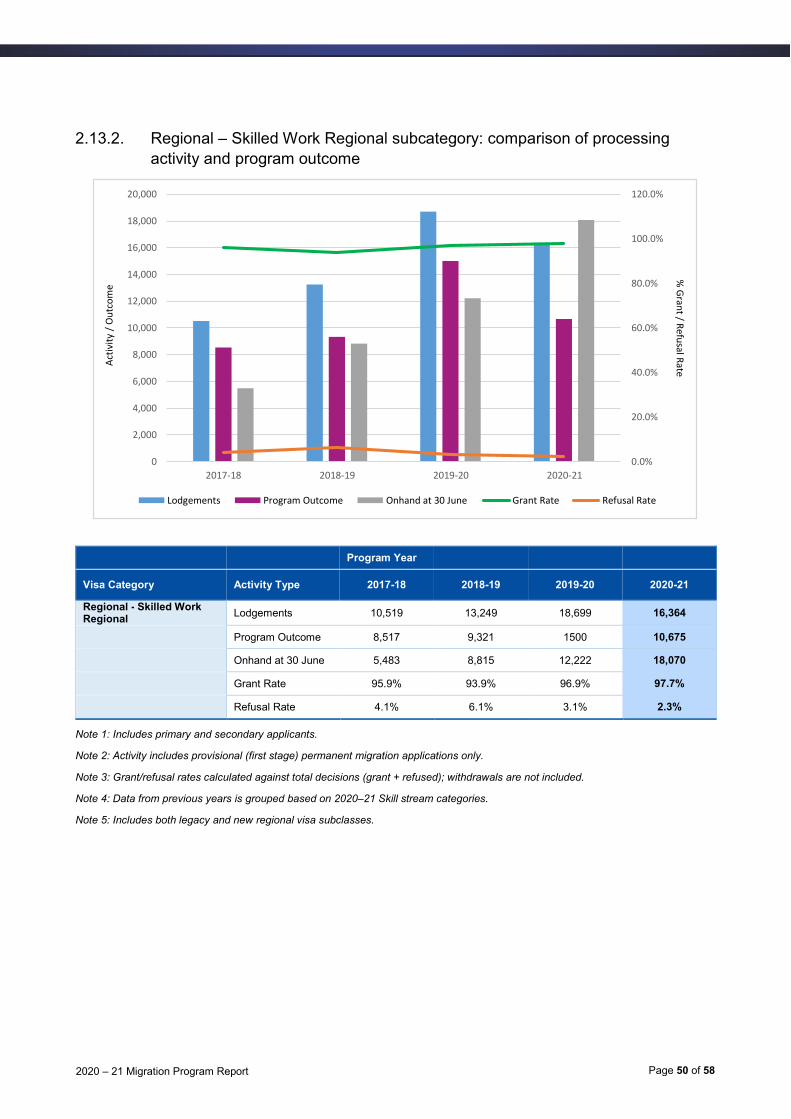
2.13.2. Regional – Skilled Work Regional subcategory: comparison of processing
activity and program outcome
Program Year
Visa Category Activity Type 2017-18 2018-19 2019-20 2020-21
Regional - Skilled Work Regional
Lodgements 10,519 13,249 18,699 16,364
Program Outcome 8,517 9,321 1500 10,675
Onhand at 30 June 5,483 8,815 12,222 18,070
Grant Rate 95.9% 93.9% 96.9% 97.7%
Refusal Rate 4.1% 6.1% 3.1% 2.3%
Note 1: Includes primary and secondary applicants.
Note 2: Activity includes provisional (first stage) permanent migration applications only.
Note 3: Grant/refusal rates calculated against total decisions (grant + refused); withdrawals are not included.
Note 4: Data from previous years is grouped based on 2020–21 Skill stream categories.
Note 5: Includes both legacy and new regional visa subclasses.
0.0%
20.0%
40.0%
60.0%
80.0%
100.0%
120.0%
0
2,000
4,000
6,000
8,000
10,000
12,000
14,000
16,000
18,000
20,000
2017-18 2018-19 2019-20 2020-21
% G
rant / R
efusal R
ateA
ctiv
ity
/ O
utc
om
e
Lodgements Program Outcome Onhand at 30 June Grant Rate Refusal Rate
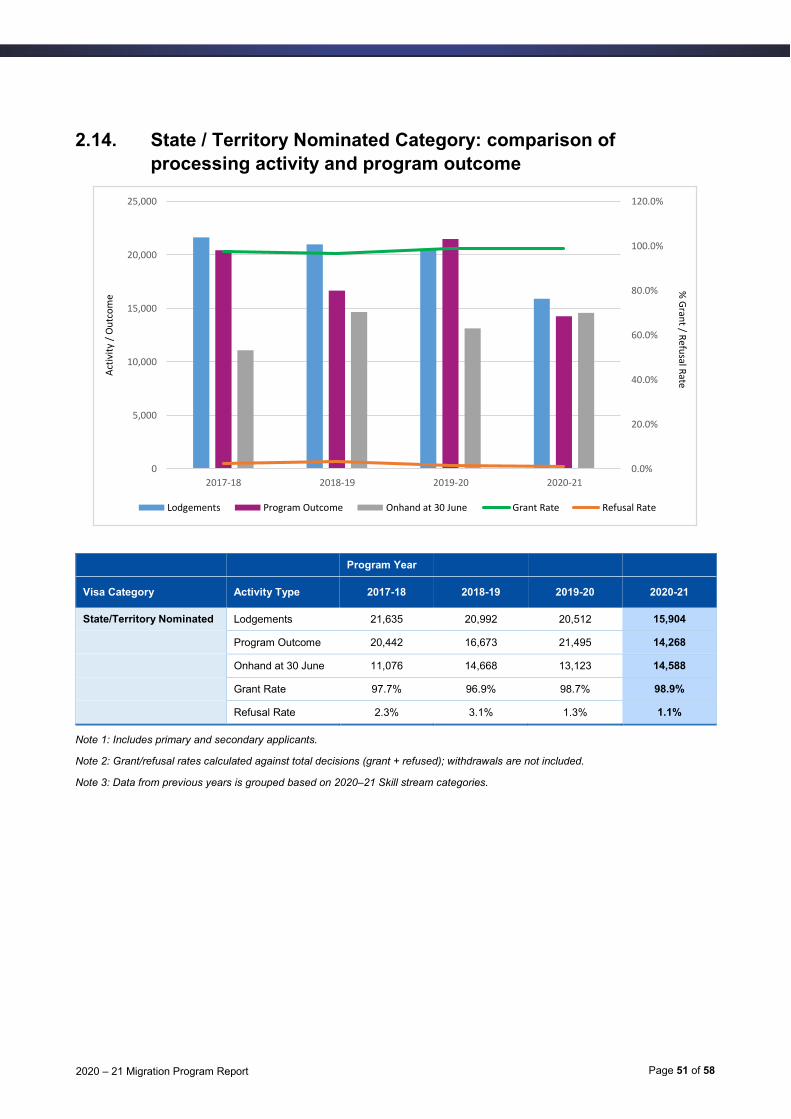
Page 51 of 582020 – 21 Migration Program Report
2.14. State / Territory Nominated Category: comparison of
processing activity and program outcome
Program Year
Visa Category Activity Type 2017-18 2018-19 2019-20 2020-21
State/Territory Nominated Lodgements 21,635 20,992 20,512 15,904
Program Outcome 20,442 16,673 21,495 14,268
Onhand at 30 June 11,076 14,668 13,123 14,588
Grant Rate 97.7% 96.9% 98.7% 98.9%
Refusal Rate 2.3% 3.1% 1.3% 1.1%
Note 1: Includes primary and secondary applicants.
Note 2: Grant/refusal rates calculated against total decisions (grant + refused); withdrawals are not included.
Note 3: Data from previous years is grouped based on 2020–21 Skill stream categories.
0.0%
20.0%
40.0%
60.0%
80.0%
100.0%
120.0%
0
5,000
10,000
15,000
20,000
25,000
2017-18 2018-19 2019-20 2020-21
% G
rant / R
efusal R
ateA
ctiv
ity
/ O
utc
om
e
Lodgements Program Outcome Onhand at 30 June Grant Rate Refusal Rate

Page 52 of 582020 – 21 Migration Program Report
2.15. Business Innovation and Investment Program (BIIP):
comparison of processing activity and program outcome
Program Year
Visa Category Activity Type 2017-18 2018-19 2019-20 2020-21
Business Innovation and Investment Program
Lodgements 14,259 14,922 15,784 15,818
Program Outcome 7,260 7,261 4,420 11,198
Onhand at 30 June 18,682 23,002 31,661 31,813
Grant Rate 73.3% 71.1% 64.5% 76.6%
Refusal Rate 11.3% 13.0% 13.9% 6.4%
Withdrawal Rate 15.4% 15.9% 21.5% 17%
Note 1: Includes primary and secondary applicants.
Note 2: Activity includes provisional (first stage) permanent migration applications only.
0.0%
10.0%
20.0%
30.0%
40.0%
50.0%
60.0%
70.0%
80.0%
90.0%
0
5,000
10,000
15,000
20,000
25,000
30,000
35,000
2017-18 2018-19 2019-20 2020-21
% G
rant / R
efusa/ W
ithd
rawal l R
ateA
ctiv
ity
/ O
utc
om
e
Lodgements Program Outcome Onhand at 30 June
Grant Rate Refusal Rate Withdrawal Rate

Page 53 of 582020 – 21 Migration Program Report
2.16. Distinguished Talent Category: comparison of processing
activity and program outcome
Program Year
Visa Category Activity Type 2017-18 2018-19 2019-20 2020-21
Distinguished Talent Lodgements 363 278 454 646
Program Outcome 200 200 200 269
Onhand at 30 June 322 412 596 915
Grant Rate 65.4% 76.5% 89.0% 84.7%
Refusal Rate 34.6% 23.5% 11.0% 15.3%
Note 1: Includes primary and secondary applicants.
Note 2: Grant/refusal rates calculated against total decisions (grant + refused); withdrawals are not included.
0.0%
10.0%
20.0%
30.0%
40.0%
50.0%
60.0%
70.0%
80.0%
90.0%
100.0%
0
100
200
300
400
500
600
700
800
900
1,000
2017-18 2018-19 2019-20 2020-21
% G
rant / R
efusal R
ateA
ctiv
ity
/ O
utc
om
e
Lodgements Program Outcome Onhand at 30 June Grant Rate Refusal Rate

Page 54 of 582020 – 21 Migration Program Report
2.17. Global Talent (Independent) Category: comparison of
processing activity and program outcome
Program Year
Visa Category Activity Type 2017-18 2018-19 2019-20 2020-21
Global Talent (Independent)
Lodgements 0 0 6,417 9,582
Program Outcome 0 0 4,109 9,584
Onhand at 30 June 0 0 2,448 2,236
Grant Rate 0.0% 0.0% 99.5% 99.4%
Refusal Rate 0.0% 0.0% 0.5% 0.6%
Note 1: Includes primary and secondary applicants.
Note 2: Grant/refusal rates calculated against total decisions (grant + refused); withdrawals are not included.
Note 3: Global Talent (Independent) category commenced in the 2019–20 program year.
0.0%
20.0%
40.0%
60.0%
80.0%
100.0%
120.0%
0
2,000
4,000
6,000
8,000
10,000
12,000
2017-18 2018-19 2019-20 2020-21
% G
rant / R
efusal R
ateA
ctiv
ity
/ O
utc
om
e
Lodgements Program Outcome Onhand at 30 June Grant Rate Refusal Rate

Page 55 of 582020 – 21 Migration Program Report
3. Family stream
3.1. Partner Category: comparison of processing activity and
program outcome
Program Year
Visa Category Activity Type 2017-18 2018-19 2019-20 2020-21
Partner Lodgements 57,144 61,884 52,479 44,325
Program Outcome 39,799 39,918 37,118 72,376
Onhand at 30 June 77,734 88,660 96,361 64,111
Grant Rate 90.0% 90.6% 92.0% 98.0%
Refusal Rate 10.0% 9.4% 8.0% 2.0%
Note 1: Includes primary and secondary applicants.
Note 2: Activity includes provisional (first stage) permanent migration applications only.
Note 3: Grant/refusal rates calculated against total decisions (grant + refused); withdrawals are not included.
0.0%
20.0%
40.0%
60.0%
80.0%
100.0%
120.0%
0
20,000
40,000
60,000
80,000
100,000
120,000
2017-18 2018-19 2019-20 2020-21
% G
rant / R
efusal R
ateA
ctiv
ity
/ O
utc
om
e
Lodgements Program Outcome Onhand at 30 June Grant Rate Refusal Rate

Page 56 of 582020 – 21 Migration Program Report
3.2. Parent Category: comparison of processing activity and
program outcome
Program Year
Visa Category Activity Type 2017-18 2018-19 2019-20 2020-21
Parent Lodgements 13,590 13,246 12,664 14,827
Program Outcome 7,371 6,805 4,399 4,500
Onhand at 30 June 99,239 102,854 108,659 114,359
Grant Rate 93.7% 93.6% 81.2% 93.3%
Refusal Rate 6.3% 6.4% 18.8% 6.7%
Note 1: Includes primary and secondary applicants.
Note 2: Grant/refusal rates calculated against total decisions (grant + refused); withdrawals are not included.
0.0%
10.0%
20.0%
30.0%
40.0%
50.0%
60.0%
70.0%
80.0%
90.0%
100.0%
0
20,000
40,000
60,000
80,000
100,000
120,000
140,000
2017-18 2018-19 2019-20 2020-21
% G
rant / R
efusal R
ateA
ctiv
ity
/ O
utc
om
e
Lodgements Program Outcome Onhand at 30 June Grant Rate Refusal Rate
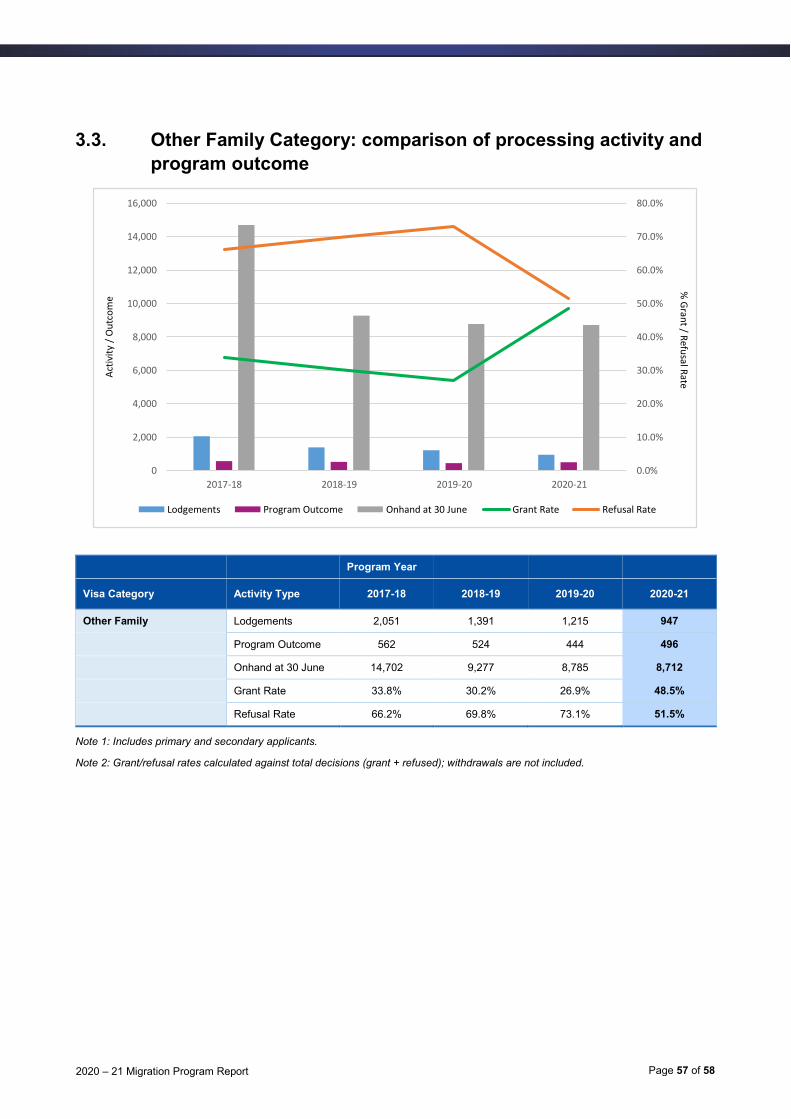
Page 57 of 582020 – 21 Migration Program Report
3.3. Other Family Category: comparison of processing activity and
program outcome
Program Year
Visa Category Activity Type 2017-18 2018-19 2019-20 2020-21
Other Family Lodgements 2,051 1,391 1,215 947
Program Outcome 562 524 444 496
Onhand at 30 June 14,702 9,277 8,785 8,712
Grant Rate 33.8% 30.2% 26.9% 48.5%
Refusal Rate 66.2% 69.8% 73.1% 51.5%
Note 1: Includes primary and secondary applicants.
Note 2: Grant/refusal rates calculated against total decisions (grant + refused); withdrawals are not included.
0.0%
10.0%
20.0%
30.0%
40.0%
50.0%
60.0%
70.0%
80.0%
0
2,000
4,000
6,000
8,000
10,000
12,000
14,000
16,000
2017-18 2018-19 2019-20 2020-21
% G
rant / R
efusal R
ateA
ctiv
ity
/ O
utc
om
e
Lodgements Program Outcome Onhand at 30 June Grant Rate Refusal Rate
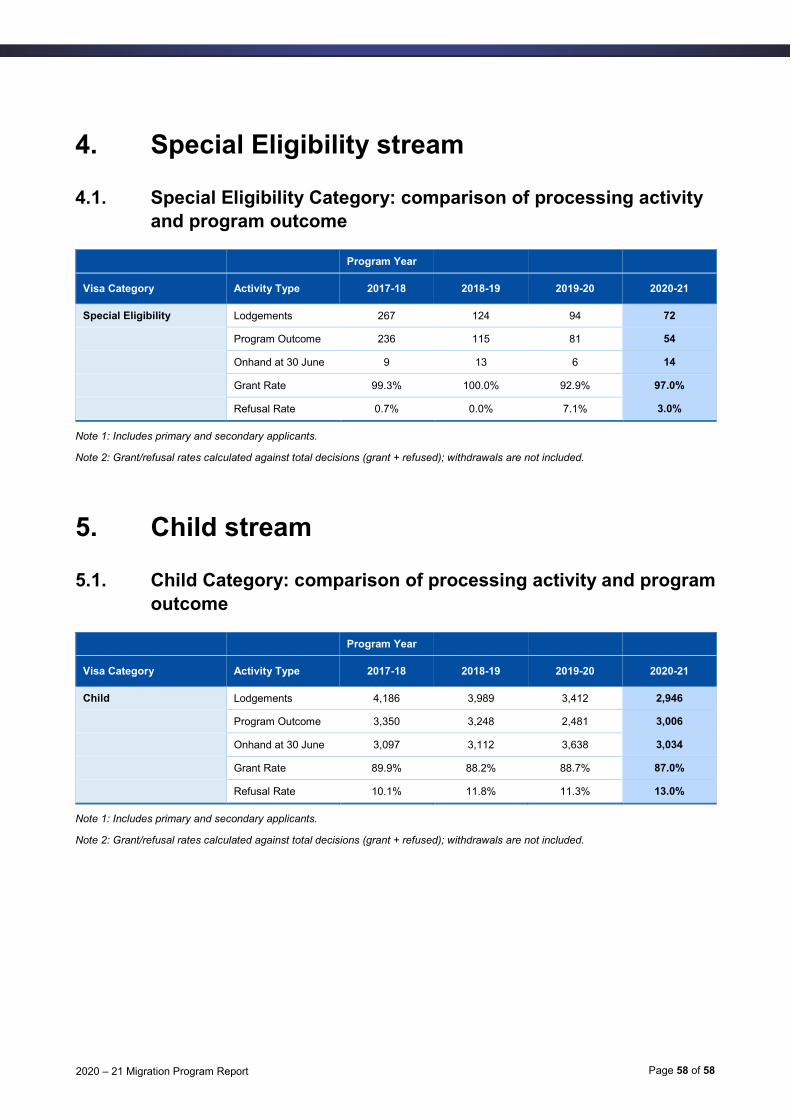
Page 58 of 582020 – 21 Migration Program Report
4. Special Eligibility stream
4.1. Special Eligibility Category: comparison of processing activity
and program outcome
Program Year
Visa Category Activity Type 2017-18 2018-19 2019-20 2020-21
Special Eligibility Lodgements 267 124 94 72
Program Outcome 236 115 81 54
Onhand at 30 June 9 13 6 14
Grant Rate 99.3% 100.0% 92.9% 97.0%
Refusal Rate 0.7% 0.0% 7.1% 3.0%
Note 1: Includes primary and secondary applicants.
Note 2: Grant/refusal rates calculated against total decisions (grant + refused); withdrawals are not included.
5. Child stream
5.1. Child Category: comparison of processing activity and program
outcome
Program Year
Visa Category Activity Type 2017-18 2018-19 2019-20 2020-21
Child Lodgements 4,186 3,989 3,412 2,946
Program Outcome 3,350 3,248 2,481 3,006
Onhand at 30 June 3,097 3,112 3,638 3,034
Grant Rate 89.9% 88.2% 88.7% 87.0%
Refusal Rate 10.1% 11.8% 11.3% 13.0%
Note 1: Includes primary and secondary applicants.
Note 2: Grant/refusal rates calculated against total decisions (grant + refused); withdrawals are not included.