2019/20: Global Stocks Boom Since May’s Initial Forecast · Monetary Fund) forecasts for 2018,...
29
For an email subscription, click here to register: https://public.govdelivery.com/accounts/USDAFAS/subscriber/ new. Approved by the World Agricultural Outlook Board/USDA 2019/20: Global Stocks Boom Since May’s Initial Forecast Dampened global cotton consumption and higher carryin have driven the 2019/20 forecast for global ending stocks higher compared with the initial May forecast. World ending stocks for 2019/20 are now forecast at 80.8 million bales, largely due to changes for use in both the 2018/19 and 2019/20 forecasts. Reductions for use in both years have been mostly driven by lower expectations for global GDP growth and dampened demand prospects for cotton. Economic growth is a major driver of cotton demand. As growth prospects in major cotton-consuming markets have been pressured lower, expectations for cotton demand have likewise been reduced. Major slowdowns in global demand and economic growth are highlighted by recent IMF (International Monetary Fund) forecasts for 2018, 2019, and 2020, as the 2019 forecast has been cut by nearly one percent (year with the highest reduction) compared with the IMF’s May forecast. The world’s largest consumer of cotton, China, has seen both its 2018/19 and 2019/20 forecasts for consumption trend down since May, due in part to slower domestic economic growth exacerbated by the ongoing trade conflict with the United States. The largest contributor to higher global stocks is India, where ending stocks are now projected more than 80 percent higher than May’s forecast. The 2018/19 and 2019/20 forecasts for production are higher while consumption has declined in both years, primarily due to sluggish economic growth, and the Minimum Support Price’s impacts (higher-priced domestic supplies) weakening domestic yarn exports. A historically generous price support program (MSP) has somewhat kept internal cotton prices high for downstream users and hindered these manufacturers’ exports prospects. Higher stocks and less use in Bangladesh since May reflect a slowing export forecast for its textile and apparel products. Reduced prospects for the country’s fabric and garment exports are attributed to economic slowdowns in major consuming markets, including the EU and the United States. 40 50 60 70 80 90 100 110 120 130 140 Production Use Beginning Stocks Ending Stocks Mil. Bales Dampened Use Propels Global Stocks Up May 2019 Forecast Nov. 2019 Forecast United States Department of Agriculture Foreign Agricultural Service November 2019 Cotton: World Markets and Trade
Transcript of 2019/20: Global Stocks Boom Since May’s Initial Forecast · Monetary Fund) forecasts for 2018,...

For an email subscription, click here to register: https://public.govdelivery.com/accounts/USDAFAS/subscriber/ new.
Approved by the World Agricultural Outlook Board/USDA
2019/20: Global Stocks Boom Since May’s Initial Forecast
Dampened global cotton consumption and higher carryin have driven the 2019/20 forecast for global ending stocks higher compared with the initial May forecast. World ending stocks for 2019/20 are now forecast at 80.8 million bales, largely due to changes for use in both the 2018/19 and 2019/20 forecasts. Reductions for use in both years have been mostly driven by lower expectations for global GDP growth and dampened demand prospects for cotton. Economic growth is a major driver of cotton demand. As growth prospects in major cotton-consuming markets have been pressured lower, expectations for cotton demand have likewise been reduced. Major slowdowns in global demand and economic growth are highlighted by recent IMF (International Monetary Fund) forecasts for 2018, 2019, and 2020, as the 2019 forecast has been cut by nearly one percent (year with the highest reduction) compared with the IMF’s May forecast. The world’s largest consumer of cotton, China, has seen both its 2018/19 and 2019/20 forecasts for consumption trend down since May, due in part to slower domestic economic growth exacerbated by the ongoing trade conflict with the United States. The largest contributor to higher global stocks is India, where ending stocks are now projected more than 80 percent higher than May’s forecast. The 2018/19 and 2019/20 forecasts for production are higher while consumption has declined in both years, primarily due to sluggish economic growth, and the Minimum Support Price’s impacts (higher-priced domestic supplies) weakening domestic yarn exports. A historically generous price support program (MSP) has somewhat kept internal cotton prices high for downstream users and hindered these manufacturers’ exports prospects. Higher stocks and less use in Bangladesh since May reflect a slowing export forecast for its textile and apparel products. Reduced prospects for the country’s fabric and garment exports are attributed to economic slowdowns in major consuming markets, including the EU and the United States.
40 50 60 70 80 90
100 110 120 130 140
Production Use Beginning Stocks Ending Stocks
Mil.
Bal
es
Dampened Use Propels Global Stocks Up
May 2019 Forecast Nov. 2019 Forecast
United States Department of Agriculture Foreign Agricultural Service November 2019
Cotton: World Markets and Trade

Although global production is projected slightly lower from May, the 2019/20 forecast remains more than 3 million bales above the previous year, adding further to global supplies and stocks. Higher 2019/20 supplies and lower consumption are propelling ending stocks 7 percent higher since May’s forecast, furthering pressuring prices.
OverviewFor 2019/20, the November forecast shows, compared with the previous month, a global use estimate that is nearly unchanged and a decline in production and ending stocks. Production is down in Pakistan, India, and China. Global trade is raised with higher imports in Turkey and Pakistan due to smaller crops. The Brazil export forecast is raised on strong early season shipments, especially to China. The U.S. forecast has lower production and ending stocks, with exports unchanged. The U.S. season-average farm price is projected at 61 cents per pound, 3 cents above last month’s forecast, but 13 percent lower than the final 2018/19 price of 70.3 cents.
For current prices received by farmers click here; NASS farm price
Prices
The A-index and the U.S. spot prices were up slightly from October’s WASDE amid an improved market perception for the outcome of U.S.-China trade negotiations, and lower expected production.
For more information on U.S. spot price click here; AMS Cotton Market News
Nov-19, 74.9
Nov-19, 61.0
40
50
60
70
80
90
100
110
Sep-16O
ct-16N
ov-16D
ec-16Jan-17Feb-17M
ar-17A
pr-17M
ay-17Jun-17Jul-17A
ug-17Sep-17O
ct-17N
ov-17D
ec-17Jan-18Feb-18M
ar-18A
pr-18M
ay-18Jun-18Jul-18A
ug-18Sep-18O
ct-18N
ov-18D
ec-18Jan-19Feb-19M
ar-19A
pr-19M
ay-19Jun-19Jul-19A
ug-19Sep-19O
ct-19N
ov-19ce
nts/
lb.
Monthly Average Cotton Prices
A-Index U.S. Spot Price
Foreign Agricultural Service/USDA 2 November 2019Office of Global Analysis
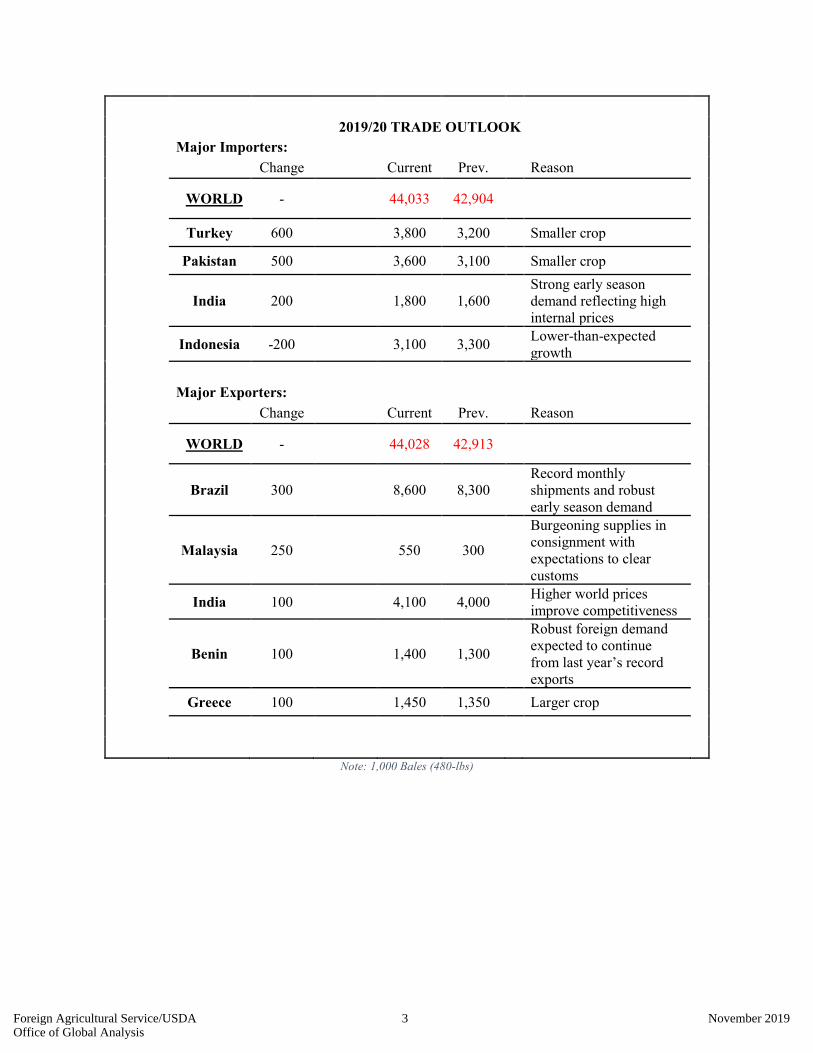
2019/20 TRADE OUTLOOK Major Importers: Change Current Prev. Reason
WORLD - 44,033 42,904
Turkey 600 3,800 3,200 Smaller crop
Pakistan 500 3,600 3,100 Smaller crop
India 200 1,800 1,600 Strong early season demand reflecting high internal prices
Indonesia -200 3,100 3,300 Lower-than-expected growth
Major Exporters: Change Current Prev. Reason
WORLD - 44,028 42,913
Brazil 300 8,600 8,300 Record monthly shipments and robust early season demand
Malaysia 250 550 300
Burgeoning supplies in consignment with expectations to clear customs
India 100 4,100 4,000 Higher world prices improve competitiveness
Benin 100 1,400 1,300
Robust foreign demand expected to continue from last year’s record exports
Greece 100 1,450 1,350 Larger crop
Note: 1,000 Bales (480-lbs)
Foreign Agricultural Service/USDA 3 November 2019Office of Global Analysis

The Foreign Agricultural Service (FAS) updates its production, supply and distribution (PSD) database for cotton, oilseeds, and grains at 12:00 p.m. on the day the World Agricultural Supply and Demand Estimates (WASDE) report is released. This circular is released by 12:15 p.m. FAS Reports and Databases: Current World Market and Trade and World Agricultural Production Reports:
https://apps.fas.usda.gov/psdonline/app/index.html#/app/downloads Archives World Market and Trade and World Agricultural Production Reports:
http://usda.mannlib.cornell.edu/MannUsda/viewTaxonomy.do?taxonomyID=7 Production, Supply and Distribution Database (PSD Online): https://apps.fas.usda.gov/psdonline/app/index.html#/app/home Global Agricultural Trade System (U.S. Exports and Imports):
http://apps.fas.usda.gov/gats/default.aspx Export Sales Report:
http://apps.fas.usda.gov/esrquery/ Global Agricultural Information Network (Agricultural Attaché Reports):
http://gain.fas.usda.gov/Pages/Default.aspx Other USDA Reports: World Agricultural Supply and Demand Estimates (WASDE):
http://www.usda.gov/oce/commodity/wasde/ Economic Research Service:
http://www.ers.usda.gov/topics/crops National Agricultural Statistics Service:
http://www.nass.usda.gov/Publications/
Questions may be directed to: James Johnson (202) 690-1546 ([email protected]) Graham Soley (202) 772-4235 ([email protected])
Foreign Agricultural Service/USDA 4 November 2019Office of Global Analysis
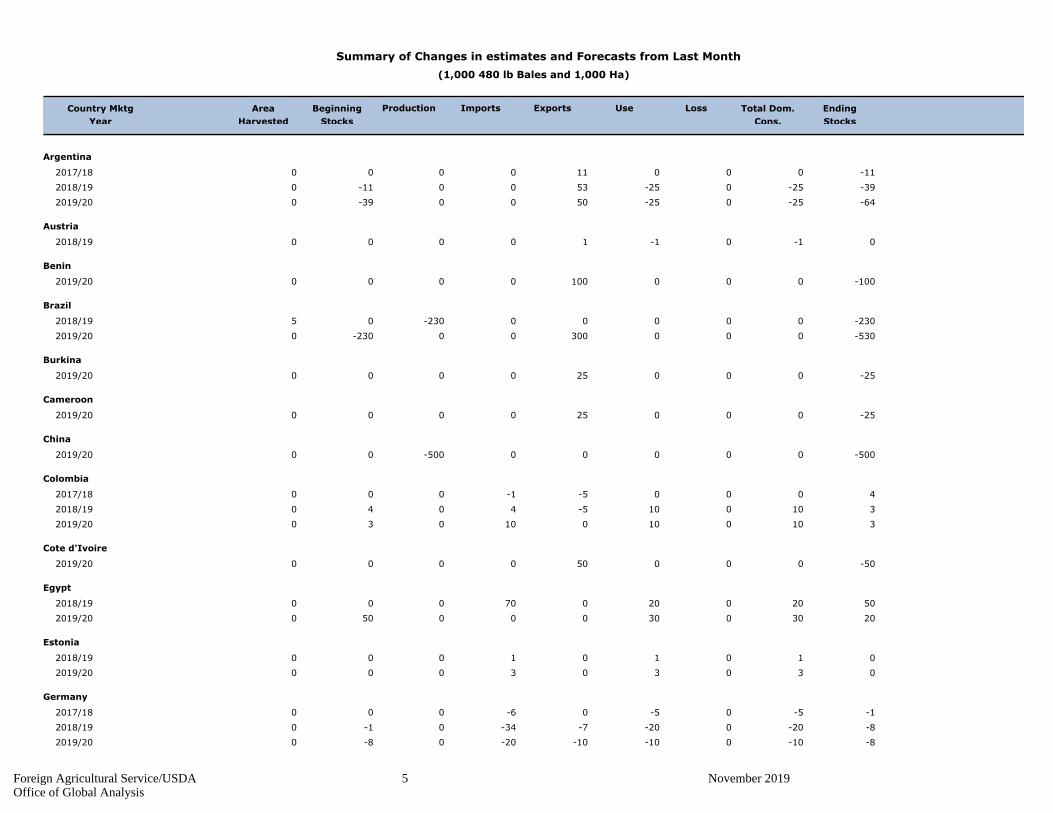
Summary of Changes in estimates and Forecasts from Last Month
(1,000 480 lb Bales and 1,000 Ha)
Country Mktg
Year
Area
Harvested
Beginning
Stocks
Production Imports Exports Use Loss Total Dom.
Cons.
Ending
Stocks
Argentina
-11000110000 2017/18
-39-250-255300-110 2018/19
-64-250-255000-390 2019/20
Austria
0-10-110000 2018/19
Benin
-1000001000000 2019/20
Brazil
-23000000-23005 2018/19
-53000030000-2300 2019/20
Burkina
-25000250000 2019/20
Cameroon
-25000250000 2019/20
China
-50000000-50000 2019/20
Colombia
4000-5-1000 2017/18
310010-54040 2018/19
310010010030 2019/20
Cote d'Ivoire
-50000500000 2019/20
Egypt
5020020070000 2018/19
2030030000500 2019/20
Estonia
010101000 2018/19
030303000 2019/20
Germany
-1-50-50-6000 2017/18
-8-200-20-7-340-10 2018/19
-8-100-10-10-200-80 2019/20
Foreign Agricultural Service/USDA 5 November 2019Office of Global Analysis
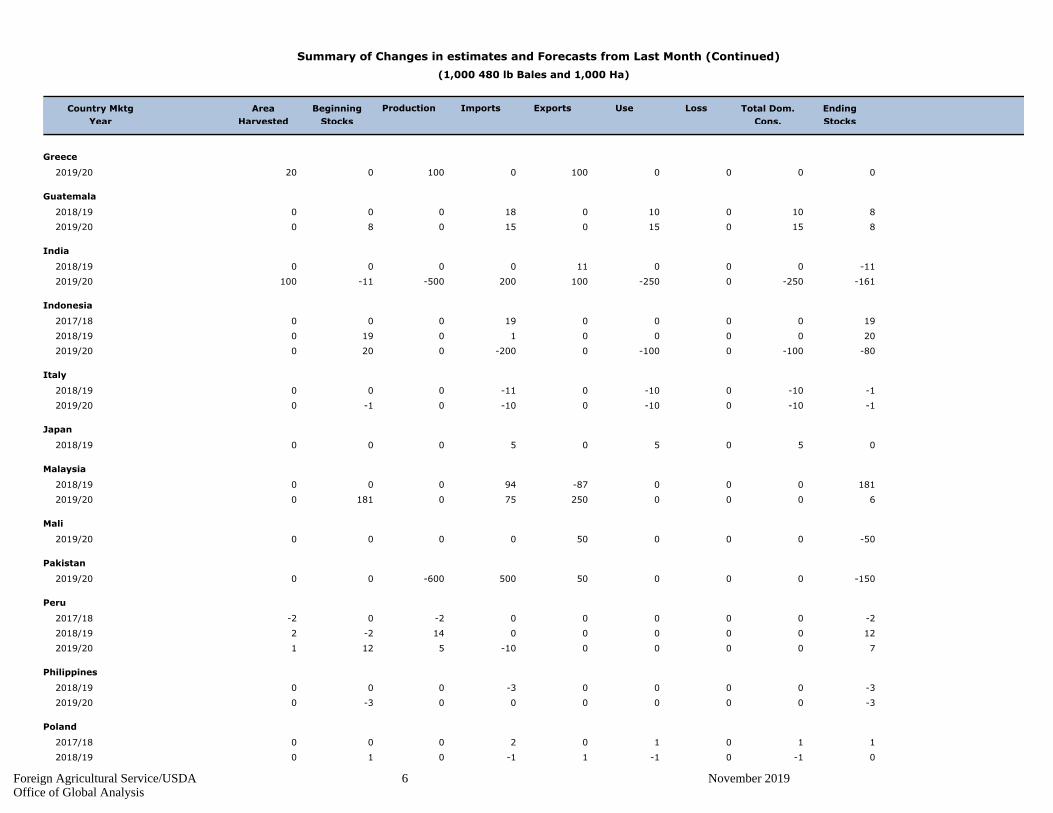
Summary of Changes in estimates and Forecasts from Last Month (Continued)
(1,000 480 lb Bales and 1,000 Ha)
Country Mktg
Year
Area
Harvested
Beginning
Stocks
Production Imports Exports Use Loss Total Dom.
Cons.
Ending
Stocks
Greece
00001000100020 2019/20
Guatemala
810010018000 2018/19
815015015080 2019/20
India
-11000110000 2018/19
-161-2500-250100200-500-11100 2019/20
Indonesia
19000019000 2017/18
20000010190 2018/19
-80-1000-1000-2000200 2019/20
Italy
-1-100-100-11000 2018/19
-1-100-100-100-10 2019/20
Japan
050505000 2018/19
Malaysia
181000-8794000 2018/19
60002507501810 2019/20
Mali
-50000500000 2019/20
Pakistan
-15000050500-60000 2019/20
Peru
-200000-20-2 2017/18
120000014-22 2018/19
70000-105121 2019/20
Philippines
-30000-3000 2018/19
-3000000-30 2019/20
Poland
110102000 2017/18
0-10-11-1010 2018/19
Foreign Agricultural Service/USDA 6 November 2019Office of Global Analysis
Summary of Changes in estimates and Forecasts from Last Month (Continued)
(1,000 480 lb Bales and 1,000 Ha)
Country Mktg
Year
Area
Harvested
Beginning
Stocks
Production Imports Exports Use Loss Total Dom.
Cons.
Ending
Stocks
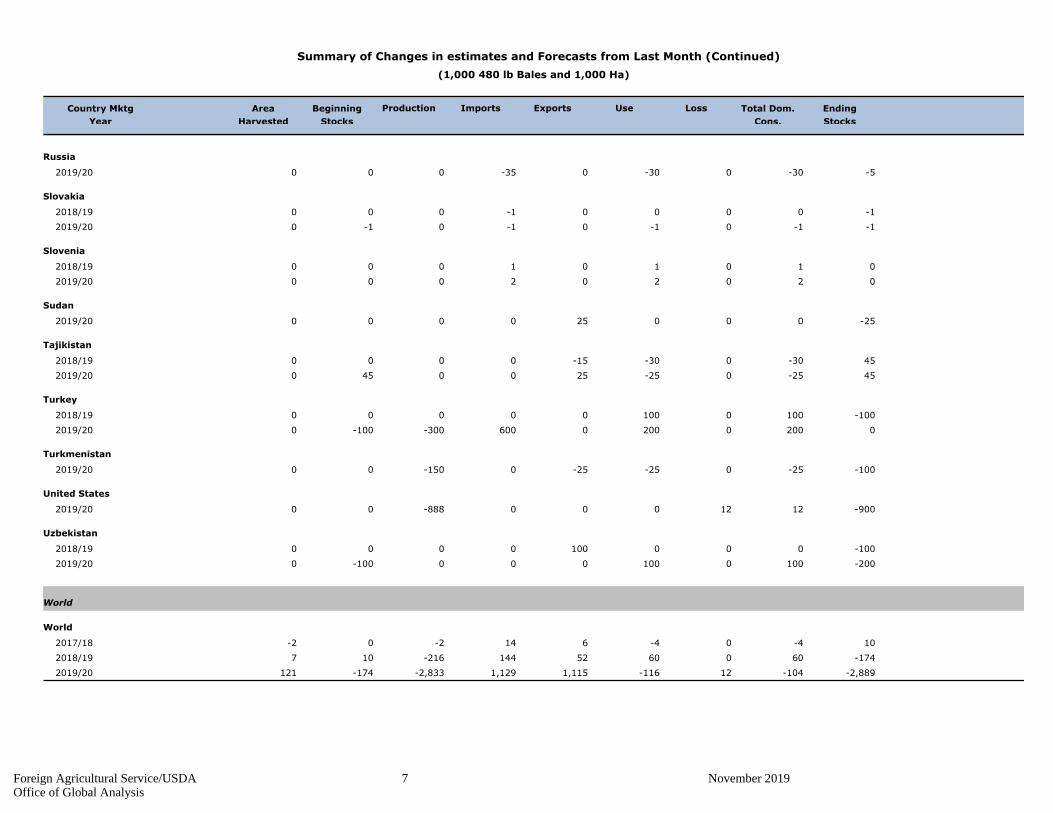
Russia
-5-300-300-35000 2019/20
Slovakia
-10000-1000 2018/19
-1-10-10-10-10 2019/20
Slovenia
010101000 2018/19
020202000 2019/20
Sudan
-25000250000 2019/20
Tajikistan
45-300-30-150000 2018/19
45-250-252500450 2019/20
Turkey
-100100010000000 2018/19
020002000600-300-1000 2019/20
Turkmenistan
-100-250-25-250-15000 2019/20
United States
-9001212000-88800 2019/20
Uzbekistan
-1000001000000 2018/19
-2001000100000-1000 2019/20
World
World
10-40-4614-20-2 2017/18
-1746006052144-216107 2018/19
-2,889-10412-1161,1151,129-2,833-174121 2019/20
Foreign Agricultural Service/USDA 7 November 2019Office of Global Analysis

Table 01 Cotton World Supply, Use, and Trade (Season Beginning August 1)
(1000 MT)
2015/16 2016/17 2017/18 2018/19
Oct
2019/20
Nov
2019/20
Production none
5,639 India 5,879 6,314 5,770 6,641 6,532
4,790 China 4,953 5,987 6,042 6,042 5,933
2,806 United States 3,738 4,555 3,999 4,726 4,532
1,289 Brazil 1,528 2,007 2,726 2,526 2,526
1,524 Pakistan 1,676 1,785 1,655 1,655 1,524
577 Turkey 697 871 806 893 827
827 Uzbekistan 811 840 713 653 653
3,484 Other 3,944 4,589 4,155 4,032 4,022
20,937 Total 23,227 26,951 25,865 27,166 26,549
USE Dom. Consumption none
7,838 China 8,382 8,927 8,600 8,600 8,600
5,389 India 5,302 5,258 5,225 5,389 5,334
2,243 Pakistan 2,243 2,373 2,330 2,330 2,330
1,372 Bangladesh 1,481 1,633 1,611 1,611 1,611
980 Vietnam 1,176 1,437 1,524 1,611 1,611
1,459 Turkey 1,426 1,622 1,502 1,502 1,546
675 Brazil 697 740 740 740 740
4,699 Other 4,589 4,738 4,657 4,694 4,680
24,654 Total 25,295 26,728 26,190 26,478 26,452
Imports none
959 China 1,096 1,243 2,099 2,068 2,068
1,002 Vietnam 1,197 1,524 1,502 1,633 1,633
1,388 Bangladesh 1,481 1,655 1,568 1,589 1,589
918 Turkey 801 876 762 697 827
718 Pakistan 533 740 621 675 784
640 Indonesia 738 766 664 718 675
233 India 596 365 392 348 392
1,858 Other 1,766 1,792 1,647 1,612 1,618
7,717 Total 8,208 8,962 9,254 9,341 9,587
Exports none
1,993 United States 3,248 3,544 3,214 3,592 3,592
939 Brazil 607 909 1,309 1,807 1,872
1,255 India 991 1,128 764 871 893
616 Australia 812 852 791 370 370
209 Greece 221 234 295 294 316
142 Benin 174 218 305 283 305
218 Mali 239 283 294 294 305
2,184 Other 1,948 1,848 2,015 1,832 1,933
7,555 Total 8,241 9,017 8,988 9,343 9,586
Ending Stocks none
12,345 China 9,998 8,272 7,766 7,238 7,129
1,534 India 1,716 2,009 2,180 2,912 2,877
1,243 Brazil 1,509 1,885 2,565 2,599 2,483
827 United States 599 914 1,056 1,524 1,328
569 Pakistan 504 616 543 527 494
330 Bangladesh 355 404 388 393 393
334 Turkey 333 387 347 380 380
2,446 Other 2,469 3,136 2,693 2,649 2,508
19,628 Total 17,481 17,623 17,539 18,222 17,593
Foreign Agricultural Service/USDA 8 November 2019Office of Global Analysis
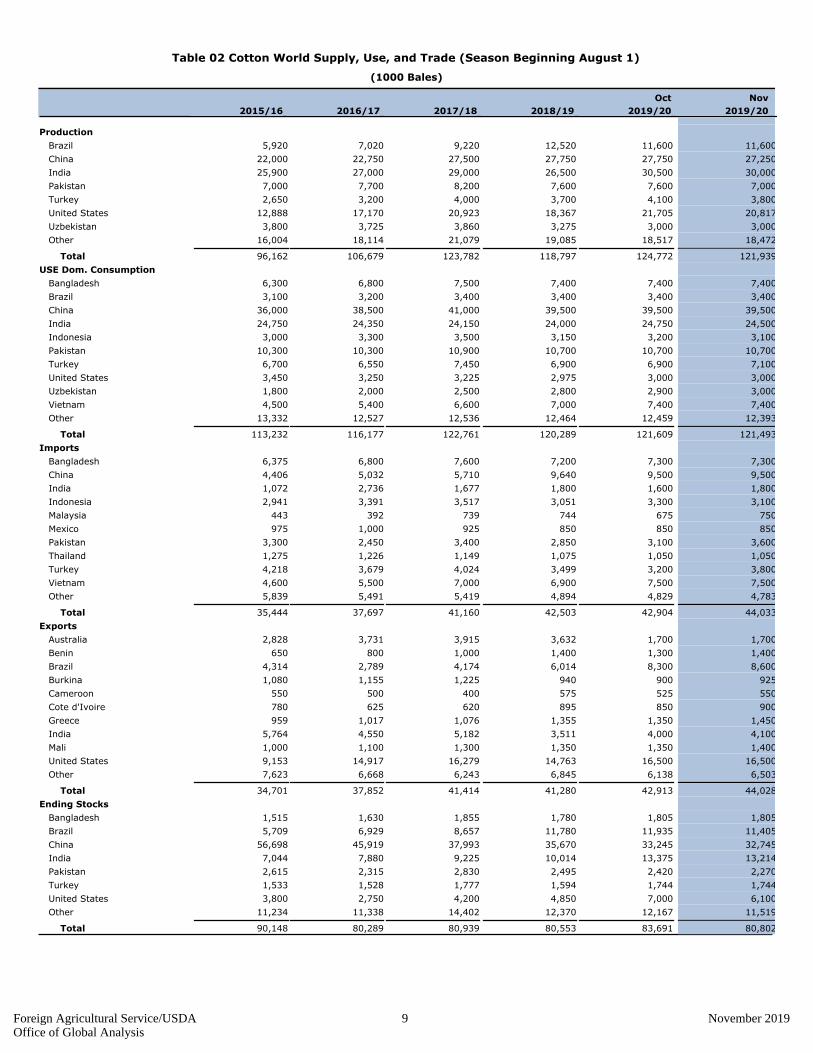
Table 02 Cotton World Supply, Use, and Trade (Season Beginning August 1)
(1000 Bales)
2015/16 2016/17 2017/18 2018/19
Oct
2019/20
Nov
2019/20
Production none
5,920 Brazil 7,020 9,220 12,520 11,600 11,600
22,000 China 22,750 27,500 27,750 27,750 27,250
25,900 India 27,000 29,000 26,500 30,500 30,000
7,000 Pakistan 7,700 8,200 7,600 7,600 7,000
2,650 Turkey 3,200 4,000 3,700 4,100 3,800
12,888 United States 17,170 20,923 18,367 21,705 20,817
3,800 Uzbekistan 3,725 3,860 3,275 3,000 3,000
16,004 Other 18,114 21,079 19,085 18,517 18,472
96,162 Total 106,679 123,782 118,797 124,772 121,939
USE Dom. Consumption none
6,300 Bangladesh 6,800 7,500 7,400 7,400 7,400
3,100 Brazil 3,200 3,400 3,400 3,400 3,400
36,000 China 38,500 41,000 39,500 39,500 39,500
24,750 India 24,350 24,150 24,000 24,750 24,500
3,000 Indonesia 3,300 3,500 3,150 3,200 3,100
10,300 Pakistan 10,300 10,900 10,700 10,700 10,700
6,700 Turkey 6,550 7,450 6,900 6,900 7,100
3,450 United States 3,250 3,225 2,975 3,000 3,000
1,800 Uzbekistan 2,000 2,500 2,800 2,900 3,000
4,500 Vietnam 5,400 6,600 7,000 7,400 7,400
13,332 Other 12,527 12,536 12,464 12,459 12,393
113,232 Total 116,177 122,761 120,289 121,609 121,493
Imports none
6,375 Bangladesh 6,800 7,600 7,200 7,300 7,300
4,406 China 5,032 5,710 9,640 9,500 9,500
1,072 India 2,736 1,677 1,800 1,600 1,800
2,941 Indonesia 3,391 3,517 3,051 3,300 3,100
443 Malaysia 392 739 744 675 750
975 Mexico 1,000 925 850 850 850
3,300 Pakistan 2,450 3,400 2,850 3,100 3,600
1,275 Thailand 1,226 1,149 1,075 1,050 1,050
4,218 Turkey 3,679 4,024 3,499 3,200 3,800
4,600 Vietnam 5,500 7,000 6,900 7,500 7,500
5,839 Other 5,491 5,419 4,894 4,829 4,783
35,444 Total 37,697 41,160 42,503 42,904 44,033
Exports none
2,828 Australia 3,731 3,915 3,632 1,700 1,700
650 Benin 800 1,000 1,400 1,300 1,400
4,314 Brazil 2,789 4,174 6,014 8,300 8,600
1,080 Burkina 1,155 1,225 940 900 925
550 Cameroon 500 400 575 525 550
780 Cote d'Ivoire 625 620 895 850 900
959 Greece 1,017 1,076 1,355 1,350 1,450
5,764 India 4,550 5,182 3,511 4,000 4,100
1,000 Mali 1,100 1,300 1,350 1,350 1,400
9,153 United States 14,917 16,279 14,763 16,500 16,500
7,623 Other 6,668 6,243 6,845 6,138 6,503
34,701 Total 37,852 41,414 41,280 42,913 44,028
Ending Stocks none
1,515 Bangladesh 1,630 1,855 1,780 1,805 1,805
5,709 Brazil 6,929 8,657 11,780 11,935 11,405
56,698 China 45,919 37,993 35,670 33,245 32,745
7,044 India 7,880 9,225 10,014 13,375 13,214
2,615 Pakistan 2,315 2,830 2,495 2,420 2,270
1,533 Turkey 1,528 1,777 1,594 1,744 1,744
3,800 United States 2,750 4,200 4,850 7,000 6,100
11,234 Other 11,338 14,402 12,370 12,167 11,519
90,148 Total 80,289 80,939 80,553 83,691 80,802
Foreign Agricultural Service/USDA 9 November 2019Office of Global Analysis

Table 04 Cotton Area, Yield, and Production
From last month From last year
MBalesPercent
Yield
(Kilograms per hectare)
Nov 2017/18 MBales
Country / Region
Area
(Million hectares)
Production
(Million 480 lb. bales)
Change in Production
2017/18
Prel.
2018/19 Oct Oct
Prel.
2018/19 Nov
Prel.
2018/19 Oct Nov Percent
2019/20 Proj.2019/20 Proj. 2019/20 Proj.
2017/18
33.73World 2.643.14-2.27-2.83121.9433.54 34.78 34.90 799 771 781 761 123.78 118.80 124.77
4.49United States 13.342.45-4.09-0.8920.824.13 5.06 5.06 1,014 968 934 895 20.92 18.37 21.71
29.23Total Foreign 0.690.69-1.89-1.95101.1229.41 29.72 29.84 766 744 755 738 102.86 100.43 103.07
none
Western Hemisphere
1.18 Brazil -7.35-0.920.000.0011.601.62 1.50 1.50 1,708 1,683 1,684 1,684 9.22 12.52 11.60
0.21 Mexico -8.93-0.160.000.001.580.24 0.23 0.23 1,617 1,555 1,529 1,529 1.56 1.74 1.58
0.32 Argentina -10.71-0.120.000.001.000.38 0.36 0.36 558 642 605 605 0.82 1.12 1.00
0.01 Paraguay 0.000.000.000.000.020.01 0.01 0.01 416 416 416 416 0.02 0.02 0.02
0.02 Peru -9.57-0.016.250.010.090.02 0.02 0.02 1,118 1,077 1,025 1,028 0.08 0.09 0.08
0.01 Colombia 16.670.010.000.000.070.01 0.02 0.02 968 1,306 1,016 1,016 0.04 0.06 0.07
Africa
0.85 Burkina 11.760.100.000.000.950.63 0.60 0.60 307 294 345 345 1.20 0.85 0.95
0.71 Mali 17.320.220.000.001.490.73 0.78 0.78 432 381 419 419 1.40 1.27 1.49
0.33 Cote d'Ivoire 2.860.030.000.000.900.39 0.43 0.43 536 486 461 461 0.81 0.88 0.90
0.23 Cameroon -5.83-0.040.000.000.570.25 0.25 0.25 484 523 492 492 0.50 0.60 0.57
0.53 Benin 3.570.050.000.001.450.65 0.68 0.68 468 469 468 468 1.14 1.40 1.45
0.12 Chad 400.000.160.000.000.200.06 0.22 0.22 181 145 198 198 0.10 0.04 0.20
0.16 Togo 3.920.010.000.000.270.18 0.19 0.19 299 308 312 312 0.22 0.26 0.27
0.02 Senegal -13.790.000.000.000.030.02 0.02 0.02 359 301 320 320 0.03 0.03 0.03
0.09 Egypt -30.00-0.150.000.000.350.14 0.10 0.10 718 772 762 762 0.30 0.50 0.35
0.20 Zimbabwe -5.00-0.010.000.000.190.20 0.20 0.20 294 218 207 207 0.27 0.20 0.19
0.27 Nigeria 0.000.000.000.000.240.27 0.27 0.27 190 190 190 190 0.24 0.24 0.24
Asia Oceania
3.40 China -1.80-0.50-1.80-0.5027.253.50 3.45 3.45 1,761 1,726 1,751 1,720 27.50 27.75 27.75
12.60 India 13.213.50-1.64-0.5030.0012.60 12.90 13.00 501 458 515 502 29.00 26.50 30.50
2.70 Pakistan -7.89-0.60-7.89-0.607.002.30 2.50 2.50 661 719 662 610 8.20 7.60 7.60
0.13 Kazakhstan -13.04-0.050.000.000.300.13 0.12 0.12 523 587 558 558 0.30 0.35 0.30
0.19 Tajikistan 6.020.030.000.000.440.18 0.18 0.18 671 502 532 532 0.57 0.42 0.44
0.55 Turkmenistan 9.890.09-13.04-0.151.000.55 0.55 0.55 535 364 459 399 1.34 0.91 1.15
1.25 Uzbekistan -8.40-0.280.000.003.001.10 1.05 1.05 672 648 622 622 3.86 3.28 3.00
0.47 Turkey 2.700.10-7.32-0.303.800.52 0.56 0.56 1,853 1,549 1,594 1,477 4.00 3.70 4.10
0.53 Australia -45.45-1.000.000.001.200.38 0.17 0.17 1,972 1,261 1,537 1,537 4.80 2.20 1.20
0.03 Syria 0.000.000.000.000.140.03 0.03 0.03 1,161 1,219 1,219 1,219 0.16 0.14 0.14
0.25 Burma 0.000.000.000.000.700.24 0.24 0.24 634 635 635 635 0.73 0.70 0.70
Europe
0.23 Greece 9.930.146.900.101.550.25 0.25 0.27 1,157 1,253 1,263 1,250 1.22 1.41 1.45
1.68Others 2.310.090.000.003.771.84 1.89 1.89 420 435 434 434 3.24 3.68 3.77
Note: Yeild for Total Foreign and Others is an incorrect calculation.
Foreign Agricultural Service/USDA 10 November 2019Office of Global Analysis
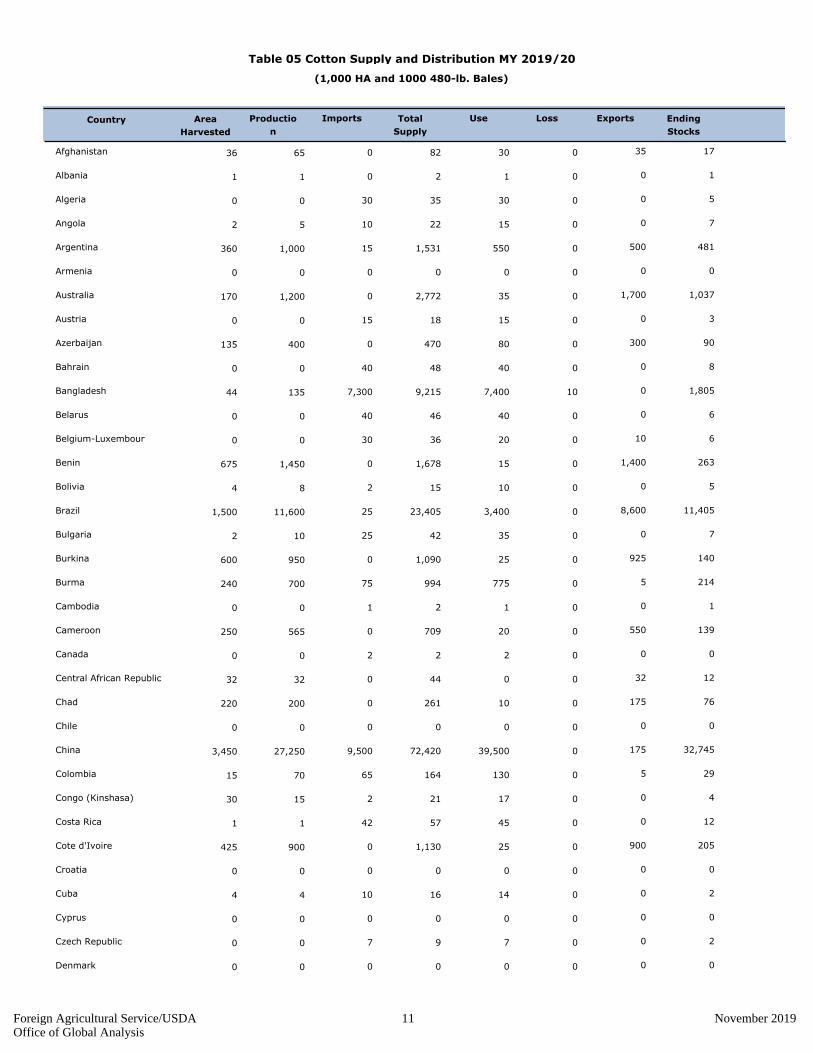
(1,000 HA and 1000 480-lb. Bales)
Table 05 Cotton Supply and Distribution MY 2019/20
Area
Harvested
Ending
Stocks
ExportsLossUseTotal
Supply
ImportsProductio
n
Country
0 35030826536 Afghanistan 17
0 001211 Albania 1
30 00303500 Algeria 5
10 00152252 Angola 7
15 50005501,5311,000360 Argentina 481
0 000000 Armenia 0
0 1,7000352,7721,200170 Australia 1,037
15 00151800 Austria 3
0 300080470400135 Azerbaijan 90
40 00404800 Bahrain 8
7,300 0107,4009,21513544 Bangladesh 1,805
40 00404600 Belarus 6
30 100203600 Belgium-Luxembour 6
0 1,4000151,6781,450675 Benin 263
2 00101584 Bolivia 5
25 8,60003,40023,40511,6001,500 Brazil 11,405
25 003542102 Bulgaria 7
0 9250251,090950600 Burkina 140
75 50775994700240 Burma 214
1 001200 Cambodia 1
0 550020709565250 Cameroon 139
2 002200 Canada 0
0 3200443232 Central African Republic 12
0 175010261200220 Chad 76
0 000000 Chile 0
9,500 175039,50072,42027,2503,450 China 32,745
65 501301647015 Colombia 29
2 0017211530 Congo (Kinshasa) 4
42 00455711 Costa Rica 12
0 9000251,130900425 Cote d'Ivoire 205
0 000000 Croatia 0
10 00141644 Cuba 2
0 000000 Cyprus 0
7 007900 Czech Republic 2
0 000000 Denmark 0
Foreign Agricultural Service/USDA 11 November 2019Office of Global Analysis
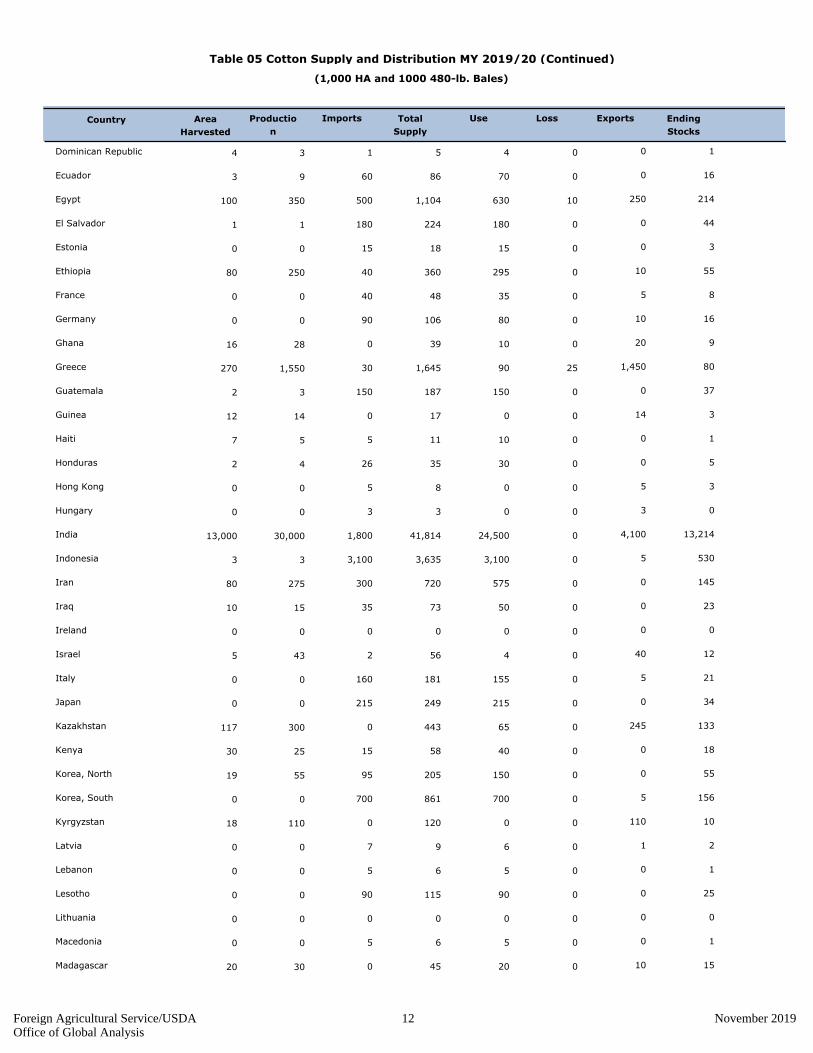
(1,000 HA and 1000 480-lb. Bales)
Table 05 Cotton Supply and Distribution MY 2019/20 (Continued)
Area
Harvested
Ending
Stocks
ExportsLossUseTotal
Supply
ImportsProductio
n
Country
1 004534 Dominican Republic 1
60 00708693 Ecuador 16
500 250106301,104350100 Egypt 214
180 0018022411 El Salvador 44
15 00151800 Estonia 3
40 10029536025080 Ethiopia 55
40 50354800 France 8
90 1008010600 Germany 16
0 20010392816 Ghana 9
30 1,45025901,6451,550270 Greece 80
150 0015018732 Guatemala 37
0 1400171412 Guinea 3
5 00101157 Haiti 1
26 00303542 Honduras 5
5 500800 Hong Kong 3
3 300300 Hungary 0
1,800 4,100024,50041,81430,00013,000 India 13,214
3,100 503,1003,63533 Indonesia 530
300 0057572027580 Iran 145
35 0050731510 Iraq 23
0 000000 Ireland 0
2 400456435 Israel 12
160 5015518100 Italy 21
215 0021524900 Japan 34
0 245065443300117 Kazakhstan 133
15 0040582530 Kenya 18
95 001502055519 Korea, North 55
700 5070086100 Korea, South 156
0 1100012011018 Kyrgyzstan 10
7 106900 Latvia 2
5 005600 Lebanon 1
90 009011500 Lesotho 25
0 000000 Lithuania 0
5 005600 Macedonia 1
0 10020453020 Madagascar 15
Foreign Agricultural Service/USDA 12 November 2019Office of Global Analysis

(1,000 HA and 1000 480-lb. Bales)
Table 05 Cotton Supply and Distribution MY 2019/20 (Continued)
Area
Harvested
Ending
Stocks
ExportsLossUseTotal
Supply
ImportsProductio
n
Country
0 75051499080 Malawi 69
750 55003751,29600 Malaysia 371
0 1,4000251,9611,490775 Mali 536
120 0012014100 Mauritius 21
850 450252,0003,1951,580225 Mexico 720
70 00658200 Moldova 17
35 00354311 Morocco 8
0 11005200115125 Mozambique 85
15 00151700 Netherlands 2
0 90112104 Nicaragua 2
0 6031495 Niger 5
10 300200314235270 Nigeria 84
3,600 1002510,70013,0957,0002,500 Pakistan 2,270
0 000000 Panama 0
8 15014362111 Paraguay 7
220 503003928518 Peru 87
65 00657821 Philippines 13
17 00172000 Poland 3
170 0017021100 Portugal 41
1 001200 Romania 1
100 0011012900 Russia 19
0 2500302517 Senegal 5
8 0081000 Serbia 2
3 500600 Singapore 1
1 001100 Slovakia 0
8 0081000 Slovenia 2
3 001011712 Somalia 1
50 16009049121545 South Africa 241
15 27502035830065 Spain 63
5 00101255 Sri Lanka 2
0 500075739600200 Sudan 164
0 000000 Sweden 0
2 002300 Switzerland 1
0 5006516414025 Syria 49
600 0060074400 Taiwan 144
Foreign Agricultural Service/USDA 13 November 2019Office of Global Analysis

(1,000 HA and 1000 480-lb. Bales)
Table 05 Cotton Supply and Distribution MY 2019/20 (Continued)
Area
Harvested
Ending
Stocks
ExportsLossUseTotal
Supply
ImportsProductio
n
Country
0 375070746440180 Tajikistan 301
0 2000175700400500 Tanzania 325
1,050 0251,0251,22921 Thailand 179
0 250015342265185 Togo 77
20 003035102 Tunisia 5
3,800 35007,1009,1943,800560 Turkey 1,744
0 25008251,6291,000545 Turkmenistan 554
0 11001522512575 Uganda 100
5 005600 Ukraine 1
2 002300 United Kingdom 1
5 16,500723,00025,67220,8175,062 United States 6,100
0 000000 Uruguay 0
0 25003,0004,3083,0001,050 Uzbekistan 1,058
15 00901208515 Venezuela 30
7,500 007,4008,69131 Vietnam 1,291
0 3025342818 Yemen 6
0 20005448210130 Zambia 243
0 1751030349190200 Zimbabwe 134
World
44,033 44,028202121,493246,525121,93934,903 World 80,802
Foreign Agricultural Service/USDA 14 November 2019Office of Global Analysis

(1000 MT and 1000 HA)
Table 05A Cotton Supply and Distribution MY 2019/20
Area
Harvested
Ending
Stocks
ExportsLossUseTotal
Supply
ImportsProductio
n
Country
0 807181436 Afghanistan 4
0 000001 Albania 0
7 007800 Algeria 1
2 003512 Angola 2
3 1090120333218360 Argentina 105
0 000000 Armenia 0
0 37008604261170 Australia 226
3 003400 Austria 1
0 6501710287135 Azerbaijan 20
9 0091000 Bahrain 2
1,589 021,6112,0062944 Bangladesh 393
9 0091000 Belarus 1
7 204800 Belgium-Luxembour 1
0 30503365316675 Benin 57
0 002324 Bolivia 1
5 1,87207405,0962,5261,500 Brazil 2,483
5 008922 Bulgaria 2
0 20105237207600 Burkina 30
16 10169216152240 Burma 47
0 000000 Cambodia 0
0 12004154123250 Cameroon 30
0 000000 Canada 0
0 70010732 Central African Republic 3
0 38025744220 Chad 17
0 000000 Chile 0
2,068 3808,60015,7685,9333,450 China 7,129
14 1028361515 Colombia 6
0 0045330 Congo (Kinshasa) 1
9 00101201 Costa Rica 3
0 19605246196425 Cote d'Ivoire 45
0 000000 Croatia 0
2 003314 Cuba 0
0 000000 Cyprus 0
2 002200 Czech Republic 0
0 000000 Denmark 0
Foreign Agricultural Service/USDA 15 November 2019Office of Global Analysis
(1000 MT and 1000 HA)
Table 05A Cotton Supply and Distribution MY 2019/20 (Continued)
Area
Harvested
Ending
Stocks
ExportsLossUseTotal
Supply
ImportsProductio
n
Country
0 001114 Dominican Republic 0
13 00151923 Ecuador 3
109 54213724076100 Egypt 47
39 00394901 El Salvador 10
3 003400 Estonia 1
9 2064785480 Ethiopia 12
9 1081000 France 2
20 20172300 Germany 3
0 4028616 Ghana 2
7 316520358337270 Greece 17
33 00334112 Guatemala 8
0 3004312 Guinea 1
1 002217 Haiti 0
6 007812 Honduras 1
1 100200 Hong Kong 1
1 100100 Hungary 0
392 89305,3349,1046,53213,000 India 2,877
675 1067579113 Indonesia 115
65 001251576080 Iran 32
8 001116310 Iraq 5
0 000000 Ireland 0
0 9011295 Israel 3
35 10343900 Italy 5
47 00475400 Japan 7
0 530149665117 Kazakhstan 29
3 00913530 Kenya 4
21 0033451219 Korea, North 12
152 1015218700 Korea, South 34
0 2400262418 Kyrgyzstan 2
2 001200 Latvia 0
1 001100 Lebanon 0
20 00202500 Lesotho 5
0 000000 Lithuania 0
1 001100 Macedonia 0
0 20410720 Madagascar 3
Foreign Agricultural Service/USDA 16 November 2019Office of Global Analysis

(1000 MT and 1000 HA)
Table 05A Cotton Supply and Distribution MY 2019/20 (Continued)
Area
Harvested
Ending
Stocks
ExportsLossUseTotal
Supply
ImportsProductio
n
Country
0 1601322080 Malawi 15
163 12008228200 Malaysia 81
0 30505427324775 Mali 117
26 00263100 Mauritius 5
185 985435696344225 Mexico 157
15 00141800 Moldova 4
8 008901 Morocco 2
0 24014425125 Mozambique 19
3 003400 Netherlands 0
0 200324 Nicaragua 0
0 101325 Niger 1
2 70446851270 Nigeria 18
784 2252,3302,8511,5242,500 Pakistan 494
0 000000 Panama 0
2 3038511 Paraguay 2
48 1065851918 Peru 19
14 00141701 Philippines 3
4 004400 Poland 1
37 00374600 Portugal 9
0 000000 Romania 0
22 00242800 Russia 4
0 5007517 Senegal 1
2 002200 Serbia 0
1 100100 Singapore 0
0 000000 Slovakia 0
2 002200 Slovenia 0
1 0022212 Somalia 0
11 350201074745 South Africa 52
3 6004786565 Spain 14
1 002315 Sri Lanka 0
0 109016161131200 Sudan 36
0 000000 Sweden 0
0 000100 Switzerland 0
0 11014363025 Syria 11
131 0013116200 Taiwan 31
Foreign Agricultural Service/USDA 17 November 2019Office of Global Analysis
(1000 MT and 1000 HA)
Table 05A Cotton Supply and Distribution MY 2019/20 (Continued)
Area
Harvested
Ending
Stocks
ExportsLossUseTotal
Supply
ImportsProductio
n
Country
0 8201516296180 Tajikistan 66
0 4403815287500 Tanzania 71
229 0522326801 Thailand 39
0 54037458185 Togo 17
4 007822 Tunisia 1
827 7601,5462,002827560 Turkey 380
0 540180355218545 Turkmenistan 121
0 2403492775 Uganda 22
1 001100 Ukraine 0
0 000100 United Kingdom 0
1 3,592166535,5894,5325,062 United States 1,328
0 000000 Uruguay 0
0 5406539386531,050 Uzbekistan 230
3 0020261915 Venezuela 7
1,633 001,6111,89211 Vietnam 281
0 1057618 Yemen 1
0 44019846130 Zambia 53
0 38277641200 Zimbabwe 29
World
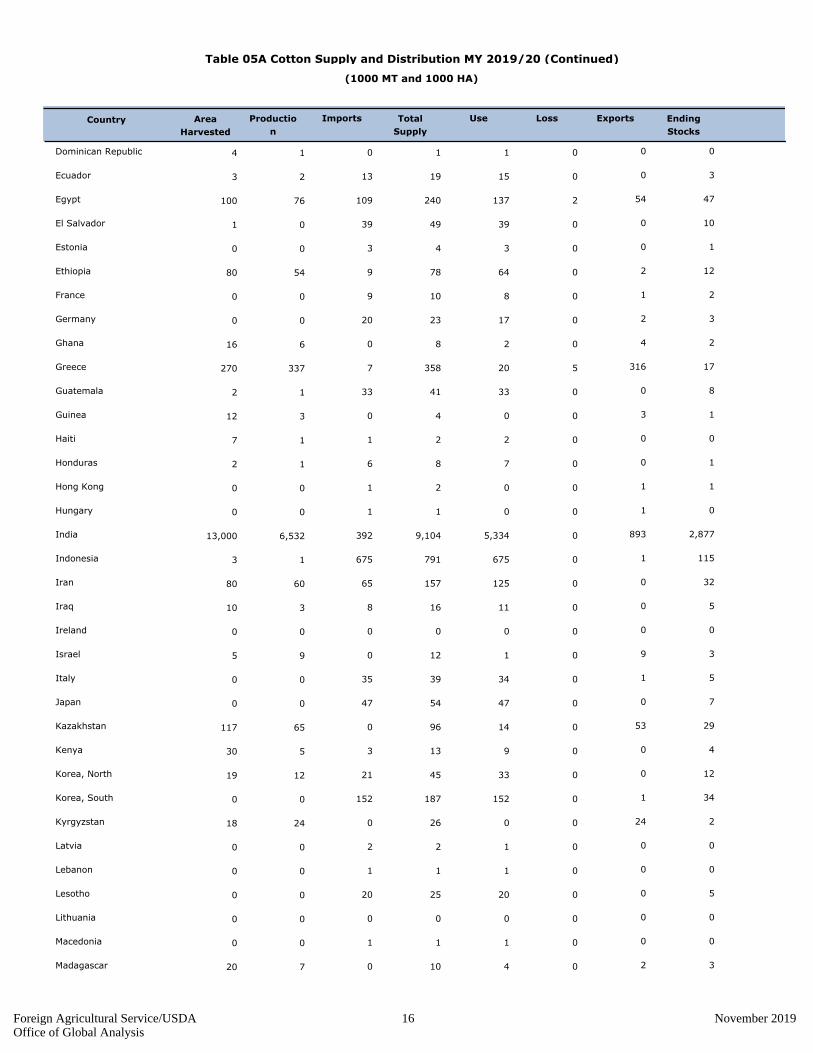
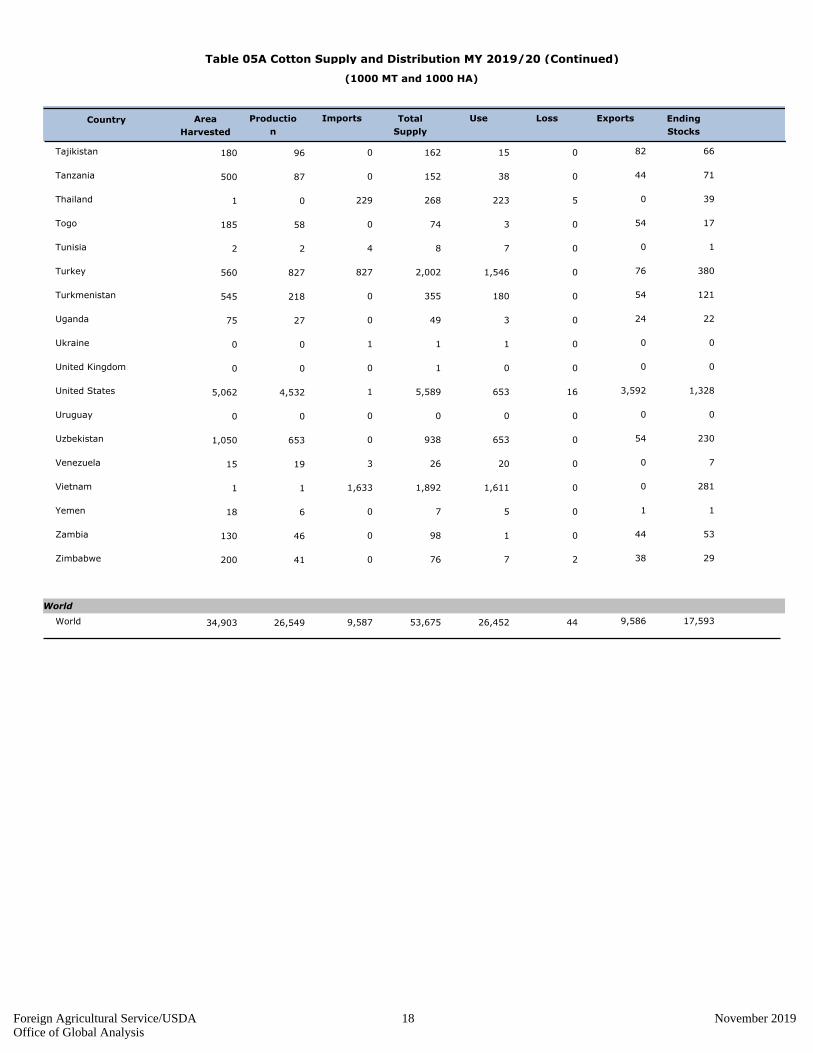
9,587 9,5864426,45253,67526,54934,903 World 17,593
Foreign Agricultural Service/USDA 18 November 2019Office of Global Analysis

(1,000 HA and 1000 480-lb. Bales)
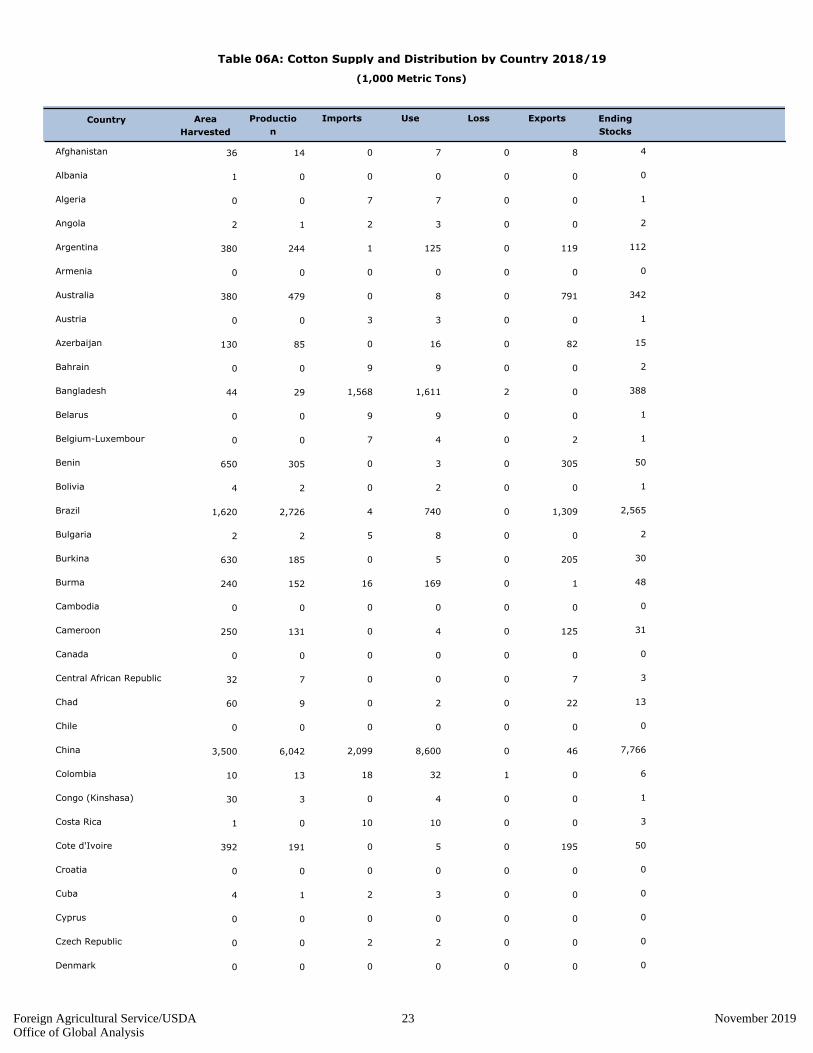
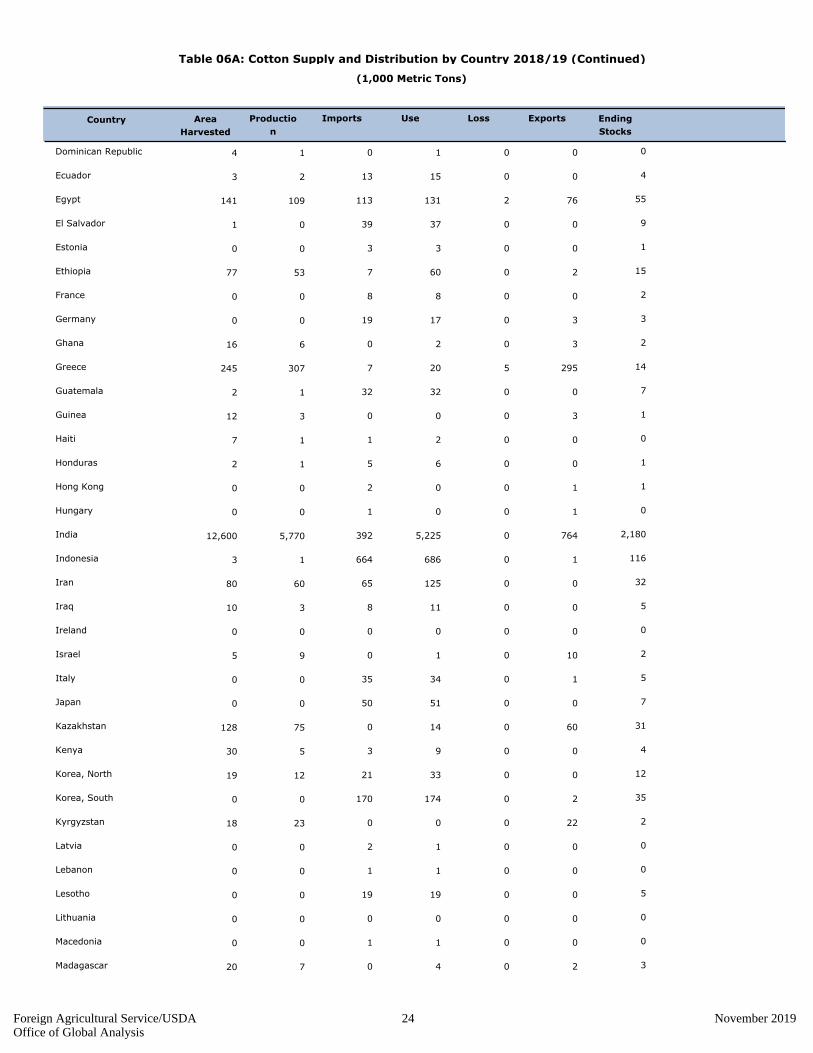
Table 06: Cotton Supply and Distribution by Country 2018/19
Area
Harvested
Ending
Stocks
ExportsLossUseTotal
Supply
ImportsProductio
n
Country
0 35030826536 Afghanistan 17
0 001211 Albania 1
30 00303500 Algeria 5
10 00152252 Angola 7
5 54505751,6361,120380 Argentina 516
0 000000 Armenia 0
0 3,6320355,2392,200380 Australia 1,572
15 10141800 Austria 3
0 375075520390130 Azerbaijan 70
40 00404800 Bahrain 8
7,200 0107,4009,19013544 Bangladesh 1,780
42 00404600 Belarus 6
30 100203600 Belgium-Luxembour 6
0 1,4000151,6431,400650 Benin 228
2 00101584 Bolivia 5
17 6,01403,40021,19412,5201,620 Brazil 11,780
25 003643102 Bulgaria 7
0 9400251,105850630 Burkina 140
75 50775999700240 Burma 219
1 001200 Cambodia 1
0 575020739600250 Cameroon 144
2 002200 Canada 0
0 3200443232 Central African Republic 12
0 1000101714060 Chad 61
0 000000 Chile 0
9,640 213039,50075,38327,7503,500 China 35,670
84 051451796010 Colombia 29
2 0017211530 Congo (Kinshasa) 4
45 00455911 Costa Rica 14
0 8950251,150875392 Cote d'Ivoire 230
0 000000 Croatia 0
10 00141644 Cuba 2
0 000000 Cyprus 0
7 007900 Czech Republic 2
0 000000 Denmark 0
Foreign Agricultural Service/USDA 19 November 2019Office of Global Analysis

(1,000 HA and 1000 480-lb. Bales)
Table 06: Cotton Supply and Distribution by Country 2018/19 (Continued)
Area
Harvested
Ending
Stocks
ExportsLossUseTotal
Supply
ImportsProductio
n
Country
1 004534 Dominican Republic 1
60 00708793 Ecuador 17
520 350106001,214500141 Egypt 254
177 0017021311 El Salvador 43
14 00131600 Estonia 3
30 8027535324377 Ethiopia 70
36 20374700 France 8
86 1308010900 Germany 16
0 15010362816 Ghana 11
31 1,35525901,5351,410245 Greece 65
148 0014517932 Guatemala 34
0 1400171412 Guinea 3
5 00101157 Haiti 1
25 00293442 Honduras 5
7 500800 Hong Kong 3
3 300300 Hungary 0
1,800 3,511024,00037,52526,50012,600 India 10,014
3,051 603,1503,68833 Indonesia 532
300 0057572027580 Iran 145
35 0050731510 Iraq 23
0 000000 Ireland 0
2 450460425 Israel 11
159 5015518100 Italy 21
230 0023526900 Japan 34
0 275065483345128 Kazakhstan 143
15 0040582530 Kenya 18
95 001502055519 Korea, North 55
781 7080096800 Korea, South 161
0 1000011010518 Kyrgyzstan 10
7 106900 Latvia 2
5 005600 Lebanon 1
85 008511000 Lesotho 25
0 000000 Lithuania 0
5 005600 Macedonia 1
0 10020453020 Madagascar 15
Foreign Agricultural Service/USDA 20 November 2019Office of Global Analysis
(1,000 HA and 1000 480-lb. Bales)
Table 06: Cotton Supply and Distribution by Country 2018/19 (Continued)
Area
Harvested
Ending
Stocks
ExportsLossUseTotal
Supply
ImportsProductio
n
Country
0 70051349070 Malawi 59
744 31303501,20900 Malaysia 546
0 1,3500251,8461,270725 Mali 471
120 0012014100 Mauritius 21
850 500251,9503,2401,735243 Mexico 765
60 00607200 Moldova 12
29 00354211 Morocco 7
0 11005200130125 Mozambique 85
16 00151700 Netherlands 2
0 90112104 Nicaragua 2
0 6031495 Niger 5
10 300200299235270 Nigeria 69
2,850 602510,70013,2807,6002,300 Pakistan 2,495
0 000000 Panama 0
2 11014322111 Paraguay 7
214 203003899419 Peru 87
62 00657621 Philippines 11
16 10162000 Poland 3
174 4017021500 Portugal 41
1 001200 Romania 1
150 2016019100 Russia 29
0 2502322921 Senegal 5
8 0081000 Serbia 2
2 100400 Singapore 3
1 001100 Slovakia 0
7 007900 Slovenia 2
3 001011712 Somalia 1
68 13808945322844 South Africa 226
10 32202038530065 Spain 43
3 00101255 Sri Lanka 2
0 425075639500180 Sudan 139
0 000000 Sweden 0
2 002300 Switzerland 1
0 9006517914025 Syria 24
592 0060074400 Taiwan 144
Foreign Agricultural Service/USDA 21 November 2019Office of Global Analysis
(1,000 HA and 1000 480-lb. Bales)
Table 06: Cotton Supply and Distribution by Country 2018/19 (Continued)
Area
Harvested
Ending
Stocks
ExportsLossUseTotal
Supply
ImportsProductio
n
Country
0 350055711415180 Tajikistan 306
0 2000175675425500 Tanzania 300
1,075 1251,0751,27821 Thailand 177
0 225015317255180 Togo 77
20 003035102 Tunisia 5
3,499 48206,9008,9763,700520 Turkey 1,594
0 15008001,579910545 Turkmenistan 629
0 11001522512075 Uganda 100
3 003400 Ukraine 1
2 002300 United Kingdom 1
3 14,763-182,97522,57018,3674,130 United States 4,850
0 000000 Uruguay 0
0 70002,8004,8083,2751,100 Uzbekistan 1,308
12 001001208515 Venezuela 20
6,900 007,0008,18831 Vietnam 1,188
0 2025332818 Yemen 6
0 15605399200125 Zambia 238
0 1751030374200200 Zimbabwe 159
World
42,503 41,280117120,289242,239118,79733,539 World 80,553
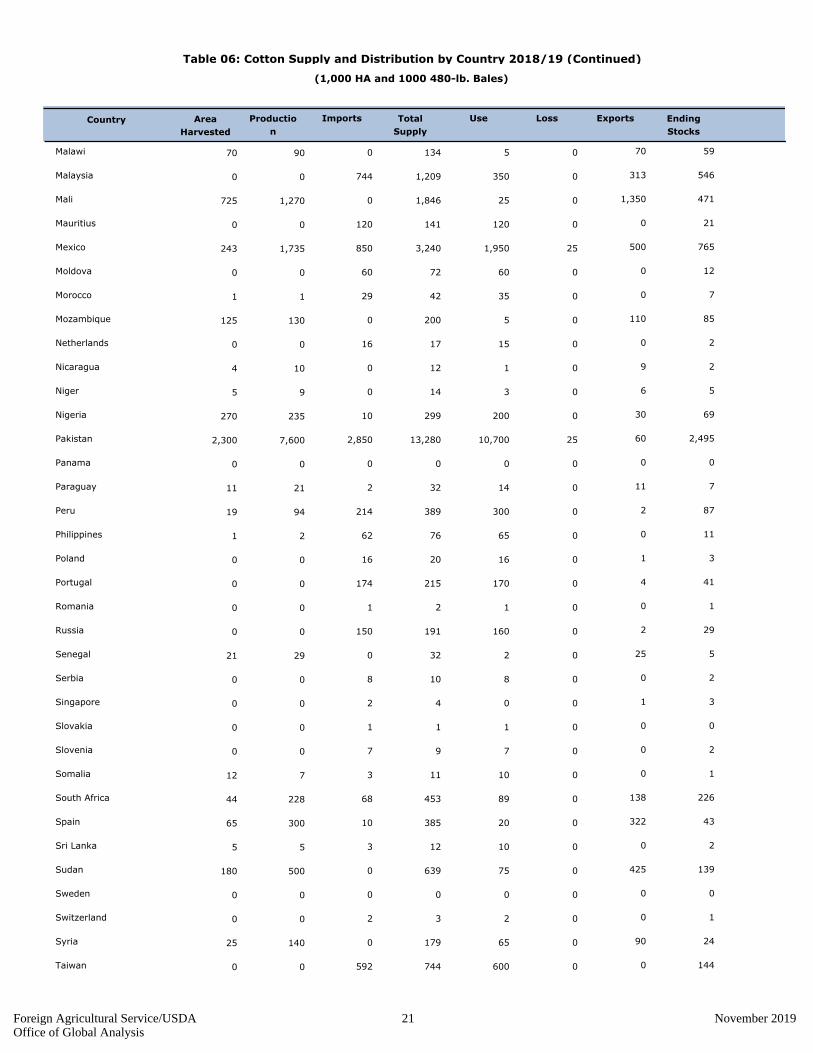
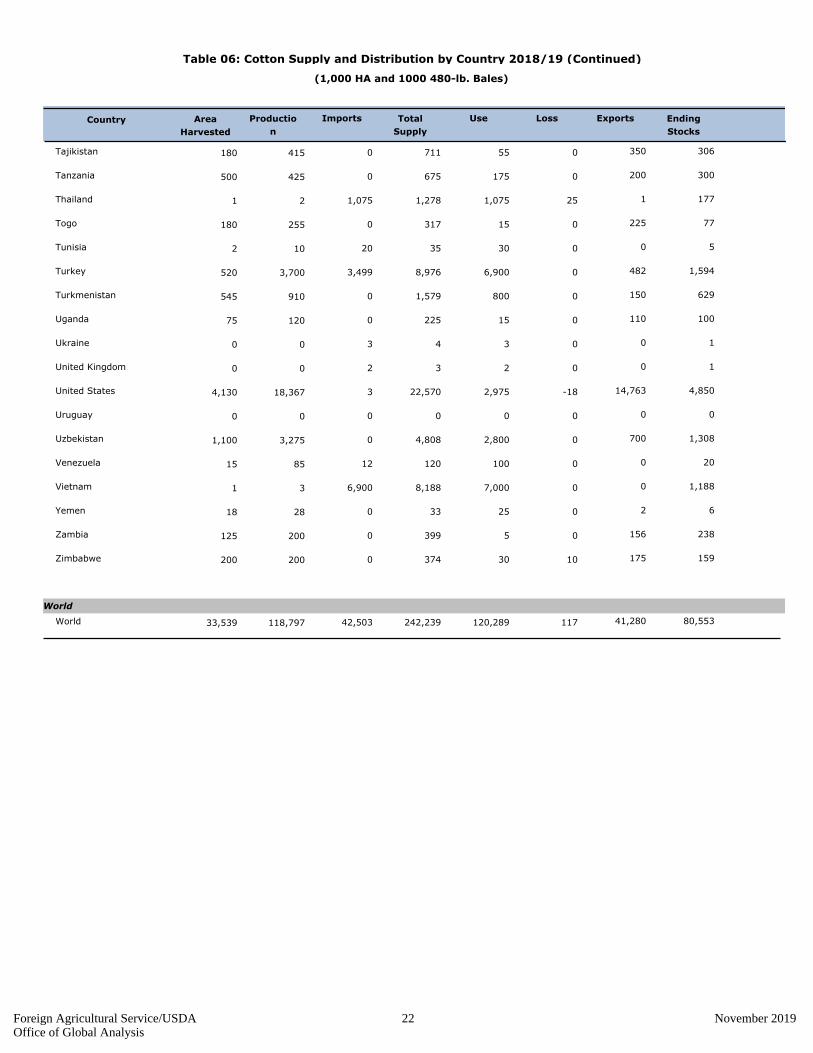
Foreign Agricultural Service/USDA 22 November 2019Office of Global Analysis
(1,000 Metric Tons)
Table 06A: Cotton Supply and Distribution by Country 2018/19
Area
Harvested
Ending
Stocks
ExportsLossUseImportsProductio
n
Country
0 48071436 Afghanistan
0 000001 Albania
7 100700 Algeria
2 200312 Angola
1 1121190125244380 Argentina
0 000000 Armenia
0 34279108479380 Australia
3 100300 Austria
0 158201685130 Azerbaijan
9 200900 Bahrain
1,568 388021,6112944 Bangladesh
9 100900 Belarus
7 120400 Belgium-Luxembour
0 5030503305650 Benin
0 100224 Bolivia
4 2,5651,30907402,7261,620 Brazil
5 200822 Bulgaria
0 3020505185630 Burkina
16 4810169152240 Burma
0 000000 Cambodia
0 3112504131250 Cameroon
0 000000 Canada
0 3700732 Central African Republic
0 132202960 Chad
0 000000 Chile
2,099 7,7664608,6006,0423,500 China
18 601321310 Colombia
0 1004330 Congo (Kinshasa)
10 3001001 Costa Rica
0 5019505191392 Cote d'Ivoire
0 000000 Croatia
2 000314 Cuba
0 000000 Cyprus
2 000200 Czech Republic
0 000000 Denmark
Foreign Agricultural Service/USDA 23 November 2019Office of Global Analysis
(1,000 Metric Tons)
Table 06A: Cotton Supply and Distribution by Country 2018/19 (Continued)
Area
Harvested
Ending
Stocks
ExportsLossUseImportsProductio
n
Country
0 000114 Dominican Republic
13 4001523 Ecuador
113 55762131109141 Egypt
39 9003701 El Salvador
3 100300 Estonia
7 1520605377 Ethiopia
8 200800 France
19 3301700 Germany
0 2302616 Ghana
7 14295520307245 Greece
32 7003212 Guatemala
0 1300312 Guinea
1 000217 Haiti
5 100612 Honduras
2 110000 Hong Kong
1 010000 Hungary
392 2,18076405,2255,77012,600 India
664 1161068613 Indonesia
65 32001256080 Iran
8 50011310 Iraq
0 000000 Ireland
0 2100195 Israel
35 5103400 Italy
50 7005100 Japan
0 316001475128 Kazakhstan
3 4009530 Kenya
21 1200331219 Korea, North
170 352017400 Korea, South
0 222002318 Kyrgyzstan
2 000100 Latvia
1 000100 Lebanon
19 5001900 Lesotho
0 000000 Lithuania
1 000100 Macedonia
0 3204720 Madagascar
Foreign Agricultural Service/USDA 24 November 2019Office of Global Analysis

(1,000 Metric Tons)
Table 06A: Cotton Supply and Distribution by Country 2018/19 (Continued)
Area
Harvested
Ending
Stocks
ExportsLossUseImportsProductio
n
Country
0 1315012070 Malawi
162 1196807600 Malaysia
0 10329405277725 Mali
26 5002600 Mauritius
185 1671095425378243 Mexico
13 3001300 Moldova
6 200801 Morocco
0 19240128125 Mozambique
3 000300 Netherlands
0 020024 Nicaragua
0 110125 Niger
2 15704451270 Nigeria
621 5431352,3301,6552,300 Pakistan
0 000000 Panama
0 2203511 Paraguay
47 1900652019 Peru
13 2001401 Philippines
3 100300 Poland
38 9103700 Portugal
0 000000 Romania
33 6003500 Russia
0 1500621 Senegal
2 000200 Serbia
0 100000 Singapore
0 000000 Slovakia
2 000200 Slovenia
1 0002212 Somalia
15 49300195044 South Africa
2 970046565 Spain
1 000215 Sri Lanka
0 3093016109180 Sudan
0 000000 Sweden
0 000000 Switzerland
0 5200143025 Syria
129 310013100 Taiwan
Foreign Agricultural Service/USDA 25 November 2019Office of Global Analysis

(1,000 Metric Tons)
Table 06A: Cotton Supply and Distribution by Country 2018/19 (Continued)
Area
Harvested
Ending
Stocks
ExportsLossUseImportsProductio
n
Country
0 677601290180 Tajikistan
0 654403893500 Tanzania
234 390523401 Thailand
0 17490356180 Togo
4 100722 Tunisia
762 34710501,502806520 Turkey
0 137330174198545 Turkmenistan
0 2224032675 Uganda
1 000100 Ukraine
0 000000 United Kingdom
1 1,0563,214-46483,9994,130 United States
0 000000 Uruguay
0 28515206107131,100 Uzbekistan
3 400221915 Venezuela
1,502 259001,52411 Vietnam
0 1005618 Yemen
0 52340144125 Zambia
0 35382744200 Zimbabwe
World
9,254 17,5398,9882526,19025,86533,539 World
Foreign Agricultural Service/USDA 26 November 2019Office of Global Analysis
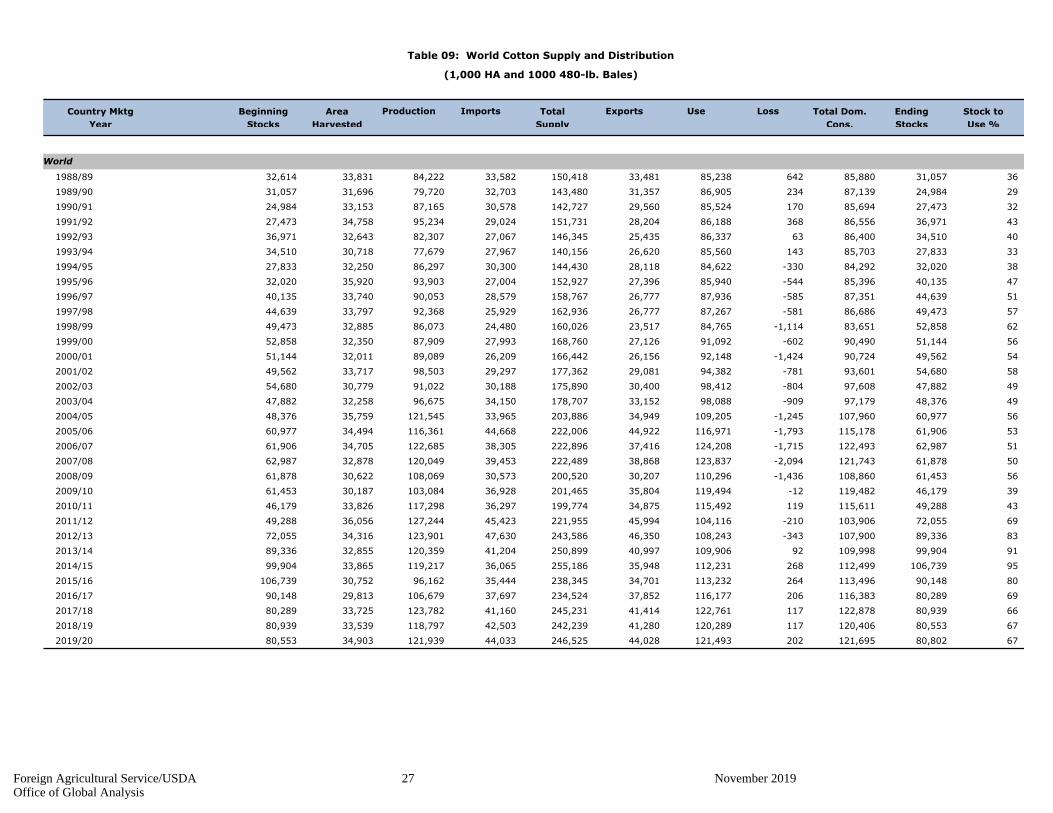
Table 09: World Cotton Supply and Distribution
(1,000 HA and 1000 480-lb. Bales)
Country Mktg
Year
Beginning
Stocks
Area
Harvested
Production Imports Total
Supply
Exports Use Loss Total Dom.
Cons.
Ending
Stocks
Stock to
Use %
World
3631,05785,88064285,23833,481150,41833,58284,22233,83132,614 1988/89
2924,98487,13923486,90531,357143,48032,70379,72031,69631,057 1989/90
3227,47385,69417085,52429,560142,72730,57887,16533,15324,984 1990/91
4336,97186,55636886,18828,204151,73129,02495,23434,75827,473 1991/92
4034,51086,4006386,33725,435146,34527,06782,30732,64336,971 1992/93
3327,83385,70314385,56026,620140,15627,96777,67930,71834,510 1993/94
3832,02084,292-33084,62228,118144,43030,30086,29732,25027,833 1994/95
4740,13585,396-54485,94027,396152,92727,00493,90335,92032,020 1995/96
5144,63987,351-58587,93626,777158,76728,57990,05333,74040,135 1996/97
5749,47386,686-58187,26726,777162,93625,92992,36833,79744,639 1997/98
6252,85883,651-1,11484,76523,517160,02624,48086,07332,88549,473 1998/99
5651,14490,490-60291,09227,126168,76027,99387,90932,35052,858 1999/00
5449,56290,724-1,42492,14826,156166,44226,20989,08932,01151,144 2000/01
5854,68093,601-78194,38229,081177,36229,29798,50333,71749,562 2001/02
4947,88297,608-80498,41230,400175,89030,18891,02230,77954,680 2002/03
4948,37697,179-90998,08833,152178,70734,15096,67532,25847,882 2003/04
5660,977107,960-1,245109,20534,949203,88633,965121,54535,75948,376 2004/05
5361,906115,178-1,793116,97144,922222,00644,668116,36134,49460,977 2005/06
5162,987122,493-1,715124,20837,416222,89638,305122,68534,70561,906 2006/07
5061,878121,743-2,094123,83738,868222,48939,453120,04932,87862,987 2007/08
5661,453108,860-1,436110,29630,207200,52030,573108,06930,62261,878 2008/09
3946,179119,482-12119,49435,804201,46536,928103,08430,18761,453 2009/10
4349,288115,611119115,49234,875199,77436,297117,29833,82646,179 2010/11
6972,055103,906-210104,11645,994221,95545,423127,24436,05649,288 2011/12
8389,336107,900-343108,24346,350243,58647,630123,90134,31672,055 2012/13
9199,904109,99892109,90640,997250,89941,204120,35932,85589,336 2013/14
95106,739112,499268112,23135,948255,18636,065119,21733,86599,904 2014/15
8090,148113,496264113,23234,701238,34535,44496,16230,752106,739 2015/16
6980,289116,383206116,17737,852234,52437,697106,67929,81390,148 2016/17
6680,939122,878117122,76141,414245,23141,160123,78233,72580,289 2017/18
6780,553120,406117120,28941,280242,23942,503118,79733,53980,939 2018/19
6780,802121,695202121,49344,028246,52544,033121,93934,90380,553 2019/20
Foreign Agricultural Service/USDA 27 November 2019Office of Global Analysis

Table 10: United States Cotton Supply and Distribution
(1,000 HA and 1000 480-lb. Bales)
Country Mktg
Year
Area
Harvested
Yield Beginning
Stocks
Production Imports Total
Supply
Exports Use Loss Ending
Stocks
Stock to
Use %
United States
517,0921657,7826,14821,187515,4115,7716944,835 1988/89
183,000-1638,7597,69419,290212,1967,0926883,860 1989/90
142,344-2858,6577,79318,509415,5053,0007114,748 1990/91
233,70489,6136,64619,9711317,6142,3447315,245 1991/92
304,662-19010,2505,20119,923116,2183,7047854,501 1992/93
203,530-810,4186,86220,802616,1344,6626795,173 1993/94
132,650-3811,1989,40223,2122019,6623,5307945,391 1994/95
142,6092710,6477,67520,95840817,9002,6506026,478 1995/96
223,971-811,1266,86521,95440318,9422,6097915,216 1996/97
213,8874111,3497,50022,7771318,7933,9717545,425 1997/98
273,939-39410,4014,29818,24443913,9183,8877014,324 1998/99
233,91514510,1946,75021,0049716,9683,9396805,433 1999/00
386,000-4838,8626,74021,1191617,1883,9157085,282 2000/01
407,4481807,69611,00026,3242120,3036,0007905,596 2001/02
285,3851667,27311,90024,7246717,2097,4487465,025 2002/03
173,4502116,26613,75823,6854518,2555,3858184,858 2003/04
265,4951086,69114,43626,7302923,2513,4509585,284 2004/05
266,069-2005,87117,67329,4132823,8905,4959315,586 2005/06
539,4793034,93512,95927,6761921,5886,0699125,152 2006/07
5510,0514294,58413,63428,6981219,2079,4799854,245 2007/08
386,337-2633,54113,26122,876012,82510,0519123,063 2008/09
192,947-143,55012,03718,520012,1836,3378703,049 2009/10
142,6001823,90014,37621,058918,1022,9479104,330 2010/11
223,350-1723,30011,71418,1921915,5732,6008863,829 2011/12
233,8003483,50013,02620,6741017,3143,3509993,772 2012/13
172,3502923,55010,53016,7221312,9093,8009213,051 2013/14
253,6502103,57511,24618,6811216,3192,3509393,785 2014/15
303,8001683,4509,15316,5713312,8883,6508593,268 2015/16
152,750603,25014,91720,977717,1703,8009723,848 2016/17
224,200-283,22516,27923,676320,9232,7501,0144,492 2017/18
274,850-182,97514,76322,570318,3674,2009684,130 2018/19
316,100723,00016,50025,672520,8174,8508955,062 2019/20
Foreign Agricultural Service/USDA 28 November 2019Office of Global Analysis

Table 11: Foreign Cotton Supply and Distribution
(1,000 HA and 1000 480-lb. Bales)
Country Mktg
Year
Area
Harvested
Yield Beginning
Stocks
Production Imports Total
Supply
Exports Use Loss Ending
Stocks
Total Foreign
23,96547777,45627,333129,23133,57768,81126,84351728,996 1988/89
21,98439778,14623,663124,19032,70167,52423,96552827,836 1989/90
25,12945576,86721,767124,21830,57471,66021,98454928,405 1990/91
33,26736076,57521,558131,76029,01177,62025,12957329,513 1991/92
29,84825376,08720,234126,42227,06666,08933,26751128,142 1992/93
24,30315175,14219,758119,35427,96161,54529,84852525,545 1993/94
29,370-29273,42418,716121,21830,28066,63524,30354026,859 1994/95
37,526-57175,29319,721131,96926,59676,00329,37056229,442 1995/96
40,668-57776,81019,912136,81328,17671,11137,52654328,524 1996/97
45,586-62275,91819,277140,15925,91673,57540,66856528,372 1997/98
48,919-72074,36419,219141,78224,04172,15545,58655028,561 1998/99
47,229-74780,89820,376147,75627,89670,94148,91957426,917 1999/00
43,562-94183,28619,416145,32326,19371,90147,22958626,729 2000/01
47,232-96186,68618,081151,03829,27678,20043,56260528,121 2001/02
42,497-97091,13918,500151,16630,12173,81347,23262425,754 2002/03
44,926-1,12091,82219,394155,02234,10578,42042,49762327,400 2003/04
55,482-1,353102,51420,513177,15633,93698,29444,92670230,475 2004/05
55,837-1,593111,10027,249192,59344,64092,47155,48269628,908 2005/06
53,508-2,018119,27324,457195,22038,286101,09755,83774529,553 2006/07
51,827-2,523119,25325,234193,79139,441100,84253,50876728,633 2007/08
55,116-1,173106,75516,946177,64430,57395,24451,82775227,559 2008/09
43,2322115,94423,767182,94536,92890,90155,11672927,138 2009/10
46,688-63111,59220,499178,71636,28899,19643,23273229,496 2010/11
68,705-38100,81634,280203,76345,404111,67146,68875432,227 2011/12
85,536-691104,74333,324222,91247,620106,58768,70576030,544 2012/13
97,554-200106,35630,467234,17741,191107,45085,53678529,804 2013/14
103,08958108,65624,702236,50536,053102,89897,55474530,080 2014/15
86,34896109,78225,548221,77435,41183,274103,08966027,484 2015/16
77,539146112,92722,935213,54737,69089,50986,34875125,965 2016/17
76,739145119,53625,135221,55541,157102,85977,53976629,233 2017/18
75,703135117,31426,517219,66942,500100,43076,73974429,409 2018/19
74,702130118,49327,528220,85344,028101,12275,70373829,841 2019/20
Foreign Agricultural Service/USDA 29 November 2019Office of Global Analysis