2019 SWOT Analysis - Harper College · Implemented a Case Management Advising Model that assigns...
34
2019 SWOT Analysis Report Presented by: Strategic Planning and Accountability Committee May 2019 Harper College 1200 West Algonquin Road Palatine, Illinois 60067-7398 Phone: 847.925.6000
Transcript of 2019 SWOT Analysis - Harper College · Implemented a Case Management Advising Model that assigns...
2019 SWOT Analysis
Report Presented by:
Strategic Planning and Accountability Committee
May 2019
Harper College
1200 West Algonquin Road
Palatine, Illinois 60067-7398
Phone: 847.925.6000

i
Table of Contents
OVERVIEW ....................................................................................................................................................... 1
STRENGTHS ...................................................................................................................................................... 2
Strength 1: Increasing Levels of Student Success – Persistence and Completion ........................................... 2
Strength 2: Institutional Focus on Diversity and Inclusion ............................................................................. 4
Strength 3: Institutional Transparency and Fiscal Stewardship....................................................................... 6
Strength 4: Meeting Community Needs through Innovative and Affordable Education ................................ 8
Strength 5: Student Satisfaction with Education and Services ...................................................................... 10
WEAKNESSES ................................................................................................................................................. 12
Weakness 1: Achievement Gaps ................................................................................................................... 12
Weakness 2: Employee Climate Concerns .................................................................................................... 14
Weakness 3: Employee Diversity .................................................................................................................. 16
Weakness 4: Enrollment ................................................................................................................................ 18
OPPORTUNITIES ........................................................................................................................................... 20
Opportunity 1: Alternative Means of Earning Credit and Alternative Delivery Methods............................. 20
Opportunity 2: Changing District and Student Demographics ...................................................................... 22
Opportunity 3: Partnerships with Educational Institutions, Business and Industry....................................... 23
Opportunity 4: Strategies to Attract and Retain Students .............................................................................. 25
THREATS ......................................................................................................................................................... 27
Threat 1: Funding and Financing Higher Education ..................................................................................... 27
Threat 2: Higher Education in a Competitive Market ................................................................................... 29
Threat 3: Uncertain State of Higher Education ............................................................................................. 31
1
OVERVIEW
In preparation for future planning, Harper College invested significant time and effort to conduct a
thorough assessment of internal strengths and weaknesses as well as an external review of
opportunities and threats – a SWOT Analysis. The SWOT analysis provides an evaluation that can
focus institutional attention and inform planning processes. The analysis began with the identification
and critical review of key institutional data. These key data sources included:
Accountability Report
Campus Master Plan
College Plan
Community College Survey of Student Engagement (CCSSE) results
Community Scan
Cultural Values Assessment results
Environmental Scan
Fact Book
Follow-up Survey results
National Community College Benchmark Project (NCCBP) results
Personal Assessment of the College Environment (PACE) results
Post-Harper Employment and Wage Outcomes
Recent task force reports
As a result of the review of these documents the College’s strengths, weaknesses, opportunities, and
threats began to surface. The analysis identified the current state of affairs, while highlighting areas in
which Harper is strong as well as those that need focused attention. Further research was conducted
to gather additional data on external factors influencing Harper as opportunities or threats. Items that
surfaced were evaluated using three criteria:
Institutional - The item is at the institutional level, not one relating solely to a particular
division, department or program.
Data Driven - Once the institutional criterion is met, the item is reviewed to determine if its
data are documentable and measurable.
Peer Comparison - If applicable, Harper can be compared to similar institutions.
An initial draft document was created and reviewed by the Strategic Planning and Accountability
Shared Governance Committee. The draft was then presented to the campus community via the portal
and during the March 14, 2019 Dialogue Session. Faculty and staff were able to provide feedback on
the draft at the session and in an online survey. This final document incorporates the campus
feedback.

2
STRENGTHS A strength is a positive internal institutional attribute.
Strength 1: Increasing Levels of Student Success – Persistence and Completion
Item Description:
Persistence rates have increased for both full-time and part-time students since 2012-13. Efforts to
retain students, both inside and outside of the classroom, appear to be producing the desired effect.
Additionally, completion rates continue to show improvement with graduation rates at their highest in
recorded history. While room for improvement in both persistence and completion still exist, the
growth in both of these areas, ultimately representing an increase in the success of Harper students, is
a reflection of the academic excellence of the College.
Supporting Information:
Harper College has experienced an increase in persistence rates for both full-time and part-time
students. Since 2012-13, persistence rates are more than five percent higher for full-time students and
five percent higher for part-time students.1
Persistence Rate (fall to fall)*
Year 2012-13 2013-14 2014-15 2015-16 2016-17
Harper full-time 68.4% 68.4% 69.7% 72.9% 73.9%
Harper part-time 44.6% 47.4% 45.8% 47.5% 49.6%
*IPEDS fall to fall persistence rate measures first-time, full-time, degree/certificate-seeking students who first enroll
at Harper in the given fall semester and return the following fall.
When compared to Harper’s peer group, persistence of first-time, full-time credential seeking
students from first fall term to second fall term is higher for Harper students (74%) than the peer
group (70%).2 Additionally, both full-time and part-time students persist to the next term and the
following fall at rates higher than peers (fall 2016 cohort).3
The College’s graduation rate has also improved over time, more than doubling since 2010, and is
currently at its highest rate in recorded history. Harper’s graduation rate has also remained above the
Illinois peer group average since 2011.
Graduation Rate*
Year 2010 2011 2012 2013 2014 2015 2016 2017 2018
Harper 13.9% 19.0% 20.4% 24.1% 21.4% 26.3% 28.4% 28.8% 32.7%
Peer Average 15.4% 15.8% 16.9% 18.3% 18.5% 20.5% 24.2% 24.4% Not Yet Available
*IPEDS Graduation Rate measures first-time, full-time, degree/certificate-seeking students who completed a credential within
three years of enrolling at Harper.
In addition, when compared with more than 200 community colleges nationwide, Harper’s full-time
completion rates at two-years, three-years, and six-years are at or above the 72nd percentile.4
1 Harper College Institutional Accountability Report 2017-2018, p. i. 2 National Center for Education Statistics. 2018. IPEDS Data Feedback Report 2018, p. 5. 3 2018 National Community College Benchmark Report, p. 2. 4 Ibid.

3
Harper College continues to respond to former President Obama’s 2010 American Graduation
Initiative, which challenged the nation to produce an additional five million credentials by 2020.
Harper College calculated its share of this five million at 10,604 additional credentials. The College
surpassed this goal in FY2017, and by the end of FY2018 conferred an additional 12,218 credentials.5
Harper confers more degree and certificates than the peer group – 3,607 for Harper as compared to
the peer group average of 2,466.6
Improved persistence and completion have been the result of the College’s focus on academic
excellence as well as the implementation of a multitude of campus efforts:
Expanded the Early Alert system (Starfish) to include all new degree-seeking students.
Starfish is a system used by faculty and advisors to identify students at-risk and intervene
with needed supports or resources.
Redesigned the MyHarper Student Portal to provide essential information in a user-friendly
manner. Increased the ease with which students can register for classes, pay tuition, and find
services.
Ensured completion of an Educational Plan for all new degree-seeking students.
Implemented a Case Management Advising Model that assigns all new degree-seeking
students with a point person.
Stackable credentials are offered in a variety of career programs and provide opportunities
for students to earn additional certificates.
Students who have earned a degree/certificate and those who are close to meeting
degree/certificate requirements are identified and notified of this status. Additionally,
certificates are auto awarded to students who earn A.A.S. degrees in a stackable career
program, once program requirements are met.
Ongoing work with sender high schools continues to result in increased college readiness
thereby increasing the likelihood of persisting and reducing the time to completion.
5 Harper College Institutional Accountability Report 2017-2018, p. i. 6 National Center for Education Statistics. 2018. IPEDS Data Feedback Report 2018, p. 3.

4
Strength 2: Institutional Focus on Diversity and Inclusion
Item Description:
Institutional priority has been given to matters of diversity and inclusion since 2012 when a
presidential task force was appointed to examine employee attitudes and beliefs, review best
practices, and recommend a goal for the College’s Institutional Effectiveness Measure (IEM) on
diversity. Many initiatives have been implemented and Harper has since been recognized for its
diversity and inclusion work.
Supporting Information:
Harper has taken many steps in support of diversity and inclusion, including creation of a Diversity
and Inclusion Officer position to further Harper’s diversity, equity, and inclusion initiatives.7
Implemented supports for diverse employees including:
Established and implemented a protocol for bias incident reporting.8
Employee Resource Groups: DREAM serving employees of color; LAND serving those with
disabilities/accommodations; and SAFE @ Harper serving LGBTQIA+ employees.9
Diversity and inclusion remains an institutional focus as indicated by:
Two IEMs, Diverse New Hires and Underrepresented Employee Separations.10 Progress on
these metrics is reported annually on the College’s public website.
A Diversity Scorecard, serving as an accountability tool, measuring recruitment/
advancement, retention, service/professional development, and student opinion/satisfaction.11
Goals that support recruitment/retention of Hispanic/Latino students, recommended by the
Hispanic Strategic Enrollment Task Force and included in the FY2019 Operational Plan.12
Administration of the Cultural Values Assessment (CVA) every three years. After the most
recent administration in 2016, 16 small group sessions were conducted with 270 employees to
review and discuss the results of the CVA.13
Updated hiring and feedback practices that support diversity and inclusion including14:
A diverse employee recruitment plan focused on increasing applicant diversity, increasing the
percent of diverse applicants interviewed from 11% in FY2015 to 14.7% in FY2016.
Use of an outside vendor to conduct all exit interviews.
Implementation of a 360-feedback process for managers and administrators.
The Diverse Faculty Fellows program, beginning in January 2015 with nine Faculty Fellows
participating in the program to date. Three fellows have continued as full-time faculty and one
as adjunct faculty. Fellows have taught 1,451 students with 95 of those students taking more
than one course with a fellow.
7 Harper College A Way Forward: Report of the President’s Task Force on Diversity and Inclusion 2013, p. 31. 8 “Bias Incident Reporting,” https://hip.harpercollege.edu/ourcollege/diversity-inclusion/Pages/Bias-Incident-Reporting.aspx, accessed
January 11, 2019. 9 “Office of Diversity & Inclusion November 2014 Pardon Our Dust,” last modified November 2014, accessed January 11, 2019,
https://hipexternal.harpercollege.edu/news/Pages/DiversityandInclusionNovember2014.aspx. 10 Ibid. 11 “Diversity Scorecard,” last modified August 16,2018, accessed January 11, 2019
https://hip.harpercollege.edu/ourcollege/AssessingOurCollege/Pages/Diversity-Scorecard.aspx. 12 Harper College College Plan 2018-2019, p. 58-59. 13 Harper College Institutional Accountability Report 2016-2017, p.48. 14 “Office of Diversity & Inclusion November 2014 Pardon Our Dust,” last modified November 2014, accessed January 11, 2019,
https://hipexternal.harpercollege.edu/news/Pages/DiversityandInclusionNovember2014.aspx.
5
Since 2007, 393 employees have attended the Cultural Competency Workshop and 413
employees have attended the Search Process Workshop, both required to be eligible to serve
on a supervisory, faculty, or administrator search committee.15
Professional development opportunities provided for all employees:
Diversity and Inclusion Dialogue Workshops provide occasion to engage and connect with
diversity and inclusion issues. In FY2018, 149 employees participated in these workshops.16
A Social Justice Leadership Certificate Program pilot in FY2019, focusing on building
employee skills and capacities to lead and support diversity and inclusion initiatives.17
Since 2014, six Diversity Symposiums have been held with more than 1,400 employees attending.
Recognition for the College’s work on Diversity and Inclusion:
2017 Equity and Diversity Award – Illinois Community College Trustees Association
2017 Central Region Equity Award – American Community College Trustees Association
2017 and 2018 INSIGHT Into Diversity Higher Education Excellence in Diversity Award.18
2018 Senator Paul Simon Spotlight Award for Campus Internationalization
Student satisfaction, learning, and outcomes related to diversity are also part of Harper’s focus:
Graduate surveys indicate an environment that values diversity and inclusion:
o FY2017 Follow-Up Survey19 – 88.3% responded “definitely yes/yes” when asked if their
experiences at Harper resulted in “a better appreciation for diversity and different cultures
and values.” In addition, 81.6% responded that their education at Harper College helped
them examine diverse perspectives and cultures.
Student learning outcomes and degree requirements include diversity and inclusion:
o The Diverse Perspectives and Cultures general education outcome states that degree
completers will be able to “examine diverse perspectives and cultures as they relate to the
individual, the community, and the global society.”20
o The World Cultures and Diversity Graduation Requirement ensures students complete a
World Cultures and Diversity course prior to degree completion.21
Hispanic Strategic Enrollment Task Force created to address recruitment/retention declines.22
Participation in the Achieving the Dream network has enhanced Harper’s use of data by
creating a practice of examining disaggregated data to determine where student achievement
gaps exist. This practice has resulted in the College focusing efforts on increasing success for
specific student populations.23 24
15 Workshop Attendees, accessed April 16, 2018, https://hip.harpercollege.edu/careerbenefits/recruitmenthiring/
Documents/Workshop%20Attendees.pdf 16 Harper College Diversity and Inclusion Scorecard FY2018, p. 1. 17 “The Social Justice Leadership Certificate,” last modified November 6, 2018, accessed January 14, 2019,
https://hip.harpercollege.edu/ourcollege/diversity-inclusion/Pages/The-Social-Justice-Leadership-Certificate.aspx. 18 “Harper College receives second Higher Education Excellence in Diversity Award,” last modified October 10, 2018, accessed
January 14, 2019, https://www.harpercollege.edu/about/news/archives/2018/posts/101118.php. 19 “Harper College 2017 Follow Up Survey Dashboard,” last modified August 22, 2018, accessed January 14, 2019,
https://hip.harpercollege.edu/ourcollege/IR/Documents/Follow%20Up%20Survey%20Dashboard%202017.xlsm. 20 “General Education Learning Outcomes,” last updated October, 16, 2018, accessed January 4, 2019,
https://www.harpercollege.edu/about/leadership/accountability/genedoutcomes.php. 21 “World Cultures and Diversity Requirement,” last updated November 2, 2018, accessed January 14, 2019,
https://www.harpercollege.edu/catalog/current/zz_requirements/diversity.php. 22 Harper College Latinx Success: A Vision for Harper College, May 2018. 23 Harper College Institutional Accountability Report 2014-2015, p.37. 24 Harper College Institutional Accountability Report 2017-2018, p.29.

6
Strength 3: Institutional Transparency and Fiscal Stewardship
Item Description:
Harper College demonstrates, to our external constituents, a commitment of transparency and fiscal
responsibility in a variety of ways including: transparent budgeting, an exceptional bond rating,
accountability metrics, and clean audit reports.
Supporting Information:
Harper presents itself clearly and completely. This is evidenced through engagement in a transparent
and public budget process, which demonstrates both fiscal responsibility and accountability to its
diverse community. Harper consistently develops a balanced or better than balanced budget for tax
capped funds. The College received an unmodified opinion from the independent audit of its
Comprehensive Annual Financial Report (CAFR).25 The unmodified opinion states that the financial
statements present fairly, in all material respects, the respective financial position of the College.
Harper has been awarded the Certificate of Achievement for Excellence in Financial Reporting, by
the Government Finance Officers Association for seven consecutive years.26 To receive this award, a
government organization must publish an easily readable and efficiently organized comprehensive
annual financial report that satisfies both generally accepted accounting principles and applicable
legal requirements.
The College’s financial stewardship is also reflected in its bond rating and Composite Financial Index
(CFI). Despite recent state budget concerns, the College has maintained a Moody’s Aaa bond rating
for more than 15 years, the highest rating awarded. Harper has consistently maintained this Aaa
rating because of its healthy operating reserves, low dependence on state appropriations, and an
annual budget process that ensures appropriate allocation of funds, maintenance of a balanced budget,
and collaboration with the Board of Trustees.27 Additionally, Harper has maintained a CFI ranging
between 2.35 and 3.80 over the past seven fiscal years. This score is reported to the Higher Learning
Commission and combines four principal ratios: primary reserve ratio, net operating revenue ratio,
return on net assets, and viability ratio. Harper’s number demonstrates adequate financial resources.28
Harper’s proactive response to fiscal challenges demonstrates its ability to maintain a balanced
budget without sacrificing the educational experience of its students. The College manages resources
appropriately to support the advancement of its physical and technological infrastructures, which has
resulted in the expansion and enhancement of instructional support, learning, and study spaces for
students. The community recognizes these efforts and overwhelmingly supports the work of the
College as demonstrated through passing a 2018 referendum to sell capital bonds in the amount of
$180 million to support the Campus Master Plan.29
Major capital projects demonstrate the College’s commitment to maintaining an excellent physical
25 Harper College Comprehensive Annual Financial Report for the Fiscal Year Ended June 30, 2018, p. 120. 26 Ibid, p. 10. 27 “Moody’s Rating Action,” last modified November 10, 2017, accessed January 11, 2019,
https://www.moodys.com/research/Moodys-Assigns-Aaa-rating-to-CCD-512-William-Rainey-Harper--PR_904284125. 28 Higher Learning Commission Assurance Argument, February 5, 2018, p.86,
https://hip.harpercollege.edu/ourcollege/Documents/Harper College Assurance Argument February 2018.pdf. 29 Harper College Minutes of Board Meeting of Wednesday, November 14, 2018, p. 8.

7
infrastructure in a fiscally responsible manner. Large projects that provide innovative spaces for
educational programs, student support, and learning resources are consistently completed on-time and
at or under budget. Projects include:
Building H: Career and Technical Education Center – $38 million renovation providing new
classrooms and labs for Harper career programs. Additionally, with support from a $500,000
grant from the Fabricators and Manufacturers Association, a $1.78 million state-of-the art
Metal Fabrication Lab for the Advanced Manufacturing Program was constructed.30
Duchossois Family Educational Center – Renovations to create updated, appropriately-sized
classrooms that offer faculty and students more opportunities for teaching and learning.31
David K. Hill Family Library – Renovations to update and expand this building providing
numerous spaces for students to study, convene, and engage in the learning experience. This
building also houses student academic support services and the Academy for Teaching
Excellence.32
Foglia Foundation Health & Recreation Center – Renovations to transform the building into
an engaging educational facility that encourages a culture of health and wellness.33
The College also demonstrates its commitment to fiscal responsibility, transparency, and
accountability through its effectiveness, planning, and assessment activities. Harper’s Institutional
Effectiveness Measures (IEMs) are key performance indicators for which the College sets goals and
publicly reports progress.34 Included in the IEMs are metrics on both student success and institutional
success, such as Persistence, Completion, Employee Diversity, and Instructional Cost.
Harper uses a broad, collaborative, community-based strategic planning process that includes the
review of internal and external data, on-campus dialogue sessions, a strategic planning conference for
internal and external stakeholders, and shared governance revision and review. The process leads to
the adoption of a comprehensive Strategic Plan. Progress toward achieving Strategic Plan goals is
made available to the public on the Strategic Plan Dashboard.35
Outcomes assessment at Harper is the process of using data about student learning to focus
institutional efforts on improving student learning and achievement. General education assessment
results and improvement plans are publically available through the Evidence of Student Learning
Dashboard. This dashboard was developed with transparency in mind. As a result of the College’s
commitment to student learning and transparency, Harper was named as a 2018 Excellence in
Assessment designee.36
30 Perkins Eastman. 2017. Harper College Campus Master Plan 2016 Update, p. 2. 31 Perkins Eastman. 2017. Harper College Campus Master Plan 2016 Update, p. 2. 32 Harper College Institutional Accountability Report 2017-2018, p. iv. 33 Ibid. 34 “Institutional Effectiveness Measure Dashboard,” last modified October 16, 2018, accessed January 18, 2019,
https://www.harpercollege.edu/about/leadership/accountability/iem/index.php. 35 “Strategic Plan Dashboard – 2016-2019,” last modified October 16, 2018, accessed January 18, 2019,
https://www.harpercollege.edu/about/leadership/planning/college_plan/iea-2016-2019/index.php. 36 “National Institute for Learning Outcomes Assessment,” accessed January 18, 2019,
http://www.learningoutcomesassessment.org/eiadesignation_2018.html.

8
Strength 4: Meeting Community Needs through Innovative and Affordable Education
Item Description:
Harper continues to meet the education needs of its community in innovative and affordable ways.
Harper maintains low tuition and fees and awards grants and scholarships to aid in keeping the cost of
education affordable. New scholarships, such as the Promise Program, continue this commitment to
affordability. Additionally, newly-completed renovations have expanded both the community
outreach at Harper as well as the programs that can be offered. Finally, strong evidence exists that
Harper credentials are valuable in the marketplace.
Supporting Information:
As stated in the College mission, Harper is committed to providing affordable education. To maintain
this affordability, the College is conservative in tuition increases and generous with institutional grant
and scholarship opportunities.
The net price of attending Harper continues to decline for full-time students awarded grant or
scholarship aid, from $7,659 in FY2015 to $6,616 in FY2017.37
Harper students received more grant aid in 2016-17 per student than the peer group average.
This includes federal, Pell, state/local, and institutional grants.38
Harper made a commitment to cover Illinois Monetary Awards Program (MAP) grants for
students when state funding was uncertain.
In the 2013 and 2016 Community Scans, when asked “What is Harper College best known
for?” the community’s consistent response was affordability.39
Harper’s annual tuition is increasing at a slower pace than its peer institutions as shown
below.40
Harper also has expanded the number of ways a credential can be earned. Through its Registered
Apprenticeship Programs, students complete Harper coursework while employed and mentored by a
local employer. Additionally, the employer covers the education costs of the program, allowing the
student to complete the apprenticeship debt-free. The College’s Fast Track program allows motivated
students to complete select credentials with classes offered in 5- or 8-week formats. The Fast Track
program offerings include an Associate of Applied Science Degree in Business Administration and
37 National Center for Education Statistics. 2018. IPEDS Data Feedback Report 2018, p. 4. 38 Ibid. 39 Clarus Corporation. 2016. Harper College Community Survey, April 2016, p. 17. 40 Ibid and National Center for Education Statistics. 2017. IPEDS Data Feedback Report 2017, p. 4.
1.38%
4.26% 4.09% 4.11%3.60%
4.70% 4.65%
6.35%
2014-2015 2015-2016 2016-2017 2017-2018
Academic Year
Percentage Change in Academic Year Tuition
from Previous Academic Year for Harper and IPEDS Peer Institutions
% Change Harper % Change Peer

9
certificates in Entrepreneurship, Health Information Technology Medical Coding, Human Resource
Management, and Supply Chain Management.
Campus renovations also allow the College to expand innovative program offerings in state-of-the art
facilities.
The renovated Building H contains the College’s Advanced Manufacturing Lab. Harper’s
manufacturing program has partnered with about 170 area companies that offer
apprenticeships, paid internships, financial support, and expertise. The program has received
approximately $2 million in funding and donated equipment from its partner companies
including a laser cutter, robotic welding cell, and computer numerical control (CNC)
machines. Harper also was selected as home of the Fabricators and Manufacturers Association
Metal Fabrication Lab, a state-of-the-art training facility for metal fabrication and welding.
The University Center was created in response to demand from the community to make
bachelor’s degrees accessible on the Harper campus.41 Students can now earn select
bachelor’s degrees from DePaul University, Northern Illinois University, and Roosevelt
University on Harper’s campus. DePaul University discounts tuition by 25% and Roosevelt
University by 35%.
The newly renovated Foglia Foundation Health and Recreation Center represents an
innovative partnership with the Palatine Park District and Northwest Community Healthcare.
The new fitness center enabled the creation of a Personal Trainer certificate, as well as
community-focused health and fitness courses and access to professional medical care on
campus.
Harper continues to meet community education needs as indicated by the labor market value of a
Harper credential. As compared to students who leave Harper prior to earning a credential, students
who leave with a credential are employed at higher rates and have higher average wages over a five-
year period. For example, five years post departure, students leaving Harper with a credential had an
average monthly wage of nearly $800 more than those never earning a credential.42 Additionally,
72.1%43 of career graduates report being employed in a field related to their Harper area of study,
further evidence of the College’s commitment to providing education that meets community needs.
41 Clarus Corporation. 2016. Harper College Community Survey, April 2016, p. 24. 42 Harper College Employment and Wage Outcomes for Harper College Students Fiscal Year 2012 Cohort, p. 7. 43 2018 National Community College Benchmark Report, p. 4.

10
Strength 5: Student Satisfaction with Education and Services
Item Description:
Harper is committed to providing high quality education and student services. This commitment is
demonstrated in the wide range of student support services available and the positive feedback from
students regarding these services and their impact on educational growth.
Supporting Information:
Harper College measures student satisfaction in various ways. Instruments that have been used to
gauge satisfaction with support services and the institution include the Follow-Up Survey, the
Community College Survey of Student Engagement (CCSSE), and Student Opinionaire of Instruction
(SOI).
The Follow-Up Survey is an annual survey administered to Harper degree and certificate completers
to measure student views on Harper and the services provided toward their educational advancement.
Follow-up surveys are conducted for students who complete career and transfer programs. Survey
results indicate:
Both career and transfer completers would recommend Harper, with at least 97% of transfer 44
and career completers45 stating “definitely yes/yes” in 2015, 2016, and 2017.
2015 2016 2017
Would recommend Harper
Transfer Completers 97% 98% 97%
Career Completers 99% 97% 99%
Career and transfer completers rate library services and availability of computers high, when
measured on a four-point scale. 46 47
2015 2016 2017
Satisfaction rating of library/audio visual services
Transfer Completers 3.63 3.73 3.70
Career Completers 3.69 3.69 3.70
Satisfaction rating for the availability of computers for out-of class use
Transfer Completers 3.59 3.74 3.80
Both career and transfer completers would return to Harper for education or personal
enrichment courses, with 86%-92% of transfer48 and career completers49 stating “definitely
yes/yes.”
2015 2016 2017
Would return to Harper for education or personal enrichment courses
Transfer Completers 86% 88% 90%
Career Completers 91% 89% 92%
44 Harper College Follow Up Survey Transfer Credential Earners Fiscal Year 2017, p. 27. 45 Harper College Follow Up Survey Career Credential Earners Fiscal Year 2017, p. 26. 46 Harper College Follow Up Survey Transfer Credential Earners Fiscal Year 2017, p. 9; FY2016, p. 9; FY2015, p. 10. 47 Harper College Follow Up Survey Career Credential Earners Fiscal Year 2017, p. 19; FY2016, p. 20; FY2015, p. 20. 48 Harper College Follow Up Survey Transfer Credential Earners Fiscal Year 2017, p. 28. 49 Harper College Follow Up Survey Career Credential Earners Fiscal Year 2017, p. 27.

11
CCSSE is administered to a randomly-selected cross-section of students every three years, in order to
gauge student engagement with academic and support services, as well as the overall educational
environment. The CCSSE results indicate:
As compared to peers, Harper’s benchmark score for Academic Challenge has been above the
peer average for the 2015 and 2018 administrations of the survey, at 51.8 and 52.0
respectively. With CCSSE benchmark scores, 50.0 is a normalized score among all colleges
conducting CCSSE that year, with scores higher than 50 considered positive.
Students also report high levels of satisfaction with courses and instruction through the Student
Opinionaires of Instruction (SOI) that are conducted for credit courses. Results indicate general
satisfaction with organization of courses and performance of the instructors:
SOI Results
Responding “mostly agree” to Fall 2016 Spring 2017 Fall 2017 Spring 2018
Satisfaction with the general
organization of the course
88.5%
(5,321/6,015)
85.0%
(4,716/5,546)
85.9%
(9,151/10,654)
87.0%
(7,706/8,854)
Satisfaction with the overall
performance of the instruction
90.0%
(5,362/5,961)
87.4%
(4,784/5,476)
89.3%
(9,319/10,436)
86.4%
(7,869/9,105)
Employees perceive the campus environment as positively focused on student success. The Personal
Assessment of the College Environment (PACE) is a survey administered to employees to assess the
climate of the institution from the perspective of different education-based categories. Within PACE,
the Student Focus category “considers the centrality of students to the actions of the institution as
well as the extent to which students are prepared for post-institution endeavors.”50 Harper employee
ratings have identified Student Focus as collaborative for the past three administrations of the
survey.51 According to PACE, collaborative is the most positive rating, followed by to consultative,
competitive, and coercive.
50 “Survey Instruments,” accessed January 23, 2019, https://nilie.ncsu.edu/nilie/pace-survey/survey-instrument/. 51 King, G., and Garland, L. The National Initiative for Leadership & Institutional Effectiveness. 2016, Harper College: Personal
Assessment of the College Environment (PACE) Quantitative Analysis, p. 15.

12
WEAKNESSES A weakness is an internal attribute requiring improvement.
Weakness 1: Achievement Gaps
Item Description:
While persistence and completion rates have increased for most demographic groups, many of the
achievement gaps identified in the 2014 SWOT still exist. Efforts supporting student success include
improved placement methods, strengthened partnerships with high schools, and assigned advisors for
credential-seeking students. Despite these efforts, gaps have only reduced for Hispanic students in
some cases, but other groups continue to underperform when compared to their peers. Continued
efforts to decrease gaps based on race/ethnicity, gender, and age are a priority of the College and
essential to providing equitable opportunities for all students.
Supporting Information:
Student achievement gaps exist in the areas of persistence, developmental course success, college-
level course success, and completion.
Persistence: Black/African American students and students age 20 and over persist at rates below the
College’s overall persistence rates.
The fall 2016 to fall 2017 full-time persistence rate for Black/African American students is
51.6% as compared to the overall rate of 73.9%.52
The fall 2016 to fall 2017 full-time persistence rate for students age 20 and over is 7.2%-
21.6% lower than the overall rate of 73.9%.53
Student engagement, both inside and outside of the classroom is related to retention. Ratings
on the Community College Survey of Student Engagement continue to be low for the Active
and Collaborative Learning benchmark.54 While overall ratings are low at 46.255 (mean =
50.0), ratings for Black/African American students are even lower at 43.4,56 having a potential
negative impact on retention.
Developmental course success: Black/African American students and male students do not perform
as well as their peers in developmental math. Success is defined as earning a C or higher in the given
developmental math course.
The developmental math course success rate for Black/African American students in fall 2017
was 46.9% versus the overall at 60.1%.57
In fall 2017, male student developmental math course success rate was 55.7%, 4.4% below
the overall rate of 60.1%.58
52 IEM Dashboard, accessed January 4, 2019, https://edmsp.harpercollege.edu/Institutional/Dashboards/StudentSuccess
/Persistence/StudentSuccess_PersistenceRate_FalltoFallFullTime_Demographics.aspx. 53 Ibid. 54 Understanding Survey Results, Benchmark, accessed January 22, 2019, http://www.ccsse.org/survey/reports/2017/
understanding.cfm#benchmark. 55 Community College Survey of Student Engagement (CCSSE) 2018 Benchmark, p. 1. 56 Community College Survey of Student Engagement (CCSSE) 2018 Custom Breakout Report by race/ethnicity, p. 1. 57 IEM Dashboard, accessed January 4, 2019,https://edmsp.harpercollege.edu/Institutional/Dashboards/StudentSuccess
/Developmental/StudentSuccess_Developmental_Math_Demographics.aspx. 58 Ibid.
13
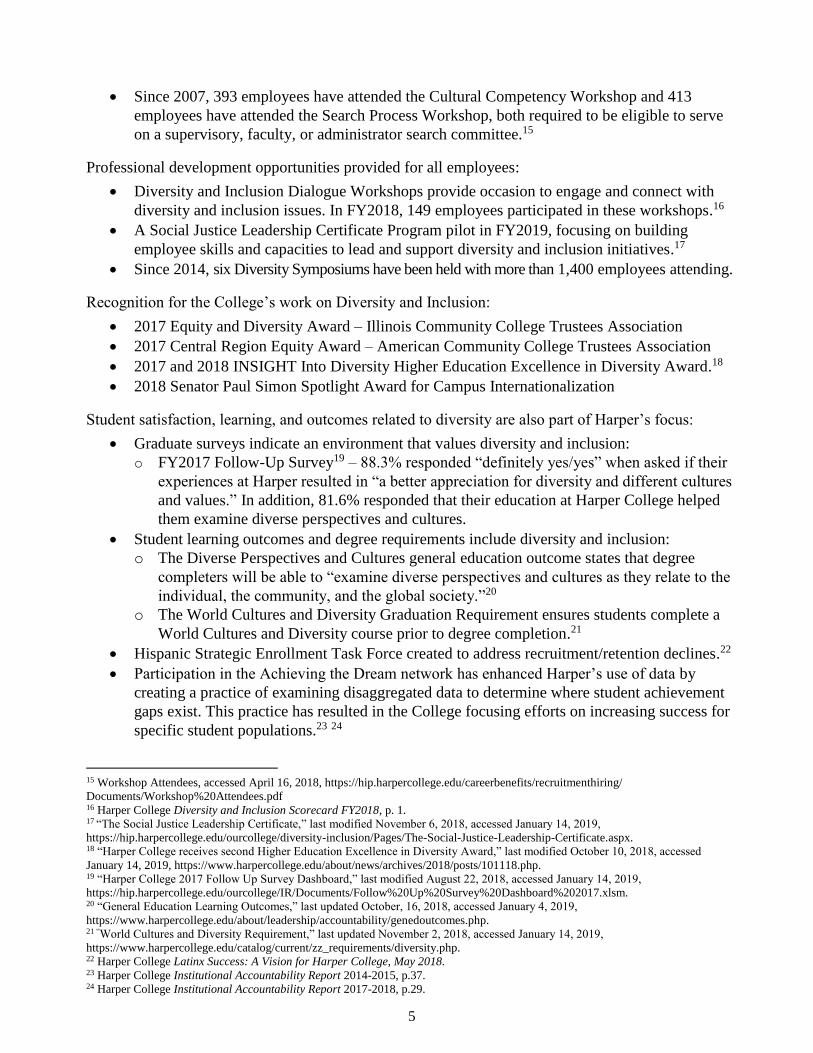
0-15 course success: Black/African American, Hispanic/Latino, and male students underperform in
comparison to their peers in 0-15 courses. The 0-15 courses are typically 100-level, high-enrollment
courses with success rates below the college-level course average. Success is defined as earning a C
or higher in a 0-15 course.
Male students consistently perform below female students in 0-15 courses. In 2017, male
student success rates were 65.2% versus 72.1% for female students.59
0-15 course success rates for Black/African American (52.6%) and Hispanic/Latino (62.1%)
students are below the overall success rate of 68.5%.60
Completion: Completion, graduation, and advancement rates are consistently lower for male students
than female students. Additionally, graduation rates for Black/African American students are
consistently lower than their peers, and student advancement rates for both Black/African American
and Hispanic/Latino students are lower than their peers.
Male students earn credentials at consistently lower rates than female students. In 2017, the
completion rate for male students was 36.3% versus 62.6% for females, a 26.3% difference.61
The graduation rate gap between males (24.0%) and females (34.5%) was 10.5% in 2017.62
Although the overall College graduation rate was 28.8% in 2017, the graduation rate for
Black/African American students remained much lower at 16.7%.63
Advancement rate is the percent of students who graduate, transfer or are still enrolled at three
years. In 2017, advancement rates were lower for Black/African American (60.6%) and
Hispanic/Latino (61.0%) students compared to the overall rate of 67.7%.64
The gap in advancement rate between male (62.7%) and female (74.3%) students was 11.6%
in 2017.65
59 IEM Dashboard, accessed January 4, 2019, https://edmsp.harpercollege.edu/Institutional/Dashboards/StudentSuccess
/Gateway/StudentSuccess_Gateway_015Courses_Demographics.aspx. 60 Ibid. 61 IEM Dashboard, accessed January 4, 2019, https://edmsp.harpercollege.edu/Institutional/Dashboards/StudentSuccess
/AnnualCompletions/StudentSuccess_AnnualCompletions_Completers_Demographics.aspx. 62 IEM Dashboard, accessed January 4, 2019, https://edmsp.harpercollege.edu/Institutional/Dashboards/StudentSuccess
/Advancement/StudentSuccess_Advancement_GraduationRate_Demographics.aspx. 63 Ibid. 64 IEM Dashboard, accessed January 4, 2019, https://edmsp.harpercollege.edu/Institutional/Dashboards/
StudentSuccess/Advancement/StudentSuccess_Advancement_AdvancementRate_Demographics.aspx. 65 Ibid.

14
Weakness 2: Employee Climate Concerns
Item Description:
Although Harper College has taken steps to improve employee climate, data suggest employees may
not be fully invested in the College. Results of the Personal Assessment of the College Environment
(PACE) call attention to issues in institutional structure, climate, communication, and feelings of
efficacy.66 Similar issues were identified in the 2016 administration of the Cultural Values
Assessment (CVA).
Supporting Information:
Although Harper College has consistently demonstrated a consultative management style as
measured by the PACE survey, employee perceptions have shown a steady decline and are moving
towards the competitive management style. A decline in this area may have a negative impact on
employee engagement.67 The four items on the PACE survey that have ranked the lowest over the
past three administrations of the survey are included in the table below.68 The scores for each of these
items have decreased over time, and the 2016 Harper rating is below that of the large two-year
college peer group.
Item 2016 2013 2011 2016 (Large
2yr colleges)
The extent to which:
I am able to appropriately influence the direction of this institution. 2.89 2.99 3.14 3.13
I have the opportunity for advancement within this institution. 3.02 3.04 3.13 3.14
decisions are made at the appropriate level at this institution. 3.07 3.22 3.29 3.31
information is shared within the institution. 3.08 3.24 3.27 3.29
The degree of cultural entropy at Harper, as measured by the CVA, has increased from 37% in 2013
to 44% in 2016.69 According to the Barrett Values Center, high levels of cultural entropy indicate a
decrease in the level of trust and internal cohesion which may lead to a lack of employee investment
in the organization, often demonstrated by employees not using their full skills and talents at work.
This cultural entropy suggests that Harper employees may be experiencing a crisis situation in the
workplace.70 Further data from the 2016 CVA has identified newly emerging cultural values
including:71
Territorial behavior
Silo mentality
Favoritism
Job insecurity
Micro-management
66 King, G., and Garland, L. The National Initiative for Leadership & Institutional Effectiveness. 2016, Harper College: Personal
Assessment of the College Environment (PACE) Qualitative Analysis, p. 37. 67 King, G., and Garland, L. The National Initiative for Leadership & Institutional Effectiveness. 2016, Harper College: Personal
Assessment of the College Environment (PACE) Quantitative Analysis, p. 33. 68 Ibid, p. 17. 69 Barrett Values Centre. 2016, Harper College Group Results Cultural Evolution Report, p 4. 70 Ibid, p. 8. 71 Ibid, p. 6.

15
Open-ended results of the 2016 CVA suggest:72
Distrust of communication and information hoarding
Feeling a lack of value and respect
Silo mentality and an interest in collaboration
Separations from the College can also result from concerns regarding employee climate. Data from
the National Community College Benchmarking Project (NCCBP) suggest that full-time employees
at Harper are departing at rates higher than peer institutions. In FY2018, 11.5% of regular full-time
employees departed from the College. This percentage puts Harper at the 85th percentile as compared
to the 174 community colleges reporting.73
72 Harper College Cultural Values Assessment Qualitative Results. 2016. 73 2018 National Community College Benchmark Report, p. 5.

16
Weakness 3: Employee Diversity
Item Description:
The racial/ethnic diversity of Harper College faculty and staff is not representative of the community
it serves. While attention has been placed on increasing employee diversity, Harper is challenged to
achieve a representative workforce within the College, and failure to do so could negatively impact
student success and College climate.
Supporting Information:
A similar weakness was identified in the 2014 SWOT. As described then, research indicates that
having a racially and culturally diverse faculty and staff greatly benefits students and the College as a
whole. Through this diversity, minority students gain mentors and role models, while all students
benefit from the diverse backgrounds and perspectives of faculty and staff.74
Although a strength of the College is its commitment to efforts around diversity and inclusion,
Harper employees do not racially/ethnically represent the community. In referencing the recent
National Community College Benchmark Project data on the ratio of minority employees to
constituent population, Harper’s ratio is 0.39 – the closer to 1.0 the more representative of the
community population. This places Harper in the 15th percentile as compared to 200 community
colleges.75
While diverse new hires have increased over time from 21.8% in 2013 to 30.8% in 2018,76 the
percentage of diverse employees (23.3%)77 is not yet representative of the community (34.8%)78 or
student (46%)79 diversity. Additionally, certain employee groups are less diverse than others, as
shown below.80
Employee Group Diverse White Unknown Total
N % N % N %
Academic Support 6 13.64% 35 79.50% 3 6.80% 44
Administrative 8 19.51% 31 75.60% 2 4.90% 41
Classified 38 20.32% 148 79.10% 1 0.50% 187
Custodial - Maintenance 35 36.08% 59 60.80% 3 3.10% 97
Professional Technical 45 26.01% 127 73.40% 1 0.60% 173
Supervisory 13 13.68% 76 80.00% 6 6.30% 95
Teaching Faculty 80 11.92% 532 79.30% 59 8.80% 671
Other 17 9.83% 67 38.70% 89 51.40% 173 Adapted from 2017-2018 Fact Book, Exhibit 7.7
Further, the Institutional Effectiveness Measure (IEM) related to underrepresented employee
separations needs attention. The College’s target for this IEM is to achieve a separation rate for
74 Harper College SWOT, p. 11. 75 2018 National Community College Benchmark Report, p. 5. 76 Harper College Institutional Accountability Report 2017-2018, p. 17. 77 Harper College Diversity and Inclusion Scorecard FY2018, p. 1. 78 Harper College Fact Book 2018-2019, p. 7. 79 Harper College Diversity and Inclusion Scorecard FY2018, p. 1. 80 Harper College Fact Book 2018-2019, p. 64.

17
underrepresented employees that is equal to or lower than the overall employee separation rate. Trend
data indicate this target was met in FY2013 and FY2015, but achievement has not been sustained.81
81 Harper College Institutional Accountability Report 2017-2018, p. 18.
0.0%
10.0%
20.0%
FY2013 FY2014 FY2015 FY2016 FY2017
Underrepresented Employee Separation
Underrepresented Employees Overall Employees

18
Weakness 4: Enrollment
Item Description:
Harper’s credit student enrollment has steadily declined in recent years, and the decline is projected
to continue. Declining enrollment, along with uncertain state funding, places substantial strain on the
College’s financial resources.
Supporting Information:
Harper’s enrollment has decreased over the past several years and continues to fall below budget.82
While Harper has experienced enrollment increases in many individual market segments, such as the
Hispanic student population, Apprenticeship programs, and Fast Track, overall College enrollment
continues to decline. FY2018 data indicates:
Full-time equivalent (FTE) enrollment is down 3.1 percentage points, while Harper College
budgeted for a 1.8 percentage point decrease.
Enrollment shows a -6.2% change in unduplicated headcount from FY2017.83
Enrollment of new students with prior college decreased by 28.2 annualized FTEs, while the
College planned for its efforts to result in a 40 annualized FTE increase in enrollment for this
group.
Application and enrollment numbers indicate that while applications have increased, the enrollment
conversion rate has decreased slightly.84
82 Harper College Institutional Accountability Report 2017-2018, p. 54. 83 Fiscal Year 2018 Official Final Enrollment Report, accessed January 15, 2019,
https://hip.harpercollege.edu/ourstudents/enrollment/Documents/FY%202018%20Official%20Enrollment.pdf. 84 Harper College Admissions Snapshot report: Enrollment Conversion Fall 2018.
10,542 10,223 9,951 9,668 9,372
0
2,000
4,000
6,000
8,000
10,000
12,000
FY2014 FY2015 FY2016 FY2017 FY2018
Full-Time Equivalent Enrollment
5,496 5,571 5,773
3,190 3,097 3,178
Conversion
58%Conversion
56%
Conversion
55%
0%
50%
100%
0
5000
10000
FY2016 FY2017 FY2018
Harper Enrollment Conversion
Applications Enrolled

19
Research indicates that enrollment will continue decreasing for community colleges. While students
from underserved communities are enrolling at higher rates, overall community college enrollment is
at a decline and expected to remain low, then drop dramatically by 2025.85 Harper’s annualized FTE
enrollment trend data and projections86 also suggest enrollment will continue to decline slightly from
previous fiscal years.
85 Ashley A. Smith, “Community college enrollment rates expected to keep falling.” Inside Higher Ed, June 21, 2018. Retrieved from
https://www.insidehighered.com/news/2018/06/21/community-college-enrollment-rates-expected-keep-
falling?width=775&height=500&iframe=true. 86 Harper College College Plan 2018-2019, p. 125.
-2.6%
9,962 -2.9%
9,675 -3.1%
9,374 -0.5%
9,328
0.0%
9,324 -0.2%
9,304
FY2016 FY2017 FY2018 FY2019 Projection FY2020 Projection FY2021 Projection
Harper FTE Enrollment

20
OPPORTUNITIES An opportunity is an external trend or situation that, if acted upon, may have a positive impact on the institution.
Opportunity 1: Alternative Means of Earning Credit and Alternative Delivery Methods
Item Description:
In many accredited public and private universities across the United States, credit may be given for
adequately documented and validated experiential equivalent learning of a postsecondary nature.
Providing alternative means for students to earn college credit decreases both the cost and time for
obtaining a credential or reaching other educational goals. Key drivers to the expansion of alternative
credentials are low unemployment rates and concerns about rising student debt levels.87
Supporting Information:
Alternative Means for Earning College Credit
Competency-based education (CBE) has become an increasingly common means of earning college
credit and has caught the attention of federal and state policymakers, foundations, and higher
education institutions.88 Broadly defined, CBE is a form of education in which credit is provided
based on student learning rather than credit or clock hours. CBE programs are often a far more
affordable route to college credit and credentials than traditional programs.89 CBE takes two primary
forms:90
Prior learning assessments, granting credit for content previously mastered; and
Competency-based coursework, where mastery of academic content is demonstrated.
An opportunity exists for higher education providers to broaden the availability of CBE, for example
by engaging employers as partners in these programs. Specifically, employers working more directly
with educational institutions can provide the inputs needed to effectively create, clarify, and assess
competencies, providing connections to careers that deliver a beneficial return on investment to
students who complete CBE programs.91 Additionally, employer enthusiasm for CBE programming
positively correlates with awareness. As employers learn more about CBE and its advantages to
students and business, they become more eager to hire CBE graduates.92
In addition to recognizing and offering competency-based education, institutions of higher education
are beginning to credential various forms of “informal” learning. New versions of academic
transcripts are emerging with credit given for achievement of learning outcomes related to co-
curricular activities and well as identification of areas of mastery and competency.93 These transcripts
are referred to as “comprehensive student records” and communicate what students know and are
able to do in ways that traditional academic transcripts do not.
Industry recognized credentials aligned to postsecondary programs are another means of awarding
87 Paul Fain, “On-Ramps and Off-Ramps: Alternative Credentials and Emerging Pathways Between Education and Work,” Inside
Higher Ed, 2018, p. 8. 88 Robert Kelchen, “The Landscape of Competency-Based Education,” Center on Higher Education Reform American Enterprise
Institute, January 2015, p. 1. 89 Ibid, p. 8. 90 Ibid, p. 2. 91 Chip Franklin and Robert Lytle, “Employer Perspectives on Competency-Based Education,” Center on Higher Education Reform
American Enterprise Institute, April 2015, p. 1-2. 92 Ibid, p. 3. 93 Work Group Report, “Connecting Credentials Building Learning-Based Credentialing Systems,” November 2017, p. 7.

21
credit. Often, these credentials are required by employers to affirm competency in the knowledge,
skills and abilities required in jobs within specific areas such as finance, manufacturing, information
technology and healthcare. Alignment of credentials creates educational pathways from high school
to community colleges and ultimately to four-year institutions that connect to employment. 94
Alternative Delivery Methods
Alternative methods for delivering higher education represent additional opportunities. Accelerated
delivery options and online programming are the leading alternative delivery methods. When adults
in Harper’s district were asked about preferred formats for earning a certificate or degree, 58% were
interested in attending accelerated or online programs, 54% were interested in programs with a class
offered the same night each week for a year, 46% were interested in programs meeting once a month
with online work, and 36% were interested in attending weekend programs.95
In 2016, 71% of district employers used online training, citing its convenience, efficiency, topic
specificity, and timeliness as reasons for choosing this modality.96 Employers believe that alternative
degree formats would make their employees more likely to enroll in degree programs.
Accelerated degree programs: 55% of smaller employers (100 or less than employees) and
64% of larger employers (more than 100 employees) reported they believe their employees
would be more likely to seek a degree if an accelerated degree program was available.
Online degree programs: 59% of smaller employers and 74% of larger employees indicated
they believe their employees would be more likely to seek a degree if an online degree was
offered. Additionally, 53% of smaller employers and 73% percent of the larger employers
also agreed that their employees would be more likely to enroll in a degree program if it met
locally once a month and had online work associated with it.97
Online programs can offer decreased cost and time to completion for students.98 Examples include
programs at Arizona State University and the University of Arkansas:
Arizona State University (ASU) offers students free, ASU-designed courses on edX. Upon
successful completion of online, synchronous courses and a proctored exam, students can
choose to pay $600 per course for ASU course credit. These credits can be applied to a degree
after enrolling at the University or another institution.99
The University of Arkansas System created a fully online eVersity to remove barriers for
adult students who commonly enroll with large numbers of credits from other institutions.100
Higher education has the opportunity to increase online offerings as new forms of credentialing are
introduced. If experts are correct, the online education field will continue to expand, with early
adopters, from community colleges to research universities, separating themselves from the rest.101
94 New Skills for Youth. 2018. Credential Currency: How States can Identify and Promote Credentials of Value, pp 2-3. 95 Clarus Corporation. 2016. Harper College Community Survey, April 2016, p. 38. 96 Ibid, p. 70. 97 Ibid, p. 84. 98 Paul Fain, “On-Ramps and Off-Ramps: Alternative Credentials and Emerging Pathways Between Education and Work,” Inside
Higher Ed, 2018, p. 29. 99 Ibid, p. 32. 100 Ibid, p. 34. 101 Ibid, p. 6.

22
Opportunity 2: Changing District and Student Demographics
Item Description:
Harper’s changing district demographics present an opportunity to assess and address the needs of the
changing community. Diversity in the Harper community is increasing, bringing with it additional
changes, such as decreases in household income and increases in foreign born residents. As a result
of district changes, Harper’s student population is changing. As an emerging Hispanic Serving
Institution, Harper has an opportunity to increase the completion and retention rates of Hispanic
students, the majority of whom enroll at community colleges.
Supporting Information:
The Harper College district population continues to become more diverse in numerous ways:
Harper’s district population is 33.8% non-white, an increase of 3.7% from 2010 to 2015.102
Asian and Hispanic populations have seen large increases from 2010-2015, while the White
non-Hispanic population has experienced a large decrease.103
District families reporting annual income of less than $30,000 increased from 2.5% in 2013 to
9.3% in 2016.104
Residents reporting a primary language other than English spoken in the home increased from
5.5% in 2013 to 11.2% in 2016.105
Harper’s district has seen large increases in foreign-born students arriving from Mexico, India
and Poland.106
Residents who have lived in the district for less than five years has increased from 6.5% in
2013 to 12.8% in 2016.107
These district changes have contributed to changes in the Harper student population:
Enrollment of Hispanic students has increased from 25.9% in fall 2015 to 28.3% in fall 2018,
during the same time, enrollment of White students decreased from 53.8%% to 49.5%.108
Enrollment shifts bring more first-generation students to Harper as 82% of Hispanic students
are first-generation, compared to 47% of non-Hispanic students.109
Many Harper students are experiencing basic needs insecurity. In FY2017, 405 students
completed a survey with results indicating 45% of respondents identifying as food insecure
and 44% responding as housing insecure.110
Given these changing demographics, colleges and universities need to adjust and discover alternative
ways to support the students, inside and outside of the classroom. Students with “nontraditional”
backgrounds will become more prevalent and traditional methods for meeting their needs will no
longer prove effective.
102 Northern Illinois University, Center for Governmental Studies. 2017, Harper College Environmental Scan, February 2017, p. 26. 103 Ibid, p. 27. 104 Clarus Corporation. 2016. Harper College Community Survey, April 2016, p. 33. 105 Ibid. 106 Northern Illinois University, Center for Governmental Studies. 2017, Harper College Environmental Scan, February 2017, p. 31. 107 Clarus Corporation. 2016. Harper College Community Survey, April 2016, p. 32. 108 Harper College Fact Book 2018-2019, p. 23. 109 Harper College Latinx Success, A vision for Harper College, May 2018, p. 5. 110 Wisconsin Hope Lab. Report for Fall 2016 Survey of Student Basic Needs, p. 2.

23
Opportunity 3: Partnerships with Educational Institutions, Business and Industry
Item Description:
Partnerships with educational institutions, as well as businesses and industry, are vital to providing
relevant educational opportunities to students, meeting workforce needs of the district, and ensuring
the College’s role as a leader in community college education. Partnerships across all levels are
critical for designing coherent education and career systems.111
Supporting Information:
Harper has developed partnerships with a variety of external organizations. Partnerships with K-12
educational institutions include elementary and middle school participation in campus tours, the
ambassador school program, efforts to increase college-readiness for district high school graduates,
development of the Promise Scholarship Program, and increased dual credit offerings. Partnerships
with other higher education providers can be seen in the development of the University Center and
the Education and Work Center. Additionally, partnerships with business and industry include
apprenticeship programs, clinical sites for students, and program advisory committees.
While Harper and the community have benefited from strong existing partnerships, maintaining,
enhancing, and growing partnerships is essential to advancing the community college mission.
College-Readiness/Remediation: Partnerships with K-12 educational institutions can help
students by increasing college-readiness, decreasing the need for remediation, and ensuring
alignment of curricula.112
Quality/Accessibility/Affordability: Partnerships with other community colleges can lead to
shared curricula,113 resource pooling and collaborative supports for students,114 and cost
reduction through cost-sharing initiatives.115 Partnerships between community colleges and
four-year institutions can benefit students by decreasing costs, reducing the number of credits
lost, and improving retention and completion rates.116
Workforce Needs/Skill Development: Partnerships with business and industry can help meet
the needs of the workforce. District employers identified the availability of qualified
employees as their most significant barrier to growth,117 followed by current employee skill
level.118 These needs are echoed by national research.119 120 Partnerships with business and
industry should focus on matching education and training with jobs, reviewing labor market
111 “Empowering Community Colleges To Build the Nation’s Future, an Implementation Guide,” American Association of Community
Colleges, 2014, p. 43. 112 Ibid, p. 15. 113 Ibid, p. 24. 114 Ibid, p. 28. 115 Douglas J. Guth, “Coming Out of the Dark,” America Association of Community Colleges, Community College Journal,
October/November 2018. 116 “These 2-Year and 4-Year College Partnerships Keep Students From Falling Through the Cracks,” last modified April 30, 2018,
accessed January 28, 2019, https://www.chronicle.com/article/These-2-Year4-Year/243283. 117 Clarus Corporation. 2016. Harper College Community Survey, April 2016, p. 50. 118 Ibid. 119 “Empowering Community Colleges To Build the Nation’s Future, an Implementation Guide,” American Association of Community
Colleges, 2014. 120 Dennis Pierce, “Use What You’ve Got Community Colleges are Finding Creative Ways to Grow Revenues,” American Association
of Community College, October/November 2018.

24
trends and employers’ needs, and closing the skills gap.121 122 For example, the College might
create customized programming for local employers in high-demand skills123 or work with
local businesses to ensure employees can take advantage of tuition assistance benefits.124 The
College might also offer customized information sessions, financial aid planning, on-site
enrollment, and academic advising at job sites.125 Furthermore, partnering with industry
provides faculty with the opportunity to better embed industry standards into the curriculum
and provides students the opportunity to have real-world experiences with actual industry
clients.126 Finally, the industries benefit from the students’ work in areas of innovation and
client relations.
121 “Empowering Community Colleges To Build the Nation’s Future, an Implementation Guide,” American Association of Community
Colleges, 2014, p. 20-21. 122 Dennis Pierce, “Use What You’ve Got Community Colleges are Finding Creative Ways to Grow Revenues,” American Association
of Community College, October/November 2018. 123 Ibid, p. 25. 124 Ibid, p. 26. 125 Ibid. 126 “The NMC Horizon Report: 2018 Higher Education Edition,” New Media Consortium and the EDUCAUSE Learning Initiative,
2018, p. 11.

25
Opportunity 4: Strategies to Attract and Retain Students
Item Description:
Community colleges continue to experience declines in enrollment and low completion rates. With
the traditional-aged college-going population decreasing, the opportunity exists to attract students
from different demographic populations. Additionally, once students are enrolled it is essential to
implement programs that will positively impact persistence and completion.
Supporting Information:
National enrollment projections continue to show a decrease in traditional-aged students.127 In
Harper’s district and elsewhere, birthrates and K-12 enrollments are declining, negatively impacting
enrollment. To increase enrollment, community colleges need to attract non-traditional students. This
includes baby boomers, dual-credit, veterans, and reverse transfers.128 A large potential growth
market is adults as 37 million Americans have some college credit but no degree.129
Community colleges are a quality, affordable sector of higher education. Marketing their affordably,
especially to non-traditional student populations, may increase enrollments. Community colleges
have lower tuition rates and smaller annual increases in tuition than four-year colleges and
universities. Recent data indicate that the average in-district tuition/fees at a community college is
less than half of the average in-state tuition/fees at a public, four-year university, $3,570 and $9,970,
respectively.130Additionally, community college students have lower debt than their four-year
counterparts, with 59% being debt free.
Colleges can implement strategies that increase affordability, thereby attracting students. Such
strategies include:
Promise programs which provide low or no-cost education for the first two-years of
college.131
Adoption of Open Educational Resources (OER) in the classroom dramatically decreases the
cost of textbooks for students.132
Z-Degree programs, those with zero textbook costs for students, build on the use of OER. In
addition to saving students money, Z-Degree programs reduce the number of dropped courses
and increase course success rates.133
Acceleration of developmental course sequencing.134
Colleges can implement strategies that increase retention and completion of those enrolled. Pathways
is an example of a strategy that can positively address enrollment and completion, as well as
127 Paul Fain, “On-Ramps and Off-Ramps: Alternative Credentials and Emerging Pathways Between Education and Work,” Inside
Higher Ed, 2018, p. 8. 128 Grace Chen, “7 Trends in Community Colleges, Community College Review,” August 17, 2017. Retrieved from
https://www.communitycollegereview.com/blog/7-trends-in-community-colleges. 129 Paul Fain, “On-Ramps and Off-Ramps: Alternative Credentials and Emerging Pathways Between Education and Work,” Inside
Higher Ed, 2018, p. 9. 130 “Fast Facts 2018,” American Association of Community Colleges, accessed January 22, 2019, https://www.aacc.nche.edu/research-
trends/fast-facts/. 131 “About the College Promise Movement,” accessed January 22, 2019, http://collegepromise.org/the-promise/. 132 “Open Educational Resources (OER) Degree Initiative,” accessed January 22, 2019,
https://www.achievingthedream.org/resources/initiatives/open-educational-resources-oer-degree-initiative. 133 “Proliferation of Open Educational Resources.” NMC Horizon Report 2018 Higher Education Edition, p. 15. 134 “California’s new effort to fix remedial education,” The Hechinger Report, accessed May 9, 2019,
https://hechingerreport.org/californias-new-effort-fix-remedial-education/.
26
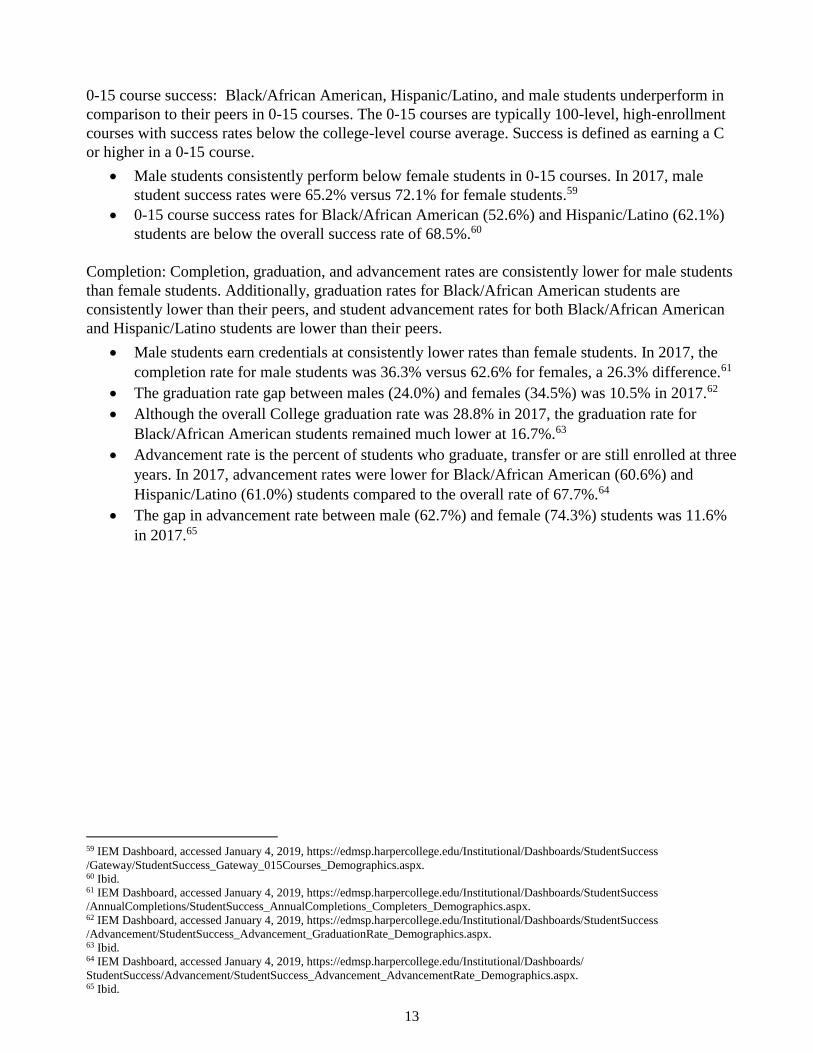
workforce skills gaps.135 Pathways provide a framework for the College’s interaction with the student
and are a partnership between student and institution, with expectations for both parties. Critical to
their success is the construction of coherent, structured pathways to certificate and degree
completion, and ensuring that students enter a pathway soon after beginning.136 When students
develop clearly articulated education plans and enter pathways, they make informed decisions about
coursework, future employment and potential earnings.137 Early research regarding the impact of
pathways on retention and completion is positive. For example, since implementation of guided
pathways, completion rates at Georgia State University have increased almost 20% for white students
and more than 30% for African American and Hispanic students.138 The City University of New York
has experienced similar increases for students in their Accelerate Study program.139
Colleges can increase student persistence and completion rates by focusing on careers and job
placement.140 Community colleges need to ensure alignment of program offerings with workforce
needs and projected job growth. Education in preparation for employment is receiving bipartisan
support as it is clear the nation needs skilled workers and education is the vehicle to develop these
workers.141 Community colleges play a critical role in developing a skilled workforce. Job
opportunities for graduates are improving in fields where community colleges have robust programs:
manufacturing, professional and technical services, finance and industry, and health care. Community
colleges must develop, sustain, and market programs in areas with job growth and strong wages.
135 “Empowering Community Colleges, To Build the Nation’s Future, an Implementation Guide,” American Association of
Community Colleges, 2014, p. 6. 136 Ibid, p. 8. 137 Ibid, p. 11. 138 Rob Johnstone, “Guided Pathways Demystified: Exploring Ten Commonly Asked Questions about Implementing Pathways,”
National Center for Inquiry & Improvement, November 2017, p. 6. 139 Ibid. 140 Grace Chen, “7 Trends in Community Colleges, Community College Review,” August 17, 2017. Retrieved from
https://www.communitycollegereview.com/blog/7-trends-in-community-colleges. 141 John Colbert and Leander J. Folley III, “Emerging trends to watch in Washington,” American Association of Community College,
October/November 201, p. 5.

27
THREATS A threat is an external trend or situation that, if not acted upon, may have a negative impact on the institution.
Threat 1: Funding and Financing Higher Education
Item Description:
The reduction in state funding of higher education coupled with changes in federal regulations, places
financial burdens on educational institutions and students. With two of the three community college
revenue sources, state appropriations and property taxes, decreasing or projected to decrease, colleges
are forced to find alternative revenue sources or rely on the remaining source of revenue, which is
student tuition and fees. This comes at a time when those who have the most need for higher
education are least likely to be able to pay.
Supporting Information:
Funding for higher education has been negatively impacted by a reduction in state appropriations and
an increase in pension liability.
Despite steadily growing student demand for higher education since the mid-1970s, state
fiscal investment in higher education has been declining since 1980. Based on funding trends
since 1980, average state fiscal support for higher education will reach zero by 2059.142
Of the 49 states analyzed, 44 states spent less per student in 2017 than in 2008, with Illinois
experiencing a -36.9% change.143 The only states spending more in 2017 were Indiana,
Montana, Nebraska, North Dakota, and Wyoming.144
Although Illinois increased support for higher education between 2010 and 2015, over one
third of the increase was to shore up pension funds rather than to provide educational
services.145
Threats to shift state pension obligations back to the employee could result in significant
annual costs to the College.146
Individual ability to finance higher education has decreased as a result of cuts to state and federal aid,
high state taxes, and declining household incomes.
Higher education federal policy appears to be heading towards deregulation, student aid cuts,
and the gutting of programs that help the neediest students, including PELL grants.147
The gap between those who are eligible for funds from the Illinois Monetary Awards Program
(MAP), but did not receive an award, continues to widen. Among those who are eligible, only
36% were awarded, leaving more than 219,000 Illinois students without MAP assistance.148
142 Thomas G. Mortenson, “State Funding: A Race to the Bottom,” American Council on Education, Winter 2012. Retrieved from
https://www.acenet.edu/the-presidency/columns-and-features/Pages/state-funding-a-race-to-the-bottom.aspx. 143 Michael Mitchell, Michael Leachman, and Kathleen Masterson, “A Lost Decade in Higher Education Funding,” Center on Budget
and Policy Priorities, August 23, 2017, p. 5. 144 Ibid, p. 2. 145 Northern Illinois University, Center for Governmental Studies. 2017, Harper College Environmental Scan, February 2017, p. 18. 146 Jose Sanchez, “Examining Another Plan to Shift Pension Cost Back to Schools,” Better Government Association, March 27, 2018,
Retrieved from https://www.bettergov.org/news/examining-another-plan-to-shift-pension-costs-back-to-schools. 147 Karen A. Stout, “Top 15 Trends in Community College Student Success and Philanthropy,” Achieving the Dream, September 1,
2017, p. 1 item #3. 148 Northern Illinois University, Center for Governmental Studies. 2017, Harper College Environmental Scan, February 2017, p. 57.

28
The state income tax increase resulted in a large increase in the overall tax burden. The State’s
tax burden is currently the 5th highest in the nation. Illinois ranks as one of the highest in
property tax rankings, putting an additional financial burden on taxpayers.149
Median household income declined in 16 of the 23 communities in the Harper district
between 2010 and 2015. Incomes in these communities experienced decreases as large as
24.6%. Ten communities experienced a greater rate of decline than the State average 5.2%.150
149 Northern Illinois University, Center for Governmental Studies. 2017, Harper College Environmental Scan, February 2017, p. 19. 150 Ibid, p. 12 and 27.

29
Threat 2: Higher Education in a Competitive Market
Item Description:
In today’s interconnected world, education is an increasingly competitive commodity.151 152 153 To
remain relevant in an environment where alternative credentials and education providers are growing,
colleges and universities must offer quality education in ways that meet the needs and demands of
students and employers.
Supporting Information:
Population decreases coupled with large numbers of education providers have created an increasingly
competitive market. Illinois’ population, for example, has decreased by over 27,000 residents since
the 2010 census.154 Additionally, the Chronicle of Higher Education projects a 13.0% decrease in
high school graduates in Illinois from 2018-19 to 2028-29.155 Further, the College's recent
Environmental Scan points to more than 70 education providers within 25 miles of Harper’s main
campus, offering approximately 600 degree, certificate, or other training programs.156 Competition
for students also exists outside of this radius. Public and private institutions in nearby states are
enrolling large numbers of Illinois freshman. In fall 2017, nearly 17,000 Illinois first-time students
enrolled at a public or private institution in Iowa, Indiana, Michigan, Missouri, or Wisconsin.157 In
addition to the competition from both in-state and out-of-state traditional brick and mortar education
providers, the growth of online and non-traditional education providers further complicate the higher
education landscape. As such, colleges need to adapt and innovate in order to remain relevant.
According to recent research, a third wave of postsecondary education, termed demand-driven
education, is occurring. In this setting, postsecondary education must adapt to the needs of workers
over the course of their lifetimes.158 This convergence between education and employment must be
met by higher education institutions in order to remain viable in the global economy. Other
organizations, both inside and outside of higher education, are already expanding their work with a
variety of students in order to meet these demands. For example, Southern New Hampshire
University has partnered with a non-profit that serves disadvantaged populations in order to create
new learning and workforce strategies such as micro-credentials, badges, and playlists.159
Additionally, IBM has issued more than 500,000 badges or micro-credentials to both employees and
external learners who want to build skills and develop competency-based portfolios.160
151 “Universities must prepare for a technology-enabled future,” last modified January 9, 2018, accessed January 28, 2019,
https://theconversation.com/universities-must-prepare-for-a-technology-enabled-future-89354?xid=PS_smithsonian. 152 Gary W. Matkin, “Alternative Digital Credentials: An Imperative for Higher Education,” February 2018, accessed January 28, 2019
https://cshe.berkeley.edu/sites/default/files/publications/rops.cshe.2.2018.matkin.altdigitalcredential.1.30.2018.pdf. 153 “Universities Must Expand Reach to Stay Competitive,” last modified February 12, 2018, accessed January 28, 2019,
https://scs.georgetown.edu/news-and-events/article/7116/universities-must-expand-reach-stay-competitive. 154 “United States Census Bureau,” accessed May 20, 2019, https://www.census.gov/. 155 “Compare the States,” last modified August 19, 2018, accessed January 28, 2019, https://www.chronicle.com/interactives/almanac-
2018?cid=cp218.
156 Northern Illinois University, Center for Governmental Studies, Harper College Environmental Scan, February 2017, p. 110-126. 157 “National Center for Education Statistics,” Fall 2017 enrollment data retrieved May 2019, https://nces.ed.gov/ipeds/use-the-data. 158 Joe Deegan and Nathan Martin, “Merging work & learning to develop the human skills that matter,” Pearson, p. 6. 159 “#2: SNHU’s new program reimagines the concept of college,” Robert Lerose, last modified December 28, 2018, accessed, January
28, 2019, https://www.ecampusnews.com/2018/12/28/2-snhus-new-program-reimagines-the-concept-of-college/. 160 Work Group Report, “Connecting Credentials Building Learning-Based Credentialing Systems,” November 2017, p. 4.

30
The number of providers of alternative credentials, both accredited and non-accredited, has grown
with large numbers of students engaging in non-traditional approaches to higher education.161 Many
corporations, professional organizations, and labor unions are working to address the educational
needs of their employees by offering industry-specific competency-based offerings, either with or
without a higher education partner.162 Additionally, certificates are being issued by employers and
other non-college education providers. These credentials often take less than two years to complete
and feature assessments that are based on job-relevant skills.163
Institutions of higher education need to be adaptive and work with employers to develop employee
skills, or they will be left behind.164 To remain competitive in the education market, colleges and
universities need to acknowledge that not all students want or need a traditional degree. Student
needs vary and require alternative paths to success, and employers require skills over degrees.165 As
employers move towards competencies required for job roles and career paths, higher education must
align itself with these needs. In a recent survey of colleges and universities, 94% of institutions
reported awarding some form of alternative credential, with 70% offering noncredit training, 20%
awarding digital badges, and 13% offering a form of micro-credential.166
Nationwide, online enrollments are increasing while overall postsecondary enrollments are falling.167
In recent years, the growth rate of online credit course enrollments has been approximately ten times
the overall growth rate of higher education enrollments.168 The percent of all students enrolled in
postsecondary education who take at least one online course has grown from 24.8% in 2012 to 33.1%
in 2017.169 170 This 33.1% equates to approximately 7 million students nationwide, the majority of
whom are community college students.171 Additionally, the largest growth in online education is
occurring in public and private nonprofit institutions, rather than for-profit institutions. At public
institutions, from 2016 to 2017, the percent of students enrolled exclusively in online courses
increased 7.2%, as did the percent enrolled in some online. At private nonprofit institutions during
the same time period, the percent of students enrolled exclusively in online courses increased 8.2%
and those enrolled in some online courses increased by 6.6%.172 With decreasing enrollments overall,
colleges need to expand opportunities for students to learn via an online platform in order to remain
competitive in the digital era.
161 Michelle R. Weise, “Alternative Credentials and the Pathway to an Unbundled Higher Ed Environment,” last modified September
2016, accessed January 28, 2019, https://evolllution.com/managing-institution/higher_ed_business/alternative-credentials-and-the-
pathway-to-an-unbundled-higher-ed-environment/. 162 Paul Fain, “On-Ramps and Off-Ramps: Alternative Credentials and Emerging Pathways Between Education and Work,” Inside
Higher Ed, 2018, p. 5. 163 Ibid, p. ii. 164 Michelle R. Weise, “Alternative Credentials and the Pathway to an Unbundled Higher Ed Environment,” last modified September
2016, accessed January 28, 2019, https://evolllution.com/managing-institution/higher_ed_business/alternative-credentials-and-the-
pathway-to-an-unbundled-higher-ed-environment/. 165 Ibid. 166 Paul Fain, “On-Ramps and Off-Ramps: Alternative Credentials and Emerging Pathways Between Education and Work,” Inside
Higher Ed, 2018, p. 8. 167 Doug Lederman, “Online Education Ascends,” last modified November 2018, accessed January 28, 2019,
https://www.insidehighered.com/digital-learning/article/2018/11/07/new-data-online-enrollments-grow-and-share-overall-enrollment. 168 Peter Shea and Temi Bidjerano “Does online learning impede degree completion?” last modified 2014, accessed January 29, 2019,
http://www.sunyresearch.net/hplo/wp-content/uploads/2014/03/c-e-paper-2014.pdf, p. 103. 169 Doug Lederman, “Online Education Ascends,” last modified November 2018, accessed January 28, 2019,
https://www.insidehighered.com/digital-learning/article/2018/11/07/new-data-online-enrollments-grow-and-share-overall-enrollment. 170 Doug Lederman, “Who is Studying Online (and where),” last modified January 5, accessed January 29, 2019,
https://www.insidehighered.com/digital-learning/article/2018/01/05/new-us-data-show-continued-growth-college-students-studying. 171 Peter Shea and Temi Bidjerano “Does online learning impede degree completion?” last modified 2014, accessed January 29, 2019,
http://www.sunyresearch.net/hplo/wp-content/uploads/2014/03/c-e-paper-2014.pdf, p. 103. 172 Doug Lederman, “Online Education Ascends,” last modified November 2018, accessed January 28, 2019,
https://www.insidehighered.com/digital-learning/article/2018/11/07/new-data-online-enrollments-grow-and-share-overall-enrollment.

31
Threat 3: Uncertain State of Higher Education
Item Description:
The state of higher education at the national level continues to be uncertain. The future of higher
education is uncertain and will be impacted by actions and decisions on policies related to the
Deferred Action for Childhood Arrivals (DACA) and the DREAM Act, and review and/or removal of
previously enacted Department of Education rules. Additionally, changing perspectives on the value
of higher education have the potential to negatively impact the College.
Supporting Information:
Value of Higher Education
Anxiety around higher education is growing in America. Historically, a degree has been the key to a
good job. But rising fees and increasing student debt, combined with shrinking financial and
educational returns, are undermining the perception that earning a degree is a good investment.
Today, nearly half of all students who begin college do not graduate within six years. Additionally,
students who borrow for college but never graduate are three times more likely to default on loans.173
With the Higher Education Act overdue for reauthorization, it is inevitable that policymakers rewrite
federal higher education policy in the next few years. However, the development of new policies
based on the same assumptions about the individual and economic benefits of debt-financed
education will only continue to deepen our country’s student debt crisis.174
Some question if a college degree still has value. The consensus is a resounding yes. Researchers
estimate college graduates earn about $1 million more over their lifetime than those without a
degree.175 Additionally the college wage "premium" – the difference in average earnings between
college graduates and those with just a high school diploma – has averaged approximately 56% over
the last three decades. When digging deeper into the data it becomes clear that, although the premium
has remained stable, the value of a degree is eroding. While there is evidence that a higher education
provides a gateway to a better paying job, the return on a college degree can vary widely. Thus,
pursuing a postsecondary education remains a risky and expensive investment for families – and one
whose value diminishes if costs increase faster than wages. 176
Immigration and Deferred Action for Childhood Arrivals (DACA)
The DACA policy was implemented in 2012 to protect individuals who entered the United States
from foreign countries as children.177 This protection includes work authorization and deferred
removal action. Many of those protected by DACA are enrolled in institutions of higher education. In
2017, the President of the United States declared an end to DACA with no new applications
accepted.178 While in the appeal process, DACA holders can apply to renew DACA status. This is a
173 Office of Federal Student Aid (FSA) analysis. 174 Julie Margetta Morgan and Marshall Steinbaum, “The Student Debt Crisis, Labor Market Credentialization, and Racial Inequality,”
Roosevelt Institute, October 2018, p. 34. 175 Jaison R. Abel and Richard Deitz, “Do the Benefits of College Still Outweigh the Costs?” Federal Reserve Bank of New York,
Volume 20, Number 3, 2014 p. 4. 176 Ibid. 177 “Secretary Napolitano Announces Deferred Action Process for Young People Who are Low Enforcement Priorities,” last modified
June 15, 2012, last accessed January 30, 2019, https://www.dhs.gov/news/2012/06/15/secretary-napolitano-announces-deferred-action-
process-young-people-who-are-low. 178 “Trump Ends DACA Program, No New Applications Accepted,” last modified September 5, 2017, last accessed January 30, 2019,
https://www.nbcnews.com/politics/immigration/trump-dreamers-daca-immigration-announcement-n798686.

32
positive step for immigrant families, but not a permanent solution. Until there is a clean DREAM Act
that provides Dreamers with resolution, the future of DACA, and those impacted by it, is uncertain.
Deregulation of Education
The Department of Education is reviewing rules and considering deregulation as a method to bolster
the development of alternative credential pathways. This deregulation includes adjustments to rules
that govern accreditation, the faculty role in online programs, the outsourcing of programs to non-
accredited education providers, and the definition of the credit hour.179
The Department of Education is aiming to reimagine higher education and promote innovation by
changing the rules for accreditors and the providers of competency-based and online programs.180
These changes would include adjustments to rules regarding access to federal financial aid. Current
regulations state that in order to access federal aid, academic programs must be offered by accredited
colleges or universities with no more than 50% of a program contracted out to a non-accredited
provider.
While deregulation has seen modest bipartisan support as a means to grow funding options for online
and nontraditional credentials, concerns exist about the lack of oversight. Deregulation could lead to
abuse, by both for-profit and nonprofit education providers, especially if additional federal funds are
directed towards these programs.181
179 Paul Fain, “On-Ramps and Off-Ramps: Alternative Credentials and Emerging Pathways Between Education and Work,” Inside
Higher Ed, 2018, p. 51. 180 Ibid, p. 53. 181 Ibid, p. 11.