2019 - Lee & Associates...9610 DeSoto Ave Chatsworth 37,260 Delta Hi-Tech, Inc. UNDER CONSTRUCTION...
64
Q3 2019 Market Reports lee-associates.com LINK A BLOG BY
Transcript of 2019 - Lee & Associates...9610 DeSoto Ave Chatsworth 37,260 Delta Hi-Tech, Inc. UNDER CONSTRUCTION...
Q32019Market Reports
lee-associates.com LINKA BLOG BY
INDUSTRIAL
Q3 2019 MARKET REPORTS
LOCAL EXPERTISE. INTERNATIONAL
REACH. WORLD CLASS.
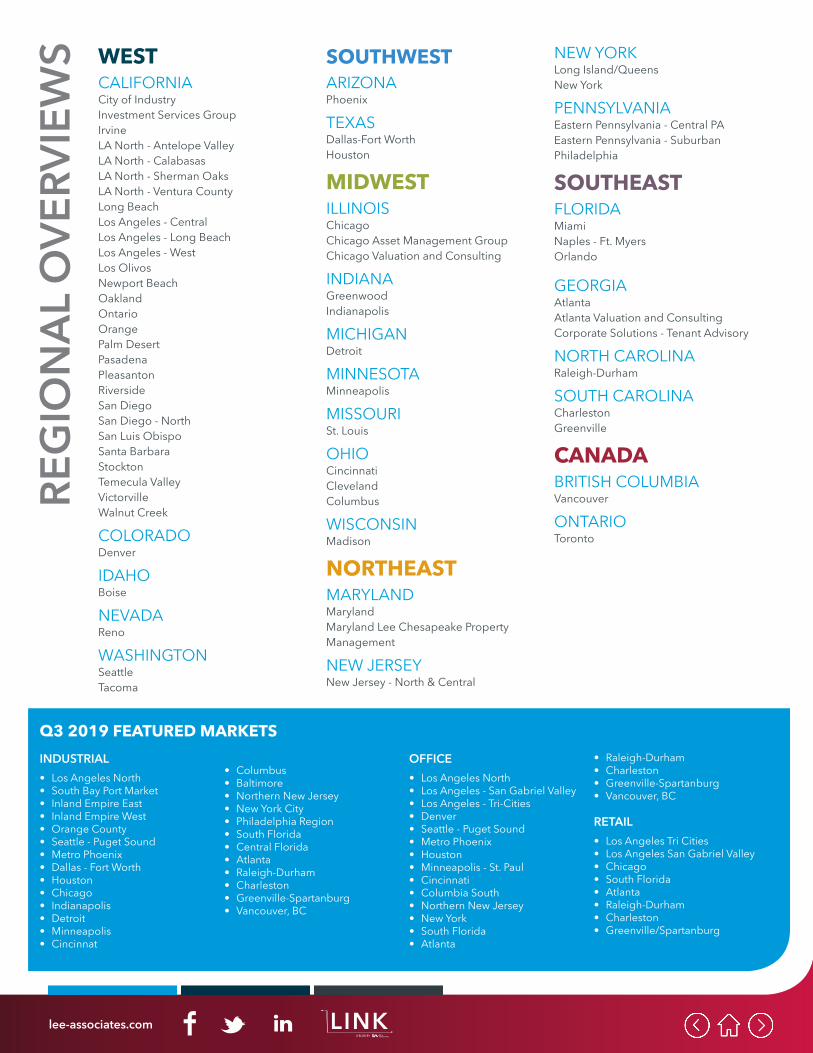
REGIONAL OVERVIEWS
INDUSTRIAL
lee-associates.com LINKA BLOG BY
REG
ION
AL O
VERV
IEW
S WEST CALIFORNIACity of IndustryInvestment Services GroupIrvineLA North - Antelope ValleyLA North - CalabasasLA North - Sherman OaksLA North - Ventura CountyLong BeachLos Angeles - CentralLos Angeles - Long BeachLos Angeles - WestLos OlivosNewport BeachOaklandOntarioOrangePalm DesertPasadenaPleasantonRiversideSan DiegoSan Diego - NorthSan Luis ObispoSanta BarbaraStocktonTemecula ValleyVictorvilleWalnut Creek COLORADODenver IDAHOBoise NEVADAReno WASHINGTONSeattleTacoma
SOUTHWEST ARIZONAPhoenix TEXASDallas-Fort WorthHouston
MIDWEST ILLINOISChicagoChicago Asset Management GroupChicago Valuation and Consulting INDIANAGreenwoodIndianapolis MICHIGANDetroit MINNESOTAMinneapolis MISSOURISt. Louis OHIOCincinnatiClevelandColumbus WISCONSINMadison
NORTHEAST MARYLANDMarylandMaryland Lee Chesapeake Property Management NEW JERSEYNew Jersey - North & Central
NEW YORKLong Island/QueensNew York PENNSYLVANIAEastern Pennsylvania - Central PAEastern Pennsylvania - Suburban Philadelphia
SOUTHEAST FLORIDAMiamiNaples - Ft. MyersOrlando
GEORGIAAtlantaAtlanta Valuation and ConsultingCorporate Solutions - Tenant Advisory NORTH CAROLINARaleigh-Durham SOUTH CAROLINACharlestonGreenville
CANADA BRITISH COLUMBIAVancouver ONTARIOToronto
Q3 2019 FEATURED MARKETSINDUSTRIAL• Los Angeles North• South Bay Port Market• Inland Empire East• Inland Empire West• Orange County• Seattle - Puget Sound• Metro Phoenix• Dallas - Fort Worth• Houston• Chicago• Indianapolis• Detroit• Minneapolis• Cincinnat
• Columbus• Baltimore• Northern New Jersey• New York City• Philadelphia Region• South Florida• Central Florida• Atlanta• Raleigh-Durham• Charleston• Greenville-Spartanburg• Vancouver, BC
OFFICE• Los Angeles North• Los Angeles - San Gabriel Valley• Los Angeles - Tri-Cities• Denver• Seattle - Puget Sound• Metro Phoenix• Houston• Minneapolis - St. Paul• Cincinnati• Columbia South• Northern New Jersey• New York• South Florida• Atlanta
• Raleigh-Durham• Charleston• Greenville-Spartanburg• Vancouver, BC
RETAIL• Los Angeles Tri Cities• Los Angeles San Gabriel Valley• Chicago• South Florida• Atlanta• Raleigh-Durham• Charleston• Greenville/Spartanburg
lee-associates.com LINKA BLOG BY
Q3INDUSTRIAL NATIONAL OVERVIEW
MOST 12-MONTH SALES VOLUME & AVERAGE PRICE PER SF
Market Sales Volume Avg Price/SF Market Sales Volume Avg Price/SF
Los Angeles, CA $4,950,475,716 $209.00 New York, NY $4,555,393,903 $176.00
Inland Empire, CA $4,402,605,068 $144.00 Chicago, IL $3,995,987,800 $75.00
San Jose, CA $3,497,600,800 $338.00 Atlanta, GA $2,704,439,940 $66.00
Orange County, CA $2,290,303,034 $239.00 Phoenix, AZ $$2,214,740,522 $106.00
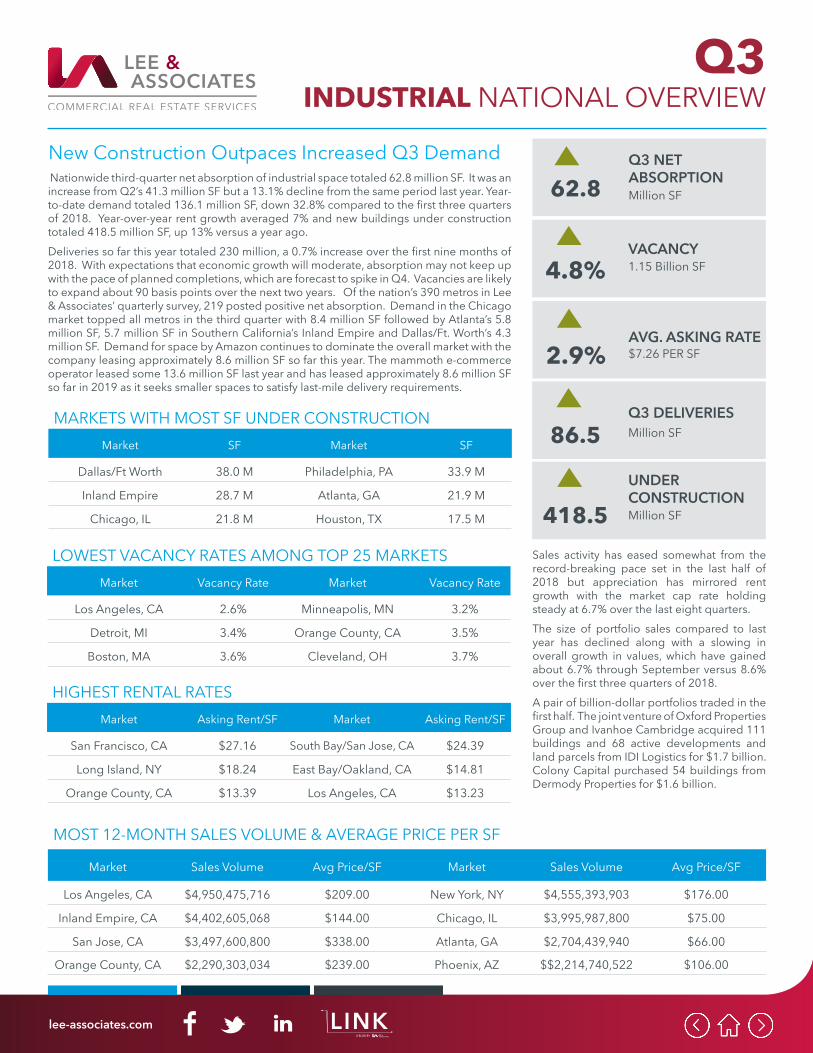
Nationwide third-quarter net absorption of industrial space totaled 62.8 million SF. It was an increase from Q2’s 41.3 million SF but a 13.1% decline from the same period last year. Year-to-date demand totaled 136.1 million SF, down 32.8% compared to the first three quarters of 2018. Year-over-year rent growth averaged 7% and new buildings under construction totaled 418.5 million SF, up 13% versus a year ago.Deliveries so far this year totaled 230 million, a 0.7% increase over the first nine months of 2018. With expectations that economic growth will moderate, absorption may not keep up with the pace of planned completions, which are forecast to spike in Q4. Vacancies are likely to expand about 90 basis points over the next two years. Of the nation’s 390 metros in Lee & Associates’ quarterly survey, 219 posted positive net absorption. Demand in the Chicago market topped all metros in the third quarter with 8.4 million SF followed by Atlanta’s 5.8 million SF, 5.7 million SF in Southern California’s Inland Empire and Dallas/Ft. Worth’s 4.3 million SF. Demand for space by Amazon continues to dominate the overall market with the company leasing approximately 8.6 million SF so far this year. The mammoth e-commerce operator leased some 13.6 million SF last year and has leased approximately 8.6 million SF so far in 2019 as it seeks smaller spaces to satisfy last-mile delivery requirements.
UNDER CONSTRUCTIONMillion SF418.5
VACANCY1.15 Billion SF4.8%
Q3 NET ABSORPTIONMillion SF 62.8
AVG. ASKING RATE$7.26 PER SF2.9%
Q3 DELIVERIESMillion SF 86.5
New Construction Outpaces Increased Q3 Demand
Sales activity has eased somewhat from the record-breaking pace set in the last half of 2018 but appreciation has mirrored rent growth with the market cap rate holding steady at 6.7% over the last eight quarters.The size of portfolio sales compared to last year has declined along with a slowing in overall growth in values, which have gained about 6.7% through September versus 8.6% over the first three quarters of 2018. A pair of billion-dollar portfolios traded in the first half. The joint venture of Oxford Properties Group and Ivanhoe Cambridge acquired 111 buildings and 68 active developments and land parcels from IDI Logistics for $1.7 billion. Colony Capital purchased 54 buildings from Dermody Properties for $1.6 billion.
MARKETS WITH MOST SF UNDER CONSTRUCTIONMarket SF Market SF
Dallas/Ft Worth 38.0 M Philadelphia, PA 33.9 M
Inland Empire 28.7 M Atlanta, GA 21.9 M
Chicago, IL 21.8 M Houston, TX 17.5 M
LOWEST VACANCY RATES AMONG TOP 25 MARKETSMarket Vacancy Rate Market Vacancy Rate
Los Angeles, CA 2.6% Minneapolis, MN 3.2%
Detroit, MI 3.4% Orange County, CA 3.5%
Boston, MA 3.6% Cleveland, OH 3.7%
HIGHEST RENTAL RATESMarket Asking Rent/SF Market Asking Rent/SF
San Francisco, CA $27.16 South Bay/San Jose, CA $24.39
Long Island, NY $18.24 East Bay/Oakland, CA $14.81
Orange County, CA $13.39 Los Angeles, CA $13.23
lee-associates.com LINKA BLOG BY
Q3
TOTAL INDUSTRIAL MARKET STATISTICSVacancy Rate Avg. SF Rental Rates GRS Net SF Absorption SF Inventory SF Under Construction
Q3 2019 2.20% $12.00 139,306 134,500,178 2,260,327
Q2 2019 2.30% $11.52 71,190 134,969,219 764,630
Q1 2019 2.10% $11.28 316,231 134,556,656 927,500
Q4 2018 2.30% $11.40 181,899 134,806,723 927,500
Q3 2018 2.40% $10.44 24,710 135,244,901 912,000
LOS ANGELES NORTH
LARGEST DELIVERIESAddress Submarket/City SF Developer
27788 Hancock Pkwy Santa Clarita 50,930 Trammell Crow Co
27736-27772 Hancock Pkwy Santa Clarita 32,667 Trammell Crow Co
- - - -
LARGEST UNDER CONSTRUCTIONAddress Submarket/City SF Delivery Date
Avion Burbank Burbank 1,000,000 Q4 2020
28820 Chase Pl Valencia 155,680 March 2020
Center @ Needham Ranch Santa Clarita 444,643 Q4 2019
SHELLY GARCIA, Director of Marketing
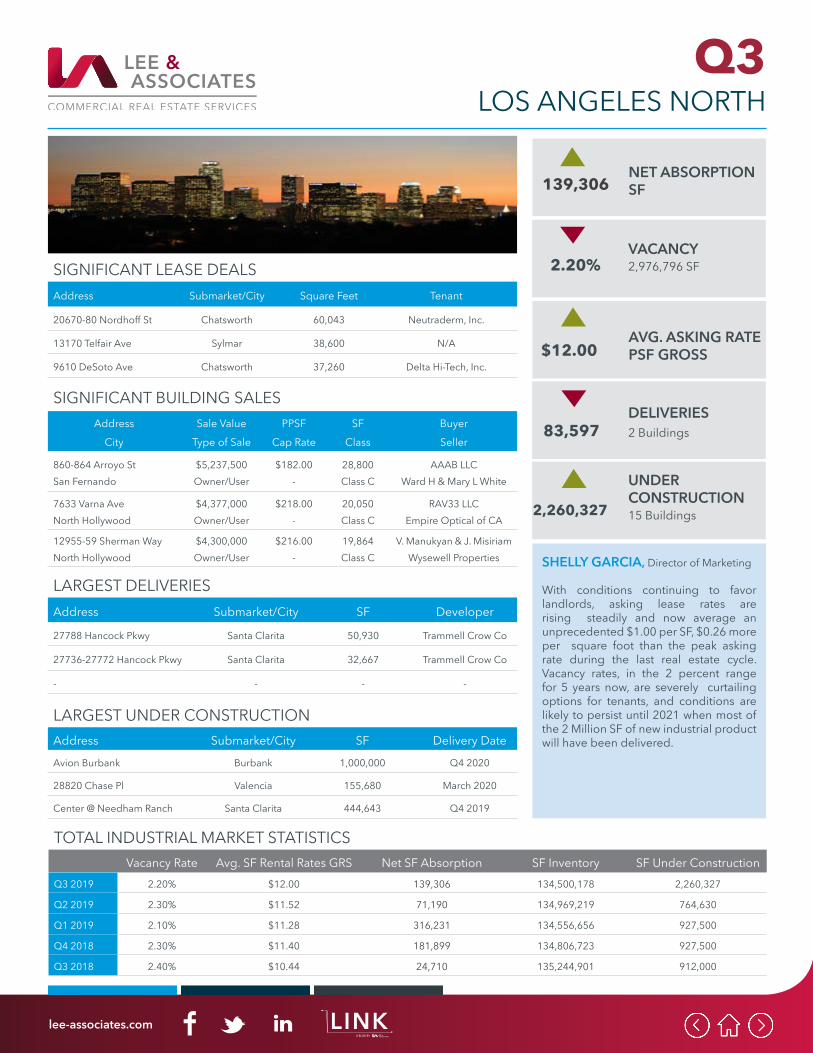
With conditions continuing to favor landlords, asking lease rates are rising steadily and now average an unprecedented $1.00 per SF, $0.26 more per square foot than the peak asking rate during the last real estate cycle. Vacancy rates, in the 2 percent range for 5 years now, are severely curtailing options for tenants, and conditions are likely to persist until 2021 when most of the 2 Million SF of new industrial product will have been delivered.
SIGNIFICANT BUILDING SALESAddress
CitySale Value
Type of SalePPSF
Cap RateSF
ClassBuyerSeller
860-864 Arroyo StSan Fernando
$5,237,500Owner/User
$182.00-
28,800Class C
AAAB LLCWard H & Mary L White
7633 Varna AveNorth Hollywood
$4,377,000Owner/User
$218.00-
20,050Class C
RAV33 LLCEmpire Optical of CA
12955-59 Sherman WayNorth Hollywood
$4,300,000Owner/User
$216.00-
19,864Class C
V. Manukyan & J. MisiriamWysewell Properties
SIGNIFICANT LEASE DEALSAddress Submarket/City Square Feet Tenant
20670-80 Nordhoff St Chatsworth 60,043 Neutraderm, Inc.
13170 Telfair Ave Sylmar 38,600 N/A
9610 DeSoto Ave Chatsworth 37,260 Delta Hi-Tech, Inc.
UNDER CONSTRUCTION15 Buildings2,260,327
VACANCY2,976,796 SF2.20%
NET ABSORPTION SF139,306
AVG. ASKING RATE PSF GROSS$12.00
DELIVERIES2 Buildings 83,597
lee-associates.com LINKA BLOG BY

Q3
TOTAL INDUSTRIAL MARKET STATISTICSVacancy Rate Avg. SF Rental Rates GRS Net SF Absorption SF Inventory SF Under Construction
Q3 2019 1.40% $13.08 (302,257) 196,005,295 2,013,297
Q2 2019 1.20% $12.96 (225,204) 195,634,111 1,912,034
Q1 2019 1.20% $12.24 99,543 195,592,982 1,047,797
Q4 2018 1.20% $12.00 190,622 195,592,982 1,047,797
Q3 2018 1.30% $11.28 502,458 195,592,982 653,449
SOUTH BAY - LA PORTS
LARGEST DELIVERIESAddress Submarket/City SF Developer
21900 S. Wilmington Carson 412,000 Alpert & Alpert
- - - -
- - - -
LARGEST UNDER CONSTRUCTIONAddress Submarket/City SF Delivery Date
13344 S. Main St Los Angeles 290,303 Q3 2020
2300 Redondo Ave Bldg 1 Long Beach 204,936 Q4 2019
1901 W. Pacific Coast Hwy Long Beach 193,379 Q3 2019
DAVID BALES, Principal
Healthy demand continued in Q3 while vacancy ticked up slightly from 1.2% to 1.4% due to delivery of a 412,000-SF facility in Carson. As vacancy has been less than 2% for more than four years, this continued demand with little availability has continued to push pricing. The average industrial rate rose slightly to $1.09 per month in Q3 but is up from $0.94 from a year ago - a 16% increase. As the boom in industrial prices and values continue, tenant confidence in absorbing new space at higher prices have demonstrated some signs of stress as both Ports forecast slower container counts for the 4th Quarter.
SIGNIFICANT BUILDING SALESAddress
CitySale Value
Type of SalePPSF
Cap RateSF
ClassBuyerSeller
11811-11831 E. FlorenceSanta Fe Springs (SE)
$55,113,937Inv Portfolio
$191.373.5%
288,000Class B
PS Business Parks IncWestcore Properties
1241-1245 Watson Ctr RdCarson (South)
$55,500,000Investment
$261.08-
212,578Class B
Liberty Property Ltd PtnSimon Levi Company Ltd
18221 S. Susana RdCompton
$20,400,000Investment
$202.905.46%
100,543Class C
The Blackstone Grp LPWest Harbor Capital
SIGNIFICANT LEASE DEALSAddress Submarket/City Square Feet Tenant
12100 Rivera Rd Whittier (Southeast) 215,462 County of Los Angeles
9350 Rayo Ave Bldg B South Gate 213,232 Amazon
2300 Redondo Ave Long Beach (South) 204,936 Traffic Tech
UNDER CONSTRUCTION15 Buildings2,013,297
VACANCY 2,822,432 SF1.40%
NET ABSORPTION SF(302,257)
AVG. ASKING RATE PSF GROSS$13.08
DELIVERIES2 Buildings 446,574
lee-associates.com LINKA BLOG BY
Q3
TOTAL INDUSTRIAL MARKET STATISTICSVacancy Rate Avg. SF Rental Rates GRS Gross SF Absorption SF Inventory SF Under Construction
Q3 2019 3.73% $8.68 3,972,991 238,631,361 16,732,914
Q2 2019 4.10% $8.88 9,228,383 235,015,746 16,362,419
Q1 2019 4.71% $8.43 3,869,865 234,034,555 18,750,669
Q4 2018 5.50% $8.81 8,363,013 229,308,545 15,205,970
Q3 2018 5.29% $8.64 6,244,653 224,108,619 14,994,018
INLAND EMPIRE EAST
LARGEST DELIVERIESAddress Submarket/City SF Developer
6275 Lance Dr Riverside 1,012,995 Hillwood/Magnon
3350 Redlands Ave Perris 643,263 IDI Gazeley
21822 Opportunity Way Riverside 262,260 Dermody Prop.
LARGEST UNDER CONSTRUCTIONAddress Submarket/City SF Delivery Date
24400 Krameria Ave Moreno Valley 1,331,763 Q4 2019
3520 S. Cactus Ave Rialto 1,264,102 Q4 2019
1010 W. 4th St Beaumont 1,074,628 Q4 2019
TOBY TEWELL, Vice PresidentCAROLINE PAYAN, Dir. Mktg & Research
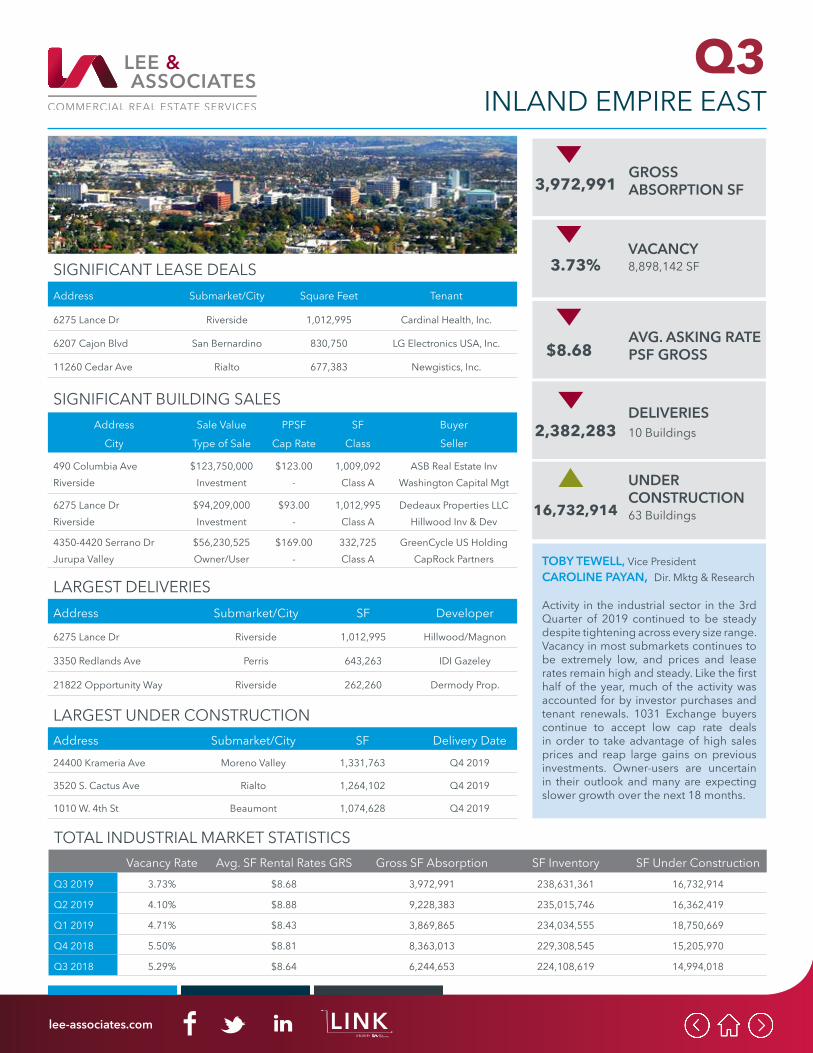
Activity in the industrial sector in the 3rd Quarter of 2019 continued to be steady despite tightening across every size range. Vacancy in most submarkets continues to be extremely low, and prices and lease rates remain high and steady. Like the first half of the year, much of the activity was accounted for by investor purchases and tenant renewals. 1031 Exchange buyers continue to accept low cap rate deals in order to take advantage of high sales prices and reap large gains on previous investments. Owner-users are uncertain in their outlook and many are expecting slower growth over the next 18 months.
SIGNIFICANT BUILDING SALESAddress
CitySale Value
Type of SalePPSF
Cap RateSF
ClassBuyerSeller
490 Columbia AveRiverside
$123,750,000Investment
$123.00-
1,009,092Class A
ASB Real Estate InvWashington Capital Mgt
6275 Lance DrRiverside
$94,209,000Investment
$93.00-
1,012,995Class A
Dedeaux Properties LLCHillwood Inv & Dev
4350-4420 Serrano DrJurupa Valley
$56,230,525Owner/User
$169.00-
332,725Class A
GreenCycle US HoldingCapRock Partners
SIGNIFICANT LEASE DEALSAddress Submarket/City Square Feet Tenant
6275 Lance Dr Riverside 1,012,995 Cardinal Health, Inc.
6207 Cajon Blvd San Bernardino 830,750 LG Electronics USA, Inc.
11260 Cedar Ave Rialto 677,383 Newgistics, Inc.
UNDER CONSTRUCTION63 Buildings16,732,914
VACANCY8,898,142 SF3.73%
GROSS ABSORPTION SF3,972,991
AVG. ASKING RATE PSF GROSS$8.68
DELIVERIES10 Buildings 2,382,283
lee-associates.com LINKA BLOG BY
Q3
TOTAL INDUSTRIAL MARKET STATISTICSVacancy Rate Avg. SF Rental Rates GRS Net SF Absorption SF Inventory SF Under Construction
Q3 2019 1.19% $8.616 1,337,003 321,877,285 11,768,301
Q2 2019 1.16% $8.460 2,357,533 319,632,450 11,969,128
Q1 2019 1.37% $8.292 583,120 314,414,452 8,555,446
Q4 2018 1.45% $8.160 1,624,090 312,310,181 6,004,339
Q3 2018 1.44% $7.884 1,977,152 311,034,499 6,121,130
INLAND EMPIRE WEST
LARGEST DELIVERIESAddress Submarket/City SF Developer
Goodman Ind Park Bldg 2 Fontana 615,971 Goodman
Goodman Ind Park Bldg 1 Fontana 508,002 Goodman
Prologis Mtn View Ind Bldg 4 Fontana 207,253 Prologis
LARGEST UNDER CONSTRUCTIONAddress Submarket/City SF Delivery Date
Watson Ind Park Bldg 848 Chino 566,210 + April 2020
Watson Ind Park Bldg 849 Chino 280,790 +April 2020
Oakmont Live Oak Fontana +236,912 +Q2 2020
ANGELICA GUZMAN, Dir. Mktg & Res
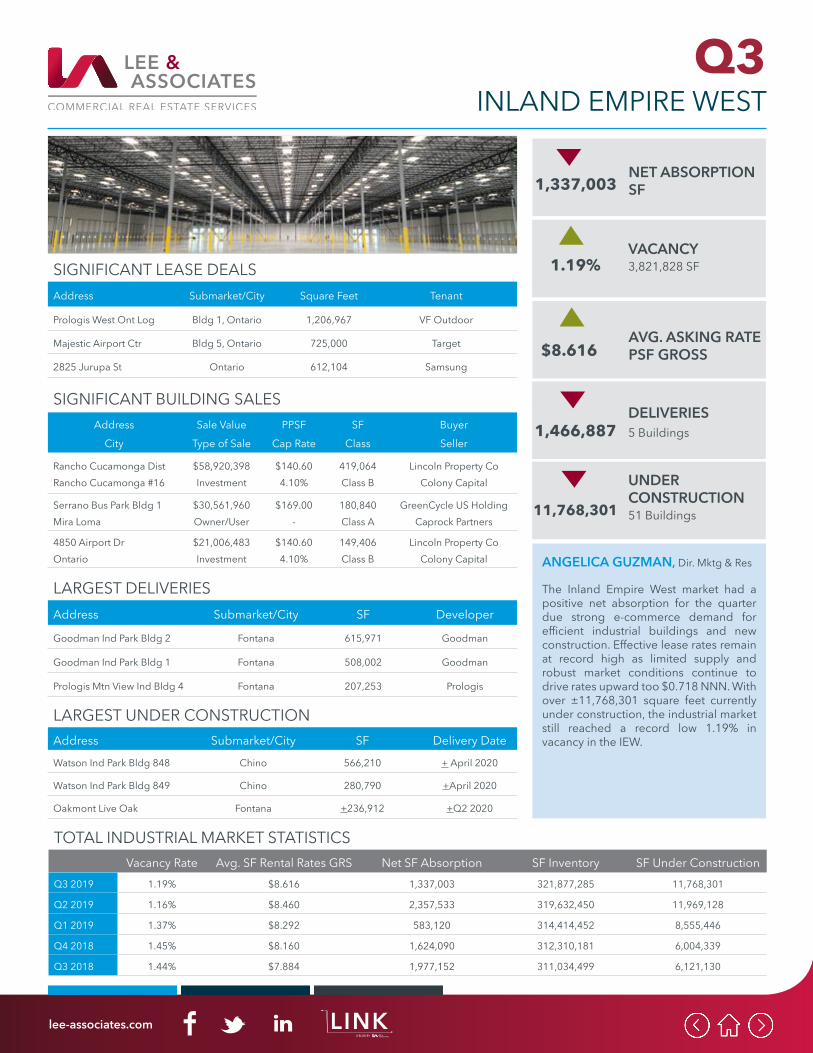
The Inland Empire West market had a positive net absorption for the quarter due strong e-commerce demand for efficient industrial buildings and new construction. Effective lease rates remain at record high as limited supply and robust market conditions continue to drive rates upward too $0.718 NNN. With over ±11,768,301 square feet currently under construction, the industrial market still reached a record low 1.19% in vacancy in the IEW.
SIGNIFICANT BUILDING SALESAddress
CitySale Value
Type of SalePPSF
Cap RateSF
ClassBuyerSeller
Rancho Cucamonga DistRancho Cucamonga #16
$58,920,398Investment
$140.604.10%
419,064Class B
Lincoln Property CoColony Capital
Serrano Bus Park Bldg 1Mira Loma
$30,561,960Owner/User
$169.00-
180,840Class A
GreenCycle US HoldingCaprock Partners
4850 Airport DrOntario
$21,006,483Investment
$140.604.10%
149,406Class B
Lincoln Property CoColony Capital
SIGNIFICANT LEASE DEALSAddress Submarket/City Square Feet Tenant
Prologis West Ont Log Bldg 1, Ontario 1,206,967 VF Outdoor
Majestic Airport Ctr Bldg 5, Ontario 725,000 Target
2825 Jurupa St Ontario 612,104 Samsung
UNDER CONSTRUCTION51 Buildings11,768,301
VACANCY3,821,828 SF1.19%
NET ABSORPTION SF1,337,003
AVG. ASKING RATE PSF GROSS$8.616
DELIVERIES5 Buildings 1,466,887
lee-associates.com LINKA BLOG BY
Q3
TOTAL INDUSTRIAL MARKET STATISTICSVacancy Rate Avg. SF Rental Rates GRS Net SF Absorption SF Inventory SF Under Construction
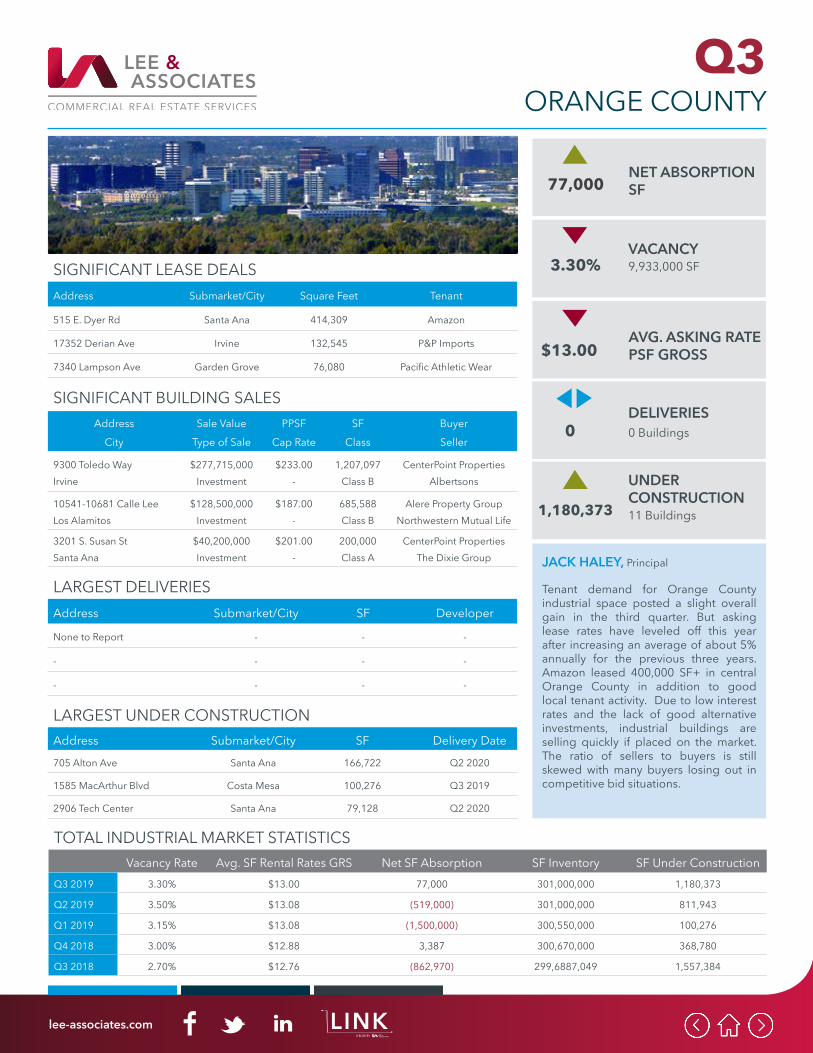
Q3 2019 3.30% $13.00 77,000 301,000,000 1,180,373
Q2 2019 3.50% $13.08 (519,000) 301,000,000 811,943
Q1 2019 3.15% $13.08 (1,500,000) 300,550,000 100,276
Q4 2018 3.00% $12.88 3,387 300,670,000 368,780
Q3 2018 2.70% $12.76 (862,970) 299,6887,049 1,557,384
ORANGE COUNTY
LARGEST DELIVERIESAddress Submarket/City SF Developer
None to Report - - -
- - - -
- - - -
LARGEST UNDER CONSTRUCTIONAddress Submarket/City SF Delivery Date
705 Alton Ave Santa Ana 166,722 Q2 2020
1585 MacArthur Blvd Costa Mesa 100,276 Q3 2019
2906 Tech Center Santa Ana 79,128 Q2 2020
JACK HALEY, Principal
Tenant demand for Orange County industrial space posted a slight overall gain in the third quarter. But asking lease rates have leveled off this year after increasing an average of about 5% annually for the previous three years. Amazon leased 400,000 SF+ in central Orange County in addition to good local tenant activity. Due to low interest rates and the lack of good alternative investments, industrial buildings are selling quickly if placed on the market. The ratio of sellers to buyers is still skewed with many buyers losing out in competitive bid situations.
SIGNIFICANT BUILDING SALESAddress
CitySale Value
Type of SalePPSF
Cap RateSF
ClassBuyerSeller
9300 Toledo WayIrvine
$277,715,000Investment
$233.00-
1,207,097Class B
CenterPoint PropertiesAlbertsons
10541-10681 Calle LeeLos Alamitos
$128,500,000Investment
$187.00-
685,588Class B
Alere Property GroupNorthwestern Mutual Life
3201 S. Susan StSanta Ana
$40,200,000Investment
$201.00-
200,000Class A
CenterPoint PropertiesThe Dixie Group
SIGNIFICANT LEASE DEALSAddress Submarket/City Square Feet Tenant
515 E. Dyer Rd Santa Ana 414,309 Amazon
17352 Derian Ave Irvine 132,545 P&P Imports
7340 Lampson Ave Garden Grove 76,080 Pacific Athletic Wear
UNDER CONSTRUCTION11 Buildings1,180,373
VACANCY9,933,000 SF3.30%
NET ABSORPTION SF77,000
AVG. ASKING RATE PSF GROSS$13.00
DELIVERIES0 Buildings 0
lee-associates.com LINKA BLOG BY
Q3
TOTAL INDUSTRIAL MARKET STATISTICSVacancy Rate Avg. SF Rental Rates NNN Net SF Absorption SF Inventory SF Under Construction
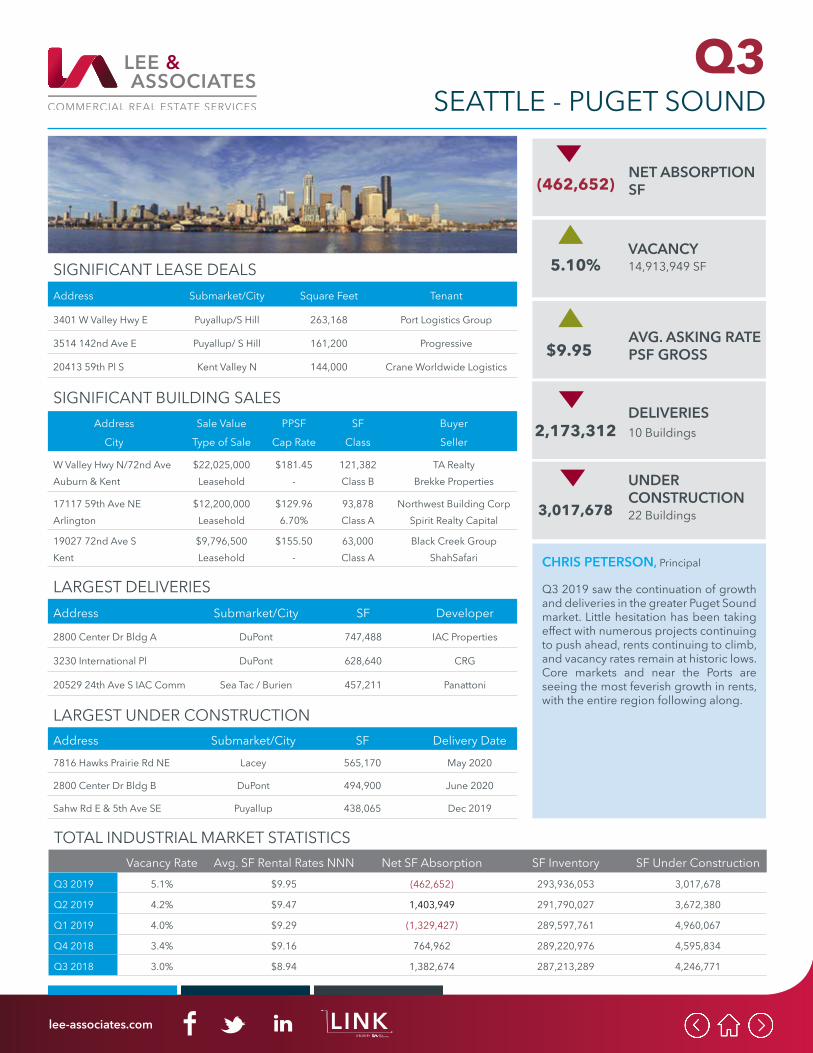
Q3 2019 5.1% $9.95 (462,652) 293,936,053 3,017,678
Q2 2019 4.2% $9.47 1,403,949 291,790,027 3,672,380
Q1 2019 4.0% $9.29 (1,329,427) 289,597,761 4,960,067
Q4 2018 3.4% $9.16 764,962 289,220,976 4,595,834
Q3 2018 3.0% $8.94 1,382,674 287,213,289 4,246,771
SEATTLE - PUGET SOUND
LARGEST DELIVERIESAddress Submarket/City SF Developer
2800 Center Dr Bldg A DuPont 747,488 IAC Properties
3230 International Pl DuPont 628,640 CRG
20529 24th Ave S IAC Comm Sea Tac / Burien 457,211 Panattoni
LARGEST UNDER CONSTRUCTIONAddress Submarket/City SF Delivery Date
7816 Hawks Prairie Rd NE Lacey 565,170 May 2020
2800 Center Dr Bldg B DuPont 494,900 June 2020
Sahw Rd E & 5th Ave SE Puyallup 438,065 Dec 2019
CHRIS PETERSON, Principal
Q3 2019 saw the continuation of growth and deliveries in the greater Puget Sound market. Little hesitation has been taking effect with numerous projects continuing to push ahead, rents continuing to climb, and vacancy rates remain at historic lows. Core markets and near the Ports are seeing the most feverish growth in rents, with the entire region following along.
SIGNIFICANT BUILDING SALESAddress
CitySale Value
Type of SalePPSF
Cap RateSF
ClassBuyerSeller
W Valley Hwy N/72nd AveAuburn & Kent
$22,025,000Leasehold
$181.45-
121,382Class B
TA RealtyBrekke Properties
17117 59th Ave NEArlington
$12,200,000Leasehold
$129.966.70%
93,878Class A
Northwest Building CorpSpirit Realty Capital
19027 72nd Ave SKent
$9,796,500Leasehold
$155.50-
63,000Class A
Black Creek GroupShahSafari
SIGNIFICANT LEASE DEALSAddress Submarket/City Square Feet Tenant
3401 W Valley Hwy E Puyallup/S Hill 263,168 Port Logistics Group
3514 142nd Ave E Puyallup/ S Hill 161,200 Progressive
20413 59th Pl S Kent Valley N 144,000 Crane Worldwide Logistics
UNDER CONSTRUCTION22 Buildings3,017,678
VACANCY14,913,949 SF5.10%
NET ABSORPTION SF(462,652)
AVG. ASKING RATE PSF GROSS$9.95
DELIVERIES10 Buildings 2,173,312
lee-associates.com LINKA BLOG BY
Q3
TOTAL INDUSTRIAL MARKET STATISTICSVacancy Rate Avg. SF Rental Rates NNN Net SF Absorption SF Inventory SF Under Construction
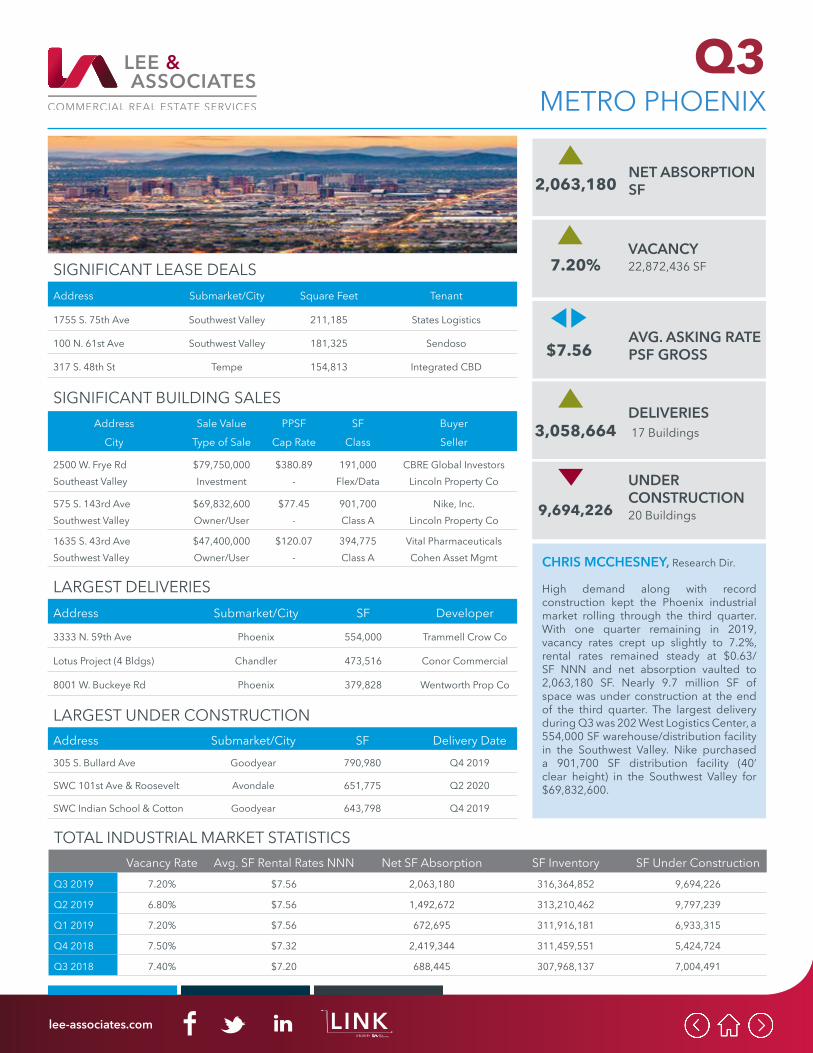
Q3 2019 7.20% $7.56 2,063,180 316,364,852 9,694,226
Q2 2019 6.80% $7.56 1,492,672 313,210,462 9,797,239
Q1 2019 7.20% $7.56 672,695 311,916,181 6,933,315
Q4 2018 7.50% $7.32 2,419,344 311,459,551 5,424,724
Q3 2018 7.40% $7.20 688,445 307,968,137 7,004,491
METRO PHOENIX
LARGEST DELIVERIESAddress Submarket/City SF Developer
3333 N. 59th Ave Phoenix 554,000 Trammell Crow Co
Lotus Project (4 Bldgs) Chandler 473,516 Conor Commercial
8001 W. Buckeye Rd Phoenix 379,828 Wentworth Prop Co
LARGEST UNDER CONSTRUCTIONAddress Submarket/City SF Delivery Date
305 S. Bullard Ave Goodyear 790,980 Q4 2019
SWC 101st Ave & Roosevelt Avondale 651,775 Q2 2020
SWC Indian School & Cotton Goodyear 643,798 Q4 2019
CHRIS MCCHESNEY, Research Dir.
High demand along with record construction kept the Phoenix industrial market rolling through the third quarter. With one quarter remaining in 2019, vacancy rates crept up slightly to 7.2%, rental rates remained steady at $0.63/SF NNN and net absorption vaulted to 2,063,180 SF. Nearly 9.7 million SF of space was under construction at the end of the third quarter. The largest delivery during Q3 was 202 West Logistics Center, a 554,000 SF warehouse/distribution facility in the Southwest Valley. Nike purchased a 901,700 SF distribution facility (40’ clear height) in the Southwest Valley for $69,832,600.
SIGNIFICANT BUILDING SALESAddress
CitySale Value
Type of SalePPSF
Cap RateSF
ClassBuyerSeller
2500 W. Frye RdSoutheast Valley
$79,750,000Investment
$380.89-
191,000Flex/Data
CBRE Global InvestorsLincoln Property Co
575 S. 143rd AveSouthwest Valley
$69,832,600Owner/User
$77.45-
901,700Class A
Nike, Inc.Lincoln Property Co
1635 S. 43rd AveSouthwest Valley
$47,400,000Owner/User
$120.07-
394,775Class A
Vital PharmaceuticalsCohen Asset Mgmt
SIGNIFICANT LEASE DEALSAddress Submarket/City Square Feet Tenant
1755 S. 75th Ave Southwest Valley 211,185 States Logistics
100 N. 61st Ave Southwest Valley 181,325 Sendoso
317 S. 48th St Tempe 154,813 Integrated CBD
UNDER CONSTRUCTION20 Buildings9,694,226
VACANCY22,872,436 SF7.20%
NET ABSORPTION SF2,063,180
AVG. ASKING RATE PSF GROSS$7.56
DELIVERIES 17 Buildings 3,058,664
lee-associates.com LINKA BLOG BY
Q3
TOTAL INDUSTRIAL MARKET STATISTICSVacancy Rate Avg. SF Rental Rates GRS Net SF Absorption SF Inventory SF Under Construction
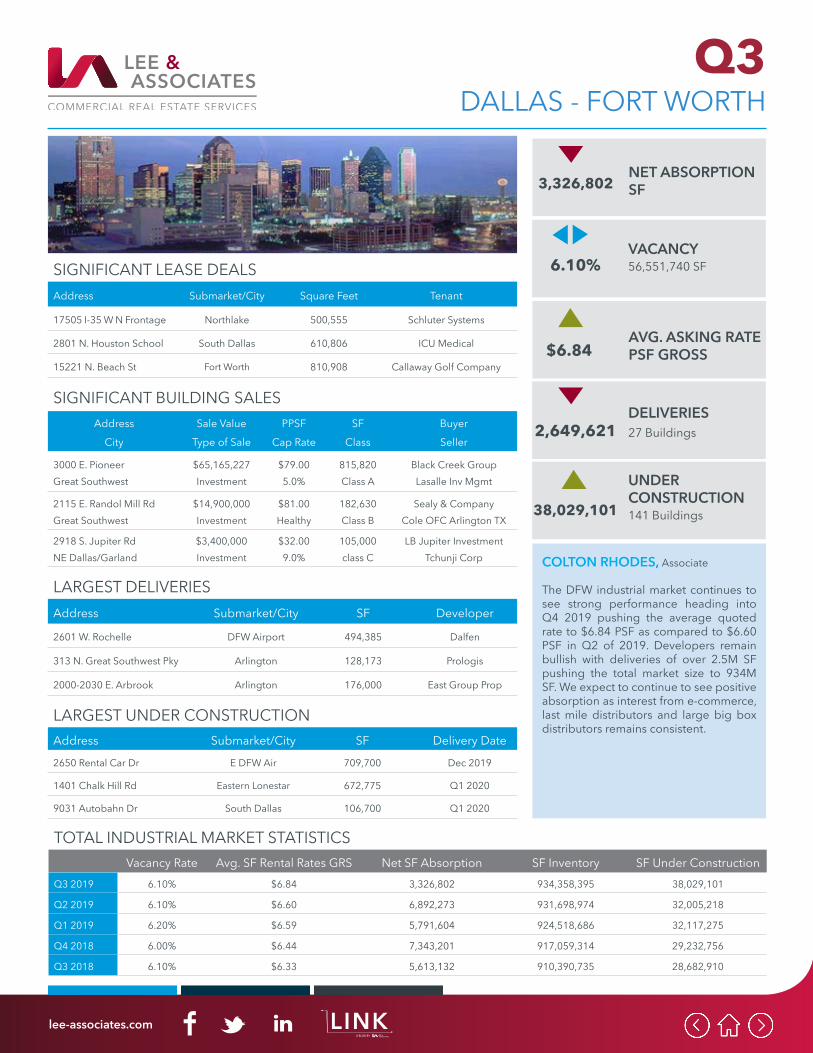
Q3 2019 6.10% $6.84 3,326,802 934,358,395 38,029,101
Q2 2019 6.10% $6.60 6,892,273 931,698,974 32,005,218
Q1 2019 6.20% $6.59 5,791,604 924,518,686 32,117,275
Q4 2018 6.00% $6.44 7,343,201 917,059,314 29,232,756
Q3 2018 6.10% $6.33 5,613,132 910,390,735 28,682,910
DALLAS - FORT WORTH
LARGEST DELIVERIESAddress Submarket/City SF Developer
2601 W. Rochelle DFW Airport 494,385 Dalfen
313 N. Great Southwest Pky Arlington 128,173 Prologis
2000-2030 E. Arbrook Arlington 176,000 East Group Prop
LARGEST UNDER CONSTRUCTIONAddress Submarket/City SF Delivery Date
2650 Rental Car Dr E DFW Air 709,700 Dec 2019
1401 Chalk Hill Rd Eastern Lonestar 672,775 Q1 2020
9031 Autobahn Dr South Dallas 106,700 Q1 2020
COLTON RHODES, Associate
The DFW industrial market continues to see strong performance heading into Q4 2019 pushing the average quoted rate to $6.84 PSF as compared to $6.60 PSF in Q2 of 2019. Developers remain bullish with deliveries of over 2.5M SF pushing the total market size to 934M SF. We expect to continue to see positive absorption as interest from e-commerce, last mile distributors and large big box distributors remains consistent.
SIGNIFICANT BUILDING SALESAddress
CitySale Value
Type of SalePPSF
Cap RateSF
ClassBuyerSeller
3000 E. PioneerGreat Southwest
$65,165,227Investment
$79.005.0%
815,820Class A
Black Creek GroupLasalle Inv Mgmt
2115 E. Randol Mill RdGreat Southwest
$14,900,000Investment
$81.00Healthy
182,630Class B
Sealy & CompanyCole OFC Arlington TX
2918 S. Jupiter RdNE Dallas/Garland
$3,400,000Investment
$32.009.0%
105,000class C
LB Jupiter InvestmentTchunji Corp
SIGNIFICANT LEASE DEALSAddress Submarket/City Square Feet Tenant
17505 I-35 W N Frontage Northlake 500,555 Schluter Systems
2801 N. Houston School South Dallas 610,806 ICU Medical
15221 N. Beach St Fort Worth 810,908 Callaway Golf Company
UNDER CONSTRUCTION141 Buildings38,029,101
VACANCY56,551,740 SF6.10%
NET ABSORPTION SF3,326,802
AVG. ASKING RATE PSF GROSS$6.84
DELIVERIES27 Buildings 2,649,621
lee-associates.com LINKA BLOG BY
Q3
TOTAL INDUSTRIAL MARKET STATISTICSVacancy Rate Avg. SF Rental Rates GRS Net SF Absorption SF Inventory SF Under Construction
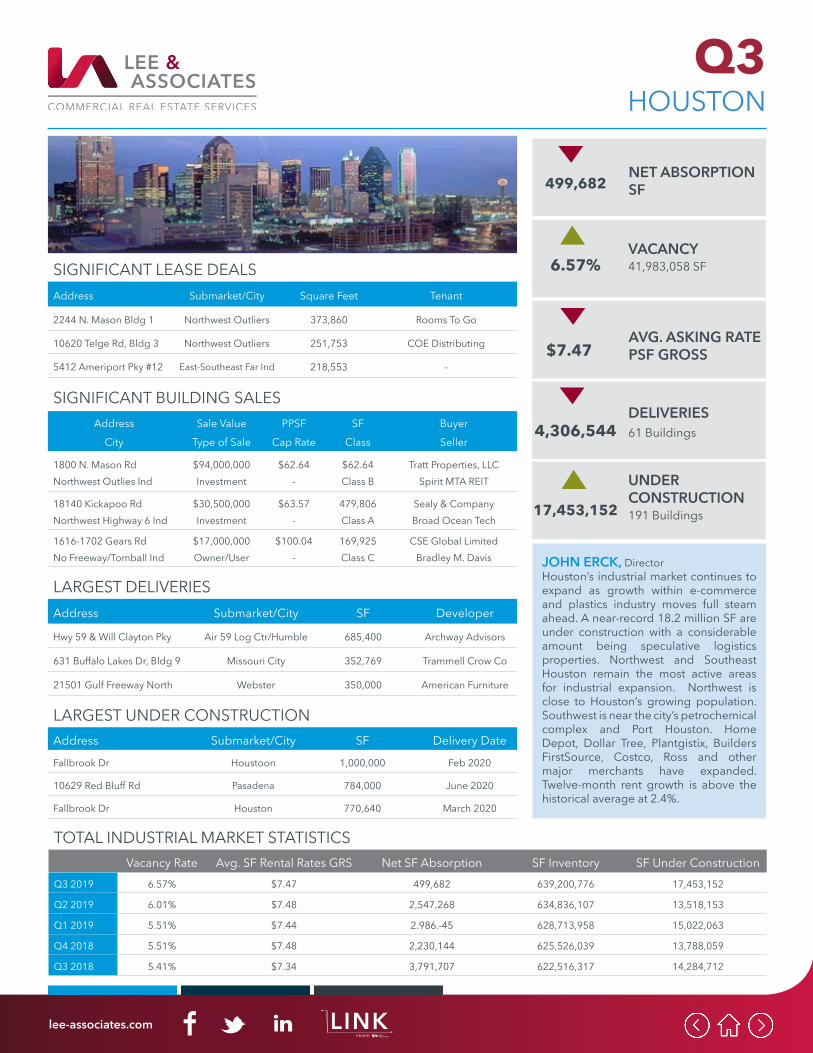
Q3 2019 6.57% $7.47 499,682 639,200,776 17,453,152
Q2 2019 6.01% $7.48 2,547,268 634,836,107 13,518,153
Q1 2019 5.51% $7.44 2.986.-45 628,713,958 15,022,063
Q4 2018 5.51% $7.48 2,230,144 625,526,039 13,788,059
Q3 2018 5.41% $7.34 3,791,707 622,516,317 14,284,712
HOUSTON
LARGEST DELIVERIESAddress Submarket/City SF Developer
Hwy 59 & Will Clayton Pky Air 59 Log Ctr/Humble 685,400 Archway Advisors
631 Buffalo Lakes Dr, Bldg 9 Missouri City 352,769 Trammell Crow Co
21501 Gulf Freeway North Webster 350,000 American Furniture
LARGEST UNDER CONSTRUCTIONAddress Submarket/City SF Delivery Date
Fallbrook Dr Houstoon 1,000,000 Feb 2020
10629 Red Bluff Rd Pasadena 784,000 June 2020
Fallbrook Dr Houston 770,640 March 2020
JOHN ERCK, DirectorHouston’s industrial market continues to expand as growth within e-commerce and plastics industry moves full steam ahead. A near-record 18.2 million SF are under construction with a considerable amount being speculative logistics properties. Northwest and Southeast Houston remain the most active areas for industrial expansion. Northwest is close to Houston’s growing population. Southwest is near the city’s petrochemical complex and Port Houston. Home Depot, Dollar Tree, Plantgistix, Builders FirstSource, Costco, Ross and other major merchants have expanded. Twelve-month rent growth is above the historical average at 2.4%.
SIGNIFICANT BUILDING SALESAddress
CitySale Value
Type of SalePPSF
Cap RateSF
ClassBuyerSeller
1800 N. Mason RdNorthwest Outlies Ind
$94,000,000Investment
$62.64-
$62.64Class B
Tratt Properties, LLCSpirit MTA REIT
18140 Kickapoo RdNorthwest Highway 6 Ind
$30,500,000Investment
$63.57-
479,806Class A
Sealy & CompanyBroad Ocean Tech
1616-1702 Gears RdNo Freeway/Tomball Ind
$17,000,000Owner/User
$100.04-
169,925Class C
CSE Global LimitedBradley M. Davis
SIGNIFICANT LEASE DEALSAddress Submarket/City Square Feet Tenant
2244 N. Mason Bldg 1 Northwest Outliers 373,860 Rooms To Go
10620 Telge Rd, Bldg 3 Northwest Outliers 251,753 COE Distributing
5412 Ameriport Pky #12 East-Southeast Far Ind 218,553 -
UNDER CONSTRUCTION191 Buildings17,453,152
VACANCY41,983,058 SF6.57%
NET ABSORPTION SF499,682
AVG. ASKING RATE PSF GROSS$7.47
DELIVERIES61 Buildings 4,306,544
lee-associates.com LINKA BLOG BY
Q3
TOTAL INDUSTRIAL MARKET STATISTICSVacancy Rate Avg. SF Rental Rates GRS Net SF Absorption SF Inventory SF Under Construction
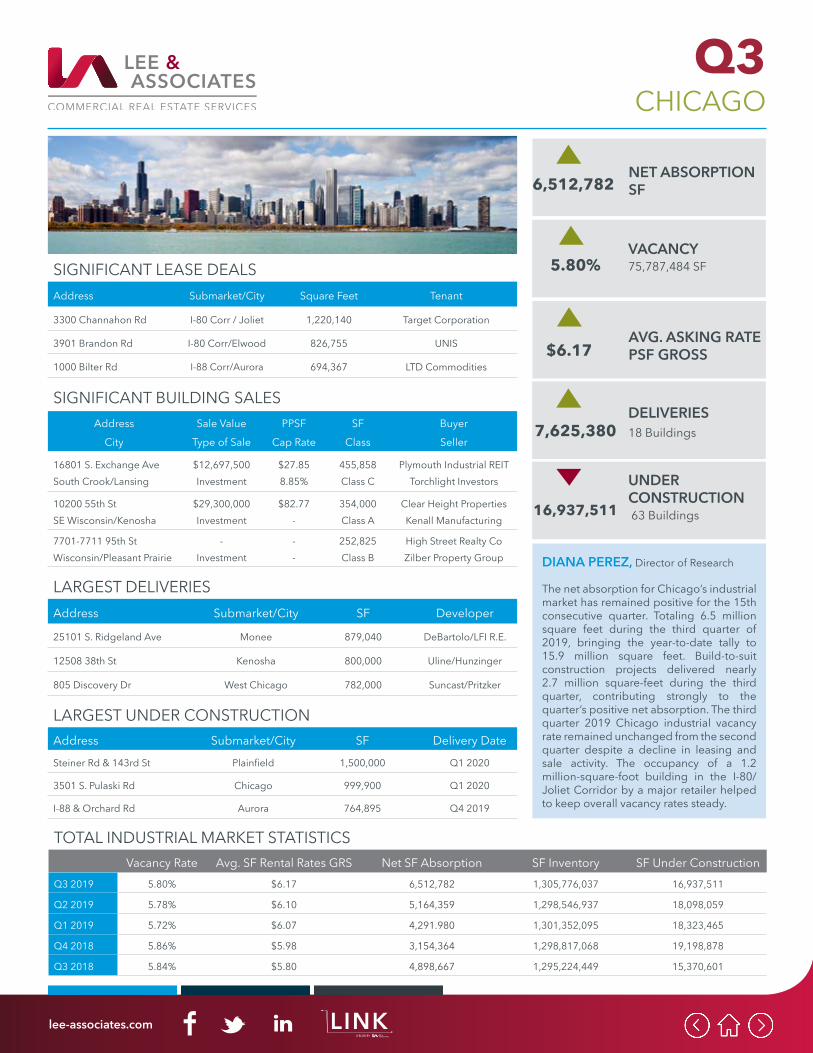
Q3 2019 5.80% $6.17 6,512,782 1,305,776,037 16,937,511
Q2 2019 5.78% $6.10 5,164,359 1,298,546,937 18,098,059
Q1 2019 5.72% $6.07 4,291.980 1,301,352,095 18,323,465
Q4 2018 5.86% $5.98 3,154,364 1,298,817,068 19,198,878
Q3 2018 5.84% $5.80 4,898,667 1,295,224,449 15,370,601
CHICAGO
LARGEST DELIVERIESAddress Submarket/City SF Developer
25101 S. Ridgeland Ave Monee 879,040 DeBartolo/LFI R.E.
12508 38th St Kenosha 800,000 Uline/Hunzinger
805 Discovery Dr West Chicago 782,000 Suncast/Pritzker
LARGEST UNDER CONSTRUCTIONAddress Submarket/City SF Delivery Date
Steiner Rd & 143rd St Plainfield 1,500,000 Q1 2020
3501 S. Pulaski Rd Chicago 999,900 Q1 2020
I-88 & Orchard Rd Aurora 764,895 Q4 2019
DIANA PEREZ, Director of Research
The net absorption for Chicago’s industrial market has remained positive for the 15th consecutive quarter. Totaling 6.5 million square feet during the third quarter of 2019, bringing the year-to-date tally to 15.9 million square feet. Build-to-suit construction projects delivered nearly 2.7 million square-feet during the third quarter, contributing strongly to the quarter’s positive net absorption. The third quarter 2019 Chicago industrial vacancy rate remained unchanged from the second quarter despite a decline in leasing and sale activity. The occupancy of a 1.2 million-square-foot building in the I-80/Joliet Corridor by a major retailer helped to keep overall vacancy rates steady.
SIGNIFICANT BUILDING SALESAddress
CitySale Value
Type of SalePPSF
Cap RateSF
ClassBuyerSeller
16801 S. Exchange AveSouth Crook/Lansing
$12,697,500Investment
$27.858.85%
455,858Class C
Plymouth Industrial REITTorchlight Investors
10200 55th StSE Wisconsin/Kenosha
$29,300,000Investment
$82.77-
354,000Class A
Clear Height PropertiesKenall Manufacturing
7701-7711 95th StWisconsin/Pleasant Prairie
-Investment
--
252,825Class B
High Street Realty CoZilber Property Group
SIGNIFICANT LEASE DEALSAddress Submarket/City Square Feet Tenant
3300 Channahon Rd I-80 Corr / Joliet 1,220,140 Target Corporation
3901 Brandon Rd I-80 Corr/Elwood 826,755 UNIS
1000 Bilter Rd I-88 Corr/Aurora 694,367 LTD Commodities
UNDER CONSTRUCTION 63 Buildings16,937,511
VACANCY75,787,484 SF5.80%
NET ABSORPTION SF6,512,782
AVG. ASKING RATE PSF GROSS$6.17
DELIVERIES18 Buildings 7,625,380
lee-associates.com LINKA BLOG BY
Q3
TOTAL INDUSTRIAL MARKET STATISTICSVacancy Rate Avg. SF Rental Rates GRS Net SF Absorption SF Inventory SF Under Construction
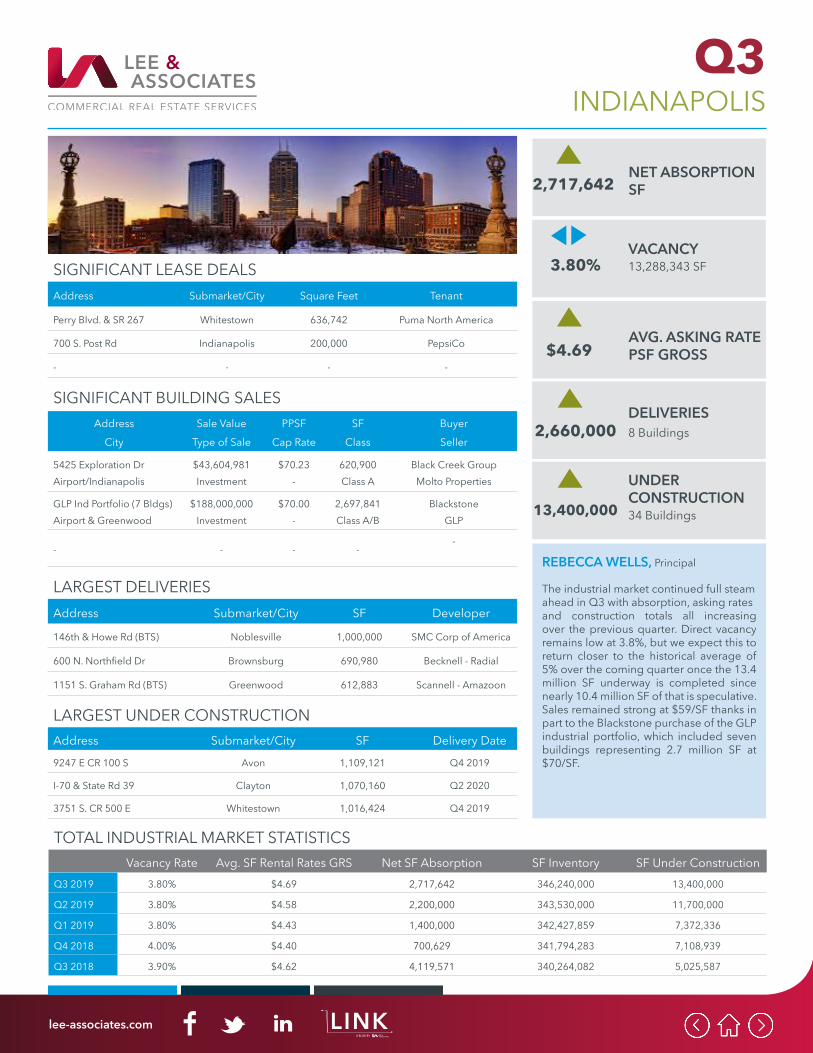
Q3 2019 3.80% $4.69 2,717,642 346,240,000 13,400,000
Q2 2019 3.80% $4.58 2,200,000 343,530,000 11,700,000
Q1 2019 3.80% $4.43 1,400,000 342,427,859 7,372,336
Q4 2018 4.00% $4.40 700,629 341,794,283 7,108,939
Q3 2018 3.90% $4.62 4,119,571 340,264,082 5,025,587
INDIANAPOLIS
LARGEST DELIVERIESAddress Submarket/City SF Developer
146th & Howe Rd (BTS) Noblesville 1,000,000 SMC Corp of America
600 N. Northfield Dr Brownsburg 690,980 Becknell - Radial
1151 S. Graham Rd (BTS) Greenwood 612,883 Scannell - Amazoon
LARGEST UNDER CONSTRUCTIONAddress Submarket/City SF Delivery Date
9247 E CR 100 S Avon 1,109,121 Q4 2019
I-70 & State Rd 39 Clayton 1,070,160 Q2 2020
3751 S. CR 500 E Whitestown 1,016,424 Q4 2019
REBECCA WELLS, Principal
The industrial market continued full steamahead in Q3 with absorption, asking ratesand construction totals all increasing over the previous quarter. Direct vacancy remains low at 3.8%, but we expect this to return closer to the historical average of 5% over the coming quarter once the 13.4 million SF underway is completed since nearly 10.4 million SF of that is speculative. Sales remained strong at $59/SF thanks in part to the Blackstone purchase of the GLP industrial portfolio, which included seven buildings representing 2.7 million SF at $70/SF.
SIGNIFICANT BUILDING SALESAddress
CitySale Value
Type of SalePPSF
Cap RateSF
ClassBuyerSeller
5425 Exploration DrAirport/Indianapolis
$43,604,981Investment
$70.23-
620,900Class A
Black Creek GroupMolto Properties
GLP Ind Portfolio (7 Bldgs)Airport & Greenwood
$188,000,000Investment
$70.00-
2,697,841Class A/B
BlackstoneGLP
- - - --
SIGNIFICANT LEASE DEALSAddress Submarket/City Square Feet Tenant
Perry Blvd. & SR 267 Whitestown 636,742 Puma North America
700 S. Post Rd Indianapolis 200,000 PepsiCo
- - - -
UNDER CONSTRUCTION34 Buildings13,400,000
VACANCY13,288,343 SF3.80%
NET ABSORPTION SF2,717,642
AVG. ASKING RATE PSF GROSS$4.69
DELIVERIES8 Buildings 2,660,000
lee-associates.com LINKA BLOG BY
Q3
TOTAL INDUSTRIAL MARKET STATISTICSVacancy Rate Avg. SF Rental Rates GRS Net SF Absorption SF Inventory SF Under Construction
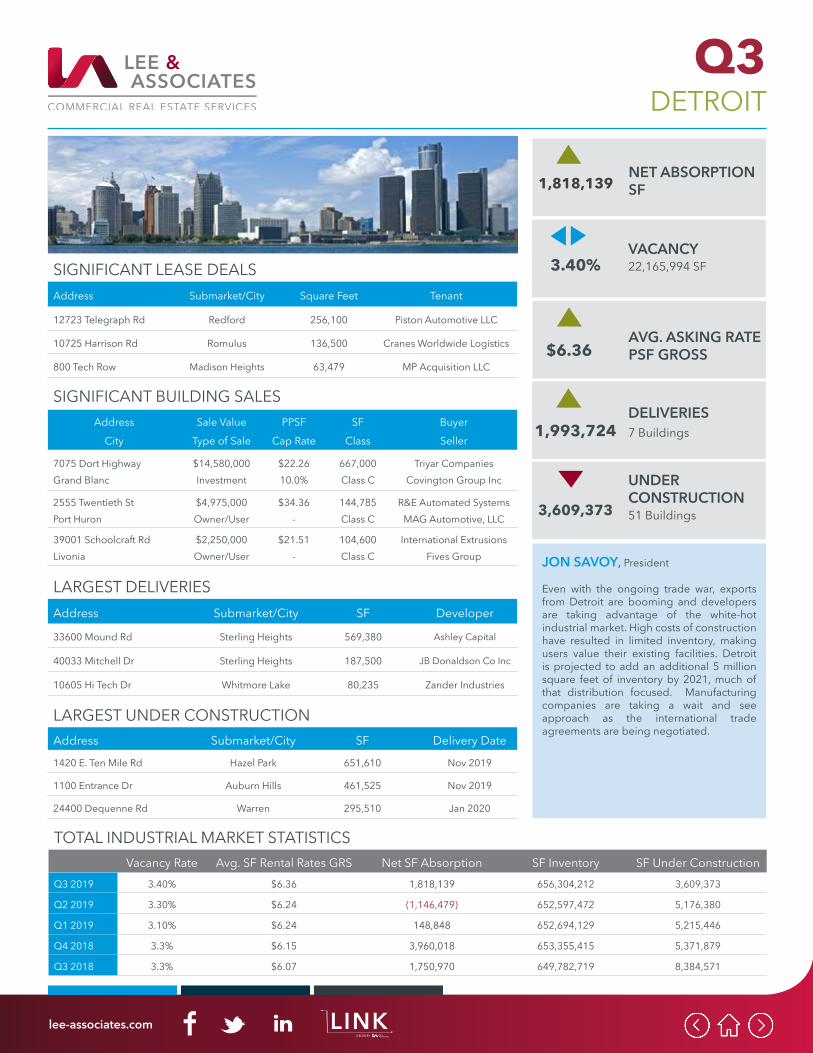
Q3 2019 3.40% $6.36 1,818,139 656,304,212 3,609,373
Q2 2019 3.30% $6.24 (1,146,479) 652,597,472 5,176,380
Q1 2019 3.10% $6.24 148,848 652,694,129 5,215,446
Q4 2018 3.3% $6.15 3,960,018 653,355,415 5,371,879
Q3 2018 3.3% $6.07 1,750,970 649,782,719 8,384,571
DETROIT
LARGEST DELIVERIESAddress Submarket/City SF Developer
33600 Mound Rd Sterling Heights 569,380 Ashley Capital
40033 Mitchell Dr Sterling Heights 187,500 JB Donaldson Co Inc
10605 Hi Tech Dr Whitmore Lake 80,235 Zander Industries
LARGEST UNDER CONSTRUCTIONAddress Submarket/City SF Delivery Date
1420 E. Ten Mile Rd Hazel Park 651,610 Nov 2019
1100 Entrance Dr Auburn Hills 461,525 Nov 2019
24400 Dequenne Rd Warren 295,510 Jan 2020
JON SAVOY, President
Even with the ongoing trade war, exports from Detroit are booming and developers are taking advantage of the white-hot industrial market. High costs of construction have resulted in limited inventory, making users value their existing facilities. Detroit is projected to add an additional 5 million square feet of inventory by 2021, much of that distribution focused. Manufacturing companies are taking a wait and see approach as the international trade agreements are being negotiated.
SIGNIFICANT BUILDING SALESAddress
CitySale Value
Type of SalePPSF
Cap RateSF
ClassBuyerSeller
7075 Dort HighwayGrand Blanc
$14,580,000Investment
$22.2610.0%
667,000Class C
Triyar CompaniesCovington Group Inc
2555 Twentieth StPort Huron
$4,975,000Owner/User
$34.36-
144,785Class C
R&E Automated SystemsMAG Automotive, LLC
39001 Schoolcraft RdLivonia
$2,250,000Owner/User
$21.51-
104,600Class C
International ExtrusionsFives Group
SIGNIFICANT LEASE DEALSAddress Submarket/City Square Feet Tenant
12723 Telegraph Rd Redford 256,100 Piston Automotive LLC
10725 Harrison Rd Romulus 136,500 Cranes Worldwide Logistics
800 Tech Row Madison Heights 63,479 MP Acquisition LLC
UNDER CONSTRUCTION51 Buildings3,609,373
VACANCY22,165,994 SF3.40%
NET ABSORPTION SF1,818,139
AVG. ASKING RATE PSF GROSS$6.36
DELIVERIES7 Buildings 1,993,724
lee-associates.com LINKA BLOG BY
Q3
TOTAL INDUSTRIAL MARKET STATISTICSVacancy Rate Avg. SF Rental Rates GRS Net SF Absorption SF Inventory SF Under Construction
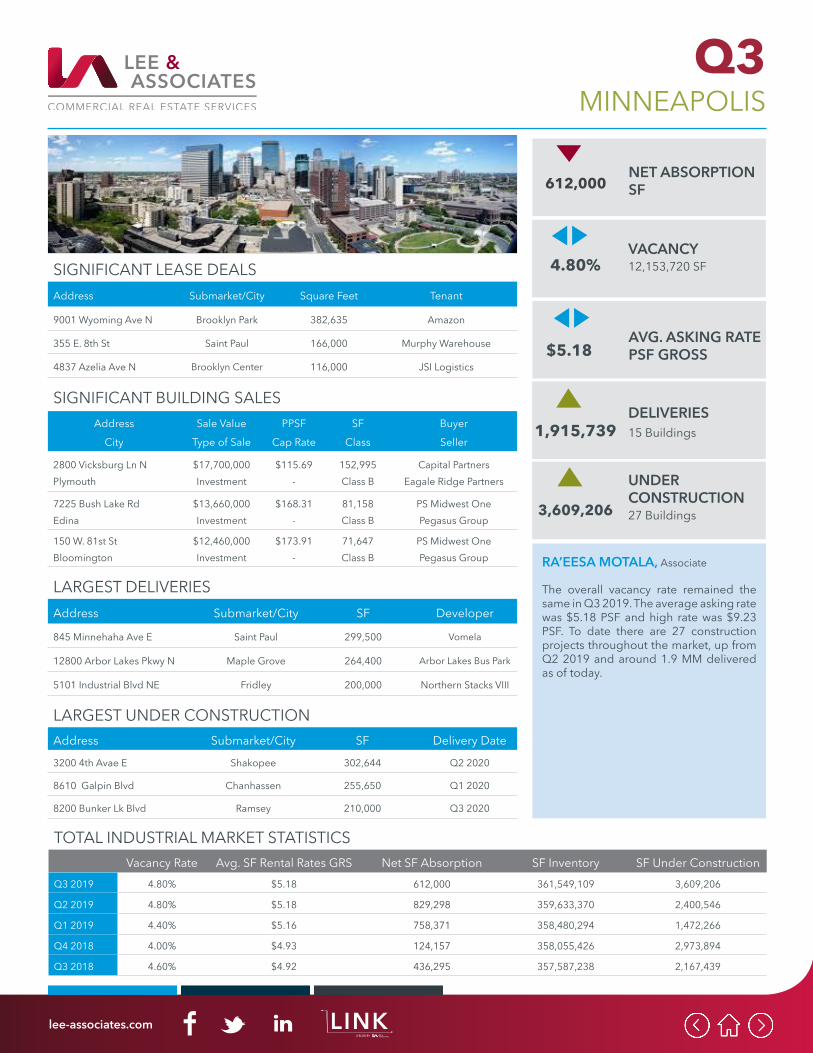
Q3 2019 4.80% $5.18 612,000 361,549,109 3,609,206
Q2 2019 4.80% $5.18 829,298 359,633,370 2,400,546
Q1 2019 4.40% $5.16 758,371 358,480,294 1,472,266
Q4 2018 4.00% $4.93 124,157 358,055,426 2,973,894
Q3 2018 4.60% $4.92 436,295 357,587,238 2,167,439
MINNEAPOLIS
LARGEST DELIVERIESAddress Submarket/City SF Developer
845 Minnehaha Ave E Saint Paul 299,500 Vomela
12800 Arbor Lakes Pkwy N Maple Grove 264,400 Arbor Lakes Bus Park
5101 Industrial Blvd NE Fridley 200,000 Northern Stacks VIII
LARGEST UNDER CONSTRUCTIONAddress Submarket/City SF Delivery Date
3200 4th Avae E Shakopee 302,644 Q2 2020
8610 Galpin Blvd Chanhassen 255,650 Q1 2020
8200 Bunker Lk Blvd Ramsey 210,000 Q3 2020
RA’EESA MOTALA, Associate
The overall vacancy rate remained the same in Q3 2019. The average asking rate was $5.18 PSF and high rate was $9.23 PSF. To date there are 27 construction projects throughout the market, up from Q2 2019 and around 1.9 MM delivered as of today.
SIGNIFICANT BUILDING SALESAddress
CitySale Value
Type of SalePPSF
Cap RateSF
ClassBuyerSeller
2800 Vicksburg Ln NPlymouth
$17,700,000Investment
$115.69-
152,995Class B
Capital PartnersEagale Ridge Partners
7225 Bush Lake RdEdina
$13,660,000Investment
$168.31-
81,158Class B
PS Midwest OnePegasus Group
150 W. 81st StBloomington
$12,460,000Investment
$173.91-
71,647Class B
PS Midwest OnePegasus Group
SIGNIFICANT LEASE DEALSAddress Submarket/City Square Feet Tenant
9001 Wyoming Ave N Brooklyn Park 382,635 Amazon
355 E. 8th St Saint Paul 166,000 Murphy Warehouse
4837 Azelia Ave N Brooklyn Center 116,000 JSI Logistics
UNDER CONSTRUCTION27 Buildings3,609,206
VACANCY12,153,720 SF4.80%
NET ABSORPTION SF612,000
AVG. ASKING RATE PSF GROSS$5.18
DELIVERIES15 Buildings 1,915,739
lee-associates.com LINKA BLOG BY
Q3
TOTAL INDUSTRIAL MARKET STATISTICSVacancy Rate Avg. SF Rental Rates GRS Net SF Absorption SF Inventory SF Under Construction
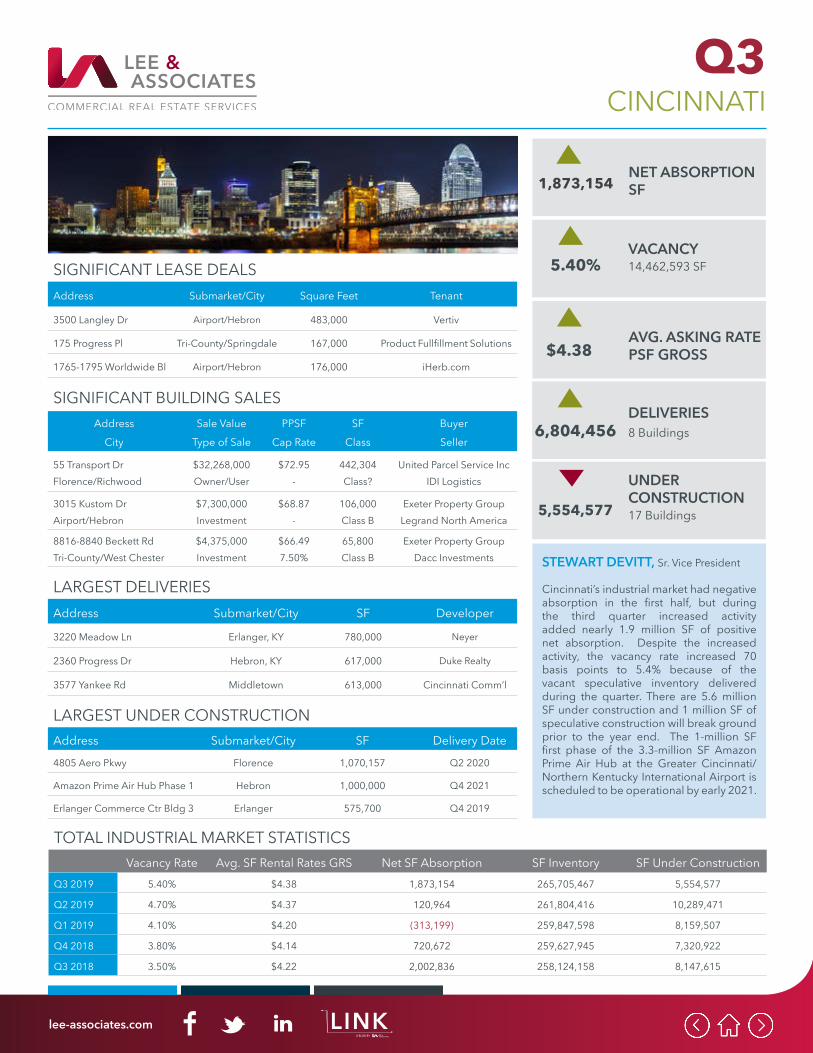
Q3 2019 5.40% $4.38 1,873,154 265,705,467 5,554,577
Q2 2019 4.70% $4.37 120,964 261,804,416 10,289,471
Q1 2019 4.10% $4.20 (313,199) 259,847,598 8,159,507
Q4 2018 3.80% $4.14 720,672 259,627,945 7,320,922
Q3 2018 3.50% $4.22 2,002,836 258,124,158 8,147,615
CINCINNATI
LARGEST DELIVERIESAddress Submarket/City SF Developer
3220 Meadow Ln Erlanger, KY 780,000 Neyer
2360 Progress Dr Hebron, KY 617,000 Duke Realty
3577 Yankee Rd Middletown 613,000 Cincinnati Comm’l
LARGEST UNDER CONSTRUCTIONAddress Submarket/City SF Delivery Date
4805 Aero Pkwy Florence 1,070,157 Q2 2020
Amazon Prime Air Hub Phase 1 Hebron 1,000,000 Q4 2021
Erlanger Commerce Ctr Bldg 3 Erlanger 575,700 Q4 2019
STEWART DEVITT, Sr. Vice President
Cincinnati’s industrial market had negative absorption in the first half, but during the third quarter increased activity added nearly 1.9 million SF of positive net absorption. Despite the increased activity, the vacancy rate increased 70 basis points to 5.4% because of the vacant speculative inventory delivered during the quarter. There are 5.6 million SF under construction and 1 million SF of speculative construction will break ground prior to the year end. The 1-million SF first phase of the 3.3-million SF Amazon Prime Air Hub at the Greater Cincinnati/Northern Kentucky International Airport is scheduled to be operational by early 2021.
SIGNIFICANT BUILDING SALESAddress
CitySale Value
Type of SalePPSF
Cap RateSF
ClassBuyerSeller
55 Transport DrFlorence/Richwood
$32,268,000Owner/User
$72.95-
442,304Class?
United Parcel Service IncIDI Logistics
3015 Kustom DrAirport/Hebron
$7,300,000Investment
$68.87-
106,000Class B
Exeter Property GroupLegrand North America
8816-8840 Beckett RdTri-County/West Chester
$4,375,000Investment
$66.497.50%
65,800Class B
Exeter Property GroupDacc Investments
SIGNIFICANT LEASE DEALSAddress Submarket/City Square Feet Tenant
3500 Langley Dr Airport/Hebron 483,000 Vertiv
175 Progress Pl Tri-County/Springdale 167,000 Product Fullfillment Solutions
1765-1795 Worldwide Bl Airport/Hebron 176,000 iHerb.com
UNDER CONSTRUCTION17 Buildings5,554,577
VACANCY14,462,593 SF5.40%
NET ABSORPTION SF1,873,154
AVG. ASKING RATE PSF GROSS$4.38
DELIVERIES8 Buildings 6,804,456
lee-associates.com LINKA BLOG BY
Q3
TOTAL INDUSTRIAL MARKET STATISTICSVacancy Rate Avg. SF Rental Rates GRS Net SF Absorption SF Inventory SF Under Construction
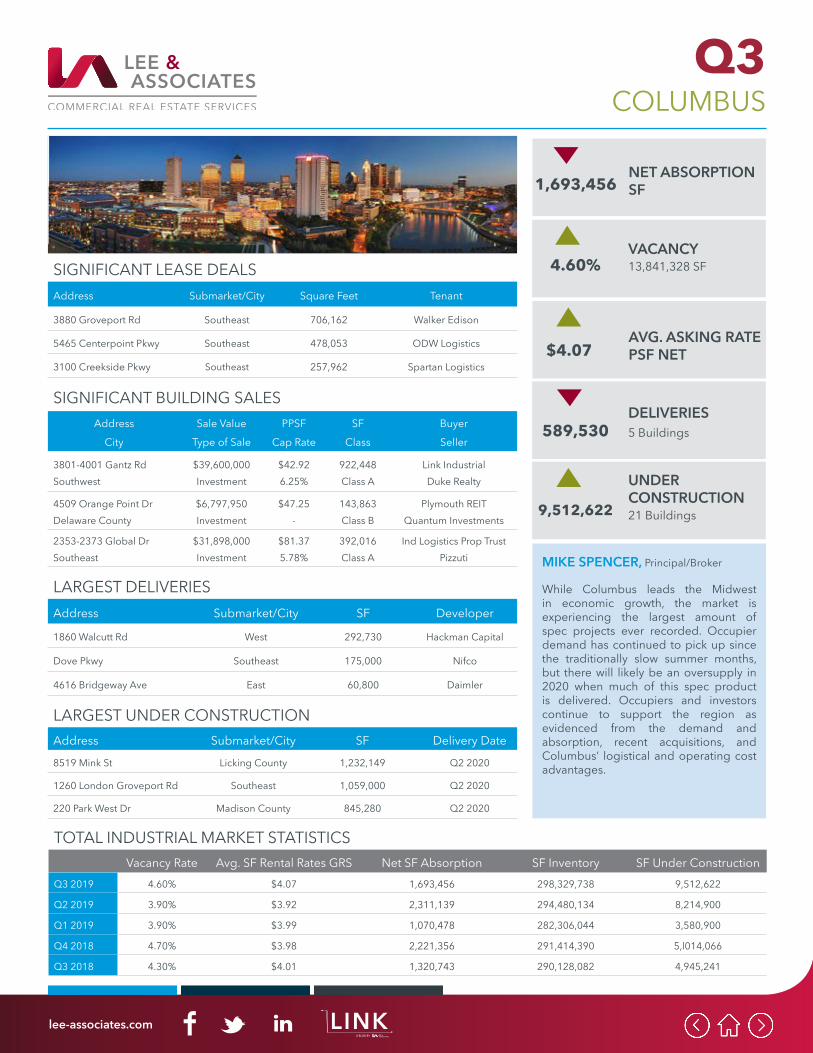
Q3 2019 4.60% $4.07 1,693,456 298,329,738 9,512,622
Q2 2019 3.90% $3.92 2,311,139 294,480,134 8,214,900
Q1 2019 3.90% $3.99 1,070,478 282,306,044 3,580,900
Q4 2018 4.70% $3.98 2,221,356 291,414,390 5,l014,066
Q3 2018 4.30% $4.01 1,320,743 290,128,082 4,945,241
COLUMBUS
LARGEST DELIVERIESAddress Submarket/City SF Developer
1860 Walcutt Rd West 292,730 Hackman Capital
Dove Pkwy Southeast 175,000 Nifco
4616 Bridgeway Ave East 60,800 Daimler
LARGEST UNDER CONSTRUCTIONAddress Submarket/City SF Delivery Date
8519 Mink St Licking County 1,232,149 Q2 2020
1260 London Groveport Rd Southeast 1,059,000 Q2 2020
220 Park West Dr Madison County 845,280 Q2 2020
MIKE SPENCER, Principal/Broker
While Columbus leads the Midwest in economic growth, the market is experiencing the largest amount of spec projects ever recorded. Occupier demand has continued to pick up since the traditionally slow summer months, but there will likely be an oversupply in 2020 when much of this spec product is delivered. Occupiers and investors continue to support the region as evidenced from the demand and absorption, recent acquisitions, and Columbus’ logistical and operating cost advantages.
SIGNIFICANT BUILDING SALESAddress
CitySale Value
Type of SalePPSF
Cap RateSF
ClassBuyerSeller
3801-4001 Gantz RdSouthwest
$39,600,000Investment
$42.926.25%
922,448Class A
Link IndustrialDuke Realty
4509 Orange Point DrDelaware County
$6,797,950Investment
$47.25-
143,863Class B
Plymouth REITQuantum Investments
2353-2373 Global DrSoutheast
$31,898,000Investment
$81.375.78%
392,016Class A
Ind Logistics Prop TrustPizzuti
SIGNIFICANT LEASE DEALSAddress Submarket/City Square Feet Tenant
3880 Groveport Rd Southeast 706,162 Walker Edison
5465 Centerpoint Pkwy Southeast 478,053 ODW Logistics
3100 Creekside Pkwy Southeast 257,962 Spartan Logistics
UNDER CONSTRUCTION21 Buildings9,512,622
VACANCY13,841,328 SF4.60%
NET ABSORPTION SF1,693,456
AVG. ASKING RATE PSF NET$4.07
DELIVERIES5 Buildings 589,530
lee-associates.com LINKA BLOG BY
Q3
TOTAL INDUSTRIAL MARKET STATISTICSVacancy Rate Avg. SF Rental Rates GRS Net SF Absorption SF Inventory SF Under Construction
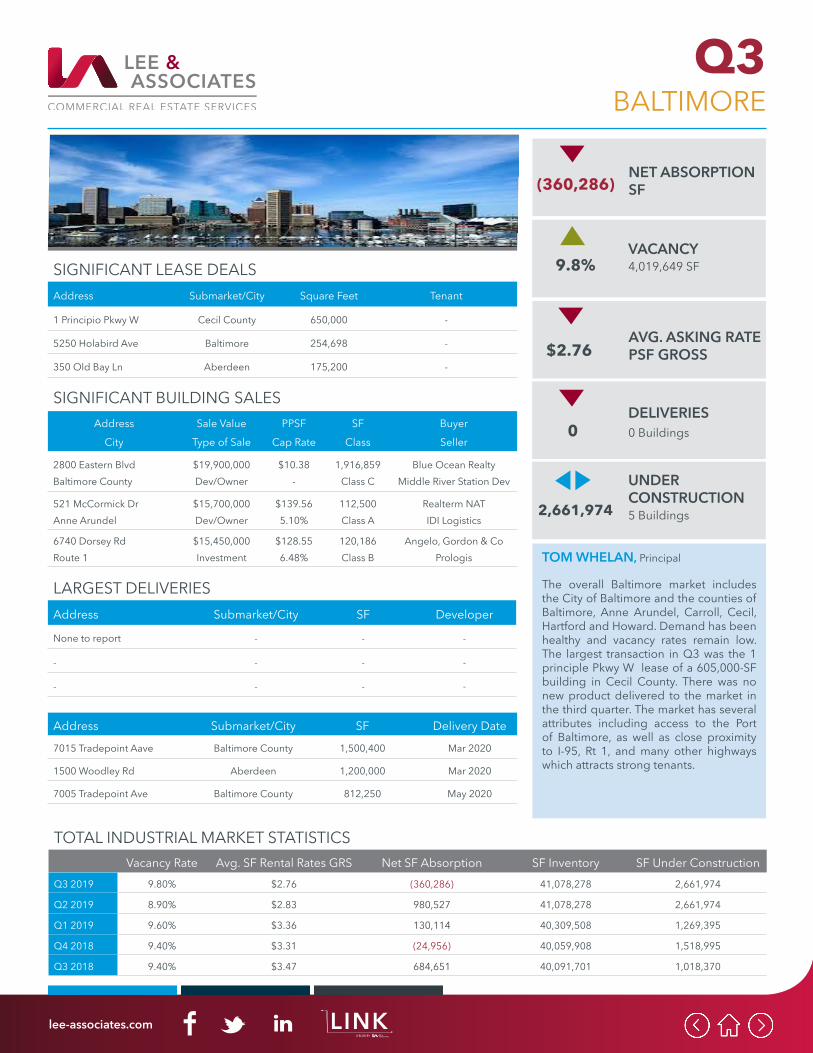
Q3 2019 9.80% $2.76 (360,286) 41,078,278 2,661,974
Q2 2019 8.90% $2.83 980,527 41,078,278 2,661,974
Q1 2019 9.60% $3.36 130,114 40,309,508 1,269,395
Q4 2018 9.40% $3.31 (24,956) 40,059,908 1,518,995
Q3 2018 9.40% $3.47 684,651 40,091,701 1,018,370
BALTIMORE
LARGEST DELIVERIESAddress Submarket/City SF Developer
None to report - - -
- - - -
- - - -
Address Submarket/City SF Delivery Date
7015 Tradepoint Aave Baltimore County 1,500,400 Mar 2020
1500 Woodley Rd Aberdeen 1,200,000 Mar 2020
7005 Tradepoint Ave Baltimore County 812,250 May 2020
TOM WHELAN, Principal
The overall Baltimore market includes the City of Baltimore and the counties of Baltimore, Anne Arundel, Carroll, Cecil, Hartford and Howard. Demand has been healthy and vacancy rates remain low. The largest transaction in Q3 was the 1 principle Pkwy W lease of a 605,000-SF building in Cecil County. There was no new product delivered to the market in the third quarter. The market has several attributes including access to the Port of Baltimore, as well as close proximity to I-95, Rt 1, and many other highways which attracts strong tenants.
SIGNIFICANT BUILDING SALESAddress
CitySale Value
Type of SalePPSF
Cap RateSF
ClassBuyerSeller
2800 Eastern BlvdBaltimore County
$19,900,000Dev/Owner
$10.38-
1,916,859Class C
Blue Ocean RealtyMiddle River Station Dev
521 McCormick DrAnne Arundel
$15,700,000Dev/Owner
$139.565.10%
112,500Class A
Realterm NATIDI Logistics
6740 Dorsey RdRoute 1
$15,450,000Investment
$128.556.48%
120,186Class B
Angelo, Gordon & CoPrologis
SIGNIFICANT LEASE DEALSAddress Submarket/City Square Feet Tenant
1 Principio Pkwy W Cecil County 650,000 -
5250 Holabird Ave Baltimore 254,698 -
350 Old Bay Ln Aberdeen 175,200 -
UNDER CONSTRUCTION5 Buildings2,661,974
VACANCY4,019,649 SF9.8%
NET ABSORPTION SF(360,286)
AVG. ASKING RATE PSF GROSS$2.76
DELIVERIES0 Buildings 0
lee-associates.com LINKA BLOG BY
Q3
TOTAL INDUSTRIAL MARKET STATISTICSVacancy Rate Avg. SF Rental Rates NNN Net SF Absorption SF Inventory SF Under Construction
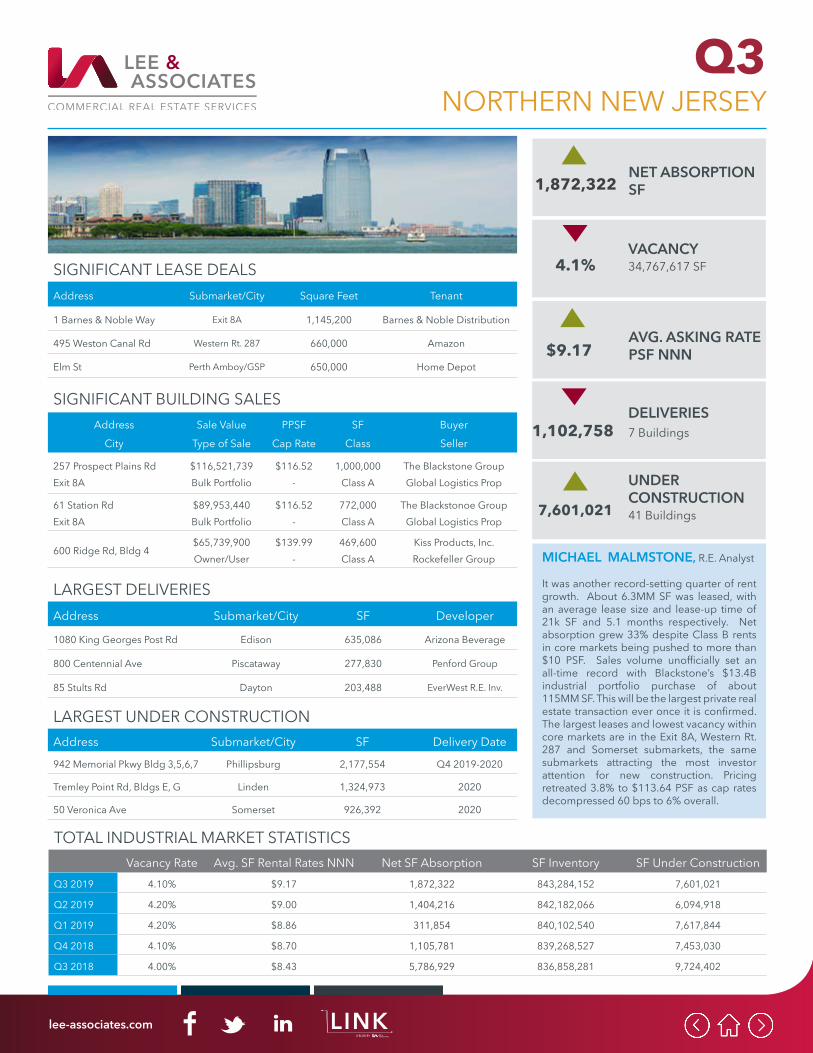
Q3 2019 4.10% $9.17 1,872,322 843,284,152 7,601,021
Q2 2019 4.20% $9.00 1,404,216 842,182,066 6,094,918
Q1 2019 4.20% $8.86 311,854 840,102,540 7,617,844
Q4 2018 4.10% $8.70 1,105,781 839,268,527 7,453,030
Q3 2018 4.00% $8.43 5,786,929 836,858,281 9,724,402
NORTHERN NEW JERSEY
LARGEST DELIVERIESAddress Submarket/City SF Developer
1080 King Georges Post Rd Edison 635,086 Arizona Beverage
800 Centennial Ave Piscataway 277,830 Penford Group
85 Stults Rd Dayton 203,488 EverWest R.E. Inv.
LARGEST UNDER CONSTRUCTIONAddress Submarket/City SF Delivery Date
942 Memorial Pkwy Bldg 3,5,6,7 Phillipsburg 2,177,554 Q4 2019-2020
Tremley Point Rd, Bldgs E, G Linden 1,324,973 2020
50 Veronica Ave Somerset 926,392 2020
MICHAEL MALMSTONE, R.E. Analyst
It was another record-setting quarter of rent growth. About 6.3MM SF was leased, with an average lease size and lease-up time of 21k SF and 5.1 months respectively. Net absorption grew 33% despite Class B rents in core markets being pushed to more than $10 PSF. Sales volume unofficially set an all-time record with Blackstone’s $13.4B industrial portfolio purchase of about 115MM SF. This will be the largest private real estate transaction ever once it is confirmed. The largest leases and lowest vacancy within core markets are in the Exit 8A, Western Rt. 287 and Somerset submarkets, the same submarkets attracting the most investor attention for new construction. Pricing retreated 3.8% to $113.64 PSF as cap rates decompressed 60 bps to 6% overall.
SIGNIFICANT BUILDING SALESAddress
CitySale Value
Type of SalePPSF
Cap RateSF
ClassBuyerSeller
257 Prospect Plains RdExit 8A
$116,521,739Bulk Portfolio
$116.52-
1,000,000Class A
The Blackstone GroupGlobal Logistics Prop
61 Station RdExit 8A
$89,953,440Bulk Portfolio
$116.52-
772,000Class A
The Blackstonoe GroupGlobal Logistics Prop
600 Ridge Rd, Bldg 4$65,739,900Owner/User
$139.99-
469,600Class A
Kiss Products, Inc.Rockefeller Group
SIGNIFICANT LEASE DEALSAddress Submarket/City Square Feet Tenant
1 Barnes & Noble Way Exit 8A 1,145,200 Barnes & Noble Distribution
495 Weston Canal Rd Western Rt. 287 660,000 Amazon
Elm St Perth Amboy/GSP 650,000 Home Depot
UNDER CONSTRUCTION41 Buildings7,601,021
VACANCY34,767,617 SF4.1%
NET ABSORPTION SF1,872,322
AVG. ASKING RATE PSF NNN$9.17
DELIVERIES7 Buildings 1,102,758
lee-associates.com LINKA BLOG BY
Q3
TOTAL INDUSTRIAL MARKET STATISTICSVacancy Rate Avg. SF Rental Rates GRS Net SF Absorption SF Inventory SF Under Construction
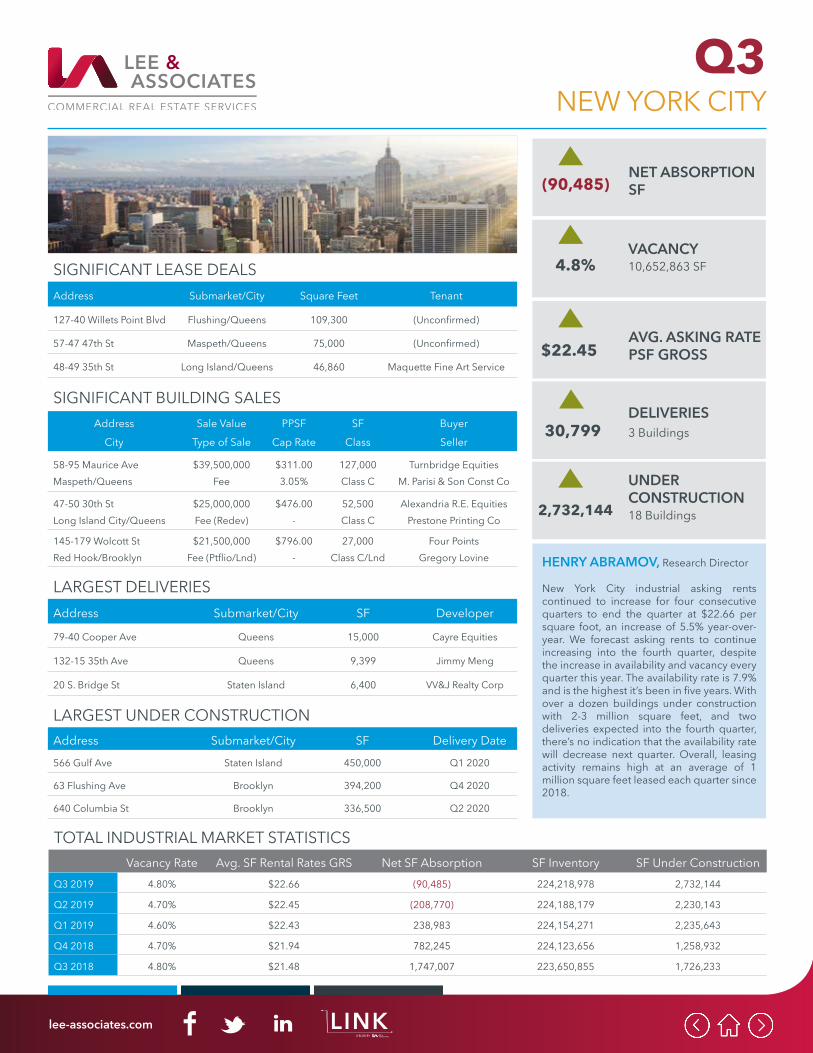
Q3 2019 4.80% $22.66 (90,485) 224,218,978 2,732,144
Q2 2019 4.70% $22.45 (208,770) 224,188,179 2,230,143
Q1 2019 4.60% $22.43 238,983 224,154,271 2,235,643
Q4 2018 4.70% $21.94 782,245 224,123,656 1,258,932
Q3 2018 4.80% $21.48 1,747,007 223,650,855 1,726,233
NEW YORK CITY
LARGEST DELIVERIESAddress Submarket/City SF Developer
79-40 Cooper Ave Queens 15,000 Cayre Equities
132-15 35th Ave Queens 9,399 Jimmy Meng
20 S. Bridge St Staten Island 6,400 VV&J Realty Corp
LARGEST UNDER CONSTRUCTIONAddress Submarket/City SF Delivery Date
566 Gulf Ave Staten Island 450,000 Q1 2020
63 Flushing Ave Brooklyn 394,200 Q4 2020
640 Columbia St Brooklyn 336,500 Q2 2020
HENRY ABRAMOV, Research Director
New York City industrial asking rents continued to increase for four consecutive quarters to end the quarter at $22.66 per square foot, an increase of 5.5% year-over-year. We forecast asking rents to continue increasing into the fourth quarter, despite the increase in availability and vacancy every quarter this year. The availability rate is 7.9% and is the highest it’s been in five years. With over a dozen buildings under construction with 2-3 million square feet, and two deliveries expected into the fourth quarter, there’s no indication that the availability rate will decrease next quarter. Overall, leasing activity remains high at an average of 1 million square feet leased each quarter since 2018.
SIGNIFICANT BUILDING SALESAddress
CitySale Value
Type of SalePPSF
Cap RateSF
ClassBuyerSeller
58-95 Maurice AveMaspeth/Queens
$39,500,000Fee
$311.003.05%
127,000Class C
Turnbridge EquitiesM. Parisi & Son Const Co
47-50 30th StLong Island City/Queens
$25,000,000Fee (Redev)
$476.00-
52,500Class C
Alexandria R.E. EquitiesPrestone Printing Co
145-179 Wolcott StRed Hook/Brooklyn
$21,500,000Fee (Ptflio/Lnd)
$796.00-
27,000Class C/Lnd
Four PointsGregory Lovine
SIGNIFICANT LEASE DEALSAddress Submarket/City Square Feet Tenant
127-40 Willets Point Blvd Flushing/Queens 109,300 (Unconfirmed)
57-47 47th St Maspeth/Queens 75,000 (Unconfirmed)
48-49 35th St Long Island/Queens 46,860 Maquette Fine Art Service
UNDER CONSTRUCTION18 Buildings2,732,144
VACANCY10,652,863 SF4.8%
NET ABSORPTION SF(90,485)
AVG. ASKING RATE PSF GROSS$22.45
DELIVERIES3 Buildings 30,799
lee-associates.com LINKA BLOG BY
Q3
TOTAL INDUSTRIAL MARKET STATISTICSVacancy Rate Avg. SF Rental Rates GRS Net SF Absorption SF Inventory SF Under Construction
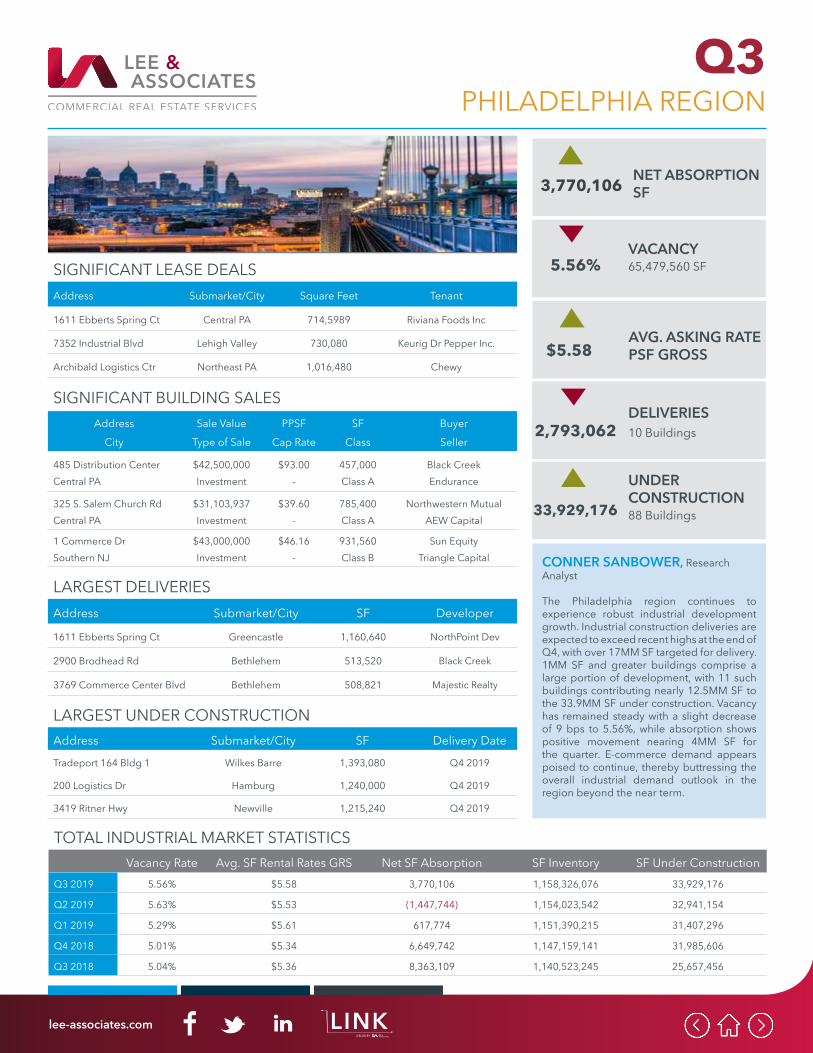
Q3 2019 5.56% $5.58 3,770,106 1,158,326,076 33,929,176
Q2 2019 5.63% $5.53 (1,447,744) 1,154,023,542 32,941,154
Q1 2019 5.29% $5.61 617,774 1,151,390,215 31,407,296
Q4 2018 5.01% $5.34 6,649,742 1,147,159,141 31,985,606
Q3 2018 5.04% $5.36 8,363,109 1,140,523,245 25,657,456
PHILADELPHIA REGION
LARGEST DELIVERIESAddress Submarket/City SF Developer
1611 Ebberts Spring Ct Greencastle 1,160,640 NorthPoint Dev
2900 Brodhead Rd Bethlehem 513,520 Black Creek
3769 Commerce Center Blvd Bethlehem 508,821 Majestic Realty
LARGEST UNDER CONSTRUCTIONAddress Submarket/City SF Delivery Date
Tradeport 164 Bldg 1 Wilkes Barre 1,393,080 Q4 2019
200 Logistics Dr Hamburg 1,240,000 Q4 2019
3419 Ritner Hwy Newville 1,215,240 Q4 2019
CONNER SANBOWER, Research Analyst
The Philadelphia region continues to experience robust industrial development growth. Industrial construction deliveries are expected to exceed recent highs at the end of Q4, with over 17MM SF targeted for delivery. 1MM SF and greater buildings comprise a large portion of development, with 11 such buildings contributing nearly 12.5MM SF to the 33.9MM SF under construction. Vacancy has remained steady with a slight decrease of 9 bps to 5.56%, while absorption shows positive movement nearing 4MM SF for the quarter. E-commerce demand appears poised to continue, thereby buttressing the overall industrial demand outlook in the region beyond the near term.
SIGNIFICANT BUILDING SALESAddress
CitySale Value
Type of SalePPSF
Cap RateSF
ClassBuyerSeller
485 Distribution CenterCentral PA
$42,500,000Investment
$93.00-
457,000Class A
Black CreekEndurance
325 S. Salem Church RdCentral PA
$31,103,937Investment
$39.60-
785,400Class A
Northwestern MutualAEW Capital
1 Commerce DrSouthern NJ
$43,000,000Investment
$46.16-
931,560Class B
Sun EquityTriangle Capital
SIGNIFICANT LEASE DEALSAddress Submarket/City Square Feet Tenant
1611 Ebberts Spring Ct Central PA 714,5989 Riviana Foods Inc
7352 Industrial Blvd Lehigh Valley 730,080 Keurig Dr Pepper Inc.
Archibald Logistics Ctr Northeast PA 1,016,480 Chewy
UNDER CONSTRUCTION88 Buildings33,929,176
VACANCY65,479,560 SF5.56%
NET ABSORPTION SF3,770,106
AVG. ASKING RATE PSF GROSS$5.58
DELIVERIES10 Buildings 2,793,062
lee-associates.com LINKA BLOG BY
Q3
TOTAL INDUSTRIAL MARKET STATISTICSVacancy Rate Avg. SF Rental Rates GRS Net SF Absorption SF Inventory SF Under Construction
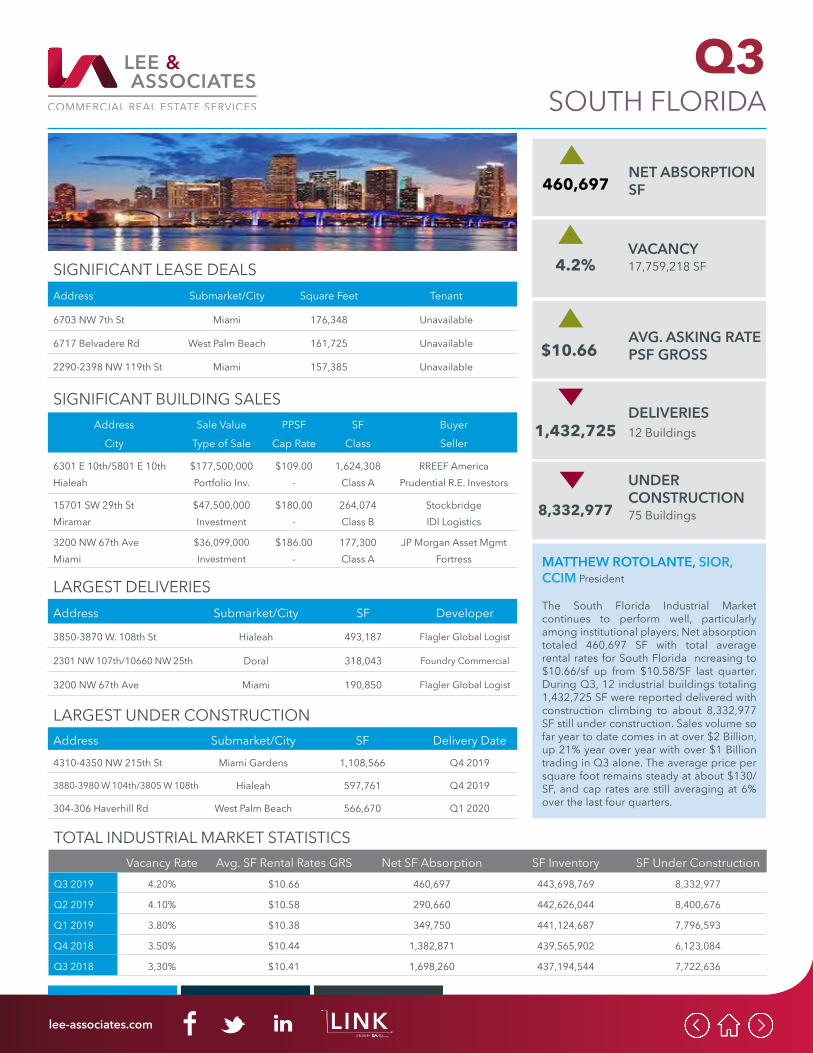
Q3 2019 4.20% $10.66 460,697 443,698,769 8,332,977
Q2 2019 4.10% $10.58 290,660 442,626,044 8,400,676
Q1 2019 3.80% $10.38 349,750 441,124,687 7,796,593
Q4 2018 3.50% $10.44 1,382,871 439,565,902 6,123,084
Q3 2018 3,30% $10.41 1,698,260 437,194,544 7,722,636
SOUTH FLORIDA
LARGEST DELIVERIESAddress Submarket/City SF Developer
3850-3870 W. 108th St Hialeah 493,187 Flagler Global Logist
2301 NW 107th/10660 NW 25th Doral 318,043 Foundry Commercial
3200 NW 67th Ave Miami 190,850 Flagler Global Logist
LARGEST UNDER CONSTRUCTIONAddress Submarket/City SF Delivery Date
4310-4350 NW 215th St Miami Gardens 1,108,566 Q4 2019
3880-3980 W 104th/3805 W 108th Hialeah 597,761 Q4 2019
304-306 Haverhill Rd West Palm Beach 566,670 Q1 2020
MATTHEW ROTOLANTE, SIOR, CCIM President
The South Florida Industrial Market continues to perform well, particularly among institutional players. Net absorption totaled 460,697 SF with total average rental rates for South Florida ncreasing to $10.66/sf up from $10.58/SF last quarter. During Q3, 12 industrial buildings totaling 1,432,725 SF were reported delivered with construction climbing to about 8,332,977 SF still under construction. Sales volume so far year to date comes in at over $2 Billion, up 21% year over year with over $1 Billion trading in Q3 alone. The average price per square foot remains steady at about $130/SF, and cap rates are still averaging at 6% over the last four quarters.
SIGNIFICANT BUILDING SALESAddress
CitySale Value
Type of SalePPSF
Cap RateSF
ClassBuyerSeller
6301 E 10th/5801 E 10thHialeah
$177,500,000Portfolio Inv.
$109.00-
1,624,308Class A
RREEF AmericaPrudential R.E. Investors
15701 SW 29th StMiramar
$47,500,000Investment
$180.00-
264,074Class B
StockbridgeIDI Logistics
3200 NW 67th AveMiami
$36,099,000Investment
$186.00-
177,300Class A
JP Morgan Asset MgmtFortress
SIGNIFICANT LEASE DEALSAddress Submarket/City Square Feet Tenant
6703 NW 7th St Miami 176,348 Unavailable
6717 Belvadere Rd West Palm Beach 161,725 Unavailable
2290-2398 NW 119th St Miami 157,385 Unavailable
UNDER CONSTRUCTION75 Buildings8,332,977
VACANCY17,759,218 SF4.2%
NET ABSORPTION SF460,697
AVG. ASKING RATE PSF GROSS$10.66
DELIVERIES12 Buildings 1,432,725
lee-associates.com LINKA BLOG BY
Q3
TOTAL INDUSTRIAL MARKET STATISTICSVacancy Rate Avg. SF Rental Rates GRS Net SF Absorption SF Inventory SF Under Construction
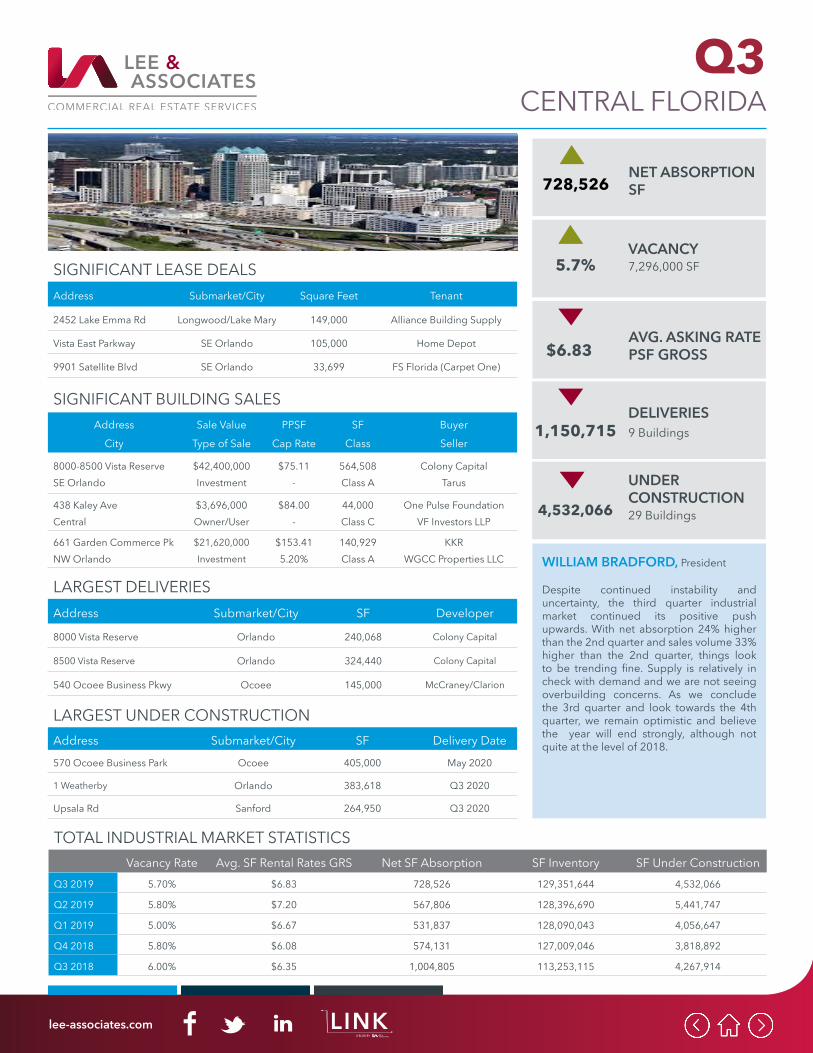
Q3 2019 5.70% $6.83 728,526 129,351,644 4,532,066
Q2 2019 5.80% $7.20 567,806 128,396,690 5,441,747
Q1 2019 5.00% $6.67 531,837 128,090,043 4,056,647
Q4 2018 5.80% $6.08 574,131 127,009,046 3,818,892
Q3 2018 6.00% $6.35 1,004,805 113,253,115 4,267,914
CENTRAL FLORIDA
LARGEST DELIVERIESAddress Submarket/City SF Developer
8000 Vista Reserve Orlando 240,068 Colony Capital
8500 Vista Reserve Orlando 324,440 Colony Capital
540 Ocoee Business Pkwy Ocoee 145,000 McCraney/Clarion
LARGEST UNDER CONSTRUCTIONAddress Submarket/City SF Delivery Date
570 Ocoee Business Park Ocoee 405,000 May 2020
1 Weatherby Orlando 383,618 Q3 2020
Upsala Rd Sanford 264,950 Q3 2020
WILLIAM BRADFORD, President
Despite continued instability and uncertainty, the third quarter industrial market continued its positive push upwards. With net absorption 24% higher than the 2nd quarter and sales volume 33% higher than the 2nd quarter, things look to be trending fine. Supply is relatively in check with demand and we are not seeing overbuilding concerns. As we conclude the 3rd quarter and look towards the 4th quarter, we remain optimistic and believe the year will end strongly, although not quite at the level of 2018.
SIGNIFICANT BUILDING SALESAddress
CitySale Value
Type of SalePPSF
Cap RateSF
ClassBuyerSeller
8000-8500 Vista ReserveSE Orlando
$42,400,000Investment
$75.11-
564,508Class A
Colony CapitalTarus
438 Kaley AveCentral
$3,696,000Owner/User
$84.00-
44,000Class C
One Pulse FoundationVF Investors LLP
661 Garden Commerce PkNW Orlando
$21,620,000Investment
$153.415.20%
140,929Class A
KKRWGCC Properties LLC
SIGNIFICANT LEASE DEALSAddress Submarket/City Square Feet Tenant
2452 Lake Emma Rd Longwood/Lake Mary 149,000 Alliance Building Supply
Vista East Parkway SE Orlando 105,000 Home Depot
9901 Satellite Blvd SE Orlando 33,699 FS Florida (Carpet One)
UNDER CONSTRUCTION29 Buildings4,532,066
VACANCY7,296,000 SF5.7%
NET ABSORPTION SF728,526
AVG. ASKING RATE PSF GROSS$6.83
DELIVERIES9 Buildings 1,150,715
lee-associates.com LINKA BLOG BY

Q3
TOTAL INDUSTRIAL MARKET STATISTICSVacancy Rate Avg. SF Rental Rates GRS Net SF Absorption SF Inventory SF Under Construction
Q3 2019 6.30% $5.28 6,305,966 709,253,894 20,609,209
Q2 2019 6.60% $5.28 4,198,969 704,526,176 21,377,513
Q1 2019 6.40% $5.19 857,014 698,940,416 17,207,348
Q4 2018 6.00% $5.08 3,491,918 694,794,278 17,338,831
Q3 2018 5.60^ $5.02 8,086,419 688,404,096 20,649,068
ATLANTA
LARGEST DELIVERIESAddress Submarket/City SF Developer
3150 Highway 42 South Atlanta 1,011,907 Scannell Properties
94 Logistics Ln Northeast 1,003,386 Exeter Property Grp
1720 Peachtree Industrial Blv Northeast 442,000 Seefried
LARGEST UNDER CONSTRUCTIONAddress Submarket/City SF Delivery Date
5455 Campbellton Fairburn Rd South Atlanta 1,400,000 Q2 2020
7055 Campbellton Rd I-20 West 1,128,400 Q2 2020
2160 Anvil Block Rd South Atlanta 1,043,418 Q4 2019
CRAIG VIERGEVER, EVP, Principal
Atlanta’s Industrial market continues to lead in strong net absorption, ending Q3 with 6.3M SF absorbed, bringing year-to-date absorption to 11.4M SF. Overall vacancy decreased 30 basis points to 6.3%. There was 20.6M SF under construction at the end of Q3. Compared to 18 buildings that broke ground in Q2, only 6 new build-to-suit and speculative properties started in Q3. At the end of Q3, the Atlanta market delivered 4M SF of new industrial product (100,000 SF plus) to the marketplace, bringing year-to-date deliveries to 12.3M SF.
SIGNIFICANT BUILDING SALESAddress
CitySale Value
Type of SalePPSF
Cap RateSF
ClassBuyerSeller
5390 Hunter RdSouth Atlanta
$59,750,000Investment
$66.005.0%
903,145Class A
Morgan Stanley R.E.LaSalle Investment Mgmt
2200 Thornton RdI-20 West
$36,700,000Investment
$77.00-
476,054Class A
Cabot Properties IncColony Capital Inc
11665 Lewis Braselton BlvNortheast
$25,000,000Investment
$54.00-
462,000Class A
BaringsUBS Realty Advisors
SIGNIFICANT LEASE DEALSAddress Submarket/City Square Feet Tenant
2100-2200 W. Park Pl Blv Stone Mountain 700,000 Amazon
1265 Terminus Dr I-20 W/Douglasville 527,000 Fr8Auctions
3120 Anvil Block Rd South Atlanta 447,520 FedEx Ground
UNDER CONSTRUCTION41 Buildings20,609,209
VACANCY44,746,317 SF6.3%
NET ABSORPTION SF6,305,966
AVG. ASKING RATE PSF GROSS$5.28
DELIVERIES11 Buildings 4,009,075
lee-associates.com LINKA BLOG BY
Q3
TOTAL INDUSTRIAL MARKET STATISTICSVacancy Rate Avg. SF Rental Rates GRS Net SF Absorption SF Inventory SF Under Construction
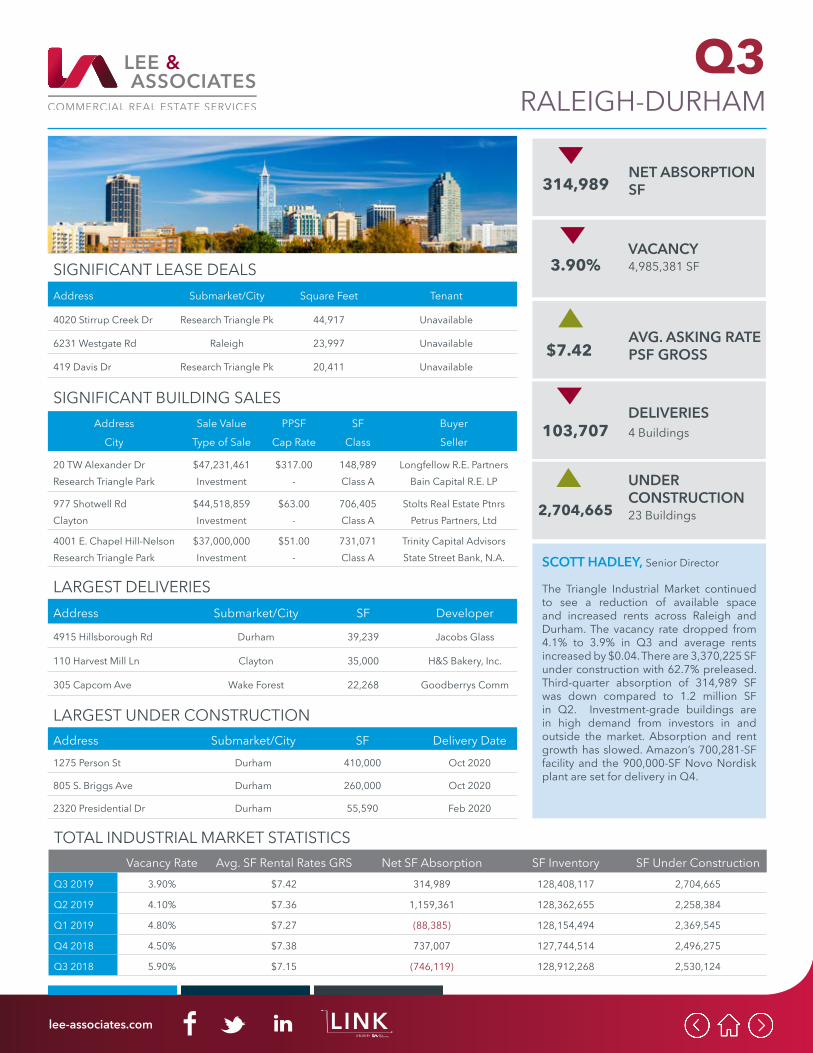
Q3 2019 3.90% $7.42 314,989 128,408,117 2,704,665
Q2 2019 4.10% $7.36 1,159,361 128,362,655 2,258,384
Q1 2019 4.80% $7.27 (88,385) 128,154,494 2,369,545
Q4 2018 4.50% $7.38 737,007 127,744,514 2,496,275
Q3 2018 5.90% $7.15 (746,119) 128,912,268 2,530,124
RALEIGH-DURHAM
LARGEST DELIVERIESAddress Submarket/City SF Developer
4915 Hillsborough Rd Durham 39,239 Jacobs Glass
110 Harvest Mill Ln Clayton 35,000 H&S Bakery, Inc.
305 Capcom Ave Wake Forest 22,268 Goodberrys Comm
LARGEST UNDER CONSTRUCTIONAddress Submarket/City SF Delivery Date
1275 Person St Durham 410,000 Oct 2020
805 S. Briggs Ave Durham 260,000 Oct 2020
2320 Presidential Dr Durham 55,590 Feb 2020
SCOTT HADLEY, Senior Director
The Triangle Industrial Market continued to see a reduction of available space and increased rents across Raleigh and Durham. The vacancy rate dropped from 4.1% to 3.9% in Q3 and average rents increased by $0.04. There are 3,370,225 SF under construction with 62.7% preleased. Third-quarter absorption of 314,989 SF was down compared to 1.2 million SF in Q2. Investment-grade buildings are in high demand from investors in and outside the market. Absorption and rent growth has slowed. Amazon’s 700,281-SF facility and the 900,000-SF Novo Nordisk plant are set for delivery in Q4.
SIGNIFICANT BUILDING SALESAddress
CitySale Value
Type of SalePPSF
Cap RateSF
ClassBuyerSeller
20 TW Alexander DrResearch Triangle Park
$47,231,461Investment
$317.00-
148,989Class A
Longfellow R.E. PartnersBain Capital R.E. LP
977 Shotwell RdClayton
$44,518,859Investment
$63.00-
706,405Class A
Stolts Real Estate PtnrsPetrus Partners, Ltd
4001 E. Chapel Hill-NelsonResearch Triangle Park
$37,000,000Investment
$51.00-
731,071Class A
Trinity Capital AdvisorsState Street Bank, N.A.
SIGNIFICANT LEASE DEALSAddress Submarket/City Square Feet Tenant
4020 Stirrup Creek Dr Research Triangle Pk 44,917 Unavailable
6231 Westgate Rd Raleigh 23,997 Unavailable
419 Davis Dr Research Triangle Pk 20,411 Unavailable
UNDER CONSTRUCTION23 Buildings2,704,665
VACANCY4,985,381 SF3.90%
NET ABSORPTION SF314,989
AVG. ASKING RATE PSF GROSS$7.42
DELIVERIES4 Buildings 103,707
lee-associates.com LINKA BLOG BY
Q3
TOTAL INDUSTRIAL MARKET STATISTICSVacancy Rate Avg. SF Rental Rates GRS Net SF Absorption SF Inventory SF Under Construction
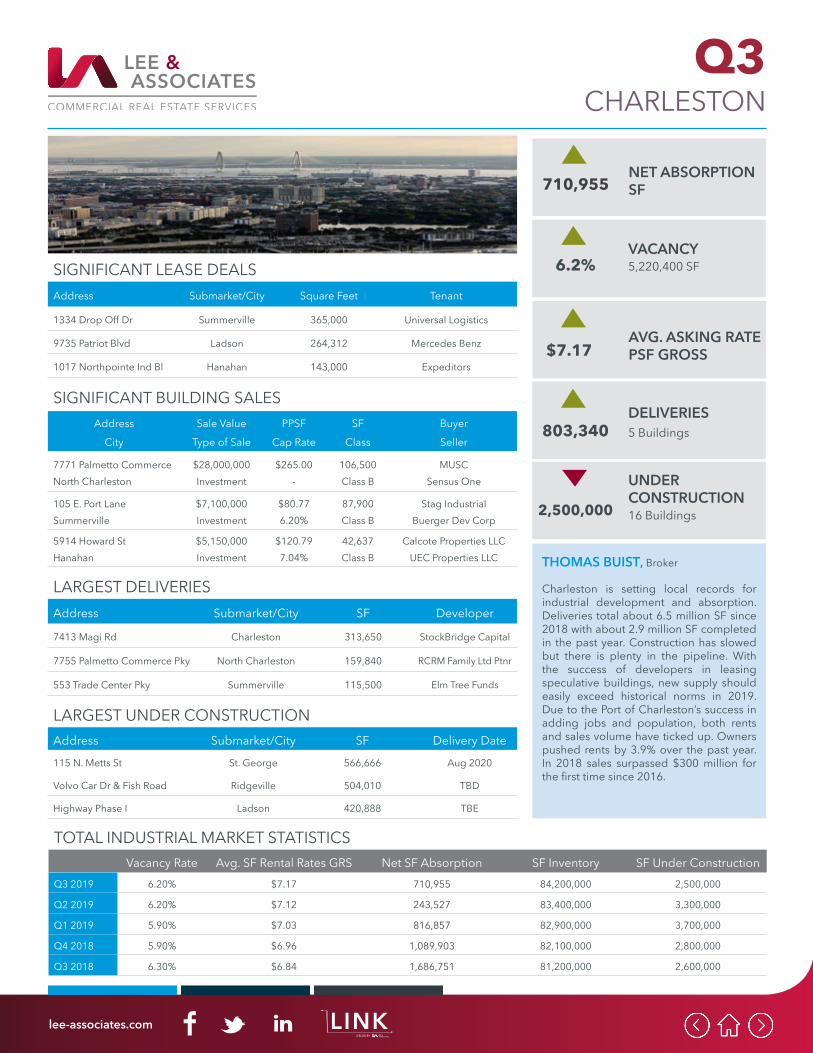
Q3 2019 6.20% $7.17 710,955 84,200,000 2,500,000
Q2 2019 6.20% $7.12 243,527 83,400,000 3,300,000
Q1 2019 5.90% $7.03 816,857 82,900,000 3,700,000
Q4 2018 5.90% $6.96 1,089,903 82,100,000 2,800,000
Q3 2018 6.30% $6.84 1,686,751 81,200,000 2,600,000
CHARLESTON
LARGEST DELIVERIESAddress Submarket/City SF Developer
7413 Magi Rd Charleston 313,650 StockBridge Capital
7755 Palmetto Commerce Pky North Charleston 159,840 RCRM Family Ltd Ptnr
553 Trade Center Pky Summerville 115,500 Elm Tree Funds
LARGEST UNDER CONSTRUCTIONAddress Submarket/City SF Delivery Date
115 N. Metts St St. George 566,666 Aug 2020
Volvo Car Dr & Fish Road Ridgeville 504,010 TBD
Highway Phase I Ladson 420,888 TBE
THOMAS BUIST, Broker
Charleston is setting local records for industrial development and absorption. Deliveries total about 6.5 million SF since 2018 with about 2.9 million SF completed in the past year. Construction has slowed but there is plenty in the pipeline. With the success of developers in leasing speculative buildings, new supply should easily exceed historical norms in 2019. Due to the Port of Charleston’s success in adding jobs and population, both rents and sales volume have ticked up. Owners pushed rents by 3.9% over the past year. In 2018 sales surpassed $300 million for the first time since 2016.
SIGNIFICANT BUILDING SALESAddress
CitySale Value
Type of SalePPSF
Cap RateSF
ClassBuyerSeller
7771 Palmetto CommerceNorth Charleston
$28,000,000Investment
$265.00-
106,500Class B
MUSCSensus One
105 E. Port LaneSummerville
$7,100,000Investment
$80.776.20%
87,900Class B
Stag IndustrialBuerger Dev Corp
5914 Howard StHanahan
$5,150,000Investment
$120.797.04%
42,637Class B
Calcote Properties LLCUEC Properties LLC
SIGNIFICANT LEASE DEALSAddress Submarket/City Square Feet Tenant
1334 Drop Off Dr Summerville 365,000 Universal Logistics
9735 Patriot Blvd Ladson 264,312 Mercedes Benz
1017 Northpointe Ind Bl Hanahan 143,000 Expeditors
UNDER CONSTRUCTION16 Buildings2,500,000
VACANCY5,220,400 SF6.2%
NET ABSORPTION SF710,955
AVG. ASKING RATE PSF GROSS$7.17
DELIVERIES5 Buildings 803,340
lee-associates.com LINKA BLOG BY
Q3
TOTAL INDUSTRIAL MARKET STATISTICSVacancy Rate Avg. SF Rental Rates GRS Net SF Absorption SF Inventory SF Under Construction
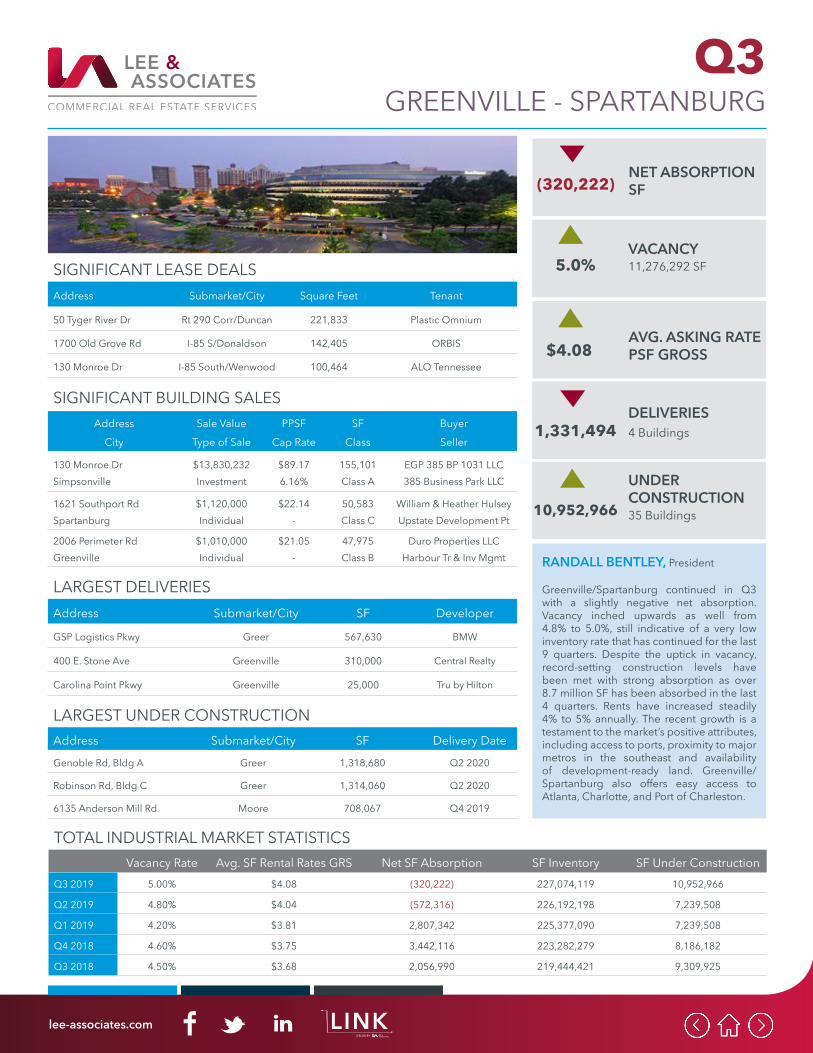
Q3 2019 5.00% $4.08 (320,222) 227,074,119 10,952,966
Q2 2019 4.80% $4.04 (572,316) 226,192,198 7,239,508
Q1 2019 4.20% $3.81 2,807,342 225,377,090 7,239,508
Q4 2018 4.60% $3.75 3,442,116 223,282,279 8,186,182
Q3 2018 4.50% $3.68 2,056,990 219,444,421 9,309,925
GREENVILLE - SPARTANBURG
LARGEST DELIVERIESAddress Submarket/City SF Developer
GSP Logistics Pkwy Greer 567,630 BMW
400 E. Stone Ave Greenville 310,000 Central Realty
Carolina Point Pkwy Greenville 25,000 Tru by Hilton
LARGEST UNDER CONSTRUCTIONAddress Submarket/City SF Delivery Date
Genoble Rd, Bldg A Greer 1,318,680 Q2 2020
Robinson Rd, Bldg C Greer 1,314,060 Q2 2020
6135 Anderson Mill Rd Moore 708,067 Q4 2019
RANDALL BENTLEY, President
Greenville/Spartanburg continued in Q3 with a slightly negative net absorption. Vacancy inched upwards as well from 4.8% to 5.0%, still indicative of a very low inventory rate that has continued for the last 9 quarters. Despite the uptick in vacancy, record-setting construction levels have been met with strong absorption as over 8.7 million SF has been absorbed in the last 4 quarters. Rents have increased steadily 4% to 5% annually. The recent growth is a testament to the market’s positive attributes, including access to ports, proximity to major metros in the southeast and availability of development-ready land. Greenville/Spartanburg also offers easy access to Atlanta, Charlotte, and Port of Charleston.
SIGNIFICANT BUILDING SALESAddress
CitySale Value
Type of SalePPSF
Cap RateSF
ClassBuyerSeller
130 Monroe DrSimpsonville
$13,830,232Investment
$89.176.16%
155,101Class A
EGP 385 BP 1031 LLC385 Business Park LLC
1621 Southport RdSpartanburg
$1,120,000Individual
$22.14-
50,583Class C
William & Heather HulseyUpstate Development Pt
2006 Perimeter RdGreenville
$1,010,000Individual
$21.05-
47,975Class B
Duro Properties LLCHarbour Tr & Inv Mgmt
SIGNIFICANT LEASE DEALSAddress Submarket/City Square Feet Tenant
50 Tyger River Dr Rt 290 Corr/Duncan 221,833 Plastic Omnium
1700 Old Grove Rd I-85 S/Donaldson 142,405 ORBIS
130 Monroe Dr I-85 South/Wenwood 100,464 ALO Tennessee
UNDER CONSTRUCTION35 Buildings10,952,966
VACANCY11,276,292 SF5.0%
NET ABSORPTION SF(320,222)
AVG. ASKING RATE PSF GROSS$4.08
DELIVERIES4 Buildings 1,331,494
lee-associates.com LINKA BLOG BY
Q3
TOTAL INDUSTRIAL MARKET STATISTICSVacancy Rate Avg. SF Rental Rates GRS Net SF Absorption SF Inventory SF Under Construction
Q3 2019 1.42% $13.10 1,637,414 214,855,677 5,067,201
Q2 2019 1.46% $12.89 1,356,107 213,145,441 4,024,055
Q1 2019 1.47% $12.89 428,998 214,855,677 3,914,415
Q4 2018 1.46% $12.56 907,240 211,339,441 3,805,649
Q3 2018 1.46% $12.15 1,439,307 210,572,470 3,536,060
METRO VANCOUVER
LARGEST DELIVERIESAddress Submarket/City SF Developer
7560 Beedie Way Delta 365,490 Beedie
2825 41B St Delta 300,000 GWL/HOOPP
18880 30th Ave Surrey 196,839 Hopewell
LARGEST UNDER CONSTRUCTIONAddress Submarket/City SF Delivery Date
18890 22nd Ave Surrey 530,563 Q2 2020
4514 27B Ave/2864 41 B St Delta 484,920 Q2 2020
18917 24 Ave Surrey 360,000 Q2 2021
NOINA MATTA, Director of Research
For Q3 2019 Metro Vancouver’s industrial market continues to experience record-low vacancy rates. Despite over 3.4 million square feet of space coming to market in the past year, the vacancy remains below 2.0%. Moreover, due to lack of specialized industrial space and a high demand, lease rates and sale prices continue to increase. There have been decreases in the residential and multi-dwelling sectors, however, the industrial sector remains strong. Prospects for non-residential construction activity in BC tops the country this year in terms of growth and capital investments.
SIGNIFICANT BUILDING SALESAddress
CitySale Value
Type of SalePPSF
Cap RateSF
ClassBuyerSeller
15050 54A AvenueSurrey
$66,150,000Investment
$221.063.8%
315,128Class A
CanFirst Capital MgmtHydro Quebec
10095 & 10097 179th StSurrey
$12,550,000Investment
$211.76-
59,265Class A
Hall Constructors CorpPD Properties & Rentals
30722 Marshall RdAbbotsford
$12,534,830Investment
$245.64-
51,030Class A
Global Bolting SystemsTeck Construction LLP
SIGNIFICANT LEASE DEALSAddress Submarket/City Square Feet Tenant
4300 80th St Delta 234,629 MTU Maintenance
3084 Peardonville Abbotsford 179,057 FlexiForce Canada Inc
27475 58 Crescent Langley 162,000 General Motors
UNDER CONSTRUCTION44 Buildings5,067,201
VACANCY3,045,192 SF1.42%
NET ABSORPTION SF1,637,414
AVG. ASKING RATE PSF GROSS$13.10
DELIVERIES12 Buildings 1,710,236
lee-associates.com LINKA BLOG BY
Q3OFFICE NATIONAL OVERVIEW
MOST 12-MONTH SALES VOLUME & AVERAGE PRICE PER SF
Market Sales Volume Avg Price/SF Market Sales Volume Avg Price/SF
New York, NY $17,381,620,431 $685.00 Boston, MA $9,167,049,930 $406.00
Washington, DC $9,016,229,734 $377.00 San Francisco, CA $7,368,653,053 $859.00
Los Angeles, CA $7,198,507,180 $433.00 Seattle, WA 6,224,261,756 $475.00
San Jose, CA $4,354,433,543 $666.00 Atlanta, GA $3,433,060,125 $197.00
Tenant growth slipped in the third quarter, notching its weakest three-month period this year. Barring a sizable gain in the fourth-quarter demand, the overall market is poised to turn in the least annual net absorption total in four years.Third-quarter absorption totaled 11,297,543 SF, 60% less than the same period last year. Year-to-date absorption through September totaled 46.3 million SF, a 28.3% drop from the first three quarters of 2018. The slowdown comes as the volume of new construction rose to 189 million SF at the end of the third quarter, a gain of 28.1 million SF compared to the same period last year. Rent growth gained an average of 3.6% year over year. Because of slowing demand and rising supply, the forecast is that rent growth will weaken further.Year-to-date demand for Class A space totaled 42.6 million SF, an 8.1% decline compared to the first nine months of 2018. Deliveries through the third quarter totaled 47 million SF, up 1.4 million SF versus a year ago, and the 152.5 million SF of new construction for premium space jumped 17.5% from the end of Q3 last year. Average year-over-year rent growth for premium space gained 2.2%.
UNDER CONSTRUCTIONMillion SF189.0
VACANCY1.1 Billion SF8.8%
Q3 NET ABSORPTIONMillion SF 11.3
AVG. ASKING RATE$26.40 PER SF0.5%
Q2 DELIVERIESMillion SF 19.7
Demand Eases Amid New Construction Boom
Demand for Class B space is off substantially so far this year. Through the third quarter, net absorption for second-tier space totaled 5.5 million SF compared to 13.5 million SF through September of last year. Deliveries of new product slipped 7.7% to 16.7 million SF year to date, but buildings under construction totaled 36.5 million SF this year, a 17.7% increase. Asking rents gained 3.5% over the same period last year. Tech markets led by Austin, TX, San Jose, CA, San Francisco and Seattle, WA, posted the strongest rent growth over the past 12 months. Metros with the weakest rent gains included New York City, Washington, D.C., and Boston, MA. Deal volume surged in the first half of the year, setting up 2019 as a potential record year. Prices continue to rise despite increasing average cap rates.
MARKETS WITH MOST SF UNDER CONSTRUCTIONMarket SF Market SF
New York, NY 17.8 M Washington, DC 13.1 M
Boston, MA 10.3 M Dallas/Ft Worth, TX 9.4 M
Chicago, IL 8.4 M Austin, TX 7.8 M
LOWEST VACANCY RATES AMONG TOP 25 MARKETSMarket Vacancy Rate Market Vacancy Rate
Seattle, WA 6.0% San Francisco, CA 6.2%
Portland, OR 6.5% Kansas City, MO 6.5%
Tampa/St. Petersburg, FL 6.7% St. Louis, MO 7.2%
HIGHEST RENTAL RATESMarket Asking Rent/SF Market Asking Rent/SF
San Francisco, CA $63.34 New York, NY $62.07
South Bay/San Jose, CA $46.83 Los Angeles, CA $37.96
Miami-Date Co, FL $37.84 Washington, DC $37.27
lee-associates.com LINKA BLOG BY

Q3
TOTAL OFFICE MARKET STATISTICSVacancy Rate Avg. SF Rental Rates GRS Net SF Absorption SF Inventory SF Under Construction
Q3 2019 9.30% $33.72 31,695 73,314,784 964,002
Q2 2019 9.40% $33.60 109,654 73,306,304 722,567
Q1 2019 9.50% $33.72 (215,363) 73,838,044 624,040
Q4 2018 9.20% $32.88 453,583 73,612,222 613,107
Q3 2018 9.80% $31.92 137,261 73,412,887 346,492
LOS ANGELES NORTH
LARGEST DELIVERIESAddress Submarket/City SF Developer
20000 Prairie St Chatsworth 255,000 MGA Entertainment
- - - -
- - - -
LARGEST UNDER CONSTRUCTIONAddress Submarket/City SF Delivery Date
6150 Laurel Canyon Blvd North Hollywood 500,000 Dec 2019
Avion Burbank Burbank 142,250 Q4 2020
18362-18424 Oxnard St Tarzana 98,527 Feb. 2020
SHELLY GARCIA, Dir. of Marketing
A quick glance suggests that the office market is plodding along with modest improvements. But a closer look shows a market in transition with strategically located creative and medical office space seeing low vacancy and high demand and the lion’s share of developer attention. Submarkets attracting creative office users, mostly in the East San Fernando Valley, show an average 4.75 percent vacancy rate, and more than two-thirds of the square footage under development geared to creative users. Medical office space, while not concentrated in one submarket cluster, is very active with one-third of the projects under development geared to health care users.
SIGNIFICANT BUILDING SALESAddress
CitySale Value
Type of SalePPSF
Cap RateSF
ClassBuyerSeller
5200 Lankershim BlvdNorth Hollywood
$91,200,000Investment
$521.00-
175,175Class A
Rockwood Cap Artisan RltySwift Real Estate Partners
24151 Ventura Blvd.Calabasas
$24,000,000Investment
$314.00-
76,496Class A
4M Investment CorpParkway Calabasas Inv
18321 Ventura BlvdTarzana
$22,000,000Investment
$260.00-
84,780Class A
Optimus Properties LLC4M Investment Corp
SIGNIFICANT LEASE DEALSAddress Submarket/City Square Feet Tenant
3900 W. Alameda Ave Burbank 115,673 Walt Disney Animation
3400 W. Olive Ave Burbank 108,167 Warner Bros.
21255 Burbank Blvd Woodland Hills 52,875 WeWork
UNDER CONSTRUCTION18 Buildings964,002
VACANCY6,826,055 SF9.3%
NET ABSORPTION SF31,659
AVG. ASKING RATE PSF GROSS$33.72
DELIVERIES1 Building255,000
lee-associates.com LINKA BLOG BY
Q3
TOTAL OFFICE MARKET STATISTICSVacancy Rate Avg. SF Rental Rates GRS Net SF Absorption SF Inventory SF Under Construction
Q3 2019 7.10% $25.80 (7,450) 32,920,270 93,160
Q2 2019 6.90% $25.32 28,568 32,887,633 94,637
Q1 2019 7.00% $25.20 66,220 32,887,633 94,637
Q4 2018 7.20% $24.48 434,658 32,887,633 104,637
Q3 2018 8.50% $24.24 (44,935) 32,887,633 104,637
LOS ANGELES - SAN GABRIEL VALLEY
LARGEST DELIVERIESAddress Submarket/City SF Developer
19115-19117 Colima Rd Rowland Heights 32,637 Rowland Hts, Medical
- - - -
- - - -
LARGEST UNDER CONSTRUCTIONAddress Submarket/City SF Delivery Date
9133 Garvey Ave Rosemead 62,000 Nov. 2019
288 N. Santa Anita Ave Arcadia 31,160 Oct 2020
- - - -
CHRISTOPHER LARIMORE, President
The SGV office leasing market experienced the usually seasonal slowing of activity due to the summer months, which lead to a few of the larger spaces available to be withdrawn. Owners sometimes correlate this slowing witheither the need for representation change or readjustment to the market. Asking rates increased 3% to $2.15 PSF and the vacancy remained almost unchanged at 6.9%. Eight sales occurred during the 3Q19 at 6.3% cap rate average and $182 PSF average. The market saw more investors purchasing office buildings which speaks to the fact that the SGV is a value-add alternative to the more expensive Los Angeles based cities. Overall sales performed at an even pace with last quarter and leasing was slower but with increased rental rates. The 4th quarter is expected to end very strong.
SIGNIFICANT BUILDING SALESAddress
CitySale Value
Type of SalePPSF
Cap RateSF
ClassBuyerSeller
955 Overland CtSan Dimas
$19,919,301Investment
$228.417.48%
87,210Class B
HCT Logistics Co, LtdAsset Mgmt Consultants
101 Centre Plaza DrMonterey Park
$14,455,000Investment
$384.54-
37,590Class C
Barry D PritchardChase Partners, Ltd
10503-10507 Valley BlvdEl Monte
$10,500,000Investment
$116.355.01%
90,243Class B
Yuqin LlJeereddi A. Prasad MD
SIGNIFICANT LEASE DEALSAddress Submarket/City Square Feet Tenant
1515 W. Cameron Ave West Covina 3,510 Children’s Bureau of SoCal
5240 Irwindale Ave Irwindale 3,350 MWDB Group, Inc.
1000 Corporate Center Monterey Park 5,620 N/A
UNDER CONSTRUCTION2 Buildings93,160
VACANCY2,322,454 SF7.1%
NET ABSORPTION SF(7,450)
AVG. ASKING RATE PSF GROSS$25.80
DELIVERIES1 Building32,637
lee-associates.com LINKA BLOG BY
Q3
TOTAL OFFICE MARKET STATISTICSVacancy Rate Avg. SF Rental Rates GRS Net SF Absorption SF Inventory SF Under Construction
Q3 2019 11.7% $39.72 37,254 18,955,573 1,300,000
Q2 2019 11.9% $38.64 13,993 18,955,573 340,067
Q1 2019 12.0% $38.64 (11,639) 18,955,573 340,067
Q4 2018 11.9% $37.68 109,928 19,955,573 121,067
Q3 2018 12.9% $35.88 25,183 19,054,149 121,067
LOS ANGELES - TRI-CITIES
LARGEST DELIVERIESAddress Submarket/City SF Developer
380 E. Union St Pasadena 82,000 Alexandria R.E. Eq
- - - -
- - - -
LARGEST UNDER CONSTRUCTIONAddress Submarket/City SF Delivery Date
10 W. Walnut Pasadena 500,000 2021
3400 Warner Blvd Burbank 800,000 2023
- - - -
COLLEEN CAREY, Founding Principal
Burbank’s office market continued to tighten with a low 7% vacancy rate. Glendale witnessed some recovery from the high-profile corporate move outs that included Nestle, which vacated 375,000 SF, and some entertainment employers. The Glendale office market sale frenzy has subsided. The Pasadena office marketplace is a hub of engineering, high tech, education and healthcare companies. Kaiser Permanente’s construction of its first medical school is taking shape. The purchase of the 600,000-SF Corporate Center on South Lake by Coretrust Capital has resulted in heavy reinvestment which should produce significant new lease activity.
SIGNIFICANT BUILDING SALESAddress
CitySale Value
Type of SalePPSF
Cap RateSF
ClassBuyerSeller
2947 Bradley StPasadena
$30,000,000Leasehold
$137.00-
219,000Class B
Graymark Capital IncHudson Advisors
2923-2935 Bradley StPasadena
$14,038,114Leasehold
$132.15-
106,229Class B
Graymark Capital IncHudson Advisors
66 Hurlbut StPasadena
$11,750,000Investment
$-
21,220Class C
Nirmal Kumar, MD IncMarkwood Enterprises
SIGNIFICANT LEASE DEALSAddress Submarket/City Square Feet Tenant
2255 N. Ontario Burbank 43,000 DNEG
55 S. Lake Ave Pasadena 26,506 HRC Management
800 N. Brand Blvd Glendale 104,000 Service Titan
UNDER CONSTRUCTION1 Building1,300,000
VACANCY2,217,319 SF11.7%
NET ABSORPTION SF37,254
AVG. ASKING RATE PSF GROSS$39.72
DELIVERIES1 Building82,000
lee-associates.com LINKA BLOG BY
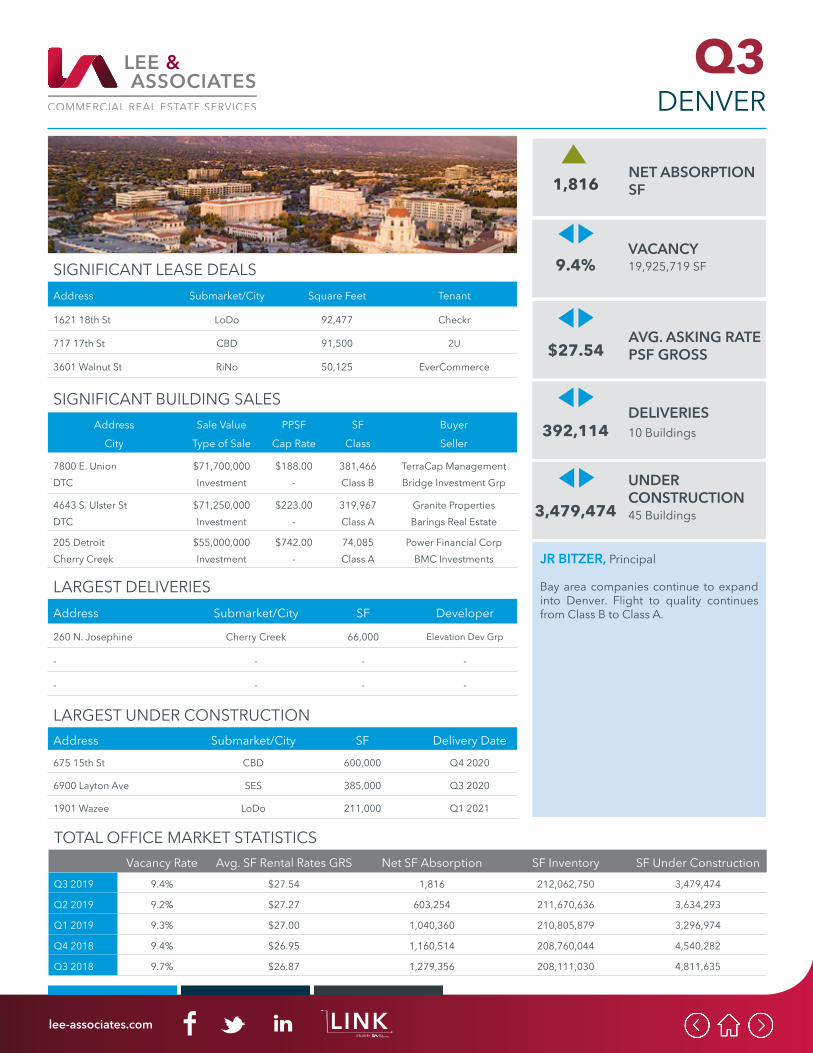
Q3
TOTAL OFFICE MARKET STATISTICSVacancy Rate Avg. SF Rental Rates GRS Net SF Absorption SF Inventory SF Under Construction
Q3 2019 9.4% $27.54 1,816 212,062,750 3,479,474
Q2 2019 9.2% $27.27 603,254 211,670,636 3,634,293
Q1 2019 9.3% $27.00 1,040,360 210,805,879 3,296,974
Q4 2018 9.4% $26.95 1,160,514 208,760,044 4,540,282
Q3 2018 9.7% $26.87 1,279,356 208,111,030 4,811,635
DENVER
LARGEST DELIVERIESAddress Submarket/City SF Developer
260 N. Josephine Cherry Creek 66,000 Elevation Dev Grp
- - - -
- - - -
LARGEST UNDER CONSTRUCTIONAddress Submarket/City SF Delivery Date
675 15th St CBD 600,000 Q4 2020
6900 Layton Ave SES 385,000 Q3 2020
1901 Wazee LoDo 211,000 Q1 2021
JR BITZER, Principal
Bay area companies continue to expand into Denver. Flight to quality continues from Class B to Class A.
SIGNIFICANT BUILDING SALESAddress
CitySale Value
Type of SalePPSF
Cap RateSF
ClassBuyerSeller
7800 E. UnionDTC
$71,700,000Investment
$188.00-
381,466Class B
TerraCap ManagementBridge Investment Grp
4643 S. Ulster StDTC
$71,250,000Investment
$223.00-
319,967Class A
Granite PropertiesBarings Real Estate
205 DetroitCherry Creek
$55,000,000Investment
$742.00-
74,085Class A
Power Financial CorpBMC Investments
SIGNIFICANT LEASE DEALSAddress Submarket/City Square Feet Tenant
1621 18th St LoDo 92,477 Checkr
717 17th St CBD 91,500 2U
3601 Walnut St RiNo 50,125 EverCommerce
UNDER CONSTRUCTION45 Buildings3,479,474
VACANCY19,925,719 SF9.4%
NET ABSORPTION SF1,816
AVG. ASKING RATE PSF GROSS$27.54
DELIVERIES10 Buildings392,114
lee-associates.com LINKA BLOG BY
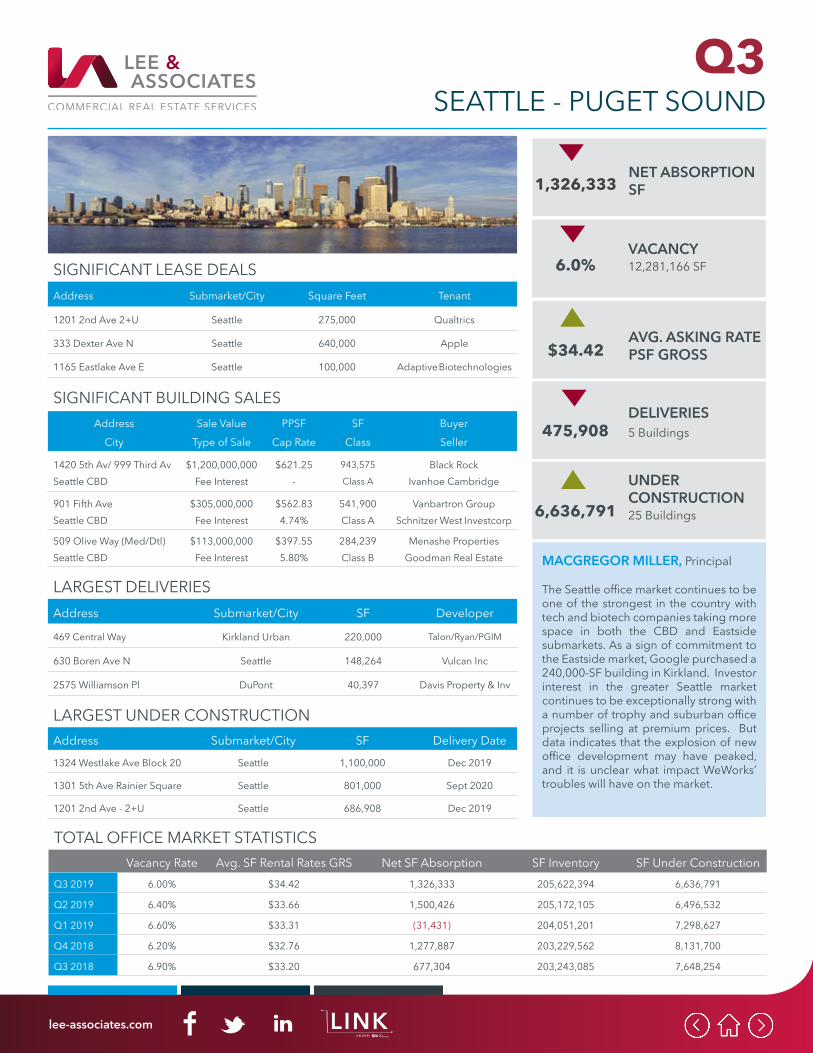
Q3
TOTAL OFFICE MARKET STATISTICSVacancy Rate Avg. SF Rental Rates GRS Net SF Absorption SF Inventory SF Under Construction
Q3 2019 6.00% $34.42 1,326,333 205,622,394 6,636,791
Q2 2019 6.40% $33.66 1,500,426 205,172,105 6,496,532
Q1 2019 6.60% $33.31 (31,431) 204,051,201 7,298,627
Q4 2018 6.20% $32.76 1,277,887 203,229,562 8,131,700
Q3 2018 6.90% $33.20 677,304 203,243,085 7,648,254
SEATTLE - PUGET SOUND
LARGEST DELIVERIESAddress Submarket/City SF Developer
469 Central Way Kirkland Urban 220,000 Talon/Ryan/PGIM
630 Boren Ave N Seattle 148,264 Vulcan Inc
2575 Williamson Pl DuPont 40,397 Davis Property & Inv
LARGEST UNDER CONSTRUCTIONAddress Submarket/City SF Delivery Date
1324 Westlake Ave Block 20 Seattle 1,100,000 Dec 2019
1301 5th Ave Rainier Square Seattle 801,000 Sept 2020
1201 2nd Ave - 2+U Seattle 686,908 Dec 2019
MACGREGOR MILLER, Principal
The Seattle office market continues to be one of the strongest in the country with tech and biotech companies taking more space in both the CBD and Eastside submarkets. As a sign of commitment to the Eastside market, Google purchased a 240,000-SF building in Kirkland. Investor interest in the greater Seattle market continues to be exceptionally strong with a number of trophy and suburban office projects selling at premium prices. But data indicates that the explosion of new office development may have peaked, and it is unclear what impact WeWorks’ troubles will have on the market.
SIGNIFICANT BUILDING SALESAddress
CitySale Value
Type of SalePPSF
Cap RateSF
ClassBuyerSeller
1420 5th Av/ 999 Third AvSeattle CBD
$1,200,000,000Fee Interest
$621.25-
943,575
Class ABlack Rock
Ivanhoe Cambridge
901 Fifth AveSeattle CBD
$305,000,000Fee Interest
$562.834.74%
541,900Class A
Vanbartron GroupSchnitzer West Investcorp
509 Olive Way (Med/Dtl)Seattle CBD
$113,000,000Fee Interest
$397.555.80%
284,239Class B
Menashe PropertiesGoodman Real Estate
SIGNIFICANT LEASE DEALSAddress Submarket/City Square Feet Tenant
1201 2nd Ave 2+U Seattle 275,000 Qualtrics
333 Dexter Ave N Seattle 640,000 Apple
1165 Eastlake Ave E Seattle 100,000 Adaptive Biotechnologies
UNDER CONSTRUCTION25 Buildings6,636,791
VACANCY12,281,166 SF6.0%
NET ABSORPTION SF1,326,333
AVG. ASKING RATE PSF GROSS$34.42
DELIVERIES5 Buildings475,908
lee-associates.com LINKA BLOG BY
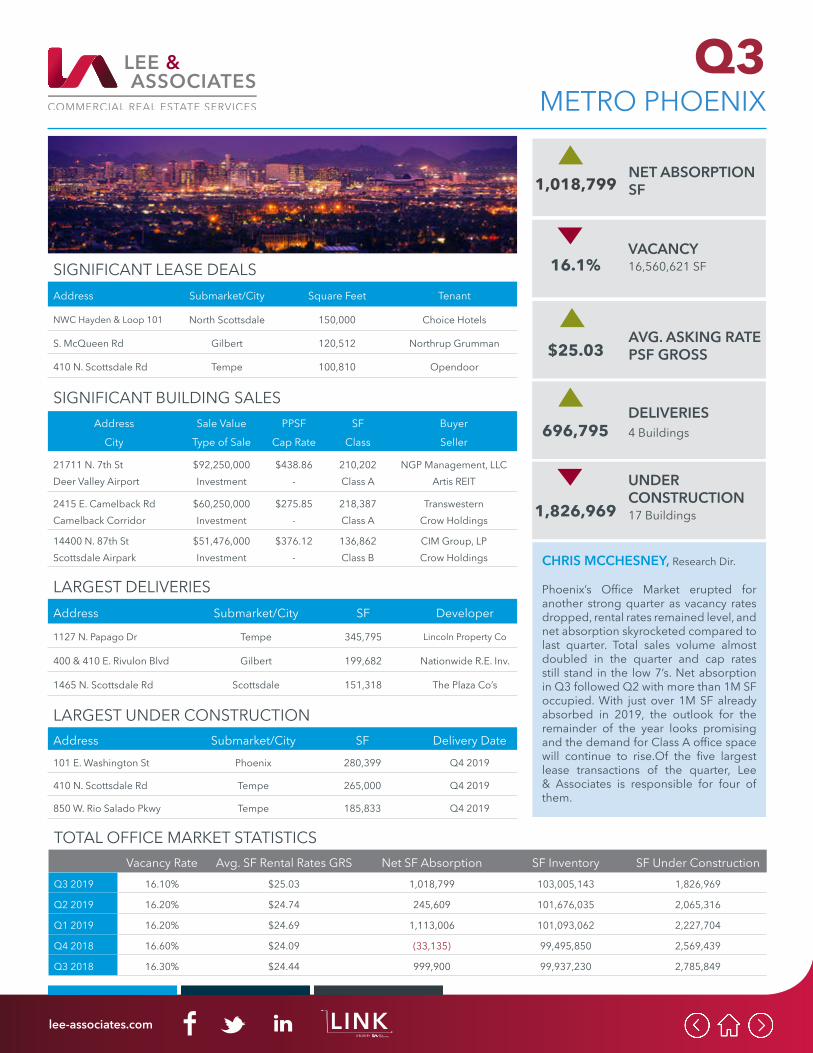
Q3
TOTAL OFFICE MARKET STATISTICSVacancy Rate Avg. SF Rental Rates GRS Net SF Absorption SF Inventory SF Under Construction
Q3 2019 16.10% $25.03 1,018,799 103,005,143 1,826,969
Q2 2019 16.20% $24.74 245,609 101,676,035 2,065,316
Q1 2019 16.20% $24.69 1,113,006 101,093,062 2,227,704
Q4 2018 16.60% $24.09 (33,135) 99,495,850 2,569,439
Q3 2018 16.30% $24.44 999,900 99,937,230 2,785,849
METRO PHOENIX
LARGEST DELIVERIESAddress Submarket/City SF Developer
1127 N. Papago Dr Tempe 345,795 Lincoln Property Co
400 & 410 E. Rivulon Blvd Gilbert 199,682 Nationwide R.E. Inv.
1465 N. Scottsdale Rd Scottsdale 151,318 The Plaza Co’s
LARGEST UNDER CONSTRUCTIONAddress Submarket/City SF Delivery Date
101 E. Washington St Phoenix 280,399 Q4 2019
410 N. Scottsdale Rd Tempe 265,000 Q4 2019
850 W. Rio Salado Pkwy Tempe 185,833 Q4 2019
CHRIS MCCHESNEY, Research Dir.
Phoenix’s Office Market erupted for another strong quarter as vacancy rates dropped, rental rates remained level, and net absorption skyrocketed compared to last quarter. Total sales volume almost doubled in the quarter and cap rates still stand in the low 7’s. Net absorption in Q3 followed Q2 with more than 1M SF occupied. With just over 1M SF already absorbed in 2019, the outlook for the remainder of the year looks promising and the demand for Class A office space will continue to rise.Of the five largest lease transactions of the quarter, Lee & Associates is responsible for four of them.
SIGNIFICANT BUILDING SALESAddress
CitySale Value
Type of SalePPSF
Cap RateSF
ClassBuyerSeller
21711 N. 7th StDeer Valley Airport
$92,250,000Investment
$438.86-
210,202Class A
NGP Management, LLCArtis REIT
2415 E. Camelback RdCamelback Corridor
$60,250,000Investment
$275.85-
218,387Class A
TranswesternCrow Holdings
14400 N. 87th StScottsdale Airpark
$51,476,000Investment
$376.12-
136,862Class B
CIM Group, LPCrow Holdings
SIGNIFICANT LEASE DEALSAddress Submarket/City Square Feet Tenant
NWC Hayden & Loop 101 North Scottsdale 150,000 Choice Hotels
S. McQueen Rd Gilbert 120,512 Northrup Grumman
410 N. Scottsdale Rd Tempe 100,810 Opendoor
UNDER CONSTRUCTION17 Buildings1,826,969
VACANCY16,560,621 SF16.1%
NET ABSORPTION SF1,018,799
AVG. ASKING RATE PSF GROSS$25.03
DELIVERIES4 Buildings696,795
lee-associates.com LINKA BLOG BY
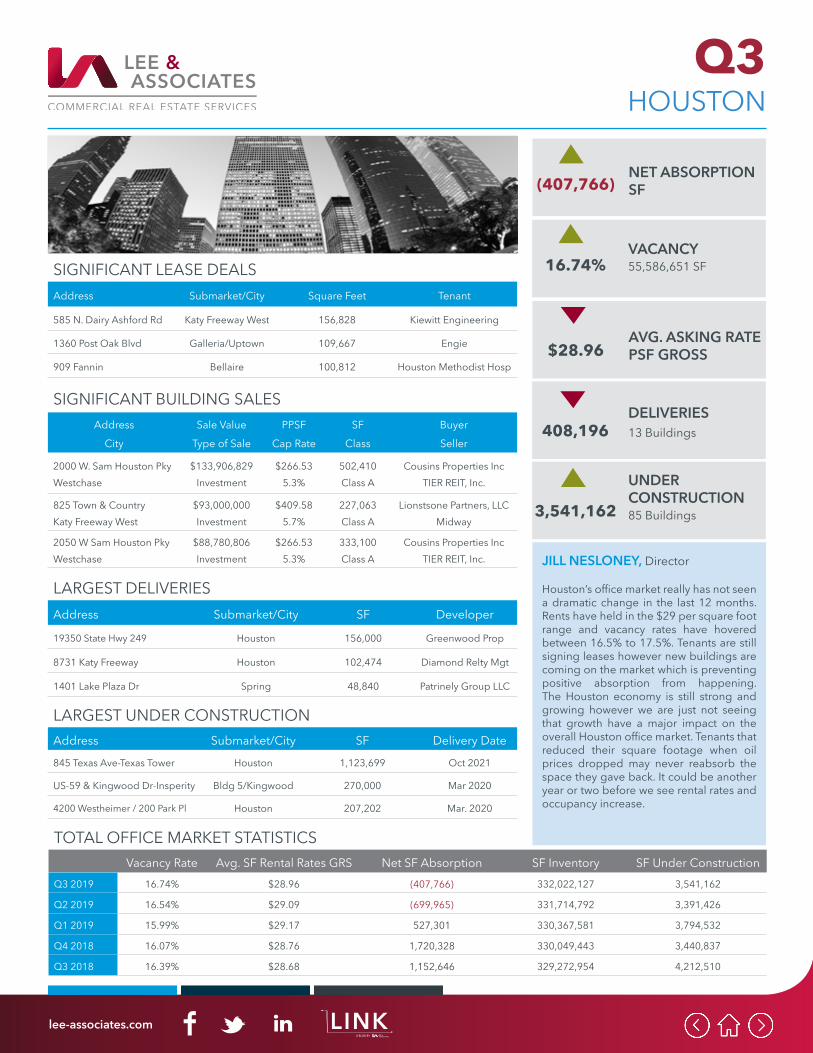
Q3
TOTAL OFFICE MARKET STATISTICSVacancy Rate Avg. SF Rental Rates GRS Net SF Absorption SF Inventory SF Under Construction
Q3 2019 16.74% $28.96 (407,766) 332,022,127 3,541,162
Q2 2019 16.54% $29.09 (699,965) 331,714,792 3,391,426
Q1 2019 15.99% $29.17 527,301 330,367,581 3,794,532
Q4 2018 16.07% $28.76 1,720,328 330,049,443 3,440,837
Q3 2018 16.39% $28.68 1,152,646 329,272,954 4,212,510
HOUSTON
LARGEST DELIVERIESAddress Submarket/City SF Developer
19350 State Hwy 249 Houston 156,000 Greenwood Prop
8731 Katy Freeway Houston 102,474 Diamond Relty Mgt
1401 Lake Plaza Dr Spring 48,840 Patrinely Group LLC
LARGEST UNDER CONSTRUCTIONAddress Submarket/City SF Delivery Date
845 Texas Ave-Texas Tower Houston 1,123,699 Oct 2021
US-59 & Kingwood Dr-Insperity Bldg 5/Kingwood 270,000 Mar 2020
4200 Westheimer / 200 Park Pl Houston 207,202 Mar. 2020
JILL NESLONEY, Director
Houston’s office market really has not seen a dramatic change in the last 12 months. Rents have held in the $29 per square foot range and vacancy rates have hovered between 16.5% to 17.5%. Tenants are still signing leases however new buildings are coming on the market which is preventing positive absorption from happening. The Houston economy is still strong and growing however we are just not seeing that growth have a major impact on the overall Houston office market. Tenants that reduced their square footage when oil prices dropped may never reabsorb the space they gave back. It could be another year or two before we see rental rates and occupancy increase.
SIGNIFICANT BUILDING SALESAddress
CitySale Value
Type of SalePPSF
Cap RateSF
ClassBuyerSeller
2000 W. Sam Houston PkyWestchase
$133,906,829Investment
$266.535.3%
502,410Class A
Cousins Properties IncTIER REIT, Inc.
825 Town & CountryKaty Freeway West
$93,000,000Investment
$409.585.7%
227,063Class A
Lionstsone Partners, LLCMidway
2050 W Sam Houston PkyWestchase
$88,780,806Investment
$266.535.3%
333,100Class A
Cousins Properties IncTIER REIT, Inc.
SIGNIFICANT LEASE DEALSAddress Submarket/City Square Feet Tenant
585 N. Dairy Ashford Rd Katy Freeway West 156,828 Kiewitt Engineering
1360 Post Oak Blvd Galleria/Uptown 109,667 Engie
909 Fannin Bellaire 100,812 Houston Methodist Hosp
UNDER CONSTRUCTION85 Buildings3,541,162
VACANCY55,586,651 SF16.74%
NET ABSORPTION SF(407,766)
AVG. ASKING RATE PSF GROSS$28.96
DELIVERIES13 Buildings408,196
lee-associates.com LINKA BLOG BY
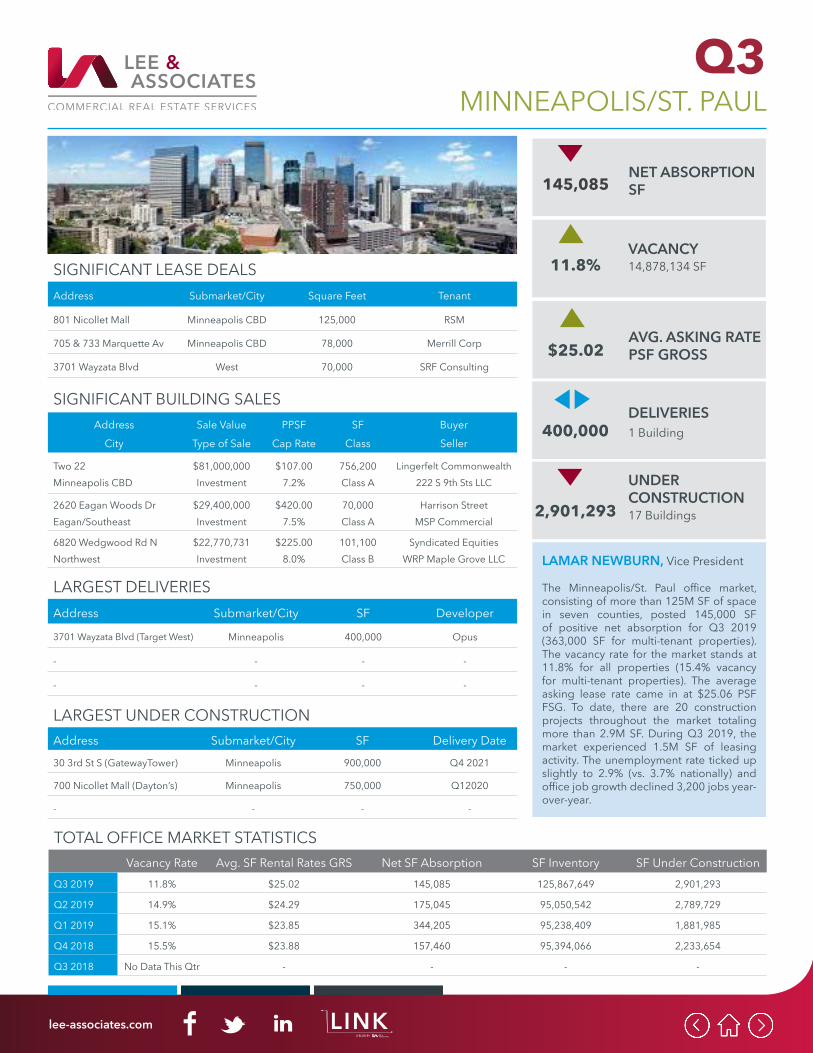
Q3
TOTAL OFFICE MARKET STATISTICSVacancy Rate Avg. SF Rental Rates GRS Net SF Absorption SF Inventory SF Under Construction
Q3 2019 11.8% $25.02 145,085 125,867,649 2,901,293
Q2 2019 14.9% $24.29 175,045 95,050,542 2,789,729
Q1 2019 15.1% $23.85 344,205 95,238,409 1,881,985
Q4 2018 15.5% $23.88 157,460 95,394,066 2,233,654
Q3 2018 No Data This Qtr - - - -
MINNEAPOLIS/ST. PAUL
LARGEST DELIVERIESAddress Submarket/City SF Developer
3701 Wayzata Blvd (Target West) Minneapolis 400,000 Opus
- - - -
- - - -
LARGEST UNDER CONSTRUCTIONAddress Submarket/City SF Delivery Date
30 3rd St S (GatewayTower) Minneapolis 900,000 Q4 2021
700 Nicollet Mall (Dayton’s) Minneapolis 750,000 Q12020
- - - -
LAMAR NEWBURN, Vice President
The Minneapolis/St. Paul office market, consisting of more than 125M SF of space in seven counties, posted 145,000 SF of positive net absorption for Q3 2019 (363,000 SF for multi-tenant properties). The vacancy rate for the market stands at 11.8% for all properties (15.4% vacancy for multi-tenant properties). The average asking lease rate came in at $25.06 PSF FSG. To date, there are 20 construction projects throughout the market totaling more than 2.9M SF. During Q3 2019, the market experienced 1.5M SF of leasing activity. The unemployment rate ticked up slightly to 2.9% (vs. 3.7% nationally) and office job growth declined 3,200 jobs year-over-year.
SIGNIFICANT BUILDING SALESAddress
CitySale Value
Type of SalePPSF
Cap RateSF
ClassBuyerSeller
Two 22Minneapolis CBD
$81,000,000Investment
$107.007.2%
756,200Class A
Lingerfelt Commonwealth222 S 9th Sts LLC
2620 Eagan Woods DrEagan/Southeast
$29,400,000Investment
$420.007.5%
70,000Class A
Harrison StreetMSP Commercial
6820 Wedgwood Rd NNorthwest
$22,770,731Investment
$225.008.0%
101,100Class B
Syndicated EquitiesWRP Maple Grove LLC
SIGNIFICANT LEASE DEALSAddress Submarket/City Square Feet Tenant
801 Nicollet Mall Minneapolis CBD 125,000 RSM
705 & 733 Marquette Av Minneapolis CBD 78,000 Merrill Corp
3701 Wayzata Blvd West 70,000 SRF Consulting
UNDER CONSTRUCTION17 Buildings2,901,293
VACANCY14,878,134 SF11.8%
NET ABSORPTION SF145,085
AVG. ASKING RATE PSF GROSS$25.02
DELIVERIES1 Building400,000
lee-associates.com LINKA BLOG BY
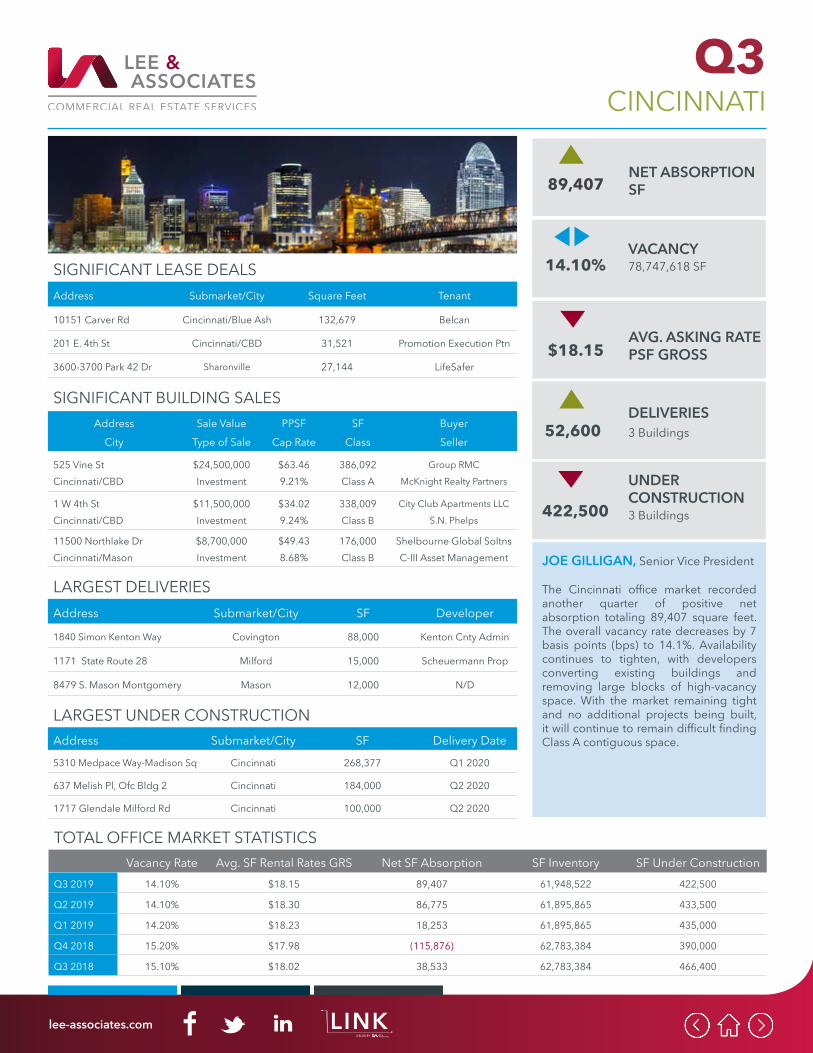
Q3
TOTAL OFFICE MARKET STATISTICSVacancy Rate Avg. SF Rental Rates GRS Net SF Absorption SF Inventory SF Under Construction
Q3 2019 14.10% $18.15 89,407 61,948,522 422,500
Q2 2019 14.10% $18.30 86,775 61,895,865 433,500
Q1 2019 14.20% $18.23 18,253 61,895,865 435,000
Q4 2018 15.20% $17.98 (115,876) 62,783,384 390,000
Q3 2018 15.10% $18.02 38,533 62,783,384 466,400
CINCINNATI
LARGEST DELIVERIESAddress Submarket/City SF Developer
1840 Simon Kenton Way Covington 88,000 Kenton Cnty Admin
1171 State Route 28 Milford 15,000 Scheuermann Prop
8479 S. Mason Montgomery Mason 12,000 N/D
LARGEST UNDER CONSTRUCTIONAddress Submarket/City SF Delivery Date
5310 Medpace Way-Madison Sq Cincinnati 268,377 Q1 2020
637 Melish Pl, Ofc Bldg 2 Cincinnati 184,000 Q2 2020
1717 Glendale Milford Rd Cincinnati 100,000 Q2 2020
JOE GILLIGAN, Senior Vice President
The Cincinnati office market recorded another quarter of positive net absorption totaling 89,407 square feet. The overall vacancy rate decreases by 7 basis points (bps) to 14.1%. Availability continues to tighten, with developers converting existing buildings and removing large blocks of high-vacancy space. With the market remaining tight and no additional projects being built, it will continue to remain difficult finding Class A contiguous space.
SIGNIFICANT BUILDING SALESAddress
CitySale Value
Type of SalePPSF
Cap RateSF
ClassBuyerSeller
525 Vine StCincinnati/CBD
$24,500,000Investment
$63.469.21%
386,092Class A
Group RMCMcKnight Realty Partners
1 W 4th StCincinnati/CBD
$11,500,000Investment
$34.029.24%
338,009Class B
City Club Apartments LLCS.N. Phelps
11500 Northlake DrCincinnati/Mason
$8,700,000Investment
$49.438.68%
176,000Class B
Shelbourne Global SoltnsC-III Asset Management
SIGNIFICANT LEASE DEALSAddress Submarket/City Square Feet Tenant
10151 Carver Rd Cincinnati/Blue Ash 132,679 Belcan
201 E. 4th St Cincinnati/CBD 31,521 Promotion Execution Ptn
3600-3700 Park 42 Dr Sharonville 27,144 LifeSafer
UNDER CONSTRUCTION3 Buildings422,500
VACANCY78,747,618 SF14.10%
NET ABSORPTION SF89,407
AVG. ASKING RATE PSF GROSS$18.15
DELIVERIES3 Buildings52,600
lee-associates.com LINKA BLOG BY
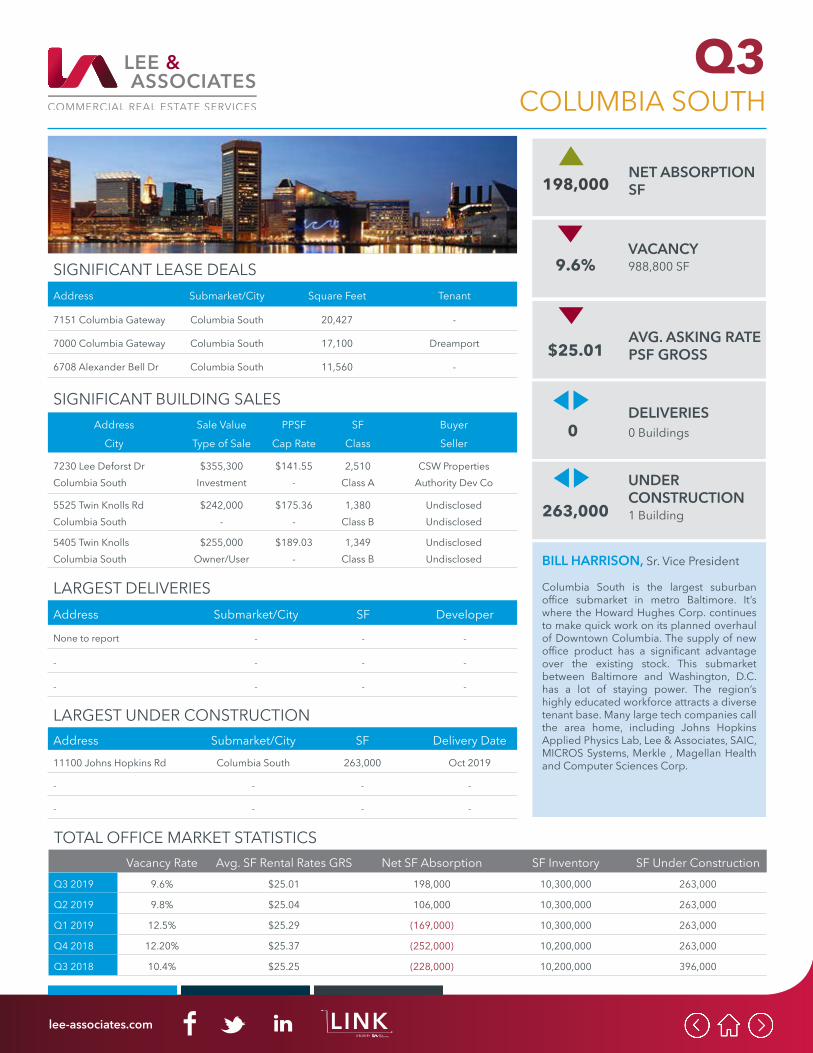
Q3
TOTAL OFFICE MARKET STATISTICSVacancy Rate Avg. SF Rental Rates GRS Net SF Absorption SF Inventory SF Under Construction
Q3 2019 9.6% $25.01 198,000 10,300,000 263,000
Q2 2019 9.8% $25.04 106,000 10,300,000 263,000
Q1 2019 12.5% $25.29 (169,000) 10,300,000 263,000
Q4 2018 12.20% $25.37 (252,000) 10,200,000 263,000
Q3 2018 10.4% $25.25 (228,000) 10,200,000 396,000
COLUMBIA SOUTH
LARGEST DELIVERIESAddress Submarket/City SF Developer
None to report - - -
- - - -
- - - -
LARGEST UNDER CONSTRUCTIONAddress Submarket/City SF Delivery Date
11100 Johns Hopkins Rd Columbia South 263,000 Oct 2019
- - - -
- - - -
BILL HARRISON, Sr. Vice President
Columbia South is the largest suburban office submarket in metro Baltimore. It’s where the Howard Hughes Corp. continues to make quick work on its planned overhaul of Downtown Columbia. The supply of new office product has a significant advantage over the existing stock. This submarket between Baltimore and Washington, D.C. has a lot of staying power. The region’s highly educated workforce attracts a diverse tenant base. Many large tech companies call the area home, including Johns Hopkins Applied Physics Lab, Lee & Associates, SAIC, MICROS Systems, Merkle , Magellan Health and Computer Sciences Corp.
SIGNIFICANT BUILDING SALESAddress
CitySale Value
Type of SalePPSF
Cap RateSF
ClassBuyerSeller
7230 Lee Deforst DrColumbia South
$355,300Investment
$141.55-
2,510Class A
CSW PropertiesAuthority Dev Co
5525 Twin Knolls RdColumbia South
$242,000-
$175.36-
1,380Class B
UndisclosedUndisclosed
5405 Twin KnollsColumbia South
$255,000Owner/User
$189.03-
1,349Class B
UndisclosedUndisclosed
SIGNIFICANT LEASE DEALSAddress Submarket/City Square Feet Tenant
7151 Columbia Gateway Columbia South 20,427 -
7000 Columbia Gateway Columbia South 17,100 Dreamport
6708 Alexander Bell Dr Columbia South 11,560 -
UNDER CONSTRUCTION1 Building263,000
VACANCY988,800 SF9.6%
NET ABSORPTION SF198,000
AVG. ASKING RATE PSF GROSS$25.01
DELIVERIES0 Buildings0
lee-associates.com LINKA BLOG BY
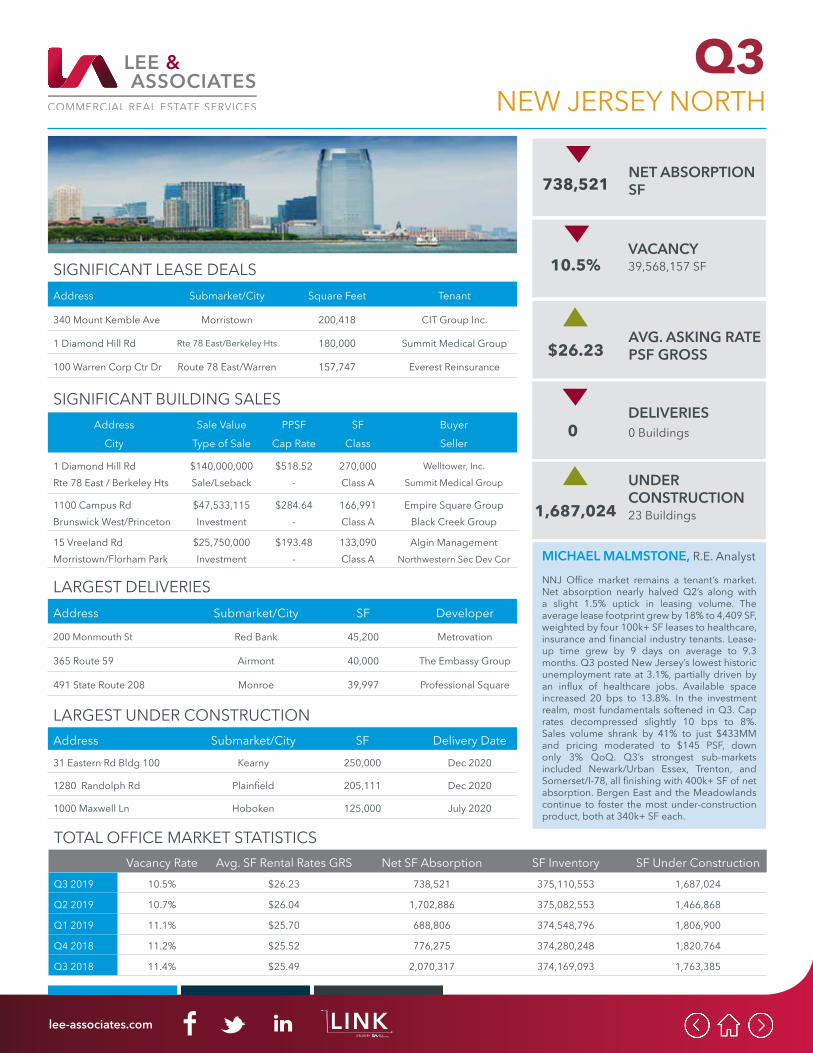
Q3
TOTAL OFFICE MARKET STATISTICSVacancy Rate Avg. SF Rental Rates GRS Net SF Absorption SF Inventory SF Under Construction
Q3 2019 10.5% $26.23 738,521 375,110,553 1,687,024
Q2 2019 10.7% $26.04 1,702,886 375,082,553 1,466,868
Q1 2019 11.1% $25.70 688,806 374,548,796 1,806,900
Q4 2018 11.2% $25.52 776,275 374,280,248 1,820,764
Q3 2018 11.4% $25.49 2,070,317 374,169,093 1,763,385
NEW JERSEY NORTH
LARGEST DELIVERIESAddress Submarket/City SF Developer
200 Monmouth St Red Bank 45,200 Metrovation
365 Route 59 Airmont 40,000 The Embassy Group
491 State Route 208 Monroe 39,997 Professional Square
LARGEST UNDER CONSTRUCTIONAddress Submarket/City SF Delivery Date
31 Eastern Rd Bldg 100 Kearny 250,000 Dec 2020
1280 Randolph Rd Plainfield 205,111 Dec 2020
1000 Maxwell Ln Hoboken 125,000 July 2020
MICHAEL MALMSTONE, R.E. Analyst
NNJ Office market remains a tenant’s market. Net absorption nearly halved Q2’s along with a slight 1.5% uptick in leasing volume. The average lease footprint grew by 18% to 4,409 SF, weighted by four 100k+ SF leases to healthcare, insurance and financial industry tenants. Lease-up time grew by 9 days on average to 9.3 months. Q3 posted New Jersey’s lowest historic unemployment rate at 3.1%, partially driven by an influx of healthcare jobs. Available space increased 20 bps to 13.8%. In the investment realm, most fundamentals softened in Q3. Cap rates decompressed slightly 10 bps to 8%. Sales volume shrank by 41% to just $433MM and pricing moderated to $145 PSF, down only 3% QoQ. Q3’s strongest sub-markets included Newark/Urban Essex, Trenton, and Somerset/I-78, all finishing with 400k+ SF of net absorption. Bergen East and the Meadowlands continue to foster the most under-construction product, both at 340k+ SF each.
SIGNIFICANT BUILDING SALESAddress
CitySale Value
Type of SalePPSF
Cap RateSF
ClassBuyerSeller
1 Diamond Hill RdRte 78 East / Berkeley Hts
$140,000,000Sale/Lseback
$518.52-
270,000Class A
Welltower, Inc.
Summit Medical Group
1100 Campus RdBrunswick West/Princeton
$47,533,115Investment
$284.64-
166,991Class A
Empire Square GroupBlack Creek Group
15 Vreeland RdMorristown/Florham Park
$25,750,000Investment
$193.48-
133,090Class A
Algin ManagementNorthwestern Sec Dev Cor
SIGNIFICANT LEASE DEALSAddress Submarket/City Square Feet Tenant
340 Mount Kemble Ave Morristown 200,418 CIT Group Inc.
1 Diamond Hill Rd Rte 78 East/Berkeley Hts 180,000 Summit Medical Group
100 Warren Corp Ctr Dr Route 78 East/Warren 157,747 Everest Reinsurance
UNDER CONSTRUCTION23 Buildings1,687,024
VACANCY39,568,157 SF10.5%
NET ABSORPTION SF738,521
AVG. ASKING RATE PSF GROSS$26.23
DELIVERIES0 Buildings0
lee-associates.com LINKA BLOG BY
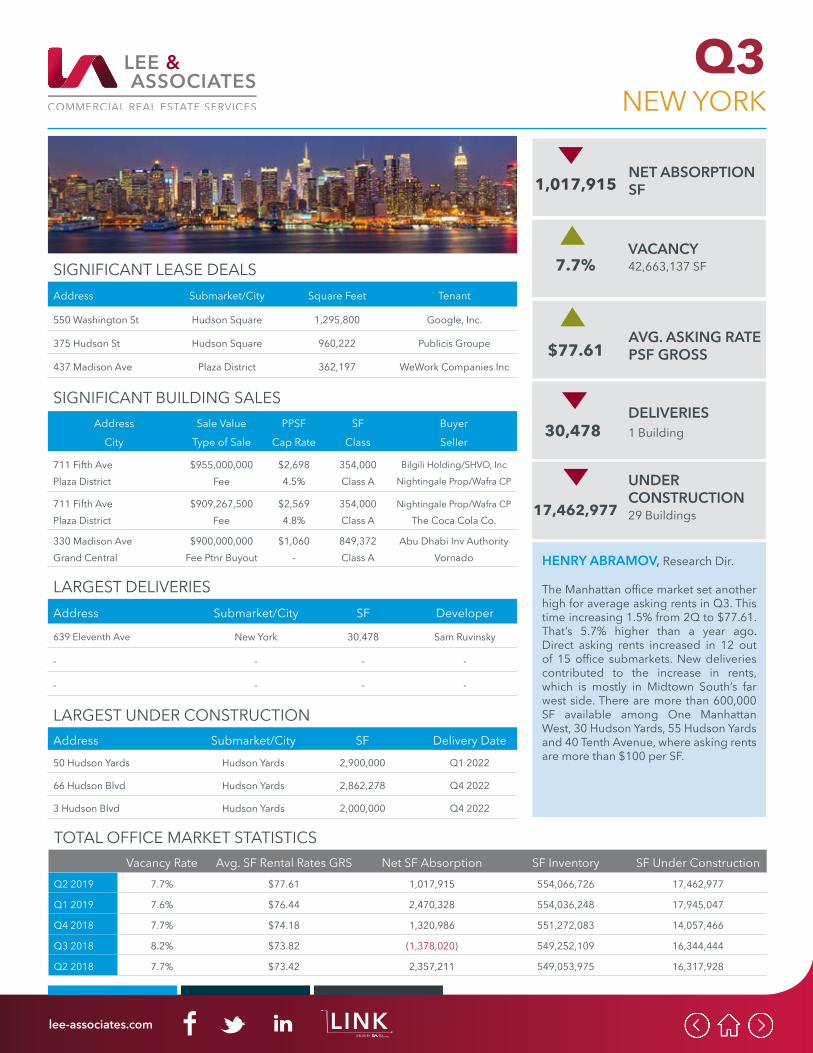
Q3
TOTAL OFFICE MARKET STATISTICSVacancy Rate Avg. SF Rental Rates GRS Net SF Absorption SF Inventory SF Under Construction
Q2 2019 7.7% $77.61 1,017,915 554,066,726 17,462,977
Q1 2019 7.6% $76.44 2,470,328 554,036,248 17,945,047
Q4 2018 7.7% $74.18 1,320,986 551,272,083 14,057,466
Q3 2018 8.2% $73.82 (1,378,020) 549,252,109 16,344,444
Q2 2018 7.7% $73.42 2,357,211 549,053,975 16,317,928
NEW YORK
LARGEST DELIVERIESAddress Submarket/City SF Developer
639 Eleventh Ave New York 30,478 Sam Ruvinsky
- - - -
- - - -
LARGEST UNDER CONSTRUCTIONAddress Submarket/City SF Delivery Date
50 Hudson Yards Hudson Yards 2,900,000 Q1 2022
66 Hudson Blvd Hudson Yards 2,862,278 Q4 2022
3 Hudson Blvd Hudson Yards 2,000,000 Q4 2022
HENRY ABRAMOV, Research Dir.
The Manhattan office market set another high for average asking rents in Q3. This time increasing 1.5% from 2Q to $77.61. That’s 5.7% higher than a year ago. Direct asking rents increased in 12 out of 15 office submarkets. New deliveries contributed to the increase in rents, which is mostly in Midtown South’s far west side. There are more than 600,000 SF available among One Manhattan West, 30 Hudson Yards, 55 Hudson Yards and 40 Tenth Avenue, where asking rents are more than $100 per SF.
SIGNIFICANT BUILDING SALESAddress
CitySale Value
Type of SalePPSF
Cap RateSF
ClassBuyerSeller
711 Fifth AvePlaza District
$955,000,000Fee
$2,6984.5%
354,000Class A
Bilgili Holding/SHVO, Inc
Nightingale Prop/Wafra CP
711 Fifth AvePlaza District
$909,267,500Fee
$2,5694.8%
354,000Class A
Nightingale Prop/Wafra CP
The Coca Cola Co.
330 Madison AveGrand Central
$900,000,000Fee Ptnr Buyout
$1,060-
849,372Class A
Abu Dhabi Inv AuthorityVornado
SIGNIFICANT LEASE DEALSAddress Submarket/City Square Feet Tenant
550 Washington St Hudson Square 1,295,800 Google, Inc.
375 Hudson St Hudson Square 960,222 Publicis Groupe
437 Madison Ave Plaza District 362,197 WeWork Companies Inc
UNDER CONSTRUCTION29 Buildings17,462,977
VACANCY42,663,137 SF7.7%
NET ABSORPTION SF1,017,915
AVG. ASKING RATE PSF GROSS$77.61
DELIVERIES1 Building30,478
lee-associates.com LINKA BLOG BY
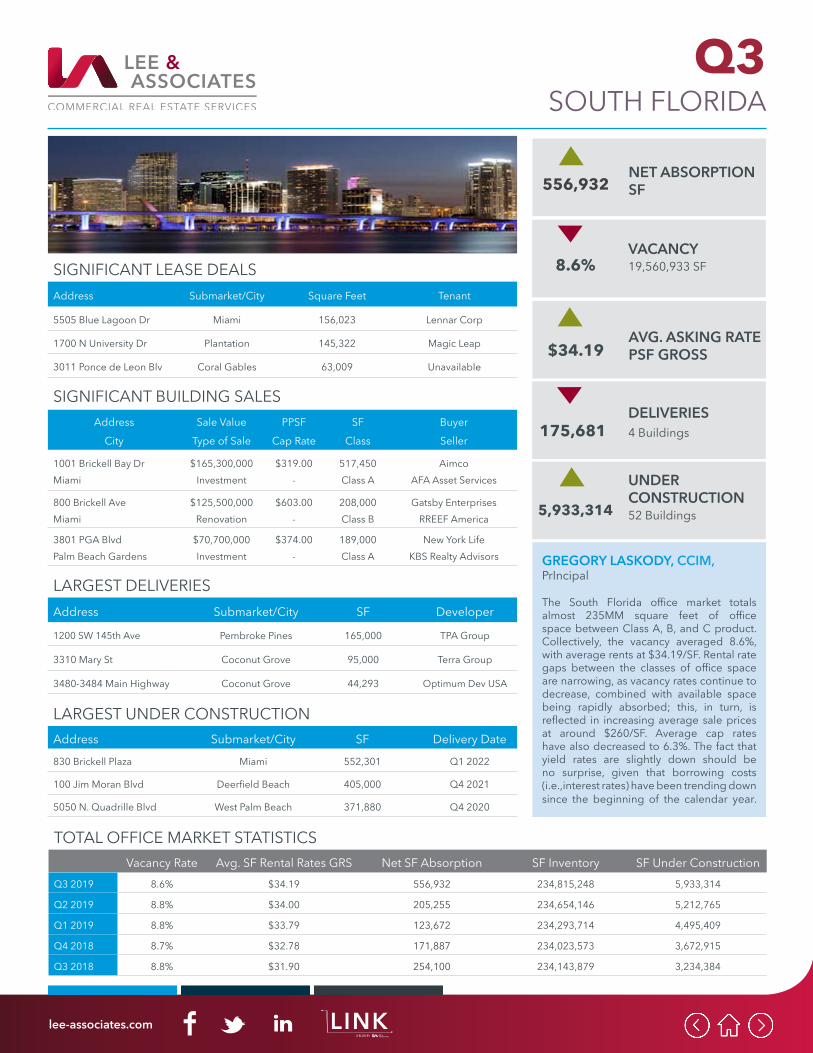
Q3
TOTAL OFFICE MARKET STATISTICSVacancy Rate Avg. SF Rental Rates GRS Net SF Absorption SF Inventory SF Under Construction
Q3 2019 8.6% $34.19 556,932 234,815,248 5,933,314
Q2 2019 8.8% $34.00 205,255 234,654,146 5,212,765
Q1 2019 8.8% $33.79 123,672 234,293,714 4,495,409
Q4 2018 8.7% $32.78 171,887 234,023,573 3,672,915
Q3 2018 8.8% $31.90 254,100 234,143,879 3,234,384
SOUTH FLORIDA
LARGEST DELIVERIESAddress Submarket/City SF Developer
1200 SW 145th Ave Pembroke Pines 165,000 TPA Group
3310 Mary St Coconut Grove 95,000 Terra Group
3480-3484 Main Highway Coconut Grove 44,293 Optimum Dev USA
LARGEST UNDER CONSTRUCTIONAddress Submarket/City SF Delivery Date
830 Brickell Plaza Miami 552,301 Q1 2022
100 Jim Moran Blvd Deerfield Beach 405,000 Q4 2021
5050 N. Quadrille Blvd West Palm Beach 371,880 Q4 2020
GREGORY LASKODY, CCIM, PrIncipal
The South Florida office market totals almost 235MM square feet of office space between Class A, B, and C product. Collectively, the vacancy averaged 8.6%, with average rents at $34.19/SF. Rental rate gaps between the classes of office space are narrowing, as vacancy rates continue to decrease, combined with available space being rapidly absorbed; this, in turn, is reflected in increasing average sale prices at around $260/SF. Average cap rates have also decreased to 6.3%. The fact that yield rates are slightly down should be no surprise, given that borrowing costs (i.e.,interest rates) have been trending down since the beginning of the calendar year.
SIGNIFICANT BUILDING SALESAddress
CitySale Value
Type of SalePPSF
Cap RateSF
ClassBuyerSeller
1001 Brickell Bay DrMiami
$165,300,000Investment
$319.00-
517,450Class A
AimcoAFA Asset Services
800 Brickell AveMiami
$125,500,000Renovation
$603.00-
208,000Class B
Gatsby EnterprisesRREEF America
3801 PGA BlvdPalm Beach Gardens
$70,700,000Investment
$374.00-
189,000Class A
New York LifeKBS Realty Advisors
SIGNIFICANT LEASE DEALSAddress Submarket/City Square Feet Tenant
5505 Blue Lagoon Dr Miami 156,023 Lennar Corp
1700 N University Dr Plantation 145,322 Magic Leap
3011 Ponce de Leon Blv Coral Gables 63,009 Unavailable
UNDER CONSTRUCTION52 Buildings5,933,314
VACANCY19,560,933 SF8.6%
NET ABSORPTION SF556,932
AVG. ASKING RATE PSF GROSS$34.19
DELIVERIES4 Buildings175,681
lee-associates.com LINKA BLOG BY
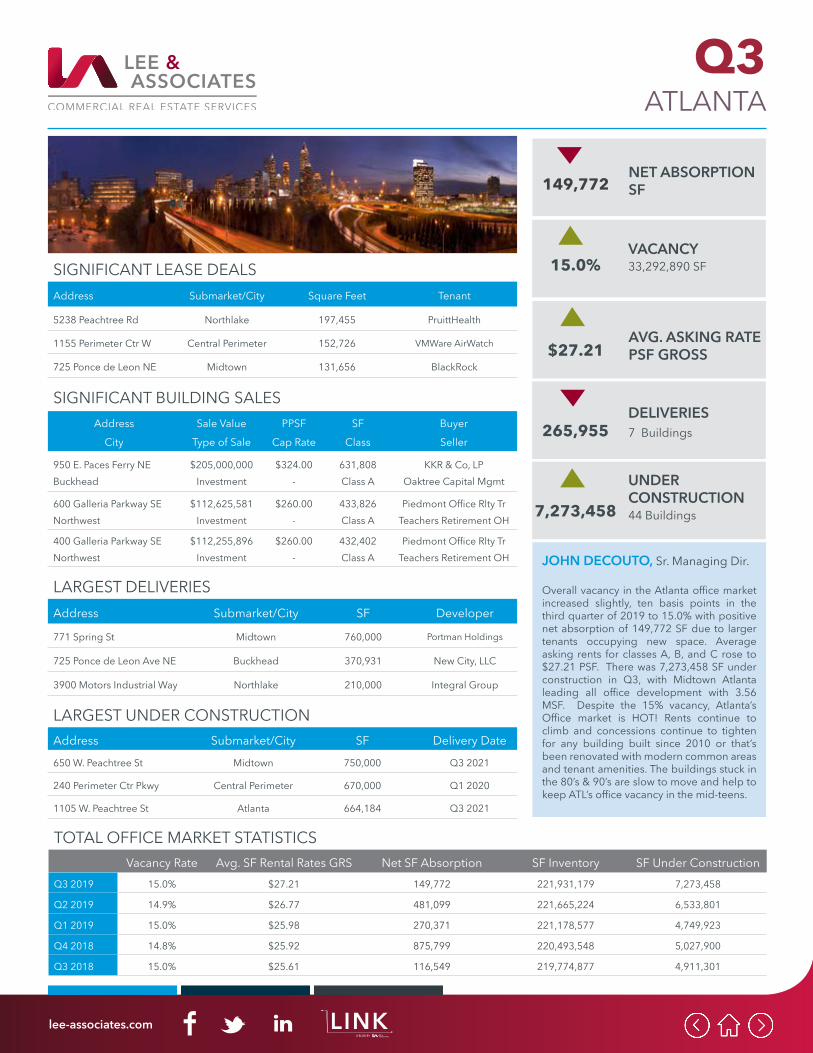
Q3
TOTAL OFFICE MARKET STATISTICSVacancy Rate Avg. SF Rental Rates GRS Net SF Absorption SF Inventory SF Under Construction
Q3 2019 15.0% $27.21 149,772 221,931,179 7,273,458
Q2 2019 14.9% $26.77 481,099 221,665,224 6,533,801
Q1 2019 15.0% $25.98 270,371 221,178,577 4,749,923
Q4 2018 14.8% $25.92 875,799 220,493,548 5,027,900
Q3 2018 15.0% $25.61 116,549 219,774,877 4,911,301
ATLANTA
LARGEST DELIVERIESAddress Submarket/City SF Developer
771 Spring St Midtown 760,000 Portman Holdings
725 Ponce de Leon Ave NE Buckhead 370,931 New City, LLC
3900 Motors Industrial Way Northlake 210,000 Integral Group
LARGEST UNDER CONSTRUCTIONAddress Submarket/City SF Delivery Date
650 W. Peachtree St Midtown 750,000 Q3 2021
240 Perimeter Ctr Pkwy Central Perimeter 670,000 Q1 2020
1105 W. Peachtree St Atlanta 664,184 Q3 2021
JOHN DECOUTO, Sr. Managing Dir.
Overall vacancy in the Atlanta office market increased slightly, ten basis points in the third quarter of 2019 to 15.0% with positive net absorption of 149,772 SF due to larger tenants occupying new space. Average asking rents for classes A, B, and C rose to $27.21 PSF. There was 7,273,458 SF under construction in Q3, with Midtown Atlanta leading all office development with 3.56 MSF. Despite the 15% vacancy, Atlanta’s Office market is HOT! Rents continue to climb and concessions continue to tighten for any building built since 2010 or that’s been renovated with modern common areas and tenant amenities. The buildings stuck in the 80’s & 90’s are slow to move and help to keep ATL’s office vacancy in the mid-teens.
SIGNIFICANT BUILDING SALESAddress
CitySale Value
Type of SalePPSF
Cap RateSF
ClassBuyerSeller
950 E. Paces Ferry NEBuckhead
$205,000,000Investment
$324.00-
631,808Class A
KKR & Co, LPOaktree Capital Mgmt
600 Galleria Parkway SENorthwest
$112,625,581Investment
$260.00-
433,826Class A
Piedmont Office Rlty TrTeachers Retirement OH
400 Galleria Parkway SENorthwest
$112,255,896Investment
$260.00-
432,402Class A
Piedmont Office Rlty TrTeachers Retirement OH
SIGNIFICANT LEASE DEALSAddress Submarket/City Square Feet Tenant
5238 Peachtree Rd Northlake 197,455 PruittHealth
1155 Perimeter Ctr W Central Perimeter 152,726 VMWare AirWatch
725 Ponce de Leon NE Midtown 131,656 BlackRock
UNDER CONSTRUCTION44 Buildings7,273,458
VACANCY33,292,890 SF15.0%
NET ABSORPTION SF149,772
AVG. ASKING RATE PSF GROSS$27.21
DELIVERIES7 Buildings265,955
lee-associates.com LINKA BLOG BY
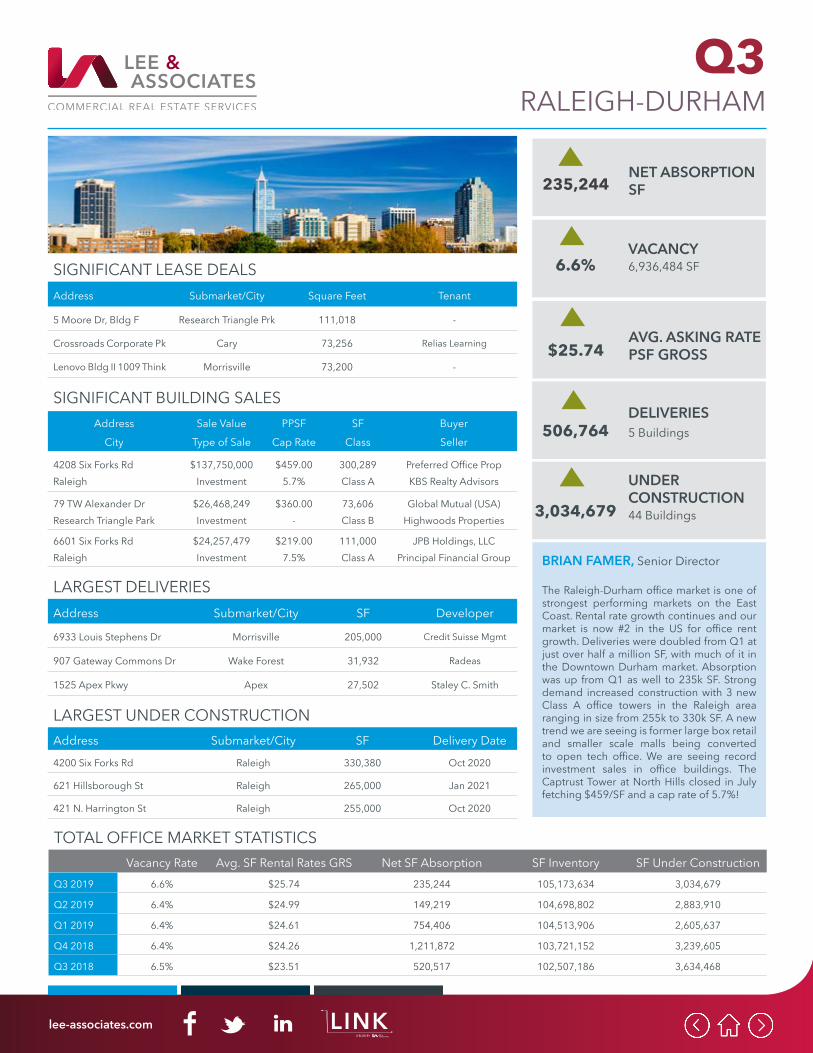
Q3
TOTAL OFFICE MARKET STATISTICSVacancy Rate Avg. SF Rental Rates GRS Net SF Absorption SF Inventory SF Under Construction
Q3 2019 6.6% $25.74 235,244 105,173,634 3,034,679
Q2 2019 6.4% $24.99 149,219 104,698,802 2,883,910
Q1 2019 6.4% $24.61 754,406 104,513,906 2,605,637
Q4 2018 6.4% $24.26 1,211,872 103,721,152 3,239,605
Q3 2018 6.5% $23.51 520,517 102,507,186 3,634,468
RALEIGH-DURHAM
LARGEST DELIVERIESAddress Submarket/City SF Developer
6933 Louis Stephens Dr Morrisville 205,000 Credit Suisse Mgmt
907 Gateway Commons Dr Wake Forest 31,932 Radeas
1525 Apex Pkwy Apex 27,502 Staley C. Smith
LARGEST UNDER CONSTRUCTIONAddress Submarket/City SF Delivery Date
4200 Six Forks Rd Raleigh 330,380 Oct 2020
621 Hillsborough St Raleigh 265,000 Jan 2021
421 N. Harrington St Raleigh 255,000 Oct 2020
BRIAN FAMER, Senior Director
The Raleigh-Durham office market is one of strongest performing markets on the East Coast. Rental rate growth continues and our market is now #2 in the US for office rent growth. Deliveries were doubled from Q1 at just over half a million SF, with much of it in the Downtown Durham market. Absorption was up from Q1 as well to 235k SF. Strong demand increased construction with 3 new Class A office towers in the Raleigh area ranging in size from 255k to 330k SF. A new trend we are seeing is former large box retail and smaller scale malls being converted to open tech office. We are seeing record investment sales in office buildings. The Captrust Tower at North Hills closed in July fetching $459/SF and a cap rate of 5.7%!
SIGNIFICANT BUILDING SALESAddress
CitySale Value
Type of SalePPSF
Cap RateSF
ClassBuyerSeller
4208 Six Forks RdRaleigh
$137,750,000Investment
$459.005.7%
300,289Class A
Preferred Office PropKBS Realty Advisors
79 TW Alexander DrResearch Triangle Park
$26,468,249Investment
$360.00-
73,606Class B
Global Mutual (USA)Highwoods Properties
6601 Six Forks RdRaleigh
$24,257,479Investment
$219.007.5%
111,000Class A
JPB Holdings, LLCPrincipal Financial Group
SIGNIFICANT LEASE DEALSAddress Submarket/City Square Feet Tenant
5 Moore Dr, Bldg F Research Triangle Prk 111,018 -
Crossroads Corporate Pk Cary 73,256 Relias Learning
Lenovo Bldg II 1009 Think Morrisville 73,200 -
UNDER CONSTRUCTION44 Buildings3,034,679
VACANCY6,936,484 SF6.6%
NET ABSORPTION SF235,244
AVG. ASKING RATE PSF GROSS$25.74
DELIVERIES5 Buildings506,764
lee-associates.com LINKA BLOG BY

Q3
TOTAL OFFICE MARKET STATISTICSVacancy Rate Avg. SF Rental Rates GRS Net SF Absorption SF Inventory SF Under Construction
Q3 2019 6.2% $26.70 118,070 31,000,000 845,000
Q2 2019 5.9% $26.78 (209,960) 30,800,000 867,000
Q1 2019 5.0% $26.59 246,606 30,700,000 841,000
Q4 2018 5.5% $26.45 97,402 30,600,000 770,000
Q3 2018 5.2% $26.46 (57,807) 30,400,000 819,000
CHARLESTON
LARGEST DELIVERIESAddress Submarket/City SF Developer
75 Port City Landing Mount Pleasant 125,000 Holder Properties
2165 Hospital Dr Mount Pleasant 75,000 MBRE
1859 Summerville Ave Charlestono 42,416 RCB
LARGEST UNDER CONSTRUCTIONAddress Submarket/City SF Delivery Date
22 Westedge St Charleston 154,998 Dec. 2019
Meetin St @ Alonquin Rd Charleston 110,000 Jul 2020
4920 O’Hear Ave North Charleston 110,000 Jan. 2021
PETE HARPER, CCIM, Principal
Charleston’s strong office sector continued in the third quarter. This is largely due to population and job growth in the Lowcountry. The continued port deepening and capital investments made by major manufacturers both national and international have been a boon to the economy. Tech-related firms relocating to Charleston have contributed greatly bringing overall vacancies down to 6.2%. The market hit a high point in 2018 when annual rents gained more than 3%. Roughly 900,000 SF in deliveries were met with strong absorption and sales volumes hit an all-time high.
SIGNIFICANT BUILDING SALESAddress
CitySale Value
Type of SalePPSF
Cap RateSF
ClassBuyerSeller
8084 Rivers AveNorth Charleston
$2,781,031Owner/User
$140.00-
19,934Class B
Origins8084 Rivers Avenue
221 St. Phillips StCharleston
$1,900,000Investment
$451.00-
4,200Class B
--
82 Cannon StCharleston
$1,900,000Investment
$1,468-
1,294Class C
--
SIGNIFICANT LEASE DEALSAddress Submarket/City Square Feet Tenant
4401 Leeds Ave North Charleston 18,174 Pulte Homes
235 Magrath Darby Mount Pleasant 7,382 USI Insurance
498 Wando Park Blvd Mount Pleasant 6,655 Jear Logistics
UNDER CONSTRUCTION20 Buildings845,000
VACANCY192,200 SF6.2%
NET ABSORPTION SF118,070
AVG. ASKING RATE PSF GROSS$26.70
DELIVERIES9 Buildings202,856
lee-associates.com LINKA BLOG BY
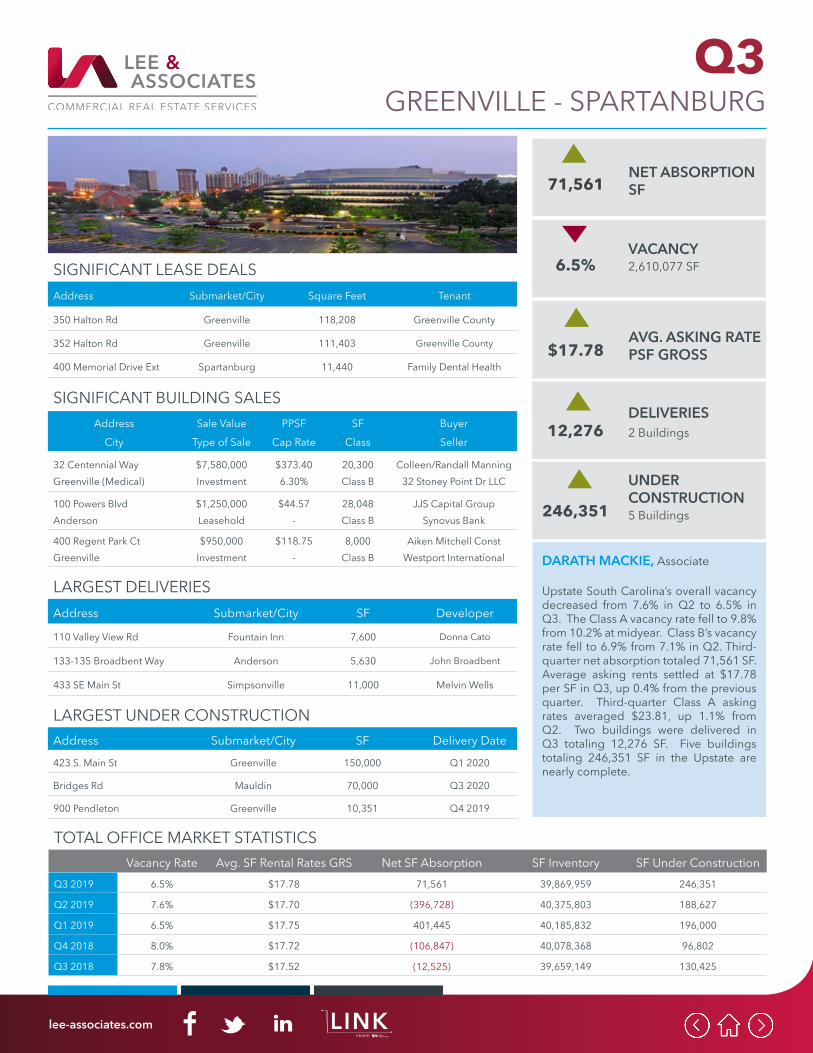
Q3
TOTAL OFFICE MARKET STATISTICSVacancy Rate Avg. SF Rental Rates GRS Net SF Absorption SF Inventory SF Under Construction
Q3 2019 6.5% $17.78 71,561 39,869,959 246,351
Q2 2019 7.6% $17.70 (396,728) 40,375,803 188,627
Q1 2019 6.5% $17.75 401,445 40,185,832 196,000
Q4 2018 8.0% $17.72 (106,847) 40,078,368 96,802
Q3 2018 7.8% $17.52 (12,525) 39,659,149 130,425
GREENVILLE - SPARTANBURG
LARGEST DELIVERIESAddress Submarket/City SF Developer
110 Valley View Rd Fountain Inn 7,600 Donna Cato
133-135 Broadbent Way Anderson 5,630 John Broadbent
433 SE Main St Simpsonville 11,000 Melvin Wells
LARGEST UNDER CONSTRUCTIONAddress Submarket/City SF Delivery Date
423 S. Main St Greenville 150,000 Q1 2020
Bridges Rd Mauldin 70,000 Q3 2020
900 Pendleton Greenville 10,351 Q4 2019
DARATH MACKIE, Associate
Upstate South Carolina’s overall vacancy decreased from 7.6% in Q2 to 6.5% in Q3. The Class A vacancy rate fell to 9.8% from 10.2% at midyear. Class B’s vacancy rate fell to 6.9% from 7.1% in Q2. Third-quarter net absorption totaled 71,561 SF. Average asking rents settled at $17.78 per SF in Q3, up 0.4% from the previous quarter. Third-quarter Class A asking rates averaged $23.81, up 1.1% from Q2. Two buildings were delivered in Q3 totaling 12,276 SF. Five buildings totaling 246,351 SF in the Upstate are nearly complete.
SIGNIFICANT BUILDING SALESAddress
CitySale Value
Type of SalePPSF
Cap RateSF
ClassBuyerSeller
32 Centennial WayGreenville (Medical)
$7,580,000Investment
$373.406.30%
20,300Class B
Colleen/Randall Manning32 Stoney Point Dr LLC
100 Powers BlvdAnderson
$1,250,000Leasehold
$44.57-
28,048Class B
JJS Capital GroupSynovus Bank
400 Regent Park CtGreenville
$950,000Investment
$118.75-
8,000Class B
Aiken Mitchell ConstWestport International
SIGNIFICANT LEASE DEALSAddress Submarket/City Square Feet Tenant
350 Halton Rd Greenville 118,208 Greenville County
352 Halton Rd Greenville 111,403 Greenville County
400 Memorial Drive Ext Spartanburg 11,440 Family Dental Health
UNDER CONSTRUCTION5 Buildings246,351
VACANCY2,610,077 SF6.5%
NET ABSORPTION SF71,561
AVG. ASKING RATE PSF GROSS$17.78
DELIVERIES2 Buildings12,276
lee-associates.com LINKA BLOG BY

Q3
TOTAL OFFICE MARKET STATISTICSVacancy Rate Avg. SF Rental Rates Net Net SF Absorption SF Inventory SF Under Construction
Q3 2019 4.6% $27.29 23,249 60,069,311 5,662,374
Q2 2019 4.4% $27.53 109,944 59,861,751 5,469,913
Q1 2019 5.0% $28.47 (268,992) 59,746,492 3,764,876
Q4 2018 6.2% $27.08 889,529 57,648,673 3,250,030
Q3 2018 6.2% $26.11 287,531 57,231,588 3,452,223
METRO VANCOUVER
LARGEST DELIVERIESAddress Submarket/City SF Developer
285 W. 5th Ave Vancouver 47,000 PC Urban
- - - -
- - - -
LARGEST UNDER CONSTRUCTIONAddress Submarket/City SF Delivery Date
349 W George St “The Post” Vancouver 1,100,000 2023
1133 Melville St “The Stack” Vancouver 540,000 2022
1090 W Pender St “B6” Vancouver 525,656 2023
JASON MARRIOTT, Vice President
All-time high rents and record low vacancy dampens deal velocity. A wait-and-see approach starts to take hold particularly in major investment sales in the lead-up to Canada’s Oct. 21 federal election. Value-driven Downtown tenants are relocating to the Suburbs for significant savings. Meanwhile, recent editions have commented on WeWork’s growth in Vancouver and their planned presence of nearly 700,000 SF in nine locations. But heightening investor and media scrutiny of its finances and leadership threatens their expansion plans. This could cause some chaos in the world of office space – not the disruption WeWork sought to create.
SIGNIFICANT BUILDING SALESAddress
CitySale Value
Type of SalePPSF
Cap RateSF
ClassBuyerSeller
5890-5900 No. 3 RdRichmond
$28,500,000Market
$477.00-
59,714Class A
Dava DevelopmentsNorenger Development
101 Smithe StDowntown Vancouver
$27,375,000Market
$913.00-
30,000Class B
Private Canadian InvestorLaSalle International
435 Columbia St
New Westminster$15,050,000Share Sale
$330.005.0%
45,617Class C
Grosvenor CanadaBovcher Institute
SIGNIFICANT LEASE DEALSAddress Submarket/City Square Feet Tenant
3777 Kingsway Burnaby 26,000 Rise People
1028 Hamilton St Vancouver 22,000 Tech Resources, Ltd
- - - -
UNDER CONSTRUCTION37 Buildings5,662,374
VACANCY2,750,542 SF4.6%
NET ABSORPTION SF23,249
AVG. ASKING RATE PSF NET$27.29
DELIVERIES1 Building 47,000
lee-associates.com LINKA BLOG BY
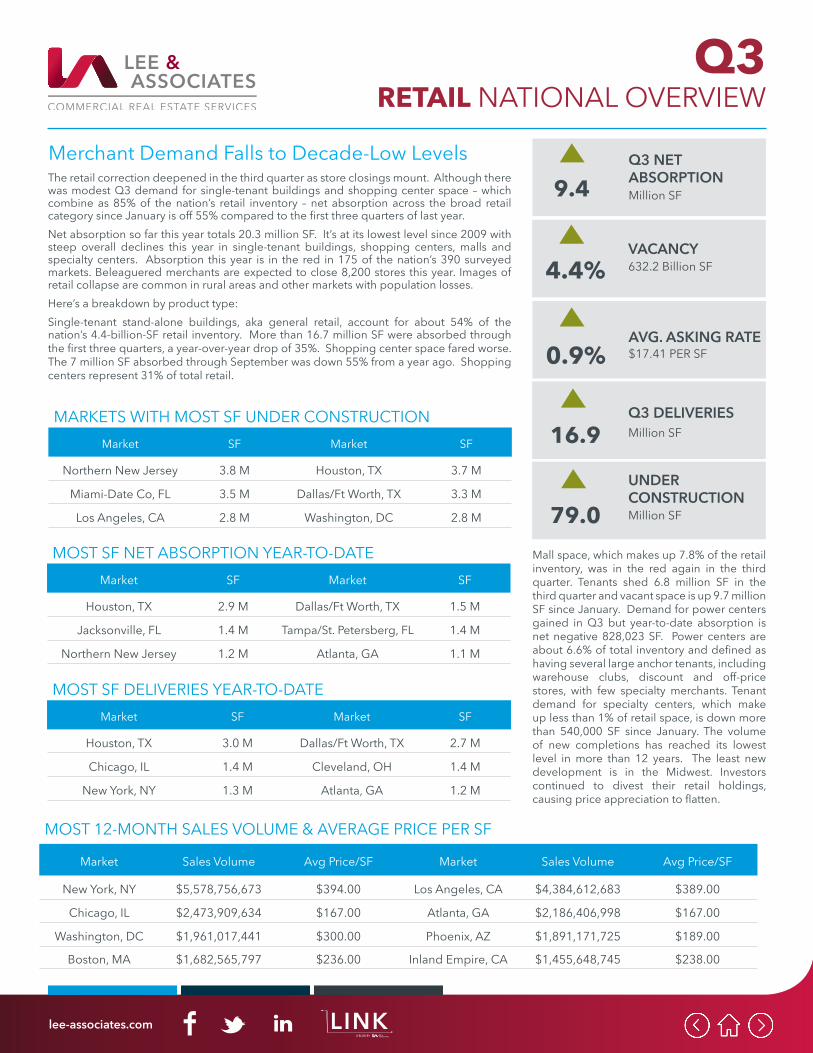
Q3RETAIL NATIONAL OVERVIEW
MOST 12-MONTH SALES VOLUME & AVERAGE PRICE PER SF
Market Sales Volume Avg Price/SF Market Sales Volume Avg Price/SF
New York, NY $5,578,756,673 $394.00 Los Angeles, CA $4,384,612,683 $389.00
Chicago, IL $2,473,909,634 $167.00 Atlanta, GA $2,186,406,998 $167.00
Washington, DC $1,961,017,441 $300.00 Phoenix, AZ $1,891,171,725 $189.00
Boston, MA $1,682,565,797 $236.00 Inland Empire, CA $1,455,648,745 $238.00
The retail correction deepened in the third quarter as store closings mount. Although there was modest Q3 demand for single-tenant buildings and shopping center space – which combine as 85% of the nation’s retail inventory – net absorption across the broad retail category since January is off 55% compared to the first three quarters of last year.Net absorption so far this year totals 20.3 million SF. It’s at its lowest level since 2009 with steep overall declines this year in single-tenant buildings, shopping centers, malls and specialty centers. Absorption this year is in the red in 175 of the nation’s 390 surveyed markets. Beleaguered merchants are expected to close 8,200 stores this year. Images of retail collapse are common in rural areas and other markets with population losses. Here’s a breakdown by product type:Single-tenant stand-alone buildings, aka general retail, account for about 54% of the nation’s 4.4-billion-SF retail inventory. More than 16.7 million SF were absorbed through the first three quarters, a year-over-year drop of 35%. Shopping center space fared worse. The 7 million SF absorbed through September was down 55% from a year ago. Shopping centers represent 31% of total retail.
UNDER CONSTRUCTIONMillion SF79.0
VACANCY632.2 Billion SF4.4%
Q3 NET ABSORPTIONMillion SF 9.4
AVG. ASKING RATE$17.41 PER SF0.9%
Q3 DELIVERIESMillion SF 16.9
Merchant Demand Falls to Decade-Low Levels
Mall space, which makes up 7.8% of the retail inventory, was in the red again in the third quarter. Tenants shed 6.8 million SF in the third quarter and vacant space is up 9.7 million SF since January. Demand for power centers gained in Q3 but year-to-date absorption is net negative 828,023 SF. Power centers are about 6.6% of total inventory and defined as having several large anchor tenants, including warehouse clubs, discount and off-price stores, with few specialty merchants. Tenant demand for specialty centers, which make up less than 1% of retail space, is down more than 540,000 SF since January. The volume of new completions has reached its lowest level in more than 12 years. The least new development is in the Midwest. Investors continued to divest their retail holdings, causing price appreciation to flatten.
MARKETS WITH MOST SF UNDER CONSTRUCTIONMarket SF Market SF
Northern New Jersey 3.8 M Houston, TX 3.7 M
Miami-Date Co, FL 3.5 M Dallas/Ft Worth, TX 3.3 M
Los Angeles, CA 2.8 M Washington, DC 2.8 M
MOST SF NET ABSORPTION YEAR-TO-DATEMarket SF Market SF
Houston, TX 2.9 M Dallas/Ft Worth, TX 1.5 M
Jacksonville, FL 1.4 M Tampa/St. Petersberg, FL 1.4 M
Northern New Jersey 1.2 M Atlanta, GA 1.1 M
MOST SF DELIVERIES YEAR-TO-DATEMarket SF Market SF
Houston, TX 3.0 M Dallas/Ft Worth, TX 2.7 M
Chicago, IL 1.4 M Cleveland, OH 1.4 M
New York, NY 1.3 M Atlanta, GA 1.2 M
lee-associates.com LINKA BLOG BY
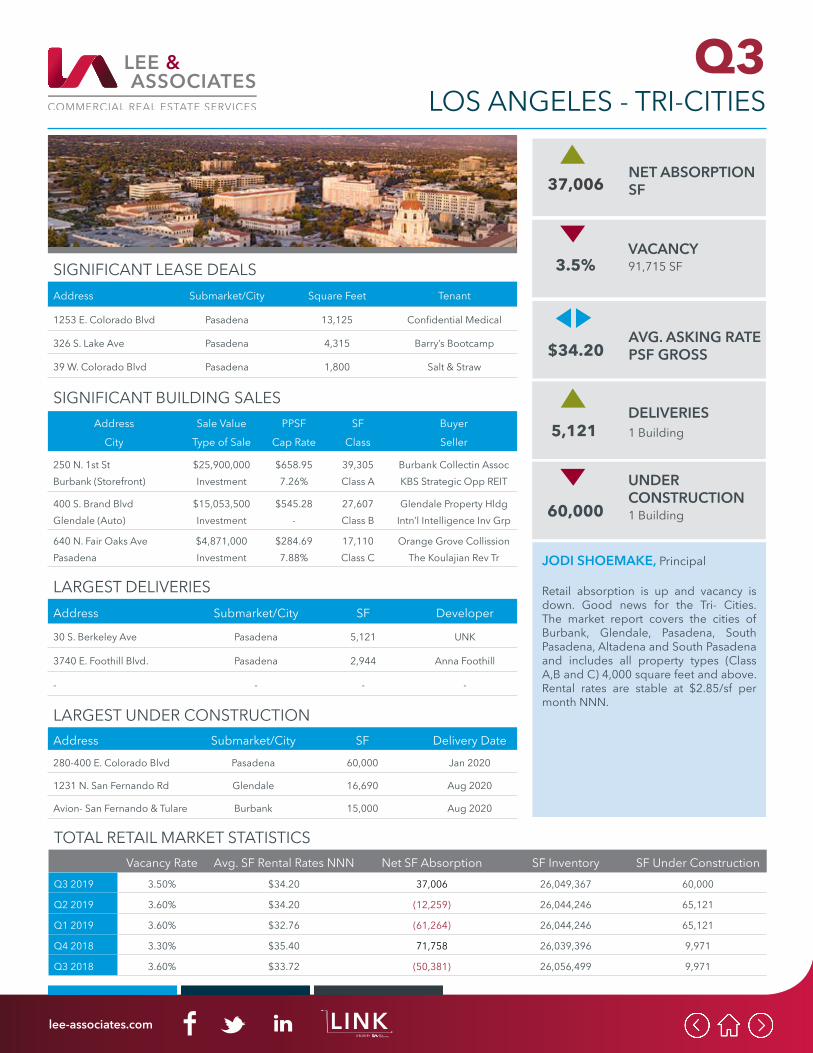
Q3
TOTAL RETAIL MARKET STATISTICSVacancy Rate Avg. SF Rental Rates NNN Net SF Absorption SF Inventory SF Under Construction
Q3 2019 3.50% $34.20 37,006 26,049,367 60,000
Q2 2019 3.60% $34.20 (12,259) 26,044,246 65,121
Q1 2019 3.60% $32.76 (61,264) 26,044,246 65,121
Q4 2018 3.30% $35.40 71,758 26,039,396 9,971
Q3 2018 3.60% $33.72 (50,381) 26,056,499 9,971
LOS ANGELES - TRI-CITIES
LARGEST DELIVERIESAddress Submarket/City SF Developer
30 S. Berkeley Ave Pasadena 5,121 UNK
3740 E. Foothill Blvd. Pasadena 2,944 Anna Foothill
- - - -
LARGEST UNDER CONSTRUCTIONAddress Submarket/City SF Delivery Date
280-400 E. Colorado Blvd Pasadena 60,000 Jan 2020
1231 N. San Fernando Rd Glendale 16,690 Aug 2020
Avion- San Fernando & Tulare Burbank 15,000 Aug 2020
JODI SHOEMAKE, Principal
Retail absorption is up and vacancy is down. Good news for the Tri- Cities.The market report covers the cities of Burbank, Glendale, Pasadena, South Pasadena, Altadena and South Pasadena and includes all property types (Class A,B and C) 4,000 square feet and above. Rental rates are stable at $2.85/sf per month NNN.
SIGNIFICANT BUILDING SALESAddress
CitySale Value
Type of SalePPSF
Cap RateSF
ClassBuyerSeller
250 N. 1st StBurbank (Storefront)
$25,900,000Investment
$658.957.26%
39,305Class A
Burbank Collectin AssocKBS Strategic Opp REIT
400 S. Brand BlvdGlendale (Auto)
$15,053,500Investment
$545.28-
27,607Class B
Glendale Property HldgIntn’l Intelligence Inv Grp
640 N. Fair Oaks AvePasadena
$4,871,000Investment
$284.697.88%
17,110Class C
Orange Grove CollissionThe Koulajian Rev Tr
SIGNIFICANT LEASE DEALSAddress Submarket/City Square Feet Tenant
1253 E. Colorado Blvd Pasadena 13,125 Confidential Medical
326 S. Lake Ave Pasadena 4,315 Barry’s Bootcamp
39 W. Colorado Blvd Pasadena 1,800 Salt & Straw
UNDER CONSTRUCTION1 Building60,000
VACANCY91,715 SF3.5%
NET ABSORPTION SF37,006
AVG. ASKING RATE PSF GROSS$34.20
DELIVERIES1 Building5,121
lee-associates.com LINKA BLOG BY
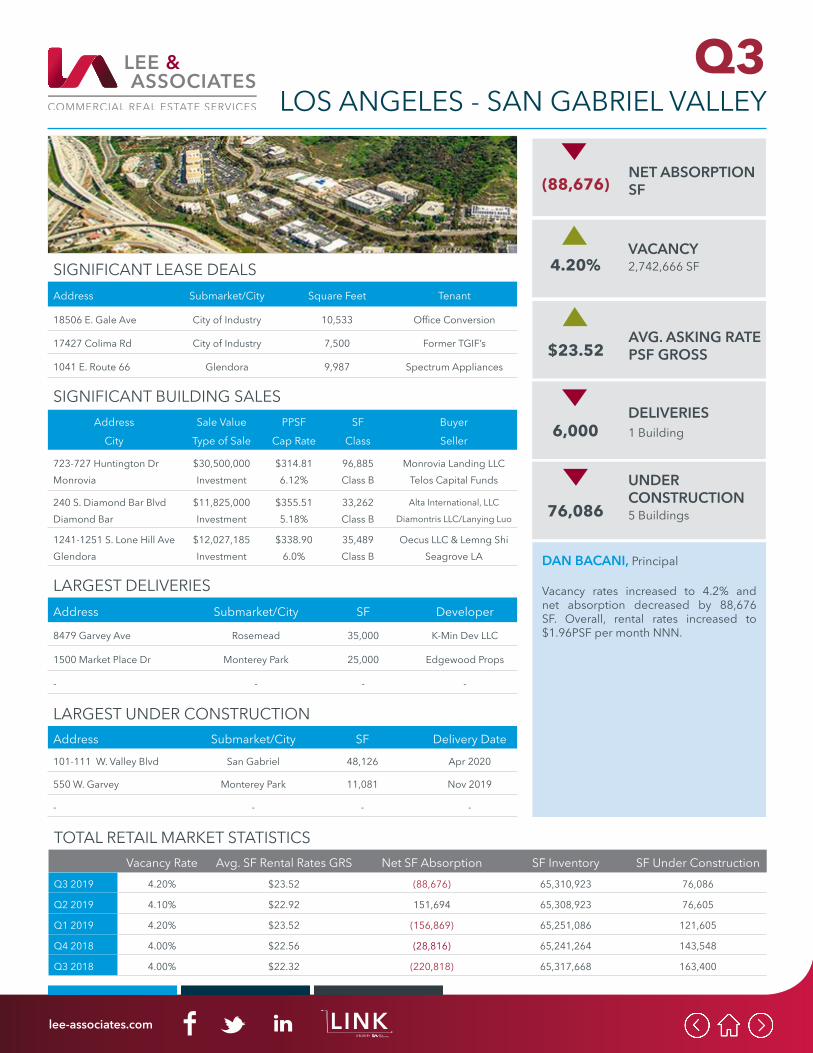
Q3
TOTAL RETAIL MARKET STATISTICSVacancy Rate Avg. SF Rental Rates GRS Net SF Absorption SF Inventory SF Under Construction
Q3 2019 4.20% $23.52 (88,676) 65,310,923 76,086
Q2 2019 4.10% $22.92 151,694 65,308,923 76,605
Q1 2019 4.20% $23.52 (156,869) 65,251,086 121,605
Q4 2018 4.00% $22.56 (28,816) 65,241,264 143,548
Q3 2018 4.00% $22.32 (220,818) 65,317,668 163,400
LOS ANGELES - SAN GABRIEL VALLEY
LARGEST DELIVERIESAddress Submarket/City SF Developer
8479 Garvey Ave Rosemead 35,000 K-Min Dev LLC
1500 Market Place Dr Monterey Park 25,000 Edgewood Props
- - - -
LARGEST UNDER CONSTRUCTIONAddress Submarket/City SF Delivery Date
101-111 W. Valley Blvd San Gabriel 48,126 Apr 2020
550 W. Garvey Monterey Park 11,081 Nov 2019
- - - -
DAN BACANI, Principal
Vacancy rates increased to 4.2% and net absorption decreased by 88,676 SF. Overall, rental rates increased to $1.96PSF per month NNN.
SIGNIFICANT BUILDING SALESAddress
CitySale Value
Type of SalePPSF
Cap RateSF
ClassBuyerSeller
723-727 Huntington DrMonrovia
$30,500,000Investment
$314.816.12%
96,885Class B
Monrovia Landing LLCTelos Capital Funds
240 S. Diamond Bar BlvdDiamond Bar
$11,825,000Investment
$355.515.18%
33,262Class B
Alta International, LLC
Diamontris LLC/Lanying Luo
1241-1251 S. Lone Hill AveGlendora
$12,027,185Investment
$338.906.0%
35,489Class B
Oecus LLC & Lemng ShiSeagrove LA
SIGNIFICANT LEASE DEALSAddress Submarket/City Square Feet Tenant
18506 E. Gale Ave City of Industry 10,533 Office Conversion
17427 Colima Rd City of Industry 7,500 Former TGIF’s
1041 E. Route 66 Glendora 9,987 Spectrum Appliances
UNDER CONSTRUCTION5 Buildings76,086
VACANCY2,742,666 SF4.20%
NET ABSORPTION SF(88,676)
AVG. ASKING RATE PSF GROSS$23.52
DELIVERIES1 Building6,000
lee-associates.com LINKA BLOG BY
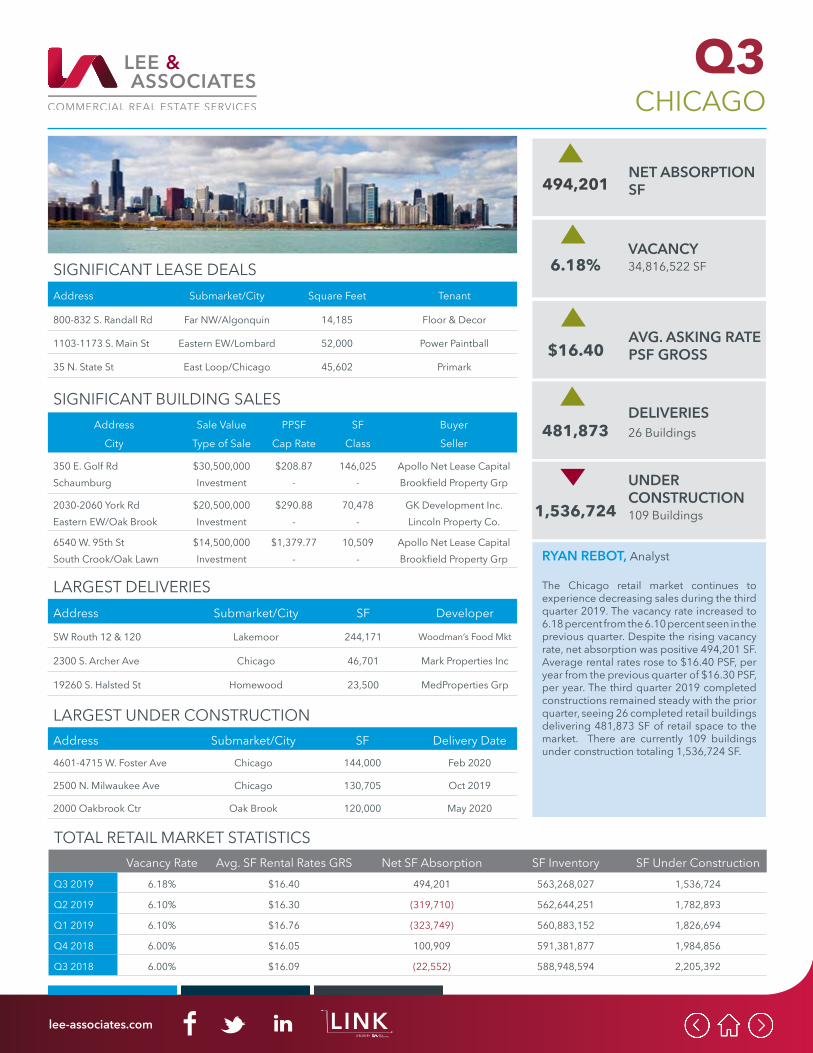
Q3
TOTAL RETAIL MARKET STATISTICSVacancy Rate Avg. SF Rental Rates GRS Net SF Absorption SF Inventory SF Under Construction
Q3 2019 6.18% $16.40 494,201 563,268,027 1,536,724
Q2 2019 6.10% $16.30 (319,710) 562,644,251 1,782,893
Q1 2019 6.10% $16.76 (323,749) 560,883,152 1,826,694
Q4 2018 6.00% $16.05 100,909 591,381,877 1,984,856
Q3 2018 6.00% $16.09 (22,552) 588,948,594 2,205,392
CHICAGO
LARGEST DELIVERIESAddress Submarket/City SF Developer
SW Routh 12 & 120 Lakemoor 244,171 Woodman’s Food Mkt
2300 S. Archer Ave Chicago 46,701 Mark Properties Inc
19260 S. Halsted St Homewood 23,500 MedProperties Grp
LARGEST UNDER CONSTRUCTIONAddress Submarket/City SF Delivery Date
4601-4715 W. Foster Ave Chicago 144,000 Feb 2020
2500 N. Milwaukee Ave Chicago 130,705 Oct 2019
2000 Oakbrook Ctr Oak Brook 120,000 May 2020
RYAN REBOT, Analyst
The Chicago retail market continues to experience decreasing sales during the third quarter 2019. The vacancy rate increased to 6.18 percent from the 6.10 percent seen in the previous quarter. Despite the rising vacancy rate, net absorption was positive 494,201 SF. Average rental rates rose to $16.40 PSF, per year from the previous quarter of $16.30 PSF, per year. The third quarter 2019 completed constructions remained steady with the prior quarter, seeing 26 completed retail buildings delivering 481,873 SF of retail space to the market. There are currently 109 buildings under construction totaling 1,536,724 SF.
SIGNIFICANT BUILDING SALESAddress
CitySale Value
Type of SalePPSF
Cap RateSF
ClassBuyerSeller
350 E. Golf RdSchaumburg
$30,500,000Investment
$208.87-
146,025-
Apollo Net Lease CapitalBrookfield Property Grp
2030-2060 York RdEastern EW/Oak Brook
$20,500,000Investment
$290.88-
70,478-
GK Development Inc.Lincoln Property Co.
6540 W. 95th StSouth Crook/Oak Lawn
$14,500,000Investment
$1,379.77-
10,509-
Apollo Net Lease CapitalBrookfield Property Grp
SIGNIFICANT LEASE DEALSAddress Submarket/City Square Feet Tenant
800-832 S. Randall Rd Far NW/Algonquin 14,185 Floor & Decor
1103-1173 S. Main St Eastern EW/Lombard 52,000 Power Paintball
35 N. State St East Loop/Chicago 45,602 Primark
UNDER CONSTRUCTION109 Buildings1,536,724
VACANCY34,816,522 SF6.18%
NET ABSORPTION SF494,201
AVG. ASKING RATE PSF GROSS$16.40
DELIVERIES26 Buildings481,873
lee-associates.com LINKA BLOG BY
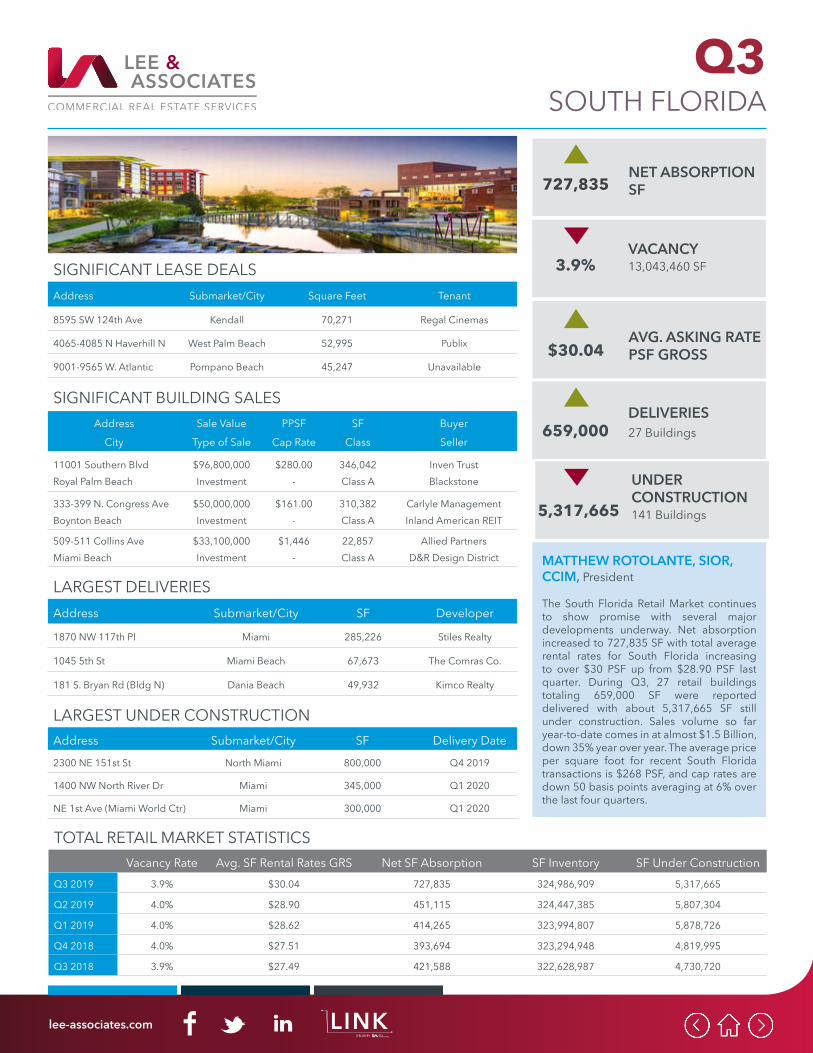
Q3
TOTAL RETAIL MARKET STATISTICSVacancy Rate Avg. SF Rental Rates GRS Net SF Absorption SF Inventory SF Under Construction
Q3 2019 3.9% $30.04 727,835 324,986,909 5,317,665
Q2 2019 4.0% $28.90 451,115 324,447,385 5,807,304
Q1 2019 4.0% $28.62 414,265 323,994,807 5,878,726
Q4 2018 4.0% $27.51 393,694 323,294,948 4,819,995
Q3 2018 3.9% $27.49 421,588 322,628,987 4,730,720
SOUTH FLORIDA
LARGEST DELIVERIESAddress Submarket/City SF Developer
1870 NW 117th Pl Miami 285,226 Stiles Realty
1045 5th St Miami Beach 67,673 The Comras Co.
181 S. Bryan Rd (Bldg N) Dania Beach 49,932 Kimco Realty
LARGEST UNDER CONSTRUCTIONAddress Submarket/City SF Delivery Date
2300 NE 151st St North Miami 800,000 Q4 2019
1400 NW North River Dr Miami 345,000 Q1 2020
NE 1st Ave (Miami World Ctr) Miami 300,000 Q1 2020
MATTHEW ROTOLANTE, SIOR, CCIM, President
The South Florida Retail Market continues to show promise with several major developments underway. Net absorption increased to 727,835 SF with total average rental rates for South Florida increasing to over $30 PSF up from $28.90 PSF last quarter. During Q3, 27 retail buildings totaling 659,000 SF were reported delivered with about 5,317,665 SF still under construction. Sales volume so far year-to-date comes in at almost $1.5 Billion, down 35% year over year. The average price per square foot for recent South Florida transactions is $268 PSF, and cap rates are down 50 basis points averaging at 6% over the last four quarters.
SIGNIFICANT BUILDING SALESAddress
CitySale Value
Type of SalePPSF
Cap RateSF
ClassBuyerSeller
11001 Southern BlvdRoyal Palm Beach
$96,800,000Investment
$280.00-
346,042Class A
Inven TrustBlackstone
333-399 N. Congress AveBoynton Beach
$50,000,000Investment
$161.00-
310,382Class A
Carlyle ManagementInland American REIT
509-511 Collins AveMiami Beach
$33,100,000Investment
$1,446-
22,857Class A
Allied PartnersD&R Design District
SIGNIFICANT LEASE DEALSAddress Submarket/City Square Feet Tenant
8595 SW 124th Ave Kendall 70,271 Regal Cinemas
4065-4085 N Haverhill N West Palm Beach 52,995 Publix
9001-9565 W. Atlantic Pompano Beach 45,247 Unavailable
UNDER CONSTRUCTION141 Buildings5,317,665
VACANCY13,043,460 SF3.9%
NET ABSORPTION SF727,835
AVG. ASKING RATE PSF GROSS$30.04
DELIVERIES27 Buildings659,000
lee-associates.com LINKA BLOG BY
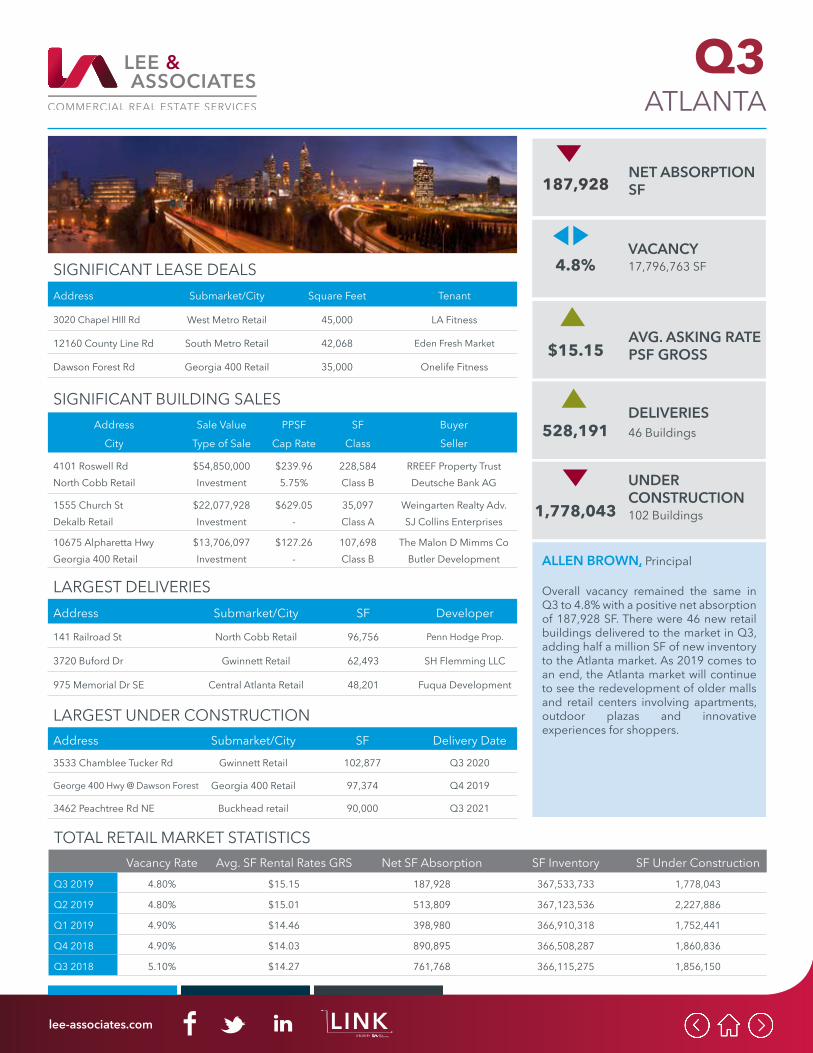
Q3
TOTAL RETAIL MARKET STATISTICSVacancy Rate Avg. SF Rental Rates GRS Net SF Absorption SF Inventory SF Under Construction
Q3 2019 4.80% $15.15 187,928 367,533,733 1,778,043
Q2 2019 4.80% $15.01 513,809 367,123,536 2,227,886
Q1 2019 4.90% $14.46 398,980 366,910,318 1,752,441
Q4 2018 4.90% $14.03 890,895 366,508,287 1,860,836
Q3 2018 5.10% $14.27 761,768 366,115,275 1,856,150
ATLANTA
LARGEST DELIVERIESAddress Submarket/City SF Developer
141 Railroad St North Cobb Retail 96,756 Penn Hodge Prop.
3720 Buford Dr Gwinnett Retail 62,493 SH Flemming LLC
975 Memorial Dr SE Central Atlanta Retail 48,201 Fuqua Development
LARGEST UNDER CONSTRUCTIONAddress Submarket/City SF Delivery Date
3533 Chamblee Tucker Rd Gwinnett Retail 102,877 Q3 2020
George 400 Hwy @ Dawson Forest Georgia 400 Retail 97,374 Q4 2019
3462 Peachtree Rd NE Buckhead retail 90,000 Q3 2021
ALLEN BROWN, Principal
Overall vacancy remained the same in Q3 to 4.8% with a positive net absorption of 187,928 SF. There were 46 new retail buildings delivered to the market in Q3, adding half a million SF of new inventory to the Atlanta market. As 2019 comes to an end, the Atlanta market will continue to see the redevelopment of older malls and retail centers involving apartments, outdoor plazas and innovative experiences for shoppers.
SIGNIFICANT BUILDING SALESAddress
CitySale Value
Type of SalePPSF
Cap RateSF
ClassBuyerSeller
4101 Roswell RdNorth Cobb Retail
$54,850,000Investment
$239.965.75%
228,584Class B
RREEF Property TrustDeutsche Bank AG
1555 Church StDekalb Retail
$22,077,928Investment
$629.05-
35,097Class A
Weingarten Realty Adv.SJ Collins Enterprises
10675 Alpharetta HwyGeorgia 400 Retail
$13,706,097Investment
$127.26-
107,698Class B
The Malon D Mimms CoButler Development
SIGNIFICANT LEASE DEALSAddress Submarket/City Square Feet Tenant
3020 Chapel HIll Rd West Metro Retail 45,000 LA Fitness
12160 County Line Rd South Metro Retail 42,068 Eden Fresh Market
Dawson Forest Rd Georgia 400 Retail 35,000 Onelife Fitness
UNDER CONSTRUCTION102 Buildings1,778,043
VACANCY17,796,763 SF4.8%
NET ABSORPTION SF187,928
AVG. ASKING RATE PSF GROSS$15.15
DELIVERIES46 Buildings528,191
lee-associates.com LINKA BLOG BY

Q3
TOTAL RETAIL MARKET STATISTICSVacancy Rate Avg. SF Rental Rates GRS Net SF Absorption SF Inventory SF Under Construction
Q3 2019 3.0% $18.58 502,764 100,888,384 1,543,589
Q2 2019 3.3% $18.48 (132,729) 100,689,111 1,861,299
Q1 2019 2.8% $17.35 172,650 100,323,594 1,276,917
Q4 2018 2.8% $17.28 213,995 100,132,826 1,145,013
Q3 2018 2.9% $17.08 (82,475) 99,978,140 1,218,539
RALEIGH-DURHAM
LARGEST DELIVERIESAddress Submarket/City SF Developer
1436 Rock Quarry Rd Raleigh 116,089 YMCA of the Triangle
1200 Wake Towne Dr Raleigh 105,000 Regency Centers
6901 Play Golf Way Raleigh 64,000 Drive Shack Raleigh
LARGEST UNDER CONSTRUCTIONAddress Submarket/City SF Delivery Date
Eastfield I-95 & I-70 Selma 750,000 Jun 2020
Hwy 86 & Eubanks Rd Chapel Hill 119,218 Apr 2020
David Dr & Airport Rd Morrisville 103,000 Nov 2020
HUNTER STEWART, MBA, Broker
The favorable demographics of the Raleigh-Durham retail market continue to attract both national and regional tenants. Average rental rates have consistently climbed, and new construction remained strong with the bulk of consisting of neighborhood centers with grocery stores or other nationally known tenants as anchor tenants. The overall vacancy rate dropped from 3.3% in Q2 to 3.0% in Q3. Just over 1.5M SF is currently under construction with approximately 86% preleased. Trends we’ve observed include demand for retail in areas we’ve traditionally not seen in the past, such as in the growing downtown areas of towns and in Research Triangle Park, following recent residential development.
SIGNIFICANT BUILDING SALESAddress
CitySale Value
Type of SalePPSF
Cap RateSF
ClassBuyerSeller
6911 Carpenter Fire StatnCary
$22,500,000Owner/User
$178.00-
126,233Health Club
YMCA of the TriangleCrosspointe Church
214-220 Hinton Oaks BlvdKnightdale
$15,051,570Investment
$124.009.0%
121,383Shop Ctr
M&J WilkowKimco Realty Corp.
1002-1018 Shoppes @ Midtown, Knightdale
$14,075,936Investment
$101.009.0%
139,462Freestndg
M&J WilkowKimco Realty Corp
SIGNIFICANT LEASE DEALSAddress Submarket/City Square Feet Tenant
1501 N. Salem St Apex 167,000 Crossroads Ford Truck Ct
652-672 N. Churton St Hillsborough 19,973 Check TBJ Space for Name
314-355 N. Madison Blv Roxboro 6,000 Korset Ladies Apparel
UNDER CONSTRUCTION47 Buildings1,543,589
VACANCY929,420 SF3.0%
NET ABSORPTION SF502,764
AVG. ASKING RATE PSF GROSS$18.58
DELIVERIES15 Buildings399,363
lee-associates.com LINKA BLOG BY
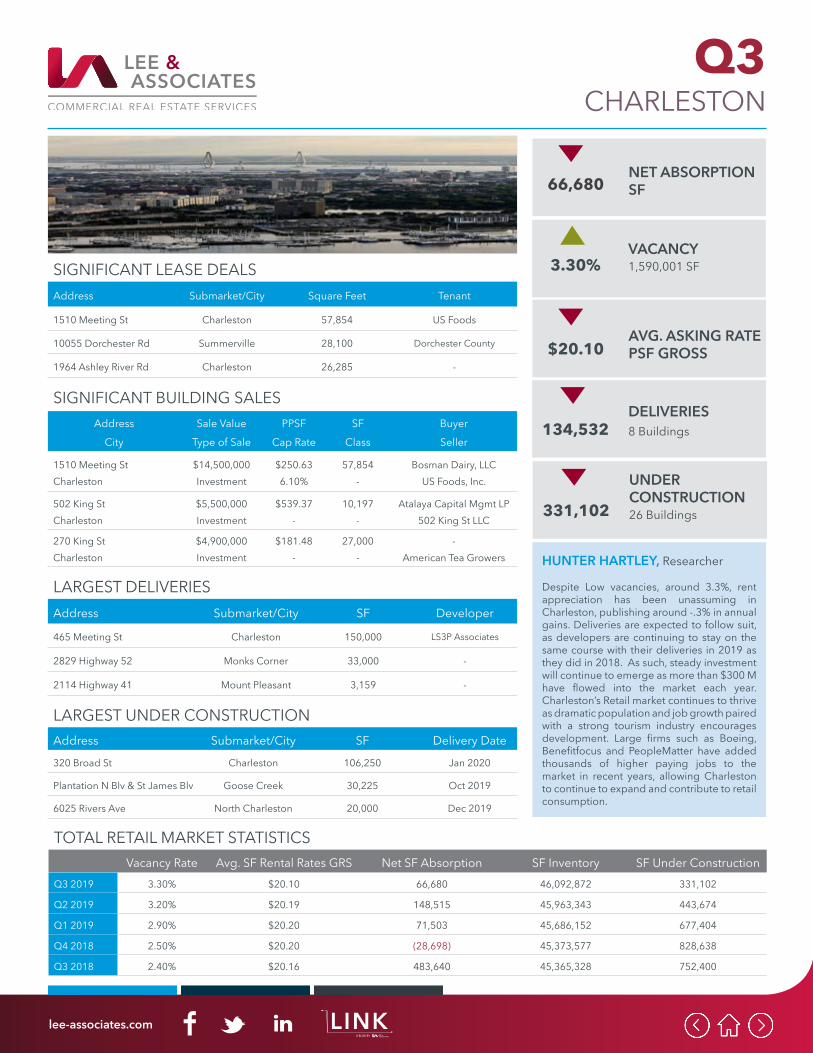
Q3
TOTAL RETAIL MARKET STATISTICSVacancy Rate Avg. SF Rental Rates GRS Net SF Absorption SF Inventory SF Under Construction
Q3 2019 3.30% $20.10 66,680 46,092,872 331,102
Q2 2019 3.20% $20.19 148,515 45,963,343 443,674
Q1 2019 2.90% $20.20 71,503 45,686,152 677,404
Q4 2018 2.50% $20.20 (28,698) 45,373,577 828,638
Q3 2018 2.40% $20.16 483,640 45,365,328 752,400
CHARLESTON
LARGEST DELIVERIESAddress Submarket/City SF Developer
465 Meeting St Charleston 150,000 LS3P Associates
2829 Highway 52 Monks Corner 33,000 -
2114 Highway 41 Mount Pleasant 3,159 -
LARGEST UNDER CONSTRUCTIONAddress Submarket/City SF Delivery Date
320 Broad St Charleston 106,250 Jan 2020
Plantation N Blv & St James Blv Goose Creek 30,225 Oct 2019
6025 Rivers Ave North Charleston 20,000 Dec 2019
HUNTER HARTLEY, Researcher
Despite Low vacancies, around 3.3%, rent appreciation has been unassuming in Charleston, publishing around -.3% in annual gains. Deliveries are expected to follow suit, as developers are continuing to stay on the same course with their deliveries in 2019 as they did in 2018. As such, steady investment will continue to emerge as more than $300 Mhave flowed into the market each year. Charleston’s Retail market continues to thrive as dramatic population and job growth paired with a strong tourism industry encourages development. Large firms such as Boeing, Benefitfocus and PeopleMatter have added thousands of higher paying jobs to the market in recent years, allowing Charleston to continue to expand and contribute to retail consumption.
SIGNIFICANT BUILDING SALESAddress
CitySale Value
Type of SalePPSF
Cap RateSF
ClassBuyerSeller
1510 Meeting StCharleston
$14,500,000Investment
$250.636.10%
57,854-
Bosman Dairy, LLCUS Foods, Inc.
502 King StCharleston
$5,500,000Investment
$539.37-
10,197-
Atalaya Capital Mgmt LP502 King St LLC
270 King StCharleston
$4,900,000Investment
$181.48-
27,000-
-American Tea Growers
SIGNIFICANT LEASE DEALSAddress Submarket/City Square Feet Tenant
1510 Meeting St Charleston 57,854 US Foods
10055 Dorchester Rd Summerville 28,100 Dorchester County
1964 Ashley River Rd Charleston 26,285 -
UNDER CONSTRUCTION26 Buildings331,102
VACANCY1,590,001 SF3.30%
NET ABSORPTION SF66,680
AVG. ASKING RATE PSF GROSS$20.10
DELIVERIES8 Buildings134,532
lee-associates.com LINKA BLOG BY
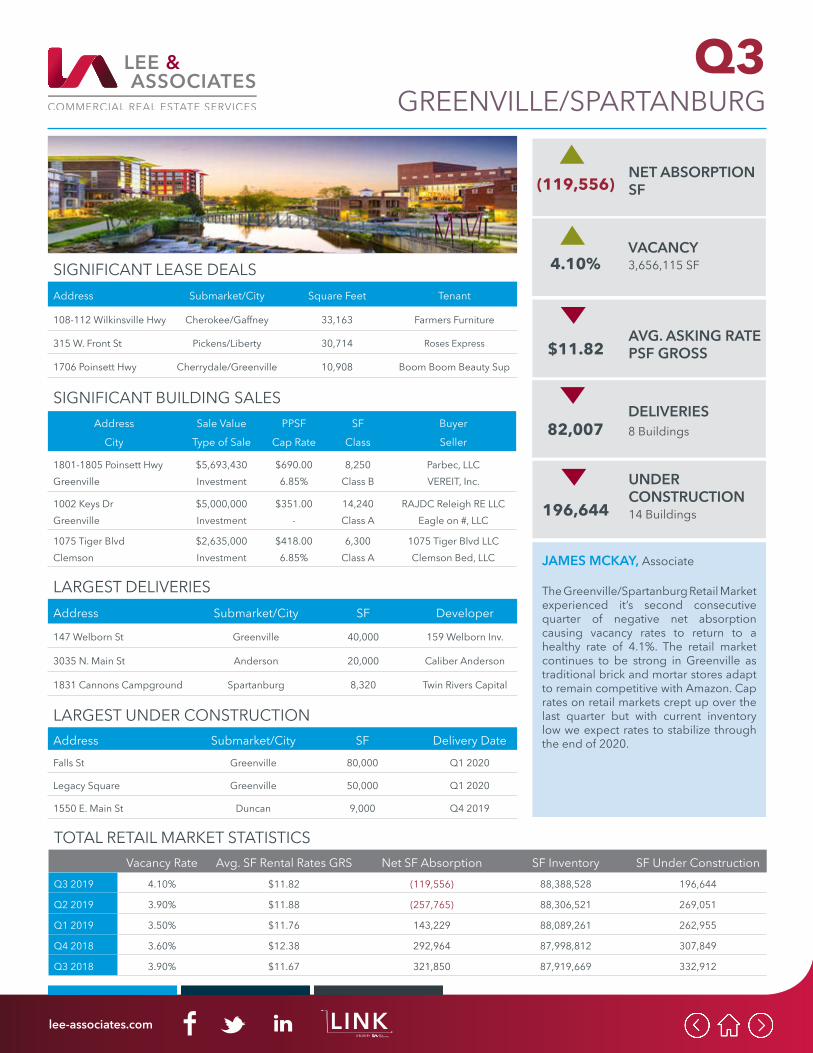
Q3
TOTAL RETAIL MARKET STATISTICSVacancy Rate Avg. SF Rental Rates GRS Net SF Absorption SF Inventory SF Under Construction
Q3 2019 4.10% $11.82 (119,556) 88,388,528 196,644
Q2 2019 3.90% $11.88 (257,765) 88,306,521 269,051
Q1 2019 3.50% $11.76 143,229 88,089,261 262,955
Q4 2018 3.60% $12.38 292,964 87,998,812 307,849
Q3 2018 3.90% $11.67 321,850 87,919,669 332,912
GREENVILLE/SPARTANBURG
LARGEST DELIVERIESAddress Submarket/City SF Developer
147 Welborn St Greenville 40,000 159 Welborn Inv.
3035 N. Main St Anderson 20,000 Caliber Anderson
1831 Cannons Campground Spartanburg 8,320 Twin Rivers Capital
LARGEST UNDER CONSTRUCTIONAddress Submarket/City SF Delivery Date
Falls St Greenville 80,000 Q1 2020
Legacy Square Greenville 50,000 Q1 2020
1550 E. Main St Duncan 9,000 Q4 2019
JAMES MCKAY, Associate
The Greenville/Spartanburg Retail Market experienced it’s second consecutive quarter of negative net absorption causing vacancy rates to return to a healthy rate of 4.1%. The retail market continues to be strong in Greenville as traditional brick and mortar stores adapt to remain competitive with Amazon. Cap rates on retail markets crept up over the last quarter but with current inventory low we expect rates to stabilize through the end of 2020.
SIGNIFICANT BUILDING SALESAddress
CitySale Value
Type of SalePPSF
Cap RateSF
ClassBuyerSeller
1801-1805 Poinsett HwyGreenville
$5,693,430Investment
$690.006.85%
8,250Class B
Parbec, LLCVEREIT, Inc.
1002 Keys DrGreenville
$5,000,000Investment
$351.00-
14,240Class A
RAJDC Releigh RE LLCEagle on #, LLC
1075 Tiger BlvdClemson
$2,635,000Investment
$418.006.85%
6,300Class A
1075 Tiger Blvd LLCClemson Bed, LLC
SIGNIFICANT LEASE DEALSAddress Submarket/City Square Feet Tenant
108-112 Wilkinsville Hwy Cherokee/Gaffney 33,163 Farmers Furniture
315 W. Front St Pickens/Liberty 30,714 Roses Express
1706 Poinsett Hwy Cherrydale/Greenville 10,908 Boom Boom Beauty Sup
UNDER CONSTRUCTION14 Buildings196,644
VACANCY3,656,115 SF4.10%
NET ABSORPTION SF(119,556)
AVG. ASKING RATE PSF GROSS$11.82
DELIVERIES8 Buildings82,007
lee-associates.com LINKA BLOG BY
ECONOMIC OVERVIEW
lee-associates.com LINKA BLOG BY
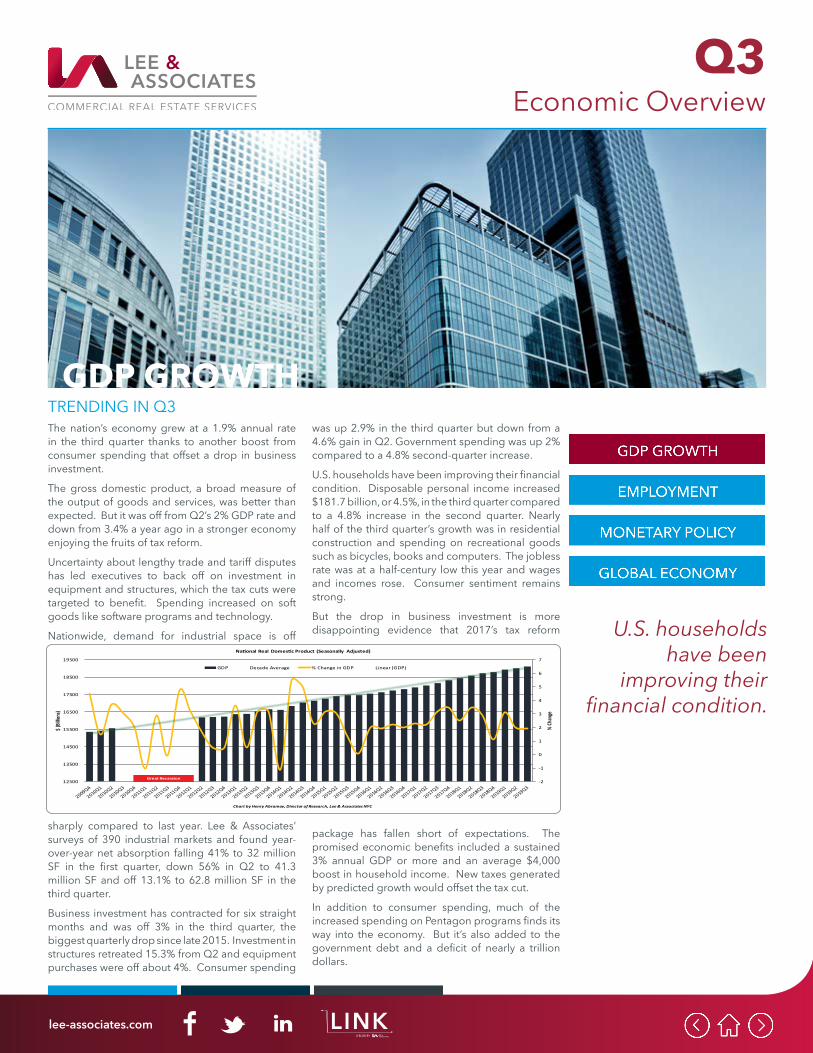
Q3Economic Overview
GDP GROWTH
U.S. households have been
improving their financial condition.
TRENDING IN Q3The nation’s economy grew at a 1.9% annual rate in the third quarter thanks to another boost from consumer spending that offset a drop in business investment.
The gross domestic product, a broad measure of the output of goods and services, was better than expected. But it was off from Q2’s 2% GDP rate and down from 3.4% a year ago in a stronger economy enjoying the fruits of tax reform.
Uncertainty about lengthy trade and tariff disputes has led executives to back off on investment in equipment and structures, which the tax cuts were targeted to benefit. Spending increased on soft goods like software programs and technology.
Nationwide, demand for industrial space is off
sharply compared to last year. Lee & Associates’ surveys of 390 industrial markets and found year-over-year net absorption falling 41% to 32 million SF in the first quarter, down 56% in Q2 to 41.3 million SF and off 13.1% to 62.8 million SF in the third quarter.
Business investment has contracted for six straight months and was off 3% in the third quarter, the biggest quarterly drop since late 2015. Investment in structures retreated 15.3% from Q2 and equipment purchases were off about 4%. Consumer spending
was up 2.9% in the third quarter but down from a 4.6% gain in Q2. Government spending was up 2% compared to a 4.8% second-quarter increase.
U.S. households have been improving their financial condition. Disposable personal income increased $181.7 billion, or 4.5%, in the third quarter compared to a 4.8% increase in the second quarter. Nearly half of the third quarter’s growth was in residential construction and spending on recreational goods such as bicycles, books and computers. The jobless rate was at a half-century low this year and wages and incomes rose. Consumer sentiment remains strong.
But the drop in business investment is more disappointing evidence that 2017’s tax reform
package has fallen short of expectations. The promised economic benefits included a sustained 3% annual GDP or more and an average $4,000 boost in household income. New taxes generated by predicted growth would offset the tax cut.
In addition to consumer spending, much of the increased spending on Pentagon programs finds its way into the economy. But it’s also added to the government debt and a deficit of nearly a trillion dollars.
-2
-1
0
1
2
3
4
5
6
7
12500
13500
14500
15500
16500
17500
18500
19500
% Ch
ange
$ (Bil
lions
)
Na�onal Real Domes�c Product (Seasonally Adjusted)
GDP Decade Average % Change in GDP Linear (GDP)
Chart by Henry Abramov, Director of Research, Lee & Associates NYC
Great Recession
lee-associates.com LINKA BLOG BY
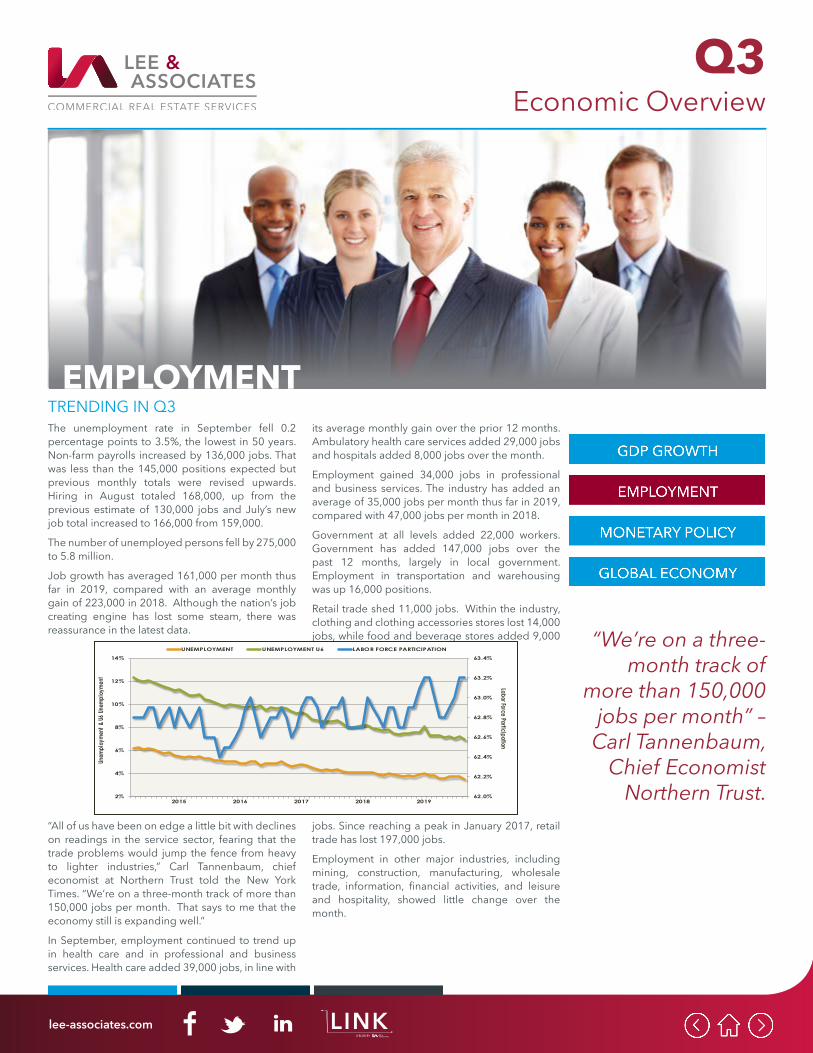
Q3Economic Overview
EMPLOYMENT
“We’re on a three-month track of
more than 150,000 jobs per month” –
Carl Tannenbaum, Chief Economist
Northern Trust.
TRENDING IN Q3The unemployment rate in September fell 0.2 percentage points to 3.5%, the lowest in 50 years. Non-farm payrolls increased by 136,000 jobs. That was less than the 145,000 positions expected but previous monthly totals were revised upwards. Hiring in August totaled 168,000, up from the previous estimate of 130,000 jobs and July’s new job total increased to 166,000 from 159,000.
The number of unemployed persons fell by 275,000 to 5.8 million.
Job growth has averaged 161,000 per month thus far in 2019, compared with an average monthly gain of 223,000 in 2018. Although the nation’s job creating engine has lost some steam, there was reassurance in the latest data.
“All of us have been on edge a little bit with declines on readings in the service sector, fearing that the trade problems would jump the fence from heavy to lighter industries,” Carl Tannenbaum, chief economist at Northern Trust told the New York Times. “We’re on a three-month track of more than 150,000 jobs per month. That says to me that the economy still is expanding well.”
In September, employment continued to trend up in health care and in professional and business services. Health care added 39,000 jobs, in line with
its average monthly gain over the prior 12 months. Ambulatory health care services added 29,000 jobs and hospitals added 8,000 jobs over the month.
Employment gained 34,000 jobs in professional and business services. The industry has added an average of 35,000 jobs per month thus far in 2019, compared with 47,000 jobs per month in 2018.
Government at all levels added 22,000 workers. Government has added 147,000 jobs over the past 12 months, largely in local government. Employment in transportation and warehousing was up 16,000 positions.
Retail trade shed 11,000 jobs. Within the industry, clothing and clothing accessories stores lost 14,000 jobs, while food and beverage stores added 9,000
jobs. Since reaching a peak in January 2017, retail trade has lost 197,000 jobs.
Employment in other major industries, including mining, construction, manufacturing, wholesale trade, information, financial activities, and leisure and hospitality, showed little change over the month.
62.0%
62.2%
62.4%
62.6%
62.8%
63.0%
63.2%
63.4%
2%
4%
6%
8%
10%
12%
14%
2015 2016 2017 2018 2019
Labor Force Participation
Unem
ploy
ment
& U6 U
nemp
loyme
nt
UNEMPLOYMENT UNEMPLOYMENT U6 LABOR FORCE PARTICIPATION
lee-associates.com LINKA BLOG BY
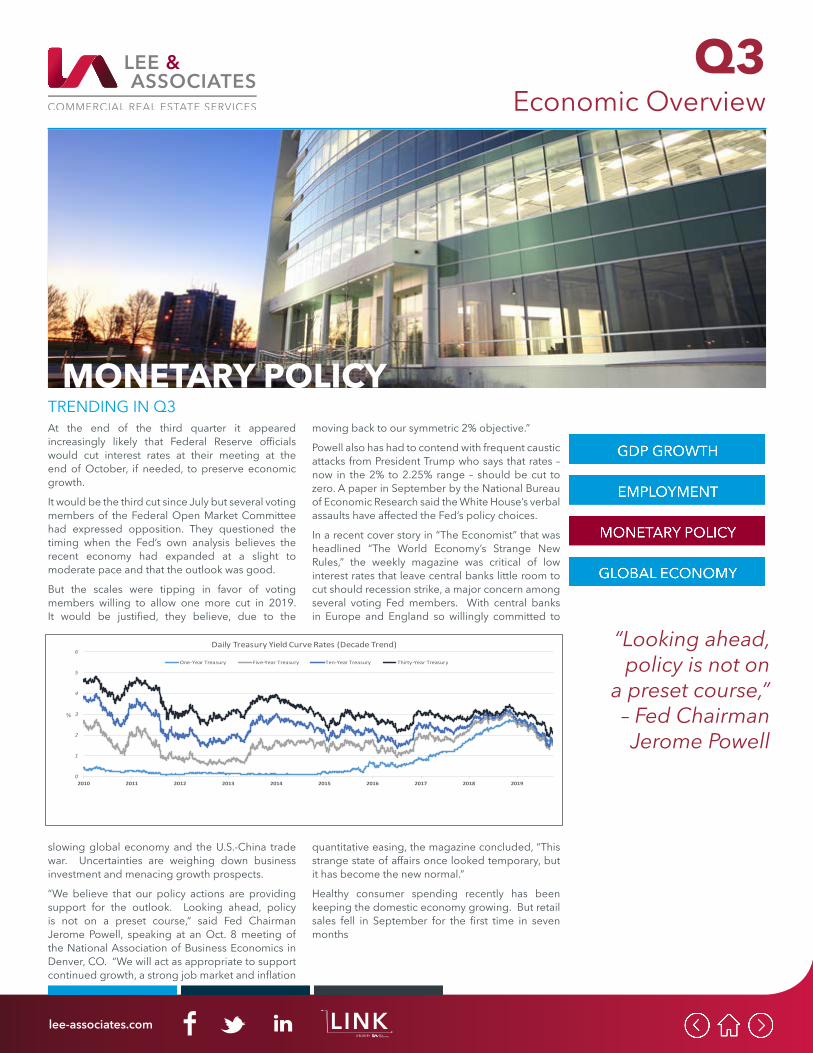
Q3Economic Overview
MONETARY POLICY
“Looking ahead, policy is not on
a preset course,” – Fed Chairman Jerome Powell
TRENDING IN Q3At the end of the third quarter it appeared increasingly likely that Federal Reserve officials would cut interest rates at their meeting at the end of October, if needed, to preserve economic growth.
It would be the third cut since July but several voting members of the Federal Open Market Committee had expressed opposition. They questioned the timing when the Fed’s own analysis believes the recent economy had expanded at a slight to moderate pace and that the outlook was good.
But the scales were tipping in favor of voting members willing to allow one more cut in 2019. It would be justified, they believe, due to the
slowing global economy and the U.S.-China trade war. Uncertainties are weighing down business investment and menacing growth prospects.
“We believe that our policy actions are providing support for the outlook. Looking ahead, policy is not on a preset course,” said Fed Chairman Jerome Powell, speaking at an Oct. 8 meeting of the National Association of Business Economics in Denver, CO. “We will act as appropriate to support continued growth, a strong job market and inflation
moving back to our symmetric 2% objective.”
Powell also has had to contend with frequent caustic attacks from President Trump who says that rates – now in the 2% to 2.25% range – should be cut to zero. A paper in September by the National Bureau of Economic Research said the White House’s verbal assaults have affected the Fed’s policy choices.
In a recent cover story in “The Economist” that was headlined “The World Economy’s Strange New Rules,” the weekly magazine was critical of low interest rates that leave central banks little room to cut should recession strike, a major concern among several voting Fed members. With central banks in Europe and England so willingly committed to
quantitative easing, the magazine concluded, “This strange state of affairs once looked temporary, but it has become the new normal.”
Healthy consumer spending recently has been keeping the domestic economy growing. But retail sales fell in September for the first time in seven months
0
1
2
3
4
5
6
2010 2011 2012 2013 2014 2015 2016 2017 2018 2019
%
Daily Treasury Yield Curve Rates (Decade Trend)
One-Year Treasury Five-Year Treasury Ten-Year Treasury Thirty-Year Treasury
lee-associates.com LINKA BLOG BY
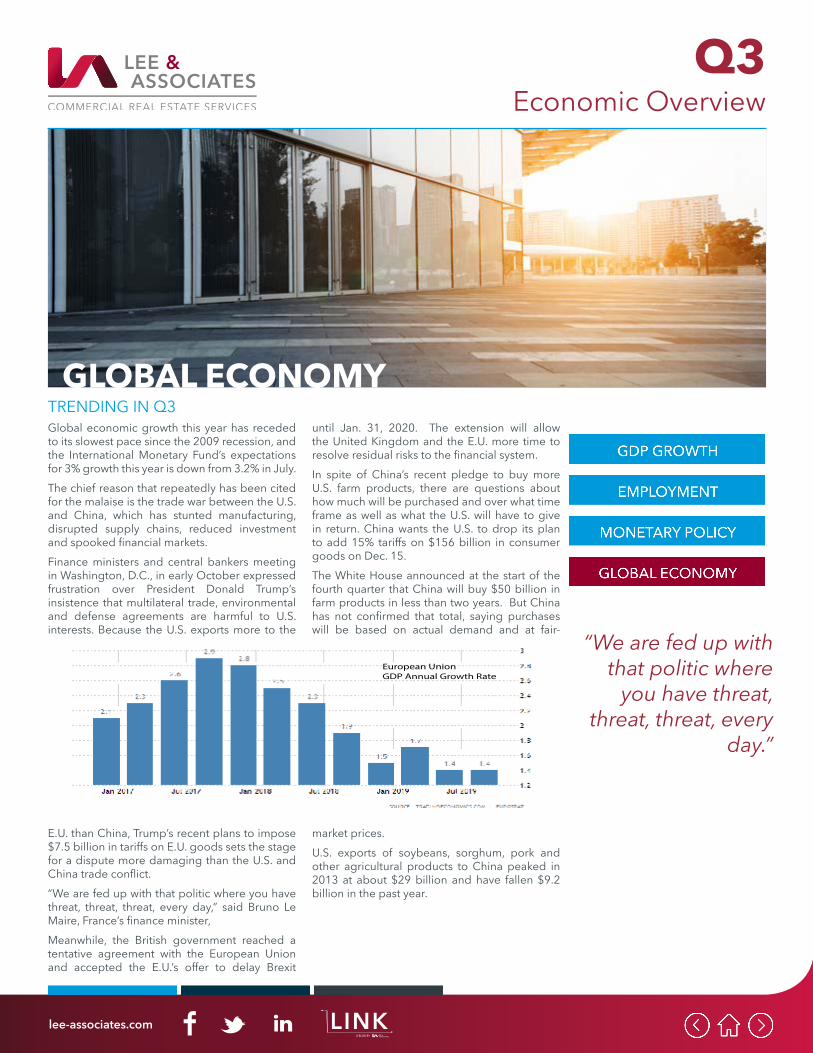
Q3Economic Overview
TRENDING IN Q3Global economic growth this year has receded to its slowest pace since the 2009 recession, and the International Monetary Fund’s expectations for 3% growth this year is down from 3.2% in July. The chief reason that repeatedly has been cited for the malaise is the trade war between the U.S. and China, which has stunted manufacturing, disrupted supply chains, reduced investment and spooked financial markets. Finance ministers and central bankers meeting in Washington, D.C., in early October expressed frustration over President Donald Trump’s insistence that multilateral trade, environmental and defense agreements are harmful to U.S. interests. Because the U.S. exports more to the
E.U. than China, Trump’s recent plans to impose $7.5 billion in tariffs on E.U. goods sets the stage for a dispute more damaging than the U.S. and China trade conflict. “We are fed up with that politic where you have threat, threat, threat, every day,” said Bruno Le Maire, France’s finance minister, Meanwhile, the British government reached a tentative agreement with the European Union and accepted the E.U.’s offer to delay Brexit
until Jan. 31, 2020. The extension will allow the United Kingdom and the E.U. more time to resolve residual risks to the financial system.In spite of China’s recent pledge to buy more U.S. farm products, there are questions about how much will be purchased and over what time frame as well as what the U.S. will have to give in return. China wants the U.S. to drop its plan to add 15% tariffs on $156 billion in consumer goods on Dec. 15.The White House announced at the start of the fourth quarter that China will buy $50 billion in farm products in less than two years. But China has not confirmed that total, saying purchases will be based on actual demand and at fair-
market prices.U.S. exports of soybeans, sorghum, pork and other agricultural products to China peaked in 2013 at about $29 billion and have fallen $9.2 billion in the past year.
GLOBAL ECONOMY
European Union GDP Annual Growth Rate
“We are fed up with that politic where
you have threat, threat, threat, every
day.”
lee-associates.com LINKA BLOG BY

The information and details contained herein have been obtained from third-party sources believed to be reliable, however, Lee & Associates has not independently verified its accuracy.Lee & Associates makes no representations, guarantees, or express or implied warranties of any kind regarding the accuracy or completeness of the information and details provided herein, including but not limited to, the implied warranty of suitability and fitness for a particular purpose. Interested parties should perform their own due diligence regarding the accuracy of the information.The information provided herein, including any sale or lease terms, is being provided subject to errors, omissions, changes of price or conditions, prior sale or lease, and withdrawal without notice. Third-party data sources: CoStar Group, Inc., The Economist, U.S. Bureau of Economic Analysis, U.S. Bureau of Labor Statistics, Congressional Budget Office, European Central Bank, GlobeSt.com, CoStar Property and Lee Proprietary Data. © Copyright 2019 Lee & Associates all rights reserved. Third-party Image sources: sorbis/shutterstock.com, shutterstock.com
lee-associates.com LINKA BLOG BY