2019 Full Year Results - Menzies Aviation
40
2019 Full Year Results 10 March 2020
Transcript of 2019 Full Year Results - Menzies Aviation

2019 Full Year Results10 March 2020

MENZIES EXECUTIVE MANAGEMENT BOARD
PHILIPP JOEINIG
Executive Chairman
GILES WILSON
Chief Executive Officer
ALVARO GOMEZ-REINO
Chief Financial Officer
JOHN GEDDES
Corporate Affairs Director
MERVYN WALKER
Chief Operating Officer
2
WELCOME – PHILIPP JOEINIG

Highlights

2019 HIGHLIGHTS
4
ACTIONS DELIVERED
• Decisive action taken to right-size the business for growth
• Cost and efficiency programmes delivered and benefits realised
• Commercial team bolstered to target customer engagement and drive growth
• Greater focus on operational discipline
• Executive team strengthened
MENZIES HERITAGEPEOPLE. PASSION. PRIDE.
Since 1833
• Logistics specialists
• Time critical services
• Customer centric
• Innovators

5
Decisive actions created momentum
for 2020
2019 ACHIEVEMENTS
People focus
Strategic growth plans
Customer and organic growth
Fixed underperforming
stations
Achievements
Reducedoverhead costs

2020 IMMEDIATE RESPONSE TO COVID-19
6
RESILIENT BUSINESS MODEL
• Flexible operating model
• Remaining close to customer
• Global business
• Experienced management team
BALANCE SHEET ACTIONS
• No final dividend
• Reduction in capital expenditure outlay
• Target leverage reduction:
Net debt to EBITDA below 2 to 2.5 times by year end
COST ACTIONS
• Tight cost management across all areas
• Ban on all non essential spend
• Recruitment freeze

Financial overview
8
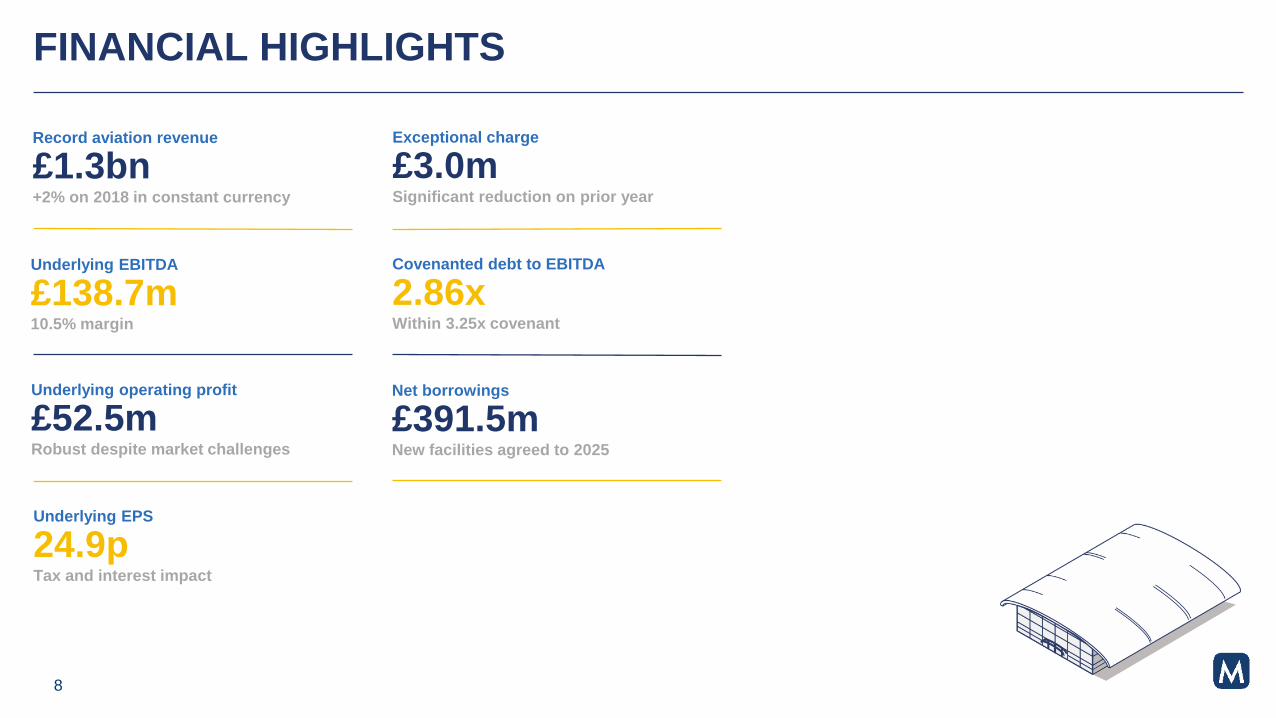
FINANCIAL HIGHLIGHTS
Record aviation revenue
£1.3bn+2% on 2018 in constant currency
Underlying operating profit
£52.5mRobust despite market challenges
Underlying EBITDA
£138.7m10.5% margin
Net borrowings
£391.5mNew facilities agreed to 2025
Underlying EPS
24.9pTax and interest impact
Exceptional charge
£3.0mSignificant reduction on prior year
Covenanted debt to EBITDA
2.86xWithin 3.25x covenant

£m
UNDERLYING OPERATING PROFIT
9
5.6
1.8 0.7
3.7
3.1
0.66.2
4.6
5.5
1.8
55.1 51.9 52.5
Cargovolume & mix
Schedules,trading &
airline failures
2018exclusivelicencelosses
Commerciallyunviable
stations fixed
Netcommercial
gains
Businessdevelopment
Costefficiencies
ResidualDistribution
costs
IFRS16 leaseaccounting
Translation2019
pre-FX
20192018

Revenue Underlying operating profit
2019 2019 2018 2019 2019 2018
ReportedConstant
currencyReported
Constant
currency
Americas 464.3 447.9 463.8 20.9 20.0 17.2
EMEA 552.5 559.6 517.3 13.4 13.6 16.6
Rest of World 161.3 165.1 157.6 12.2 12.3 14.8
Cargo Forwarding 147.5 148.9 152.3 6.0 6.0 6.5
1,325.6 1,321.5 1,291.0 52.5 51.9 55.1
Margin 4.0% 3.9% 4.3%
Notes:
Current year underlying operating profit adjusted for constant currency for comparative purposes
Prior year restated to show the previously reported Corporate function subsumed within the four operating segments
SEGMENTAL PERFORMANCE
10
£m

(199.6)
134.9
32.3
12.1 21.5
0.2 30.7
6.7
237.1
(391.5)
Opening netborrowings
Operating cashflow
Tax & interest Pension Net capitalexpenditure
Net M&A Dividend & other Translation Leaseaccounting
Closing netborrowings
MOVEMENT IN NET BORROWINGS
11
Note:
Operating cash flow and tax & interest include the impact of the new lease accounting standard as appropriate
£m

12
NEW FIVE-YEAR FACILITY
• Extended maturities until 2025
• Same margins as previous financing
• Strong support from existing and new banks
IMPROVED TERMS
• Improved covenants:
3.25x and up to 3.5x in case of acquisitions
• Improved documentation on exchange rate:
Consistent P&L and balance sheet rates
• New asset-backed financial indebtedness permitted
GROUP RE-FINANCING IN JANUARY 2020

Business review

14
THE MARKET IN 2019
ECONOMY
• Global economic uncertainty in depressed markets
• Brexit and US/China trade war
CARGO
• Economic uncertainty reduced cargo volumes globally
• Mix from import to export in Oceania reduced yields
AIRLINES
• Boeing 737 Max materially impacted airline flying schedules
• Airline failures
LABOUR
• Some improvement in North American market, but remained difficult
• Hardening in Eastern Europe as economies prosper

BUSINESS REVIEW
AMERICAS
• Improved commercial engagement
• HR initiatives reducing staff turnover in tight labour markets
• Expansion in Canada drives higher profits
• Operations in Mexico and Colombia perform strongly
• Focus on operational performance improvements
EMEA
• Restructure enhanced operational performance and focus
• UK turnaround plans delivering a return to profitability
• Tight labour markets in Eastern Europe
• Lower volumes at Heathrow and Amsterdam cargo
• Airline bankruptcies including Thomas Cook
REST OF WORLD
• Change in cargo import/export mix impacted returns
• Commercial success with key contract renewals
• Macau delivered excellent returns
• New Indonesian operations gaining traction
CARGO FORWARDING
• Strong performance in Europe and Africa
• Operating model invested for growth
• Organic network expansion UK and Australia
• Acquisition of GTO Logistics in Canada integrated
15

2019 RETURN TO COMMERCIAL GROWTH
16
COMMERCIAL ACTIVITY
Losses (18) Wins 13
ACTIONS
• Refocused to be customer centric
• Solution orientated approach
• Dedicated key account management
HIGHLIGHTS
• Secured further five years with easyJet at their Luton hub
• Successful key account cargo renewals in Oceania
• Mango Airlines contract win in South Africa
• New cleaning contracts with easyJet and British Airways
• Norwegian extensions across USA
• WestJet in Toronto secured for a further four years
• Qatar success in Scandinavia
+£8madditional annual
revenue secured
179new contracts won
£153mrevenue renewed
213contracts renewed
across the network

INVESTMENT CASE – RETURNING TO HISTORICAL GROWTHS
17
NET COMMERCIAL GROWTH IS RETURNING
OUR REVENUE SHOWS TRACK RECORD OF GROWTH
£645m
£1,326m
2011 2018 2019
2011 2018 2019
8% CAGR with major acquisitions
5% CAGR excluding acquisitions
5% CAGR 2011-2016
+£1m H1
+£7m H2

2020 AND BEYOND – STRATEGIC FOCUS
18
STRATEGIC ENABLERS
STRATEGIC PRIORITIESLong term sustainable growth
Employer of
choice
Target scale
operations
Margin
improvement
Optimise
portfolio mix
Customer
engagement
Security & safety People focusCommercial IT & systems
Innovation
Innovation
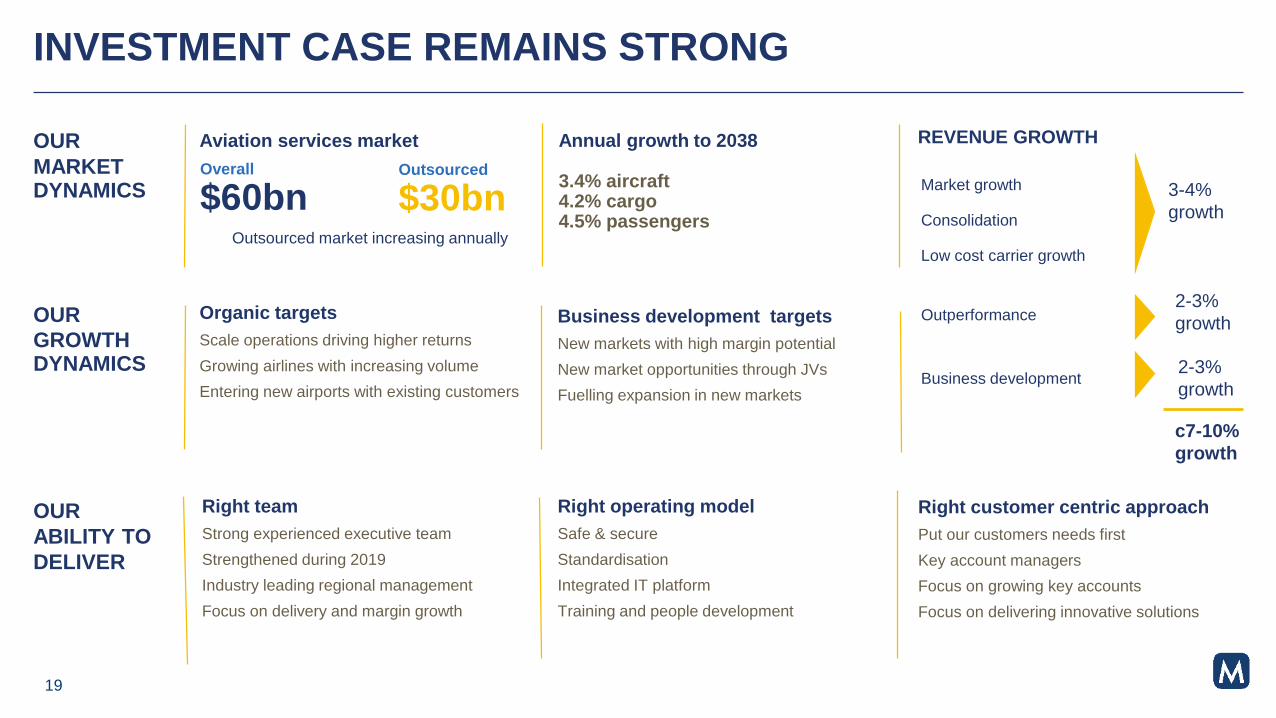
Overall
$60bn
INVESTMENT CASE REMAINS STRONG
OUR
MARKET DYNAMICS
19
3.4% aircraft4.2% cargo4.5% passengers
Aviation services market Annual growth to 2038 REVENUE GROWTH
Outsourced
$30bnOutsourced market increasing annually
OUR
GROWTHDYNAMICS
Organic targets
Scale operations driving higher returns
Growing airlines with increasing volume
Entering new airports with existing customers
OUR
ABILITY TO
DELIVER
Right team
Strong experienced executive team
Strengthened during 2019
Industry leading regional management
Focus on delivery and margin growth
Right operating model
Safe & secure
Standardisation
Integrated IT platform
Training and people development
Right customer centric approach
Put our customers needs first
Key account managers
Focus on growing key accounts
Focus on delivering innovative solutions
Business development targets
New markets with high margin potential
New market opportunities through JVs
Fuelling expansion in new markets
Market growth
Consolidation
Low cost carrier growth
3-4%
growth
Outperformance
Business development
2-3%
growth
2-3%
growth
c7-10%
growth

20
SUMMARY
• Robust performance in difficult markets
• Executive leadership team strengthened
• Commercial performance much improved
• Operational performance much improved
• Group banking re-financing in January 2020
• People development programmes in place
SUMMARY AND OUTLOOK
OUTLOOK
• COVID-19 is having a significant impact
• Focus on strengthening balance sheet
• Net debt target of less than 2 to 2.5 times
• Underlying business performing well
• Commercial pipeline strong
• Business development plans in place
Right team and right structureto seize opportunities in current challenging conditions

Thank you

Appendix 1
Environmental, social & governance

ENVIRONMENTAL, SOCIAL & GOVERNANCE
23
Woven throughout our business and decision making for the future
We commit to and measure against ESG benchmarks and standards
Wellbeing Environment Communities Governance
• Ex-military back to work
• Community initiatives
• Industry groups
• Code of conduct
• Compliance programme
• Due diligence
• Electric turns every day
• Carbon offsetting
• De-icing efficiencies
• Mental health
awareness
• Health & safety
standards
• Inclusivity training
• Living leadership
• People engagement
IMMEDIATE
FOCUS
Reduce
carbon
footprint
Plan for
future
Engage with
communities
Develop our
people
Be a
responsible
business
People
Sustainability strategy and programme delivery

Appendix 2
Further financial information

£m 2019 2019 2018
Reported Constant currency
Continuing operations
Revenue 1,325.6. 1,321.5. 1,291.0.
Underlying EBITDA 138.7. 137.5. 80.3.
Underlying operating profit 52.5. 51.9. 55.1.
Interest (22.1) (22.1) (11.0)
Underlying profit before tax 30.4. 29.8. 44.1.
Underlying effective tax rate 31% 28%
Underlying EPS 24.9p 37.6p
Including discontinued operations
Net borrowings 391.5. 199.6.
Exceptional charge in operating profit (3.0) (43.8)
Covenanted debt to EBITDA ratio 2.86x 2.41x
Basic EPS 12.8p (6.8)p
Dividend per share 6.0p 20.5p
Notes:
Current year underlying operating profit adjusted
for constant currency for comparative purposes
Current year data reflect the impact of the new
leasing accounting standard
2019 FINANCIAL SUMMARY
25

11.2p
21.8p
33.7p
37.6p
24.9p
2015 2016 2017 2018 2019
UNDERLYING EARNINGS PER SHARE PROGRESSION
Notes:
All data is stated excluding Menzies Distribution Ltd and its associated subsidiaries disposed of 2018
2015 to 2018 have not been restated for the adoption of the new leasing standard, a 3.7p per share reduction in 2019
26

Notes:
Margin is reported EBITDA divided by revenue. All data is stated excluding Menzies Distribution Ltd and its associated subsidiaries disposed of in 2018
2015 to 2018 have not been restated for the adoption of the new lease accounting standard, a benefit of 5.0% in 2019
EBITDA MARGIN PROGRESSION
27
5.2%5.8% 6.1% 6.2%
2015 2016 2017 2018 2019
10.5%

Revenue Underlying EBITDA
£m 2019 2019 2018 2019 2019 2018
ReportedConstant
currencyReported
Constant
currency
Americas 464.3 447.9 463.8 58.1 55.8 29.6
EMEA 552.4 559.6 517.3 47.6 48.4 23.9
Rest of World 161.3 165.1 157.6 23.2 23.4 19.4
Cargo Forwarding 147.6 148.9 152.3 9.8 9.9 7.4
1,325.6 1,321.5 1,291.0 138.7 137.5 80.3
Margin 10.5% 10.4% 6.2%
Notes:
2019 EBITDA adjusted for constant currency. Prior year restated to show the previously reported Corporate function subsumed within the four aviation operating segments
2018 has not been restated for the adoption of the new leasing accounting standard in 2019
SEGMENTAL UNDERLYING EBITDA PERFORMANCE
28

£m 2019 2018
Continuing operations:
Acquisition and transaction costs (3.9) (2.9)
Acquisition integration costs (3.3) (2.1)
Acquisition and other claims settlement 18.1. (6.7)
Restructuring, property and pension items (15.6) 1.9.
Impairment -. (3.7)
(4.7) (13.5)
Discontinued operations 1.7. (30.3)
(3.0) (43.8)
EXCEPTIONAL CHARGE IN OPERATING PROFIT
29

£m 2019 2018
Underlying profit before tax 30.4. 44.1.
Non-recurring items in operating profit (4.7) (13.5)
Non-recurring items in finance costs -. (0.7)
JV and associate tax (1.8) (2.0)
Contract amortisation (6.6) (6.3)
17.3. 21.6.
30
PROFIT BEFORE TAX

NET ASSETS
31
£m 2019 2018
Tangible fixed assets and investments 294.5. 140.5.
Goodwill, intangibles and other assets 200.9. 179.3.
Working capital and others (12.2) (4.0)
Net borrowings (391.5) (199.6)
Pension liability, net of deferred tax (4.4) (14.9)
87.3. 101.3.

£m 2019 2018
Underlying EBITDA 138.7. 98.7.
Working capital movement (2.7) (1.8)
Other movements (1.1) (2.0)
Operating cash flow 134.9. 94.9.
Tax and net interest paid (32.3) (25.5)
Net capital expenditure (21.5) (17.3)
Free cash flow 81.1. 52.1.
M&A 0.2. 29.2.
Exceptional and other items (13.4) (15.4)
Dividends (17.3) (17.1)
Additional pension contribution (12.1) (24.8)
Net cash flow 38.5. 24.0.
Net borrowings at start of year (199.6) (214.4)
New lease accounting standard impact (237.1) -.
Currency translation 6.7. (9.2)
Net borrowings at end of year (391.5) (199.6)
CASH FLOW AND NET BORROWINGS
32
Note:
Prior year cash flow presented on a combined
continuing and discontinued basis
Appendix 3
Market dynamics

34
MARKET OVERVIEW – COMPETITIVE LANDSCAPE
Outsourced
market
Restricted
market
Total market
$60bn
Outsourced
market
$30bn
MARKETGLOBAL PLAYERS
50 315 G F C E O
34 202 G F C E O
22 195 G C O
19 129 C C E
REGIONAL PLAYERS
13 60 G C
6 38 G C E
5 36 G C
Source: IATA
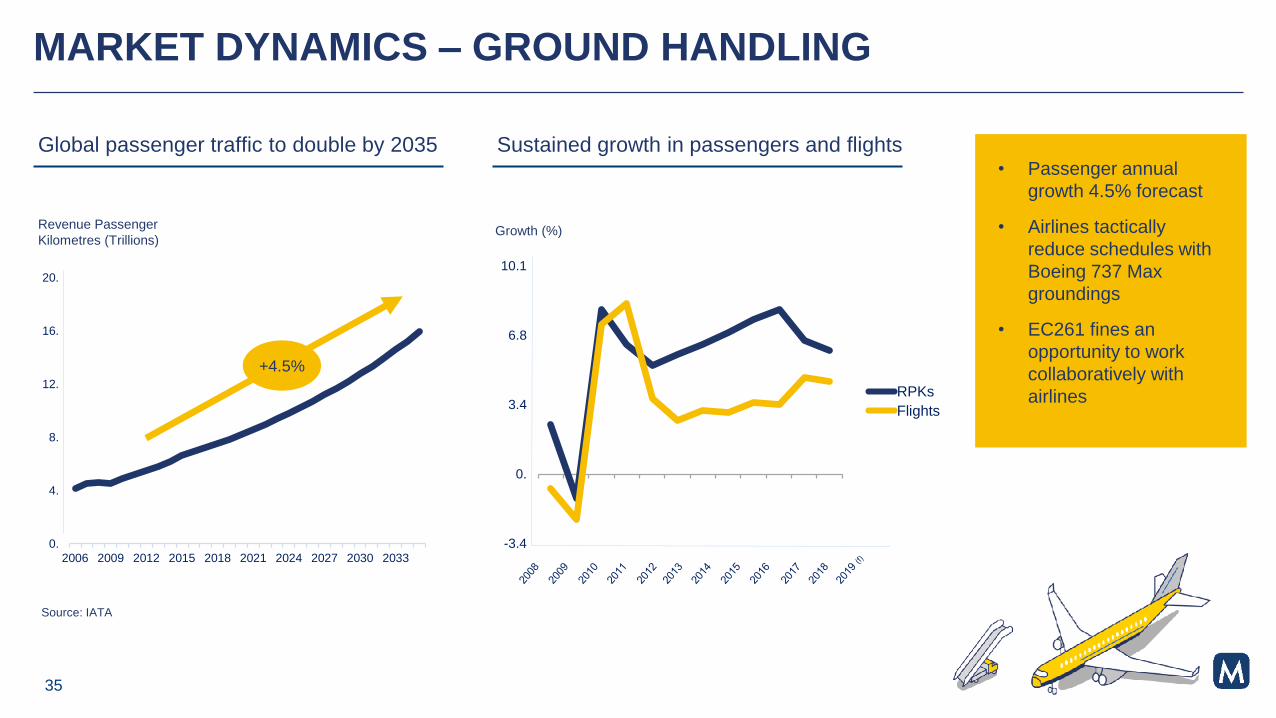
MARKET DYNAMICS – GROUND HANDLING
Global passenger traffic to double by 2035 Sustained growth in passengers and flights
0.
4.
8.
12.
16.
20.
2006 2009 2012 2015 2018 2021 2024 2027 2030 2033
Revenue Passenger
Kilometres (Trillions)
+4.5%
Growth (%)
-3.4
0.
3.4
6.8
10.1
RPKs
Flights
35
• Passenger annual
growth 4.5% forecast
• Airlines tactically
reduce schedules with
Boeing 737 Max
groundings
• EC261 fines an
opportunity to work
collaboratively with
airlines

MARKET DYNAMICS – CARGO
Source: IATA
36
• Global cargo demand is
cyclical and volatile
• Boom in cargo demand
2016 to 2017
• Slowdown in 2018
• Downturn further in
2019
• Forecast to improve
through 2020

MARKET DYNAMICS – FUELLING
0
60
120
180
240
2014 2015 2016 2017 2018 2019 2020f
Fuel ($ billion) Fuel Consumption (billions gallons)
Source: IATA
• Improved aircraft
efficiency
• Fuel consumption
growth marginally
slower than flight
growth
37
Appendix 4
Further information
39
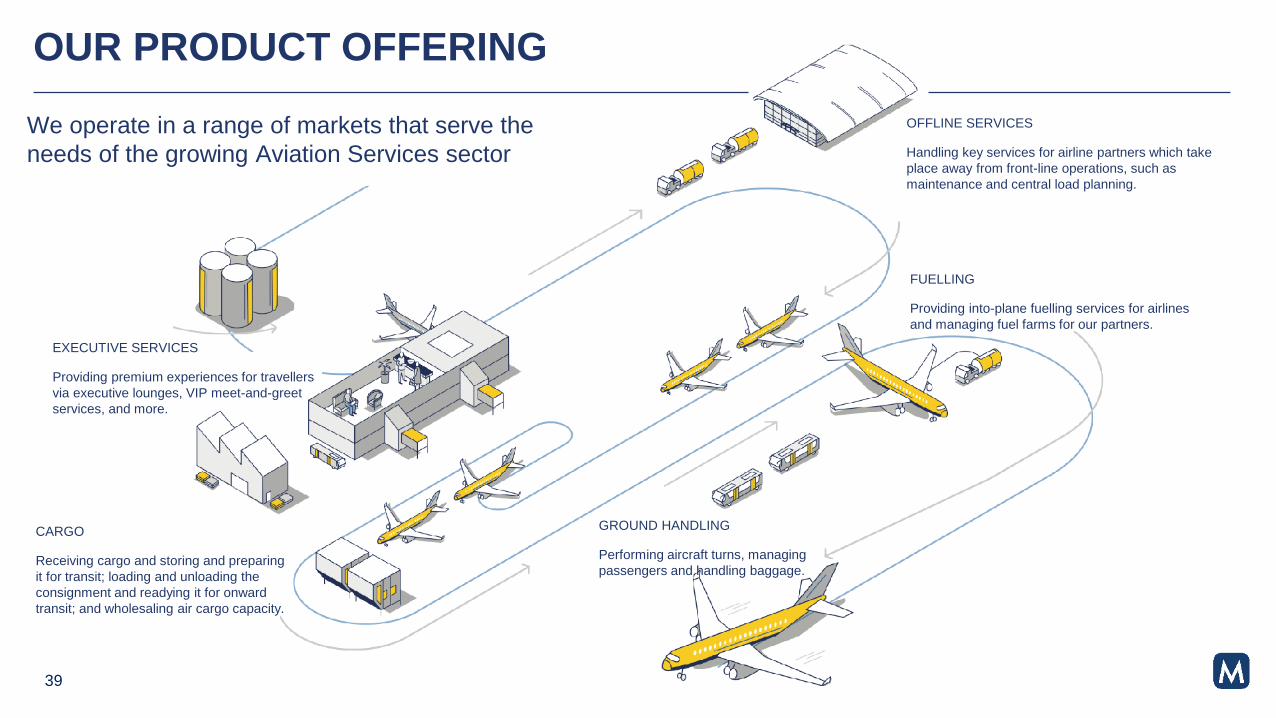
OUR PRODUCT OFFERING
We operate in a range of markets that serve the
needs of the growing Aviation Services sector
GROUND HANDLING
Performing aircraft turns, managing
passengers and handling baggage.
OFFLINE SERVICES
Handling key services for airline partners which take
place away from front-line operations, such as
maintenance and central load planning.
CARGO
Receiving cargo and storing and preparing
it for transit; loading and unloading the
consignment and readying it for onward
transit; and wholesaling air cargo capacity.
FUELLING
Providing into-plane fuelling services for airlines
and managing fuel farms for our partners.
EXECUTIVE SERVICES
Providing premium experiences for travellers
via executive lounges, VIP meet-and-greet
services, and more.

JOHN MENZIES PLC AT A GLANCE
1,291
1,274
843
728
1,3262019
2018
2017
2016
2015 37.649.2
78.2 80.3
138.7
2015 2016 2017 2018 2019
FINANCIAL OVERVIEW
Revenue £m EBITDA £m
COVERAGEBased on 2019
40
Countries
34Airports
202Employees
32,000Flights handled
1.2mCargo tonnes
1.5mFuelling turns
3.6m