2019 EXAM RETDAC Case Study - Society of Actuaries · EXAM RETDAC . RETDAC Morning. Canadian Exam...
17
Case Study FALL 2019 Design & Accounting Exam–Canada EXAM RETDAC RETDAC Morning
Transcript of 2019 EXAM RETDAC Case Study - Society of Actuaries · EXAM RETDAC . RETDAC Morning. Canadian Exam...
Case Study FALL 2019 Design & Accounting Exam–Canada EXAM RETDAC
RETDAC Morning
Canadian Exam Case Study — Course DA Retirement
National Oil Company Background
National Oil Company (NOC) is a large, well-established company that services oil wells all over the country ofGevrey. NOC has been in existence for over 30 years and has approximately 9,000 full-time salaried and unionhourly employees and up to a further 7,000 non-skilled seasonal employees during the non-winter months.Approximately one-half of the seasonal employees return for another season. The full-time workforce isreasonably stable, but turnover in the last 5 years has been greater than desired due to competitors recruitingNOC’s employees.
Normally, an undergraduate degree is a minimum requirement to obtain entry to the salaried workforce andmany employees have graduate degrees. About half of NOC’s salaried employees are recruited directly fromuniversity with the other half coming from competitors.
The company’s financial position varies with the price of oil. As oil prices rise, oil companies becomeincreasingly active and in turn require the services of NOC. Conversely, activity slows as oil prices drop.Despite this, the company is usually in a taxable position.
NOC has managed to be successful by staying on the cutting edge of technology. NOC prides itself on beingstate of the art in processes and software relevant to its industry. This has helped it to stave off competitionfrom both inside and outside of Gevrey. Although NOC is the largest player in the industry within Gevrey, thereare larger players from outside of the country, with which NOC has to compete. From time to time, there arerumors of a takeover of NOC.
Country of Gevrey Background
Gevrey is a modern developed country with a simplified tax system. Both corporations and individuals aresubject to income tax at a flat rate of 40%. Reasonable operating expenses, including contributions to EligibleRetirement Plans (ERPs), reduce taxable income.
No pension legislation exists apart from the rules outlined herein.
Rules that apply to gain ERP status are as follows:
General
• If a company has one or more ERPs, then all employees are entitled to be in at least one of the company’s ERPs.
Defined Benefit Plans (DB ERPs)
•Employer contributions may not exceed those recommended by an actuary, in accordance with generally accepted actuarial practice• Employer contributions are an eligible expense to reduce the employer’s taxable income• Periodic pensions may not exceed $3,000 per annum for each year of service regardless of form or commencement age• Periodic pensions cannot commence prior to age 55• Investment earnings generated by the ERP pension fund are not taxable• Pension payments are taxed as received in the hands of the recipient• No employee contributions are permitted• Plan sponsors have unconditional rights to a refund of surplus assets
Defined Contribution Plans (DC ERPs)
• Employer contributions for any individual plan member cannot exceed $20,000 annually• Employer contributions are an eligible expense to reduce the employer’s taxable income• Investment earnings generated by the ERP pension fund are not taxable until withdrawn• Benefit distributions are taxed as received in the hands of the recipient• Employer contributions may or may not be dependent on employee contributions• Individuals may contribute up to $20,000 annually • Such contributions are tax deductible to the individual
The tax assistance available under each of the above two arrangements does not depend on the extent ofparticipation under the other one. For example, an individual could participate in a DC ERP and, if eligibleunder the plans’ rules, also a DB ERP of his or her employer.
Supplemental Retirement Plans (SRPs)
Contributions to a retirement plan that does not meet ERP status are not tax-deductible. Benefits paid toparticipants under such plans are tax deductible to the company and are taxable to participants, when paid toparticipants. Such a plan is known as a Supplemental Retirement Plan (SRP). An example of an SRP is a planthat restores the benefits lost by the imposition of the ERP maximums.
Retiree Health Care Plans
Employers in Gevrey may provide health care benefits to retirees and their spouses through a separate planwhich is not intended to qualify for ERP status. Benefits (including insurance premiums) paid under such plansare tax deductible to the company when paid on behalf of participants. Benefits payable as an indemnity forhealth related services are not taxable to plan participants at any time.
* * *
No social security pension system exists in Gevrey and there are no state-provided life or health care benefits.
For financial reporting purposes, Gevrey has adopted International Accounting Standard (IAS) 19, rev. 2011.
Gevrey has a well-developed investment market with substantial trading in government bonds, corporatebonds, and equities.
Summary of National Oil’s Retirement Benefits
NOC maintains three defined benefit plans:
1. Final-average pay defined benefit ERP for its full-time salaried employees;2. Unit benefit defined benefit ERP for its full-time hourly union staff; and 3. Non-eligible pension plan (referred to as the SRP) for its executives that is supplemental to the salaried ERP. This plan has no assets.
In addition, the company has a defined contribution ERP for its seasonal workforce.
Furthermore, full-time salaried and union employees retiring with the company are covered for their lifetime byhealth benefits.
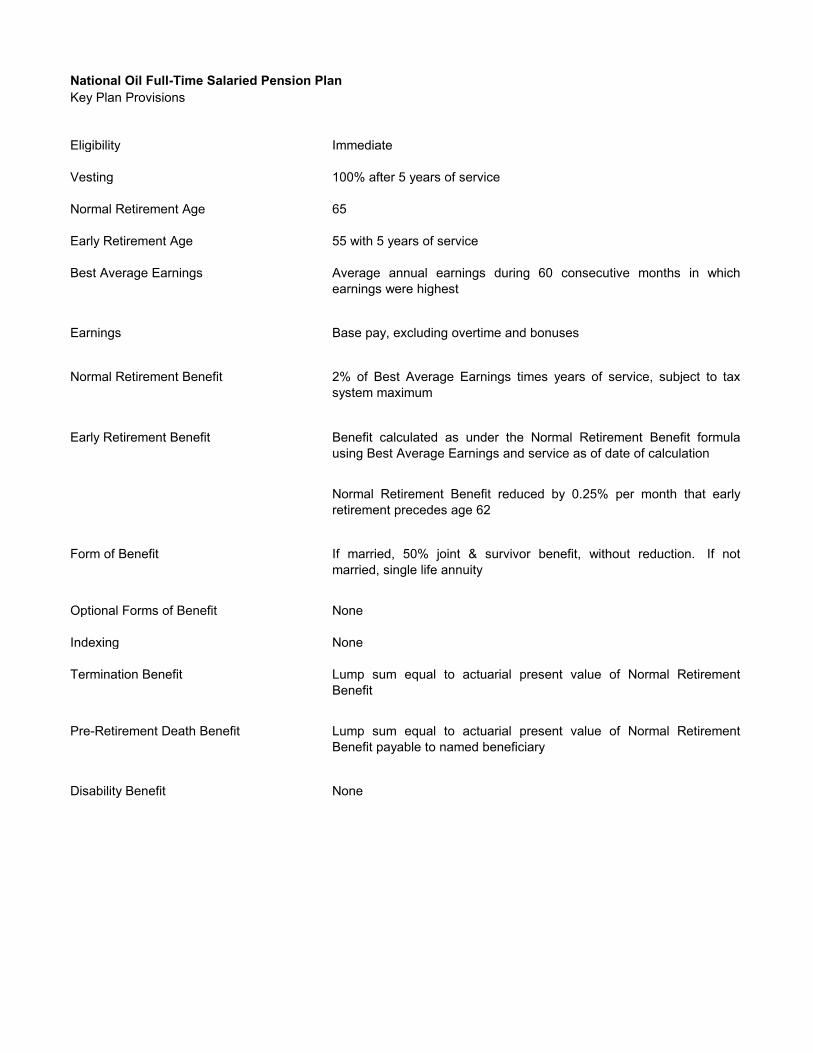
National Oil Full-Time Salaried Pension PlanKey Plan Provisions
Eligibility Immediate
Vesting 100% after 5 years of service
Normal Retirement Age 65
Early Retirement Age 55 with 5 years of service
Best Average Earnings Average annual earnings during 60 consecutive months in whichearnings were highest
Earnings Base pay, excluding overtime and bonuses
Normal Retirement Benefit 2% of Best Average Earnings times years of service, subject to taxsystem maximum
Early Retirement Benefit Benefit calculated as under the Normal Retirement Benefit formulausing Best Average Earnings and service as of date of calculation
Normal Retirement Benefit reduced by 0.25% per month that earlyretirement precedes age 62
Form of Benefit If married, 50% joint & survivor benefit, without reduction. If notmarried, single life annuity
Optional Forms of Benefit None
Indexing None
Termination Benefit Lump sum equal to actuarial present value of Normal RetirementBenefit
Pre-Retirement Death Benefit Lump sum equal to actuarial present value of Normal RetirementBenefit payable to named beneficiary
Disability Benefit None
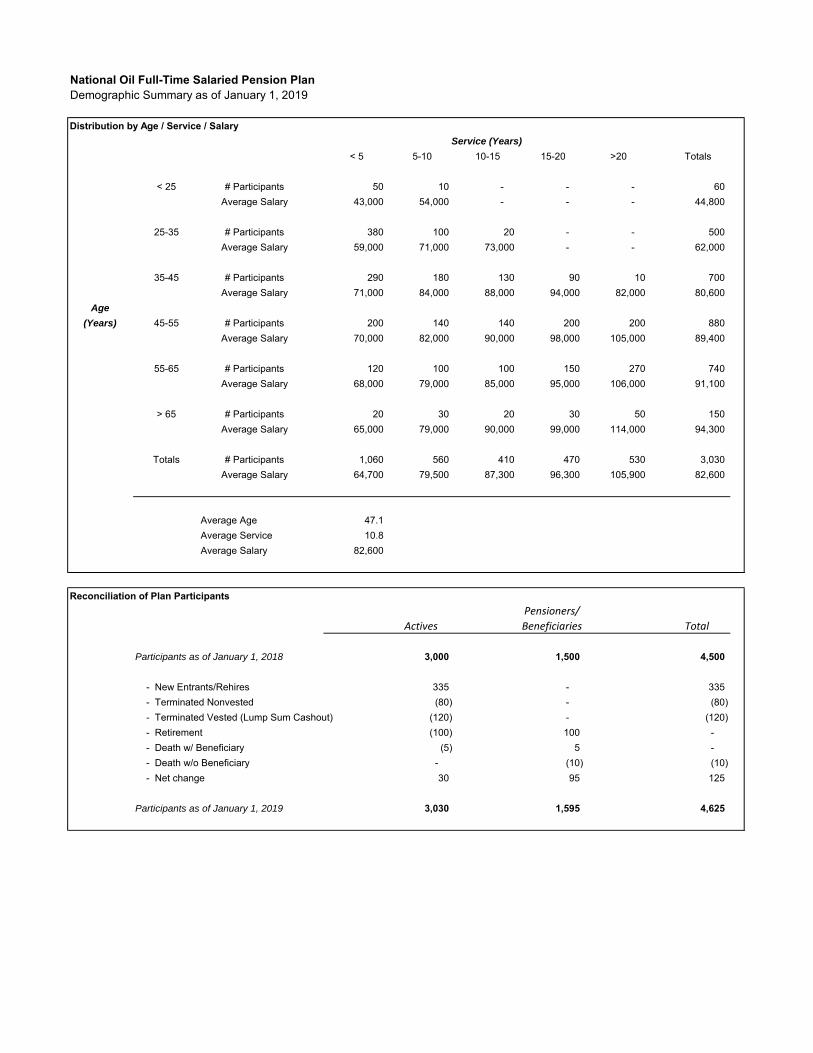
National Oil Full-Time Salaried Pension PlanDemographic Summary as of January 1, 2019
Distribution by Age / Service / Salary
< 5 5-10 10-15 15-20 >20 Totals
< 25 # Participants 50 10 - - - 60 Average Salary 43,000 54,000 - - - 44,800
25-35 # Participants 380 100 20 - - 500 Average Salary 59,000 71,000 73,000 - - 62,000
35-45 # Participants 290 180 130 90 10 700 Average Salary 71,000 84,000 88,000 94,000 82,000 80,600
Age
(Years) 45-55 # Participants 200 140 140 200 200 880 Average Salary 70,000 82,000 90,000 98,000 105,000 89,400
55-65 # Participants 120 100 100 150 270 740 Average Salary 68,000 79,000 85,000 95,000 106,000 91,100
> 65 # Participants 20 30 20 30 50 150 Average Salary 65,000 79,000 90,000 99,000 114,000 94,300
Totals # Participants 1,060 560 410 470 530 3,030 Average Salary 64,700 79,500 87,300 96,300 105,900 82,600
Average Age 47.1 Average Service 10.8 Average Salary 82,600
Reconciliation of Plan ParticipantsPensioners/
Actives Beneficiaries Total
Participants as of January 1, 2018 3,000 1,500 4,500
- New Entrants/Rehires 335 - 335 - Terminated Nonvested (80) - (80) - Terminated Vested (Lump Sum Cashout) (120) - (120) - Retirement (100) 100 - - Death w/ Beneficiary (5) 5 - - Death w/o Beneficiary - (10) (10) - Net change 30 95 125
Participants as of January 1, 2019 3,030 1,595 4,625
Service (Years)

National Oil Full-Time Salaried Pension PlanHistorical Actuarial Valuation Results
2018 2019
Participant Summary – January 1
Active Participants(a) Count 3,000 3,030 (b) average age 46.5 47.1 (c) average service 10.2 10.8 (d) average future working lifetime 12.4 11.9 (e) average future working lifetime to vesting (for those not) 2.5 2.5 (f) average plan earnings (prior year) 82,000 82,600
Deferred Vested Participants(a) count - -
Pensioners (including beneficiaries)(a) count 1,500 1,595 (b) average age 68.0 67.5 (c) average annual benefit 21,600 21,816
Duration of plan liabilities 13.1 13.1
Plan Assets (numbers in $000's) *
Change in Plan Assets during Prior Year(a) Market Value of Assets at January 1 of prior year 545,331 590,439 (b) Employer Contributions during prior year 32,930 33,590 (c) Benefit Payments during prior year (31,610) (32,400) (d) Expenses during prior year - - (e) Investment return during prior year 43,788 32,802 (f) Market Value of Assets at January 1 of current year 590,439 624,431 (g) Rate of return during prior year 8.02% 5.55%
Average Portfolio Mix During Prior Year(a) Domestic Large Cap Equities 31% 30%(b) Domestic Small Cap Equities 23% 20%(c) Domestic Fixed Income 32% 35%(d) International Equities 5% 5%(e) Real Estate 4% 5%(f) Cash 5% 5%(g) Total 100% 100%
Duration of Domestic Fixed Income 10.0 10.0
Asset Class Returns during Prior Year(a) Domestic Large Cap Equities 11% 7%(b) Domestic Small Cap Equities 12% 6%(c) Domestic Fixed Income 4% 5%(d) International Equities 8% 2%(e) Real Estate 3% 7%(f) Cash 1% 1%
* numbers may not add due to rounding
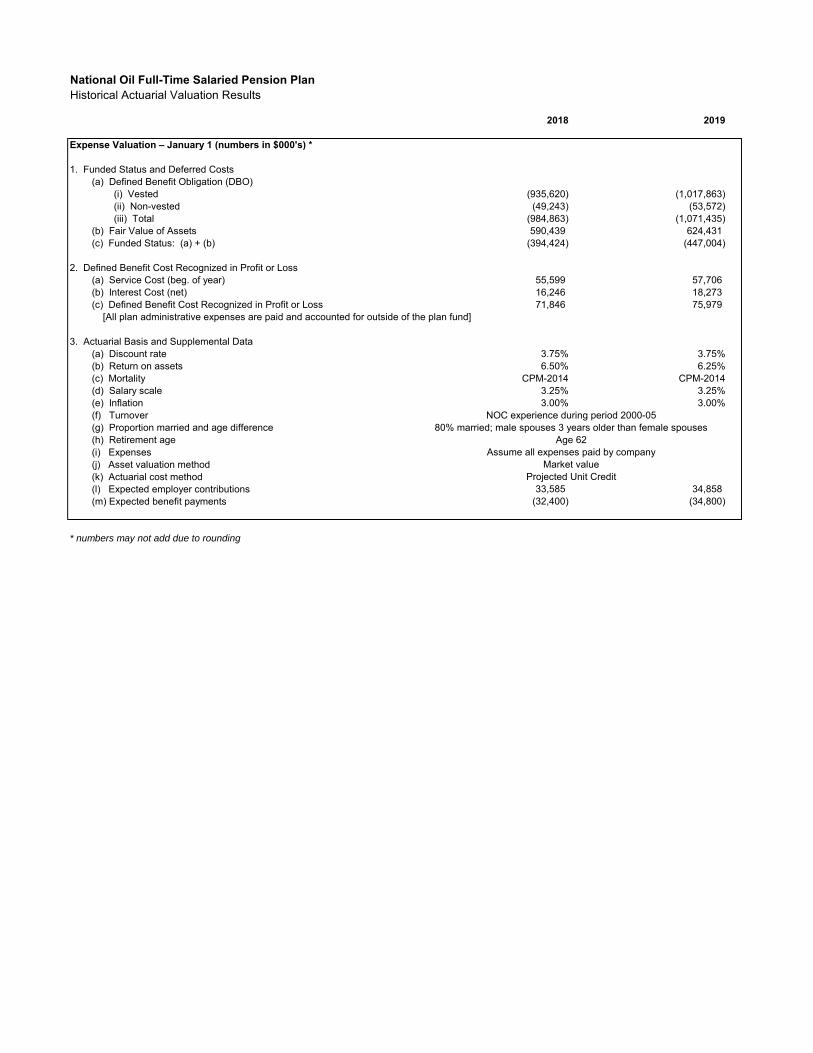
National Oil Full-Time Salaried Pension PlanHistorical Actuarial Valuation Results
2018 2019
Expense Valuation – January 1 (numbers in $000's) *
1. Funded Status and Deferred Costs(a) Defined Benefit Obligation (DBO)
(i) Vested (935,620) (1,017,863) (ii) Non-vested (49,243) (53,572) (iii) Total (984,863) (1,071,435)
(b) Fair Value of Assets 590,439 624,431 (c) Funded Status: (a) + (b) (394,424) (447,004)
2. Defined Benefit Cost Recognized in Profit or Loss(a) Service Cost (beg. of year) 55,599 57,706 (b) Interest Cost (net) 16,246 18,273 (c) Defined Benefit Cost Recognized in Profit or Loss 71,846 75,979
[All plan administrative expenses are paid and accounted for outside of the plan fund]
3. Actuarial Basis and Supplemental Data(a) Discount rate 3.75% 3.75%(b) Return on assets 6.50% 6.25%(c) Mortality CPM-2014 CPM-2014(d) Salary scale 3.25% 3.25%(e) Inflation 3.00% 3.00%(f) Turnover NOC experience during period 2000-05(g) Proportion married and age difference 80% married; male spouses 3 years older than female spouses(h) Retirement age Age 62(i) Expenses Assume all expenses paid by company(j) Asset valuation method Market value(k) Actuarial cost method Projected Unit Credit(l) Expected employer contributions 33,585 34,858 (m) Expected benefit payments (32,400) (34,800)
* numbers may not add due to rounding
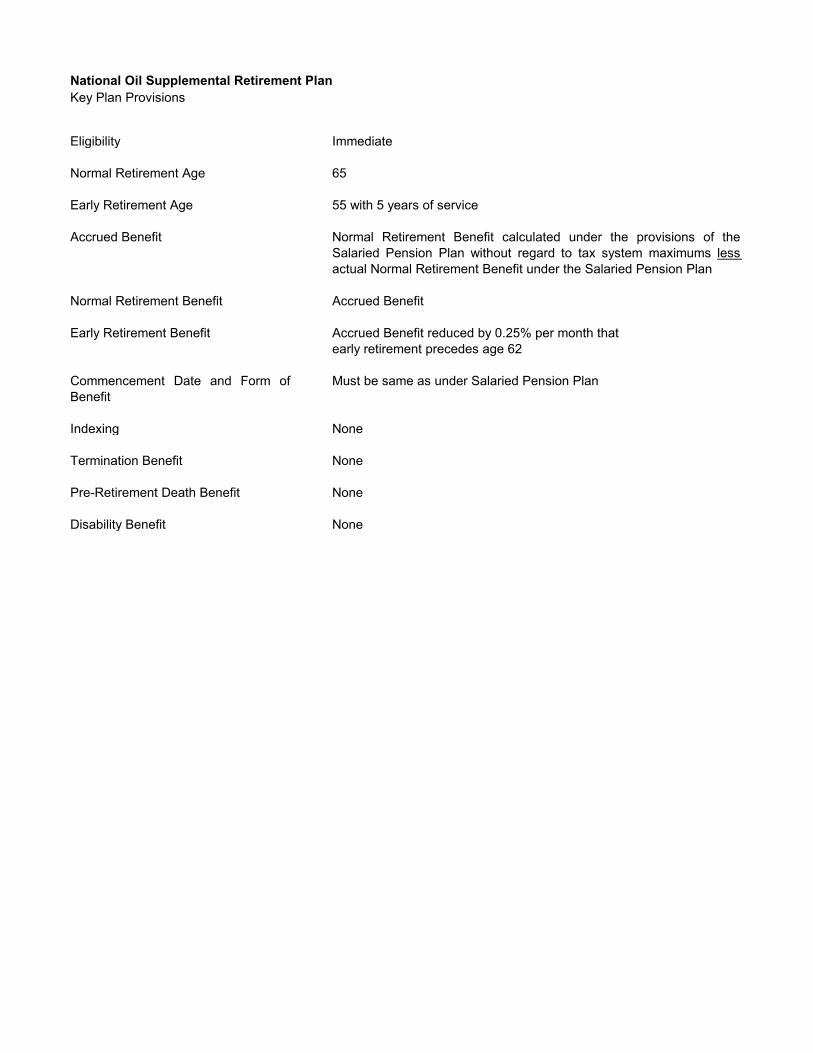
National Oil Supplemental Retirement PlanKey Plan Provisions
Eligibility Immediate
Normal Retirement Age 65
Early Retirement Age 55 with 5 years of service
Accrued Benefit Normal Retirement Benefit calculated under the provisions of theSalaried Pension Plan without regard to tax system maximums less actual Normal Retirement Benefit under the Salaried Pension Plan
Normal Retirement Benefit Accrued Benefit
Early Retirement Benefit Accrued Benefit reduced by 0.25% per month thatearly retirement precedes age 62
Commencement Date and Form ofBenefit
Must be same as under Salaried Pension Plan
Indexing None
Termination Benefit None
Pre-Retirement Death Benefit None
Disability Benefit None
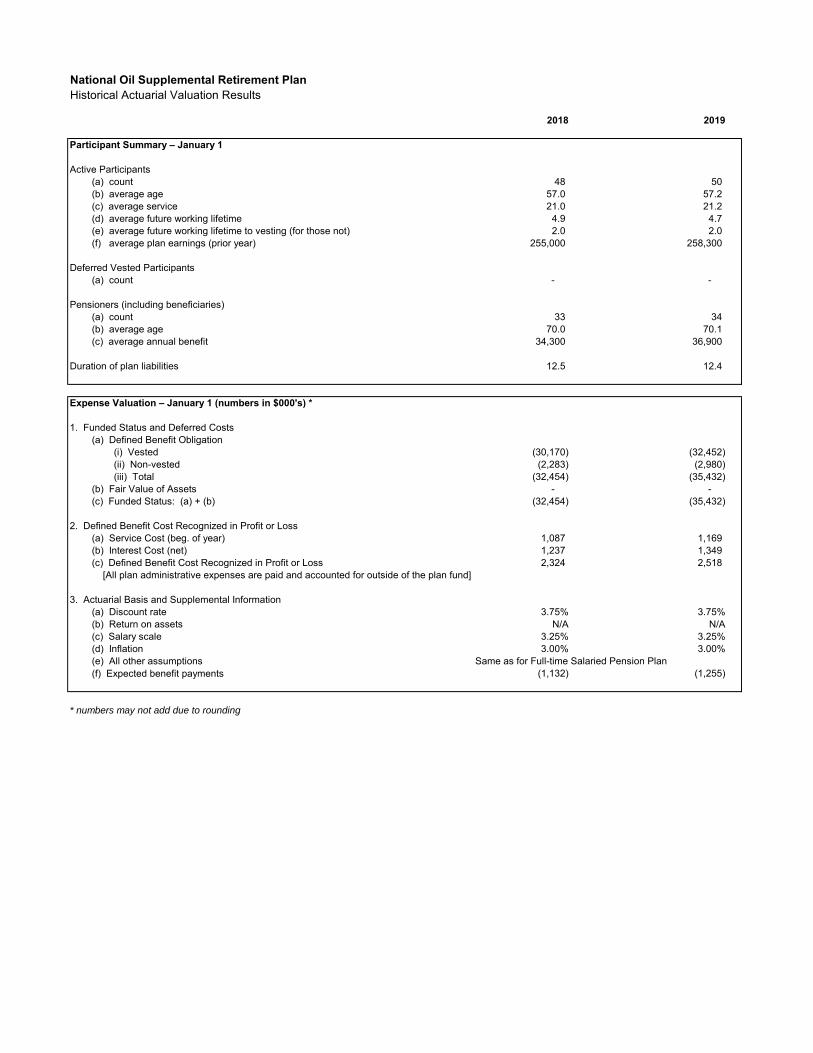
National Oil Supplemental Retirement PlanHistorical Actuarial Valuation Results
2018 2019
Participant Summary – January 1
Active Participants(a) count 48 50 (b) average age 57.0 57.2 (c) average service 21.0 21.2 (d) average future working lifetime 4.9 4.7 (e) average future working lifetime to vesting (for those not) 2.0 2.0 (f) average plan earnings (prior year) 255,000 258,300
Deferred Vested Participants(a) count - -
Pensioners (including beneficiaries)(a) count 33 34 (b) average age 70.0 70.1 (c) average annual benefit 34,300 36,900
Duration of plan liabilities 12.5 12.4
Expense Valuation – January 1 (numbers in $000's) *
1. Funded Status and Deferred Costs(a) Defined Benefit Obligation
(i) Vested (30,170) (32,452) (ii) Non-vested (2,283) (2,980) (iii) Total (32,454) (35,432)
(b) Fair Value of Assets - - (c) Funded Status: (a) + (b) (32,454) (35,432)
2. Defined Benefit Cost Recognized in Profit or Loss(a) Service Cost (beg. of year) 1,087 1,169 (b) Interest Cost (net) 1,237 1,349 (c) Defined Benefit Cost Recognized in Profit or Loss 2,324 2,518
[All plan administrative expenses are paid and accounted for outside of the plan fund]
3. Actuarial Basis and Supplemental Information(a) Discount rate 3.75% 3.75%(b) Return on assets N/A N/A(c) Salary scale 3.25% 3.25%(d) Inflation 3.00% 3.00%(e) All other assumptions Same as for Full-time Salaried Pension Plan(f) Expected benefit payments (1,132) (1,255)
* numbers may not add due to rounding
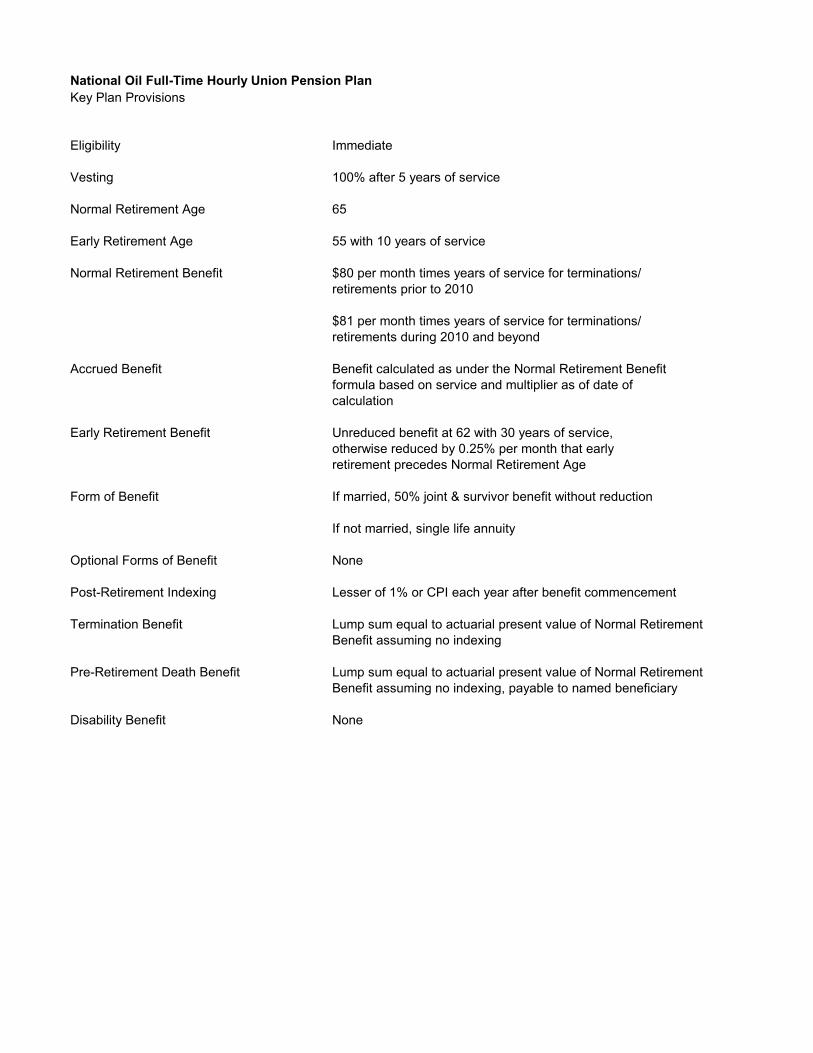
National Oil Full-Time Hourly Union Pension PlanKey Plan Provisions
Eligibility Immediate
Vesting 100% after 5 years of service
Normal Retirement Age 65
Early Retirement Age 55 with 10 years of service
Normal Retirement Benefit $80 per month times years of service for terminations/retirements prior to 2010
$81 per month times years of service for terminations/retirements during 2010 and beyond
Accrued Benefit Benefit calculated as under the Normal Retirement Benefitformula based on service and multiplier as of date ofcalculation
Early Retirement Benefit Unreduced benefit at 62 with 30 years of service, otherwise reduced by 0.25% per month that early retirement precedes Normal Retirement Age
Form of Benefit If married, 50% joint & survivor benefit without reduction
If not married, single life annuity
Optional Forms of Benefit None
Post-Retirement Indexing Lesser of 1% or CPI each year after benefit commencement
Termination Benefit Lump sum equal to actuarial present value of Normal RetirementBenefit assuming no indexing
Pre-Retirement Death Benefit Lump sum equal to actuarial present value of Normal RetirementBenefit assuming no indexing, payable to named beneficiary
Disability Benefit None
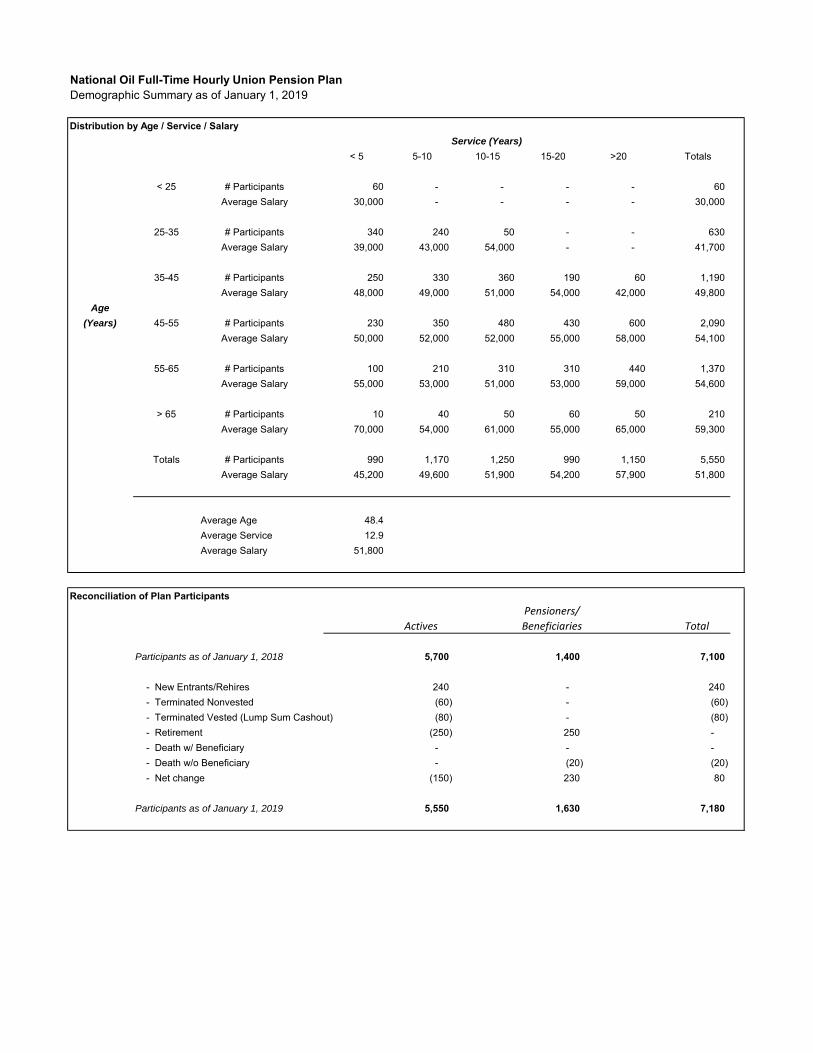
National Oil Full-Time Hourly Union Pension PlanDemographic Summary as of January 1, 2019
Distribution by Age / Service / Salary
< 5 5-10 10-15 15-20 >20 Totals
< 25 # Participants 60 - - - - 60 Average Salary 30,000 - - - - 30,000
25-35 # Participants 340 240 50 - - 630 Average Salary 39,000 43,000 54,000 - - 41,700
35-45 # Participants 250 330 360 190 60 1,190 Average Salary 48,000 49,000 51,000 54,000 42,000 49,800
Age
(Years) 45-55 # Participants 230 350 480 430 600 2,090 Average Salary 50,000 52,000 52,000 55,000 58,000 54,100
55-65 # Participants 100 210 310 310 440 1,370 Average Salary 55,000 53,000 51,000 53,000 59,000 54,600
> 65 # Participants 10 40 50 60 50 210 Average Salary 70,000 54,000 61,000 55,000 65,000 59,300
Totals # Participants 990 1,170 1,250 990 1,150 5,550 Average Salary 45,200 49,600 51,900 54,200 57,900 51,800
Average Age 48.4 Average Service 12.9 Average Salary 51,800
Reconciliation of Plan ParticipantsPensioners/
Actives Beneficiaries Total
Participants as of January 1, 2018 5,700 1,400 7,100
- New Entrants/Rehires 240 - 240 - Terminated Nonvested (60) - (60) - Terminated Vested (Lump Sum Cashout) (80) - (80) - Retirement (250) 250 - - Death w/ Beneficiary - - - - Death w/o Beneficiary - (20) (20) - Net change (150) 230 80
Participants as of January 1, 2019 5,550 1,630 7,180
Service (Years)
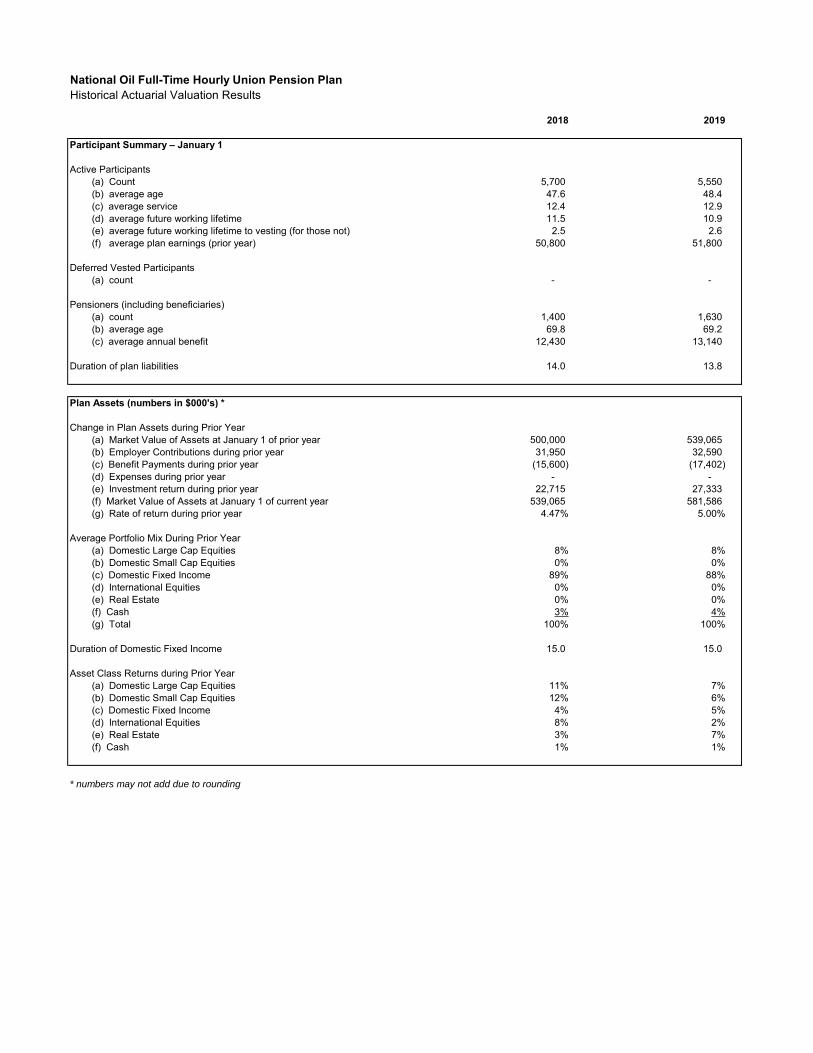
National Oil Full-Time Hourly Union Pension PlanHistorical Actuarial Valuation Results
2018 2019
Participant Summary – January 1
Active Participants(a) Count 5,700 5,550 (b) average age 47.6 48.4 (c) average service 12.4 12.9 (d) average future working lifetime 11.5 10.9 (e) average future working lifetime to vesting (for those not) 2.5 2.6 (f) average plan earnings (prior year) 50,800 51,800
Deferred Vested Participants(a) count - -
Pensioners (including beneficiaries)(a) count 1,400 1,630 (b) average age 69.8 69.2 (c) average annual benefit 12,430 13,140
Duration of plan liabilities 14.0 13.8
Plan Assets (numbers in $000's) *
Change in Plan Assets during Prior Year(a) Market Value of Assets at January 1 of prior year 500,000 539,065 (b) Employer Contributions during prior year 31,950 32,590 (c) Benefit Payments during prior year (15,600) (17,402) (d) Expenses during prior year - - (e) Investment return during prior year 22,715 27,333 (f) Market Value of Assets at January 1 of current year 539,065 581,586 (g) Rate of return during prior year 4.47% 5.00%
Average Portfolio Mix During Prior Year(a) Domestic Large Cap Equities 8% 8%(b) Domestic Small Cap Equities 0% 0%(c) Domestic Fixed Income 89% 88%(d) International Equities 0% 0%(e) Real Estate 0% 0%(f) Cash 3% 4%(g) Total 100% 100%
Duration of Domestic Fixed Income 15.0 15.0
Asset Class Returns during Prior Year(a) Domestic Large Cap Equities 11% 7%(b) Domestic Small Cap Equities 12% 6%(c) Domestic Fixed Income 4% 5%(d) International Equities 8% 2%(e) Real Estate 3% 7%(f) Cash 1% 1%
* numbers may not add due to rounding

National Oil Full-Time Hourly Union Pension PlanHistorical Actuarial Valuation Results
2018 2019
Expense Valuation – January 1 (numbers in $000's) *
1. Funded Status and Deferred Costs(a) Defined Benefit Obligation (DBO)
(i) Vested (723,139) (782,550) (ii) Non-vested (22,365) (24,203) (iii) Total (745,505) (806,753)
(b) Fair Value of Assets 539,065 581,586 (c) Funded Status: (a) + (b) (206,439) (225,166)
2. Defined Benefit Cost Recognized in Profit or Loss(a) Service Cost (beg. of year) 42,283 41,386 (b) Interest Cost (net) 9,878 11,247 (c) Defined Benefit Cost Recognized in Profit or Loss 52,161 52,633
[All plan administrative expenses are paid and accounted for outside of the plan fund]
3. Actuarial Basis and Supplemental Information(a) Discount rate 4.25% 4.50%(b) Return on assets 5.50% 5.50%(c) Mortality CPM-2014 CPM-2014(d) Salary scale N/A N/A(e) Inflation 3.00% 3.00%(f) Turnover NOC experience during period 2000-05(g) Proportion married and age difference 80% married; male spouses 3 years older than female spouses(h) Retirement age Age 62 with early retirement reduction if applicable(i) Expenses Assume all expenses paid by company(j) Asset valuation method Market value(k) Actuarial cost method Projected Unit Credit(l) Expected employer contributions 32,585 33,242 (m) Expected benefit payments (17,402) (21,418)
* numbers may not add due to rounding

National Oil Part-Time DC Pension PlanKey Plan Provisions
Eligibility Immediate
Vesting Immediate
Employee Contributions Employee may defer between 1% to 20% of pay
Employer Contributions 3% of pay
Plan Fund Investment Options The employer invests in funds elected by employee
Account Balance Contributions are accumulated in member's individual account earninga rate of return based on the investments elected by the employee
Loans/Withdrawals Not permitted
Benefit on Termination or Retirement Account balance is payable to employee upon termination orretirement. Employee has the option to leave the balance in the fundor withdraw entire balance immediately upon termination or retirement.
Benefit on Death Account balance is payable to named beneficiary
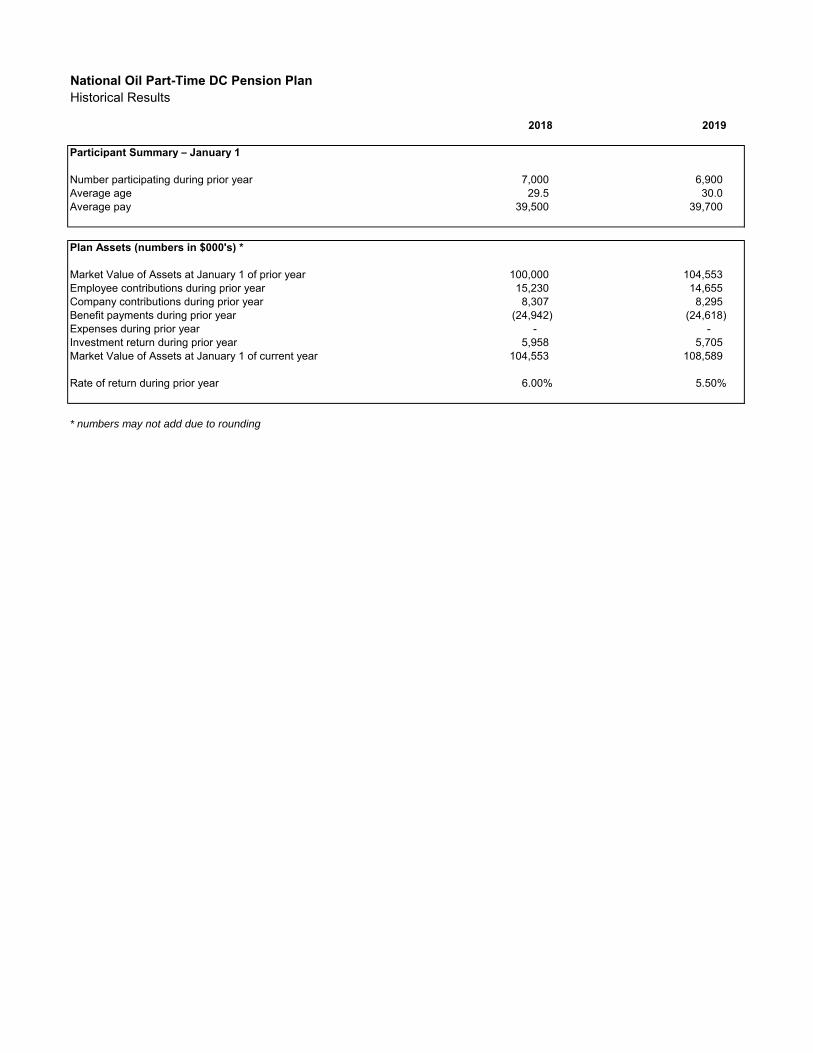
National Oil Part-Time DC Pension PlanHistorical Results
2018 2019
Participant Summary – January 1
Number participating during prior year 7,000 6,900 Average age 29.5 30.0 Average pay 39,500 39,700
Plan Assets (numbers in $000's) *
Market Value of Assets at January 1 of prior year 100,000 104,553 Employee contributions during prior year 15,230 14,655 Company contributions during prior year 8,307 8,295 Benefit payments during prior year (24,942) (24,618) Expenses during prior year - - Investment return during prior year 5,958 5,705 Market Value of Assets at January 1 of current year 104,553 108,589
Rate of return during prior year 6.00% 5.50%
* numbers may not add due to rounding
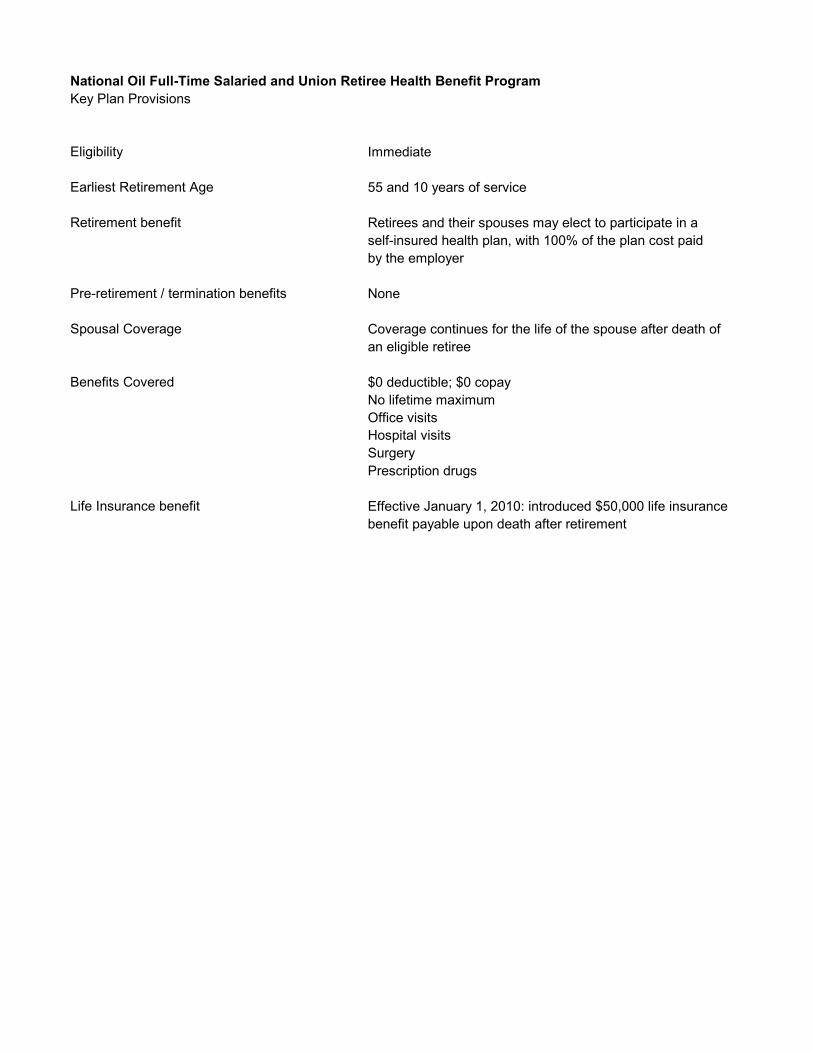
National Oil Full-Time Salaried and Union Retiree Health Benefit ProgramKey Plan Provisions
Eligibility Immediate
Earliest Retirement Age 55 and 10 years of service
Retirement benefit Retirees and their spouses may elect to participate in aself-insured health plan, with 100% of the plan cost paidby the employer
Pre-retirement / termination benefits None
Spousal Coverage Coverage continues for the life of the spouse after death ofan eligible retiree
Benefits Covered $0 deductible; $0 copayNo lifetime maximumOffice visitsHospital visitsSurgeryPrescription drugs
Life Insurance benefit Effective January 1, 2010: introduced $50,000 life insurancebenefit payable upon death after retirement
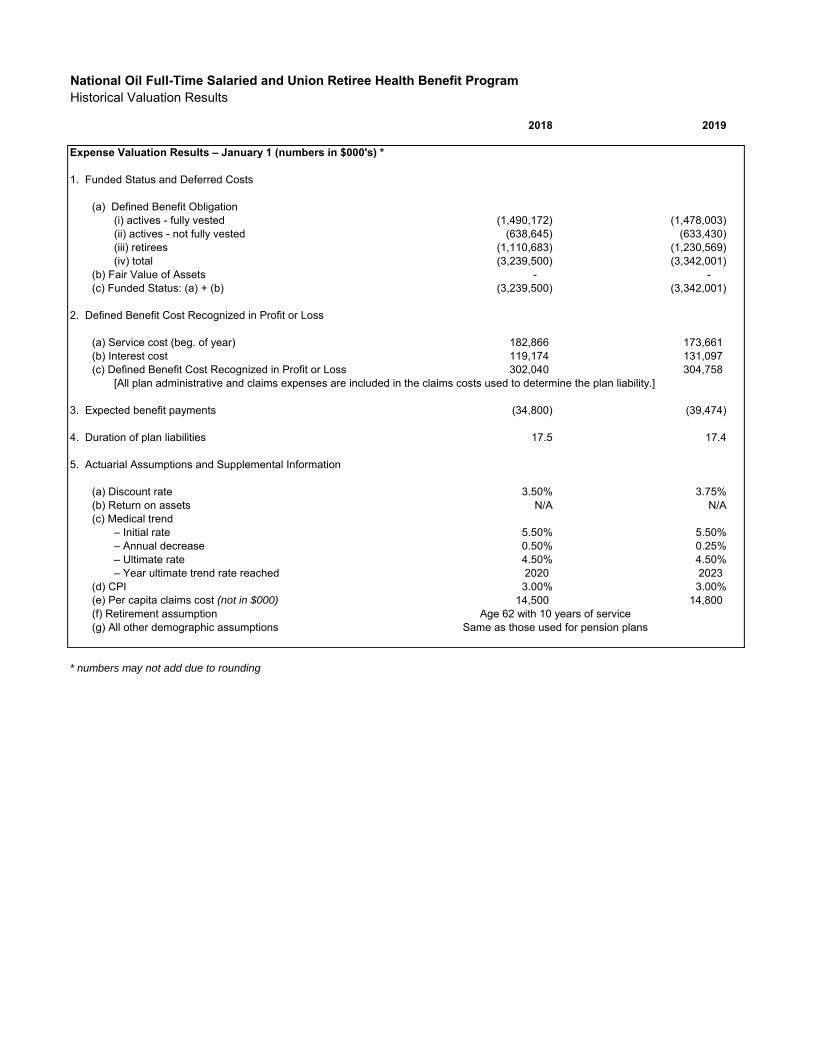
National Oil Full-Time Salaried and Union Retiree Health Benefit ProgramHistorical Valuation Results
2018 2019
Expense Valuation Results – January 1 (numbers in $000's) *
1. Funded Status and Deferred Costs
(a) Defined Benefit Obligation(i) actives - fully vested (1,490,172) (1,478,003) (ii) actives - not fully vested (638,645) (633,430) (iii) retirees (1,110,683) (1,230,569) (iv) total (3,239,500) (3,342,001)
(b) Fair Value of Assets - - (c) Funded Status: (a) + (b) (3,239,500) (3,342,001)
2. Defined Benefit Cost Recognized in Profit or Loss
(a) Service cost (beg. of year) 182,866 173,661 (b) Interest cost 119,174 131,097 (c) Defined Benefit Cost Recognized in Profit or Loss 302,040 304,758
[All plan administrative and claims expenses are included in the claims costs used to determine the plan liability.]
3. Expected benefit payments (34,800) (39,474)
4. Duration of plan liabilities 17.5 17.4
5. Actuarial Assumptions and Supplemental Information
(a) Discount rate 3.50% 3.75%(b) Return on assets N/A N/A(c) Medical trend
– Initial rate 5.50% 5.50%– Annual decrease 0.50% 0.25%– Ultimate rate 4.50% 4.50%– Year ultimate trend rate reached 2020 2023
(d) CPI 3.00% 3.00%(e) Per capita claims cost (not in $000) 14,500 14,800 (f) Retirement assumption Age 62 with 10 years of service(g) All other demographic assumptions Same as those used for pension plans
* numbers may not add due to rounding


![Case Study 1 and Exam Project 1 Yoshinori Takahashi[1]](https://static.fdocuments.net/doc/165x107/55288cd44979592e048b49de/case-study-1-and-exam-project-1-yoshinori-takahashi1.jpg)