2019 EDELMAN TRUST BAROMETER · 2020 Edelman Trust Barometer. The Trust Index is the average...
78
Edelman Trust Barometer 2020 Global Report
Transcript of 2019 EDELMAN TRUST BAROMETER · 2020 Edelman Trust Barometer. The Trust Index is the average...

Edelman TrustBarometer 2020
Global Report
2
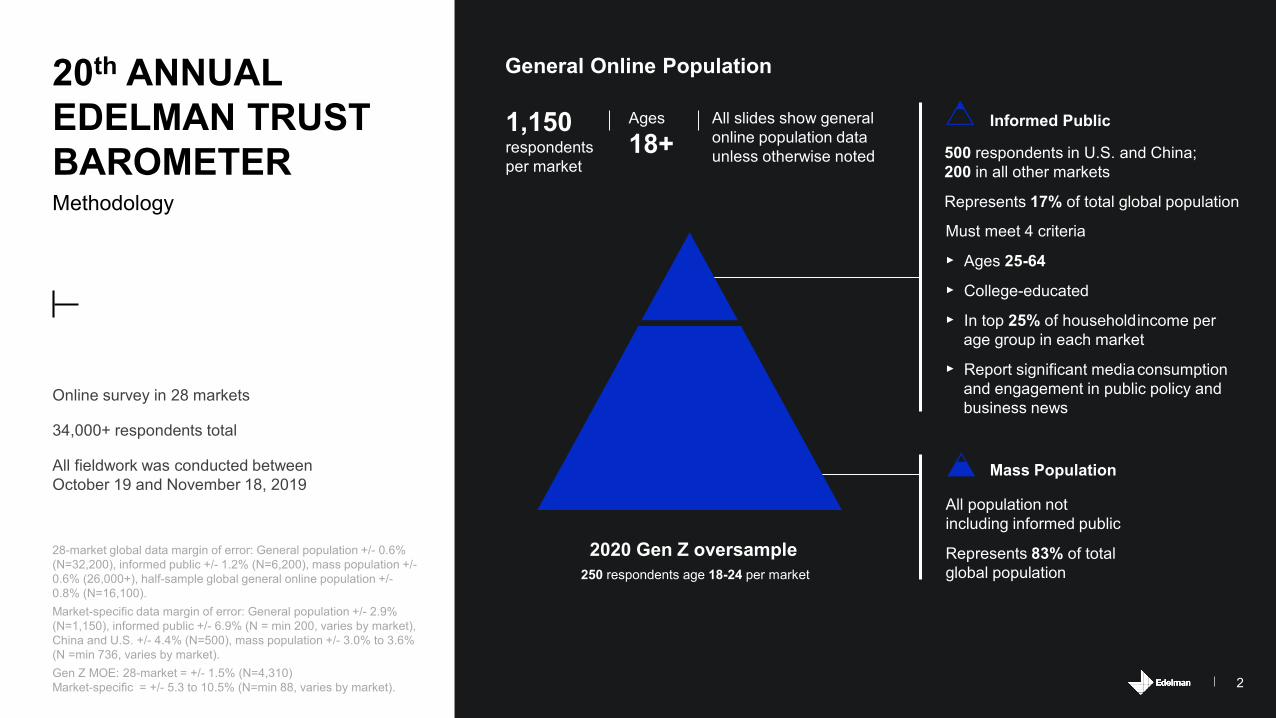
20th ANNUAL EDELMAN TRUST BAROMETERMethodology
28-market global data margin of error: General population +/- 0.6% (N=32,200), informed public +/- 1.2% (N=6,200), mass population +/-0.6% (26,000+), half-sample global general online population +/-0.8% (N=16,100). Market-specific data margin of error: General population +/- 2.9% (N=1,150), informed public +/- 6.9% (N = min 200, varies by market), China and U.S. +/- 4.4% (N=500), mass population +/- 3.0% to 3.6% (N =min 736, varies by market).Gen Z MOE: 28-market = +/- 1.5% (N=4,310)Market-specific = +/- 5.3 to 10.5% (N=min 88, varies by market).
2020 Gen Z oversample250 respondents age 18-24 per market
General Online Population
1,150respondents per market
Ages
18+All slides show general online population data unless otherwise noted
Informed Public
Mass Population
500 respondents in U.S. and China;200 in all other markets
Represents 17% of total global population
Must meet 4 criteria
‣ Ages 25-64
‣ College-educated
‣ In top 25% of householdincome per age group in each market
‣ Report significant mediaconsumption and engagement in public policy and business news
All population not including informed public
Represents 83% of total global population
Online survey in 28 markets
34,000+ respondents total
All fieldwork was conducted between October 19 and November 18, 2019

3
• 2M+ respondents
• 145 companies
• 80k employee reviews
• Interviews with 50+ business leaders
• 23M measures of trust
• Review of 150+ academic articles and 80+ models of trust
• Trust and stock price analysis for 80 companies
20 years of Edelman research on trust
TRUST ESSENTIAL FOR FUTURE SUCCESS
Trustmatters
to…
Consumers
Trusted companies have stronger
consumer buyers and advocates
Employees
Trust drives workplace
recommendations
Regulators
Trusted companies have greater
license to operate
Investors
Trusted companies have greater
license to operate
Media coverage
Trusted companies have greater
license to operate
Resilience against risk
Trusted companies have stronger
consumer buyers and advocates
The market
Trust drives workplace
recommendations

4
20 YEARS OF TRUST
2001 2002 2003 2004 2005 2006 2007 2008 2009 2010
Rising Influence of NGOs
Fall of the Celebrity CEO
Earned Media More Credible Than Advertising
U.S. Companies in Europe Suffer Trust Discount
Trust Shifts from “Authorities” to Peers
A “Person Like Me” Emerges as Credible Spokesperson
Business More Trusted Than Government and Media
Young People Have More Trust in Business
Trust in Business Plummets
Performance and Transparency Essential to Trust
2011 2012 2013 2014 2015 2016 2017 2018 2019 2020
Business Must Partner With Government to Regain Trust
Fall of Government
Crisis of Leadership
Business to Lead the Debate for Change
Trust is Essential to Innovation
Growing Inequality of Trust
Trust in Crisis
The Battle for Truth
Trust at Work
Trust: Competenceand Ethics

5
Percent trust
INCOME INEQUALITY NOW AFFECTS TRUST MORE THAN ECONOMIC GROWTH
GDP Growth
Developed markets
Developing markets
Low growthHigh growth
726064
44
696362
38
Distrust Neutral Trust
Income InequalityMore inequalityLess inequality
52 5043 47
Little effect on trust
Low growth linked to less trust in government
High inequality linked to less trust in government
High inequality linked to less trust in government
50 5246
40
2020 Edelman Trust Barometer. TRU_INS. Below is a list of institutions. For each one, please indicate how much you trust that institution to do what is right. 9-point scale; top 4 box, trust. General online population, 23-mkt avg., by developed and developing markets. High-growth economies are those with a Q2 2019 GDP of 1.4% or higher. Developing market high-growth economies: China, Colombia, India, Indonesia, Kenya, Malaysia, UAE; low growth economies: Argentina, Brazil, Mexico, Russia, Saudi Arabia, S. Africa, Thailand. Developed market high-growth economies: Australia, Canada, France, Ireland, The Netherlands, Spain, U.S.; low-growth economies: Germany, Hong Kong, Japan, Italy, Singapore, S. Korea, U.K.

vGROWING SENSE OF INEQUITY

7
54 Global 2682 China79 India73 Indonesia65 UAE62 Mexico62 Singapore61 Saudi Arabia60 Malaysia57 The Netherlands53 Canada 53 Colombia51 Brazil 50 Hong Kong50 S. Korea49 Argentina49 Italy47 Australia47 U.S.46 Germany45 France45 Ireland 45 Spain44 S. Africa42 Japan 42 U.K.30 Russia
Saudi Arabia
UAE
Hong Kong
Canada
U.S.
Australia +5
S. Africa -5
U.K.
CONTINUEDDISTRUSTTrust Index
2020 Edelman Trust Barometer. The Trust Index is the average percent trust in NGOs, business, government and media. TRU_INS. Below is a list of institutions. For each one, please indicate how much you trust that institution to do what is right. 9-point scale; top 4 box, trust. General population, 26-mkt avg.
Declines in
53 Global 2679 China73 Indonesia72 India71 UAE70 Saudi Arabia62 Singapore59 Malaysia58 Mexico 56 Canada55 Hong Kong54 The Netherlands52 Colombia49 U.S.48 Australia46 Argentina46 Brazil46 Italy46 S. Korea45 S. Africa 44 France44 Germany43 U.K.42 Ireland40 Spain39 Japan29 Russia
2019General population
2020General population
Global Trust Index increases 1 pt., with increases in 16 of 26 markets measured
12 of 26 markets are distrusters, down 2 from 2019
-9
-6
-5
-2
-3
-1
-1
-1
Distrust(1-49)
Neutral(50-59)
Trust(60-100)
Change, 2019 to 2020
- 0
+
8
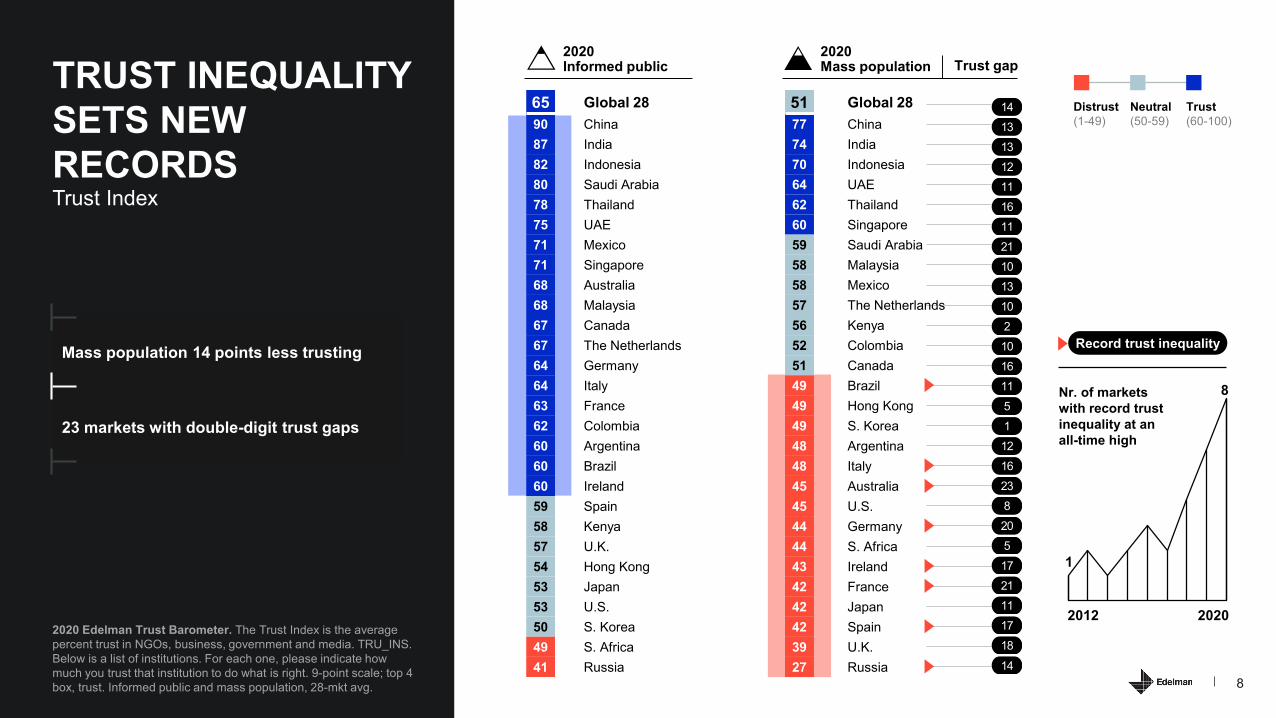
Record trust inequalityMass population 14 points less trusting
23 markets with double-digit trust gaps
51 Global 2877 China74 India70 Indonesia64 UAE62 Thailand60 Singapore59 Saudi Arabia58 Malaysia58 Mexico57 The Netherlands56 Kenya52 Colombia51 Canada49 Brazil 49 Hong Kong49 S. Korea48 Argentina48 Italy45 Australia45 U.S.44 Germany44 S. Africa43 Ireland42 France42 Japan42 Spain39 U.K.27 Russia
1
8
2012 2020
65 Global 2890 China87 India82 Indonesia80 Saudi Arabia 78 Thailand75 UAE71 Mexico71 Singapore68 Australia68 Malaysia67 Canada67 The Netherlands64 Germany64 Italy63 France62 Colombia60 Argentina60 Brazil60 Ireland59 Spain58 Kenya57 U.K.54 Hong Kong53 Japan53 U.S.50 S. Korea49 S. Africa41 Russia
TRUST INEQUALITY SETS NEW RECORDS
2020 Edelman Trust Barometer. The Trust Index is the average percent trust in NGOs, business, government and media. TRU_INS. Below is a list of institutions. For each one, please indicate how much you trust that institution to do what is right. 9-point scale; top 4 box, trust. Informed public and mass population, 28-mkt avg.
Trust Index
Nr. of markets with record trust inequality at an all-time high
Trust gap
14131312111611211013102101611511216238205172111171814
2020Informed public
2020Mass population
Distrust(1-49)
Neutral(50-59)
Trust(60-100)

92020 Edelman Trust Barometer. TRU_INS. Below is a list of institutions. For each one, please indicate how much you trust that institution to do what is right. 9-point scale; top 4 box, trust. Informed public and mass population, 28-mkt avg.
Percent trustTWO DIFFERENT TRUST REALITIES
70 7059 61
Informed publicThree of four institutions trusted
Mass population
No institutions trusted
Trust gap,informed public vs. mass population
65TRUST INDEX
51TRUST INDEX
55 5547 47
NGOs Business Government Media
15 15 12 1414
Distrust Neutral Trust

10
47
15 19 23 27 29 31 31 32 34 35 36 37 3742 43
57 58 59 6066 68 69 70
75 77 77 8090
10
PESSIMISTIC ABOUT ECONOMIC PROSPECTSPercent who believe they and their families will be better off in five years’ time
Majority pessimistic in 15 of 28 markets
- 0
+
Change, 2019 to 2020
2020 Edelman Trust Barometer. CNG_FUT. Thinking about the economic prospects for yourself and your family, how do you think you and your family will be doing in five years’ time? 5-point scale; top 2 box, better off. General population, 26-mkt avg.
-5 -3 -4 -4 -2 -7 -9 0 -2 -6 -2 -4 -10 -9 -8 -7 +1 -2 n/a -10 -9 -4 -6 -4 +3 -8 -5 -3 n/a

11
FEAR BEING LEFT BEHINDPercent who are worried
57
7368 67 66 64 64 64 63 62 62 62 62 59 59 57 55 55 53 52 52 51 50 50 49 48 44 42 41
I worry about people like me losing the respect and dignity I once enjoyed in this countryMajority share concern in 21 of 28 markets
112020 Edelman Trust Barometer. POP_EMO. Some people say they worry about many things while others say they have few concerns. We are interested in what you worry about. Specifically, how much do you worry about each of the following? 9-point scale; top 4 box, worried. General population, 28-mkt avg.

12
2020 Edelman Trust Barometer. “System failing” measure. For full details on how the “system failing” measure was calculated, please refer to the Technical Appendix. POP_MDC. Below is a list of statements. For each one, please rate how true you believe that statement is. 9-point scale; top 4 box, true. General population, 26-mkt avg. Sense of injustice is an average of POP_MDC/1,2,3,8; Desire for change is POP_MDC/9; Lack of confidence is POP_MDC/10; Lack of hope is an average of POP_MDC/18,19,20 [reverse scored]. TMA_SIE_SHV. Please indicate how much you agree or disagree with the following statements. 9-point scale; top 4 box, agree. Question asked of half of the sample. General population, 28-mkt avg.
Percent who agreeCAPITALISM UNDER FIRE
56%
Capitalism as it exists today does more harm than good in the world
18
34
48
The system is… Working for me Not sure Failing me
-2 -2 +3
Sense of injustice 74
Desire for change 73
Lack of confidence 66
Lack of hope 26
How true is this for you?
Change, 2019 to 2020- 0
+

vUNPREPARED FOR THE FUTURE

14
I worry about losing my jobdue to one or more of these causes
2020 Edelman Trust Barometer. POP_EMO. Some people say they worry about many things while others say they have few concerns. We are interested in what you worry about. Specifically, how much do you worry about each of the following? 9-point scale; top 4 box, worried. Job loss net = codes 1,2,3,4,5,23,24. General population, 28-mkt avg, among those who are employed (Q43/1).
Percent of employees who worry about job loss due to each issueWORRY ABOUT THE FUTURE OF WORK
50
53
54
55
58
60
61
Jobs moved to other countries
Automation
Immigrants who work for less
Cheaper foreign competitors
Lack of training/skills
Looming recession
Freelance/gig economy
83%

15
Trust in technology 2019-2020
Global 26
Largest declines in:
France
Canada, Italy, Russia, Singapore
U.S.
Australia
2020 Edelman Trust Barometer. CNG_POC. For the statements below, please think about the pace of development and change in society today and select the response that most accurately represents your opinion. 9-point scale; top 4 box, fast. 28-mkt avg. ATT_MED_AGR. Below is a list of statements. For each one, please rate how much you agree or disagree with that statement. 9-point scale; top 4 box, agree. 28-mkt avg. PER_GOV. How well do you feel the government is currently doing each of the following? 5-point scale; bottom 3 box, not doing well (data excludes DK responses). 25-mkt avg. (data not collected in China, Russia, and Thailand). TRU_IND. Please indicate how much you trust businesses in each of the following industries to do what is right. 9-point scale; top 4 box, trust. 26-mkt avg. All questions asked of half of the sample among the general population.
Percent who agreeWORRY TECHNOLOGY IS OUT OF CONTROL
61% 66% 61%
Government does not understand emerging technologies enough to regulate them effectively
I worry technology will make it impossible to know if what people are seeing or hearing is real
-4
-10
-6
The pace of change in technology is too fast
-8
-7

162020 Edelman Trust Barometer. ATT_MED_AGR. Below is a list of statements. For each one, please rate how much you agree or disagree with that statement. 9-point scale; top 4 box, agree. Question asked of half of the sample. General population, 25-mkt avg. Data on the left not collected in China, Russia and Thailand. Data on the right excludes Kenya, Thailand, and Saudi Arabia.
Percent who agreeWORRY ABOUT QUALITY INFORMATION
57% 76%
The media I use are contaminated with untrustworthy information
I worry about false information or fake news being used as a weapon
+6 pts
Change, 2018 to 2020

17
80
6965
51 5046
4236
Scientists People inmy local
community
Citizens ofmy country
CEOs Journalists Religiousleaders
Governmentleaders
The verywealthy
Percent trust
SOCIETAL LEADERS NOT TRUSTED TO ADDRESS CHALLENGES
2020 Edelman Trust Barometer. POP_MDC. Below is a list of statements. For each one, please rate how true you believe that statement is. 9-point scale; top 4 box, true. TRU_PEP. Below is a list of groups of people. For each one, please indicate how much you trust that group of people to do what is right. 9-point scale; top 4 box, trust. General population, 28-mkt avg.
66%
“I do not have confidence that our current leaders will be able to successfully address our country’s challenges
Distrust Neutral Trust
“

18
Climate Change Automation Income Inequality #MeToo
TAKING THE FUTURE INTO THEIR OWN HANDS
Paris, February 2019
Students protest to draw attention to climate change
London, November 2019
McDonald’s employees protest for higher wages
Oregon, December 2019
Nike employees protest company’s treatment of women
Angers, August 2019
Unions protest a Géant automated supermarket

vTRUST IS BUILT ON COMPETENCE AND ETHICS

20
-35
ETHICAL
35
UNETHICAL
- 50LESS COMPETENT 50 COMPETENT
(Competence score, net ethical score)
NO INSTITUTION SEEN AS BOTH COMPETENT AND ETHICAL
2020 Edelman Trust Barometer. The ethical scores are averages of nets based on [INSTITUTION]_PER_DIM r1-r4. Question asked of half of the sample. The competence score is a net based on TRU_3D _[INSTITUTION] r1. Depending on the question it was either asked of the full of half the sample. General population, 25-mkt avg. Data not collected in China, Russia and Thailand. For full details regarding how this data was calculated and plotted, please see the Technical Appendix.
(-40, -19)
(-17, -7)
(-4, 12)
(14, -2)
Government
MediaBusiness
NGOs

21
-35
ETHICAL
35
UNETHICAL
- 50LESS COMPETENT 50 COMPETENT
(Competence score,* net ethical score)
ONLY BUSINESS SEEN AS COMPETENT
Business doing best at:
Generating value for owners 56
Being the engine of innovation 51
Driving economic prosperity 51
*This institution is good at what it does
(-40, -19)
(-17, -7)
(-4, 12)
(14, -2)
2020 Edelman Trust Barometer. The ethical scores are averages of nets based on [INSTITUTION]_PER_DIM r1-r4. Question asked of half of the sample. The competence score is a net based on TRU_3D _[INSTITUTION] r1. Depending on the question it was either asked of the full of half the sample. PER_GOV. How well do you feel government is currently doing each of the following? 5-point scale; top 2 box, doing well. Question asked of half of the sample. General population, 25-mkt avg. Data not collected in China, Russia and Thailand. For full details regarding how this data was calculated and plotted, please see the Technical Appendix.
Government
MediaBusiness
NGOs

22
-35
ETHICAL
35
UNETHICAL
- 50LESS COMPETENT 50 COMPETENT
(-40, -19)
(-17, -7)
(-4, 12)
(14, -2)
(Competence score, net ethical score*)
ONLY NGOS SEEN AS ETHICAL
*This institution…• Is purpose driven• Is honest• Has vision• Is fair
2020 Edelman Trust Barometer. The ethical scores are averages of nets based on [INSTITUTION]_PER_DIM r1-r4. Question asked of half the sample. The competence score is a net based on TRU_3D _[INSTITUTION] r1. Depending on the question it was either asked of the full of half the sample. PER_NGO. How well do you feel NGOs are currently doing each of the following? 5-point scale; top 2 box, doing well. Question asked of half the sample. General population, 25-mkt avg. Data not collected in China, Russia and Thailand. For full details regarding how this data was calculated and plotted, please see the Technical Appendix.
NGOs doing best at:
Protecting the environment 48
Civil and human rights 47
Poverty, illiteracy, disease 45
Government
MediaBusiness
NGOs

23
2020 Edelman Trust Barometer. Net scores represent positive responses minus negative responses to the following questions: [INSTITUTION]_PER_DIM. In thinking about why you do or do not trust [institution], please specify where you think they fall on the scale between the two opposing descriptions. 11-point scale; top 5 box, positive; bottom 5 box, negative. Question asked of half of the sample. General population, 25-mkt avg. Data not collected in China, Russia and Thailand.
Percent who cite each as a reason they trust or distrust each institution INSTITUTIONS SEEN AS UNFAIR
Serves the interests of only the few
Serves the interests of everyone equally and fairly
57 54 51
42
30 29 32
40
Government Business Media NGOs
-2- 25 - 19- 27
This institution…• Is purpose-driven• Is honest• Has vision• Is fair

24
Washington, August 2019
The Business Roundtable redefines the purpose of a corporation
Biarritz, August 2019
Business for Inclusive Growth (B4IG) coalition forms to address inequality and diversity
Dependability
15
Ability
24
Integrity
49
Purpose
12
Percent of predictable variance in trust explained by each dimension
ETHICAL DRIVERS 3X MORE IMPORTANT TO COMPANY TRUST THAN COMPETENCE
2019 Edelman Trust Management Tracking Study. U.S., U.K. and German general population data, collected between January and December of 2019, based on 40 major companies.
Competence
24%
New York, January 2020
BlackRock shifts investment strategy to focus on sustainability
New York, September 2019
Coalition of business, civil society and UN leaders pledge to set climate targets to 1.5°C
Ethics
76%

vBUSINESS:CATALYST FOR CHANGE

26
2020 Edelman Trust Barometer. PPL_RNK. Please rank the following four groups of people in terms of their importance to a company achieving long-term success. Give the most important group a rank of 1 and the least important a rank of 4. Stakeholders is a net of “Communities,” “Customers,” and “Employees”. TMA_SIE_SHV. Please indicate how much you agree or disagree with the following statements. 9-point scale; top 4 box, agree. Question asked of half of the sample. General population, 28-mkt avg.
Percent who ranked each group as most important
SERVE THE INTERESTS OF ALL STAKEHOLDERS
a company can take actions that both increase profits and improve conditions in communities where it operates
Stakeholders, not shareholders, are most important to long-term company success
13
12 37
38
Shareholders
CommunitiesEmployees
Customers
73%87%
Percent who agree

27
2020 Edelman Trust Barometer. CEO_ISS. How important is it to you that the CEO or head of the organization you work for speaks out publicly about each of the following issues? 9-point scale; top 4 box, important. Question asked of those who are an employee (Q43/1). Issues is a net of codes 1-7. General population, 28-mkt avg. CEO_AGR. Thinking about CEOs, how strongly do you agree or disagree with the following statement? 9-point scale; top 4 box, agree. Question asked of half of the sample. General population, 25-mkt avg.
Percent who agreeCEOS MUST LEAD
It is important that my employer’s CEO speak out on one or more of these issues
92%
Training for jobs of the future 84
Automation’s impact on jobs 81
Ethical use of tech 81
Income inequality 78
Diversity 77
Climate change 73
Immigration 62
CEOs should take the lead on change rather than waiting for government to impose it
74%
Change, 2018 to 2020
+9 pts
28
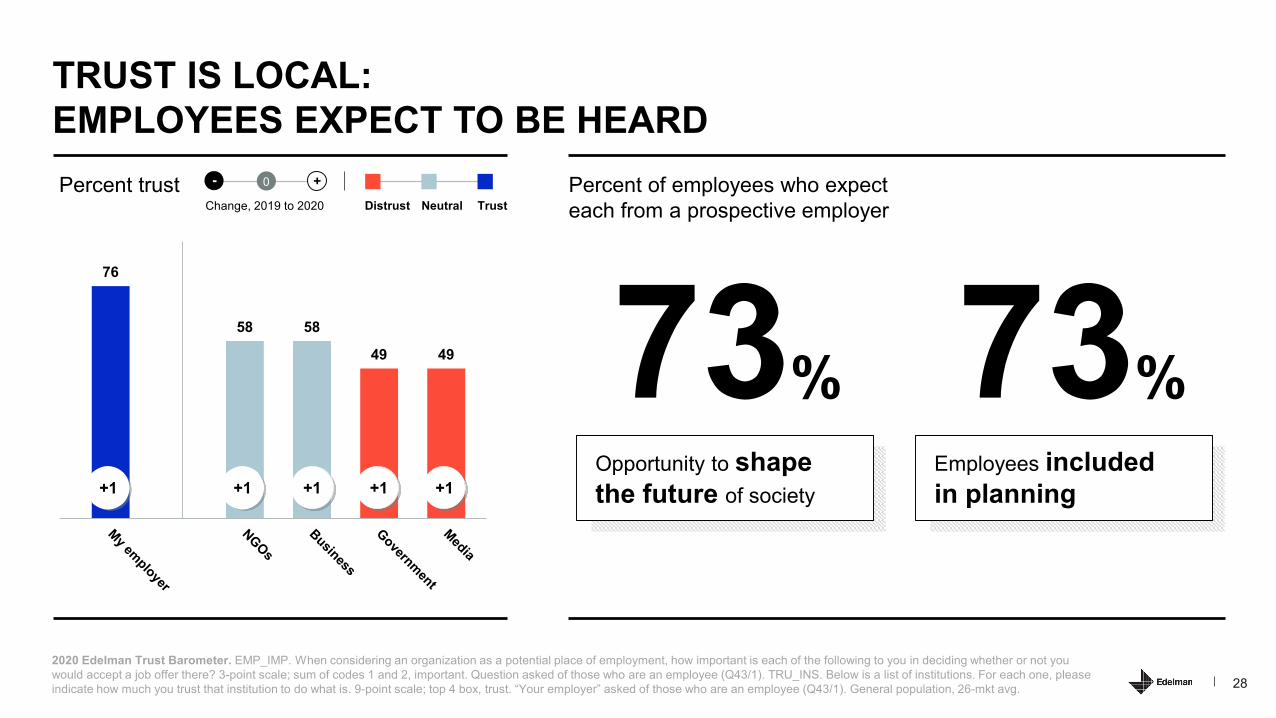
76
58 58
49 49
+1 +1 +1 +1 +1
2020 Edelman Trust Barometer. EMP_IMP. When considering an organization as a potential place of employment, how important is each of the following to you in deciding whether or not you would accept a job offer there? 3-point scale; sum of codes 1 and 2, important. Question asked of those who are an employee (Q43/1). TRU_INS. Below is a list of institutions. For each one, please indicate how much you trust that institution to do what is. 9-point scale; top 4 box, trust. “Your employer” asked of those who are an employee (Q43/1). General population, 26-mkt avg.
TRUST IS LOCAL:EMPLOYEES EXPECT TO BE HEARDPercent trust Percent of employees who expect
each from a prospective employer
Opportunity to shape the future of society
73%Employees included in planning
73%
Distrust Neutral TrustChange, 2019 to 2020
- 0
+

29
2017 2018 2019*
2018 Edelman Earned Brand. Belief-driven buying segments. 8-mkt avg. Belief-driven buyers choose, switch, avoid or boycott a brand based on its stand on societal issues.*2019 Edelman Trust Barometer Special Report: In Brands We Trust? Mobile Survey. Belief-driven buying segments. 8-mkt avg. See Technical Appendix for a detailed explanation of how the Belief-driven buying score was calculated.
Percent of customers who are belief-driven buyersCONSUMERS EXPECT BRANDS TO ACT
Belief-driven buyers:
• choose• switch• avoid• boycott
a brand based on its stand on societal issues
Brand Democracy
I believe brands can be a powerful force for change.
I expect them to represent me and solve societal problems.
My wallet is my vote.
51
64 64
+13
Change, 2017 to 2018- 0
+

302020 Edelman Trust Barometer. CMP_DUT. For each of the actions below, please indicate whether you believe that this is something that companies have a duty to do, but you do/do not trust that they will ever follow through and consistently do it. 3-point scale; sum of codes 2 and 3, have a duty; code 3, have a duty and are trusted. General population, 28-mkt avg.
Percent who agreeOVERCOME SKEPTICISM THROUGH ACTION
Business has a duty to do this I trust business will do this
31
30
82
79Retrain employees
affected by automation or innovation
Pay everyone a decent wage, even if that means
I must pay more
30
31
31
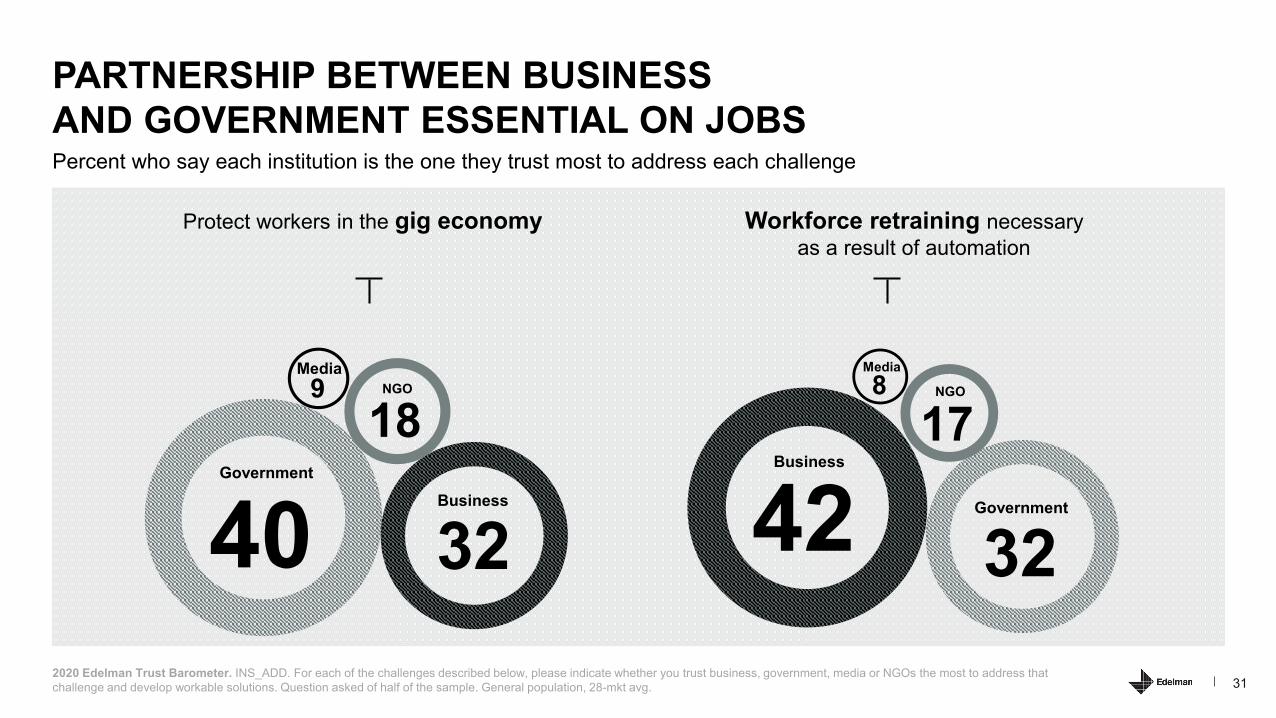
Percent who say each institution is the one they trust most to address each challenge
PARTNERSHIP BETWEEN BUSINESS AND GOVERNMENT ESSENTIAL ON JOBS
2020 Edelman Trust Barometer. INS_ADD. For each of the challenges described below, please indicate whether you trust business, government, media or NGOs the most to address that challenge and develop workable solutions. Question asked of half of the sample. General population, 28-mkt avg.
Workforce retraining necessary as a result of automation
Protect workers in the gig economy
40Government
32Business
9Media
18NGO
32Government
8Media
42Business
17NGO

32
59 58
48 49
72 75
6569
2020 Edelman Trust Barometer. Regression analysis. TRU_INS. Below is a list of institutions. For each one, please indicate how much you trust that institution to do what is right. 9-point scale; top 4 box, trust. PER_[INSTITUTION]. How well do you feel [institution] is currently doing each of the following? 5-point scale; top 2 box, doing well. Question asked of half of the sample. General population, 25-mkt avg. Data not collected in China, Russia and Thailand. For a full explanation of how this data was calculated, please see the Technical Appendix.
Percent who think each institution is doing well/very well on the issue, and the potential trust gains associated with doing each well
ADDRESSING GREATEST FAILURES GETS EVERY INSTITUTION TO TRUST
NGOs
Transparency about funding 35
Expose corruption 35
Avoid becoming politicized 35
Partner with government 38
Partner with business 38
Business
Partner with NGOs 33
Jobs that pay a decent wage 35
Partner with government 37
Deal fairly with suppliers 40
Contribute to communities 41
Government
Reduce partisanship 26
Partner with NGOs 30
Community-level problems 31
Social services for the poor 34
Partner with business 34
Media
Keep social media clean 34
Being objective 35
Information quality 38
Important vs sensationalized 38
Differentiate opinion and fact 39
+13 +17 +17 +20
Distrust Neutral Trust
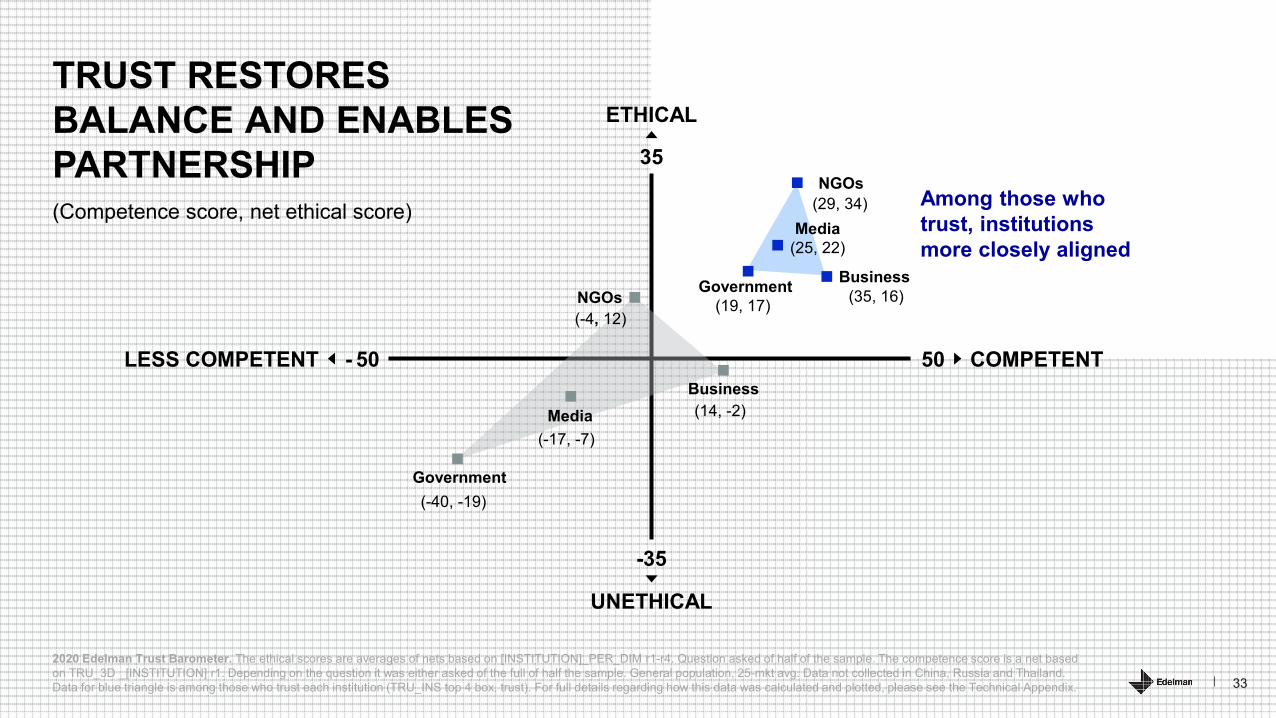
33
-35
ETHICAL
35
UNETHICAL
- 50LESS COMPETENT 50 COMPETENT
Government
MediaBusiness
NGOs
2020 Edelman Trust Barometer. The ethical scores are averages of nets based on [INSTITUTION]_PER_DIM r1-r4. Question asked of half of the sample. The competence score is a net based on TRU_3D _[INSTITUTION] r1. Depending on the question it was either asked of the full of half the sample. General population, 25-mkt avg. Data not collected in China, Russia and Thailand. Data for blue triangle is among those who trust each institution (TRU_INS top 4 box, trust). For full details regarding how this data was calculated and plotted, please see the Technical Appendix.
(Competence score, net ethical score)
TRUST RESTORES BALANCE AND ENABLES PARTNERSHIP
Among those who trust, institutions more closely aligned
Government
Media
Business
NGOs
(-40, -19)
(-17, -7)
(-4, 12)
(14, -2)
(19, 17)
(25, 22)
(29, 34)
(35, 16)

34
ETHICAL
35
50 COMPETENT
BUILDING TRUST FOR THE FUTURE
• Pay fair wages
• Focus on education and retraining
• Embrace an all-stakeholders model
• Partner across institutions
Government
Media
Business
NGOs
2020 Edelman Trust Barometer. For details regarding how this model of trusted institutions, please see the Technical Appendix.

SUPPLEMENTAL DATA

36
Supplemental Data
2020 Edelman Trust BarometerTABLE OF CONTENTS
1. Institutions: trust and performance
• NGOs
• Business
• Government
• Media
• Local vs central government
• The United Nations
• The European Union
• Performance
2. Trust in business in detail
3. Modeling trust
4. Trust and information
5. Societal issues
6. Employee expectations

Institutions: Trust and Performance

38
58
25
40 4348 49 50 50
54 54 54 55 57 58 59 59 59 61 64 64 65 65 66 68 69 72 73 7480
Percent trust in NGOs
TRUST IN NGOS INCREASES IN 16 OF 26 MARKETS
2020 Edelman Trust Barometer. TRU_INS. [NGOs in general] Below is a list of institutions. For each one, please indicate how much you trust that institution to do what is right. 9-point scale; top 4 box, trust. General population, 26-mkt avg.
Distrusted in5 markets
+1 +2 +2 -1 +1 +5 +3 -2 -2 +4 -12 -4 +4 +2 +2 -1 +3 -4 +1 -4 +3 +2 n/a 0 +4 n/a +1 0 +8
Distrust Neutral TrustChange, 2019 to 2020
- 0
+

39
58
35
45 45 47 48 48 49 50 50 50 52 52 5357 58 58
62 63 64 64 65 66 6872 73
79 82 82
Percent trust in business
TRUST IN BUSINESS INCREASES IN 15 OF 26 MARKETS
2020 Edelman Trust Barometer. TRU_INS. [Business in general] Below is a list of institutions. For each one, please indicate how much you trust that institution to do what is right. 9-point scale; top 4 box, trust. General population, 26-mkt avg.
Distrusted in 7 markets
+1 +1 0 +6 0 +1 +4 +5 0 +6 -4 +3 0 -3 +4 -2 0 +2 +2 +6 n/a -8 +1 -6 +1 n/a 0 +2 +5
Distrust Neutral TrustChange, 2019 to 2020
- 0
+

40
49
20
30 33 33 34 34 35 36 37 39 41 41 42 43 44 44 4550 51
58 59 60
7075 76 78 81
90
Percent trust in government
TRUST IN GOVERNMENT INCREASES IN 15 OF 26 MARKETS
2020 Edelman Trust Barometer. TRU_INS. [Government in general] Below is a list of institutions. For each one, please indicate how much you trust that institution to do what is right. 9-point scale; top 4 box, trust. General population, 26-mkt avg.
+1 -1 +4 -4 -1 +3 n/a +3 -6 +9 -1 +3 -2 -13 +4 +2 +10 +5 -3 +3 -2 +5 n/a +3 0 -6 +2 +7 +4
Distrusted in 17 markets
Distrust Neutral TrustChange, 2019 to 2020
- 0
+

41
311 11 9 8 8 6 6 6 5 4 4 3 2 2 2 2 1 1
-2 -3 -3 -4 -4 -5
2020 Edelman Trust Barometer. TRU_INS. [Central/federal government and your local/state government] Below is a list of institutions. For each one, please indicate how much you trust that institution to do what is right. 9-point scale; top 4 box, trust. General population, 24-mkt avg. Data not collected in China, Hong Kong, Russia and Thailand.
Percentage point gap between trust in local/state government and central/federal governmentMORE TRUST IN LOCAL GOVERNMENT
Local/State government
Central/Federal government
Distrust Neutral Trust
54 63 54 54 61 47 49 77 68 51 64 42 39 41 54 25 83 46 71 34 40 73 79 46 43
Local government more trusted in 18 out of 24 markets
51 52 43 45 53 39 43 71 62 46 60 38 36 39 52 23 81 45 70 36 43 76 83 50 48

42
49
2835 37 37 37 39 40 42 42 43 44 46 48 48 49 49 52 53 53 53 55 56 58 59
6469 73
80
Percent trust in media
TRUST IN MEDIA RISES, IN 16 OF 26 MARKETS
2020 Edelman Trust Barometer. TRU_INS. [Media in general] Below is a list of institutions. For each one, please indicate how much you trust that institution to do what is right. 9-point scale; top 4 box, trust. General population, 26-mkt avg.
+1 +2 -2 +1 +2 +2 -1 -1 +4 +6 +1 +3 -17 +4 0 +5 +4 -2 -4 +1 -7 -1 n/a +2 +6 n/a -1 +9 +4
Distrusted in 16 markets
Distrust Neutral TrustChange, 2019 to 2020
- 0
+

43
61
3944
48 50 51 52 54 55 56 57 58 58 58 60 61 62 62 63 65 65 67 70 73 7478 79
83 85
Percent trust in the United Nations
TRUST IN THE UNITED NATIONS INCREASES IN 11 OF 26 MARKETS
2020 Edelman Trust Barometer. TRU_INS. [United Nations] Below is a list of institutions. For each one, please indicate how much you trust that institution to do what is right. 9-point scale; top 4 box, trust. General population, 26-mkt avg.
Distrusted in3 markets
+1 +7 +5 +1 +2 -15 -2 -1 -1 0 +5 +7 +6 -2 -2 0 +4 -2 -1 -1 -5 -2 +2 0 n/a +2 n/a 0 +6
Distrust Neutral TrustChange, 2019 to 2020
- 0
+

44
54
28
39 41 42 44 45 46 47 47 48 51 54 54 54 5660 60 61 61 62 63 63 63 66 69
74 75 76
Percent trust in the European Union
TRUST IN THE EUROPEAN UNION INCREASES IN 14 OF 26 MARKETS
2020 Edelman Trust Barometer. TRU_INS. [The European Union] Below is a list of institutions. For each one, please indicate how much you trust that institution to do what is right. 9-point scale; top 4 box, trust. General population, 26-mkt avg.
Distrusted in 10 markets
+1 +4 -4 -1 +4 -1 +2 -4 +3 -1 -3 +2 +9 -14 +2 +7 +2 +4 +1 +5 -3 0 n/a -4 0 0 n/a +2 +7
Distrust Neutral TrustChange, 2019 to 2020
- 0
+

45
Strength > 50%
Weakness < 50%
2020 Edelman Trust Barometer. PER_[INSTITUTION]. How well do you feel [institution] is currently doing each of the following? 5-point scale; top 2 box, doing well. Question asked of half of the sample. General population, 25-mkt avg. Data not collected in China, Russia and Thailand.
Percent who think each institution is doing well/very well on the issueINSTITUTIONAL PERFORMANCE
Business
Generate value for owners 56
Engine of innovation 51
Drive economic prosperity 51
Meet customer expectations 47
Diversity in the workplace 42
Sustainable business practices 42
Invest in employee training 42
Contribute to communities 41
Deal fairly with suppliers 40
Partner with government 37
Jobs that pay a decent wage 35
Partner with NGOs 33
NGOs
Protect the environment 48
Protect civil and human rights 47
Poverty, illiteracy, disease 45
Educate people for good decisions 44
Community-level problems 43
Global-level problems 42
Set goals with regular public updates 40
Partner with business 38
Partner with government 38
Avoid becoming politicized 35
Expose corruption 35
Transparency about funding 35
Government
International alliances, defense 43
Safe and modern infrastructure 41
Maintain law and order 38
Protect civil and human rights 38
Balance national interests and
international engagement37
Education 37
Regulate emerging tech 37
Partner with business 34
Social services for the poor 34
Community-level problems 31
Partner with NGOs 30
Reduce partisanship 26
Media
Covering national news 61
Covering international news 57
Covering local news 57
Enough journalists 53
Information for good decisions 44
Let people be heard 43
Exposing corruption 42
Differentiate opinion and fact 39
Important vs sensationalized 38
Information quality 38
Being objective 35
Keep social media clean 34

Trust in Business in Detail

47
Percent trust in each sector
TRUST DECLINES ACROSS SECTORS, LED BY TECHNOLOGY AND ENTERTAINMENT
2020 Edelman Trust Barometer. TRU_IND. Please indicate how much you trust businesses in each of the following industries to do what is right. 9-point scale; top 4 box, trust. Industries shown to half of the sample. General population, 26-mkt avg.
5763 63 63 65 66 67 67 67 67 68 68 69 70
75
-1 -3 -3 -2 -4 -2 -3 -2 -1 -1 -3 -1 -1 -1 -4
Distrust Neutral TrustChange, 2019 to 2020
- 0
+

48
Industry 2012 2013 2014 2015 2016 2017 2018 2019 20208yr.
Trend
Technology 77 74 77 74 75 76 75 78 75
Automotive 63 66 70 67 61 66 62 69 67
Food and beverage 64 65 66 64 65 68 64 68 67
Healthcare - - - - 64 67 65 68 67
Telecommunications 59 62 62 60 61 64 64 67 65
Entertainment - 63 66 64 65 65 63 68 64
Energy 54 58 58 57 59 63 63 65 63
Consumer packaged goods 58 61 62 61 62 64 61 65 62
Financial services 44 48 49 49 53 55 55 57 56
-2
2020 Edelman Trust Barometer. TRU_IND. Please indicate how much you trust businesses in each of the following industries to do what is right. 9-point scale; top 4 box, trust. Industries shown to half of the sample. General population, 23-mkt avg.
Percent trust in each sectorINDUSTRY SECTORS OVER TIME
+3
n/a
n/a
+9
+4
+12
+4
+6
Distrust Neutral TrustChange, 2012 to 2020
- 0
+

49
3337 38 38
45 4752 52 53
5863 63 63
67 68 69 69
2020 Edelman Trust Barometer. TRU_NAT. Now we would like to focus on global companies headquartered in specific countries. Please indicate how much you trust global companies headquartered in the following countries to do what is right. 9-point scale; top 4 box, trust. Markets shown to half of the sample. General population, 26-mkt avg.
Trust in companies headquartered in each marketTRUST DECLINES FOR ALL COUNTRY BRANDS
-3 -4 -2 -2 n/a -2 -2 -3 -3 -4 -3 -1 -3 -2 -3 -1 -2
Distrust Neutral TrustChange, 2019 to 2020
- 0
+

502020 Edelman Trust Barometer. TRU_ORG. Thinking about different types of businesses, please indicate how much you trust each type of business to do what is right. 9-point scale; top 4 box, trust. Question asked of half of the sample. General population, 28-mkt avg.
Percent trust in each sectorFAMILY BUSINESS MOST TRUSTED
6760 58
52
Family owned Privately owned Public State owned
Distrust Neutral Trust

Modeling Trust

52
2020 Edelman Trust Barometer. Net scores represent positive responses minus negative responses to the following questions: [INSTITUTION]_PER_DIM. In thinking about why you do or do not trust [institution], please specify where you think they fall on the scale between the two opposing descriptions. 11-point scale; top 5 box, positive; bottom 5 box, negative. Question asked of half of the sample. General population, 25-mkt avg. Data not collected in China, Russia and Thailand.
Percent who cite each as a reason they trust or distrust each institution INSTITUTIONS SEEN AS LACKING HONESTY
52
4338
303338 38
49
Government Media Business NGOs
Corrupt and biased
Honest and fair
This institution…• Is purpose-driven• Is honest• Has vision• Is fair
19- 5 0- 19

53
Percent who cite each as a reason they trust or distrust each institution
INSTITUTIONS SEEN AS LACKING A VISIONAND PURPOSE FOR THE FUTURE
2020 Edelman Trust Barometer. Net scores represent positive responses minus negative responses to the following questions: [INSTITUTION]_PER_DIM. In thinking about why you do or do not trust [institution], please specify where you think they fall on the scale between the two opposing descriptions. 11-point scale; top 5 box, positive; bottom 5 box, negative. Question asked of half of the sample. General population, 25-mkt avg. Data not collected in China, Russia and Thailand.
50
43
36 3435 35
4145
Government NGOsMedia Business
-15
Does not have a vision for the future that I believe in
Has a vision for the future that I believe in
-8 5 11
47
3732
2934
4144
49
Government NGOsMedia Business
-13 4
Lacks purpose Is purpose-driven
12 20
This institution…• Is purpose-driven• Is honest• Has vision• Is fair

54
-35
ETHICAL
35
UNETHICAL
- 50LESS COMPETENT 50 COMPETENT
2020 Edelman Trust Barometer. The ethical scores are averages of nets based on [INSTITUTION]_PER_DIM r1-r4. Question asked of half of the sample. The competence score is a net based on TRU_3D _[INSTITUTION] r1. Depending on the question it was either asked of the full of half the sample. General population, by market. Data not collected in China, Russia and Thailand. For full details regarding how this data was calculated and plotted, please see the Technical Appendix.
(Competence score, net ethical score)
NGOS: COMPETENCE AND ETHICS ACROSS MARKETS
ARG
AUS
BRA
CAN
COL
FRA
GER H.K.
IND
IDN
IRLITA
JAP
KEN
MAS
MEX
KSASIN
RSA
KOR
ESP
NED
UAE
U.K.

55
-35
ETHICAL
35
UNETHICAL
- 50LESS COMPETENT 50 COMPETENT
2020 Edelman Trust Barometer. The ethical scores are averages of nets based on [INSTITUTION]_PER_DIM r1-r4. Question asked of half of the sample. The competence score is a net based on TRU_3D _[INSTITUTION] r1. Depending on the question it was either asked of the full of half the sample. General population, by market. Data not collected in China, Russia and Thailand. For full details regarding how this data was calculated and plotted, please see the Technical Appendix.
(Competence score, net ethical score)
BUSINESS: COMPETENCE AND ETHICS ACROSS MARKETS
ARG
AUS
BRA
CAN
COL
FRAGER
H.K.
IND
IDN
IRLITA
JAPKEN
MAS
MEX
KSASIN
RSAKOR
ESP
NED
UAE
U.K.
U.S.

56
-35
ETHICAL
35
UNETHICAL
- 50LESS COMPETENT 50 COMPETENT
AUSCAN
FRA
GER
IND
IDN
IRL JAP
MAS
SIN
KOR
NED
UAE
U.S.
2020 Edelman Trust Barometer. The ethical scores are averages of nets based on [INSTITUTION]_PER_DIM r1-r4. Question asked of half of the sample. The competence score is a net based on TRU_3D _[INSTITUTION] r1. Depending on the question it was either asked of the full of half the sample. General population, by market. Data not collected in China, Russia and Thailand. For full details regarding how this data was calculated and plotted, please see the Technical Appendix.
(Competence score, net ethical score)
GOVERNMENT: COMPETENCE AND ETHICS ACROSS MARKETS
X Y
RSA -103 -64 ESP -80 -38 ARG -74 -29 COL -69 -43 ITA -69 -43 KEN -69 -41 BRA -64 -40 U.K. -61 -31 HK -56 -29 MEX -52 -36
X Y
KSA 17 38

57
-35
ETHICAL
35
UNETHICAL
- 50LESS COMPETENT 50 COMPETENT
2020 Edelman Trust Barometer. The ethical scores are averages of nets based on [INSTITUTION]_PER_DIM r1-r4. Question asked of half of the sample. The competence score is a net based on TRU_3D _[INSTITUTION] r1. Depending on the question it was either asked of the full of half the sample. General population, by market. Data not collected in China, Russia and Thailand. For full details regarding how this data was calculated and plotted, please see the Technical Appendix.
(Competence score, net ethical score)
MEDIA: COMPETENCE AND ETHICS ACROSS MARKETS
ARG
AUSBRA
CAN
COL FRA
GERH.K.
INDIDN
IRL
ITA
KEN
MAS
MEX
KSA
SIN
RSA
KOR
ESP
NEDUAE
U.K.
U.S.
X Y
JAP -57 -23

Trust and Information

592020 Edelman Trust Barometer. COM_MCL. When looking for general news and information, how much would you trust each type of source for general news and information? 9-point scale; top 4 box, trust. Question asked of half of the sample. General population, 26-mkt avg and by region.
Percent who trust each source of newsCHAMPION RELIABLE SOURCES
6255 54
6471
60 63 61 60 59
46 4336
4857
41
29 29
4752
Global 26 EU U.S./Canada APACMEA LATAM
Change, 2019 to 2020- 0
+
Search Social mediaTraditional media Owned media
-4 -5 -4 -3 -3 -2 -2 -4 -7 -4 -6 -5 -4 -6 -5 -3 -4 -7 -3 -1
Global 26

60
2020 Edelman Trust Barometer. COM_MCL. When looking for general news and information, how much would you trust each type of source for general news and information? 9-point scale; top 4 box, trust. Question asked of half of the sample. General population, 23-mkt avg.*From 2012-2015, “Online Search Engines” were included as a media type. In 2016, this was changed to “Search Engines.”
Percent trust in each source for general news and informationTRADITIONAL MEDIA AND SEARCH ENGINES MOST TRUSTED
6360 62
58 5958
6365
6162
59
63 6364 65
61
65
61
42 4144 44
4744
41
49
4645
42
45 46
4542
40
4340
2012 2013 2014 2015 2016 2017 2018 2019 2020
Traditional media
Search engines*
Owned media
Social Media

61
72
4856
62 64 6468 69 69 70 71 72 73 74 75 75 75 76 76 76 77 77 77 78 78 78 80 82 85
2020 Edelman Trust Barometer. CMP_DUT. For each of the actions below, please indicate whether you believe that this is something that companies have a duty to do, but you do/do not trust that they will ever follow through and consistently do it. 3-point scale; sum of codes 2 and 3, have a duty. General population, 28-mkt avg.
Percent who agreeADVERTISERS HELD ACCOUNTABLE FOR FAKE NEWS
Companies should stop advertising with any media platformthat fails to prevent the spread of fake news and false information

62
2018 2019 2020
3450 50
22
26 26
4424 23
2020 Edelman Trust Barometer. News Engagement Scale, built from MED_SEG_OFT. How often do you engage in the following activities related to news and information? Indicate your answer using the 7-point scale below. General population, 25-mkt avg. For details on how the News Engagement Scale was built, please refer to the Technical Appendix.
How often do you engage in the following activities related to news and information?CONTINUED ENGAGEMENT WITH NEWS
62
THE DISENGAGEDConsume news less than weekly
AMPLIFIERSConsume news about weekly or more AND share or post content several times a month or more
CONSUMERSConsume news about weekly or more

63
68 6661
5447 47 47 44 44
36 33
2020 Edelman Trust Barometer. CRE_PPL. Below is a list of people. In general, when forming an opinion of a company, if you heard information about a company from each person, how credible would the information be—extremely credible, very credible, somewhat credible, or not credible at all. 4-point scale; top 2 box, credible. Spokespeople asked of half of the sample. General population, 26-mkt avg.
Percent who rate each source as very/extremely credibleEXPERTS AND PEERS MOST CREDIBLE
Company technical expert
Academic expert
A person like yourself
Regular employee
CEO Financial industryanalyst
Successful entrepreneur
Board of directors
NGO representative
Journalist Government official
+3 +3 0 +1 0 -6 -5 0 -4 -1 -2
Change, 2019 to 2020- 0
+

Societal Issues

65
57 5953 57 56 55 59 57
18-34 35-54 55+ Men Women BottomQuartile
MiddleQuartile
TopQuartile
Percent who agree
CAPITALISM IN QUESTION ACROSS GENERATIONS, GENDERS AND INCOME GROUPS
2020 Edelman Trust Barometer. TMA_SIE_SHV. Please indicate how much you agree or disagree with the following statements. 9-point scale; top 4 box, agree. Question asked of half of the sample. General population, 28-mkt avg, by age, gender and income.
Age Gender Income
Capitalism as it exists today does more harm than good in the world
56%

662020 Edelman Trust Barometer. TMA_SIE_SHV. Please indicate how much you agree or disagree with the following statements. 9-point scale; top 4 box, agree. Question asked of half of the sample. General population, 28-mkt avg.
Percent who agreeCAPITALISM IN QUESTION AROUND THE WORLD
Capitalism as it exists today does more harm than good in the world
75 7469 68 66 63 61 60 60 59 58 57 57 56 55 55 55 54 54 53 53 51
5650 47 47 46 45
35
Majority agree in 22 of 28 markets

672020 Edelman Trust Barometer. POP_EMO. Some people say they worry about many things while others say they have few concerns. We are interested in what you worry about. Specifically, how much do you worry about each of the following? 9-point scale; top 4 box, worried. General population, 28-mkt avg, among those who are employed (Q43/1).
Percent who are worried about losing their job due to each reasonJOB LOSS Highest job loss worry in each market
Second-highest job loss worry
Third-highest job loss worry
Gig-economy Looming recession Lack of training/skills Foreign competitors Immigration Automation Job moved abroadArgentina 61 65 57 55 54 51 46Australia 60 51 51 49 48 45 41Brazil 64 67 68 56 52 58 54Canada 56 49 50 42 43 45 36China 65 62 67 59 56 63 59Colombia 74 74 69 69 74 65 60France 65 54 54 51 52 55 49Germany 51 45 43 42 41 40 46Hong Kong 60 52 58 46 49 50 44India 82 80 81 79 80 77 77Indonesia 61 58 61 58 56 57 52Ireland 57 55 50 45 42 39 40Italy 60 64 55 57 53 51 70Japan 44 37 45 38 44 38 40Kenya 64 64 63 58 49 52 49Malaysia 70 71 67 73 71 69 61Mexico 71 71 67 64 59 60 59Russia 49 60 49 38 43 34 27Saudi Arabia 47 48 44 46 45 41 44Singapore 67 67 66 64 67 59 60S. Africa 61 70 63 53 55 51 45S. Korea 60 69 57 58 50 63 44Spain 68 66 65 62 58 57 58Thailand 68 76 67 66 67 65 60The Netherlands 49 34 38 36 38 35 29UAE 62 65 63 62 64 59 59U.K. 53 52 49 46 44 46 43U.S. 55 49 51 42 47 46 40

TECHNICALAPPENDIX
69
Edelman Trust Barometer 2020
TABLE OF CONTENTS
1. Methodology
2. Sample sizes and margin of error
3. Markets covered and languages used
4. How we measured belief in the system
5. How we plotted the institutional competence and ethics scores
6. How we measured the importance of competence and ethics in determining trust in a company
7. How we measured belief-driven buying
8. How we calculated the trust gains associated with improved institutional performance
Technical Appendix

70
20th ANNUAL EDELMAN TRUST BAROMETER
28-market global data margin of error: General population +/- 0.6% (N=32,200), informed public +/- 1.2% (N=6,200), mass population +/-0.6% (26,000+), half-sample global general online population +/-0.8% (N=16,100). Market-specific data margin of error: General population +/- 2.9% (N=1,150), informed public +/- 6.9% (N = min 200, varies by market), China and U.S. +/- 4.4% (N=500), mass population +/- 3.0% to 3.6% (N =min 736, varies by market).Gen Z MOE: 28-market = +/- 1.5% (N=4,310)Market-specific = +/- 5.3 to 10.5% (N=min 88, varies by market).
Methodology
2020 Gen Z oversample250 respondents age 18-24 per market
General Online Population
1,150respondents per market
Ages
18+All slides show general online population data unless otherwise noted
Online survey in 28 markets
34,000+ respondents total
All fieldwork was conducted between October 19 and November 18, 2019
Informed Public
Mass Population
500 respondents in U.S. and China;200 in all other markets
Represents 17% of total global population
Must meet 4 criteria
‣ Ages 25-64
‣ College-educated
‣ In top 25% of householdincome per age group in each market
‣ Report significant mediaconsumption and engagement in public policy and business news
All population not including informed public
Represents 83% of total global population

71
2020 EDELMAN TRUST BAROMETERSAMPLE SIZE, QUOTAS AND MARGIN OF ERROR
General Population Informed Public
Sample Size* Quotas Set On** Margin of Error Sample Size* Quotas Set On*** Margin of Error
Global 32,200 Age, Gender, Region +/- 0.6% total sample+/- 0.8% half sample 6200 Age, Education,
Gender, Income+/- 1.2% total sample+/- 1.8% split sample
China and U.S. 1,150 Age, Gender, Region +/- 2.9% total sample
+/- 4.1% half sample 500 Age, Education, Gender, Income
+/- 4.4% total sample+/- 6.2% split sample
All other markets 1,150 Age, Gender, Region +/- 2.9% total sample
+/- 4.1% half sample 200 Age, Education, Gender, Income
+/- 6.9% total sample+/- 9.8% split sample
Some questions were asked of only half of the sample. Please refer to the footnotes on each slide for details. In the U.K. and U.S. there were additional quotas on ethnicity.In the UAE and Saudi Arabia there were additional quotas on nationality.
***
***
NOTE: Questions that afforded respondents the opportunity to criticize their government were not asked in China, Russia and Thailand.

72
The Edelman Trust Barometer is an online survey. In developed markets, a nationally-representative online sample closely mirrors the general population. In markets with lower levels of internet penetration, a nationally-representative online sample will be more affluent, educated and urban than the general population.
2020 EDELMAN TRUST BAROMETER LANGUAGES AND INTERNET PENETRATION BY MARKET
Languages Internet Penetration*
Global - 59%
Argentina Localized Spanish 93%
Australia English 87%
Brazil Portuguese 71%
Canada English & French Canadian 93%
China Simplified Chinese 60%
Colombia Localized Spanish 63%
France French 92%
Germany German 96%
Hong Kong English & Traditional Chinese 89%
*Data source: http://www.internet worldstats.com/stats.htm
Languages Internet Penetration*
India English & Hindi 41%
Indonesia Indonesian 64%
Ireland English 92%
Italy Italian 93%
Kenya English & Swahili 90%
Japan Japanese 94%
Malaysia Malay 81%
Mexico Localized Spanish 65%
Russia Russian 81%
Saudi Arabia English & Arabic 93%
Languages Internet Penetration*
Singapore English & Simplified Chinese 88%
South Africa English & Afrikaans 56%
South Korea Korean 96%
Spain Spanish 93%
Thailand Thai 82%
The Netherlands English & Dutch 96%
UAE English & Arabic 98%
U.K. English 95%
U.S. English 89%

73
2020 EDELMAN TRUST BAROMETER HOW WE MEASURED BELIEF IN THE SYSTEM
Sense of Injustice Items
“The elites who run our institutions are out of touch with regular people” POP_MDCr8
“The elites who run our institutions are indifferent to the will of the people” POP_MDCr1
“As regular people struggle just to pay their bills, the elites are getting richer than they deserve” POP_MDCr2
“The system is biased against regular people and in favor of the rich and powerful” POP_MDCr3
Lack of Hope Items
“My hard work will be rewarded” (reverse scored) POP_MDCr18
“My children will have a better life than I do” (reverse scored) POP_MDCr19
“The country is moving in the right direction” (reverse scored) POP_MDCr20
Lack of Confidence Items
“I do not have confidence that our current leaders will be able to address our country’s challenges” POP_MDCr10
Desire for Change Items
“We need forceful reformers in positions of power to bring about much-needed change” POP_MDCr9
Respondents were asked: For each one, please rate how trueyou believe that statement is using
a nine-point scale where one means it is “not at all true” and nine means it is “completely true”.
Four dimensions were examined to determine whether or not respondents believe the system is failing them: 1) A sense of injustice stemming from the perception that society’s elites have
co-opted the system to their own advantage at the expense of regular people, 2) A lack of hope that the future will be better for you and your family, 3) A lack of confidence in the leaders of societal institutions to solve the
country’s problems, and 4) A desire for forceful reformers in positions of power that are capable of
bring about much-needed change.
Overall scores were calculated by taking the average of the nine item scores.
Respondents were categorized into one of three segments based their mean score:
• Those who averaged 6.00 or higher believe the system is failing them
• Those who averaged between 5.00 and 5.99 were labelled as uncertain
• Those who averaged less than 5.00 believe the system is working
74
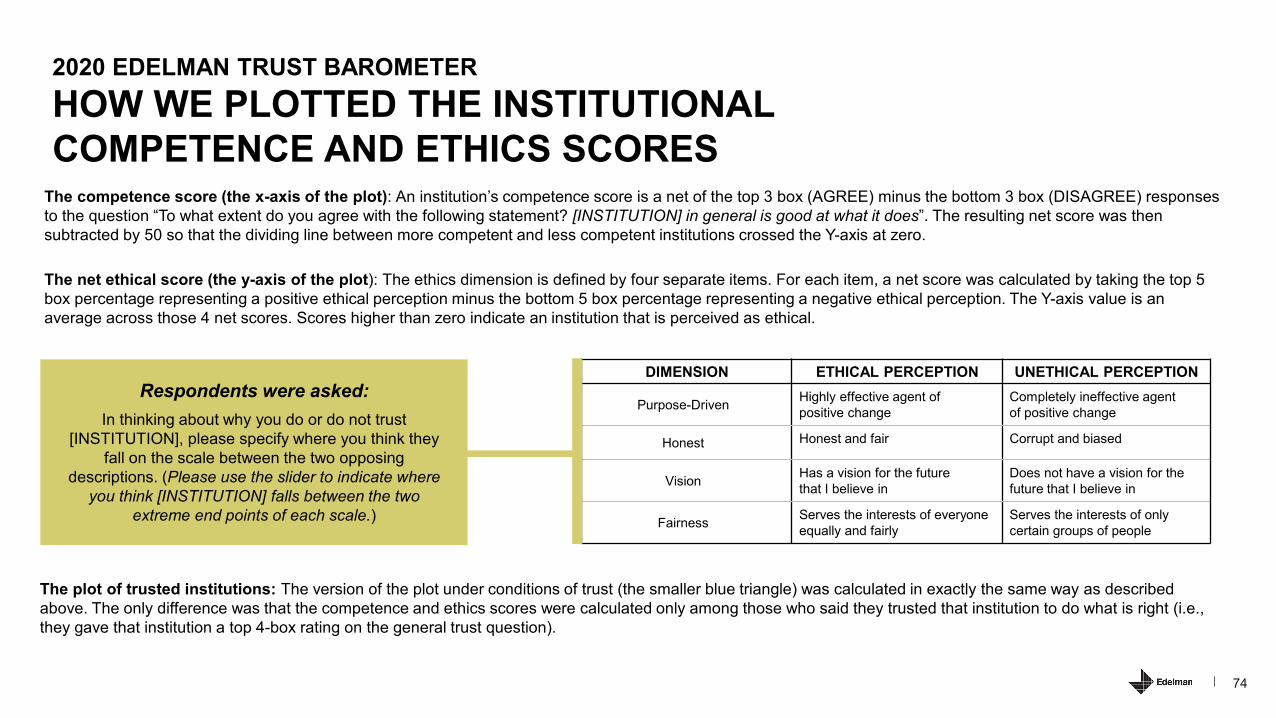
2020 EDELMAN TRUST BAROMETERHOW WE PLOTTED THE INSTITUTIONAL COMPETENCE AND ETHICS SCORES
The competence score (the x-axis of the plot): An institution’s competence score is a net of the top 3 box (AGREE) minus the bottom 3 box (DISAGREE) responses to the question “To what extent do you agree with the following statement? [INSTITUTION] in general is good at what it does”. The resulting net score was then subtracted by 50 so that the dividing line between more competent and less competent institutions crossed the Y-axis at zero.
The net ethical score (the y-axis of the plot): The ethics dimension is defined by four separate items. For each item, a net score was calculated by taking the top 5 box percentage representing a positive ethical perception minus the bottom 5 box percentage representing a negative ethical perception. The Y-axis value is an average across those 4 net scores. Scores higher than zero indicate an institution that is perceived as ethical.
Respondents were asked: In thinking about why you do or do not trust
[INSTITUTION], please specify where you think they fall on the scale between the two opposing
descriptions. (Please use the slider to indicate where you think [INSTITUTION] falls between the two
extreme end points of each scale.)
DIMENSION ETHICAL PERCEPTION UNETHICAL PERCEPTION
Purpose-Driven Highly effective agent of positive change
Completely ineffective agent of positive change
Honest Honest and fair Corrupt and biased
Vision Has a vision for the future that I believe in
Does not have a vision for the future that I believe in
Fairness Serves the interests of everyone equally and fairly
Serves the interests of only certain groups of people
The plot of trusted institutions: The version of the plot under conditions of trust (the smaller blue triangle) was calculated in exactly the same way as described above. The only difference was that the competence and ethics scores were calculated only among those who said they trusted that institution to do what is right (i.e., they gave that institution a top 4-box rating on the general trust question).

75
EDELMAN TRUST MANAGEMENT HOW WE MEASURED THE IMPORTANCE OF COMPETENCE AND ETHICS IN DETERMINING TRUST IN A COMPANY
COMPETENCE DIMENSION:
ABILITY: [COMPANY] is good at what it does
ETHICS DIMENSION:
INTEGRITY: [COMPANY] is honest
DEPENDABILITY: [COMPANY] keeps its promises
PURPOSE: [COMPANY] is trying hard to have a positive impact on society
Respondents were asked: Please indicate to what extent you agree or disagree with the following statements using a nine-point scale where one means it is “disagree strongly” and nine means it is “agree strongly”.
The data used was collected across the 12 monthly waves of the 2019 Edelman Trust Management brand tracking study conducted in Germany, the U.K. and the U.S among 23,000+ respondents. For this analysis, we looked at 40 global companies that were common across all three markets. For each company, respondents were asked whether they trusted it or not to do what is right. They were then asked to evaluate each company across the four trust subdimensions – ability, integrity, dependability and purpose. Ability defined the competence dimension while integrity, dependability and purpose were rolled up to define the ethics dimension.An ANOVA was performed to measure the proportion of the variance in company trust each of the four subdimensions explained. The data shown on the slide represents the percentage of the total variance explained by all four subdimensions together accounted for by each of the individual subdimensions separately.

76
2019 EDELMAN TRUST BAROMETER SPECIAL REPORT: IN BRANDS WE TRUSTHOW WE MEASURED BELIEF-DRIVEN BUYING
• Even if a company makes the product that I like most, I will not buy it if I disagree with the company’s stand on important social issues
• I have bought a brand for the first time for the sole reason that I appreciated its position on a controversial societal or political issue
• I have stopped buying one brand and started buying another because I liked the politics of one more than the other
• I have strong opinions about many societal and political issues. The brands I choose to buy and not buy are one important way I express those opinions
• If a brand offers the best price on a product, I will buy it even if I disagree with the company’s stand on controversial social or political issues [reversed scored]
• I have stopped buying a brand solely because it remained silent on a controversial societal or political issue that I believed it had an obligation to publicly address
Respondents were asked: Please indicate how much you agree or disagree with the following statements using a nine-point scale where one means it is “disagreestrongly” and nine means it is “agree strongly”.
We classified respondents into three belief-driven buyer segments based on their responses to the scale questions: 1) Leaders: Have strongly-held, passionate beliefs. The brands they buy are one
important way they express those beliefs.
2) Joiners: Depending on the issue and the brand, they will change their buying behavior based on the brand’s stand.
3) Spectators: Rarely buy on belief or punish brands that take a stand.
Respondents were categorized into one of the three segments based their overall mean score across the six scale items:
• Those who averaged 6.00 or higher were categorized as Leaders
• Those who averaged between 5.00 and 5.99 were categorized as Joiners
• Those who averaged less than 5.00 were categorized as Spectators

77
2020 EDELMAN TRUST BAROMETER HOW WE CALCULATED THE TRUSTGAINS ASSOCIATED WITH IMPROVEDPERFORMANCE
Example List of Business Behaviors
1. Driving the economic prosperity of our country
2. Being an engine of innovation and scientific advancement
3. Ensuring that there are plenty of good job opportunities available that pay a decent wage
4. Contributing to the improvement of the communities in which they do business
5. Fostering diversity, inclusion, dignity and mutual respect in the workplace
6. Meeting and exceeding their customers’ expectations
7. Investing in their employees’ professional development, including offering training and education that helps them develop new skills for a rapidly changing world
8. Forging strong working partnerships with government to develop solutions to our country’s problems
9. Forging strong working partnerships with NGOs to develop solutions to our country’s problems
10. Dealing fairly and ethically with their partners and suppliers
11. Generating long-term financial benefits and value for their owners and shareholders
12. Embracing sustainable practices across their business
Respondents were asked: How well do you feel [INST] is
currently doing each of the following? Please indicate your answer using the 5-point scale
below where 1 means the institution is “failing at this” and 5 means the institution is “doing this very well”
Respondents were asked to evaluate the performance of each of the four institutions against 12 expectations. These performance scores were then used to predict trust in the institution using a regression analysis. The results of regression allowed us to identify the percentage point lift in trust associated with the institution doing each individual behavior well or very well.Next, we looked at the percentage of respondents who currently rate an institution as doing a given behavior well, identifying the five behaviors each of the institutions scored the lowest on.
For each of these five behaviors that the regression determined were significant predictors of trust, we subtracted the percentage of people who currently felt the institution was doing them well from 100%. This gave us a measure of the unrealized potential for performance gain. That percentage was then multiplied by the percentage point lift in trust associated with every respondent rating the institution as doing that behavior well. This yielded an unrealized trust gain for that behavior. These unrealized trust gains were added up across the five behaviors to yield an overall trust gain associated with the institution successfully addressing its five biggest challenges.

2020 EDELMAN TRUST BAROMETER TEAM
Edelman Intellectual Property
Executive Director Tonia E. [email protected]
Executive Advisors Richard EdelmanStephen KehoeEd Williams
Executive Editor Joseph Tropiano
VP of Operations Sarah Adkins
Sr. Project Manager Esther Choi
Project Manager Alina Krikunova
Executive Creative Producer David Isaacs
Edelman Intelligence
Head of Thought Leadership Research David M. Bersoff, [email protected]
Sr. Research Manager Cody Armstrong
Statistician Joshua Wu
Research Coordinators Nick MaxwellGiuseppe Bovenzi
Assoc. Research Coordinator Abbey Fox
Assoc. Data Processor John Zamites