CAFR.2016.CityofBoston · CAFR.2016.CityofBoston Created Date: 20161229144 ...

Inv
estm
en
t
State Plant ♦ State Hat
Report on Investment Activity
TMRS Comprehensive Annual Financial Report 201958
RVKInc.com
Portland · Boise · New York · Chicago
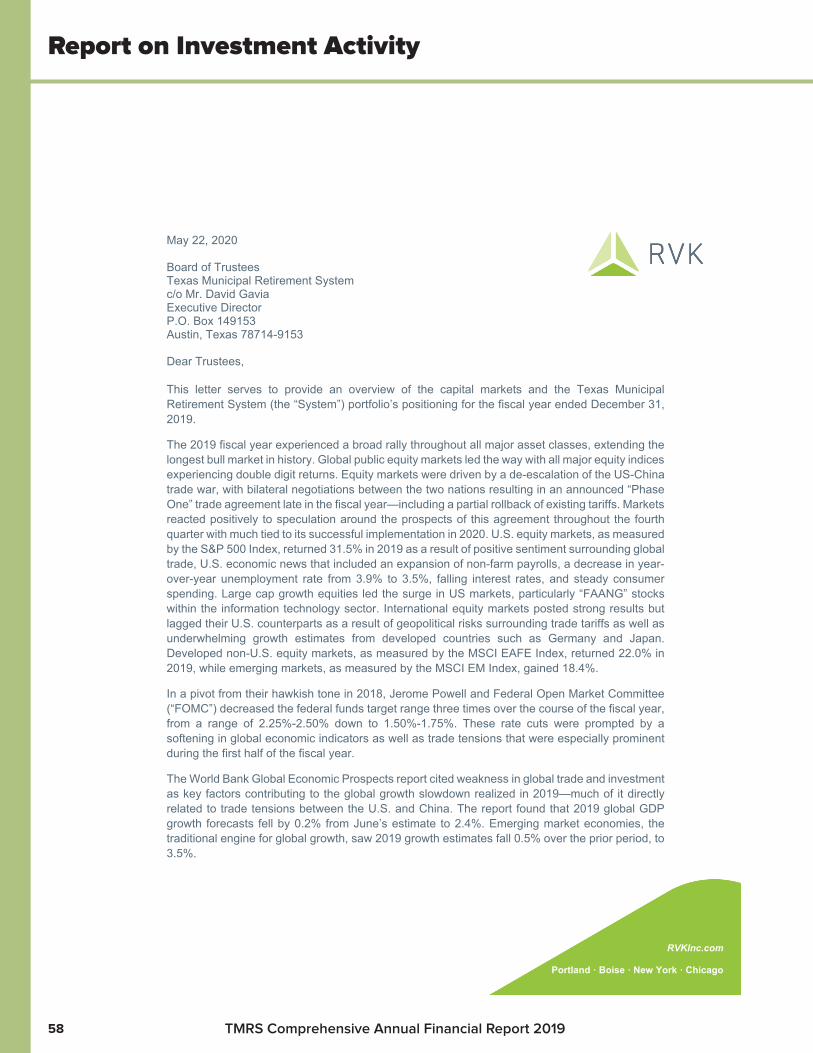
May 22, 2020 Board of Trustees Texas Municipal Retirement System c/o Mr. David Gavia Executive Director P.O. Box 149153 Austin, Texas 78714-9153 Dear Trustees, This letter serves to provide an overview of the capital markets and the Texas Municipal Retirement System (the “System”) portfolio’s positioning for the fiscal year ended December 31, 2019.
The 2019 fiscal year experienced a broad rally throughout all major asset classes, extending the longest bull market in history. Global public equity markets led the way with all major equity indices experiencing double digit returns. Equity markets were driven by a de-escalation of the US-China trade war, with bilateral negotiations between the two nations resulting in an announced “Phase One” trade agreement late in the fiscal year—including a partial rollback of existing tariffs. Markets reacted positively to speculation around the prospects of this agreement throughout the fourth quarter with much tied to its successful implementation in 2020. U.S. equity markets, as measured by the S&P 500 Index, returned 31.5% in 2019 as a result of positive sentiment surrounding global trade, U.S. economic news that included an expansion of non-farm payrolls, a decrease in year-over-year unemployment rate from 3.9% to 3.5%, falling interest rates, and steady consumer spending. Large cap growth equities led the surge in US markets, particularly “FAANG” stocks within the information technology sector. International equity markets posted strong results but lagged their U.S. counterparts as a result of geopolitical risks surrounding trade tariffs as well as underwhelming growth estimates from developed countries such as Germany and Japan. Developed non-U.S. equity markets, as measured by the MSCI EAFE Index, returned 22.0% in 2019, while emerging markets, as measured by the MSCI EM Index, gained 18.4%.
In a pivot from their hawkish tone in 2018, Jerome Powell and Federal Open Market Committee (“FOMC”) decreased the federal funds target range three times over the course of the fiscal year, from a range of 2.25%-2.50% down to 1.50%-1.75%. These rate cuts were prompted by a softening in global economic indicators as well as trade tensions that were especially prominent during the first half of the fiscal year.
The World Bank Global Economic Prospects report cited weakness in global trade and investment as key factors contributing to the global growth slowdown realized in 2019—much of it directly related to trade tensions between the U.S. and China. The report found that 2019 global GDP growth forecasts fell by 0.2% from June’s estimate to 2.4%. Emerging market economies, the traditional engine for global growth, saw 2019 growth estimates fall 0.5% over the prior period, to 3.5%.

Continued
Report on Investment Activity
TMRS Comprehensive Annual Financial Report 2019 59
RVK · 2
Multiple rate cuts during the first three quarters of the fiscal year provided strong tailwinds for U.S. bond markets as the Bloomberg U.S. Aggregate Bond Index returned 8.7%. Both investment grade and high yield corporate credit outperformed the broad index. Internationally, the Bloomberg Global Aggregate Index gained 6.8% during the year. Emerging markets debt outperformed the broad index, primarily a result of the risk-on sentiment throughout most of 2019. The price of oil increased from $45 a barrel to $61 a barrel during the year, leading the Bloomberg Commodity Index to return 7.7%. Private real estate assets measured by the NCREIF ODCE Index (Gross) returned 5.3% in 2019. However, they were outperformed by public U.S. REITs as measured by the Wilshire U.S. REIT Index, which returned 25.8%.
The market value of the System’s investments increased from $27.59 billion to $31.45 billion in the year ended December 31, 2019. The System’s current actuarial assumed rate of return is 6.75%, which represents the System’s long-term return goal. The System’s overall net of fees investment return over the past year was 14.7% while the System’s three-year annualized return was 8.4%. The five-year annualized return for the System was 6.4% and the System’s ten-year annualized return was 6.9%.
At the end of the fiscal year 2019, all asset classes were within their target ranges as outlined within the System’s Investment Policy Statement.
During the fiscal year, the Board conducted an Asset/Liability Study, Asset Allocation Study, made several changes to the manager lineup, and initiated a review of their governance practices with the assistance of Staff, the Board’s consultants, and the System’s actuary (GRS). Following the Asset/Liability and Asset Allocation Studies, the Board adopted a new target allocation, which reduced the public equity allocation and increased the private equity allocation. Staff, the Board, and RVK will continue to monitor the portfolio, recommending changes aimed at improving potential return and/or diversification as deemed necessary.
The System’s investment policies, goals, and objectives, as well as the performance of its assets and transaction costs are regularly monitored by Staff, the Board, and by RVK. These evaluations include analysis of the investment management firms and the custodial bank that serve the System.
The System’s publicly traded assets managed through separate accounts are held in custody at State Street Bank, with the majority of equity investments held at Northern Trust through commingled vehicles. Private fund assets are held by their respective general partners. Market values and returns referenced above are based upon statements prepared by State Street Bank. Their statements are, to the best of our knowledge, reliable and accurate. Investment performance is calculated using a time-weighted rate of return methodology (gross of fees) based upon market values and cash flows.
RVK · 3
We look forward to continuing to work with Staff and the Board to monitor, review, and best position the System’s portfolio to meet its long-term goals and objective.
Sincerely,
Rebecca Gratsinger Chief Executive Officer RVK, Inc.
Outline of Investment Policies
TMRS Comprehensive Annual Financial Report 201960
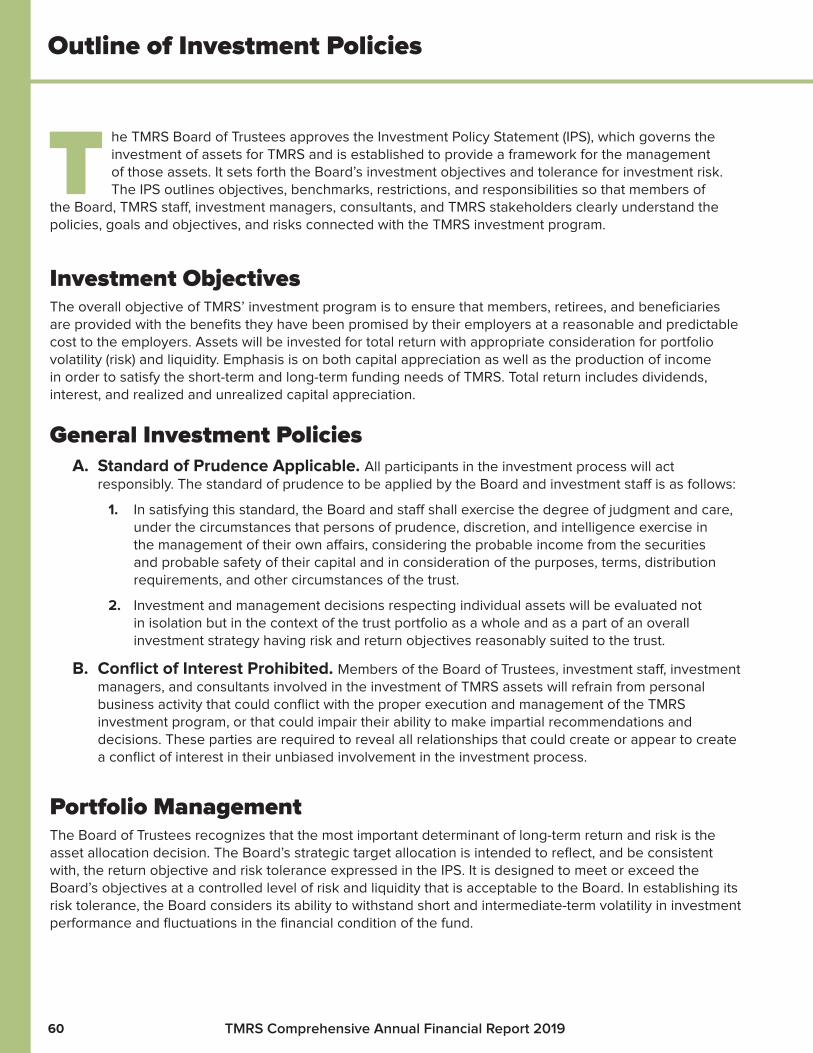
The TMRS Board of Trustees approves the Investment Policy Statement (IPS), which governs the investment of assets for TMRS and is established to provide a framework for the management of those assets. It sets forth the Board’s investment objectives and tolerance for investment risk. The IPS outlines objectives, benchmarks, restrictions, and responsibilities so that members of
the Board, TMRS staff, investment managers, consultants, and TMRS stakeholders clearly understand the policies, goals and objectives, and risks connected with the TMRS investment program.
Investment ObjectivesThe overall objective of TMRS’ investment program is to ensure that members, retirees, and beneficiaries are provided with the benefits they have been promised by their employers at a reasonable and predictable cost to the employers. Assets will be invested for total return with appropriate consideration for portfolio volatility (risk) and liquidity. Emphasis is on both capital appreciation as well as the production of income in order to satisfy the short-term and long-term funding needs of TMRS. Total return includes dividends, interest, and realized and unrealized capital appreciation.
General Investment PoliciesA. Standard of Prudence Applicable. All participants in the investment process will act
responsibly. The standard of prudence to be applied by the Board and investment staff is as follows:
1. In satisfying this standard, the Board and staff shall exercise the degree of judgment and care, under the circumstances that persons of prudence, discretion, and intelligence exercise in the management of their own affairs, considering the probable income from the securities and probable safety of their capital and in consideration of the purposes, terms, distribution requirements, and other circumstances of the trust.
2. Investment and management decisions respecting individual assets will be evaluated not in isolation but in the context of the trust portfolio as a whole and as a part of an overall investment strategy having risk and return objectives reasonably suited to the trust.
B. Conflict of Interest Prohibited. Members of the Board of Trustees, investment staff, investment managers, and consultants involved in the investment of TMRS assets will refrain from personal business activity that could conflict with the proper execution and management of the TMRS investment program, or that could impair their ability to make impartial recommendations and decisions. These parties are required to reveal all relationships that could create or appear to create a conflict of interest in their unbiased involvement in the investment process.
Portfolio ManagementThe Board of Trustees recognizes that the most important determinant of long-term return and risk is the asset allocation decision. The Board’s strategic target allocation is intended to reflect, and be consistent with, the return objective and risk tolerance expressed in the IPS. It is designed to meet or exceed the Board’s objectives at a controlled level of risk and liquidity that is acceptable to the Board. In establishing its risk tolerance, the Board considers its ability to withstand short and intermediate-term volatility in investment performance and fluctuations in the financial condition of the fund.
Continued
Outline of Investment Policies
TMRS Comprehensive Annual Financial Report 2019 61
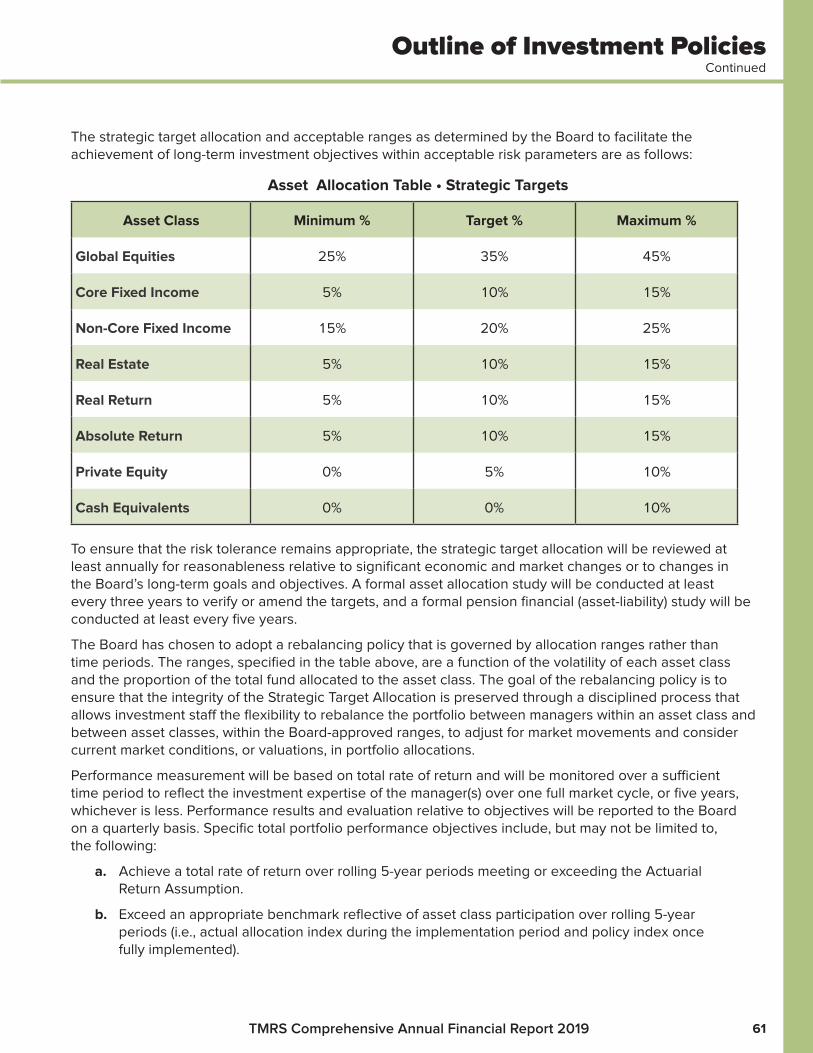
The strategic target allocation and acceptable ranges as determined by the Board to facilitate the achievement of long-term investment objectives within acceptable risk parameters are as follows:
Asset Allocation Table • Strategic Targets
Asset Class Minimum % Target % Maximum %
Global Equities 25% 35% 45%
Core Fixed Income 5% 10% 15%
Non-Core Fixed Income 15% 20% 25%
Real Estate 5% 10% 15%
Real Return 5% 10% 15%
Absolute Return 5% 10% 15%
Private Equity 0% 5% 10%
Cash Equivalents 0% 0% 10%
To ensure that the risk tolerance remains appropriate, the strategic target allocation will be reviewed at least annually for reasonableness relative to significant economic and market changes or to changes in the Board’s long-term goals and objectives. A formal asset allocation study will be conducted at least every three years to verify or amend the targets, and a formal pension financial (asset-liability) study will be conducted at least every five years.
The Board has chosen to adopt a rebalancing policy that is governed by allocation ranges rather than time periods. The ranges, specified in the table above, are a function of the volatility of each asset class and the proportion of the total fund allocated to the asset class. The goal of the rebalancing policy is to ensure that the integrity of the Strategic Target Allocation is preserved through a disciplined process that allows investment staff the flexibility to rebalance the portfolio between managers within an asset class and between asset classes, within the Board-approved ranges, to adjust for market movements and consider current market conditions, or valuations, in portfolio allocations.
Performance measurement will be based on total rate of return and will be monitored over a sufficient time period to reflect the investment expertise of the manager(s) over one full market cycle, or five years, whichever is less. Performance results and evaluation relative to objectives will be reported to the Board on a quarterly basis. Specific total portfolio performance objectives include, but may not be limited to, the following:
a. Achieve a total rate of return over rolling 5-year periods meeting or exceeding the Actuarial Return Assumption.
b. Exceed an appropriate benchmark reflective of asset class participation over rolling 5-year periods (i.e., actual allocation index during the implementation period and policy index once fully implemented).
Continued
Outline of Investment Policies
TMRS Comprehensive Annual Financial Report 201962
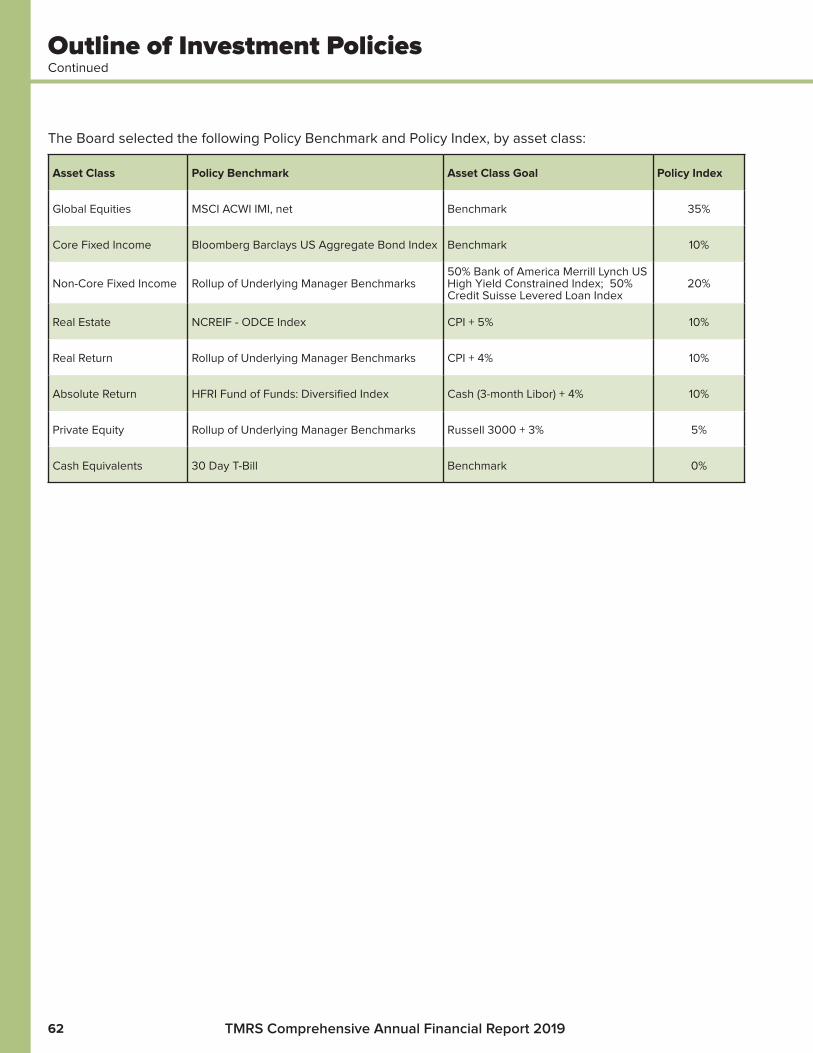
The Board selected the following Policy Benchmark and Policy Index, by asset class:
Asset Class Policy Benchmark Asset Class Goal Policy Index
Global Equities MSCI ACWI IMI, net Benchmark 35%
Core Fixed Income Bloomberg Barclays US Aggregate Bond Index Benchmark 10%
Non-Core Fixed Income Rollup of Underlying Manager Benchmarks50% Bank of America Merrill Lynch US High Yield Constrained Index; 50% Credit Suisse Levered Loan Index
20%
Real Estate NCREIF - ODCE Index CPI + 5% 10%
Real Return Rollup of Underlying Manager Benchmarks CPI + 4% 10%
Absolute Return HFRI Fund of Funds: Diversified Index Cash (3-month Libor) + 4% 10%
Private Equity Rollup of Underlying Manager Benchmarks Russell 3000 + 3% 5%
Cash Equivalents 30 Day T-Bill Benchmark 0%
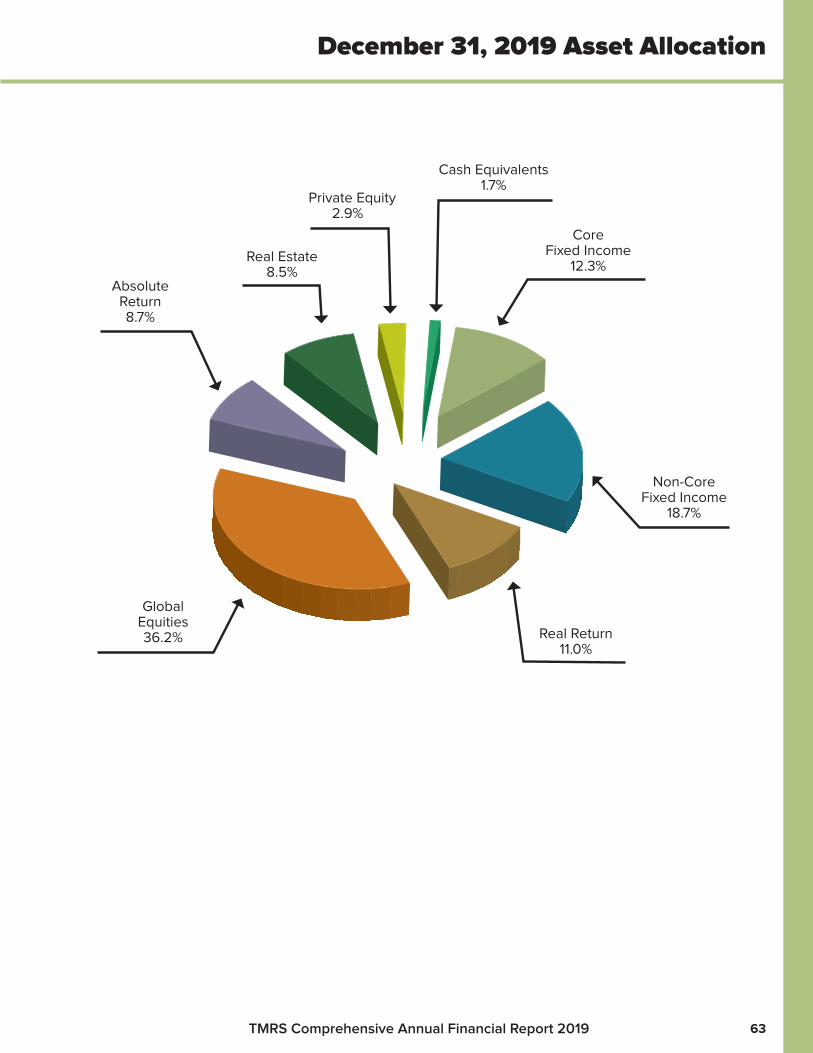
Core Fixed Income
12.3%Real Estate
8.5%
Global Equities36.2% Real Return
11.0%
Non-Core Fixed Income
18.7%
Absolute Return8.7%
Cash Equivalents1.7%
Private Equity2.9%
December 31, 2019 Asset Allocation
TMRS Comprehensive Annual Financial Report 2019 63

Summary of Investments
As of December 31, 2019
Fair ValuePercent of Total
Fair Value
Cash Equivalents
Short-term investments $ 549,127,635 1.7 %
Total Cash Equivalents 549,127,635 1.7
Core Fixed Income
Short-term investments 243,632,837 0.8
Fixed-income securities 3,661,764,547 11.5
Total Core Fixed Income 3,905,397,384 12.3
Non-Core Fixed Income
Short-term investments 31,689,108 0.1
Fixed-income securities 1,285,568,727 4.0
Non-core fixed income funds 4,641,597,864 14.6
Total Non-Core Fixed Income 5,958,855,699 18.7
Real Return
Short-term investments 20,642,636 0.1
Fixed-income securities 843,102,200 2.6
Equity securities 882,560,835 2.8
Real return funds 1,759,145,232 5.5
Total Real Return 3,505,450,903 11.0
Global Equities
Short-term investment funds 57,695,364 0.2
Equity securities 2,405,481,612 7.5
Commingled funds 9,073,212,797 28.5
Total Global Equities 11,536,389,773 36.2
Absolute Return
Direct hedge funds 16,423,780 0.1
Hedge fund-of-funds 2,748,824,660 8.6
Total Absolute Return 2,765,248,440 8.7
Real Estate
Private real estate funds 2,713,951,673 8.5
Total Real Estate 2,713,951,673 8.5
Private Equity
Private equity funds 936,779,828 2.9
Total Private Equity 936,779,828 2.9
TOTAL $ 31,871,201,335 100.0 %
Note: The table at left presents the investment values by asset class, and is therefore not consistent with the categorization on the Statement of Fiduciary Net Position.
TMRS Comprehensive Annual Financial Report 201964
Largest Holdings (by Fair Value)
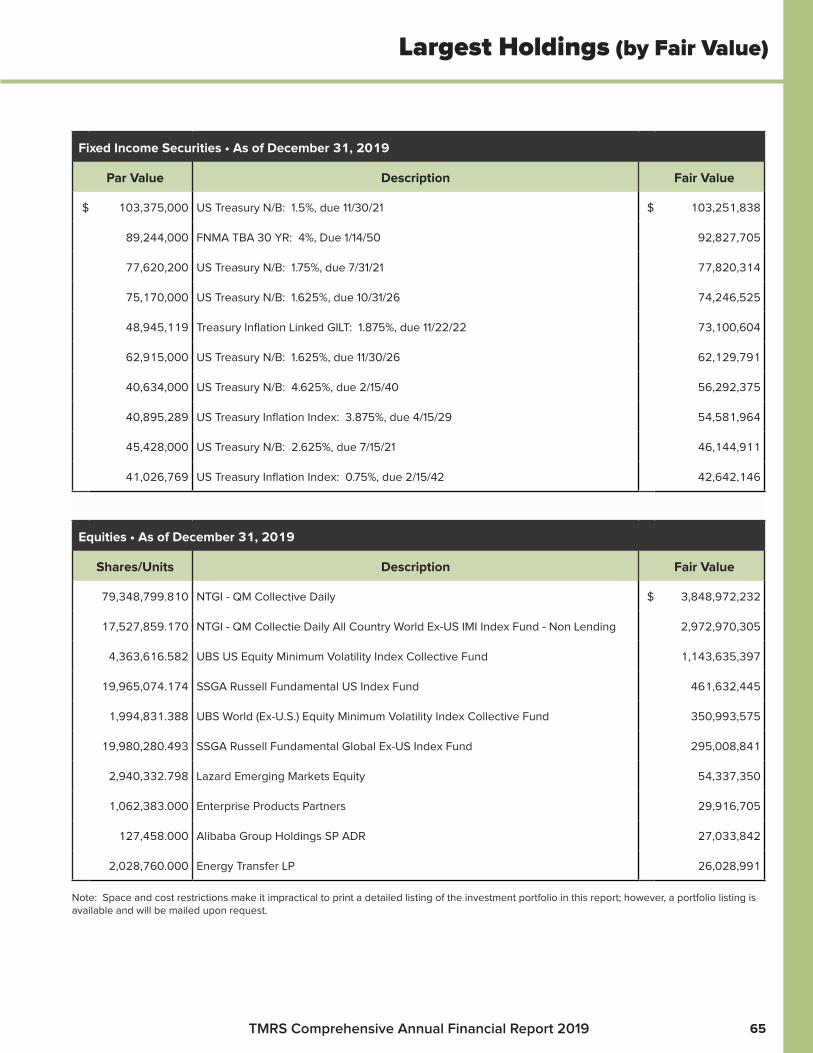
Fixed Income Securities • As of December 31, 2019
Par Value Description Fair Value
$ 103,375,000 US Treasury N/B: 1.5%, due 11/30/21 $ 103,251,838
89,244,000 FNMA TBA 30 YR: 4%, Due 1/14/50 92,827,705
77,620,200 US Treasury N/B: 1.75%, due 7/31/21 77,820,314
75,170,000 US Treasury N/B: 1.625%, due 10/31/26 74,246,525
48,945,119 Treasury Inflation Linked GILT: 1.875%, due 11/22/22 73,100,604
62,915,000 US Treasury N/B: 1.625%, due 11/30/26 62,129,791
40,634,000 US Treasury N/B: 4.625%, due 2/15/40 56,292,375
40,895,289 US Treasury Inflation Index: 3.875%, due 4/15/29 54,581,964
45,428,000 US Treasury N/B: 2.625%, due 7/15/21 46,144,911
41,026,769 US Treasury Inflation Index: 0.75%, due 2/15/42 42,642,146
Equities • As of December 31, 2019
Shares/Units Description Fair Value
79,348,799.810 NTGI - QM Collective Daily $ 3,848,972,232
17,527,859.170 NTGI - QM Collectie Daily All Country World Ex-US IMI Index Fund - Non Lending 2,972,970,305
4,363,616.582 UBS US Equity Minimum Volatility Index Collective Fund 1,143,635,397
19,965,074.174 SSGA Russell Fundamental US Index Fund 461,632,445
1,994,831.388 UBS World (Ex-U.S.) Equity Minimum Volatility Index Collective Fund 350,993,575
19,980,280.493 SSGA Russell Fundamental Global Ex-US Index Fund 295,008,841
2,940,332.798 Lazard Emerging Markets Equity 54,337,350
1,062,383.000 Enterprise Products Partners 29,916,705
127,458.000 Alibaba Group Holdings SP ADR 27,033,842
2,028,760.000 Energy Transfer LP 26,028,991
Note: Space and cost restrictions make it impractical to print a detailed listing of the investment portfolio in this report; however, a portfolio listing is available and will be mailed upon request.
TMRS Comprehensive Annual Financial Report 2019 65
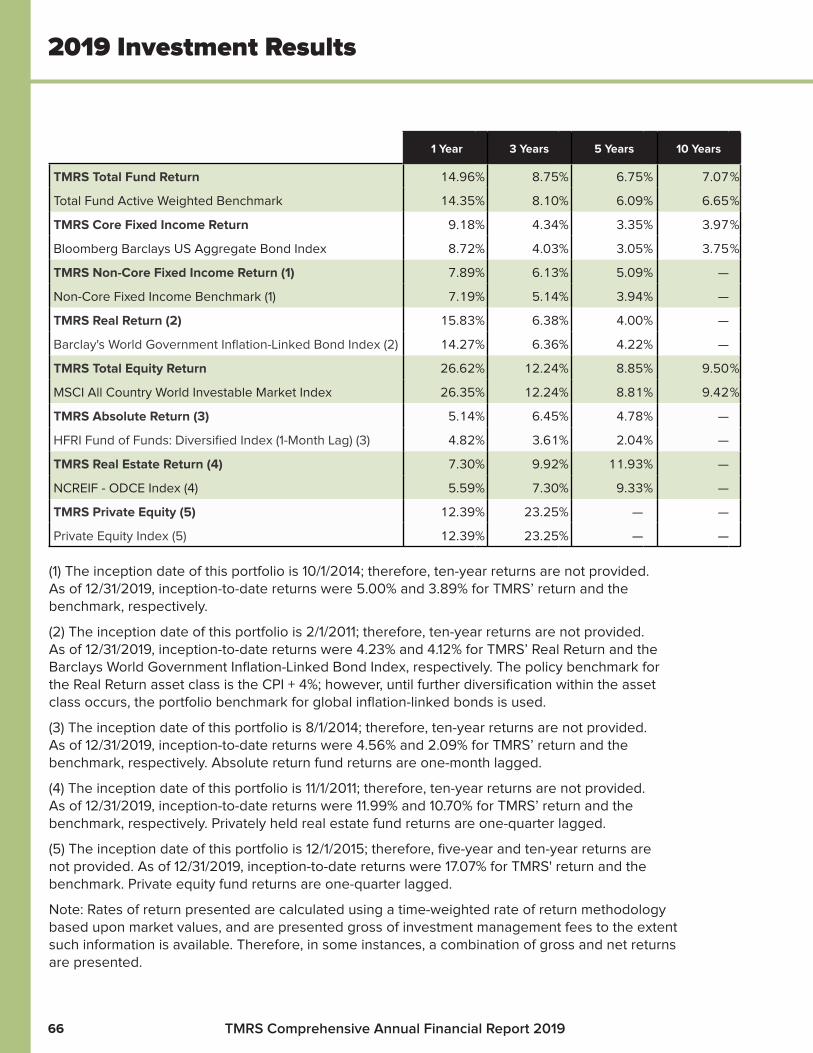
2019 Investment Results
1 Year 3 Years 5 Years 10 Years
TMRS Total Fund Return 14.96 % 8.75 % 6.75 % 7.07 %
Total Fund Active Weighted Benchmark 14.35 % 8.10 % 6.09 % 6.65 %
TMRS Core Fixed Income Return 9.18 % 4.34 % 3.35 % 3.97 %
Bloomberg Barclays US Aggregate Bond Index 8.72 % 4.03 % 3.05 % 3.75 %
TMRS Non-Core Fixed Income Return (1) 7.89 % 6.13 % 5.09 % —
Non-Core Fixed Income Benchmark (1) 7.19 % 5.14 % 3.94 % —
TMRS Real Return (2) 15.83 % 6.38 % 4.00 % —
Barclay's World Government Inflation-Linked Bond Index (2) 14.27 % 6.36 % 4.22 % —
TMRS Total Equity Return 26.62 % 12.24 % 8.85 % 9.50 %
MSCI All Country World Investable Market Index 26.35 % 12.24 % 8.81 % 9.42 %
TMRS Absolute Return (3) 5.14 % 6.45 % 4.78 % —
HFRI Fund of Funds: Diversified Index (1-Month Lag) (3) 4.82 % 3.61 % 2.04 % —
TMRS Real Estate Return (4) 7.30 % 9.92 % 11.93 % —
NCREIF - ODCE Index (4) 5.59 % 7.30 % 9.33 % —
TMRS Private Equity (5) 12.39% 23.25 % — —
Private Equity Index (5) 12.39 % 23.25 % — —
(1) The inception date of this portfolio is 10/1/2014; therefore, ten-year returns are not provided. As of 12/31/2019, inception-to-date returns were 5.00% and 3.89% for TMRS’ return and the benchmark, respectively.
(2) The inception date of this portfolio is 2/1/2011; therefore, ten-year returns are not provided. As of 12/31/2019, inception-to-date returns were 4.23% and 4.12% for TMRS’ Real Return and the Barclays World Government Inflation-Linked Bond Index, respectively. The policy benchmark for the Real Return asset class is the CPI + 4%; however, until further diversification within the asset class occurs, the portfolio benchmark for global inflation-linked bonds is used.
(3) The inception date of this portfolio is 8/1/2014; therefore, ten-year returns are not provided. As of 12/31/2019, inception-to-date returns were 4.56% and 2.09% for TMRS’ return and the benchmark, respectively. Absolute return fund returns are one-month lagged.
(4) The inception date of this portfolio is 11/1/2011; therefore, ten-year returns are not provided. As of 12/31/2019, inception-to-date returns were 11.99% and 10.70% for TMRS’ return and the benchmark, respectively. Privately held real estate fund returns are one-quarter lagged.
(5) The inception date of this portfolio is 12/1/2015; therefore, five-year and ten-year returns are not provided. As of 12/31/2019, inception-to-date returns were 17.07% for TMRS' return and the benchmark. Private equity fund returns are one-quarter lagged.
Note: Rates of return presented are calculated using a time-weighted rate of return methodology based upon market values, and are presented gross of investment management fees to the extent such information is available. Therefore, in some instances, a combination of gross and net returns are presented.
TMRS Comprehensive Annual Financial Report 201966
Continued
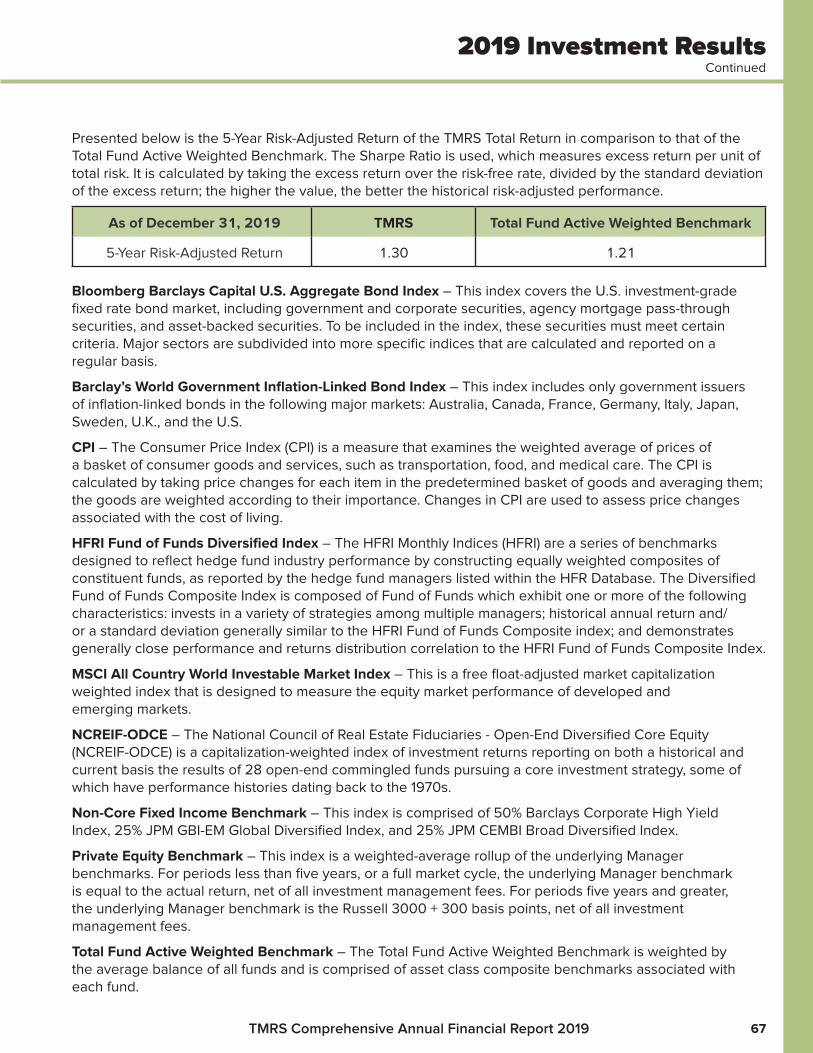
2019 Investment Results
Presented below is the 5-Year Risk-Adjusted Return of the TMRS Total Return in comparison to that of the Total Fund Active Weighted Benchmark. The Sharpe Ratio is used, which measures excess return per unit of total risk. It is calculated by taking the excess return over the risk-free rate, divided by the standard deviation of the excess return; the higher the value, the better the historical risk-adjusted performance.
As of December 31, 2019 TMRS Total Fund Active Weighted Benchmark
5-Year Risk-Adjusted Return 1.30 1.21
Bloomberg Barclays Capital U.S. Aggregate Bond Index – This index covers the U.S. investment-grade fixed rate bond market, including government and corporate securities, agency mortgage pass-through securities, and asset-backed securities. To be included in the index, these securities must meet certain criteria. Major sectors are subdivided into more specific indices that are calculated and reported on a regular basis.
Barclay’s World Government Inflation-Linked Bond Index – This index includes only government issuers of inflation-linked bonds in the following major markets: Australia, Canada, France, Germany, Italy, Japan, Sweden, U.K., and the U.S.
CPI – The Consumer Price Index (CPI) is a measure that examines the weighted average of prices of a basket of consumer goods and services, such as transportation, food, and medical care. The CPI is calculated by taking price changes for each item in the predetermined basket of goods and averaging them; the goods are weighted according to their importance. Changes in CPI are used to assess price changes associated with the cost of living.
HFRI Fund of Funds Diversified Index – The HFRI Monthly Indices (HFRI) are a series of benchmarks designed to reflect hedge fund industry performance by constructing equally weighted composites of constituent funds, as reported by the hedge fund managers listed within the HFR Database. The Diversified Fund of Funds Composite Index is composed of Fund of Funds which exhibit one or more of the following characteristics: invests in a variety of strategies among multiple managers; historical annual return and/or a standard deviation generally similar to the HFRI Fund of Funds Composite index; and demonstrates generally close performance and returns distribution correlation to the HFRI Fund of Funds Composite Index.
MSCI All Country World Investable Market Index – This is a free float-adjusted market capitalization weighted index that is designed to measure the equity market performance of developed and emerging markets.
NCREIF-ODCE – The National Council of Real Estate Fiduciaries - Open-End Diversified Core Equity (NCREIF-ODCE) is a capitalization-weighted index of investment returns reporting on both a historical and current basis the results of 28 open-end commingled funds pursuing a core investment strategy, some of which have performance histories dating back to the 1970s.
Non-Core Fixed Income Benchmark – This index is comprised of 50% Barclays Corporate High Yield Index, 25% JPM GBI-EM Global Diversified Index, and 25% JPM CEMBI Broad Diversified Index.
Private Equity Benchmark – This index is a weighted-average rollup of the underlying Manager benchmarks. For periods less than five years, or a full market cycle, the underlying Manager benchmark is equal to the actual return, net of all investment management fees. For periods five years and greater, the underlying Manager benchmark is the Russell 3000 + 300 basis points, net of all investment management fees.
Total Fund Active Weighted Benchmark – The Total Fund Active Weighted Benchmark is weighted by the average balance of all funds and is comprised of asset class composite benchmarks associated with each fund.
TMRS Comprehensive Annual Financial Report 2019 67
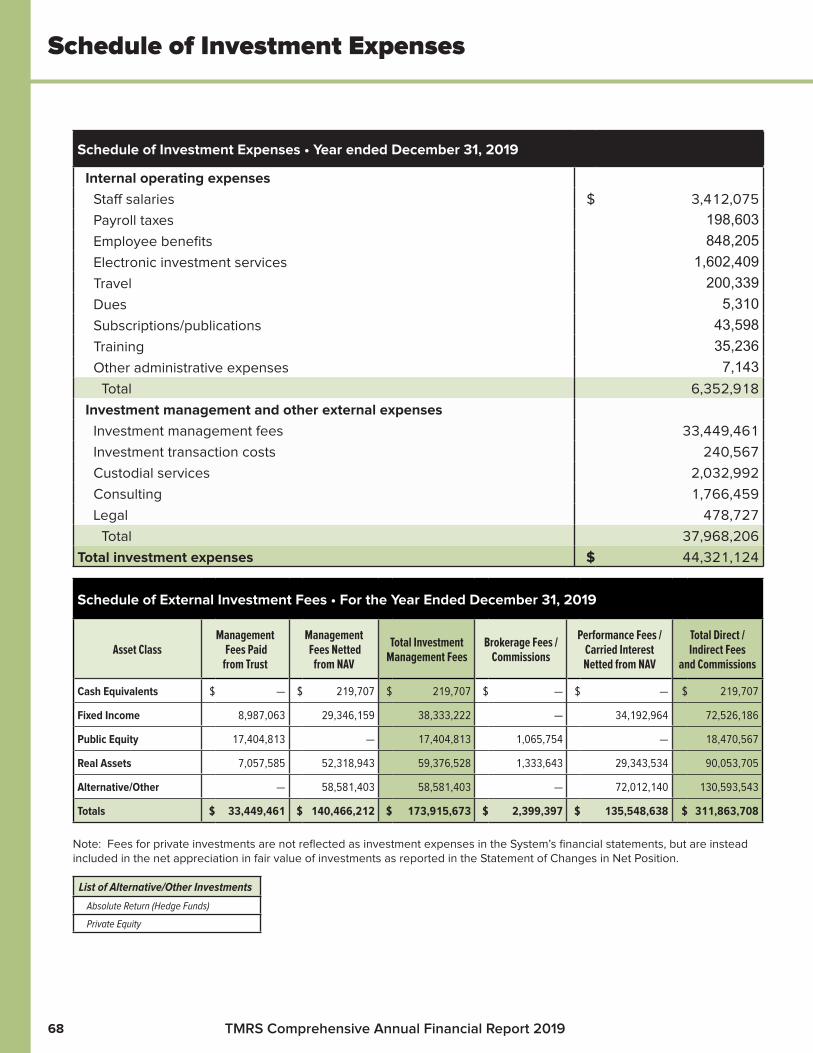
Schedule of Investment Expenses
Schedule of Investment Expenses • Year ended December 31, 2019
Internal operating expenses
Staff salaries $ 3,412,075
Payroll taxes 198,603Employee benefits 848,205Electronic investment services 1,602,409Travel 200,339Dues 5,310Subscriptions/publications 43,598Training 35,236Other administrative expenses 7,143
Total 6,352,918
Investment management and other external expenses
Investment management fees 33,449,461
Investment transaction costs 240,567
Custodial services 2,032,992
Consulting 1,766,459
Legal 478,727
Total 37,968,206
Total investment expenses $ 44,321,124
Schedule of External Investment Fees • For the Year Ended December 31, 2019
Asset ClassManagement
Fees Paid from Trust
Management Fees Netted
from NAV
Total Investment Management Fees
Brokerage Fees / Commissions
Performance Fees / Carried Interest Netted from NAV
Total Direct / Indirect Fees
and Commissions
Cash Equivalents $ — $ 219,707 $ 219,707 $ — $ — $ 219,707
Fixed Income 8,987,063 29,346,159 38,333,222 — 34,192,964 72,526,186
Public Equity 17,404,813 — 17,404,813 1,065,754 — 18,470,567
Real Assets 7,057,585 52,318,943 59,376,528 1,333,643 29,343,534 90,053,705
Alternative/Other — 58,581,403 58,581,403 — 72,012,140 130,593,543
Totals $ 33,449,461 $ 140,466,212 $ 173,915,673 $ 2,399,397 $ 135,548,638 $ 311,863,708
Note: Fees for private investments are not reflected as investment expenses in the System’s financial statements, but are instead included in the net appreciation in fair value of investments as reported in the Statement of Changes in Net Position.
List of Alternative/Other Investments
Absolute Return (Hedge Funds)
Private Equity
TMRS Comprehensive Annual Financial Report 201968