2019 Annual Report on Results and Impact of IFAD Operations Annual... · KWAMP Kirehe...
152
2019 ANNUAL REPORT ON RESULTS AND IMPACT OF IFAD OPERATIONS Independent Office of Evaluation 2019 ARRI
Transcript of 2019 Annual Report on Results and Impact of IFAD Operations Annual... · KWAMP Kirehe...
2019 ANNUAL REPORT ON RESULTS AND IMPACT OF IFAD OPERATIONS
Independent Of�ce of Evaluation
2019 ARRI

2019 ANNUAL REPORT ON RESULTS AND IMPACT OF IFAD OPERATIONS
2019 ARRI
© 2019 by the International Fund for Agricultural Development (IFAD)
The designations employed and the presentation of material in this
publication do not imply the expression of any opinion whatsoever
on the part of IFAD concerning the legal status of any country,
territory, city or area or of its authorities, or concerning the delimitation
of its frontiers or boundaries. The designations ‘developed’ and
‘developing’ countries are intended for statistical convenience and do
not necessarily express a judgement about the stage reached by a
particular country or area in the development process.
All rights reserved.
ISBN 978-92-9072-945-7
Printed on FSC paper
by Quintily, Rome, Italy
October 2019
Cover photo
Colombia: Indigenous Peoples Assistance Facility grant
Mercy Vera, the local leader of the Asociación para el Futuro con
Manos de Mujer (ASFUMUJER) for the community of Cocana,
performs a traditional Pijao agricultural dance, carrying corn kernels
in a clay pot.
©IFAD/Michael Benanav
3
Contents 3
Abbreviations and acronyms 4
Acknowledgements 6
Foreword 7
Executive summary 9
1 Overview 21
Background 21
Context of the 2019 ARRI 23
Overall portfolio performance from 2007 to 2017 24
Trends in portfolio performance 25
Benchmarking the performance of IFAD-financed projects 27
2 Project portfolio trends 2007‑2017 35
Rural poverty impact 35
Project performance criteria 39
Other performance criteria 49
Overall project achievement 60
Performance of partners 61
3 Country strategy and programme performance 2006‑2018 67
Performance of non-lending activities 67
Country strategies 76
4 IFAD performance by replenishment 79
Bigger 79
Smarter 84
Better 86
5 Learning theme on relevance of IFAD project interventions 91
Background 91
Defining and rating relevance 91
Main findings 95
Lessons 99
Way forward 105
6 Conclusions and recommendations 107
Conclusions 107
Recommendations 109
Contents
Annexes1 Project evaluation and country strategy and
programme evaluation methodology 113
2 Definitions of the evaluation criteria used by IOE 115
3 List of country strategy and programme evaluations completed and published by IOE (1992-2018) 117
4 Evaluations included in the 2019 ARRI 119
5 2019 ARRI methodology and analyses 125
6 Project performance by IFAD replenishment period (2001-2018) 133
7 Comparison of IOE’s PPE ratings and IFAD’s Programme Management Department’s PCR ratings 140
8 Analysis of performance by region 141
9 Response of IFAD Management to the 2019 Annual Report on Results and Impact of IFAD Operations 143
Appendices*
1 Detailed project performance by IFAD replenishment period (2001-2018)
2 Project performance ratings based on the all evaluation data series (2001-2017)
3 Objectives of country programmes and individual projects evaluated
4 Number of projects per each rating in the PCRV/PPE series (2007-2016)
5 Analysis of disconnect between PCR and IOE ratings
Issues paper*
Issues paper on learning theme: Relevance of IFAD project interventions
* Available online at www.ifad.org/evaluation/reports/arri
4
AD2M Project to Support Development in the Menabe and Melaky Regions
(Madagascar)
AfDB African Development Bank
APR Asia and the Pacific Division (IFAD)
ARRI Annual Report on Results and Impact of IFAD Operations
ASAP Adaptation for Smallholder Agriculture Programme
AsDB Asian Development Bank
COSOP country strategic opportunities programme
CPM country programme manager
CSPE country strategy and programme evaluation
DO development objective
ENRM environment and natural resources management
ESA East and Southern Africa Division (IFAD)
FAO Food and Agriculture Organization of the United Nations
FFS Farmer Field School
GEWE gender equality and women’s empowerment
GRIPS Grants and Investment Projects System
IE impact evaluation
IFAD5 Fifth Replenishment of IFAD’s Resources
IFI international financial institution
IOE Independent Office of Evaluation of IFAD
KM knowledge management
KWAMP Kirehe Community-based Watershed Management Project (Rwanda)
LAC Latin America and the Caribbean Division (IFAD)
LIC low-income country
M&E monitoring and evaluation
MIC middle-income country
MOSAP Market Oriented Smallholder Agriculture Project (Angola)
MTR mid-term review
NEN Near East, North Africa and Europe Division (IFAD)
NERCORMP North Eastern Region Community Resource Management Project for
Upland Areas (India)
OECD Organisation for Economic Co-operation and Development
OECD-DAC OECD Development Assistance Committee
PAFA Agricultural Value Chains Support Project (Senegal)
PCA principal component analysis
PCR project completion report
PCRV project completion report validation
PMD Programme Management Department (IFAD)
Abbreviations and acronyms
5
PMU project management unit
PoLG programme of loans and grants
PoW programme of work
PPE project performance evaluation
PROCAVAL Inclusion of Small-scale Producers in Value Chains and Market Access
Project (Nicaragua)
PRODER 3 Rural Development Project in the Likouala, Pool and Sangha Departments
(Congo)
QA Quality Assurance
QAG Quality Assurance Group
RMF Results Measurement Framework
RTIMP Root and Tuber Improvement and Marketing Programme (Ghana)
SDG Sustainable Development Goal
SIS supervision and implementation support
TNSP Agriculture, Farmers and Rural Areas Support Project (Viet Nam)
UNDP United Nations Development Programme
WCA West and Central Africa Division (IFAD)
6
The 2019 Annual Report on Results and
Impact of IFAD Operations (ARRI) was
prepared by Chitra Deshpande, Senior
Evaluation Officer, Independent Office of
Evaluation of IFAD (IOE), under the supervision
of Fabrizio Felloni, Deputy Director, IOE. They
were supported in IOE by Valentina Di Marco,
Mankan Mohammed Koné and Laura Morgia
as well as by an independent consultant,
Willem Zijp, on the learning theme. The report
benefited from IOE’s internal review process.
IOE would like to express its deep
appreciation to IFAD Management and staff
for their support and insightful comments
on the draft report, which have been duly
considered, in line with the IFAD Evaluation
Policy, in preparing the final report.
The comments contained in IFAD
Management’s written response to the 2018
ARRI and feedback from the Evaluation
Committee and Executive Board are also
reflected in the 2019 ARRI.
Acknowledgements
7
Foreword
The Independent Office of Evaluation of
IFAD (IOE) is pleased to present the 2019
Annual Report on Results and Impact of IFAD
Operations (ARRI). This flagship report presents
a synthesis of IFAD’s performance based
on evaluative evidence. This year’s report
highlights results and systemic issues based on
independent evaluations conducted in 2018.
The 2019 ARRI draws its quantitative
findings from a sample of 344 project-level
evaluations completed between 2002 and
2017, as well as 50 country strategy and
programme evaluations and a total number of
3,807 ratings from IOE project evaluations.
Overall, the performance of IFAD operations
shows flat or slightly declining trends. While
75 per cent of all evaluation ratings were
positive between 2007 and 2017, satisfactory
and better ratings are diminishing. These
trends are also reflected in Management’s
project completion report ratings for all criteria.
IFAD project performance continues to
outperform that of the African Development
Bank and Asian Development Bank in the
agriculture sector in their respective regions.
However, globally and in the regions of Latin
American and the Caribbean as well as the
Near East, North Africa and Europe, IFAD
project performance is now lower than that
of the World Bank, whose definition does not
include sustainability of benefits.
At the country programme level, performance
trends in partnership-building have risen while
declining in knowledge management and
country policy dialogue. A number of factors
have been identified as enabling performance
across these non-lending activities, including:
building on good practices and lessons;
systematically supporting dialogue with
partners; and engaging project actors beyond
the project life. Conversely, limited resources,
capacities and technical knowledge are
considered key constraints.
The 2019 ARRI finds that reaching the ambitious
Sustainable Development Goals requires
commensurate resources and capacities within
IFAD and its partner countries. In particular,
to perform “better”, IFAD will need to: dedicate
more resources and technical expertise to
project design, supervision and implementation
support; design IFAD programmes based on
country capacities and ensure implementation
arrangements are appropriate; and
develop government capacities to design
and implement country programmes in
collaboration with other partners.
In closing, it is our hope that this edition of
the ARRI will stimulate further discussion
and decisive action on how to improve
the quality of IFAD operations. As IFAD
undergoes transformational change to
achieve the ambitious targets of the Eleventh
Replenishment of IFAD’s Resources (IFAD11),
it needs to continue strengthening the quality
of its current operations in order to eradicate
rural poverty and help achieve the Sustainable
Development Goals.
OSCAR A . G ARCIA
Director
Independent Office of Evaluation of IFAD
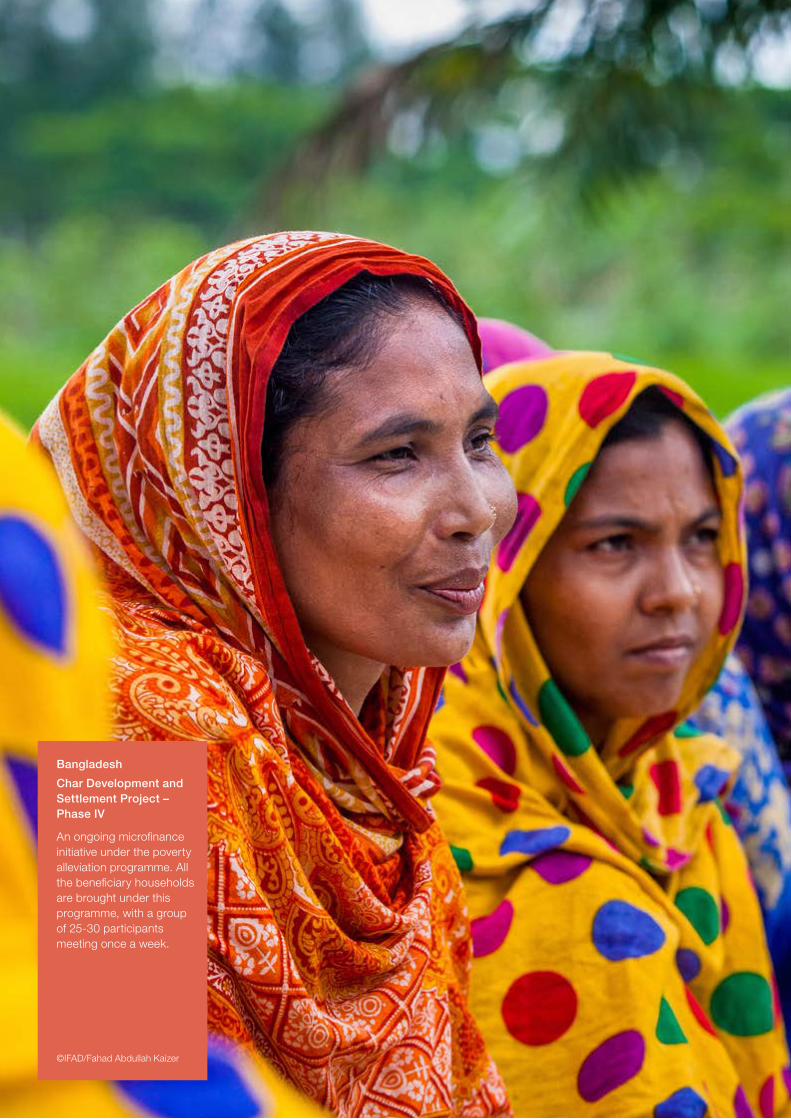
Bangladesh
Char Development and Settlement Project – Phase IV
An ongoing microfinance initiative under the poverty alleviation programme. All the beneficiary households are brought under this programme, with a group of 25-30 participants meeting once a week.
©IFAD/Fahad Abdullah Kaizer
9
Executive summary
Introduction
1. This is the seventeenth edition of the Annual
Report on Results and Impact of IFAD
Operations (ARRI), the flagship report of the
Independent Office of Evaluation of IFAD (IOE).
The objectives of the ARRI are to: (i) present
a synthesis of the performance of IFAD-
supported operations based on a common
evaluation methodology; and (ii) highlight
systemic and cross-cutting issues, lessons
and challenges to enhance the development
effectiveness of IFAD-funded operations.
The 2019 ARRI also includes a learning theme
chapter focused on the relevance of IFAD
project interventions.
2. Context. The context of the 2019 ARRI was
the close of IFAD’s Tenth Replenishment
(IFAD10; 2016-2018), which was also the first
replenishment period for IFAD’s Strategic
Framework 2016-2025. The Strategic
Framework seeks to address the ambitious
commitments to the 2030 Agenda for
Sustainable Development and targets for
the Sustainable Development Goals (SDGs).
It envisions IFAD fulfilling its mandate of
reducing rural poverty by working in a way
that is “bigger, better and smarter”. Therefore,
the 2019 ARRI examines the initial results
from IFAD10. In order to compare results
with the previous Strategic Framework and
replenishment periods, a special chapter
presents a high-level analysis and discussion
of recurring issues in the IFAD10 period.
3. Age of the portfolio. The 2019 ARRI primarily
draws its qualitative findings from evaluations
conducted in 2018, and presents quantitative
analysis of ratings from projects completed
between 2007 and 2017. Performance
analysis in the ARRI does not cover recently
designed projects or other initiatives. Of the
41 newly evaluated projects included in this
year’s ARRI, 14 were completed in 2014 and
2015, and 27 in 2016 and 2017. The average
project duration was 6.9 years. Only one
project had an implementation period of more
than ten years.
4. Methodology. The 2019 ARRI synthesizes
findings from evaluations completed in 2018
(annex 4 of the main report) and analyses
ratings from project evaluations and country
strategy and programme evaluations (CSPEs).
It follows a mixed-methods approach based
on qualitative and quantitative analyses, and
the triangulation of different data sources.
Performance by evaluation criteria is
presented as percentages of projects rated
moderately satisfactory or better according
to three-year moving periods. This highlights
long-term trends and minimize short-term
fluctuations. More details are included in
annex 5 of the main report.
5. Since 2005, IFAD has used a six-point ratings
scale1 to assess performance on each
evaluation criterion and report on operational
performance in ARRI analyses. Ratings from
2002 onwards are recorded in an independent
evaluation database, which is publicly
available.2
1 Projects rated moderately satisfactory or better are in the “satisfactory” zone (4-6), while projects rated moderately unsatisfactory or worse are in the “unsatisfactory” zone (1-3).
2 https://www.ifad.org/it/web/ioe/-/ifad-s-independent-evaluation-ratings-database.
2019 Annual Report on Results and Impact of IFAD Operations
10
6. The performance of projects is assessed
and rated across ten evaluation criteria: rural
poverty impact, relevance, effectiveness,
efficiency, sustainability of benefits, gender
equality and women’s empowerment (GEWE),
innovation, scaling up, environment and
natural resources management (ENRM), and
adaptation to climate change. In addition to
two composite criteria – project performance
(an average of relevance, effectiveness,
efficiency and sustainability) and overall
project achievement (an assessment of all
ten criteria) – each project is evaluated on
how IFAD and the government perform as
partners.
7. The CSPEs assess and rate: (i) overall project
portfolio achievement (based on the ten
criteria); (ii) the performance of partners in
managing the programme; (iii) non-lending
activities; and (iv) country strategy and
programme performance (relevance and
effectiveness). The ARRI focuses on the latter
two points and presents ratings by the year in
which the CSPE was conducted.
8. This ARRI presents ratings for 50 CSPEs by
the year conducted, which ranges from 2006
to 2018. This year’s ARRI includes five new
CSPEs carried out in Angola, Burkina Faso,
Kenya, Sri Lanka and Tunisia.
9. Project evaluation ratings are presented by
year of completion in two data series:
• all evaluation data – presents 3,807 project
ratings from 344 evaluations of projects
completed from 2002 to 2017;
• project completion report validation / project
performance evaluation (PCRV/PPE) data –
includes 2,634 ratings from 228 PCRVs,
PPEs and impact evaluations (IEs) of
projects completed from 2007 to 2017.
10. New features. The 2019 ARRI includes a
special chapter on replenishment analysis
(chapter 4). At the request of Management,
non-lending performance ratings are
presented for the first time within the full
range of the six-point rating scale (from highly
unsatisfactory to highly satisfactory) and by
replenishment period. As the databases used
for the ARRI analysis have been reviewed
and aligned with management system data
to enhance their reliability, there are some
differences in the total project sample size by
year compared to past ARRIs.
Portfolio performance
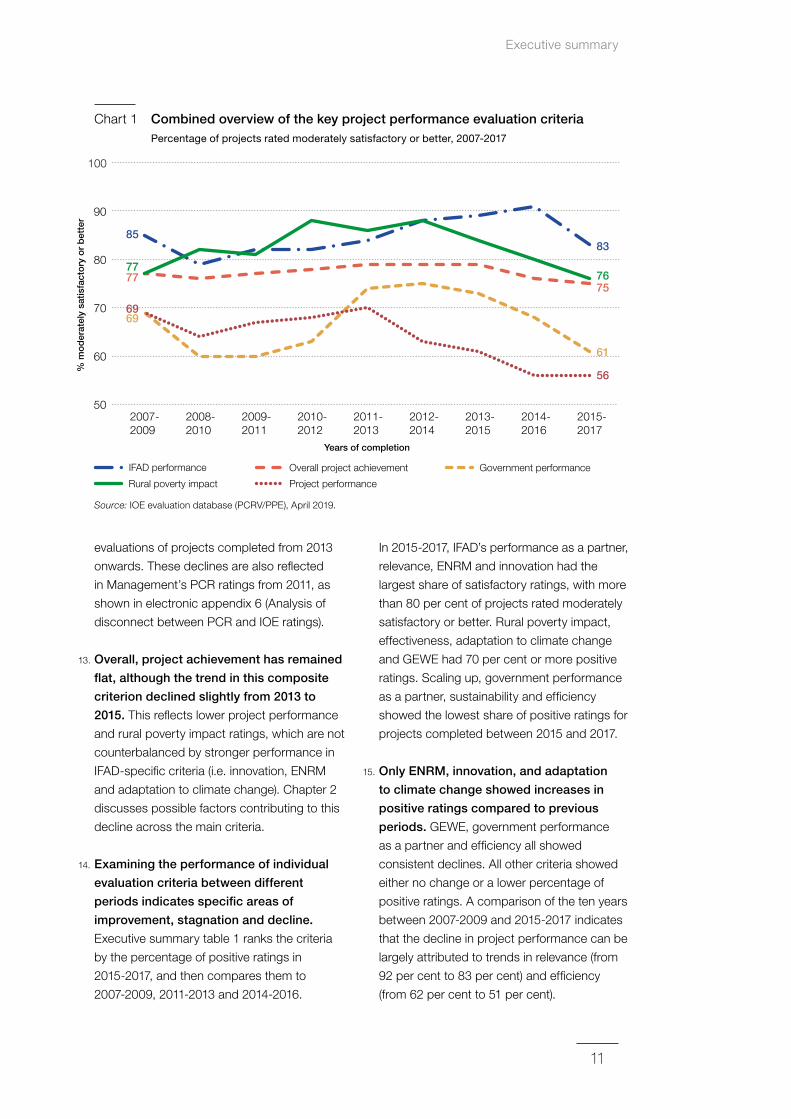
11. Between 2007 and 2017, most ratings
were positive, but recent trends in IFAD’s
project portfolio performance indicate flat
or declining performance. These trends
are observed both in Management’s project
completion report (PCR) self-assessment
ratings and in IOE’s independently rated
evaluations. In terms of total IOE ratings,
75 per cent are moderately satisfactory
or better. Executive summary chart 1
presents the trends in the main project
criteria, which fall into two groups in terms
of moderately satisfactory or better ratings:
better performance (over 70 per cent) and
weaker performance (under 70 per cent). The
two better-performing criteria are: (i) IFAD’s
performance as a partner; and (ii) rural poverty
impact. Both improved from 2008 to 2010 and
then declined; rural poverty impact declined
from 2012 to 2014, and IFAD’s performance
as a partner declined from 2014 to 2016.
The initial period of improvement coincided
with IFAD’s move to direct supervision and
implementation of its targeting policy.
12. Ratings of project performance and of
government performance as a partner
were lower, with moderately satisfactory
ratings often below 70 per cent. Initially,
these improved between 2008 and 2013,
with government performance as a partner
reaching 75 per cent positive ratings in
2012-2014. However, they have both
declined more recently. The decline in project
performance partly reflects the inclusion
of sustainability of benefits from 2016 in
Executive summary
11
evaluations of projects completed from 2013
onwards. These declines are also reflected
in Management’s PCR ratings from 2011, as
shown in electronic appendix 6 (Analysis of
disconnect between PCR and IOE ratings).
13. Overall, project achievement has remained
flat, although the trend in this composite
criterion declined slightly from 2013 to
2015. This reflects lower project performance
and rural poverty impact ratings, which are not
counterbalanced by stronger performance in
IFAD-specific criteria (i.e. innovation, ENRM
and adaptation to climate change). Chapter 2
discusses possible factors contributing to this
decline across the main criteria.
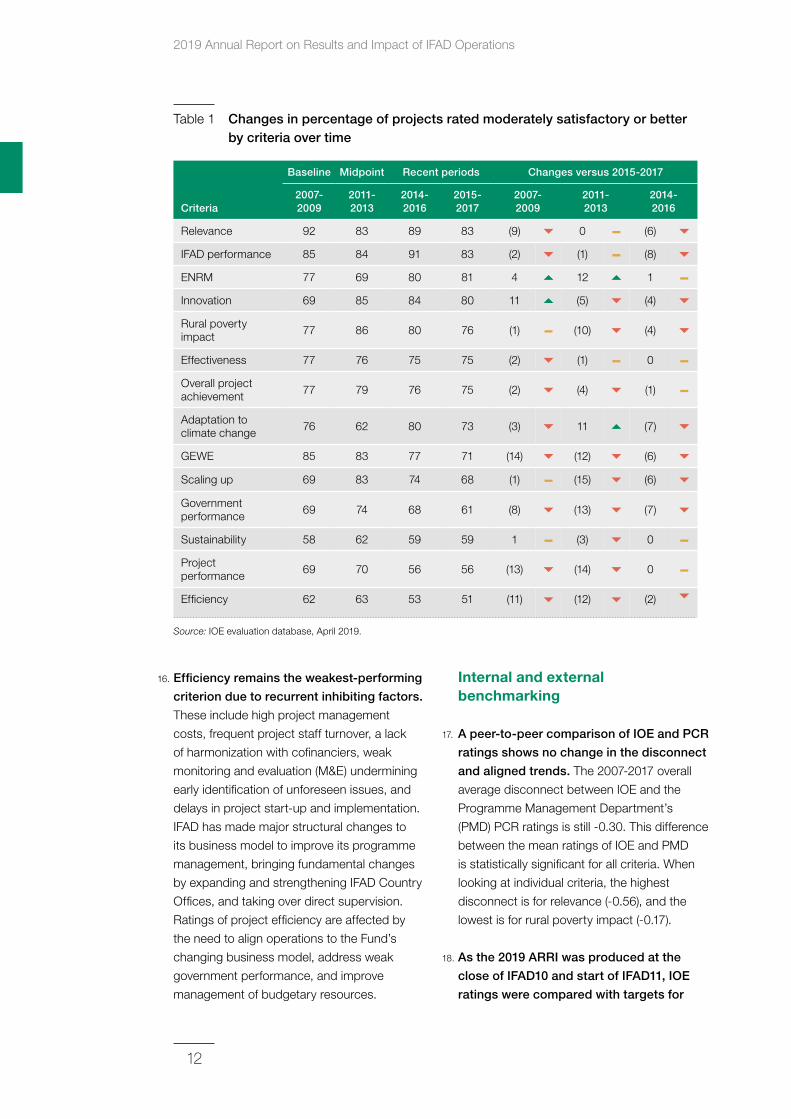
14. Examining the performance of individual
evaluation criteria between different
periods indicates specific areas of
improvement, stagnation and decline.
Executive summary table 1 ranks the criteria
by the percentage of positive ratings in
2015-2017, and then compares them to
2007-2009, 2011-2013 and 2014-2016.
In 2015-2017, IFAD’s performance as a partner,
relevance, ENRM and innovation had the
largest share of satisfactory ratings, with more
than 80 per cent of projects rated moderately
satisfactory or better. Rural poverty impact,
effectiveness, adaptation to climate change
and GEWE had 70 per cent or more positive
ratings. Scaling up, government performance
as a partner, sustainability and efficiency
showed the lowest share of positive ratings for
projects completed between 2015 and 2017.
15. Only ENRM, innovation, and adaptation
to climate change showed increases in
positive ratings compared to previous
periods. GEWE, government performance
as a partner and efficiency all showed
consistent declines. All other criteria showed
either no change or a lower percentage of
positive ratings. A comparison of the ten years
between 2007-2009 and 2015-2017 indicates
that the decline in project performance can be
largely attributed to trends in relevance (from
92 per cent to 83 per cent) and efficiency
(from 62 per cent to 51 per cent).
2007-2009
2008-2010
2012-2014
2013-2015
2009-2011
2010-2012
2011-2013
% m
od
erat
ely
satis
fact
ory
or
bet
ter
Years of completion
2015-2017
2014-2016
90
50
60
70
80
100
Rural poverty impact
Government performance
Project performance
Overall project achievementIFAD performance
85
7777
6969
83
7675
56
61
Source: IOE evaluation database (PCRV/PPE), April 2019.
Chart 1 Combined overview of the key project performance evaluation criteria Percentage of projects rated moderately satisfactory or better, 2007-2017
2019 Annual Report on Results and Impact of IFAD Operations
12
16. Efficiency remains the weakest‑performing
criterion due to recurrent inhibiting factors.
These include high project management
costs, frequent project staff turnover, a lack
of harmonization with cofinanciers, weak
monitoring and evaluation (M&E) undermining
early identification of unforeseen issues, and
delays in project start-up and implementation.
IFAD has made major structural changes to
its business model to improve its programme
management, bringing fundamental changes
by expanding and strengthening IFAD Country
Offices, and taking over direct supervision.
Ratings of project efficiency are affected by
the need to align operations to the Fund’s
changing business model, address weak
government performance, and improve
management of budgetary resources.
Internal and external benchmarking
17. A peer‑to‑peer comparison of IOE and PCR
ratings shows no change in the disconnect
and aligned trends. The 2007-2017 overall
average disconnect between IOE and the
Programme Management Department’s
(PMD) PCR ratings is still -0.30. This difference
between the mean ratings of IOE and PMD
is statistically significant for all criteria. When
looking at individual criteria, the highest
disconnect is for relevance (-0.56), and the
lowest is for rural poverty impact (-0.17).
18. As the 2019 ARRI was produced at the
close of IFAD10 and start of IFAD11, IOE
ratings were compared with targets for
Table 1 Changes in percentage of projects rated moderately satisfactory or better by criteria over time
Baseline Midpoint Recent periods Changes versus 2015‑2017
Criteria2007‑2009
2011‑2013
2014‑2016
2015‑2017
2007‑ 2009
2011‑ 2013
2014‑ 2016
Relevance 92 83 89 83 (9) 0 – (6)
IFAD performance 85 84 91 83 (2) (1) – (8)
ENRM 77 69 80 81 4 12 1 –Innovation 69 85 84 80 11 (5) (4)
Rural poverty impact 77 86 80 76 (1) – (10) (4)
Effectiveness 77 76 75 75 (2) (1) – 0 –Overall project achievement 77 79 76 75 (2) (4) (1) –
Adaptation to climate change 76 62 80 73 (3) 11 (7)
GEWE 85 83 77 71 (14) (12) (6)
Scaling up 69 83 74 68 (1) – (15) (6)
Government performance 69 74 68 61 (8) (13) (7)
Sustainability 58 62 59 59 1 – (3) 0 –Project performance 69 70 56 56 (13) (14) 0 –
Efficiency 62 63 53 51 (11) (12) (2)
Source: IOE evaluation database, April 2019.
Executive summary
13
both replenishment periods. Findings are
presented below, and achievements against
the IFAD10 Results Measurement Framework
(RMF) are discussed in the special chapter
on replenishment analysis (chapter 4) and
summarized in paragraph 27 of this executive
summary. As IFAD11 began in 2019, this
benchmarking exercise presents a baseline
for monitoring future progress against IOE
ratings and draws attention to issues that
require special attention. For IFAD11, IOE
ratings of overall project achievement will be
used to verify the target for ratings of 4 and
above (moderately satisfactory or better). The
achievement of targets for all other criteria
will be based on Management’s PCR ratings,
which are presented below.
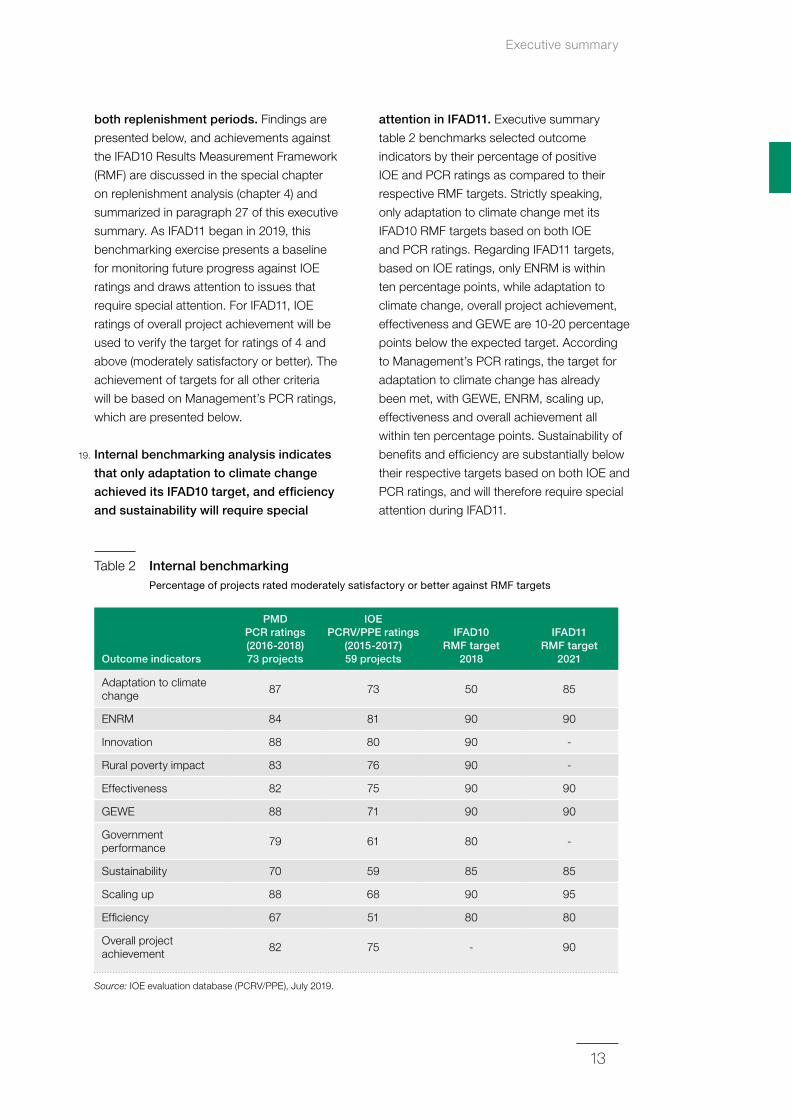
19. Internal benchmarking analysis indicates
that only adaptation to climate change
achieved its IFAD10 target, and efficiency
and sustainability will require special
attention in IFAD11. Executive summary
table 2 benchmarks selected outcome
indicators by their percentage of positive
IOE and PCR ratings as compared to their
respective RMF targets. Strictly speaking,
only adaptation to climate change met its
IFAD10 RMF targets based on both IOE
and PCR ratings. Regarding IFAD11 targets,
based on IOE ratings, only ENRM is within
ten percentage points, while adaptation to
climate change, overall project achievement,
effectiveness and GEWE are 10-20 percentage
points below the expected target. According
to Management’s PCR ratings, the target for
adaptation to climate change has already
been met, with GEWE, ENRM, scaling up,
effectiveness and overall achievement all
within ten percentage points. Sustainability of
benefits and efficiency are substantially below
their respective targets based on both IOE and
PCR ratings, and will therefore require special
attention during IFAD11.
Table 2 Internal benchmarking Percentage of projects rated moderately satisfactory or better against RMF targets
Outcome indicators
PMD PCR ratings (2016‑2018) 73 projects
IOE PCRV/PPE ratings
(2015‑2017) 59 projects
IFAD10 RMF target
2018
IFAD11 RMF target
2021
Adaptation to climate change 87 73 50 85
ENRM 84 81 90 90
Innovation 88 80 90 -
Rural poverty impact 83 76 90 -
Effectiveness 82 75 90 90
GEWE 88 71 90 90
Government performance 79 61 80 -
Sustainability 70 59 85 85
Scaling up 88 68 90 95
Efficiency 67 51 80 80
Overall project achievement 82 75 - 90
Source: IOE evaluation database (PCRV/PPE), July 2019.
2019 Annual Report on Results and Impact of IFAD Operations
14
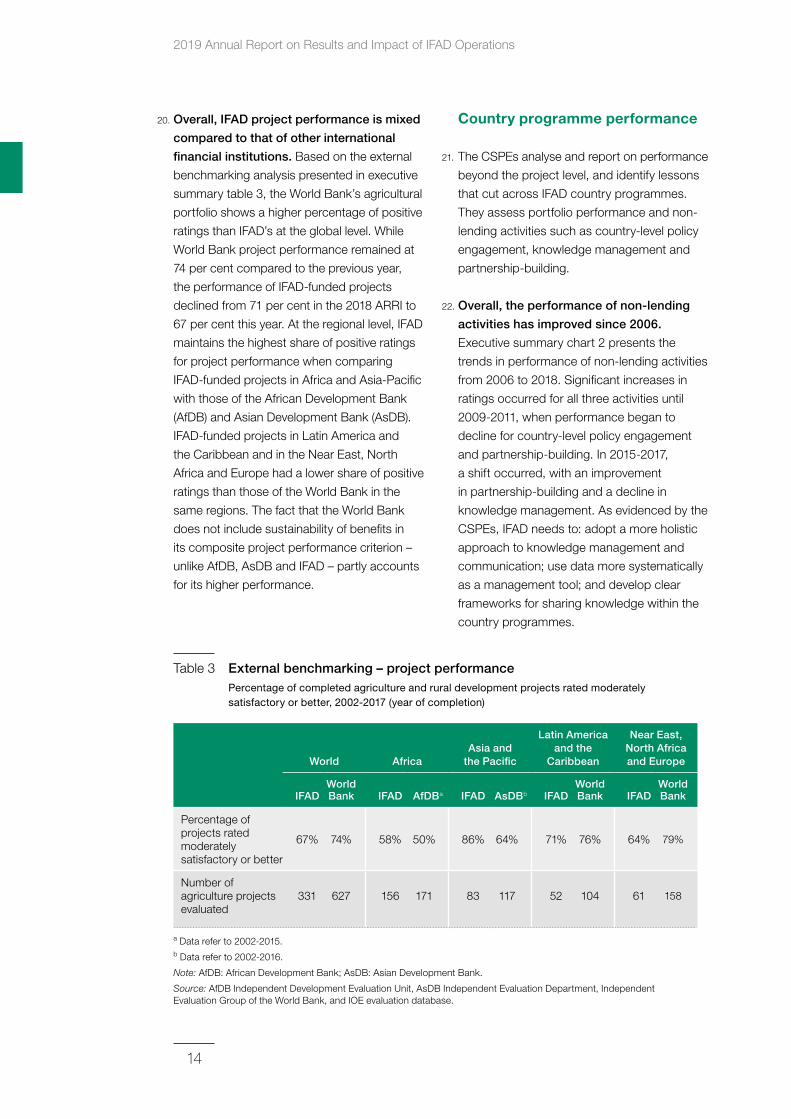
20. Overall, IFAD project performance is mixed
compared to that of other international
financial institutions. Based on the external
benchmarking analysis presented in executive
summary table 3, the World Bank’s agricultural
portfolio shows a higher percentage of positive
ratings than IFAD’s at the global level. While
World Bank project performance remained at
74 per cent compared to the previous year,
the performance of IFAD-funded projects
declined from 71 per cent in the 2018 ARRI to
67 per cent this year. At the regional level, IFAD
maintains the highest share of positive ratings
for project performance when comparing
IFAD-funded projects in Africa and Asia-Pacific
with those of the African Development Bank
(AfDB) and Asian Development Bank (AsDB).
IFAD-funded projects in Latin America and
the Caribbean and in the Near East, North
Africa and Europe had a lower share of positive
ratings than those of the World Bank in the
same regions. The fact that the World Bank
does not include sustainability of benefits in
its composite project performance criterion –
unlike AfDB, AsDB and IFAD – partly accounts
for its higher performance.
Country programme performance
21. The CSPEs analyse and report on performance
beyond the project level, and identify lessons
that cut across IFAD country programmes.
They assess portfolio performance and non-
lending activities such as country-level policy
engagement, knowledge management and
partnership-building.
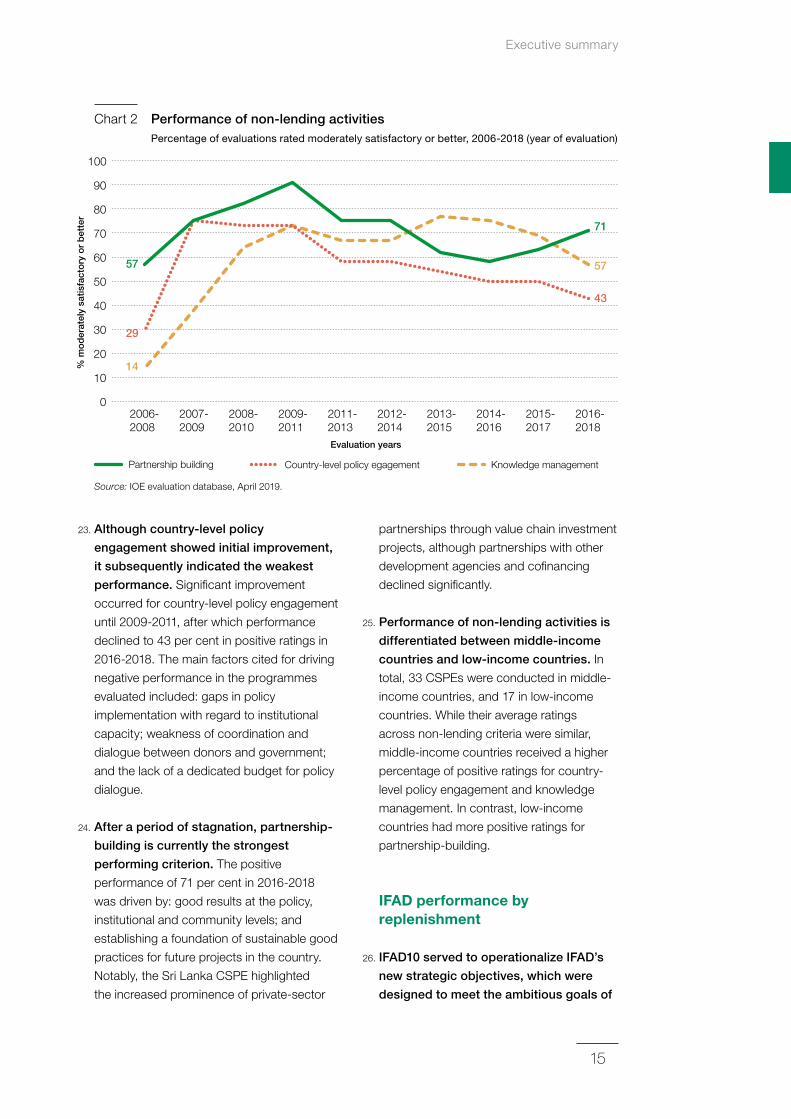
22. Overall, the performance of non‑lending
activities has improved since 2006.
Executive summary chart 2 presents the
trends in performance of non-lending activities
from 2006 to 2018. Significant increases in
ratings occurred for all three activities until
2009-2011, when performance began to
decline for country-level policy engagement
and partnership-building. In 2015-2017,
a shift occurred, with an improvement
in partnership-building and a decline in
knowledge management. As evidenced by the
CSPEs, IFAD needs to: adopt a more holistic
approach to knowledge management and
communication; use data more systematically
as a management tool; and develop clear
frameworks for sharing knowledge within the
country programmes.
Table 3 External benchmarking – project performance Percentage of completed agriculture and rural development projects rated moderately satisfactory or better, 2002-2017 (year of completion)
World AfricaAsia and
the Pacific
Latin America and the
Caribbean
Near East, North Africa and Europe
IFAD World Bank IFAD AfDBa IFAD AsDBb IFAD
World Bank IFAD
World Bank
Percentage of projects rated moderately satisfactory or better
67% 74% 58% 50% 86% 64% 71% 76% 64% 79%
Number of agriculture projects evaluated
331 627 156 171 83 117 52 104 61 158
a Data refer to 2002-2015. b Data refer to 2002-2016.
Note: AfDB: African Development Bank; AsDB: Asian Development Bank.
Source: AfDB Independent Development Evaluation Unit, AsDB Independent Evaluation Department, Independent Evaluation Group of the World Bank, and IOE evaluation database.
Executive summary
15
23. Although country‑level policy
engagement showed initial improvement,
it subsequently indicated the weakest
performance. Significant improvement
occurred for country-level policy engagement
until 2009-2011, after which performance
declined to 43 per cent in positive ratings in
2016-2018. The main factors cited for driving
negative performance in the programmes
evaluated included: gaps in policy
implementation with regard to institutional
capacity; weakness of coordination and
dialogue between donors and government;
and the lack of a dedicated budget for policy
dialogue.
24. After a period of stagnation, partnership‑
building is currently the strongest
performing criterion. The positive
performance of 71 per cent in 2016-2018
was driven by: good results at the policy,
institutional and community levels; and
establishing a foundation of sustainable good
practices for future projects in the country.
Notably, the Sri Lanka CSPE highlighted
the increased prominence of private-sector
partnerships through value chain investment
projects, although partnerships with other
development agencies and cofinancing
declined significantly.
25. Performance of non‑lending activities is
differentiated between middle‑income
countries and low‑income countries. In
total, 33 CSPEs were conducted in middle-
income countries, and 17 in low-income
countries. While their average ratings
across non-lending criteria were similar,
middle-income countries received a higher
percentage of positive ratings for country-
level policy engagement and knowledge
management. In contrast, low-income
countries had more positive ratings for
partnership-building.
IFAD performance by replenishment
26. IFAD10 served to operationalize IFAD’s
new strategic objectives, which were
designed to meet the ambitious goals of
2006-2008
2007-2009
2008-2010
2012-2014
2013-2015
2009-2011
2011-2013
% m
od
erat
ely
satis
fact
ory
or
bet
ter
Evaluation years
2016-2018
2015-2017
2014-2016
Knowledge managementCountry-level policy egagementPartnership building
0
10
20
30
40
50
60
70
80
90
100
14
29
57
71
43
57
Source: IOE evaluation database, April 2019.
Chart 2 Performance of non‑lending activities Percentage of evaluations rated moderately satisfactory or better, 2006-2018 (year of evaluation)
2019 Annual Report on Results and Impact of IFAD Operations
16
the 2030 Agenda. Commencing in 2016,
IFAD10 coincided with both the launch of the
SDGs and IFAD’s new Strategic Framework
2016-2025. IFAD’s Strategic Framework set
out to make the Fund “bigger, better and
smarter”. IFAD would become “bigger” by
mobilizing substantially more funds and other
resources for investment in rural areas. It
would become “better” by strengthening the
quality of its country programmes through
innovation, knowledge sharing, quality-at-
entry, implementation support, partnerships
and policy engagement. Finally, IFAD would
become “smarter” by delivering development
results in a cost-effective manner that
responds to countries’ evolving needs.
27. Data on the performance of projects
completed during IFAD10 indicates the
challenges IFAD faces in achieving this
vision for a “bigger, better and smarter”
organization. While IFAD’s project
investments remained sizeable and were
“smarter” in terms of reducing costs,
they have yet to prove higher in terms of
quality. IFAD experienced impressive growth
in IFAD8, which it maintained into IFAD10.
Although the programme of loans and grants
(PoLG) grew steadily, the total administrative
budget allocation3 for country programme
management, design, and supervision and
implementation support (SIS) appear to have
declined in IFAD10 to a point where the ratio
of administrative budget allocation to PoLG
was below that of IFAD7. In a context of a
zero-growth budget, IFAD appears to have
managed its higher PoLG by designing fewer
but larger projects. The ratio of all SIS missions
to projects also decreased between 2012 and
2018. In addition, from IFAD7, the timeliness of
projects improved, with reduced disbursement
lags and fewer project extensions.
28. However, a decline in both IOE and PCR
ratings of completed projects was observed
between IFAD9 and IFAD10. Based on
the statistically significant changes in IOE
ratings of projects completed up to 2017 and
Management’s full set of PCR ratings including
2018, IFAD demonstrated better quality
only in ENRM between IFAD8 and IFAD10,
while performance was weaker in relevance,
IFAD’s performance as a partner and project
performance between IFAD9 and IFAD10.
Declines are evident in all other criteria between
IFAD9 and IFAD10, although these changes are
not statistically significant. As mentioned above,
only adaptation to climate change met its
IFAD10 target based on IOE and PCR ratings.
29. Moving forward into IFAD11, greater
efforts are required to enhance the quality
of IFAD’s project portfolio. This entails:
strengthening IFAD’s performance as a
partner in the context of decentralization;
enhancing the technical quality of IFAD-funded
projects and SIS missions with specialists;
and developing partnerships for greater
cofinancing and scaling up of project impacts.
Learning theme on relevance of IFAD project interventions
30. Most development organizations recognize
relevance as the fundamental evaluation
criterion. No project design should move
forward unless the project is considered
relevant by the donor and country stakeholders.
The assessment of relevance includes many
critical aspects of project performance,
such as government capacity, the quality
and appropriateness of project design to the
country context, and plans for mitigating risks.
31. The learning theme on the relevance of
IFAD project interventions highlighted
five important lessons for consideration
during IFAD11. First, relevance is not a
fixed assessment at design, and project
interventions may need to be adapted to ensure
their continued relevance. Second, meaningful
engagement of beneficiaries in the design,
implementation and evaluation of projects
enhances project relevance by understanding
beneficiaries’ needs. Third, government
3 This includes staff and non-staff resources as per IFAD’s results-based programme of work and budget.
Executive summary
17
commitment is critical to: adopting pro-
poor policies and project designs; providing
adequate implementation capacity; and
ensuring continued relevance during and after
the project lifespan. This entails governments’
willingness and capacity to create and maintain
a pro-poor policy environment. Fourth, a lack
of understanding of institutional arrangements
together with the absence of implementation
capacity are the main threats to improved
relevance. Fifth, well-functioning institutions
are a key determinant of high relevance.
Slow implementation, overly ambitious and
complex projects, underperforming project
management units, and failure to address
political and economic issues are among
the most prominent issues leading to weak
project performance. A comprehensive
institutional assessment, a good understanding
of the political and economic context, and
identification of all key stakeholders’ roles,
accountabilities and responsibilities should be
fundamental aspects of any project design.
32. Addressing two recurrent issues would have
a significant positive impact on relevance:
a weak understanding of the institutional
arrangements underlying a project; and the
ongoing issue of limited implementation
capacity in many countries. These persistent
issues underscore the importance of IFAD
taking a “continued relevance” approach,
which entails adaptive design. Such design
recognizes that relevance is dynamic and that
project interventions need to adapt in order to
remain relevant for their entire duration.
Conclusions
33. While most IOE ratings are positive,
recent trends in the performance of
IFAD‑funded projects show flat or slightly
declining performance. This is highlighted
by downward trends in criteria such as IFAD’s
performance as a partner, relevance, rural
poverty impact and GEWE. Little progress
has been made in areas such as efficiency,
sustainability of benefits and government
performance. These flat and declining trends
are also reflected in Management’s PCR
ratings for all criteria except GEWE. This –
along with the inclusion of sustainability
of benefits in IFAD’s composite project
performance criterion from 2016 – has
contributed to lowering the performance
ratings of IFAD-funded projects compared
to the World Bank’s agricultural portfolio.
However, IFAD project performance is higher
than that of the AfDB and AsDB, which share
the Fund’s definition of performance.
34. Improving the quality of a “bigger” ongoing
programme of work with fewer resources
appears challenging. IFAD’s Strategic
Framework set out to make the Fund “bigger,
better and smarter”. However, based on
IFAD10 performance, this vision appears
ambitious. While IFAD10 project investments
remained large and were “smarter” in terms of
reducing costs, they did not prove “better” in
terms of quality – except in ENRM. While new
investments increased, the actual number of
approved projects decreased, indicating that
country programme managers were designing
and supervising fewer but “bigger” projects.
IFAD also managed to improve its average
project effectiveness lag and reduced the
number of extensions in IFAD10. However,
the lower total direct administrative budget
allocation for country programme management,
design and SIS may have contributed to the
decline in project quality between IFAD9 and
IFAD10, particularly with regard to relevance
and IFAD’s performance as a partner.
35. A shift in the nature of IFAD‑funded
projects from reaching high numbers of
beneficiaries to increasing investments per
beneficiary may possibly indicate more
value‑adding activities. Most of the projects
included in the 2019 sample take value chain
or market approaches involving the private
sector. This indicates the need for technical
expertise to design and support a larger
portfolio of market-oriented and private-sector-
2019 Annual Report on Results and Impact of IFAD Operations
18
driven projects. In addition to managing double
the programme of work from IFAD8, IFAD
was also designing projects in new areas in
which it had limited expertise. Therefore, there
is a need to raise the overall quality of IFAD’s
performance with greater technical expertise.
36. The importance of resources and technical
expertise is reiterated in the positive trend
in performance on the ENRM criterion.
Performance in ENRM has improved steadily
from a low in 2010-2012 and was the only
criterion that showed statistically significant
improvement between IFAD8 and IFAD10.
This improvement in ENRM and adaptation to
climate change was supported by the creation
of a unique IFAD division dedicated to the
environment and climate change (which now
also includes gender, youth and nutrition), as
well as supplementary funds. During IFAD10,
the Fund entered into a decisive transition
towards full climate change mainstreaming in
its country strategies and project portfolios.
However, the positive trend did not continue in
2015-2017 for adaptation to climate change.
This was in part due to the lack of specific
strategies on climate during project design
and implementation, and weak national
policies adopted by local governments.
37. Although still the top‑ranking criterion,
IFAD’s performance as a partner declined
in 2015‑2017 for the first time since 2008.
Recurring constraints include high staff turnover,
weak M&E, inaccurate funding at the design
stage and a lack of specialists on supervision
missions. Nonetheless, IFAD remains a
valued and trusted partner – able to adjust
to varying circumstances and show flexibility
and willingness to find alternative solutions in
changing contexts. IFAD Country Office-based
consultations were deemed effective and
efficient for problem-solving and providing timely
support. However, additional measures are still
needed in order to learn from past experience
for scaled-up results. Capacity within IFAD
Country Offices was not always sufficient to
aggregate and share evidence across the entire
portfolio. With limited resources, complex
projects, wide geographical distribution of
activities and little time to engage in non‑
lending activities, IFAD Country Offices are
often under pressure in supporting IFAD’s
project portfolio.
38. Government performance as a partner
is one of the key criteria accounting for
the overall performance of IFAD‑funded
projects. The principal component analysis
conducted this year indicated that positive
ratings in overall project achievement
are correlated with good performance of
government as a partner, effectiveness and
rural poverty impact. However, government
performance still shows shortcomings related
to staffing issues, and delays in financial
execution and implementation. As indicated
in past ARRIs and this year’s learning theme,
building institutional capacity at the national
level is critically important for good project
design and improved project relevance.
Recommendations
39. The 2030 Agenda has set very ambitious
targets for governments to achieve with
IFAD’s support. Reaching these goals requires
commensurate resources and capacities
within IFAD and its partner countries. The
Executive Board is invited to adopt the
recommendations below, which seek to
address constraints in capacity and related
issues raised in the 2019 ARRI.
40. Recommendation 1. Dedicate more
resources to country programme delivery –
specifically, project design, supervision and
implementation – to achieve the improved
quality needed for a “better” IFAD. IFAD’s
aim to become “bigger, better and smarter”
appears ambitious based on results thus
far. While IFAD has managed to maintain a
significantly higher ongoing programme of
work since IFAD8, the decline in budgetary
resources dedicated specifically to design,
Executive summary
19
supervision and implementation may have
affected its quality, with lower ratings across
criteria in IFAD10. “Better” results also require
high-quality technical expertise to support
IFAD country programmes and projects. To
improve quality standards, IFAD needs to plan
and provide the commensurate resources for
country programme management, design and
implementation.
41. Recommendation 2. Design IFAD‑funded
programmes and projects according
to country capacities based on sound
institutional analysis to ensure the most
appropriate implementation arrangements
for country delivery. For projects to be more
relevant, they need to be appropriate to the
country context and designed according to
country capacities (including public, private
and civil society institutions). This knowledge
begins with sound institutional analysis during
country strategic opportunities programme
(COSOP) or project design, the inclusion of
capacity-strengthening components, and
support to rural institutions within the country.
42. Recommendation 3. Develop government
capacities to design and implement country
programmes and projects in collaboration
with other partners. Government performance
is critical to achieving development objectives
(DOs) and making positive impacts on rural
poverty. In the short term, IFAD needs to
provide more intensive implementation support,
particularly in areas such as procurement
and financial management. In the long term,
IFAD can utilize its grant financing to work with
other partners on strengthening the capacities
of government institutions and project
management units. Depending on the country
and project, multi-donor project management
units may be considered along with the greater
involvement of government counterparts in
project design and SIS.
43. Recommendation 4. Determine the need to
adjust project designs earlier on in order
to ensure their continued relevance to
the country context. Good project design
is necessary but not sufficient to achieve
DOs. Project design should be viewed as a
“living” blueprint that is reviewed and adjusted
based on the context during implementation.
Active supervision during start-up is needed
to determine whether the project design
needs to be adjusted even before the mid-
term review. IFAD’s new restructuring policy
should facilitate project redesign early on
where necessary, and should not simply be
used to close projects that are challenging but
important for achieving IFAD’s mandate.
44. Recommendation 5. A more
comprehensive and integrated system is
required to better mitigate risks in IFAD‑
funded projects and programmes. IFAD
currently has a decentralized system for risk
mitigation at various stages of the project
cycle, with assessments conducted by
different divisions. To ensure that identified
risks are addressed appropriately and at
the right time, IFAD needs to develop better
linkages among the various assessments from
project design to evaluation.
45. 2020 ARRI learning theme. Pending the
decision on whether to retain learning themes
in the ARRI based on recommendations of
the external peer review of IFADs evaluation
function, the Evaluation Committee is invited
to choose one of the two proposed topics:
(i) Quality of IFAD’s supervision and
implementation support: Given the
observed decline in annual SIS missions
per project, this learning theme would
examine the quality of recent SIS missions
in terms of technical composition, expertise
and advice.
(ii) Efficiency: The efficiency criterion
measures how economically resources
and inputs (funds, expertise and time) are
converted into results. In the current context
in which greater emphasis is placed on
“value for resources”, this learning theme
would explore the quality of results per
dollar invested in IFAD-funded projects.
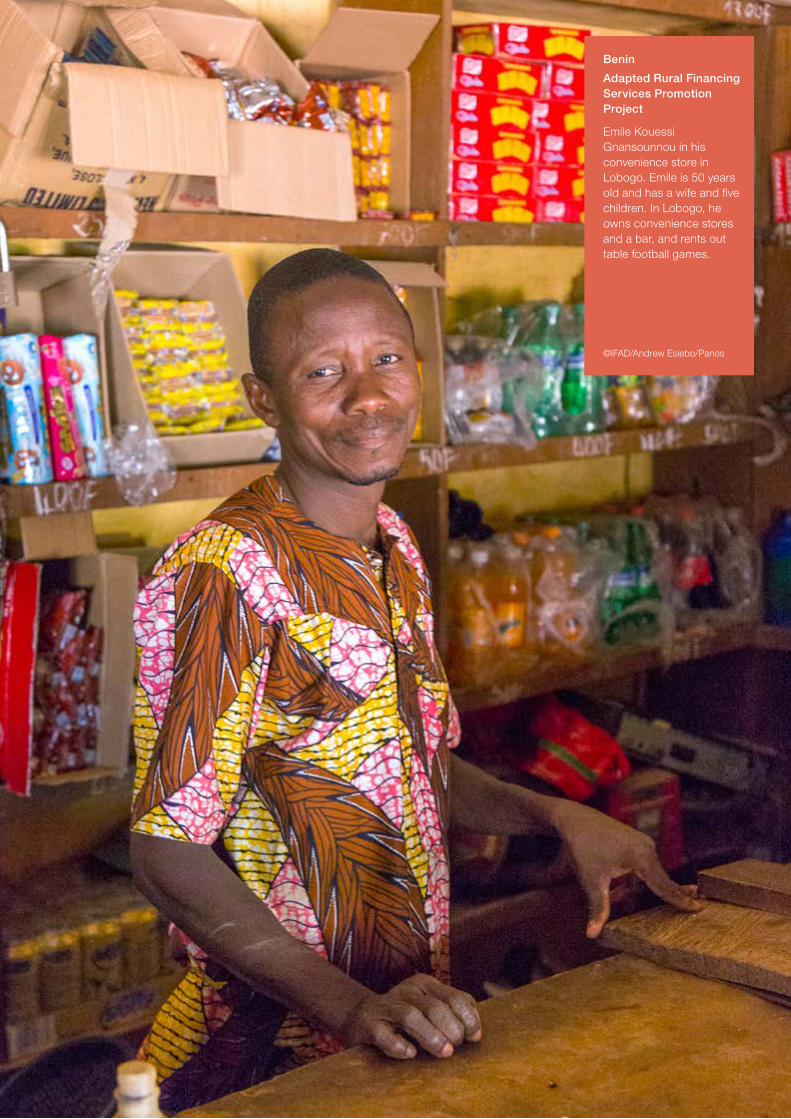
Benin
Adapted Rural Financing Services Promotion Project
Emile Kouessi Gnansounnou in his convenience store in Lobogo. Emile is 50 years old and has a wife and five children. In Lobogo, he owns convenience stores and a bar, and rents out table football games.
©IFAD/Andrew Esiebo/Panos
21
1 Overview
Background
1. This is the seventeenth edition of the Annual
Report on Results and Impact of IFAD
Operations (ARRI), which the Independent
Office of Evaluation of IFAD (IOE) has prepared
annually since 2003. The ARRI provides an
independent presentation of the aggregate
results of IFAD’s performance at the project
and country levels for the consideration of
its Management and Executive Board to
strengthen accountability and learning.
2. Objectives. The ARRI has two main
objectives: (i) present a synthesis of the
performance of IFAD-supported operations
based on a common evaluation methodology;
and (ii) highlight systemic and cross-cutting
issues, lessons and challenges that IFAD
and recipient countries need to address to
enhance the development effectiveness of
IFAD-funded operations.
3. Learning theme. Since 2007, each ARRI
has focused on a learning theme with the
aim of deepening analysis on selected
issues to enhance the performance of IFAD
operations. The learning theme agreed upon
with the Executive Board for the 2019 ARRI
is relevance of IFAD project interventions.
The full study of the topic was published as
an issues paper4 and is summarized in the
learning theme chapter.
4. Methodology. The 2019 ARRI synthesizes
findings from evaluations completed in 2018
(annex 4) and analyses ratings from project
evaluations and from country strategy and
programme evaluations (CSPEs). It follows a
mixed methodology based on qualitative and
quantitative analyses, and the triangulation
of different data. Performance by evaluation
criteria is presented as percentages of
projects rated moderately satisfactory or
better according to three-year moving periods.
This highlights long-term trends and smoothen
short-term fluctuations. Annex 5 provides
more detail on the methodology and analyses.
5. The 2019 ARRI follows the provisions of the
second edition of IFAD’s Evaluation Manual
published in December 2015. In addition, the
evaluation criteria and definitions included in
the revised harmonization agreement between
Management and IOE are fully reflected. Each
project included has been assessed and rated
across ten evaluation criteria: rural poverty
impact, relevance, effectiveness, efficiency,
sustainability of benefits, gender equality and
women’s empowerment (GEWE), innovation,
scaling up, environment and natural resources
management (ENRM), and adaptation to
climate change.
6. IOE also has two composite evaluation
criteria: project performance, and overall
project achievement. Project performance
4 IOE. 2019 Annual Report on Results and Impact of IFAD Operations (ARRI): Relevance of IFAD project interventions. Issues Paper (IFAD, 2019).
2019 Annual Report on Results and Impact of IFAD Operations
22
5 Projects rated moderately satisfactory or better are in the “satisfactory” zone (4-6), while projects rated moderately unsatisfactory or worse are in the “unsatisfactory” zone (1-3).
6 https://www.ifad.org/it/web/ioe/-/ifad-s-independent-evaluation-ratings-database.
is an average of the ratings of four individual
evaluation criteria (relevance, effectiveness,
efficiency and sustainability) in line with
other international financial institutions (IFIs),
whereas overall project achievement is based
on (but not an average of) the ten criteria
above. In addition, each project is evaluated
for IFAD and government performance as
partners.
7. The CSPEs assess and rate: (i) overall project
portfolio achievement (based on the ten
criteria); (ii) performance of partners (IFAD
and government); (iii) non-lending activities;
and (iv) country strategy and programme
performance (its relevance and effectiveness).
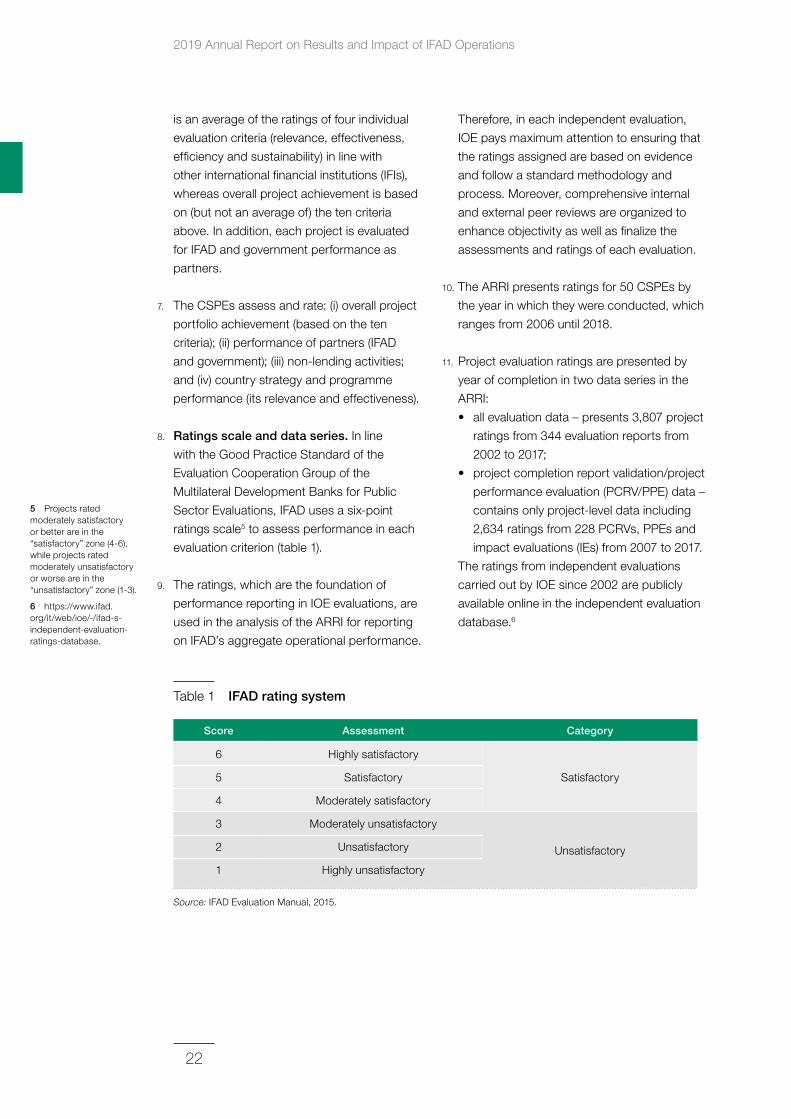
8. Ratings scale and data series. In line
with the Good Practice Standard of the
Evaluation Cooperation Group of the
Multilateral Development Banks for Public
Sector Evaluations, IFAD uses a six-point
ratings scale5 to assess performance in each
evaluation criterion (table 1).
9. The ratings, which are the foundation of
performance reporting in IOE evaluations, are
used in the analysis of the ARRI for reporting
on IFAD’s aggregate operational performance.
Therefore, in each independent evaluation,
IOE pays maximum attention to ensuring that
the ratings assigned are based on evidence
and follow a standard methodology and
process. Moreover, comprehensive internal
and external peer reviews are organized to
enhance objectivity as well as finalize the
assessments and ratings of each evaluation.
10. The ARRI presents ratings for 50 CSPEs by
the year in which they were conducted, which
ranges from 2006 until 2018.
11. Project evaluation ratings are presented by
year of completion in two data series in the
ARRI:
• all evaluation data – presents 3,807 project
ratings from 344 evaluation reports from
2002 to 2017;
• project completion report validation/project
performance evaluation (PCRV/PPE) data –
contains only project-level data including
2,634 ratings from 228 PCRVs, PPEs and
impact evaluations (IEs) from 2007 to 2017.
The ratings from independent evaluations
carried out by IOE since 2002 are publicly
available online in the independent evaluation
database.6
Table 1 IFAD rating system
Score Assessment Category
6 Highly satisfactory
Satisfactory5 Satisfactory
4 Moderately satisfactory
3 Moderately unsatisfactory
Unsatisfactory2 Unsatisfactory
1 Highly unsatisfactory
Source: IFAD Evaluation Manual, 2015.
1 Overview
23
7 Hence, there are some differences in the total number of projects included in the analysis across the years compared to previous ARRIs.
8 As the IOE sample of IFAD10 project evaluations does not include many projects completing in 2018, the results are partial and will become clearer next year.
12. Age of the portfolio. Of the 41 newly
evaluated projects included in this year’s ARRI,
13 were approved between 2004 and 2006,
22 between 2007 and 2009, and 6 between
2010 and 2012. All projects are completed and
closed: 14 were completed in 2014 and 2015,
and 27 in 2016 and 2017. The average project
duration was 6.9 years. Only one project
had an implementation period of more than
10 years compared to 4 out of the 36 projects
evaluated in the 2018 ARRI. It is important to
note that analysis of performance in the ARRI
does not take into account recently designed
projects and initiatives.
13. New features. The 2019 ARRI includes a
special chapter based on replenishment
analysis (chapter 4). At the request of
Management, non-lending performance
ratings are presented over time by
replenishment period. A thorough review of
the ARRI databases was conducted for this
year, which ensures the robustness of the
data and analyses. The databases were also
reclassified by project versus evaluation and
aligned with management system data. This
has ensured that all completed projects with
evaluations are included only once in the
dataset with the latest ratings.7
14. More systematic qualitative analysis was
achieved in this year’s ARRI, again with the
improved use of the data management tool
NVivo. Specific examples are presented that
draw lessons learned from projects evaluated
in 2018 and past years. On the quantitative
side, the 2019 ARRI includes in annex 5 a
principal component analysis (PCA) based on
project evaluation ratings to understand how
criteria relate to each other in groups, identify
criteria varying similarly, and detect clusters in
data, if possible.
15. Document structure. The 2019 ARRI
presents multiple levels of analysis of IFAD’s
project and country programme to highlight
areas requiring attention and identify key
factors driving performance. The overview
presented in chapter 1 provides a context
for understanding the current performance
by presenting ten-year trends that are
benchmarked against other comparable
IFIs and internal targets adopted by the
Fund. To further understand these trends in
IFAD’s project portfolio, chapter 2 provides
deeper analysis on each criterion and
identifies factors from projects evaluated by
IOE in 2018 to explain recent performance.
Chapter 3 concentrates on country strategy
and programme performance, with a specific
focus on non-lending activities and country
strategies. Given the conclusion of the Tenth
Replenishment of IFAD’s Resources (IFAD10)
in 2018, a special, chapter 4, is included
this year that analyses ratings and other
data by replenishment period to assess the
effectiveness of IFAD’s strategic approach to
fulfilling its mandate and contributing to the
2030 Agenda for Sustainable Development.
Chapter 5 is dedicated to the learning theme
on relevance of IFAD project interventions.
Finally, chapter 6 presents the main
conclusions and recommendations.
Context of the 2019 ARRI
16. The 2019 ARRI draws its qualitative findings
from evaluations conducted in 2018 – the last
year of IFAD10 (2016-2018). IFAD10 was also
the first replenishment period of IFAD’s latest
Strategic Framework (2016-2025). Therefore,
the 2019 ARRI examines the initial results
from these first three years as represented
by IFAD10.8 In order to compare results with
replenishments, a special chapter has been
prepared that presents in-depth analysis and
recurring issues of this initial period.
17. IFAD’s Strategic Framework seeks to address
the ambitious commitments and targets
of the 2030 Agenda and the Sustainable
Development Goals (SDGs). It envisions IFAD
fulfilling its mandate of reducing rural poverty
by working in a way that is “bigger, better and
smarter”.
2019 Annual Report on Results and Impact of IFAD Operations
24
18. IFAD10 translated the objectives of the
strategic framework into a number of
commitments. According to the Report of the
Consultation on the Tenth Replenishment of
IFAD’s Resources, IFAD will draw and build on
its recent performance achievements to scale
up its results and consolidate the strategic
approaches of the Ninth Replenishment of
IFAD’s Resources (IFAD9, 2013-2015). The
two IFAD10 priorities relevant to IFAD-funded
programmes were: (i) increasing operational
effectiveness (“better”); and (ii) increasing
institutional effectiveness and efficiency
(“bigger” and “smarter”). Chapter 4 presents
a replenishment-based analysis to assess
IFAD10 achievements against these priorities.
Overall portfolio performance from 2007 to 2017
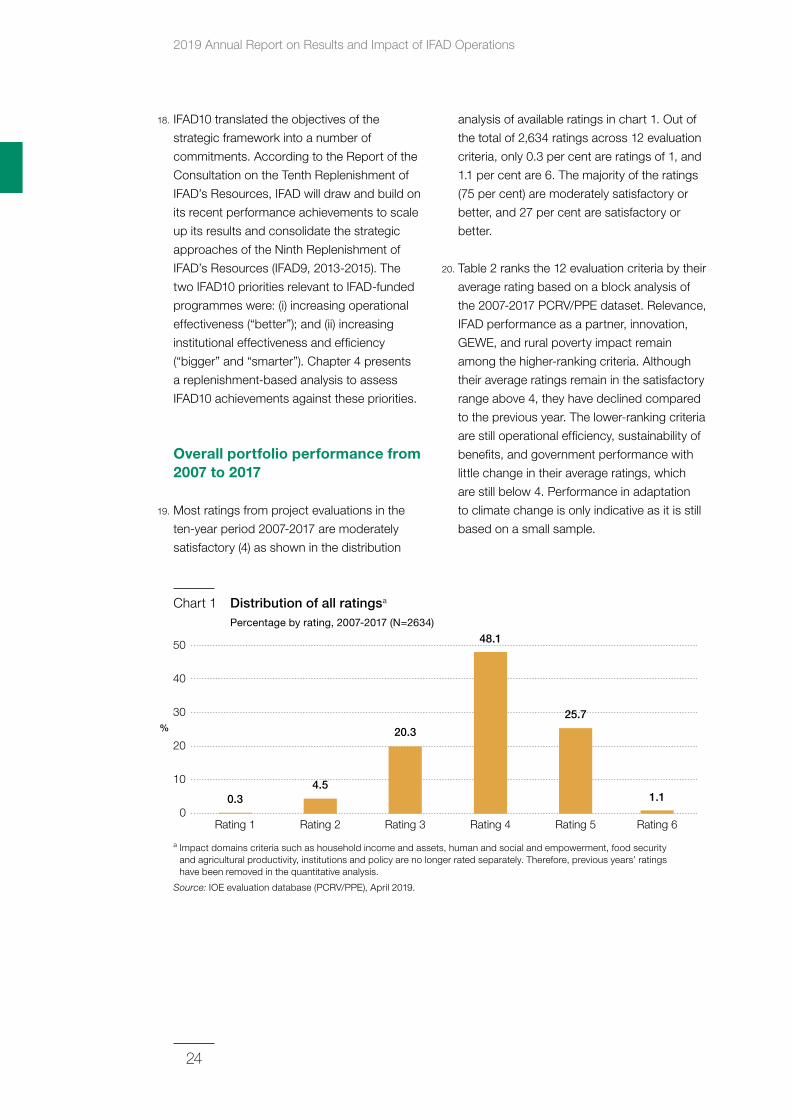
19. Most ratings from project evaluations in the
ten-year period 2007-2017 are moderately
satisfactory (4) as shown in the distribution
analysis of available ratings in chart 1. Out of
the total of 2,634 ratings across 12 evaluation
criteria, only 0.3 per cent are ratings of 1, and
1.1 per cent are 6. The majority of the ratings
(75 per cent) are moderately satisfactory or
better, and 27 per cent are satisfactory or
better.
20. Table 2 ranks the 12 evaluation criteria by their
average rating based on a block analysis of
the 2007-2017 PCRV/PPE dataset. Relevance,
IFAD performance as a partner, innovation,
GEWE, and rural poverty impact remain
among the higher-ranking criteria. Although
their average ratings remain in the satisfactory
range above 4, they have declined compared
to the previous year. The lower-ranking criteria
are still operational efficiency, sustainability of
benefits, and government performance with
little change in their average ratings, which
are still below 4. Performance in adaptation
to climate change is only indicative as it is still
based on a small sample.
Rating 1 Rating 2 Rating 3 Rating 4 Rating 5 Rating 6
0.3
20.3
48.1
25.7
1.1
20
10
30
40
50
4.5
0
%
a Impact domains criteria such as household income and assets, human and social and empowerment, food security and agricultural productivity, institutions and policy are no longer rated separately. Therefore, previous years’ ratings have been removed in the quantitative analysis.
Source: IOE evaluation database (PCRV/PPE), April 2019.
Chart 1 Distribution of all ratingsa Percentage by rating, 2007-2017 (N=2634)
1 Overview
25
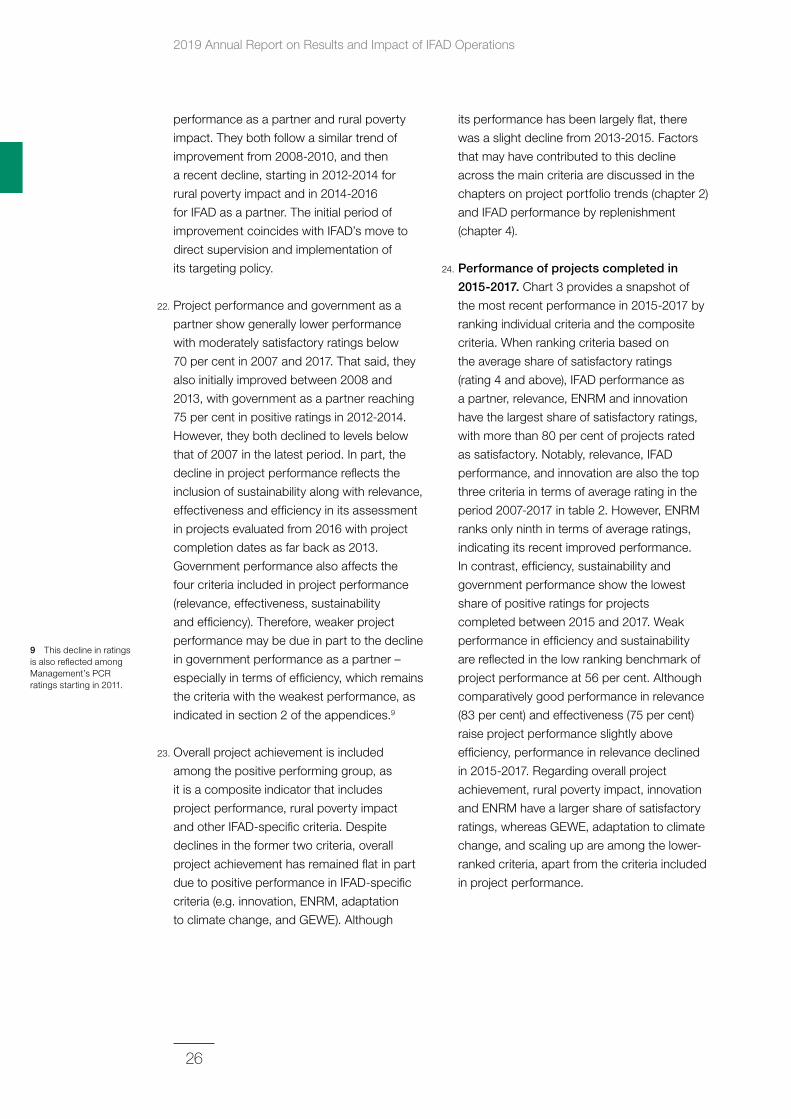
Trends in portfolio performance
21. Overall, between 2007 and 2017, the
performance of IFAD’s project portfolio was
declining or flat. Chart 2 presents an overview
of the key project criteria, which fall into two
groups in terms of moderately satisfactory or
better ratings: better (over 70 per cent) and
weaker performance (under 70 per cent).
The two better-performing criteria are IFAD
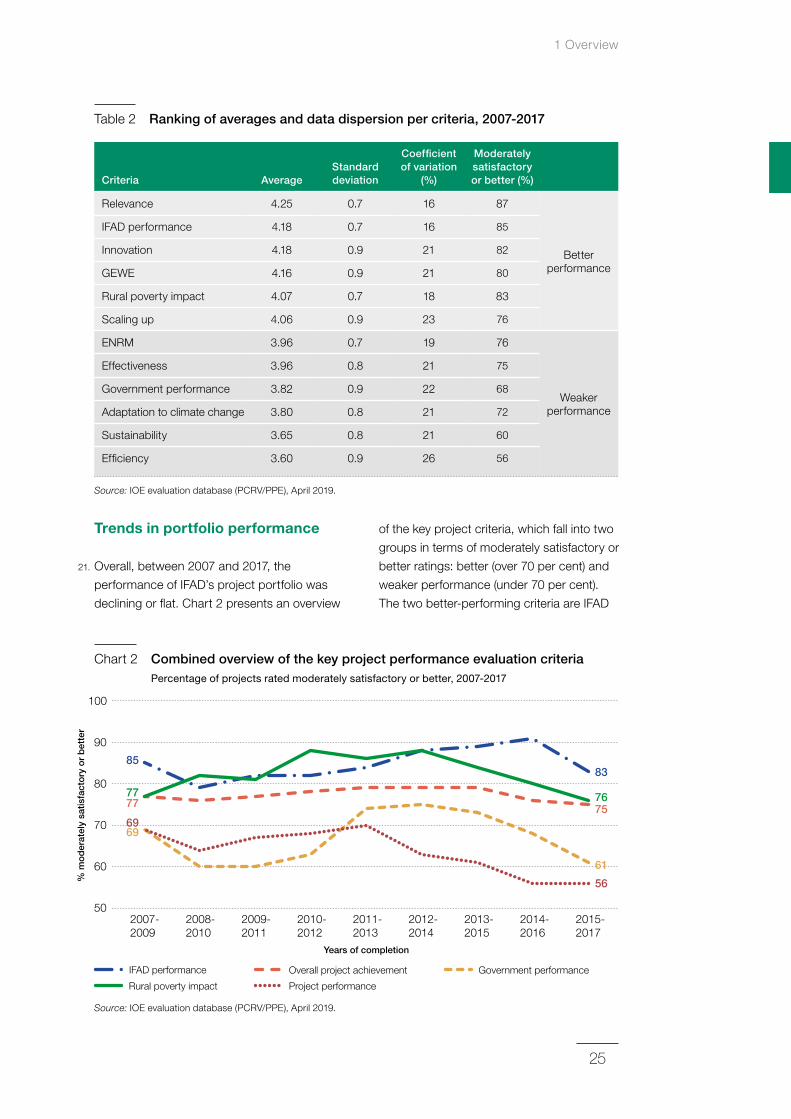
Table 2 Ranking of averages and data dispersion per criteria, 2007‑2017
Criteria AverageStandard deviation
Coefficient of variation
(%)
Moderately satisfactory or better (%)
Relevance 4.25 0.7 16 87
Better performance
IFAD performance 4.18 0.7 16 85
Innovation 4.18 0.9 21 82
GEWE 4.16 0.9 21 80
Rural poverty impact 4.07 0.7 18 83
Scaling up 4.06 0.9 23 76
ENRM 3.96 0.7 19 76
Weaker performance
Effectiveness 3.96 0.8 21 75
Government performance 3.82 0.9 22 68
Adaptation to climate change 3.80 0.8 21 72
Sustainability 3.65 0.8 21 60
Efficiency 3.60 0.9 26 56
Source: IOE evaluation database (PCRV/PPE), April 2019.
2007-2009
2008-2010
2012-2014
2013-2015
2009-2011
2010-2012
2011-2013
% m
od
erat
ely
satis
fact
ory
or
bet
ter
Years of completion
2015-2017
2014-2016
Rural poverty impact
Government performance
Project performance
Overall project achievementIFAD performance
90
50
60
70
80
100
85
7777
6969
83
7675
56
61
Chart 2 Combined overview of the key project performance evaluation criteria Percentage of projects rated moderately satisfactory or better, 2007-2017
Source: IOE evaluation database (PCRV/PPE), April 2019.
2019 Annual Report on Results and Impact of IFAD Operations
26
9 This decline in ratings is also reflected among Management’s PCR ratings starting in 2011.
performance as a partner and rural poverty
impact. They both follow a similar trend of
improvement from 2008-2010, and then
a recent decline, starting in 2012-2014 for
rural poverty impact and in 2014-2016
for IFAD as a partner. The initial period of
improvement coincides with IFAD’s move to
direct supervision and implementation of
its targeting policy.
22. Project performance and government as a
partner show generally lower performance
with moderately satisfactory ratings below
70 per cent in 2007 and 2017. That said, they
also initially improved between 2008 and
2013, with government as a partner reaching
75 per cent in positive ratings in 2012-2014.
However, they both declined to levels below
that of 2007 in the latest period. In part, the
decline in project performance reflects the
inclusion of sustainability along with relevance,
effectiveness and efficiency in its assessment
in projects evaluated from 2016 with project
completion dates as far back as 2013.
Government performance also affects the
four criteria included in project performance
(relevance, effectiveness, sustainability
and efficiency). Therefore, weaker project
performance may be due in part to the decline
in government performance as a partner –
especially in terms of efficiency, which remains
the criteria with the weakest performance, as
indicated in section 2 of the appendices.9
23. Overall project achievement is included
among the positive performing group, as
it is a composite indicator that includes
project performance, rural poverty impact
and other IFAD-specific criteria. Despite
declines in the former two criteria, overall
project achievement has remained flat in part
due to positive performance in IFAD-specific
criteria (e.g. innovation, ENRM, adaptation
to climate change, and GEWE). Although
its performance has been largely flat, there
was a slight decline from 2013-2015. Factors
that may have contributed to this decline
across the main criteria are discussed in the
chapters on project portfolio trends (chapter 2)
and IFAD performance by replenishment
(chapter 4).
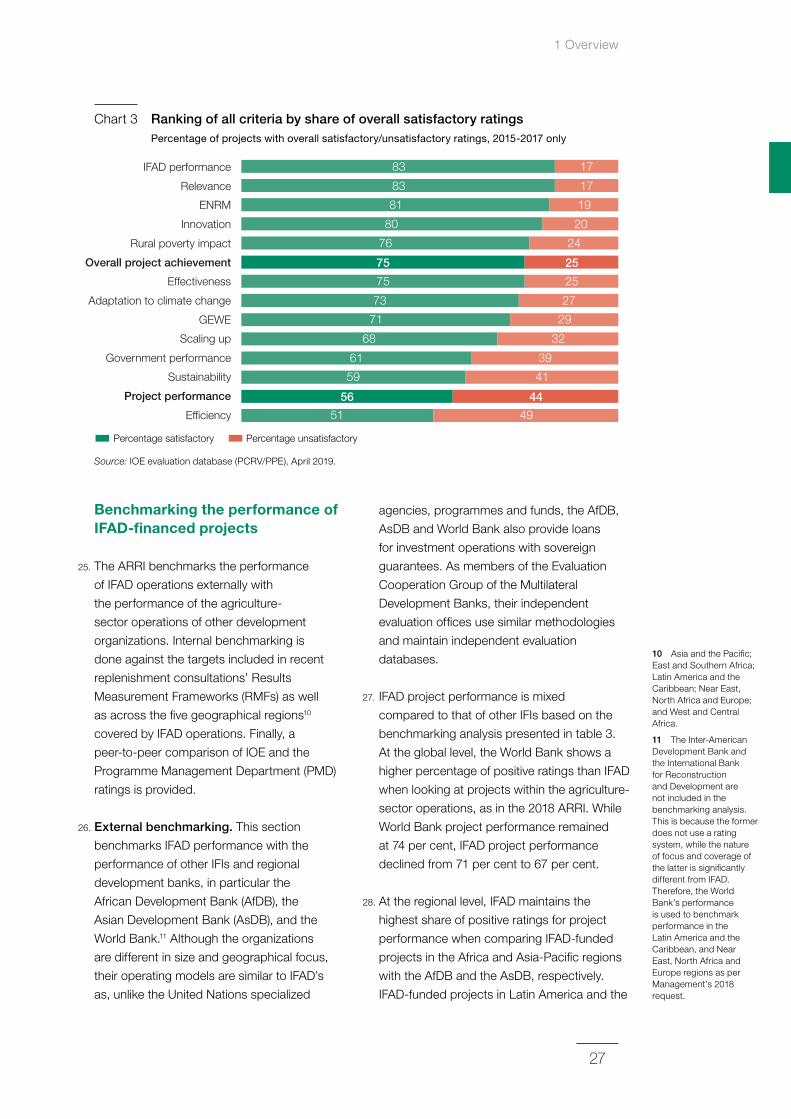
24. Performance of projects completed in
2015‑2017. Chart 3 provides a snapshot of
the most recent performance in 2015-2017 by
ranking individual criteria and the composite
criteria. When ranking criteria based on
the average share of satisfactory ratings
(rating 4 and above), IFAD performance as
a partner, relevance, ENRM and innovation
have the largest share of satisfactory ratings,
with more than 80 per cent of projects rated
as satisfactory. Notably, relevance, IFAD
performance, and innovation are also the top
three criteria in terms of average rating in the
period 2007-2017 in table 2. However, ENRM
ranks only ninth in terms of average ratings,
indicating its recent improved performance.
In contrast, efficiency, sustainability and
government performance show the lowest
share of positive ratings for projects
completed between 2015 and 2017. Weak
performance in efficiency and sustainability
are reflected in the low ranking benchmark of
project performance at 56 per cent. Although
comparatively good performance in relevance
(83 per cent) and effectiveness (75 per cent)
raise project performance slightly above
efficiency, performance in relevance declined
in 2015-2017. Regarding overall project
achievement, rural poverty impact, innovation
and ENRM have a larger share of satisfactory
ratings, whereas GEWE, adaptation to climate
change, and scaling up are among the lower-
ranked criteria, apart from the criteria included
in project performance.
1 Overview
27
10 Asia and the Pacific; East and Southern Africa; Latin America and the Caribbean; Near East, North Africa and Europe; and West and Central Africa.
11 The Inter-American Development Bank and the International Bank for Reconstruction and Development are not included in the benchmarking analysis. This is because the former does not use a rating system, while the nature of focus and coverage of the latter is significantly different from IFAD. Therefore, the World Bank’s performance is used to benchmark performance in the Latin America and the Caribbean, and Near East, North Africa and Europe regions as per Management’s 2018 request.
Benchmarking the performance of IFAD-financed projects
25. The ARRI benchmarks the performance
of IFAD operations externally with
the performance of the agriculture-
sector operations of other development
organizations. Internal benchmarking is
done against the targets included in recent
replenishment consultations’ Results
Measurement Frameworks (RMFs) as well
as across the five geographical regions10
covered by IFAD operations. Finally, a
peer-to-peer comparison of IOE and the
Programme Management Department (PMD)
ratings is provided.
26. External benchmarking. This section
benchmarks IFAD performance with the
performance of other IFIs and regional
development banks, in particular the
African Development Bank (AfDB), the
Asian Development Bank (AsDB), and the
World Bank.11 Although the organizations
are different in size and geographical focus,
their operating models are similar to IFAD’s
as, unlike the United Nations specialized
agencies, programmes and funds, the AfDB,
AsDB and World Bank also provide loans
for investment operations with sovereign
guarantees. As members of the Evaluation
Cooperation Group of the Multilateral
Development Banks, their independent
evaluation offices use similar methodologies
and maintain independent evaluation
databases.
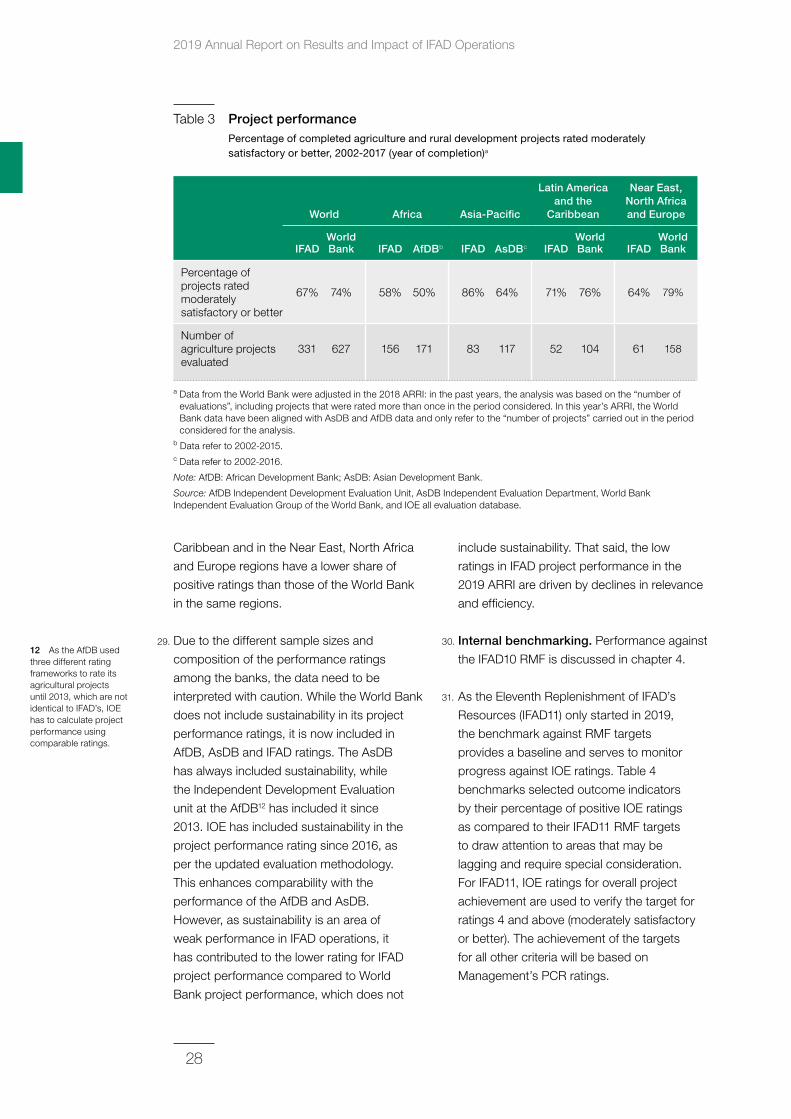
27. IFAD project performance is mixed
compared to that of other IFIs based on the
benchmarking analysis presented in table 3.
At the global level, the World Bank shows a
higher percentage of positive ratings than IFAD
when looking at projects within the agriculture-
sector operations, as in the 2018 ARRI. While
World Bank project performance remained
at 74 per cent, IFAD project performance
declined from 71 per cent to 67 per cent.
28. At the regional level, IFAD maintains the
highest share of positive ratings for project
performance when comparing IFAD-funded
projects in the Africa and Asia-Pacific regions
with the AfDB and the AsDB, respectively.
IFAD-funded projects in Latin America and the
83 17
83 17
81 19
80 20
76 24
75 25
75 25
73 27
71 29
68 32
61 39
59 41
56 44
51 49
Percentage satisfactory Percentage unsatisfactory
Effectiveness
Project performance
Overall project achievement
Rural poverty impact
ENRM
IFAD performance
Ef�ciency
GEWE
Government performance
Adaptation to climate change
Scaling up
Innovation
Relevance
Sustainability
Chart 3 Ranking of all criteria by share of overall satisfactory ratings Percentage of projects with overall satisfactory/unsatisfactory ratings, 2015-2017 only
Source: IOE evaluation database (PCRV/PPE), April 2019.
2019 Annual Report on Results and Impact of IFAD Operations
28
12 As the AfDB used three different rating frameworks to rate its agricultural projects until 2013, which are not identical to IFAD’s, IOE has to calculate project performance using comparable ratings.
Caribbean and in the Near East, North Africa
and Europe regions have a lower share of
positive ratings than those of the World Bank
in the same regions.
29. Due to the different sample sizes and
composition of the performance ratings
among the banks, the data need to be
interpreted with caution. While the World Bank
does not include sustainability in its project
performance ratings, it is now included in
AfDB, AsDB and IFAD ratings. The AsDB
has always included sustainability, while
the Independent Development Evaluation
unit at the AfDB12 has included it since
2013. IOE has included sustainability in the
project performance rating since 2016, as
per the updated evaluation methodology.
This enhances comparability with the
performance of the AfDB and AsDB.
However, as sustainability is an area of
weak performance in IFAD operations, it
has contributed to the lower rating for IFAD
project performance compared to World
Bank project performance, which does not
include sustainability. That said, the low
ratings in IFAD project performance in the
2019 ARRI are driven by declines in relevance
and efficiency.
30. Internal benchmarking. Performance against
the IFAD10 RMF is discussed in chapter 4.
31. As the Eleventh Replenishment of IFAD’s
Resources (IFAD11) only started in 2019,
the benchmark against RMF targets
provides a baseline and serves to monitor
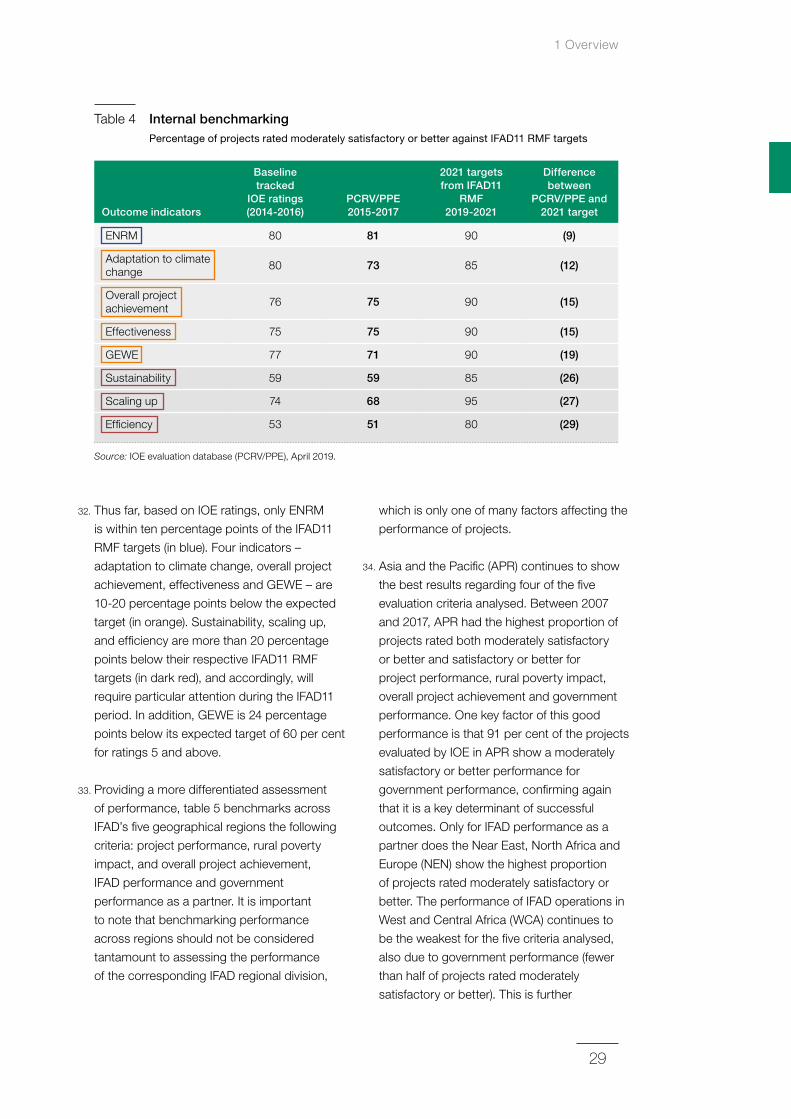
progress against IOE ratings. Table 4
benchmarks selected outcome indicators
by their percentage of positive IOE ratings
as compared to their IFAD11 RMF targets
to draw attention to areas that may be
lagging and require special consideration.
For IFAD11, IOE ratings for overall project
achievement are used to verify the target for
ratings 4 and above (moderately satisfactory
or better). The achievement of the targets
for all other criteria will be based on
Management’s PCR ratings.
Table 3 Project performance Percentage of completed agriculture and rural development projects rated moderately satisfactory or better, 2002-2017 (year of completion)a
World Africa Asia‑Pacific
Latin America and the
Caribbean
Near East, North Africa and Europe
IFAD World Bank IFAD AfDBb IFAD AsDBc IFAD
World Bank IFAD
World Bank
Percentage of projects rated moderately satisfactory or better
67% 74% 58% 50% 86% 64% 71% 76% 64% 79%
Number of agriculture projects evaluated
331 627 156 171 83 117 52 104 61 158
a Data from the World Bank were adjusted in the 2018 ARRI: in the past years, the analysis was based on the “number of evaluations”, including projects that were rated more than once in the period considered. In this year’s ARRI, the World Bank data have been aligned with AsDB and AfDB data and only refer to the “number of projects” carried out in the period considered for the analysis.
b Data refer to 2002-2015. c Data refer to 2002-2016.
Note: AfDB: African Development Bank; AsDB: Asian Development Bank.
Source: AfDB Independent Development Evaluation Unit, AsDB Independent Evaluation Department, World Bank Independent Evaluation Group of the World Bank, and IOE all evaluation database.
1 Overview
29
32. Thus far, based on IOE ratings, only ENRM
is within ten percentage points of the IFAD11
RMF targets (in blue). Four indicators –
adaptation to climate change, overall project
achievement, effectiveness and GEWE – are
10-20 percentage points below the expected
target (in orange). Sustainability, scaling up,
and efficiency are more than 20 percentage
points below their respective IFAD11 RMF
targets (in dark red), and accordingly, will
require particular attention during the IFAD11
period. In addition, GEWE is 24 percentage
points below its expected target of 60 per cent
for ratings 5 and above.
33. Providing a more differentiated assessment
of performance, table 5 benchmarks across
IFAD’s five geographical regions the following
criteria: project performance, rural poverty
impact, and overall project achievement,
IFAD performance and government
performance as a partner. It is important
to note that benchmarking performance
across regions should not be considered
tantamount to assessing the performance
of the corresponding IFAD regional division,
which is only one of many factors affecting the
performance of projects.
34. Asia and the Pacific (APR) continues to show
the best results regarding four of the five
evaluation criteria analysed. Between 2007
and 2017, APR had the highest proportion of
projects rated both moderately satisfactory
or better and satisfactory or better for
project performance, rural poverty impact,
overall project achievement and government
performance. One key factor of this good
performance is that 91 per cent of the projects
evaluated by IOE in APR show a moderately
satisfactory or better performance for
government performance, confirming again
that it is a key determinant of successful
outcomes. Only for IFAD performance as a
partner does the Near East, North Africa and
Europe (NEN) show the highest proportion
of projects rated moderately satisfactory or
better. The performance of IFAD operations in
West and Central Africa (WCA) continues to
be the weakest for the five criteria analysed,
also due to government performance (fewer
than half of projects rated moderately
satisfactory or better). This is further
Table 4 Internal benchmarking Percentage of projects rated moderately satisfactory or better against IFAD11 RMF targets
Outcome indicators
Baseline tracked
IOE ratings (2014‑2016)
PCRV/PPE 2015‑2017
2021 targets from IFAD11
RMF 2019‑2021
Difference between
PCRV/PPE and 2021 target
ENRM 80 81 90 (9)
Adaptation to climate change 80 73 85 (12)
Overall project achievement 76 75 90 (15)
Effectiveness 75 75 90 (15)
GEWE 77 71 90 (19)
Sustainability 59 59 85 (26)
Scaling up 74 68 95 (27)
Efficiency 53 51 80 (29)
Source: IOE evaluation database (PCRV/PPE), April 2019.
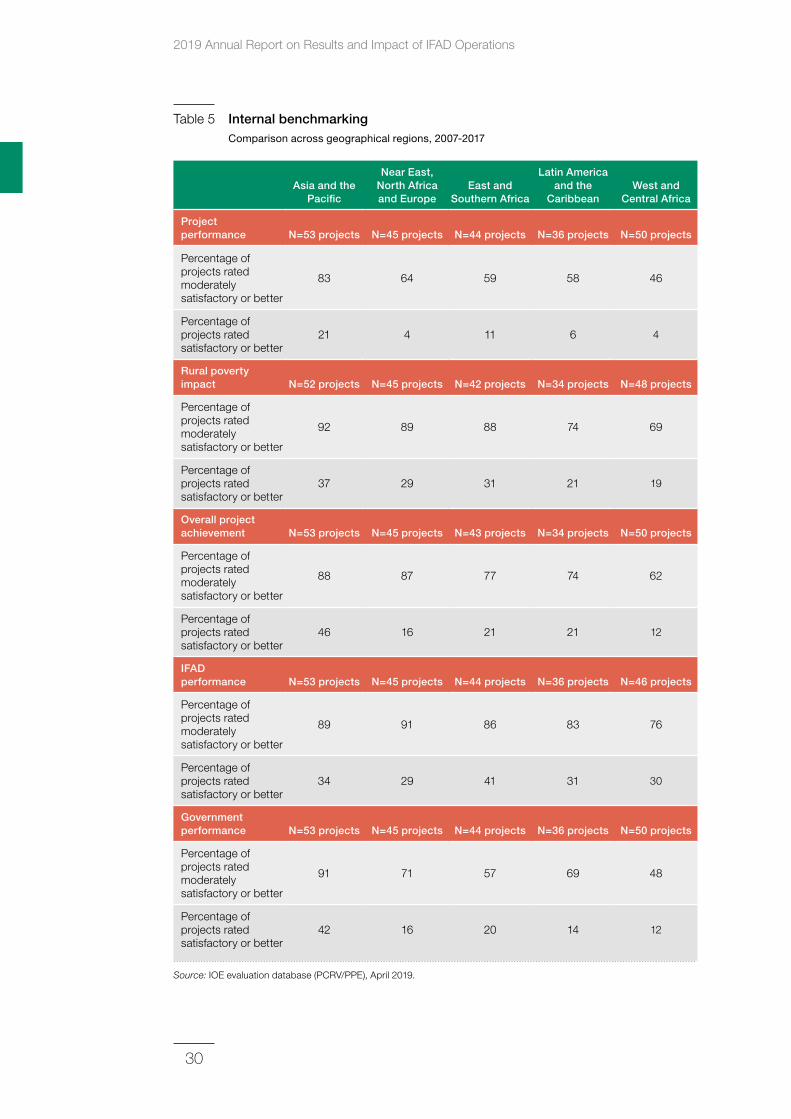
2019 Annual Report on Results and Impact of IFAD Operations
30
Table 5 Internal benchmarking Comparison across geographical regions, 2007-2017
Asia and the Pacific
Near East, North Africa and Europe
East and Southern Africa
Latin America and the
CaribbeanWest and
Central Africa
Project performance N=53 projects N=45 projects N=44 projects N=36 projects N=50 projects
Percentage of projects rated moderately satisfactory or better
83 64 59 58 46
Percentage of projects rated satisfactory or better
21 4 11 6 4
Rural poverty impact N=52 projects N=45 projects N=42 projects N=34 projects N=48 projects
Percentage of projects rated moderately satisfactory or better
92 89 88 74 69
Percentage of projects rated satisfactory or better
37 29 31 21 19
Overall project achievement N=53 projects N=45 projects N=43 projects N=34 projects N=50 projects
Percentage of projects rated moderately satisfactory or better
88 87 77 74 62
Percentage of projects rated satisfactory or better
46 16 21 21 12
IFAD performance N=53 projects N=45 projects N=44 projects N=36 projects N=46 projects
Percentage of projects rated moderately satisfactory or better
89 91 86 83 76
Percentage of projects rated satisfactory or better
34 29 41 31 30
Government performance N=53 projects N=45 projects N=44 projects N=36 projects N=50 projects
Percentage of projects rated moderately satisfactory or better
91 71 57 69 48
Percentage of projects rated satisfactory or better
42 16 20 14 12
Source: IOE evaluation database (PCRV/PPE), April 2019.
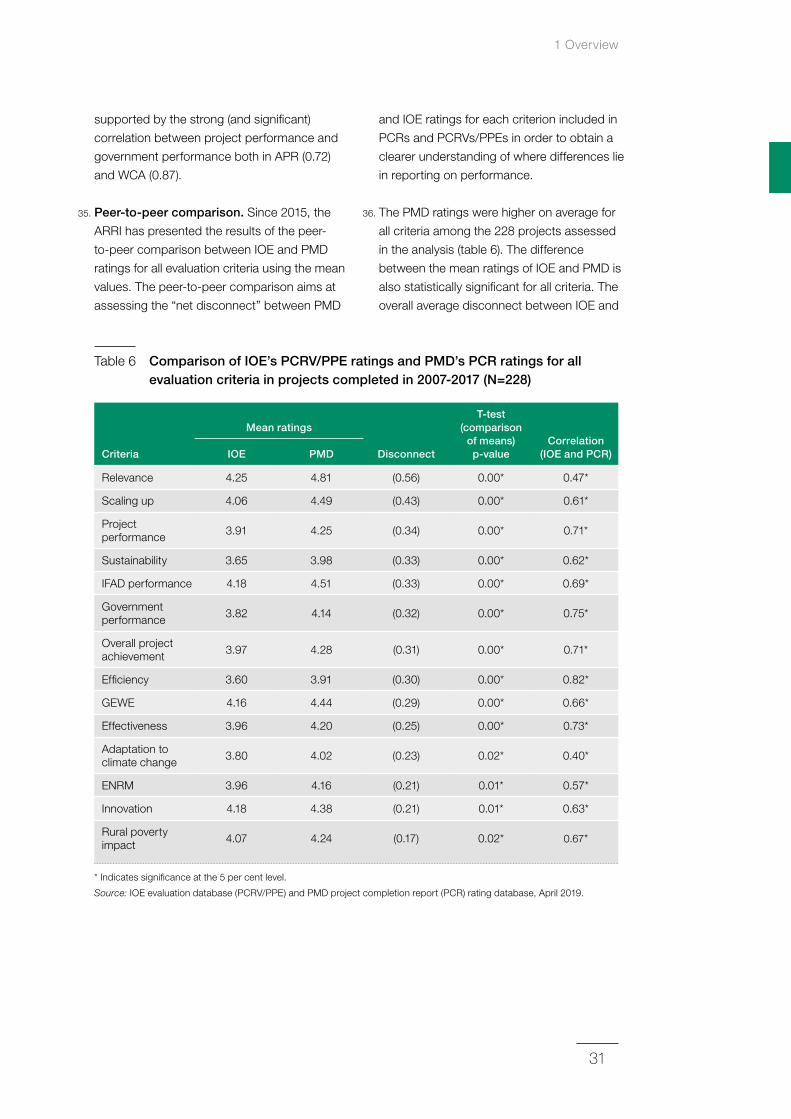
1 Overview
31
supported by the strong (and significant)
correlation between project performance and
government performance both in APR (0.72)
and WCA (0.87).
35. Peer‑to‑peer comparison. Since 2015, the
ARRI has presented the results of the peer-
to-peer comparison between IOE and PMD
ratings for all evaluation criteria using the mean
values. The peer-to-peer comparison aims at
assessing the “net disconnect” between PMD
and IOE ratings for each criterion included in
PCRs and PCRVs/PPEs in order to obtain a
clearer understanding of where differences lie
in reporting on performance.
36. The PMD ratings were higher on average for
all criteria among the 228 projects assessed
in the analysis (table 6). The difference
between the mean ratings of IOE and PMD is
also statistically significant for all criteria. The
overall average disconnect between IOE and
Table 6 Comparison of IOE’s PCRV/PPE ratings and PMD’s PCR ratings for all evaluation criteria in projects completed in 2007‑2017 (N=228)
Criteria
Mean ratings
Disconnect
T‑test (comparison
of means)p‑value
Correlation (IOE and PCR)IOE PMD
Relevance 4.25 4.81 (0.56) 0.00* 0.47*
Scaling up 4.06 4.49 (0.43) 0.00* 0.61*
Project performance 3.91 4.25 (0.34) 0.00* 0.71*
Sustainability 3.65 3.98 (0.33) 0.00* 0.62*
IFAD performance 4.18 4.51 (0.33) 0.00* 0.69*
Government performance 3.82 4.14 (0.32) 0.00* 0.75*
Overall project achievement 3.97 4.28 (0.31) 0.00* 0.71*
Efficiency 3.60 3.91 (0.30) 0.00* 0.82*
GEWE 4.16 4.44 (0.29) 0.00* 0.66*
Effectiveness 3.96 4.20 (0.25) 0.00* 0.73*
Adaptation to climate change 3.80 4.02 (0.23) 0.02* 0.40*
ENRM 3.96 4.16 (0.21) 0.01* 0.57*
Innovation 4.18 4.38 (0.21) 0.01* 0.63*
Rural poverty impact 4.07 4.24 (0.17) 0.02* 0.67*
* Indicates significance at the 5 per cent level.
Source: IOE evaluation database (PCRV/PPE) and PMD project completion report (PCR) rating database, April 2019.
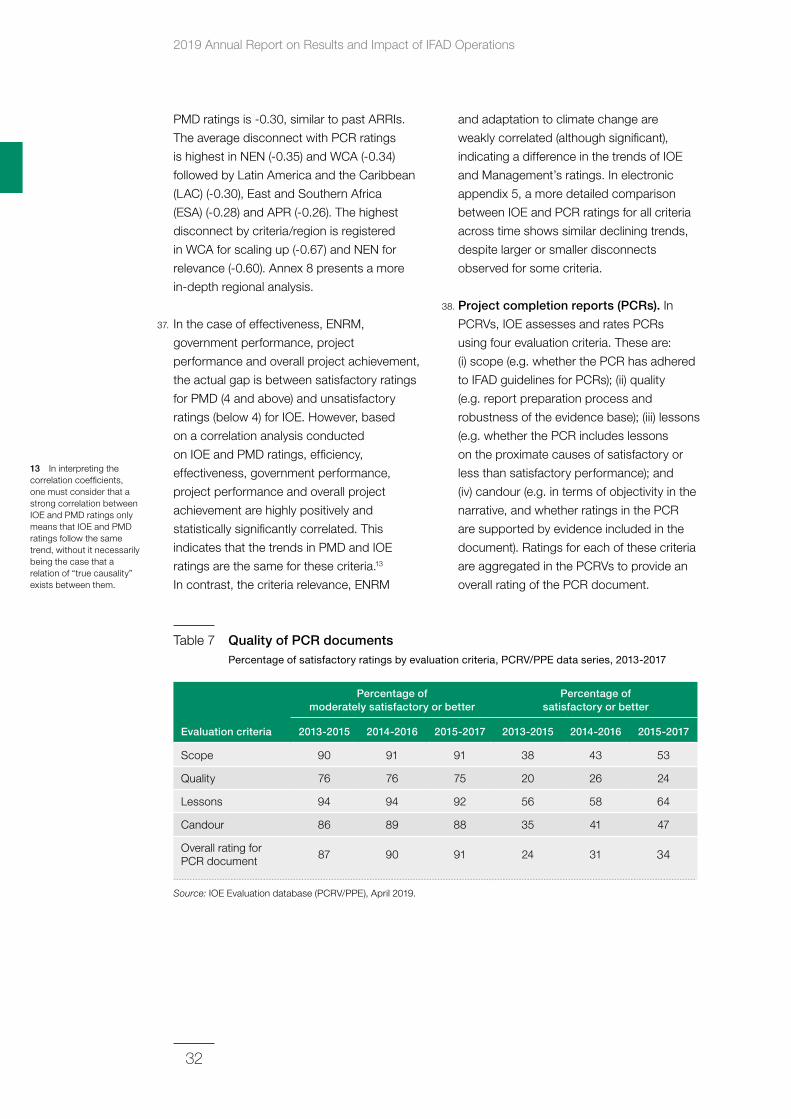
2019 Annual Report on Results and Impact of IFAD Operations
32
13 In interpreting the correlation coefficients, one must consider that a strong correlation between IOE and PMD ratings only means that IOE and PMD ratings follow the same trend, without it necessarily being the case that a relation of “true causality” exists between them.
PMD ratings is -0.30, similar to past ARRIs.
The average disconnect with PCR ratings
is highest in NEN (-0.35) and WCA (-0.34)
followed by Latin America and the Caribbean
(LAC) (-0.30), East and Southern Africa
(ESA) (-0.28) and APR (-0.26). The highest
disconnect by criteria/region is registered
in WCA for scaling up (-0.67) and NEN for
relevance (-0.60). Annex 8 presents a more
in-depth regional analysis.
37. In the case of effectiveness, ENRM,
government performance, project
performance and overall project achievement,
the actual gap is between satisfactory ratings
for PMD (4 and above) and unsatisfactory
ratings (below 4) for IOE. However, based
on a correlation analysis conducted
on IOE and PMD ratings, efficiency,
effectiveness, government performance,
project performance and overall project
achievement are highly positively and
statistically significantly correlated. This
indicates that the trends in PMD and IOE
ratings are the same for these criteria.13
In contrast, the criteria relevance, ENRM
and adaptation to climate change are
weakly correlated (although significant),
indicating a difference in the trends of IOE
and Management’s ratings. In electronic
appendix 5, a more detailed comparison
between IOE and PCR ratings for all criteria
across time shows similar declining trends,
despite larger or smaller disconnects
observed for some criteria.
38. Project completion reports (PCRs). In
PCRVs, IOE assesses and rates PCRs
using four evaluation criteria. These are:
(i) scope (e.g. whether the PCR has adhered
to IFAD guidelines for PCRs); (ii) quality
(e.g. report preparation process and
robustness of the evidence base); (iii) lessons
(e.g. whether the PCR includes lessons
on the proximate causes of satisfactory or
less than satisfactory performance); and
(iv) candour (e.g. in terms of objectivity in the
narrative, and whether ratings in the PCR
are supported by evidence included in the
document). Ratings for each of these criteria
are aggregated in the PCRVs to provide an
overall rating of the PCR document.
Table 7 Quality of PCR documents Percentage of satisfactory ratings by evaluation criteria, PCRV/PPE data series, 2013-2017
Evaluation criteria
Percentage of moderately satisfactory or better
Percentage of satisfactory or better
2013‑2015 2014‑2016 2015‑2017 2013‑2015 2014‑2016 2015‑2017
Scope 90 91 91 38 43 53
Quality 76 76 75 20 26 24
Lessons 94 94 92 56 58 64
Candour 86 89 88 35 41 47
Overall rating for PCR document 87 90 91 24 31 34
Source: IOE Evaluation database (PCRV/PPE), April 2019.

1 Overview
33
39. As shown in table 7, the overall assessment
of PCRs in 2015-2017 improved slightly, with
91 per cent of the PCRs validated by IOE
rated moderately satisfactory or better. The
2019 ARRI finds a flat performance in all four
PCR criteria but a significant increase in the
percentage of satisfactory or better for all
criteria except quality.
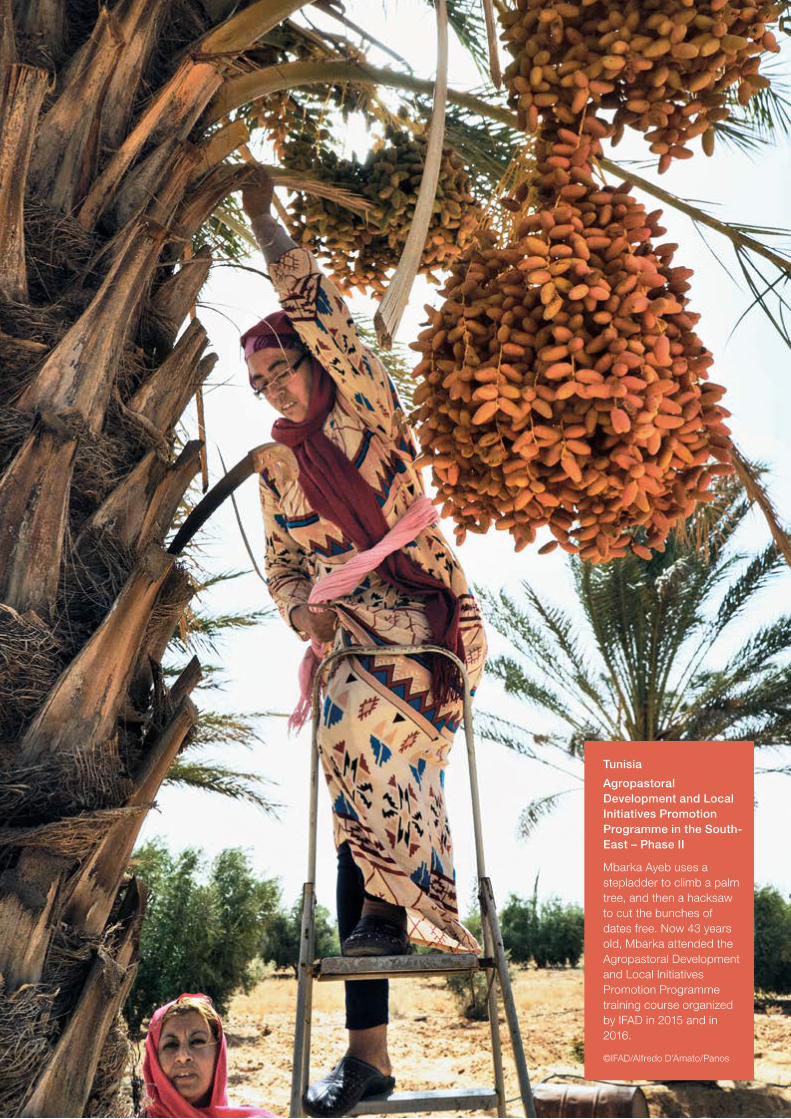
Tunisia
Agropastoral Development and Local Initiatives Promotion Programme in the South‑East – Phase II
Mbarka Ayeb uses a stepladder to climb a palm tree, and then a hacksaw to cut the bunches of dates free. Now 43 years old, Mbarka attended the Agropastoral Development and Local Initiatives Promotion Programme training course organized by IFAD in 2015 and in 2016.
©IFAD/Alfredo D’Amato/Panos
35
Project portfolio trends 2007-2017
2
40. This chapter presents the analysis of the
independent evaluation ratings for the whole
set of evaluation criteria assessed by IOE in
its project-based evaluations according to
trends in performance over time by moving
averages. For each criterion, the percentage
of moderately satisfactory and better ratings
of projects that completed between 2007
and 2017 are presented in three-year moving
periods based on the PCRV/PPE database.
These trends are consistent with those for the
performance of all criteria between 2007 and
2017 based on the “all evaluation” database.
41. Notably, while IOE introduced its first
Evaluation Manual in 2009 and its second
edition in 2015, they were implemented in
evaluations conducted from 2010 and 2016,
respectively, which include projects with
completion dates 2-3 years prior. As a result,
for many criteria there is a change in the
trend line in 2008-2010 and 2011-2013. It is
important to note that the 2015-2017 sample,
which includes 59 projects completed and
evaluated by IOE, will increase next year
as new evaluations become available. The
qualitative analysis by criteria highlights
trends and drivers based only on evaluations
conducted in 2018. Finally, annex 8 provides
detailed analysis comparing IOE and
PCR mean ratings for each criterion as well
as by region.
Rural poverty impact
42. Measuring IFAD’s rural poverty impact is
central to the achievement of its mandate and
its strategic objectives to increase poor rural
people’s productive capacities and benefits
from market participation. Through rural
poverty impact, IFAD contributes to SDG 1
to end poverty, and to SDG 2 to end hunger,
achieve food security and improved nutrition,
and promote sustainable agriculture. For
IFAD11, Management aims to reach 120 million
poor rural people and achieve significant
attributable impact across each of its strategic
objectives and thereby contribute to related
SDG targets: (i) 47 million people with
increased agricultural production (SDG 2.3);
(ii) 46 million people with increased market
access (SDG 2.3); (iii) 24 million people with
greater resilience (SDG 1.5); (iv) 12 million
people with improved nutrition (SDG 2.1); and
(v) 44 million people experiencing economic
mobility (SDGs 1.2 and 2.3).
43. The rural poverty impact criterion has been
consistently rated in project evaluations to
enable comparisons and tracking of trends
over time. IFAD-funded projects rated
positively for rural poverty impact accounted
for 76 per cent of projects in 2015-2017,
lower than the 80 per cent in 2014-2016
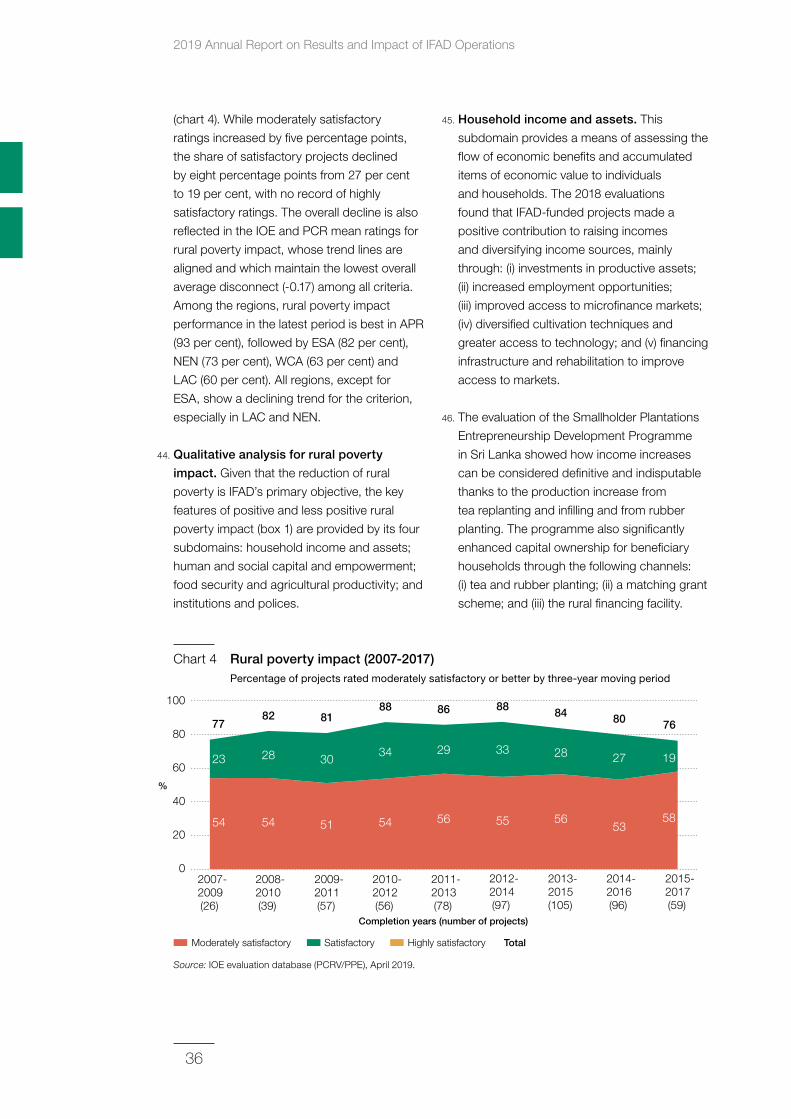
2019 Annual Report on Results and Impact of IFAD Operations
36
(chart 4). While moderately satisfactory
ratings increased by five percentage points,
the share of satisfactory projects declined
by eight percentage points from 27 per cent
to 19 per cent, with no record of highly
satisfactory ratings. The overall decline is also
reflected in the IOE and PCR mean ratings for
rural poverty impact, whose trend lines are
aligned and which maintain the lowest overall
average disconnect (-0.17) among all criteria.
Among the regions, rural poverty impact
performance in the latest period is best in APR
(93 per cent), followed by ESA (82 per cent),
NEN (73 per cent), WCA (63 per cent) and
LAC (60 per cent). All regions, except for
ESA, show a declining trend for the criterion,
especially in LAC and NEN.
44. Qualitative analysis for rural poverty
impact. Given that the reduction of rural
poverty is IFAD’s primary objective, the key
features of positive and less positive rural
poverty impact (box 1) are provided by its four
subdomains: household income and assets;
human and social capital and empowerment;
food security and agricultural productivity; and
institutions and polices.
45. Household income and assets. This
subdomain provides a means of assessing the
flow of economic benefits and accumulated
items of economic value to individuals
and households. The 2018 evaluations
found that IFAD-funded projects made a
positive contribution to raising incomes
and diversifying income sources, mainly
through: (i) investments in productive assets;
(ii) increased employment opportunities;
(iii) improved access to microfinance markets;
(iv) diversified cultivation techniques and
greater access to technology; and (v) financing
infrastructure and rehabilitation to improve
access to markets.
46. The evaluation of the Smallholder Plantations
Entrepreneurship Development Programme
in Sri Lanka showed how income increases
can be considered definitive and indisputable
thanks to the production increase from
tea replanting and infilling and from rubber
planting. The programme also significantly
enhanced capital ownership for beneficiary
households through the following channels:
(i) tea and rubber planting; (ii) a matching grant
scheme; and (iii) the rural financing facility.
2008-2010(39)
2009-2011(57)
2010-2012(56)
2011-2013(78)
2012-2014(97)
0
100
20
40
60
80
2015-2017(59)
%
Completion years (number of projects)
54 54 51 54 56 55 58
23
7782 81
88 86 88
76
28 3034 29 33
2013-2015(105)
56
84
28 19
2014-2016(96)
53
80
27
Total
2007-2009(26)
Moderately satisfactory Satisfactory Highly satisfactory
Chart 4 Rural poverty impact (2007‑2017) Percentage of projects rated moderately satisfactory or better by three-year moving period
Source: IOE evaluation database (PCRV/PPE), April 2019.
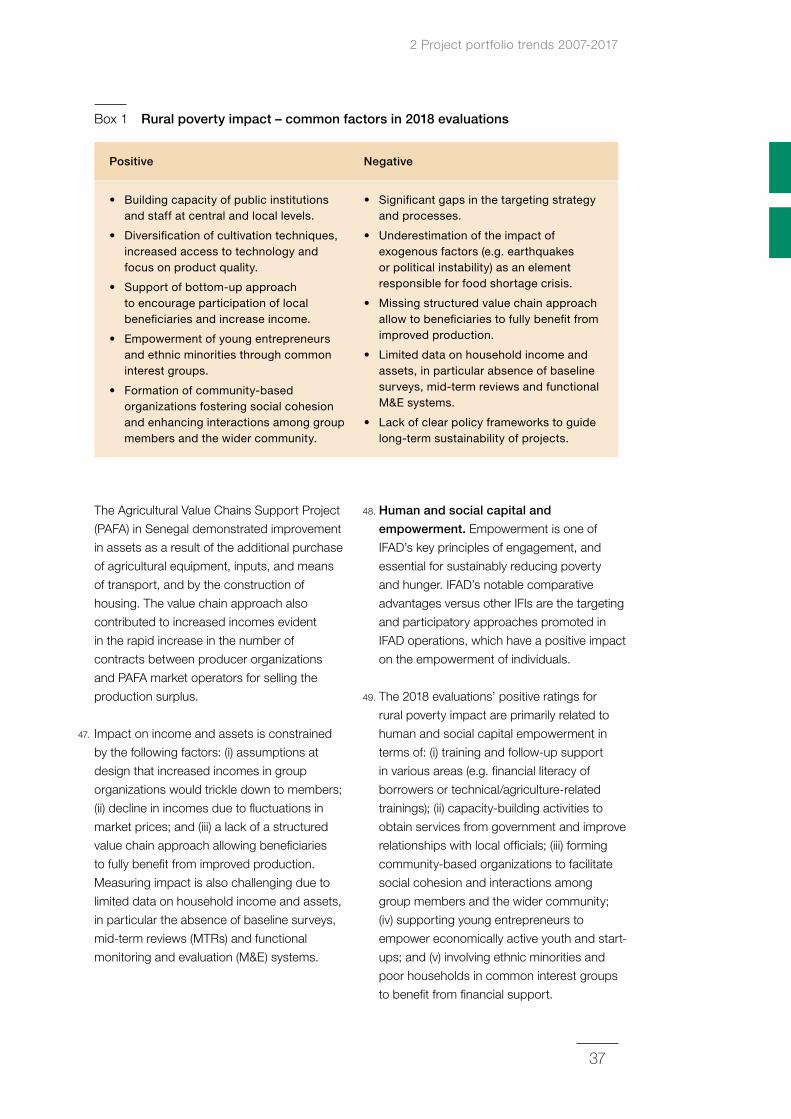
2 Project portfolio trends 2007-2017
37
The Agricultural Value Chains Support Project
(PAFA) in Senegal demonstrated improvement
in assets as a result of the additional purchase
of agricultural equipment, inputs, and means
of transport, and by the construction of
housing. The value chain approach also
contributed to increased incomes evident
in the rapid increase in the number of
contracts between producer organizations
and PAFA market operators for selling the
production surplus.
47. Impact on income and assets is constrained
by the following factors: (i) assumptions at
design that increased incomes in group
organizations would trickle down to members;
(ii) decline in incomes due to fluctuations in
market prices; and (iii) a lack of a structured
value chain approach allowing beneficiaries
to fully benefit from improved production.
Measuring impact is also challenging due to
limited data on household income and assets,
in particular the absence of baseline surveys,
mid-term reviews (MTRs) and functional
monitoring and evaluation (M&E) systems.
48. Human and social capital and
empowerment. Empowerment is one of
IFAD’s key principles of engagement, and
essential for sustainably reducing poverty
and hunger. IFAD’s notable comparative
advantages versus other IFIs are the targeting
and participatory approaches promoted in
IFAD operations, which have a positive impact
on the empowerment of individuals.
49. The 2018 evaluations’ positive ratings for
rural poverty impact are primarily related to
human and social capital empowerment in
terms of: (i) training and follow-up support
in various areas (e.g. financial literacy of
borrowers or technical/agriculture-related
trainings); (ii) capacity-building activities to
obtain services from government and improve
relationships with local officials; (iii) forming
community-based organizations to facilitate
social cohesion and interactions among
group members and the wider community;
(iv) supporting young entrepreneurs to
empower economically active youth and start-
ups; and (v) involving ethnic minorities and
poor households in common interest groups
to benefit from financial support.
Box 1 Rural poverty impact – common factors in 2018 evaluations
Positive Negative
• Building capacity of public institutions and staff at central and local levels.
• Diversification of cultivation techniques, increased access to technology and focus on product quality.
• Support of bottom-up approach to encourage participation of local beneficiaries and increase income.
• Empowerment of young entrepreneurs and ethnic minorities through common interest groups.
• Formation of community-based organizations fostering social cohesion and enhancing interactions among group members and the wider community.
• Significant gaps in the targeting strategy and processes.
• Underestimation of the impact of exogenous factors (e.g. earthquakes or political instability) as an element responsible for food shortage crisis.
• Missing structured value chain approach allow to beneficiaries to fully benefit from improved production.
• Limited data on household income and assets, in particular absence of baseline surveys, mid-term reviews and functional M&E systems.
• Lack of clear policy frameworks to guide long-term sustainability of projects.
2019 Annual Report on Results and Impact of IFAD Operations
38
50. In Nicaragua, the Inclusion of Small-scale
Producers in Value Chains and Market Access
Project (PROCAVAL) was able to strengthen
producers’ capacities (including women and
youth) through technology transfer, counselling
and technical assistance. The demand-driven
approach allowed beneficiaries to access
technical assistance and services adapted
to their needs. Moreover, the strengthened
capacities and productivity allowed producers
to engage in negotiations leading to better
prices and contractual arrangements with
important private entities in national and
international markets.
51. For projects rated unsatisfactory for rural
poverty impact, the 2018 evaluations underline
some key elements constraining positive
outcomes in human and social capital
empowerment, such as: (i) limited duration and
quality of technical assistance for introducing
innovations and technological changes;
(ii) significant gaps in the targeting strategy
and processes (i.e. women and youth); (iii) a
lack of in-depth analysis of the capacities of
grass-roots organizations supported during
implementation; (iv) the absence of long-term
strategies to link beneficiaries with institutions;
and (v) a culture of dependence on external
support by beneficiaries resulting in their
continuous need for support in terms of
planning and administration.
52. In The Gambia, the Participatory Integrated
Watershed Management Project demonstrates
how capacity-building provided to farmers
organizations was not sufficient to ensure
sustained monitoring and maintenance of the
water management structures. Considerable
capacity development and further support
would have been required to enable these
organizations to become functional and self-
sufficient. Village farmers associations were
found most successful in places where they
had been operational for some time and were
established by the farmers themselves, as the
members had common business interests and
even worked as mutual lending organizations.
53. Food security and agricultural productivity.
Food security lies at the heart of IFAD’s
mandate and of SDG 2 to end hunger and
promote sustainable agriculture. Some
positive factors that contribute to food
security and improved agricultural productivity
impact are related to: (i) adoption of crop
diversification activities and good agricultural
practices, with a focus on product quality;
(ii) supporting awareness-raising activities
and access to new food sources to fight
malnutrition; (iii) working with agricultural
enterprises to secure better access to
markets; and (iv) support to microprojects
in agriculture, livestock and fisheries,
together with improved access to water
and irrigation.
54. The adoption of the Farmer Field School (FFS)
approach as a national agricultural extension
methodology has improved the quality of
support and technical assistance to farmers.
In Angola, the Market Oriented Smallholder
Agriculture Project (MOSAP) introduced the
FFS approach, which was scaled up to a
level that helped develop farmers’ capacities,
increase food security and agricultural
production, and establish local producers
associations. Within the FFS approach, the
project aimed at improving the quality of
support and technical assistance farmers
would receive from the relevant government
organizations. The same effect was found
in Burkina Faso, where the Agricultural
Commodity Chain Support Project supported
FFSs, which improved agricultural productivity
through increased yields and reduced
production costs.
55. Projects rated unsatisfactory for rural poverty
impact underscore some constraining factors
related to food security and agricultural
productivity, specifically: (i) underestimation
of the impact of exogenous factors (e.g.
earthquakes or political instability) on
food security; (ii) food shortage issues not
adequately addressed; and (iii) post-harvest
losses. Reliable assessments of food security
2 Project portfolio trends 2007-2017
39
are limited by the lack of robust evidence
and data on nutritional values and child
malnutrition.
56. Institutions and policies. IFAD’s contribution
to the quality and performance of institutions,
policies and regulatory frameworks is critical
to the sustainability and scaling up of IFAD’s
country programme results. IFAD-funded
projects have the potential to generate
changes in public institutions and policies by:
(i) building the capacity of public institutions
and their staff as an entry point for project
interventions; (ii) adopting bottom-up
approaches that decentralize coordination
and management to local organizations and
enhance beneficiary participation; (iii) forming
enterprise-based producer associations
that establish marketing networks to gain
access to larger markets; and (iv) establishing
procedures through district and village
development plans to channel funds
from the central government to the rural
communities.
57. In Kenya, the Smallholder Horticulture
Marketing Programme strengthened the
capacity of service providers as well as staff
from the project management unit (PMU)
and collaborating ministries. Government
staff in the counties were trained in effective
agricultural practices, agribusiness,
value chains, business management and
entrepreneurship. The Tonga Rural Innovation
Project empowered local public agencies
by enhancing the skills of district and town
officers through capacity-building and their
participation in developing community
development plans, and adopting bottom-
up approaches nationwide to foster rural
development.
58. Limited impact in terms of institutions and
policies is mainly due to the lack of clear
policy frameworks to guide the long-term
sustainability of projects, as well as a dearth
of studies on institutions, policies, laws and
regulations that would support capacity
building. The Rural Microfinance and Livestock
Support Programme in Afghanistan required
a clear policy framework for the microfinance
sector. In Ghana, the Root and Tuber
Improvement and Marketing Programme
(RTIMP) lacked a strategy to engage financial
institutions and support their development,
in a market where liquidity was a concern
and no strategic approach to institutional
development was taken.
Project performance criteria
59. This section on project performance, which
is an average of relevance, effectiveness,
efficiency and sustainability, presents rating
trends and key features of better and weaker
performance for the four individual criteria as
well as the composite criterion.
60. Relevance. While IFAD operations remain
highly relevant, with an average of 88 per cent
of all projects between 2007 and 2017
rated as moderately satisfactory or better,
performance recently declined in 2015-2017
to 83 per cent (chart 5). Lower performance
in the latest period was mainly driven by a
15-point decrease in satisfactory ratings
and a 10-point increase in moderately
satisfactory ratings; notably, no project that
completed between 2015 and 2017 was
rated highly satisfactory. Among the regions,
APR shows the strongest performance
(86 per cent), followed by WCA (85 per cent),
ESA (82 per cent) and NEN (82 per cent),
and finally LAC (80 per cent) in 2015-2017.
All regions, except LAC, show a declining
trend for relevance in the latest period. While
the trends in IOE and PCR mean ratings for
relevance are aligned across time and show a
declining trend since 2012-2014, the average
disconnect between IOE and PCR ratings
remains the highest at -0.56 for the period
2007-2017.
61. Qualitative analysis for relevance. The 2018
evaluations identify some good results in the
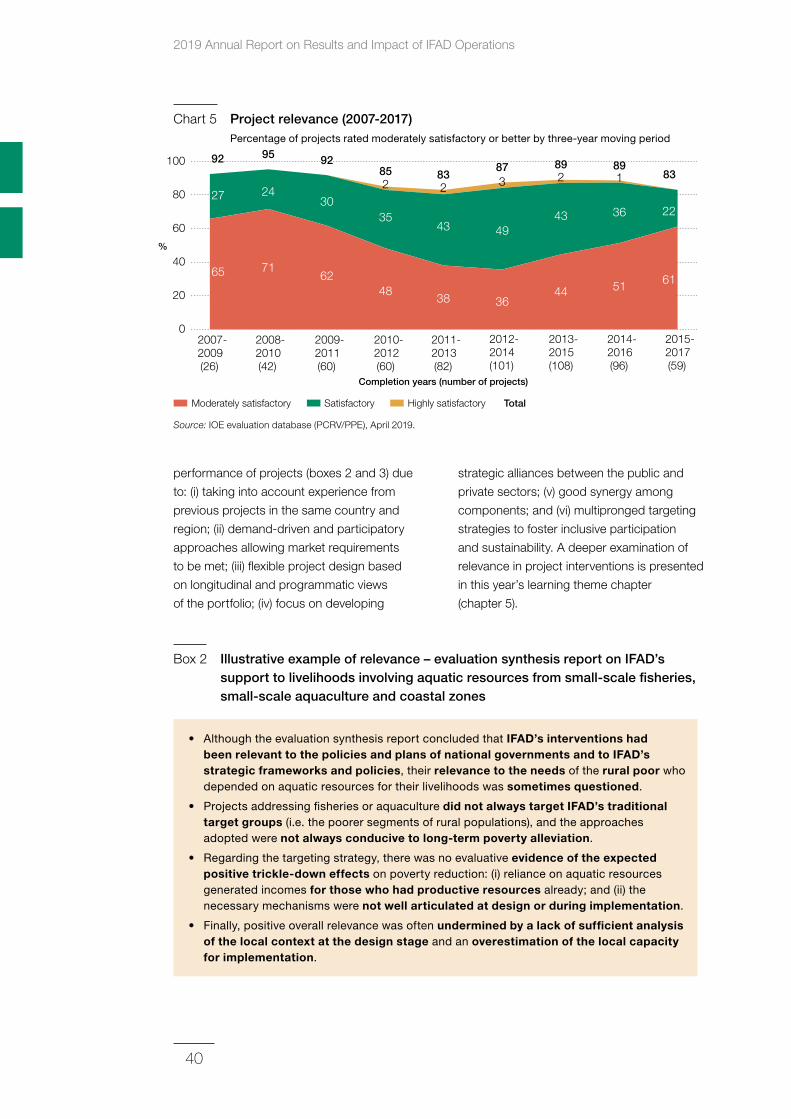
2019 Annual Report on Results and Impact of IFAD Operations
40
performance of projects (boxes 2 and 3) due
to: (i) taking into account experience from
previous projects in the same country and
region; (ii) demand-driven and participatory
approaches allowing market requirements
to be met; (iii) flexible project design based
on longitudinal and programmatic views
of the portfolio; (iv) focus on developing
strategic alliances between the public and
private sectors; (v) good synergy among
components; and (vi) multipronged targeting
strategies to foster inclusive participation
and sustainability. A deeper examination of
relevance in project interventions is presented
in this year’s learning theme chapter
(chapter 5).
2007-2009(26)
2008-2010(42)
2009-2011(60)
2010-2012(60)
2011-2013(82)
2012-2014(101)
0
100
20
40
60
80
2015-2017(59)
%
Completion years (number of projects)
65 7162
4838 36
61
27
95 9285 83
8783
2430
35
2
43
2
49
3
2013-2015(108)
44
89
43
2
2014-2016(96)
51
89
36
1
22
92
TotalModerately satisfactory Satisfactory Highly satisfactory
Chart 5 Project relevance (2007‑2017) Percentage of projects rated moderately satisfactory or better by three-year moving period
Source: IOE evaluation database (PCRV/PPE), April 2019.
Box 2 Illustrative example of relevance – evaluation synthesis report on IFAD’s support to livelihoods involving aquatic resources from small‑scale fisheries, small‑scale aquaculture and coastal zones
• Although the evaluation synthesis report concluded that IFAD’s interventions had been relevant to the policies and plans of national governments and to IFAD’s strategic frameworks and policies, their relevance to the needs of the rural poor who depended on aquatic resources for their livelihoods was sometimes questioned.
• Projects addressing fisheries or aquaculture did not always target IFAD’s traditional target groups (i.e. the poorer segments of rural populations), and the approaches adopted were not always conducive to long-term poverty alleviation.
• Regarding the targeting strategy, there was no evaluative evidence of the expected positive trickle-down effects on poverty reduction: (i) reliance on aquatic resources generated incomes for those who had productive resources already; and (ii) the necessary mechanisms were not well articulated at design or during implementation.
• Finally, positive overall relevance was often undermined by a lack of sufficient analysis of the local context at the design stage and an overestimation of the local capacity for implementation.
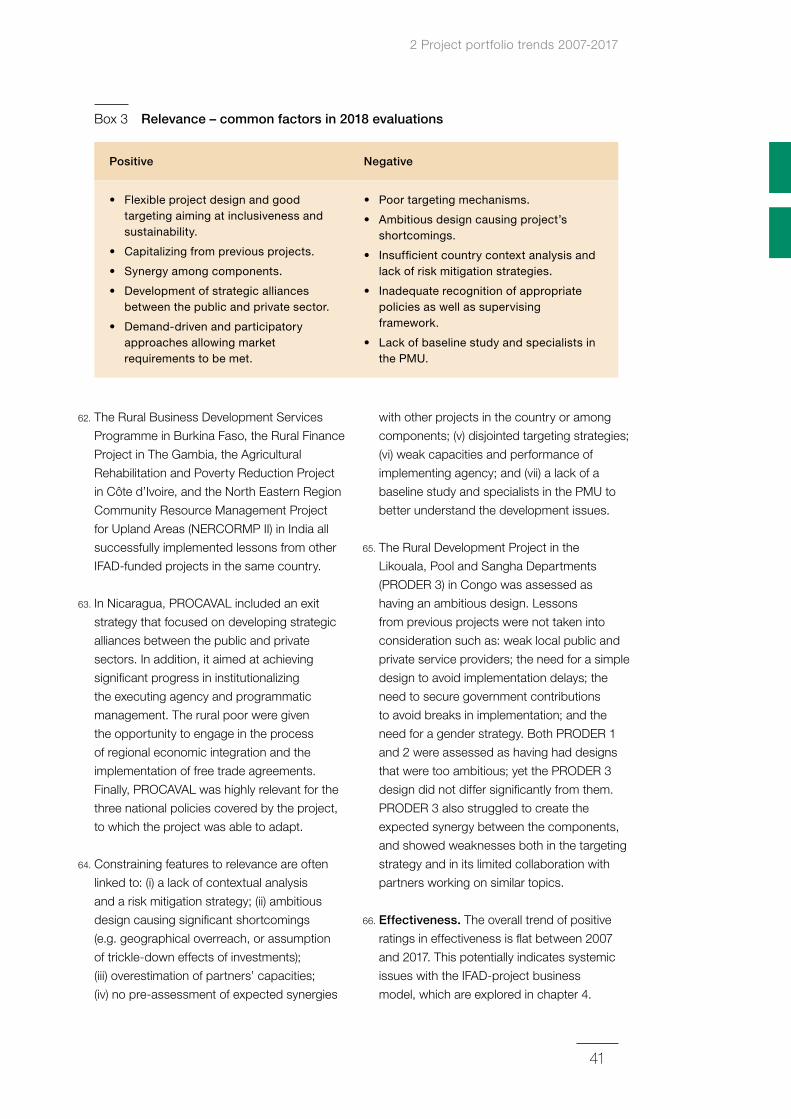
2 Project portfolio trends 2007-2017
41
62. The Rural Business Development Services
Programme in Burkina Faso, the Rural Finance
Project in The Gambia, the Agricultural
Rehabilitation and Poverty Reduction Project
in Côte d’Ivoire, and the North Eastern Region
Community Resource Management Project
for Upland Areas (NERCORMP II) in India all
successfully implemented lessons from other
IFAD-funded projects in the same country.
63. In Nicaragua, PROCAVAL included an exit
strategy that focused on developing strategic
alliances between the public and private
sectors. In addition, it aimed at achieving
significant progress in institutionalizing
the executing agency and programmatic
management. The rural poor were given
the opportunity to engage in the process
of regional economic integration and the
implementation of free trade agreements.
Finally, PROCAVAL was highly relevant for the
three national policies covered by the project,
to which the project was able to adapt.
64. Constraining features to relevance are often
linked to: (i) a lack of contextual analysis
and a risk mitigation strategy; (ii) ambitious
design causing significant shortcomings
(e.g. geographical overreach, or assumption
of trickle-down effects of investments);
(iii) overestimation of partners’ capacities;
(iv) no pre-assessment of expected synergies
with other projects in the country or among
components; (v) disjointed targeting strategies;
(vi) weak capacities and performance of
implementing agency; and (vii) a lack of a
baseline study and specialists in the PMU to
better understand the development issues.
65. The Rural Development Project in the
Likouala, Pool and Sangha Departments
(PRODER 3) in Congo was assessed as
having an ambitious design. Lessons
from previous projects were not taken into
consideration such as: weak local public and
private service providers; the need for a simple
design to avoid implementation delays; the
need to secure government contributions
to avoid breaks in implementation; and the
need for a gender strategy. Both PRODER 1
and 2 were assessed as having had designs
that were too ambitious; yet the PRODER 3
design did not differ significantly from them.
PRODER 3 also struggled to create the
expected synergy between the components,
and showed weaknesses both in the targeting
strategy and in its limited collaboration with
partners working on similar topics.
66. Effectiveness. The overall trend of positive
ratings in effectiveness is flat between 2007
and 2017. This potentially indicates systemic
issues with the IFAD-project business
model, which are explored in chapter 4.
Box 3 Relevance – common factors in 2018 evaluations
Positive Negative
• Flexible project design and good targeting aiming at inclusiveness and sustainability.
• Capitalizing from previous projects.
• Synergy among components.
• Development of strategic alliances between the public and private sector.
• Demand-driven and participatory approaches allowing market requirements to be met.
• Poor targeting mechanisms.
• Ambitious design causing project’s shortcomings.
• Insufficient country context analysis and lack of risk mitigation strategies.
• Inadequate recognition of appropriate policies as well as supervising framework.
• Lack of baseline study and specialists in the PMU.
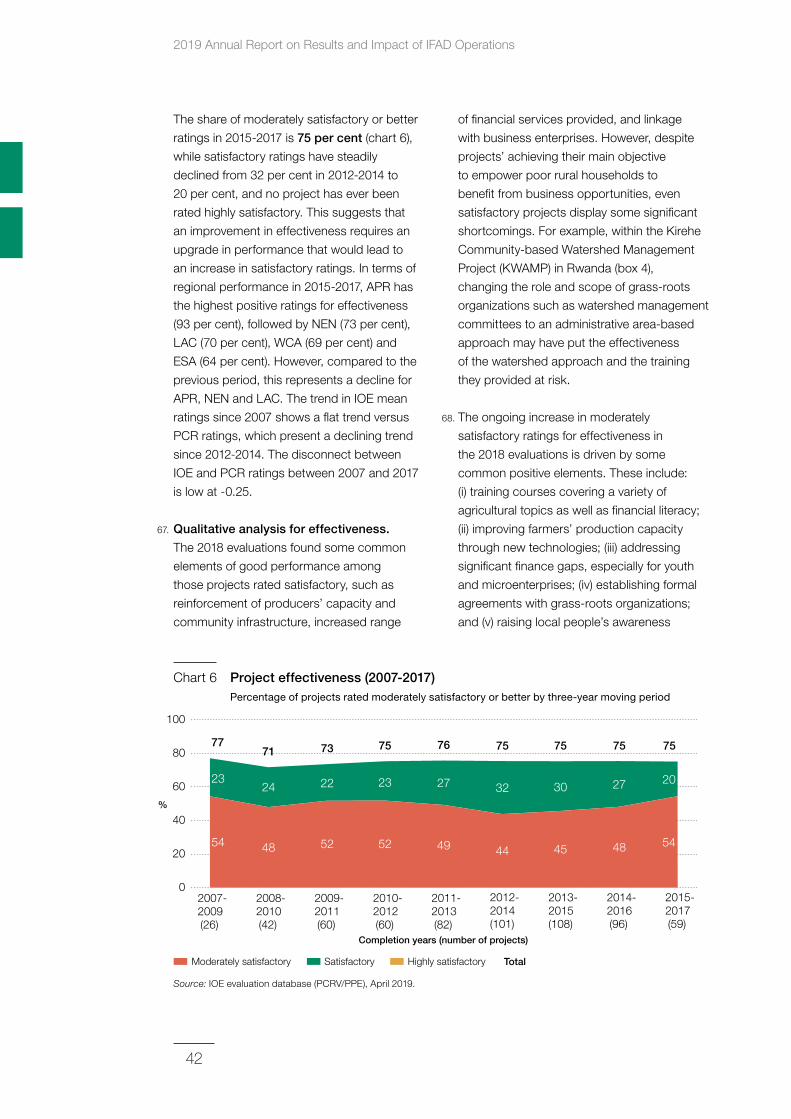
2019 Annual Report on Results and Impact of IFAD Operations
42
The share of moderately satisfactory or better
ratings in 2015-2017 is 75 per cent (chart 6),
while satisfactory ratings have steadily
declined from 32 per cent in 2012-2014 to
20 per cent, and no project has ever been
rated highly satisfactory. This suggests that
an improvement in effectiveness requires an
upgrade in performance that would lead to
an increase in satisfactory ratings. In terms of
regional performance in 2015-2017, APR has
the highest positive ratings for effectiveness
(93 per cent), followed by NEN (73 per cent),
LAC (70 per cent), WCA (69 per cent) and
ESA (64 per cent). However, compared to the
previous period, this represents a decline for
APR, NEN and LAC. The trend in IOE mean
ratings since 2007 shows a flat trend versus
PCR ratings, which present a declining trend
since 2012-2014. The disconnect between
IOE and PCR ratings between 2007 and 2017
is low at -0.25.
67. Qualitative analysis for effectiveness.
The 2018 evaluations found some common
elements of good performance among
those projects rated satisfactory, such as
reinforcement of producers’ capacity and
community infrastructure, increased range
of financial services provided, and linkage
with business enterprises. However, despite
projects’ achieving their main objective
to empower poor rural households to
benefit from business opportunities, even
satisfactory projects display some significant
shortcomings. For example, within the Kirehe
Community-based Watershed Management
Project (KWAMP) in Rwanda (box 4),
changing the role and scope of grass-roots
organizations such as watershed management
committees to an administrative area-based
approach may have put the effectiveness
of the watershed approach and the training
they provided at risk.
68. The ongoing increase in moderately
satisfactory ratings for effectiveness in
the 2018 evaluations is driven by some
common positive elements. These include:
(i) training courses covering a variety of
agricultural topics as well as financial literacy;
(ii) improving farmers’ production capacity
through new technologies; (iii) addressing
significant finance gaps, especially for youth
and microenterprises; (iv) establishing formal
agreements with grass-roots organizations;
and (v) raising local people’s awareness
2007-2009(26)
2008-2010(42)
2009-2011(60)
2010-2012(60)
2011-2013(82)
2012-2014(101)
0
100
20
40
60
80
2015-2017(59)
%
Completion years (number of projects)
54 48 52 52 49 4454
23
71 73 75 76 75 75
24 22 23 27 32
2014-2016(96)
48
75
27
2013-2015(108)
45
75
3020
77
TotalModerately satisfactory Satisfactory Highly satisfactory
Chart 6 Project effectiveness (2007‑2017) Percentage of projects rated moderately satisfactory or better by three-year moving period
Source: IOE evaluation database (PCRV/PPE), April 2019.
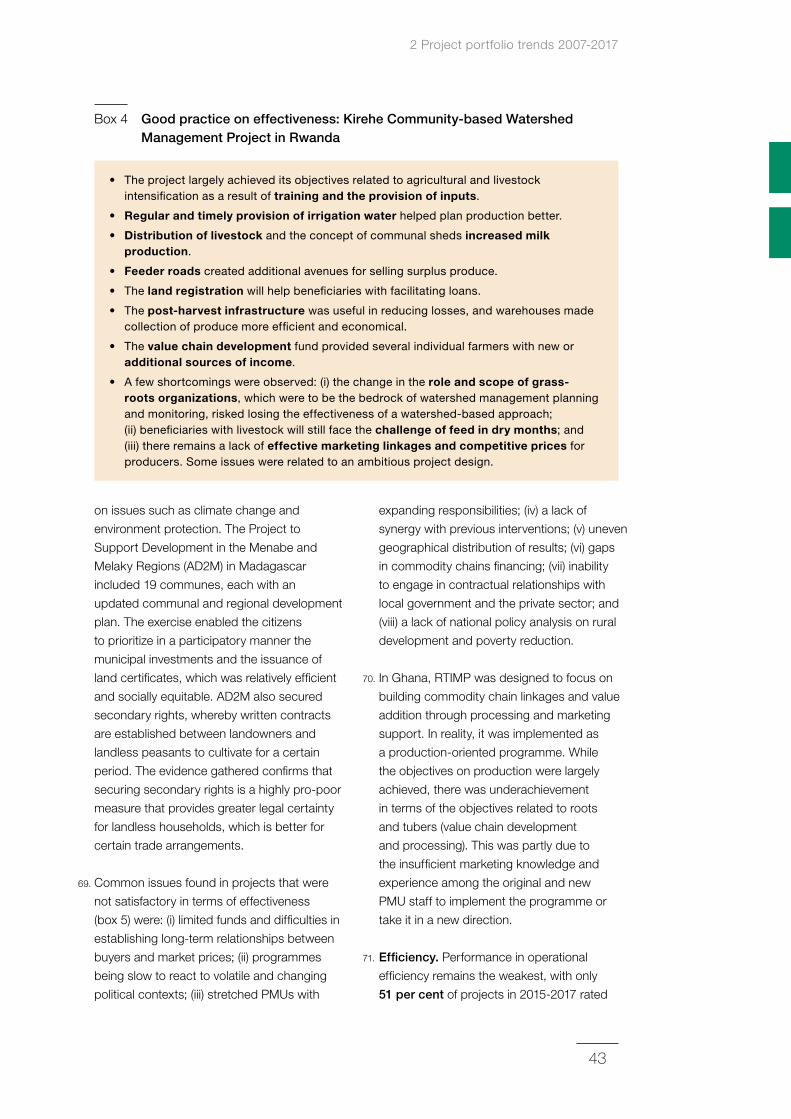
2 Project portfolio trends 2007-2017
43
on issues such as climate change and
environment protection. The Project to
Support Development in the Menabe and
Melaky Regions (AD2M) in Madagascar
included 19 communes, each with an
updated communal and regional development
plan. The exercise enabled the citizens
to prioritize in a participatory manner the
municipal investments and the issuance of
land certificates, which was relatively efficient
and socially equitable. AD2M also secured
secondary rights, whereby written contracts
are established between landowners and
landless peasants to cultivate for a certain
period. The evidence gathered confirms that
securing secondary rights is a highly pro-poor
measure that provides greater legal certainty
for landless households, which is better for
certain trade arrangements.
69. Common issues found in projects that were
not satisfactory in terms of effectiveness
(box 5) were: (i) limited funds and difficulties in
establishing long-term relationships between
buyers and market prices; (ii) programmes
being slow to react to volatile and changing
political contexts; (iii) stretched PMUs with
expanding responsibilities; (iv) a lack of
synergy with previous interventions; (v) uneven
geographical distribution of results; (vi) gaps
in commodity chains financing; (vii) inability
to engage in contractual relationships with
local government and the private sector; and
(viii) a lack of national policy analysis on rural
development and poverty reduction.
70. In Ghana, RTIMP was designed to focus on
building commodity chain linkages and value
addition through processing and marketing
support. In reality, it was implemented as
a production-oriented programme. While
the objectives on production were largely
achieved, there was underachievement
in terms of the objectives related to roots
and tubers (value chain development
and processing). This was partly due to
the insufficient marketing knowledge and
experience among the original and new
PMU staff to implement the programme or
take it in a new direction.
71. Efficiency. Performance in operational
efficiency remains the weakest, with only
51 per cent of projects in 2015-2017 rated
Box 4 Good practice on effectiveness: Kirehe Community‑based Watershed Management Project in Rwanda
• The project largely achieved its objectives related to agricultural and livestock intensification as a result of training and the provision of inputs.
• Regular and timely provision of irrigation water helped plan production better.
• Distribution of livestock and the concept of communal sheds increased milk production.
• Feeder roads created additional avenues for selling surplus produce.
• The land registration will help beneficiaries with facilitating loans.
• The post-harvest infrastructure was useful in reducing losses, and warehouses made collection of produce more efficient and economical.
• The value chain development fund provided several individual farmers with new or additional sources of income.
• A few shortcomings were observed: (i) the change in the role and scope of grass-roots organizations, which were to be the bedrock of watershed management planning and monitoring, risked losing the effectiveness of a watershed-based approach; (ii) beneficiaries with livestock will still face the challenge of feed in dry months; and (iii) there remains a lack of effective marketing linkages and competitive prices for producers. Some issues were related to an ambitious project design.
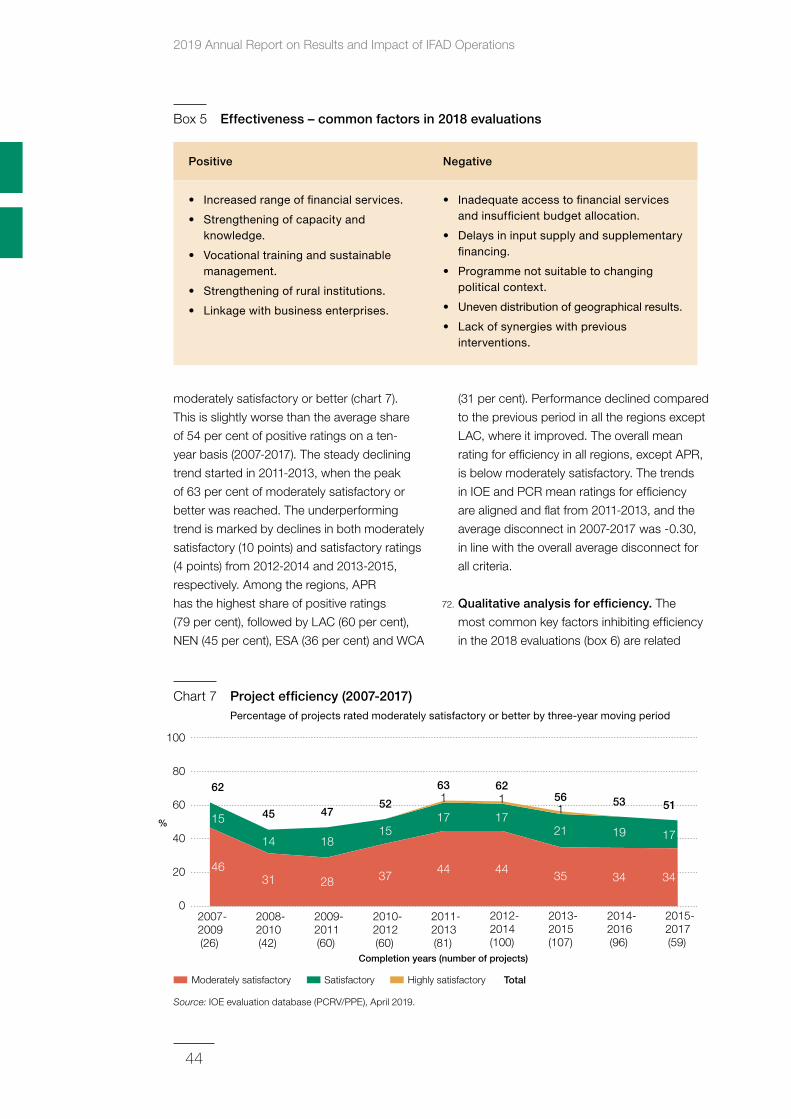
2019 Annual Report on Results and Impact of IFAD Operations
44
moderately satisfactory or better (chart 7).
This is slightly worse than the average share
of 54 per cent of positive ratings on a ten-
year basis (2007-2017). The steady declining
trend started in 2011-2013, when the peak
of 63 per cent of moderately satisfactory or
better was reached. The underperforming
trend is marked by declines in both moderately
satisfactory (10 points) and satisfactory ratings
(4 points) from 2012-2014 and 2013-2015,
respectively. Among the regions, APR
has the highest share of positive ratings
(79 per cent), followed by LAC (60 per cent),
NEN (45 per cent), ESA (36 per cent) and WCA
(31 per cent). Performance declined compared
to the previous period in all the regions except
LAC, where it improved. The overall mean
rating for efficiency in all regions, except APR,
is below moderately satisfactory. The trends
in IOE and PCR mean ratings for efficiency
are aligned and flat from 2011-2013, and the
average disconnect in 2007-2017 was -0.30,
in line with the overall average disconnect for
all criteria.
72. Qualitative analysis for efficiency. The
most common key factors inhibiting efficiency
in the 2018 evaluations (box 6) are related
Box 5 Effectiveness – common factors in 2018 evaluations
Positive Negative
• Increased range of financial services.
• Strengthening of capacity and knowledge.
• Vocational training and sustainable management.
• Strengthening of rural institutions.
• Linkage with business enterprises.
• Inadequate access to financial services and insufficient budget allocation.
• Delays in input supply and supplementary financing.
• Programme not suitable to changing political context.
• Uneven distribution of geographical results.
• Lack of synergies with previous interventions.
2007-2009(26)
2008-2010(42)
2009-2011(60)
2010-2012(60)
2011-2013(81)
2012-2014(100)
0
100
20
40
60
80
2015-2017(59)
%
Completion years (number of projects)
4631 28 37 44 44
34
15 45 4752
63 62
51
14 1815
17
1
17
1
2014-2016(96)
34
53
19
2013-2015(107)
35
56
21
1
17
62
TotalModerately satisfactory Satisfactory Highly satisfactory
Chart 7 Project efficiency (2007‑2017) Percentage of projects rated moderately satisfactory or better by three-year moving period
Source: IOE evaluation database (PCRV/PPE), April 2019.
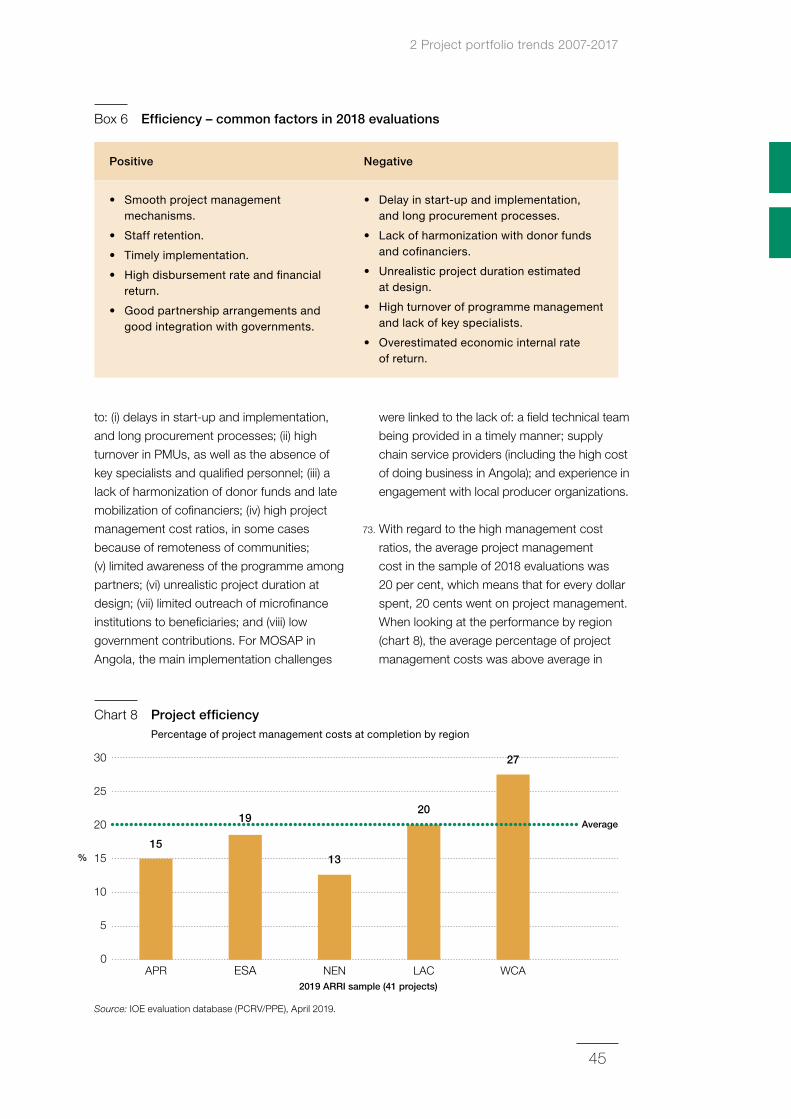
2 Project portfolio trends 2007-2017
45
to: (i) delays in start-up and implementation,
and long procurement processes; (ii) high
turnover in PMUs, as well as the absence of
key specialists and qualified personnel; (iii) a
lack of harmonization of donor funds and late
mobilization of cofinanciers; (iv) high project
management cost ratios, in some cases
because of remoteness of communities;
(v) limited awareness of the programme among
partners; (vi) unrealistic project duration at
design; (vii) limited outreach of microfinance
institutions to beneficiaries; and (viii) low
government contributions. For MOSAP in
Angola, the main implementation challenges
were linked to the lack of: a field technical team
being provided in a timely manner; supply
chain service providers (including the high cost
of doing business in Angola); and experience in
engagement with local producer organizations.
73. With regard to the high management cost
ratios, the average project management
cost in the sample of 2018 evaluations was
20 per cent, which means that for every dollar
spent, 20 cents went on project management.
When looking at the performance by region
(chart 8), the average percentage of project
management costs was above average in
Box 6 Efficiency – common factors in 2018 evaluations
Positive Negative
• Smooth project management mechanisms.
• Staff retention.
• Timely implementation.
• High disbursement rate and financial return.
• Good partnership arrangements and good integration with governments.
• Delay in start-up and implementation, and long procurement processes.
• Lack of harmonization with donor funds and cofinanciers.
• Unrealistic project duration estimated at design.
• High turnover of programme management and lack of key specialists.
• Overestimated economic internal rate of return.
APR
15
10
5
15
20
25
30
0
%
2019 ARRI sample (41 projects)
WCA
27
LAC
20
NEN
13
ESA
19Average
Chart 8 Project efficiency Percentage of project management costs at completion by region
Source: IOE evaluation database (PCRV/PPE), April 2019.
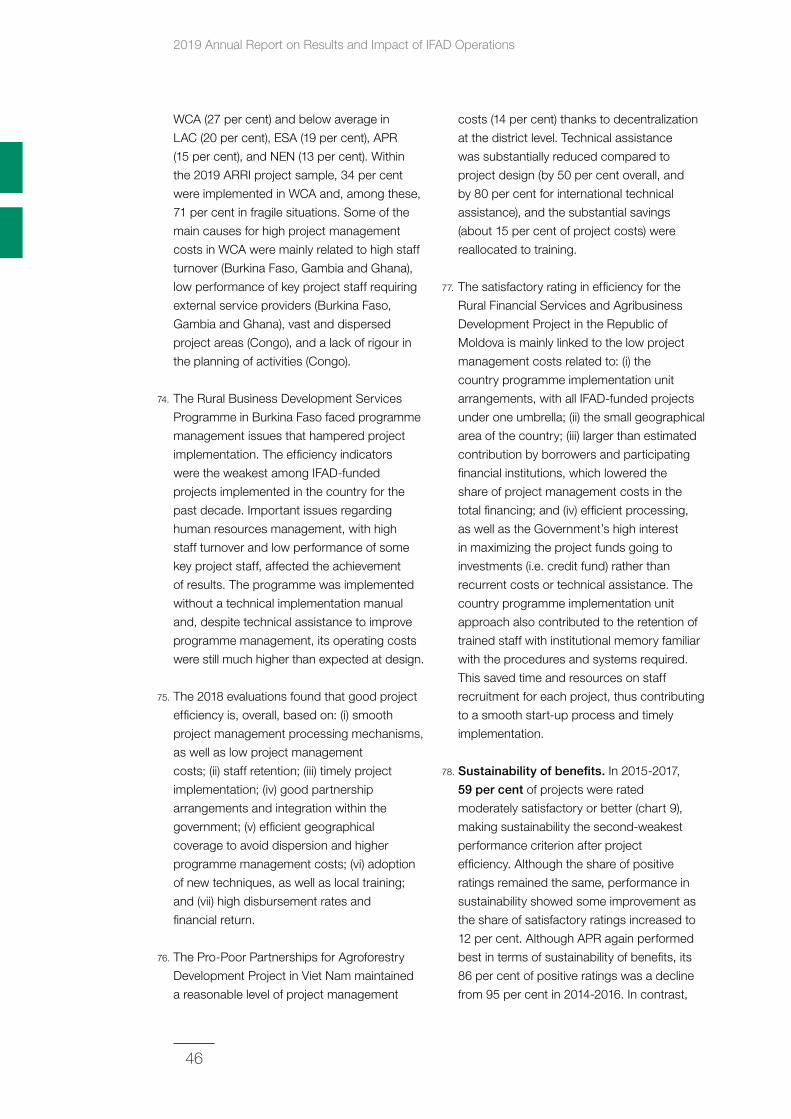
2019 Annual Report on Results and Impact of IFAD Operations
46
WCA (27 per cent) and below average in
LAC (20 per cent), ESA (19 per cent), APR
(15 per cent), and NEN (13 per cent). Within
the 2019 ARRI project sample, 34 per cent
were implemented in WCA and, among these,
71 per cent in fragile situations. Some of the
main causes for high project management
costs in WCA were mainly related to high staff
turnover (Burkina Faso, Gambia and Ghana),
low performance of key project staff requiring
external service providers (Burkina Faso,
Gambia and Ghana), vast and dispersed
project areas (Congo), and a lack of rigour in
the planning of activities (Congo).
74. The Rural Business Development Services
Programme in Burkina Faso faced programme
management issues that hampered project
implementation. The efficiency indicators
were the weakest among IFAD-funded
projects implemented in the country for the
past decade. Important issues regarding
human resources management, with high
staff turnover and low performance of some
key project staff, affected the achievement
of results. The programme was implemented
without a technical implementation manual
and, despite technical assistance to improve
programme management, its operating costs
were still much higher than expected at design.
75. The 2018 evaluations found that good project
efficiency is, overall, based on: (i) smooth
project management processing mechanisms,
as well as low project management
costs; (ii) staff retention; (iii) timely project
implementation; (iv) good partnership
arrangements and integration within the
government; (v) efficient geographical
coverage to avoid dispersion and higher
programme management costs; (vi) adoption
of new techniques, as well as local training;
and (vii) high disbursement rates and
financial return.
76. The Pro-Poor Partnerships for Agroforestry
Development Project in Viet Nam maintained
a reasonable level of project management
costs (14 per cent) thanks to decentralization
at the district level. Technical assistance
was substantially reduced compared to
project design (by 50 per cent overall, and
by 80 per cent for international technical
assistance), and the substantial savings
(about 15 per cent of project costs) were
reallocated to training.
77. The satisfactory rating in efficiency for the
Rural Financial Services and Agribusiness
Development Project in the Republic of
Moldova is mainly linked to the low project
management costs related to: (i) the
country programme implementation unit
arrangements, with all IFAD-funded projects
under one umbrella; (ii) the small geographical
area of the country; (iii) larger than estimated
contribution by borrowers and participating
financial institutions, which lowered the
share of project management costs in the
total financing; and (iv) efficient processing,
as well as the Government’s high interest
in maximizing the project funds going to
investments (i.e. credit fund) rather than
recurrent costs or technical assistance. The
country programme implementation unit
approach also contributed to the retention of
trained staff with institutional memory familiar
with the procedures and systems required.
This saved time and resources on staff
recruitment for each project, thus contributing
to a smooth start-up process and timely
implementation.
78. Sustainability of benefits. In 2015-2017,
59 per cent of projects were rated
moderately satisfactory or better (chart 9),
making sustainability the second-weakest
performance criterion after project
efficiency. Although the share of positive
ratings remained the same, performance in
sustainability showed some improvement as
the share of satisfactory ratings increased to
12 per cent. Although APR again performed
best in terms of sustainability of benefits, its
86 per cent of positive ratings was a decline
from 95 per cent in 2014-2016. In contrast,
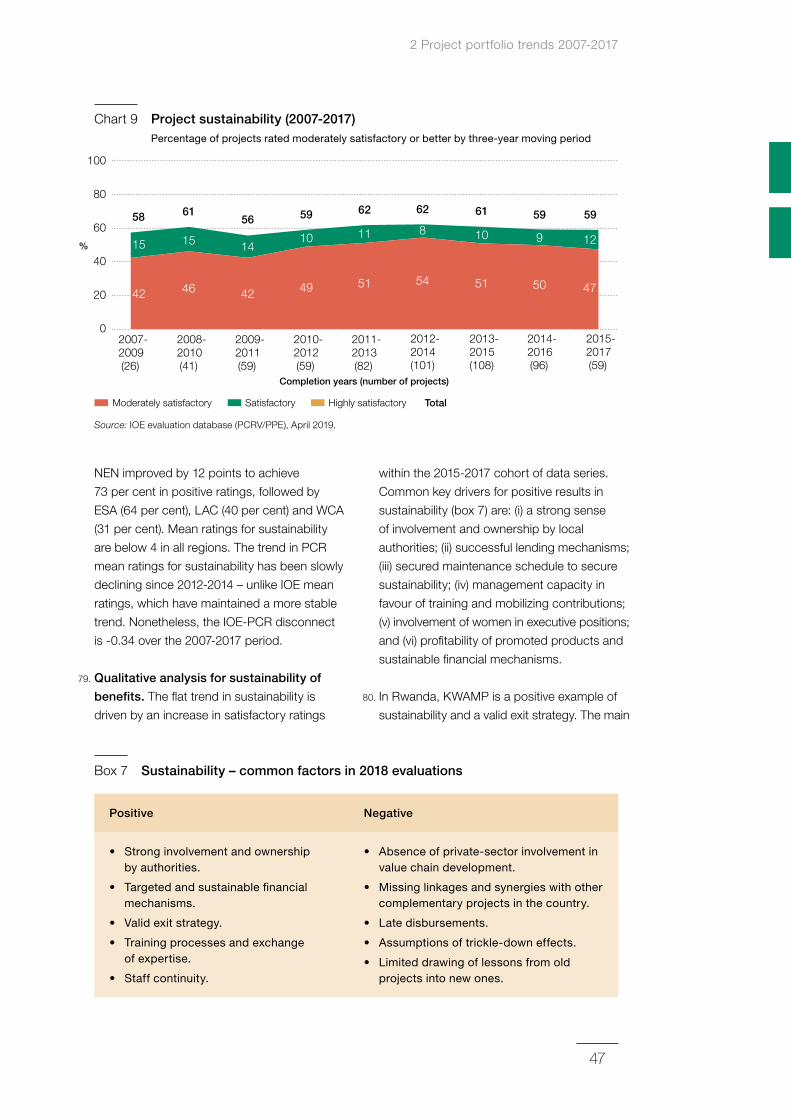
2 Project portfolio trends 2007-2017
47
NEN improved by 12 points to achieve
73 per cent in positive ratings, followed by
ESA (64 per cent), LAC (40 per cent) and WCA
(31 per cent). Mean ratings for sustainability
are below 4 in all regions. The trend in PCR
mean ratings for sustainability has been slowly
declining since 2012-2014 – unlike IOE mean
ratings, which have maintained a more stable
trend. Nonetheless, the IOE-PCR disconnect
is -0.34 over the 2007-2017 period.
79. Qualitative analysis for sustainability of
benefits. The flat trend in sustainability is
driven by an increase in satisfactory ratings
within the 2015-2017 cohort of data series.
Common key drivers for positive results in
sustainability (box 7) are: (i) a strong sense
of involvement and ownership by local
authorities; (ii) successful lending mechanisms;
(iii) secured maintenance schedule to secure
sustainability; (iv) management capacity in
favour of training and mobilizing contributions;
(v) involvement of women in executive positions;
and (vi) profitability of promoted products and
sustainable financial mechanisms.
80. In Rwanda, KWAMP is a positive example of
sustainability and a valid exit strategy. The main
2007-2009(26)
2008-2010(41)
2009-2011(59)
2010-2012(59)
2011-2013(82)
2012-2014(101)
0
100
20
40
60
80
2015-2017(59)
%
Completion years (number of projects)
42 46 42 49 51 5447
15
6156 59 62 62 59
15 1410 11 8
2014-2016(96)
50
59
9
2013-2015(108)
51
61
10 12
58
TotalModerately satisfactory Satisfactory Highly satisfactory
Chart 9 Project sustainability (2007‑2017) Percentage of projects rated moderately satisfactory or better by three-year moving period
Source: IOE evaluation database (PCRV/PPE), April 2019.
Box 7 Sustainability – common factors in 2018 evaluations
Positive Negative
• Strong involvement and ownership by authorities.
• Targeted and sustainable financial mechanisms.
• Valid exit strategy.
• Training processes and exchange of expertise.
• Staff continuity.
• Absence of private-sector involvement in value chain development.
• Missing linkages and synergies with other complementary projects in the country.
• Late disbursements.
• Assumptions of trickle-down effects.
• Limited drawing of lessons from old projects into new ones.
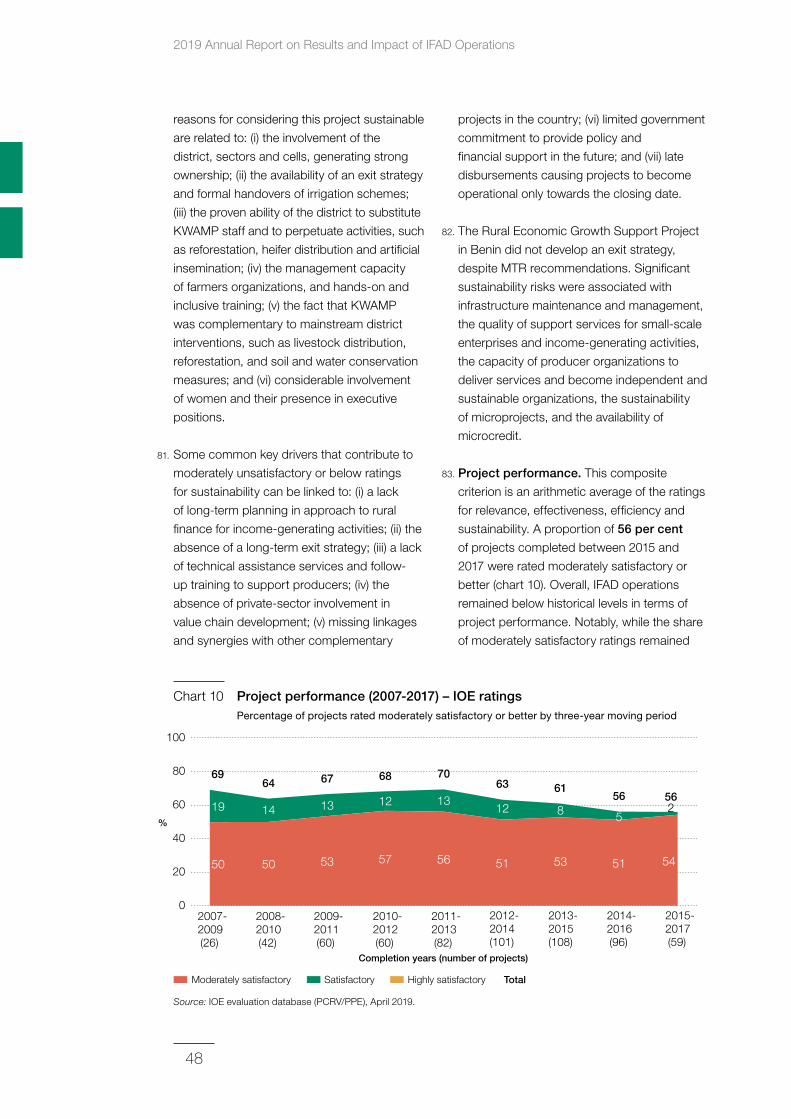
2019 Annual Report on Results and Impact of IFAD Operations
48
reasons for considering this project sustainable
are related to: (i) the involvement of the
district, sectors and cells, generating strong
ownership; (ii) the availability of an exit strategy
and formal handovers of irrigation schemes;
(iii) the proven ability of the district to substitute
KWAMP staff and to perpetuate activities, such
as reforestation, heifer distribution and artificial
insemination; (iv) the management capacity
of farmers organizations, and hands-on and
inclusive training; (v) the fact that KWAMP
was complementary to mainstream district
interventions, such as livestock distribution,
reforestation, and soil and water conservation
measures; and (vi) considerable involvement
of women and their presence in executive
positions.
81. Some common key drivers that contribute to
moderately unsatisfactory or below ratings
for sustainability can be linked to: (i) a lack
of long-term planning in approach to rural
finance for income-generating activities; (ii) the
absence of a long-term exit strategy; (iii) a lack
of technical assistance services and follow-
up training to support producers; (iv) the
absence of private-sector involvement in
value chain development; (v) missing linkages
and synergies with other complementary
projects in the country; (vi) limited government
commitment to provide policy and
financial support in the future; and (vii) late
disbursements causing projects to become
operational only towards the closing date.
82. The Rural Economic Growth Support Project
in Benin did not develop an exit strategy,
despite MTR recommendations. Significant
sustainability risks were associated with
infrastructure maintenance and management,
the quality of support services for small-scale
enterprises and income-generating activities,
the capacity of producer organizations to
deliver services and become independent and
sustainable organizations, the sustainability
of microprojects, and the availability of
microcredit.
83. Project performance. This composite
criterion is an arithmetic average of the ratings
for relevance, effectiveness, efficiency and
sustainability. A proportion of 56 per cent
of projects completed between 2015 and
2017 were rated moderately satisfactory or
better (chart 10). Overall, IFAD operations
remained below historical levels in terms of
project performance. Notably, while the share
of moderately satisfactory ratings remained
2007-2009(26)
2008-2010(42)
2009-2011(60)
2010-2012(60)
2011-2013(82)
2012-2014(101)
0
100
20
40
60
80
2015-2017(59)
%
Completion years (number of projects)
50 50 53 57 56 51 54
19
64 67 68 7063
14 13 12 1312
2013-2015(108)
53
61
8
2014-2016(96)
51
56
5
562
69
TotalModerately satisfactory Satisfactory Highly satisfactory
Chart 10 Project performance (2007‑2017) – IOE ratings Percentage of projects rated moderately satisfactory or better by three-year moving period
Source: IOE evaluation database (PCRV/PPE), April 2019.
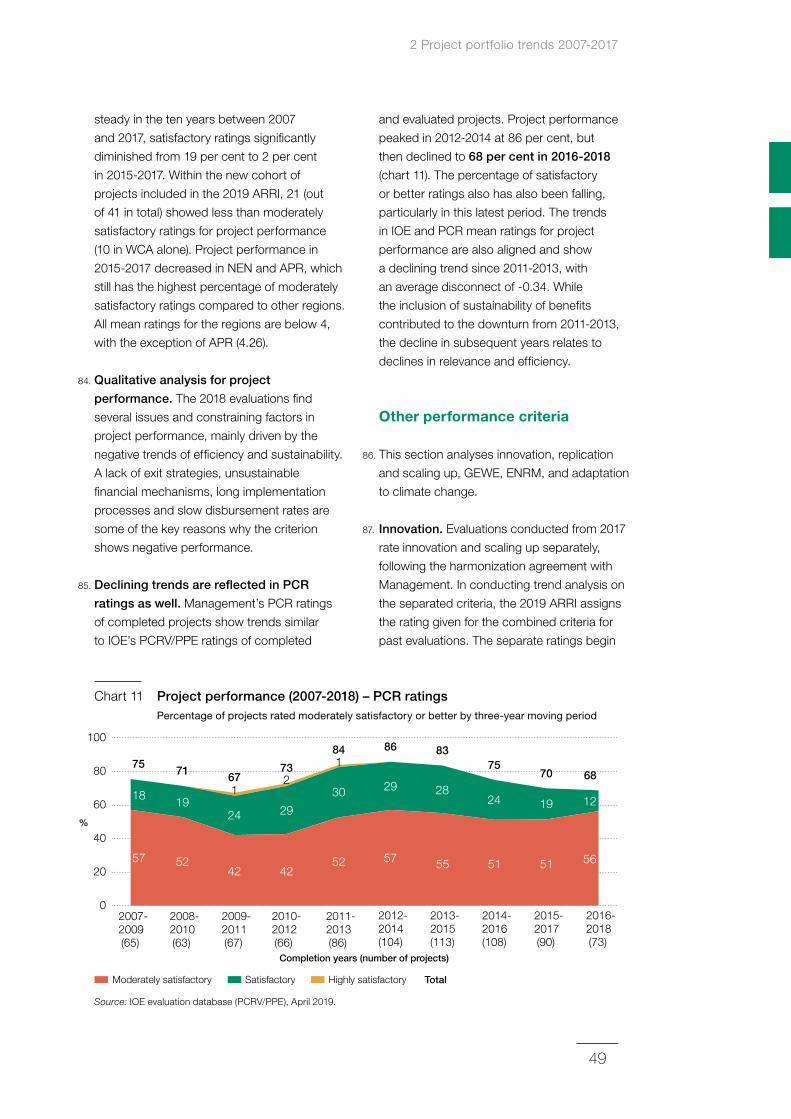
2 Project portfolio trends 2007-2017
49
steady in the ten years between 2007
and 2017, satisfactory ratings significantly
diminished from 19 per cent to 2 per cent
in 2015-2017. Within the new cohort of
projects included in the 2019 ARRI, 21 (out
of 41 in total) showed less than moderately
satisfactory ratings for project performance
(10 in WCA alone). Project performance in
2015-2017 decreased in NEN and APR, which
still has the highest percentage of moderately
satisfactory ratings compared to other regions.
All mean ratings for the regions are below 4,
with the exception of APR (4.26).
84. Qualitative analysis for project
performance. The 2018 evaluations find
several issues and constraining factors in
project performance, mainly driven by the
negative trends of efficiency and sustainability.
A lack of exit strategies, unsustainable
financial mechanisms, long implementation
processes and slow disbursement rates are
some of the key reasons why the criterion
shows negative performance.
85. Declining trends are reflected in PCR
ratings as well. Management’s PCR ratings
of completed projects show trends similar
to IOE’s PCRV/PPE ratings of completed
and evaluated projects. Project performance
peaked in 2012-2014 at 86 per cent, but
then declined to 68 per cent in 2016‑2018
(chart 11). The percentage of satisfactory
or better ratings also has also been falling,
particularly in this latest period. The trends
in IOE and PCR mean ratings for project
performance are also aligned and show
a declining trend since 2011-2013, with
an average disconnect of -0.34. While
the inclusion of sustainability of benefits
contributed to the downturn from 2011-2013,
the decline in subsequent years relates to
declines in relevance and efficiency.
Other performance criteria
86. This section analyses innovation, replication
and scaling up, GEWE, ENRM, and adaptation
to climate change.
87. Innovation. Evaluations conducted from 2017
rate innovation and scaling up separately,
following the harmonization agreement with
Management. In conducting trend analysis on
the separated criteria, the 2019 ARRI assigns
the rating given for the combined criteria for
past evaluations. The separate ratings begin
2007-2009(65)
2008-2010(63)
2009-2011(67)
2010-2012(66)
2011-2013(86)
2012-2014(104)
0
100
20
40
60
80
2016-2018(73)
%
Completion years (number of projects)
57 5242 42
52 57 56
18
71 6773
84 86
68
191
24 29
230
1
29
2013-2015(113)
55
83
28
2014-2016(108)
51
75
24
2015-2017(90)
51
70
19 12
75
TotalModerately satisfactory Satisfactory Highly satisfactory
Chart 11 Project performance (2007‑2018) – PCR ratings Percentage of projects rated moderately satisfactory or better by three-year moving period
Source: IOE evaluation database (PCRV/PPE), April 2019.
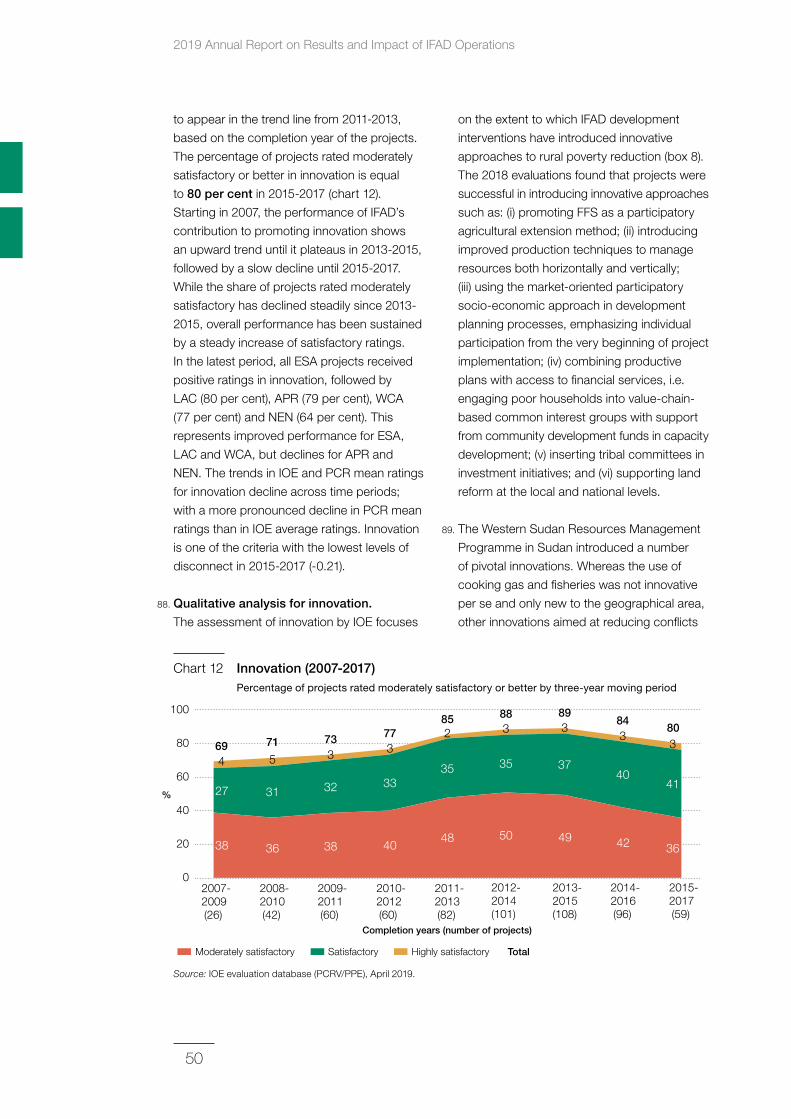
2019 Annual Report on Results and Impact of IFAD Operations
50
to appear in the trend line from 2011-2013,
based on the completion year of the projects.
The percentage of projects rated moderately
satisfactory or better in innovation is equal
to 80 per cent in 2015-2017 (chart 12).
Starting in 2007, the performance of IFAD’s
contribution to promoting innovation shows
an upward trend until it plateaus in 2013-2015,
followed by a slow decline until 2015-2017.
While the share of projects rated moderately
satisfactory has declined steadily since 2013-
2015, overall performance has been sustained
by a steady increase of satisfactory ratings.
In the latest period, all ESA projects received
positive ratings in innovation, followed by
LAC (80 per cent), APR (79 per cent), WCA
(77 per cent) and NEN (64 per cent). This
represents improved performance for ESA,
LAC and WCA, but declines for APR and
NEN. The trends in IOE and PCR mean ratings
for innovation decline across time periods;
with a more pronounced decline in PCR mean
ratings than in IOE average ratings. Innovation
is one of the criteria with the lowest levels of
disconnect in 2015-2017 (-0.21).
88. Qualitative analysis for innovation.
The assessment of innovation by IOE focuses
on the extent to which IFAD development
interventions have introduced innovative
approaches to rural poverty reduction (box 8).
The 2018 evaluations found that projects were
successful in introducing innovative approaches
such as: (i) promoting FFS as a participatory
agricultural extension method; (ii) introducing
improved production techniques to manage
resources both horizontally and vertically;
(iii) using the market-oriented participatory
socio-economic approach in development
planning processes, emphasizing individual
participation from the very beginning of project
implementation; (iv) combining productive
plans with access to financial services, i.e.
engaging poor households into value-chain-
based common interest groups with support
from community development funds in capacity
development; (v) inserting tribal committees in
investment initiatives; and (vi) supporting land
reform at the local and national levels.
89. The Western Sudan Resources Management
Programme in Sudan introduced a number
of pivotal innovations. Whereas the use of
cooking gas and fisheries was not innovative
per se and only new to the geographical area,
other innovations aimed at reducing conflicts
2007-2009(26)
2008-2010(42)
2009-2011(60)
2010-2012(60)
2011-2013(82)
2012-2014(101)
0
100
20
40
60
80
2015-2017(59)
%
Completion years (number of projects)
38 36 38 4048 50
36
27
71 73 7785 88
31
5 3
32 33
3
35
2
35
3
2013-2015(108)
49
89
37
3
2014-2016(96)
42
84
40
3803
41
469
TotalModerately satisfactory Satisfactory Highly satisfactory
Chart 12 Innovation (2007‑2017) Percentage of projects rated moderately satisfactory or better by three-year moving period
Source: IOE evaluation database (PCRV/PPE), April 2019.
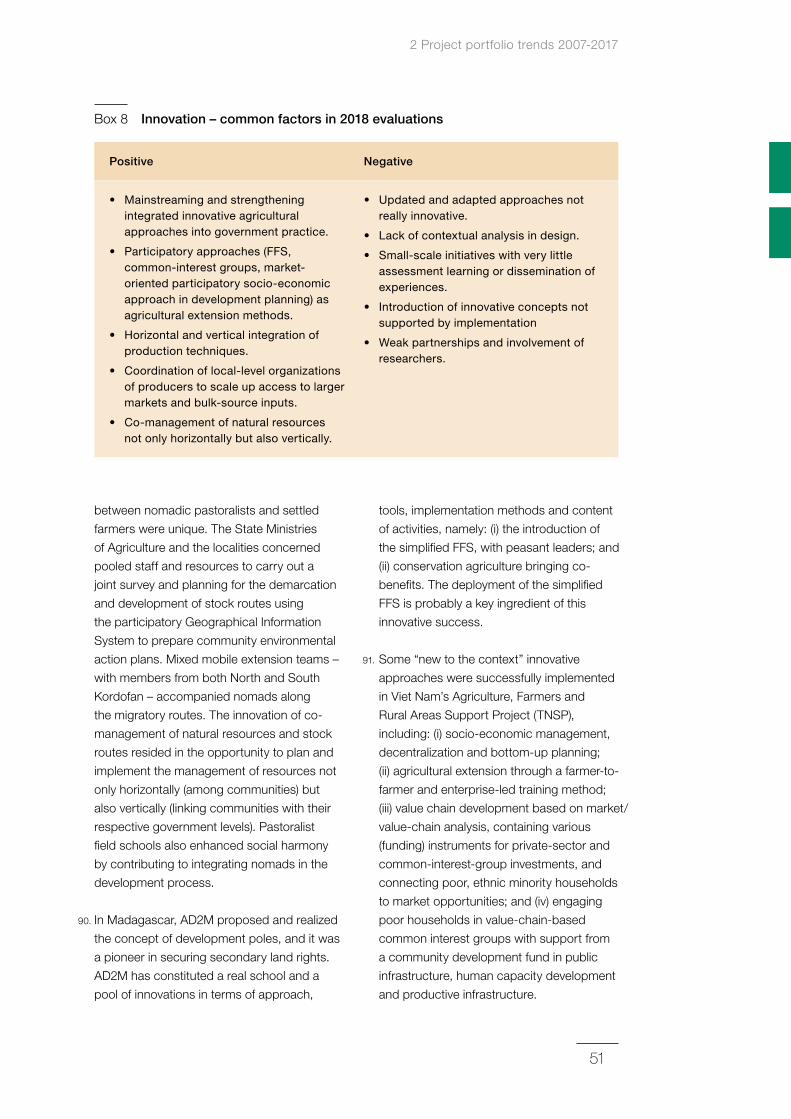
2 Project portfolio trends 2007-2017
51
between nomadic pastoralists and settled
farmers were unique. The State Ministries
of Agriculture and the localities concerned
pooled staff and resources to carry out a
joint survey and planning for the demarcation
and development of stock routes using
the participatory Geographical Information
System to prepare community environmental
action plans. Mixed mobile extension teams –
with members from both North and South
Kordofan – accompanied nomads along
the migratory routes. The innovation of co-
management of natural resources and stock
routes resided in the opportunity to plan and
implement the management of resources not
only horizontally (among communities) but
also vertically (linking communities with their
respective government levels). Pastoralist
field schools also enhanced social harmony
by contributing to integrating nomads in the
development process.
90. In Madagascar, AD2M proposed and realized
the concept of development poles, and it was
a pioneer in securing secondary land rights.
AD2M has constituted a real school and a
pool of innovations in terms of approach,
tools, implementation methods and content
of activities, namely: (i) the introduction of
the simplified FFS, with peasant leaders; and
(ii) conservation agriculture bringing co-
benefits. The deployment of the simplified
FFS is probably a key ingredient of this
innovative success.
91. Some “new to the context” innovative
approaches were successfully implemented
in Viet Nam’s Agriculture, Farmers and
Rural Areas Support Project (TNSP),
including: (i) socio-economic management,
decentralization and bottom-up planning;
(ii) agricultural extension through a farmer-to-
farmer and enterprise-led training method;
(iii) value chain development based on market/
value-chain analysis, containing various
(funding) instruments for private-sector and
common-interest-group investments, and
connecting poor, ethnic minority households
to market opportunities; and (iv) engaging
poor households in value-chain-based
common interest groups with support from
a community development fund in public
infrastructure, human capacity development
and productive infrastructure.
Box 8 Innovation – common factors in 2018 evaluations
Positive Negative
• Mainstreaming and strengthening integrated innovative agricultural approaches into government practice.
• Participatory approaches (FFS, common-interest groups, market-oriented participatory socio-economic approach in development planning) as agricultural extension methods.
• Horizontal and vertical integration of production techniques.
• Coordination of local-level organizations of producers to scale up access to larger markets and bulk-source inputs.
• Co-management of natural resources not only horizontally but also vertically.
• Updated and adapted approaches not really innovative.
• Lack of contextual analysis in design.
• Small-scale initiatives with very little assessment learning or dissemination of experiences.
• Introduction of innovative concepts not supported by implementation
• Weak partnerships and involvement of researchers.
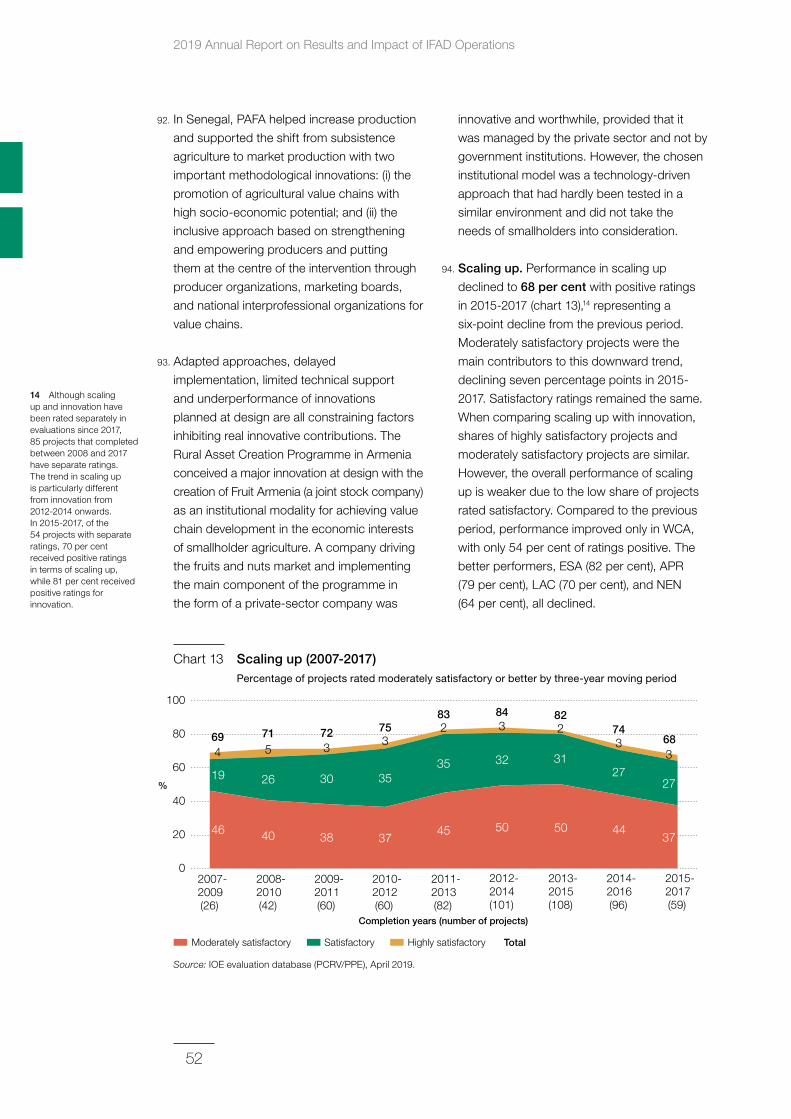
2019 Annual Report on Results and Impact of IFAD Operations
52
14 Although scaling up and innovation have been rated separately in evaluations since 2017, 85 projects that completed between 2008 and 2017 have separate ratings. The trend in scaling up is particularly different from innovation from 2012-2014 onwards. In 2015-2017, of the 54 projects with separate ratings, 70 per cent received positive ratings in terms of scaling up, while 81 per cent received positive ratings for innovation.
92. In Senegal, PAFA helped increase production
and supported the shift from subsistence
agriculture to market production with two
important methodological innovations: (i) the
promotion of agricultural value chains with
high socio-economic potential; and (ii) the
inclusive approach based on strengthening
and empowering producers and putting
them at the centre of the intervention through
producer organizations, marketing boards,
and national interprofessional organizations for
value chains.
93. Adapted approaches, delayed
implementation, limited technical support
and underperformance of innovations
planned at design are all constraining factors
inhibiting real innovative contributions. The
Rural Asset Creation Programme in Armenia
conceived a major innovation at design with the
creation of Fruit Armenia (a joint stock company)
as an institutional modality for achieving value
chain development in the economic interests
of smallholder agriculture. A company driving
the fruits and nuts market and implementing
the main component of the programme in
the form of a private-sector company was
innovative and worthwhile, provided that it
was managed by the private sector and not by
government institutions. However, the chosen
institutional model was a technology-driven
approach that had hardly been tested in a
similar environment and did not take the
needs of smallholders into consideration.
94. Scaling up. Performance in scaling up
declined to 68 per cent with positive ratings
in 2015-2017 (chart 13),14 representing a
six-point decline from the previous period.
Moderately satisfactory projects were the
main contributors to this downward trend,
declining seven percentage points in 2015-
2017. Satisfactory ratings remained the same.
When comparing scaling up with innovation,
shares of highly satisfactory projects and
moderately satisfactory projects are similar.
However, the overall performance of scaling
up is weaker due to the low share of projects
rated satisfactory. Compared to the previous
period, performance improved only in WCA,
with only 54 per cent of ratings positive. The
better performers, ESA (82 per cent), APR
(79 per cent), LAC (70 per cent), and NEN
(64 per cent), all declined.
2007-2009(26)
2008-2010(42)
2009-2011(60)
2010-2012(60)
2011-2013(82)
2012-2014(101)
0
100
20
40
60
80
2015-2017(59)
%
Completion years (number of projects)
46 40 38 3745 50
37
19
71 72 7583 84
26
5 3
30 35
3
35
2
32
3
2014-2016(96)
44
74
27
3
2013-2015(108)
50
82
31
2683
27
469
TotalModerately satisfactory Satisfactory Highly satisfactory
Chart 13 Scaling up (2007‑2017) Percentage of projects rated moderately satisfactory or better by three-year moving period
Source: IOE evaluation database (PCRV/PPE), April 2019.
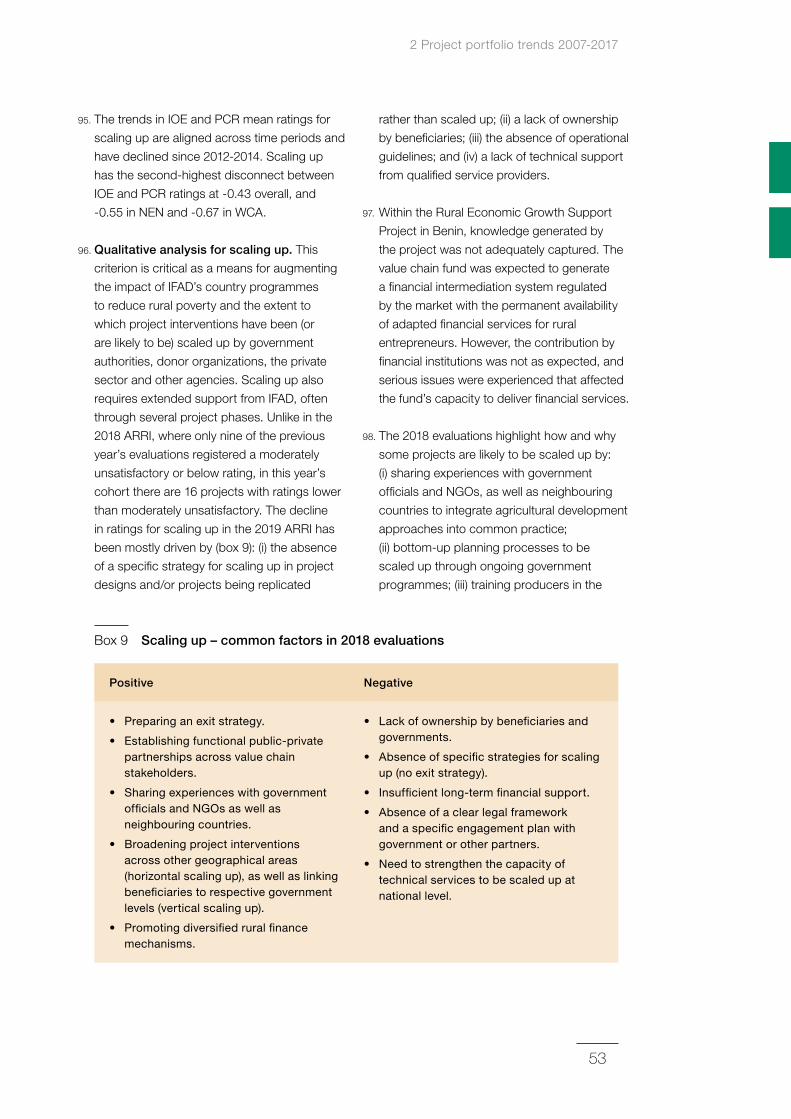
2 Project portfolio trends 2007-2017
53
95. The trends in IOE and PCR mean ratings for
scaling up are aligned across time periods and
have declined since 2012-2014. Scaling up
has the second-highest disconnect between
IOE and PCR ratings at -0.43 overall, and
-0.55 in NEN and -0.67 in WCA.
96. Qualitative analysis for scaling up. This
criterion is critical as a means for augmenting
the impact of IFAD’s country programmes
to reduce rural poverty and the extent to
which project interventions have been (or
are likely to be) scaled up by government
authorities, donor organizations, the private
sector and other agencies. Scaling up also
requires extended support from IFAD, often
through several project phases. Unlike in the
2018 ARRI, where only nine of the previous
year’s evaluations registered a moderately
unsatisfactory or below rating, in this year’s
cohort there are 16 projects with ratings lower
than moderately unsatisfactory. The decline
in ratings for scaling up in the 2019 ARRI has
been mostly driven by (box 9): (i) the absence
of a specific strategy for scaling up in project
designs and/or projects being replicated
rather than scaled up; (ii) a lack of ownership
by beneficiaries; (iii) the absence of operational
guidelines; and (iv) a lack of technical support
from qualified service providers.
97. Within the Rural Economic Growth Support
Project in Benin, knowledge generated by
the project was not adequately captured. The
value chain fund was expected to generate
a financial intermediation system regulated
by the market with the permanent availability
of adapted financial services for rural
entrepreneurs. However, the contribution by
financial institutions was not as expected, and
serious issues were experienced that affected
the fund’s capacity to deliver financial services.
98. The 2018 evaluations highlight how and why
some projects are likely to be scaled up by:
(i) sharing experiences with government
officials and NGOs, as well as neighbouring
countries to integrate agricultural development
approaches into common practice;
(ii) bottom-up planning processes to be
scaled up through ongoing government
programmes; (iii) training producers in the
Box 9 Scaling up – common factors in 2018 evaluations
Positive Negative
• Preparing an exit strategy.
• Establishing functional public-private partnerships across value chain stakeholders.
• Sharing experiences with government officials and NGOs as well as neighbouring countries.
• Broadening project interventions across other geographical areas (horizontal scaling up), as well as linking beneficiaries to respective government levels (vertical scaling up).
• Promoting diversified rural finance mechanisms.
• Lack of ownership by beneficiaries and governments.
• Absence of specific strategies for scaling up (no exit strategy).
• Insufficient long-term financial support.
• Absence of a clear legal framework and a specific engagement plan with government or other partners.
• Need to strengthen the capacity of technical services to be scaled up at national level.
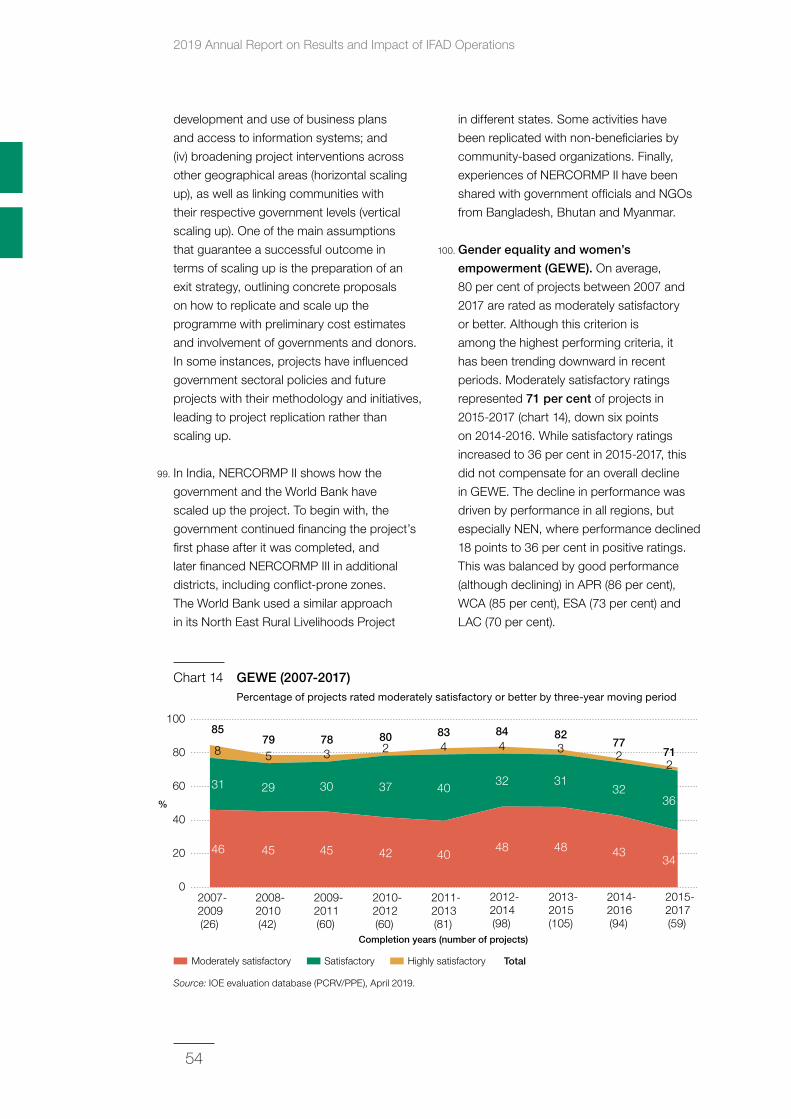
2019 Annual Report on Results and Impact of IFAD Operations
54
development and use of business plans
and access to information systems; and
(iv) broadening project interventions across
other geographical areas (horizontal scaling
up), as well as linking communities with
their respective government levels (vertical
scaling up). One of the main assumptions
that guarantee a successful outcome in
terms of scaling up is the preparation of an
exit strategy, outlining concrete proposals
on how to replicate and scale up the
programme with preliminary cost estimates
and involvement of governments and donors.
In some instances, projects have influenced
government sectoral policies and future
projects with their methodology and initiatives,
leading to project replication rather than
scaling up.
99. In India, NERCORMP II shows how the
government and the World Bank have
scaled up the project. To begin with, the
government continued financing the project’s
first phase after it was completed, and
later financed NERCORMP III in additional
districts, including conflict-prone zones.
The World Bank used a similar approach
in its North East Rural Livelihoods Project
in different states. Some activities have
been replicated with non-beneficiaries by
community-based organizations. Finally,
experiences of NERCORMP II have been
shared with government officials and NGOs
from Bangladesh, Bhutan and Myanmar.
100. Gender equality and women’s
empowerment (GEWE). On average,
80 per cent of projects between 2007 and
2017 are rated as moderately satisfactory
or better. Although this criterion is
among the highest performing criteria, it
has been trending downward in recent
periods. Moderately satisfactory ratings
represented 71 per cent of projects in
2015-2017 (chart 14), down six points
on 2014-2016. While satisfactory ratings
increased to 36 per cent in 2015-2017, this
did not compensate for an overall decline
in GEWE. The decline in performance was
driven by performance in all regions, but
especially NEN, where performance declined
18 points to 36 per cent in positive ratings.
This was balanced by good performance
(although declining) in APR (86 per cent),
WCA (85 per cent), ESA (73 per cent) and
LAC (70 per cent).
2007-2009(26)
2008-2010(42)
2009-2011(60)
2010-2012(60)
2011-2013(81)
2012-2014(98)
0
100
20
40
60
80
2015-2017(59)
%
Completion years (number of projects)
46 45 45 42 4048
34
31
80 83 84
29 30 37
2783
795
85
8
40
4
32
4
2014-2016(94)
43
77
32
2
2013-2015(105)
48
82
31
3
36
712
TotalModerately satisfactory Satisfactory Highly satisfactory
Chart 14 GEWE (2007‑2017) Percentage of projects rated moderately satisfactory or better by three-year moving period
Source: IOE evaluation database (PCRV/PPE), April 2019.
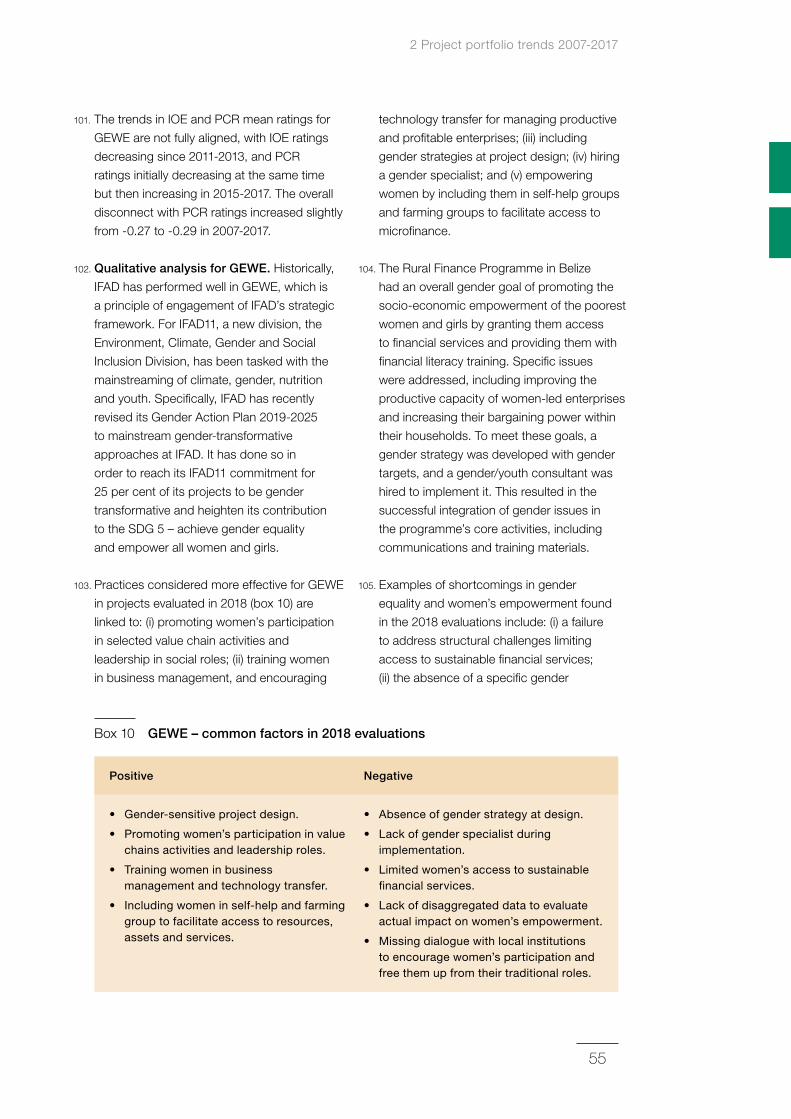
2 Project portfolio trends 2007-2017
55
101. The trends in IOE and PCR mean ratings for
GEWE are not fully aligned, with IOE ratings
decreasing since 2011-2013, and PCR
ratings initially decreasing at the same time
but then increasing in 2015-2017. The overall
disconnect with PCR ratings increased slightly
from -0.27 to -0.29 in 2007-2017.
102. Qualitative analysis for GEWE. Historically,
IFAD has performed well in GEWE, which is
a principle of engagement of IFAD’s strategic
framework. For IFAD11, a new division, the
Environment, Climate, Gender and Social
Inclusion Division, has been tasked with the
mainstreaming of climate, gender, nutrition
and youth. Specifically, IFAD has recently
revised its Gender Action Plan 2019-2025
to mainstream gender-transformative
approaches at IFAD. It has done so in
order to reach its IFAD11 commitment for
25 per cent of its projects to be gender
transformative and heighten its contribution
to the SDG 5 – achieve gender equality
and empower all women and girls.
103. Practices considered more effective for GEWE
in projects evaluated in 2018 (box 10) are
linked to: (i) promoting women’s participation
in selected value chain activities and
leadership in social roles; (ii) training women
in business management, and encouraging
technology transfer for managing productive
and profitable enterprises; (iii) including
gender strategies at project design; (iv) hiring
a gender specialist; and (v) empowering
women by including them in self-help groups
and farming groups to facilitate access to
microfinance.
104. The Rural Finance Programme in Belize
had an overall gender goal of promoting the
socio-economic empowerment of the poorest
women and girls by granting them access
to financial services and providing them with
financial literacy training. Specific issues
were addressed, including improving the
productive capacity of women-led enterprises
and increasing their bargaining power within
their households. To meet these goals, a
gender strategy was developed with gender
targets, and a gender/youth consultant was
hired to implement it. This resulted in the
successful integration of gender issues in
the programme’s core activities, including
communications and training materials.
105. Examples of shortcomings in gender
equality and women’s empowerment found
in the 2018 evaluations include: (i) a failure
to address structural challenges limiting
access to sustainable financial services;
(ii) the absence of a specific gender
Box 10 GEWE – common factors in 2018 evaluations
Positive Negative
• Gender-sensitive project design.
• Promoting women’s participation in value chains activities and leadership roles.
• Training women in business management and technology transfer.
• Including women in self-help and farming group to facilitate access to resources, assets and services.
• Absence of gender strategy at design.
• Lack of gender specialist during implementation.
• Limited women’s access to sustainable financial services.
• Lack of disaggregated data to evaluate actual impact on women’s empowerment.
• Missing dialogue with local institutions to encourage women’s participation and free them up from their traditional roles.
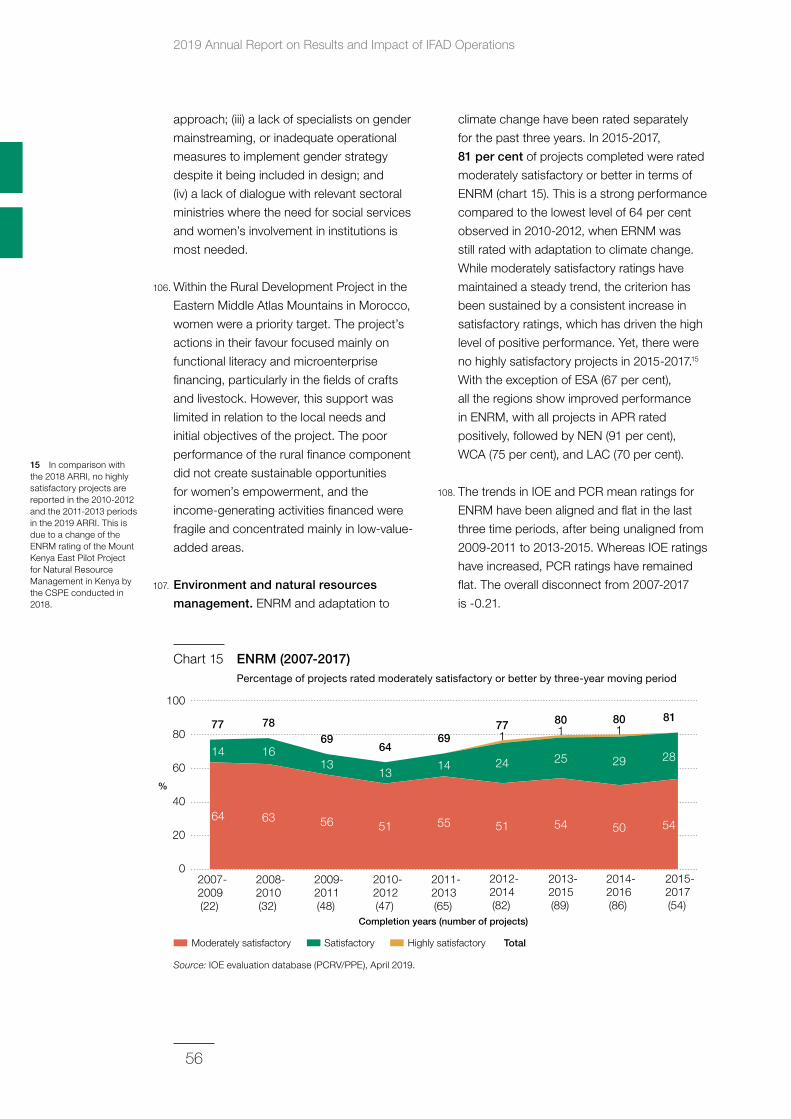
2019 Annual Report on Results and Impact of IFAD Operations
56
15 In comparison with the 2018 ARRI, no highly satisfactory projects are reported in the 2010-2012 and the 2011-2013 periods in the 2019 ARRI. This is due to a change of the ENRM rating of the Mount Kenya East Pilot Project for Natural Resource Management in Kenya by the CSPE conducted in 2018.
approach; (iii) a lack of specialists on gender
mainstreaming, or inadequate operational
measures to implement gender strategy
despite it being included in design; and
(iv) a lack of dialogue with relevant sectoral
ministries where the need for social services
and women’s involvement in institutions is
most needed.
106. Within the Rural Development Project in the
Eastern Middle Atlas Mountains in Morocco,
women were a priority target. The project’s
actions in their favour focused mainly on
functional literacy and microenterprise
financing, particularly in the fields of crafts
and livestock. However, this support was
limited in relation to the local needs and
initial objectives of the project. The poor
performance of the rural finance component
did not create sustainable opportunities
for women’s empowerment, and the
income-generating activities financed were
fragile and concentrated mainly in low-value-
added areas.
107. Environment and natural resources
management. ENRM and adaptation to
climate change have been rated separately
for the past three years. In 2015-2017,
81 per cent of projects completed were rated
moderately satisfactory or better in terms of
ENRM (chart 15). This is a strong performance
compared to the lowest level of 64 per cent
observed in 2010-2012, when ERNM was
still rated with adaptation to climate change.
While moderately satisfactory ratings have
maintained a steady trend, the criterion has
been sustained by a consistent increase in
satisfactory ratings, which has driven the high
level of positive performance. Yet, there were
no highly satisfactory projects in 2015-2017.15
With the exception of ESA (67 per cent),
all the regions show improved performance
in ENRM, with all projects in APR rated
positively, followed by NEN (91 per cent),
WCA (75 per cent), and LAC (70 per cent).
108. The trends in IOE and PCR mean ratings for
ENRM have been aligned and flat in the last
three time periods, after being unaligned from
2009-2011 to 2013-2015. Whereas IOE ratings
have increased, PCR ratings have remained
flat. The overall disconnect from 2007-2017
is -0.21.
2007-2009(22)
2008-2010(32)
2009-2011(48)
2010-2012(47)
2011-2013(65)
2012-2014(82)
0
100
20
40
60
80
2015-2017(54)
%
Completion years (number of projects)
64 63 56 51 55 51 54
14
7869
6469
7781
1613
1314 24
1
2014-2016(86)
50
80
29
1
2013-2015(89)
54
80
25
1
28
77
TotalModerately satisfactory Satisfactory Highly satisfactory
Chart 15 ENRM (2007‑2017) Percentage of projects rated moderately satisfactory or better by three-year moving period
Source: IOE evaluation database (PCRV/PPE), April 2019.
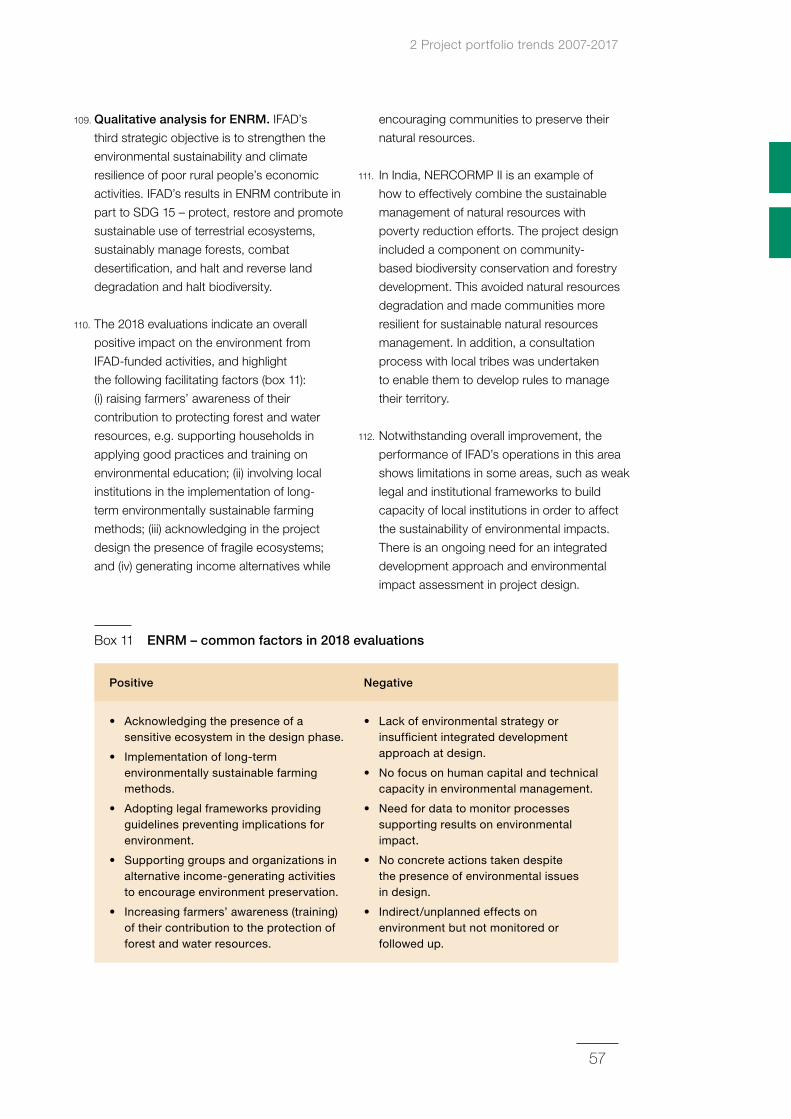
2 Project portfolio trends 2007-2017
57
109. Qualitative analysis for ENRM. IFAD’s
third strategic objective is to strengthen the
environmental sustainability and climate
resilience of poor rural people’s economic
activities. IFAD’s results in ENRM contribute in
part to SDG 15 – protect, restore and promote
sustainable use of terrestrial ecosystems,
sustainably manage forests, combat
desertification, and halt and reverse land
degradation and halt biodiversity.
110. The 2018 evaluations indicate an overall
positive impact on the environment from
IFAD-funded activities, and highlight
the following facilitating factors (box 11):
(i) raising farmers’ awareness of their
contribution to protecting forest and water
resources, e.g. supporting households in
applying good practices and training on
environmental education; (ii) involving local
institutions in the implementation of long-
term environmentally sustainable farming
methods; (iii) acknowledging in the project
design the presence of fragile ecosystems;
and (iv) generating income alternatives while
encouraging communities to preserve their
natural resources.
111. In India, NERCORMP II is an example of
how to effectively combine the sustainable
management of natural resources with
poverty reduction efforts. The project design
included a component on community-
based biodiversity conservation and forestry
development. This avoided natural resources
degradation and made communities more
resilient for sustainable natural resources
management. In addition, a consultation
process with local tribes was undertaken
to enable them to develop rules to manage
their territory.
112. Notwithstanding overall improvement, the
performance of IFAD’s operations in this area
shows limitations in some areas, such as weak
legal and institutional frameworks to build
capacity of local institutions in order to affect
the sustainability of environmental impacts.
There is an ongoing need for an integrated
development approach and environmental
impact assessment in project design.
Box 11 ENRM – common factors in 2018 evaluations
Positive Negative
• Acknowledging the presence of a sensitive ecosystem in the design phase.
• Implementation of long-term environmentally sustainable farming methods.
• Adopting legal frameworks providing guidelines preventing implications for environment.
• Supporting groups and organizations in alternative income-generating activities to encourage environment preservation.
• Increasing farmers’ awareness (training) of their contribution to the protection of forest and water resources.
• Lack of environmental strategy or insufficient integrated development approach at design.
• No focus on human capital and technical capacity in environmental management.
• Need for data to monitor processes supporting results on environmental impact.
• No concrete actions taken despite the presence of environmental issues in design.
• Indirect/unplanned effects on environment but not monitored or followed up.
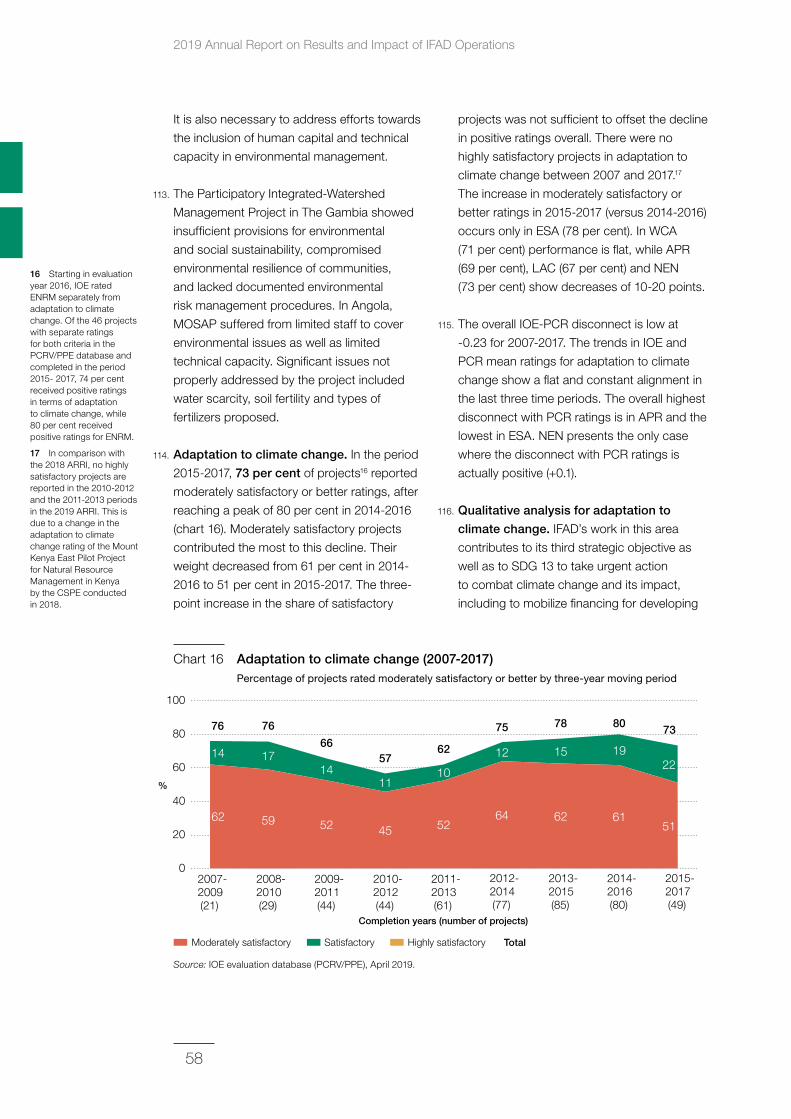
2019 Annual Report on Results and Impact of IFAD Operations
58
16 Starting in evaluation year 2016, IOE rated ENRM separately from adaptation to climate change. Of the 46 projects with separate ratings for both criteria in the PCRV/PPE database and completed in the period 2015- 2017, 74 per cent received positive ratings in terms of adaptation to climate change, while 80 per cent received positive ratings for ENRM.
17 In comparison with the 2018 ARRI, no highly satisfactory projects are reported in the 2010-2012 and the 2011-2013 periods in the 2019 ARRI. This is due to a change in the adaptation to climate change rating of the Mount Kenya East Pilot Project for Natural Resource Management in Kenya by the CSPE conducted in 2018.
It is also necessary to address efforts towards
the inclusion of human capital and technical
capacity in environmental management.
113. The Participatory Integrated-Watershed
Management Project in The Gambia showed
insufficient provisions for environmental
and social sustainability, compromised
environmental resilience of communities,
and lacked documented environmental
risk management procedures. In Angola,
MOSAP suffered from limited staff to cover
environmental issues as well as limited
technical capacity. Significant issues not
properly addressed by the project included
water scarcity, soil fertility and types of
fertilizers proposed.
114. Adaptation to climate change. In the period
2015-2017, 73 per cent of projects16 reported
moderately satisfactory or better ratings, after
reaching a peak of 80 per cent in 2014-2016
(chart 16). Moderately satisfactory projects
contributed the most to this decline. Their
weight decreased from 61 per cent in 2014-
2016 to 51 per cent in 2015-2017. The three-
point increase in the share of satisfactory
projects was not sufficient to offset the decline
in positive ratings overall. There were no
highly satisfactory projects in adaptation to
climate change between 2007 and 2017.17
The increase in moderately satisfactory or
better ratings in 2015-2017 (versus 2014-2016)
occurs only in ESA (78 per cent). In WCA
(71 per cent) performance is flat, while APR
(69 per cent), LAC (67 per cent) and NEN
(73 per cent) show decreases of 10-20 points.
115. The overall IOE-PCR disconnect is low at
-0.23 for 2007-2017. The trends in IOE and
PCR mean ratings for adaptation to climate
change show a flat and constant alignment in
the last three time periods. The overall highest
disconnect with PCR ratings is in APR and the
lowest in ESA. NEN presents the only case
where the disconnect with PCR ratings is
actually positive (+0.1).
116. Qualitative analysis for adaptation to
climate change. IFAD’s work in this area
contributes to its third strategic objective as
well as to SDG 13 to take urgent action
to combat climate change and its impact,
including to mobilize financing for developing
2007-2009(21)
2008-2010(29)
2009-2011(44)
2010-2012(44)
2011-2013(61)
2012-2014(77)
0
100
20
40
60
80
2015-2017(49)
%
Completion years (number of projects)
62 59 52 45 5264
51
14
76
6657
62
75 73
1714
1110
12
2014-2016(80)
61
80
19
2013-2015(85)
62
78
1522
76
TotalModerately satisfactory Satisfactory Highly satisfactory
Chart 16 Adaptation to climate change (2007‑2017) Percentage of projects rated moderately satisfactory or better by three-year moving period
Source: IOE evaluation database (PCRV/PPE), April 2019.
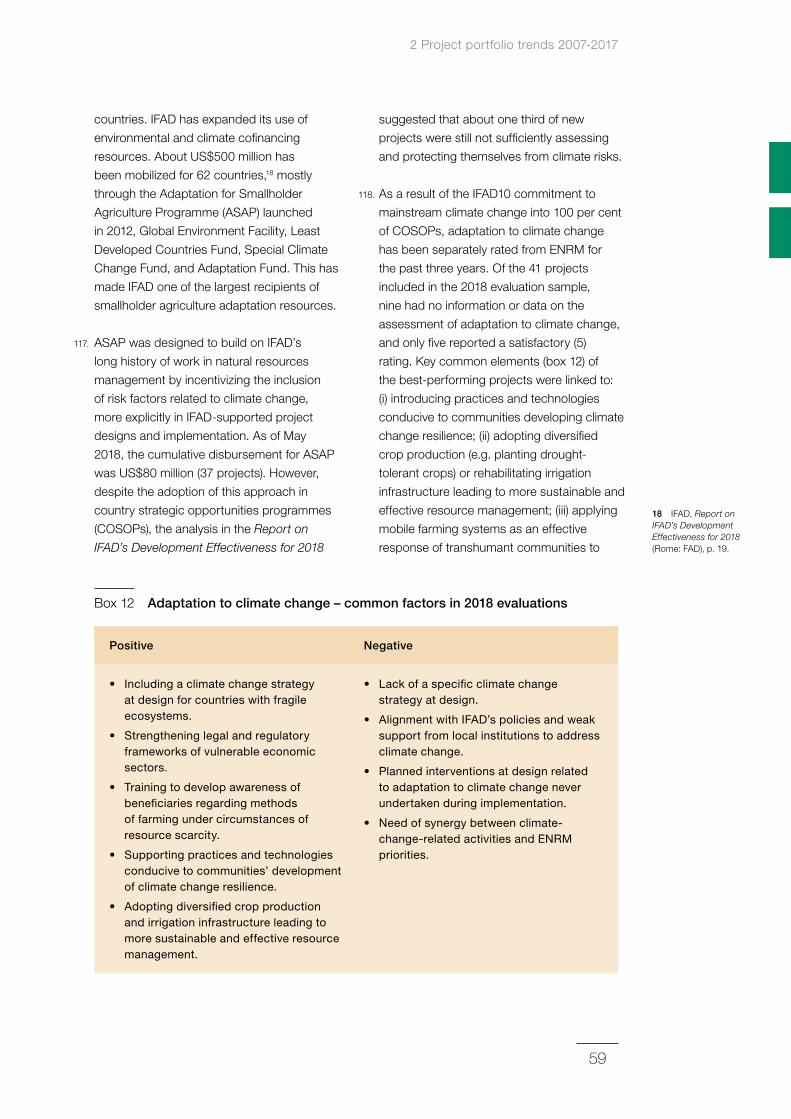
2 Project portfolio trends 2007-2017
59
18 IFAD, Report on IFAD’s Development Effectiveness for 2018 (Rome: FAD), p. 19.
countries. IFAD has expanded its use of
environmental and climate cofinancing
resources. About US$500 million has
been mobilized for 62 countries,18 mostly
through the Adaptation for Smallholder
Agriculture Programme (ASAP) launched
in 2012, Global Environment Facility, Least
Developed Countries Fund, Special Climate
Change Fund, and Adaptation Fund. This has
made IFAD one of the largest recipients of
smallholder agriculture adaptation resources.
117. ASAP was designed to build on IFAD’s
long history of work in natural resources
management by incentivizing the inclusion
of risk factors related to climate change,
more explicitly in IFAD-supported project
designs and implementation. As of May
2018, the cumulative disbursement for ASAP
was US$80 million (37 projects). However,
despite the adoption of this approach in
country strategic opportunities programmes
(COSOPs), the analysis in the Report on
IFAD’s Development Effectiveness for 2018
suggested that about one third of new
projects were still not sufficiently assessing
and protecting themselves from climate risks.
118. As a result of the IFAD10 commitment to
mainstream climate change into 100 per cent
of COSOPs, adaptation to climate change
has been separately rated from ENRM for
the past three years. Of the 41 projects
included in the 2018 evaluation sample,
nine had no information or data on the
assessment of adaptation to climate change,
and only five reported a satisfactory (5)
rating. Key common elements (box 12) of
the best-performing projects were linked to:
(i) introducing practices and technologies
conducive to communities developing climate
change resilience; (ii) adopting diversified
crop production (e.g. planting drought-
tolerant crops) or rehabilitating irrigation
infrastructure leading to more sustainable and
effective resource management; (iii) applying
mobile farming systems as an effective
response of transhumant communities to
Box 12 Adaptation to climate change – common factors in 2018 evaluations
Positive Negative
• Including a climate change strategy at design for countries with fragile ecosystems.
• Strengthening legal and regulatory frameworks of vulnerable economic sectors.
• Training to develop awareness of beneficiaries regarding methods of farming under circumstances of resource scarcity.
• Supporting practices and technologies conducive to communities’ development of climate change resilience.
• Adopting diversified crop production and irrigation infrastructure leading to more sustainable and effective resource management.
• Lack of a specific climate change strategy at design.
• Alignment with IFAD’s policies and weak support from local institutions to address climate change.
• Planned interventions at design related to adaptation to climate change never undertaken during implementation.
• Need of synergy between climate-change-related activities and ENRM priorities.
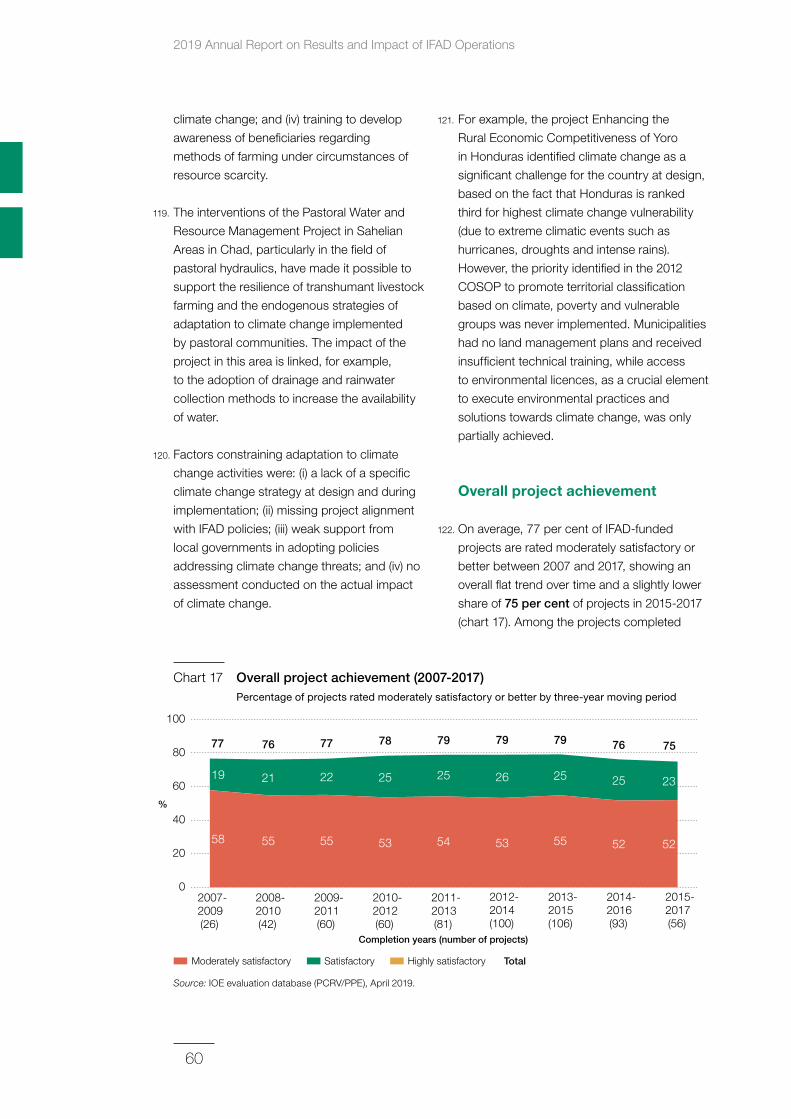
2019 Annual Report on Results and Impact of IFAD Operations
60
climate change; and (iv) training to develop
awareness of beneficiaries regarding
methods of farming under circumstances of
resource scarcity.
119. The interventions of the Pastoral Water and
Resource Management Project in Sahelian
Areas in Chad, particularly in the field of
pastoral hydraulics, have made it possible to
support the resilience of transhumant livestock
farming and the endogenous strategies of
adaptation to climate change implemented
by pastoral communities. The impact of the
project in this area is linked, for example,
to the adoption of drainage and rainwater
collection methods to increase the availability
of water.
120. Factors constraining adaptation to climate
change activities were: (i) a lack of a specific
climate change strategy at design and during
implementation; (ii) missing project alignment
with IFAD policies; (iii) weak support from
local governments in adopting policies
addressing climate change threats; and (iv) no
assessment conducted on the actual impact
of climate change.
121. For example, the project Enhancing the
Rural Economic Competitiveness of Yoro
in Honduras identified climate change as a
significant challenge for the country at design,
based on the fact that Honduras is ranked
third for highest climate change vulnerability
(due to extreme climatic events such as
hurricanes, droughts and intense rains).
However, the priority identified in the 2012
COSOP to promote territorial classification
based on climate, poverty and vulnerable
groups was never implemented. Municipalities
had no land management plans and received
insufficient technical training, while access
to environmental licences, as a crucial element
to execute environmental practices and
solutions towards climate change, was only
partially achieved.
Overall project achievement
122. On average, 77 per cent of IFAD-funded
projects are rated moderately satisfactory or
better between 2007 and 2017, showing an
overall flat trend over time and a slightly lower
share of 75 per cent of projects in 2015-2017
(chart 17). Among the projects completed
2007-2009(26)
2008-2010(42)
2009-2011(60)
2010-2012(60)
2011-2013(81)
2012-2014(100)
0
100
20
40
60
80
2015-2017(56)
%
Completion years (number of projects)
58 55 55 53 54 53 52
19
76 77 78 79 79 75
21 22 25 25 26
2014-2016(93)
52
76
25
2013-2015(106)
55
79
25 23
77
TotalModerately satisfactory Satisfactory Highly satisfactory
Chart 17 Overall project achievement (2007‑2017) Percentage of projects rated moderately satisfactory or better by three-year moving period
Source: IOE evaluation database (PCRV/PPE), April 2019.
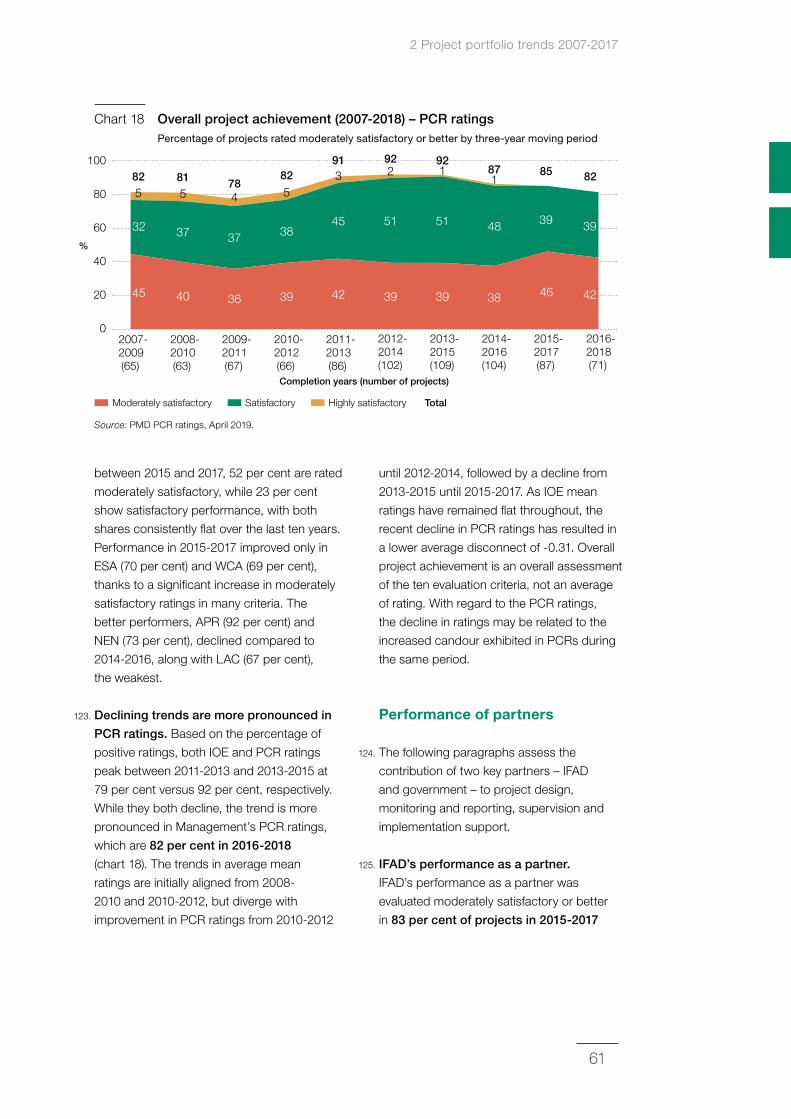
2 Project portfolio trends 2007-2017
61
between 2015 and 2017, 52 per cent are rated
moderately satisfactory, while 23 per cent
show satisfactory performance, with both
shares consistently flat over the last ten years.
Performance in 2015-2017 improved only in
ESA (70 per cent) and WCA (69 per cent),
thanks to a significant increase in moderately
satisfactory ratings in many criteria. The
better performers, APR (92 per cent) and
NEN (73 per cent), declined compared to
2014-2016, along with LAC (67 per cent),
the weakest.
123. Declining trends are more pronounced in
PCR ratings. Based on the percentage of
positive ratings, both IOE and PCR ratings
peak between 2011-2013 and 2013-2015 at
79 per cent versus 92 per cent, respectively.
While they both decline, the trend is more
pronounced in Management’s PCR ratings,
which are 82 per cent in 2016‑2018
(chart 18). The trends in average mean
ratings are initially aligned from 2008-
2010 and 2010-2012, but diverge with
improvement in PCR ratings from 2010-2012
until 2012-2014, followed by a decline from
2013-2015 until 2015-2017. As IOE mean
ratings have remained flat throughout, the
recent decline in PCR ratings has resulted in
a lower average disconnect of -0.31. Overall
project achievement is an overall assessment
of the ten evaluation criteria, not an average
of rating. With regard to the PCR ratings,
the decline in ratings may be related to the
increased candour exhibited in PCRs during
the same period.
Performance of partners
124. The following paragraphs assess the
contribution of two key partners – IFAD
and government – to project design,
monitoring and reporting, supervision and
implementation support.
125. IFAD’s performance as a partner.
IFAD’s performance as a partner was
evaluated moderately satisfactory or better
in 83 per cent of projects in 2015‑2017
Moderately satisfactory Satisfactory Highly satisfactory
Source: IOE evaluation database (PCRV/PPE), April 2019.
2007-2009(65)
2008-2010(63)
2009-2011(67)
2010-2012(66)
2011-2013(86)
2012-2014(102)
0
100
20
40
60
80
2016-2018(71)
%
Completion years (number of projects)
45 40 36 39 42 39 42
32
581 78
82 82
37
5 4 5
913
922
37 3845 51
2013-2015(109)
39
921 87
1
51
2015-2017(87)
46
85
39
2014-2016(104)
38
48 39
82
Total
Chart 18 Overall project achievement (2007‑2018) – PCR ratings Percentage of projects rated moderately satisfactory or better by three-year moving period
Source: PMD PCR ratings, April 2019.
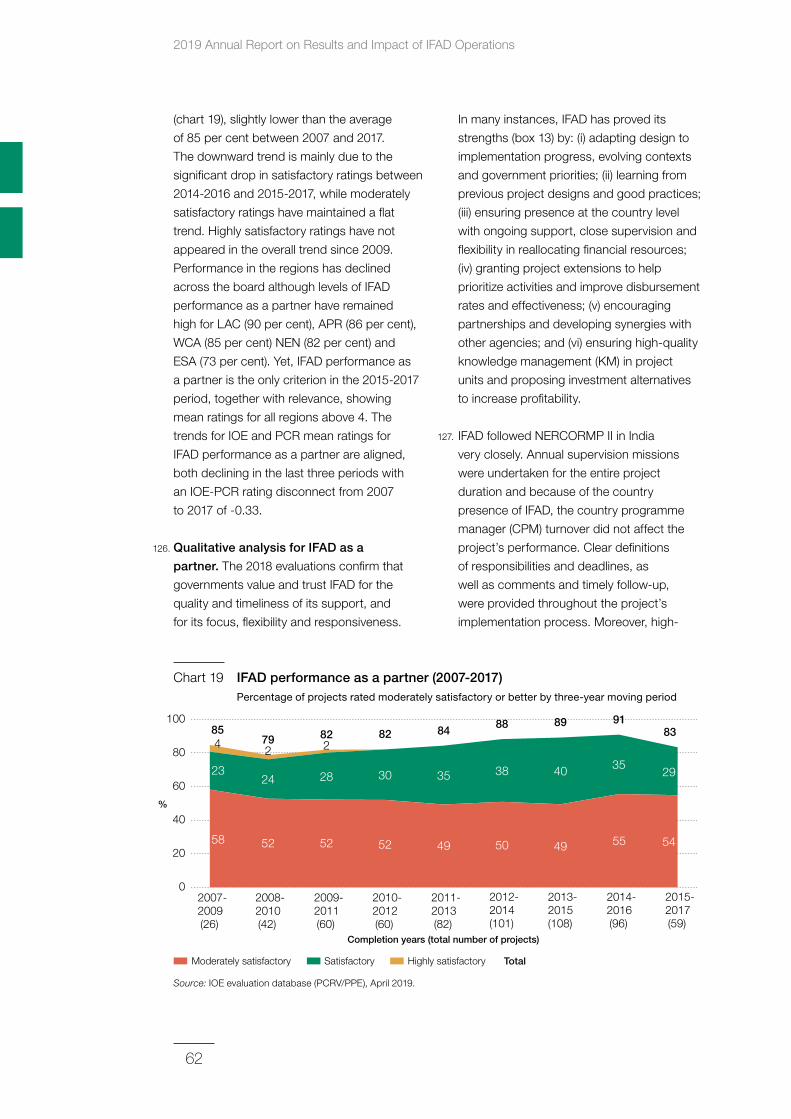
2019 Annual Report on Results and Impact of IFAD Operations
62
(chart 19), slightly lower than the average
of 85 per cent between 2007 and 2017.
The downward trend is mainly due to the
significant drop in satisfactory ratings between
2014-2016 and 2015-2017, while moderately
satisfactory ratings have maintained a flat
trend. Highly satisfactory ratings have not
appeared in the overall trend since 2009.
Performance in the regions has declined
across the board although levels of IFAD
performance as a partner have remained
high for LAC (90 per cent), APR (86 per cent),
WCA (85 per cent) NEN (82 per cent) and
ESA (73 per cent). Yet, IFAD performance as
a partner is the only criterion in the 2015-2017
period, together with relevance, showing
mean ratings for all regions above 4. The
trends for IOE and PCR mean ratings for
IFAD performance as a partner are aligned,
both declining in the last three periods with
an IOE-PCR rating disconnect from 2007
to 2017 of -0.33.
126. Qualitative analysis for IFAD as a
partner. The 2018 evaluations confirm that
governments value and trust IFAD for the
quality and timeliness of its support, and
for its focus, flexibility and responsiveness.
In many instances, IFAD has proved its
strengths (box 13) by: (i) adapting design to
implementation progress, evolving contexts
and government priorities; (ii) learning from
previous project designs and good practices;
(iii) ensuring presence at the country level
with ongoing support, close supervision and
flexibility in reallocating financial resources;
(iv) granting project extensions to help
prioritize activities and improve disbursement
rates and effectiveness; (v) encouraging
partnerships and developing synergies with
other agencies; and (vi) ensuring high-quality
knowledge management (KM) in project
units and proposing investment alternatives
to increase profitability.
127. IFAD followed NERCORMP II in India
very closely. Annual supervision missions
were undertaken for the entire project
duration and because of the country
presence of IFAD, the country programme
manager (CPM) turnover did not affect the
project’s performance. Clear definitions
of responsibilities and deadlines, as
well as comments and timely follow-up,
were provided throughout the project’s
implementation process. Moreover, high-
Moderately satisfactory Satisfactory Highly satisfactory
2007-2009(26)
2008-2010(42)
2009-2011(60)
2010-2012(60)
2011-2013(82)
2012-2014(101)
0
100
20
40
60
80
2015-2017(59)
%
Completion years (total number of projects)
58 52 52 52 49 50 54
23
4 79 82 82 83
24
2 284
88
28 30 35 38
2013-2015(108)
49
89 91
40
2014-2016(96)
55
3529
85
Total
Chart 19 IFAD performance as a partner (2007‑2017) Percentage of projects rated moderately satisfactory or better by three-year moving period
Source: IOE evaluation database (PCRV/PPE), April 2019.
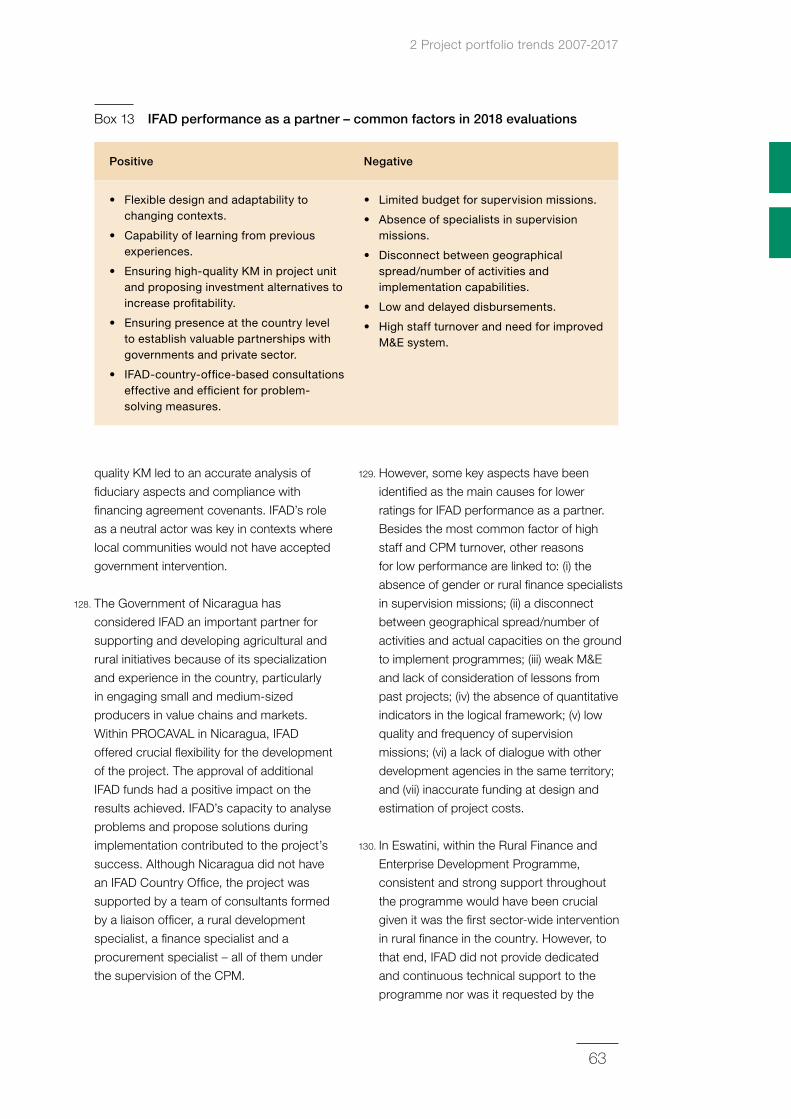
2 Project portfolio trends 2007-2017
63
quality KM led to an accurate analysis of
fiduciary aspects and compliance with
financing agreement covenants. IFAD’s role
as a neutral actor was key in contexts where
local communities would not have accepted
government intervention.
128. The Government of Nicaragua has
considered IFAD an important partner for
supporting and developing agricultural and
rural initiatives because of its specialization
and experience in the country, particularly
in engaging small and medium-sized
producers in value chains and markets.
Within PROCAVAL in Nicaragua, IFAD
offered crucial flexibility for the development
of the project. The approval of additional
IFAD funds had a positive impact on the
results achieved. IFAD’s capacity to analyse
problems and propose solutions during
implementation contributed to the project’s
success. Although Nicaragua did not have
an IFAD Country Office, the project was
supported by a team of consultants formed
by a liaison officer, a rural development
specialist, a finance specialist and a
procurement specialist – all of them under
the supervision of the CPM.
129. However, some key aspects have been
identified as the main causes for lower
ratings for IFAD performance as a partner.
Besides the most common factor of high
staff and CPM turnover, other reasons
for low performance are linked to: (i) the
absence of gender or rural finance specialists
in supervision missions; (ii) a disconnect
between geographical spread/number of
activities and actual capacities on the ground
to implement programmes; (iii) weak M&E
and lack of consideration of lessons from
past projects; (iv) the absence of quantitative
indicators in the logical framework; (v) low
quality and frequency of supervision
missions; (vi) a lack of dialogue with other
development agencies in the same territory;
and (vii) inaccurate funding at design and
estimation of project costs.
130. In Eswatini, within the Rural Finance and
Enterprise Development Programme,
consistent and strong support throughout
the programme would have been crucial
given it was the first sector-wide intervention
in rural finance in the country. However, to
that end, IFAD did not provide dedicated
and continuous technical support to the
programme nor was it requested by the
Box 13 IFAD performance as a partner – common factors in 2018 evaluations
Positive Negative
• Flexible design and adaptability to changing contexts.
• Capability of learning from previous experiences.
• Ensuring high-quality KM in project unit and proposing investment alternatives to increase profitability.
• Ensuring presence at the country level to establish valuable partnerships with governments and private sector.
• IFAD-country-office-based consultations effective and efficient for problem-solving measures.
• Limited budget for supervision missions.
• Absence of specialists in supervision missions.
• Disconnect between geographical spread/number of activities and implementation capabilities.
• Low and delayed disbursements.
• High staff turnover and need for improved M&E system.
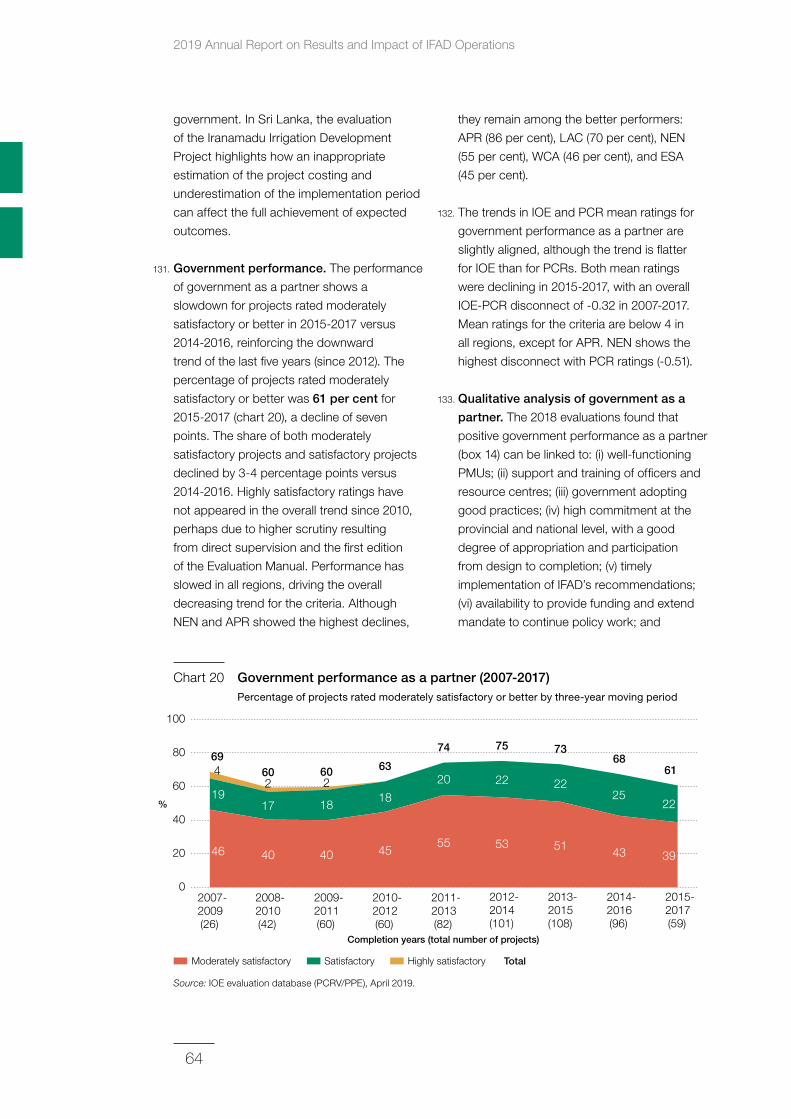
2019 Annual Report on Results and Impact of IFAD Operations
64
government. In Sri Lanka, the evaluation
of the Iranamadu Irrigation Development
Project highlights how an inappropriate
estimation of the project costing and
underestimation of the implementation period
can affect the full achievement of expected
outcomes.
131. Government performance. The performance
of government as a partner shows a
slowdown for projects rated moderately
satisfactory or better in 2015-2017 versus
2014-2016, reinforcing the downward
trend of the last five years (since 2012). The
percentage of projects rated moderately
satisfactory or better was 61 per cent for
2015-2017 (chart 20), a decline of seven
points. The share of both moderately
satisfactory projects and satisfactory projects
declined by 3-4 percentage points versus
2014-2016. Highly satisfactory ratings have
not appeared in the overall trend since 2010,
perhaps due to higher scrutiny resulting
from direct supervision and the first edition
of the Evaluation Manual. Performance has
slowed in all regions, driving the overall
decreasing trend for the criteria. Although
NEN and APR showed the highest declines,
they remain among the better performers:
APR (86 per cent), LAC (70 per cent), NEN
(55 per cent), WCA (46 per cent), and ESA
(45 per cent).
132. The trends in IOE and PCR mean ratings for
government performance as a partner are
slightly aligned, although the trend is flatter
for IOE than for PCRs. Both mean ratings
were declining in 2015-2017, with an overall
IOE-PCR disconnect of -0.32 in 2007-2017.
Mean ratings for the criteria are below 4 in
all regions, except for APR. NEN shows the
highest disconnect with PCR ratings (-0.51).
133. Qualitative analysis of government as a
partner. The 2018 evaluations found that
positive government performance as a partner
(box 14) can be linked to: (i) well-functioning
PMUs; (ii) support and training of officers and
resource centres; (iii) government adopting
good practices; (iv) high commitment at the
provincial and national level, with a good
degree of appropriation and participation
from design to completion; (v) timely
implementation of IFAD’s recommendations;
(vi) availability to provide funding and extend
mandate to continue policy work; and
Chart 20 Government performance as a partner (2007‑2017) Percentage of projects rated moderately satisfactory or better by three-year moving period
Moderately satisfactory Satisfactory Highly satisfactory
2007-2009(26)
2008-2010(42)
2009-2011(60)
2010-2012(60)
2011-2013(82)
2012-2014(101)
0
100
20
40
60
80
2015-2017(59)
%
Completion years (total number of projects)
46 40 40 4555 53
39
19
4 60 60 63 61
17
2 2
74 75
1818
20 22
2013-2015(108)
51
7368
22
2014-2016(96)
43
2522
69
Total
Source: IOE evaluation database (PCRV/PPE), April 2019.
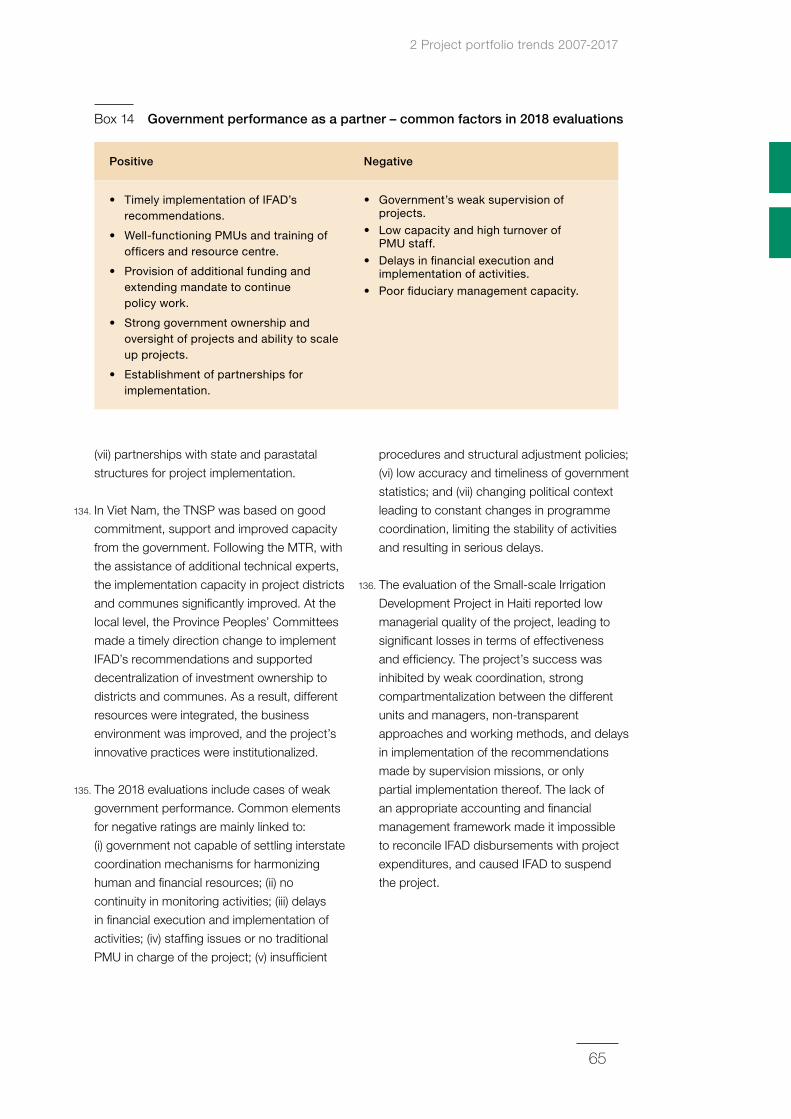
2 Project portfolio trends 2007-2017
65
(vii) partnerships with state and parastatal
structures for project implementation.
134. In Viet Nam, the TNSP was based on good
commitment, support and improved capacity
from the government. Following the MTR, with
the assistance of additional technical experts,
the implementation capacity in project districts
and communes significantly improved. At the
local level, the Province Peoples’ Committees
made a timely direction change to implement
IFAD’s recommendations and supported
decentralization of investment ownership to
districts and communes. As a result, different
resources were integrated, the business
environment was improved, and the project’s
innovative practices were institutionalized.
135. The 2018 evaluations include cases of weak
government performance. Common elements
for negative ratings are mainly linked to:
(i) government not capable of settling interstate
coordination mechanisms for harmonizing
human and financial resources; (ii) no
continuity in monitoring activities; (iii) delays
in financial execution and implementation of
activities; (iv) staffing issues or no traditional
PMU in charge of the project; (v) insufficient
procedures and structural adjustment policies;
(vi) low accuracy and timeliness of government
statistics; and (vii) changing political context
leading to constant changes in programme
coordination, limiting the stability of activities
and resulting in serious delays.
136. The evaluation of the Small-scale Irrigation
Development Project in Haiti reported low
managerial quality of the project, leading to
significant losses in terms of effectiveness
and efficiency. The project’s success was
inhibited by weak coordination, strong
compartmentalization between the different
units and managers, non-transparent
approaches and working methods, and delays
in implementation of the recommendations
made by supervision missions, or only
partial implementation thereof. The lack of
an appropriate accounting and financial
management framework made it impossible
to reconcile IFAD disbursements with project
expenditures, and caused IFAD to suspend
the project.
Box 14 Government performance as a partner – common factors in 2018 evaluations
Positive Negative
• Timely implementation of IFAD’s recommendations.
• Well-functioning PMUs and training of officers and resource centre.
• Provision of additional funding and extending mandate to continue policy work.
• Strong government ownership and oversight of projects and ability to scale up projects.
• Establishment of partnerships for implementation.
• Government’s weak supervision of projects.
• Low capacity and high turnover of PMU staff.
• Delays in financial execution and implementation of activities.
• Poor fiduciary management capacity.
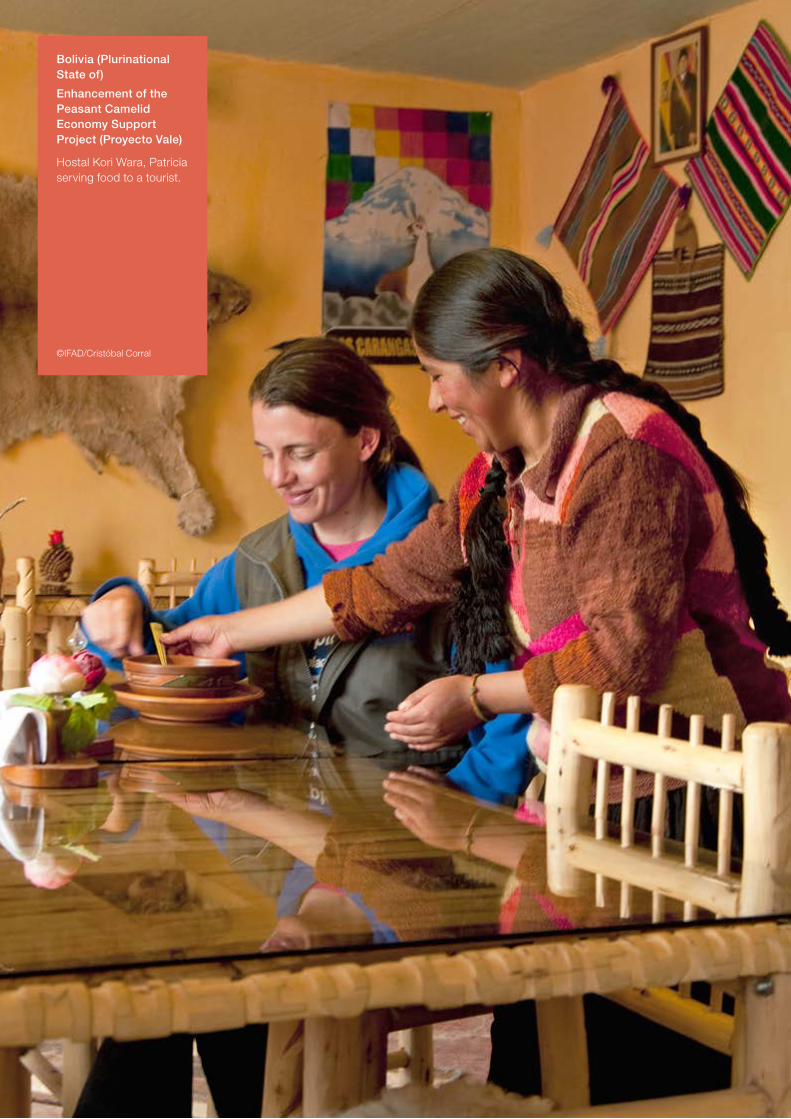
Bolivia (Plurinational State of)
Enhancement of the Peasant Camelid Economy Support Project (Proyecto Vale)
Hostal Kori Wara, Patricia serving food to a tourist.
©IFAD/Cristóbal Corral
67
Country strategy and programme performance 2006-2018
3
137. Background. Country strategy and
programme evaluations (CSPEs) provide a
broader assessment of the IFAD-government
partnership in the reduction of rural poverty
and serve to inform the development of
new country strategies and IFAD-supported
activities in the country.
138. This chapter on CSPEs analyses and reports
on performance beyond the project level
and identifies lessons that cut across
IFAD country programmes. It outlines
IFAD’s performance in relation to: (i) non-
lending activities (i.e. country-level policy
engagement, KM and partnership-building);
(ii) country strategies (i.e. the COSOP) in terms
of relevance and effectiveness; and (iii) cross-
cutting issues of importance to ongoing and
future IFAD country strategies.
139. Historically, IOE has undertaken a total of
72 CSPEs since the product was introduced
in the 1990s (see annex 3 for the complete
list). Of these, 50 have been completed since
2006 based on a consistent methodology
including the use of ratings, which allows
for aggregating results across country
programmes. This year’s ARRI includes five
new CSPEs carried out in Angola, Burkina
Faso, Kenya, Sri Lanka and Tunisia.
Performance of non-lending activities
140. Knowledge management, partnership-
building and country-level policy engagement
are mutually reinforcing actions to
complement IFAD’s investment projects.
They are increasingly recognized as essential
instruments to promote institutional and
policy transformation at the country level and
to scale up the impact of IFAD operations
for deeper results in rural poverty reduction.
Given the limited number of CSPEs, past
ARRIs presented ratings for non-lending as
an aggregate only in terms of moderately
satisfactory or better. However, in response
to Management’s request, the 2019 ARRI
presents the breakdown of the ratings for
non-lending activities by replenishment blocks
in line with the special chapter. Performance
during these replenishment periods reflects
primarily the CSPEs, rather than general
trends; therefore, the emphasis is on the
qualitative analysis.
141. Chart 21 is a consolidated summary of the
performance of 50 country programmes
evaluated since 2006. The total percentage of
country programmes considered moderately
satisfactory for the overall non-lending
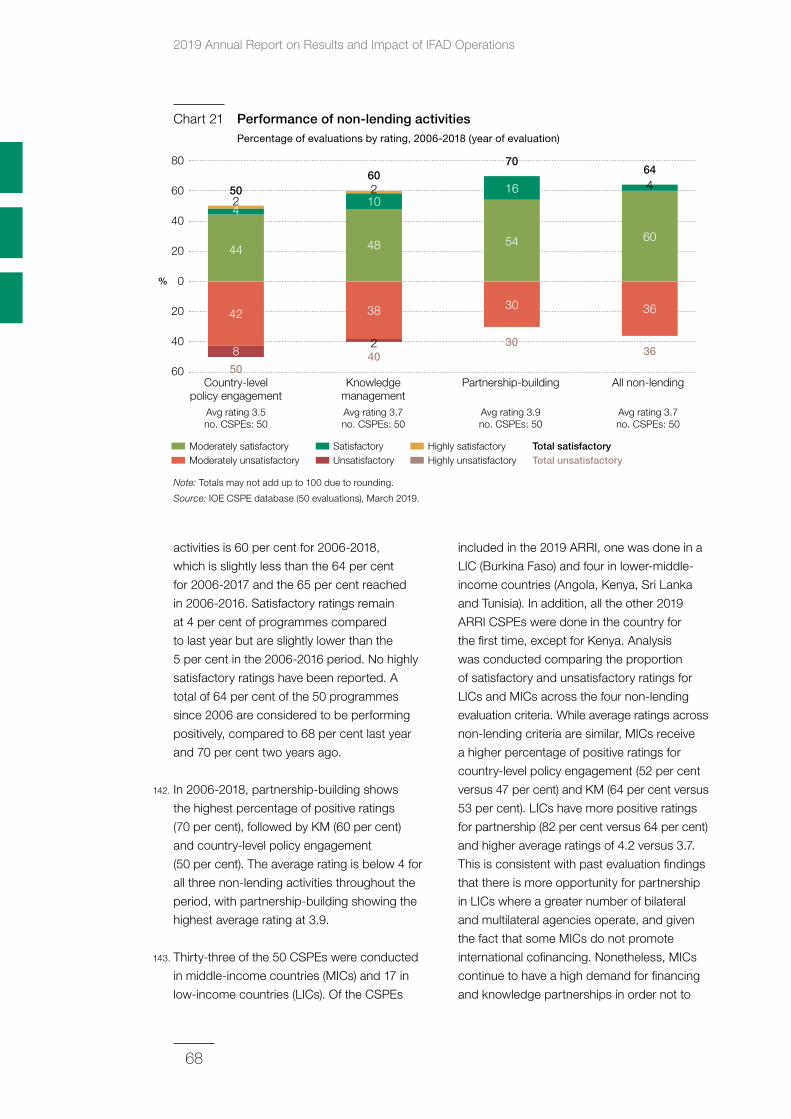
2019 Annual Report on Results and Impact of IFAD Operations
68
activities is 60 per cent for 2006-2018,
which is slightly less than the 64 per cent
for 2006-2017 and the 65 per cent reached
in 2006-2016. Satisfactory ratings remain
at 4 per cent of programmes compared
to last year but are slightly lower than the
5 per cent in the 2006-2016 period. No highly
satisfactory ratings have been reported. A
total of 64 per cent of the 50 programmes
since 2006 are considered to be performing
positively, compared to 68 per cent last year
and 70 per cent two years ago.
142. In 2006-2018, partnership-building shows
the highest percentage of positive ratings
(70 per cent), followed by KM (60 per cent)
and country-level policy engagement
(50 per cent). The average rating is below 4 for
all three non-lending activities throughout the
period, with partnership-building showing the
highest average rating at 3.9.
143. Thirty-three of the 50 CSPEs were conducted
in middle-income countries (MICs) and 17 in
low-income countries (LICs). Of the CSPEs
included in the 2019 ARRI, one was done in a
LIC (Burkina Faso) and four in lower-middle-
income countries (Angola, Kenya, Sri Lanka
and Tunisia). In addition, all the other 2019
ARRI CSPEs were done in the country for
the first time, except for Kenya. Analysis
was conducted comparing the proportion
of satisfactory and unsatisfactory ratings for
LICs and MICs across the four non-lending
evaluation criteria. While average ratings across
non-lending criteria are similar, MICs receive
a higher percentage of positive ratings for
country-level policy engagement (52 per cent
versus 47 per cent) and KM (64 per cent versus
53 per cent). LICs have more positive ratings
for partnership (82 per cent versus 64 per cent)
and higher average ratings of 4.2 versus 3.7.
This is consistent with past evaluation findings
that there is more opportunity for partnership
in LICs where a greater number of bilateral
and multilateral agencies operate, and given
the fact that some MICs do not promote
international cofinancing. Nonetheless, MICs
continue to have a high demand for financing
and knowledge partnerships in order not to
Chart 21 Performance of non‑lending activities Percentage of evaluations by rating, 2006-2018 (year of evaluation)
60
40
20
20
40
60
80
%
Country-levelpolicy engagement
Avg rating 3.5no. CSPEs: 50
KnowledgemanagementAvg rating 3.7no. CSPEs: 50
All non-lending
Avg rating 3.7no. CSPEs: 50
Partnership-building
Avg rating 3.9no. CSPEs: 50
Moderately satisfactory Satisfactory Highly satisfactoryModerately unsatisfactory Unsatisfactory Highly unsatisfactory
Total satisfactoryTotal unsatisfactory
0
42
8
44
10
2
38
48
30
54
36
60
464
260
4250
5040
3036
16
70
Note: Totals may not add up to 100 due to rounding.
Source: IOE CSPE database (50 evaluations), March 2019.
3 Country strategy and programme performance 2006-2018
69
19 IFAD, Corporate-Level Evaluation: IFAD’s financial architecture (Rome: IFAD, 2018); World Bank, Forward Look – A vision for the World Bank Group in 2030 – Implementation Update (World Bank, 2018).
risk their poverty-reduction gains and in order
to maintain their track record for promoting
growth and addressing climate change.19
South-South and triangular cooperation
offers another opportunity for IFAD to build
partnerships with MICs as well as LICs, as
illustrated in box 15.
144. The following sections more closely examine
performance for each of the non-lending
activities. The analysis focuses on the period
2016-2018 and the factors of good and
weaker performance emerging from CSPEs
included in the 2019 ARRI.
145. Knowledge management. IFAD’s Strategic
Framework clearly recognizes the importance
of KM as a key activity for strengthening
the Fund’s development effectiveness.
Knowledge generated by IFAD programmes
is a key resource to further its mandate of
sustainable and inclusive rural transformation.
The Strategic Framework states that a core
purpose of IFAD’s KM must be to “identify,
develop and promote successful and
innovative approaches and interventions that
have demonstrated potential to be scaled up.”
While KM performance rose considerably from
2007-2009 until 2013-2015, in 2016-2018 the
trend inverted and declined to 57 per cent
moderately satisfactory and above (chart 22),
although there are more satisfactory ratings.
The following qualitative analysis presents
examples from the sample of CSPEs
conducted during IFAD10.
146. In Burkina Faso, the COSOP 2007-2012
planned to build on a “strategy for innovation,
communication and knowledge” to inform the
framework for policy initiatives and to regularly
disseminate lessons learned at the national,
regional and international levels. IFAD needed
to add value through its experience in areas
such as rural microenterprises, irrigation,
and management of natural resources and
community development. The COSOP
mentioned the need for a “holistic” approach
to KM and communication, by integrating the
educational dimension and recommending
technical, logistic and human partnerships.
Despite the significant amount of knowledge
generated, developed or tested, most
projects in Burkina Faso did not have a clear
approach to KM, and project designs only
partially benefited from the lessons learned
from past and ongoing projects. Without an
adequate budget and a clear definition of
responsibilities, KM has been weak at the
Box 15 South‑south triangular cooperation – role in partnership‑building
• The CSPE for Angola found steps had been taken under the umbrella of South-South and triangular cooperation with other Lusophone countries: (i) with Brazil, contacts were only at a very incipient stage; (ii) with Mozambique, in July 2017, a delegation from the Artisanal Fisheries Institute (IDPAA) and the Artisanal Fisheries and Aquaculture Project (AFAP) visited some of the PROAQUA and ProPesca activities in the country. Overall, the visit was considered useful, but did not lead to any plan of further exchange or collaboration.
• In the view of the CSPE, there could be opportunities to be explored in future with Brazil and its agricultural research organization on themes such as agroecology, water-harvesting, and soil fertility conservation and restoration in tropical edaphic and climatic conditions.
• In Kenya, the promotion of South-South cooperation was achieved through the learning route methodology and the design of innovation plans under the PROCASUR grant.
• In Sri Lanka, both COSOPs presented a long list of institutions with potential for partnerships, complementarities and synergies. While the 2003 COSOP limited the discussion largely to donor agencies and NGOs, the 2015 COSOP was more diversified and included the private sector, “partnership with non-traditional donors”, and South-South cooperation by supporting knowledge sharing covered by grants.
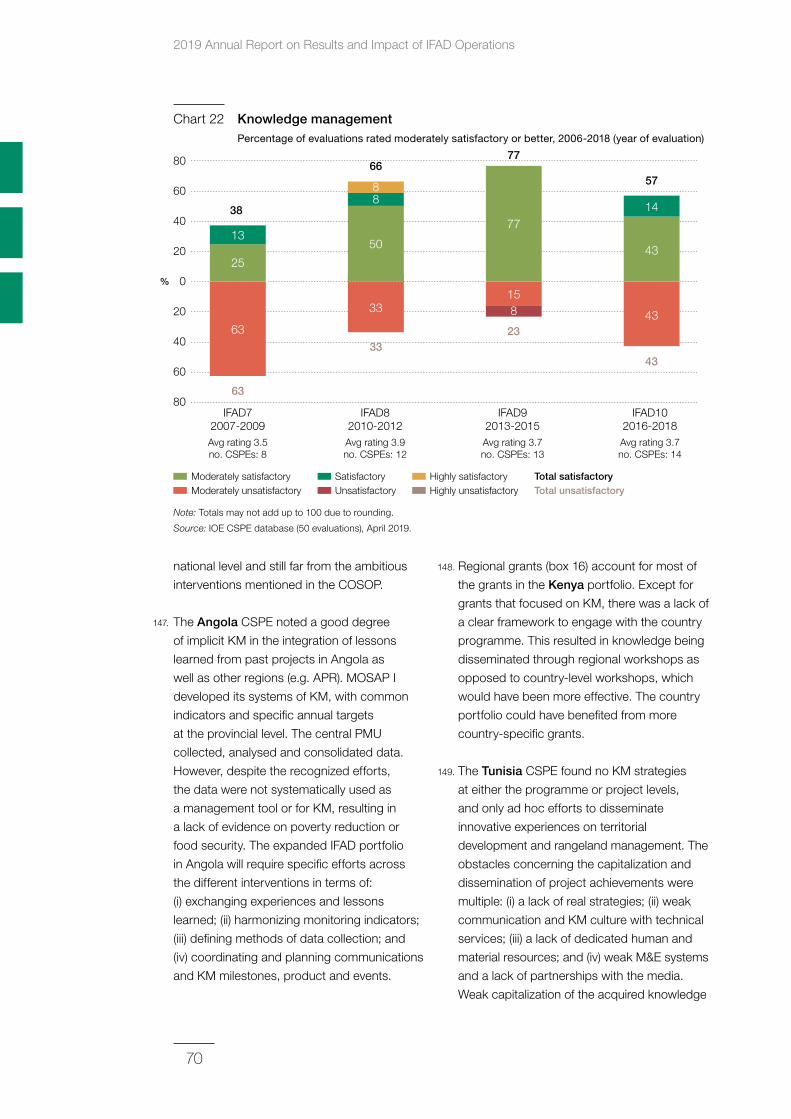
2019 Annual Report on Results and Impact of IFAD Operations
70
national level and still far from the ambitious
interventions mentioned in the COSOP.
147. The Angola CSPE noted a good degree
of implicit KM in the integration of lessons
learned from past projects in Angola as
well as other regions (e.g. APR). MOSAP I
developed its systems of KM, with common
indicators and specific annual targets
at the provincial level. The central PMU
collected, analysed and consolidated data.
However, despite the recognized efforts,
the data were not systematically used as
a management tool or for KM, resulting in
a lack of evidence on poverty reduction or
food security. The expanded IFAD portfolio
in Angola will require specific efforts across
the different interventions in terms of:
(i) exchanging experiences and lessons
learned; (ii) harmonizing monitoring indicators;
(iii) defining methods of data collection; and
(iv) coordinating and planning communications
and KM milestones, product and events.
148. Regional grants (box 16) account for most of
the grants in the Kenya portfolio. Except for
grants that focused on KM, there was a lack of
a clear framework to engage with the country
programme. This resulted in knowledge being
disseminated through regional workshops as
opposed to country-level workshops, which
would have been more effective. The country
portfolio could have benefited from more
country-specific grants.
149. The Tunisia CSPE found no KM strategies
at either the programme or project levels,
and only ad hoc efforts to disseminate
innovative experiences on territorial
development and rangeland management. The
obstacles concerning the capitalization and
dissemination of project achievements were
multiple: (i) a lack of real strategies; (ii) weak
communication and KM culture with technical
services; (iii) a lack of dedicated human and
material resources; and (iv) weak M&E systems
and a lack of partnerships with the media.
Weak capitalization of the acquired knowledge
Chart 22 Knowledge management Percentage of evaluations rated moderately satisfactory or better, 2006-2018 (year of evaluation)
60
40
20
20
40
60
80
%
63
Moderately satisfactory Satisfactory Highly satisfactoryModerately unsatisfactory Unsatisfactory Highly unsatisfactory
Total satisfactoryTotal unsatisfactory
IFAD72007-2009Avg rating 3.5no. CSPEs: 8
IFAD82010-2012Avg rating 3.9no. CSPEs: 12
IFAD102016-2018Avg rating 3.7no. CSPEs: 14
IFAD92013-2015Avg rating 3.7no. CSPEs: 13
80
63
25
8
33
50
158
77
43
43
14
578
66
13
38
3323
43
77
0
Note: Totals may not add up to 100 due to rounding.
Source: IOE CSPE database (50 evaluations), April 2019.
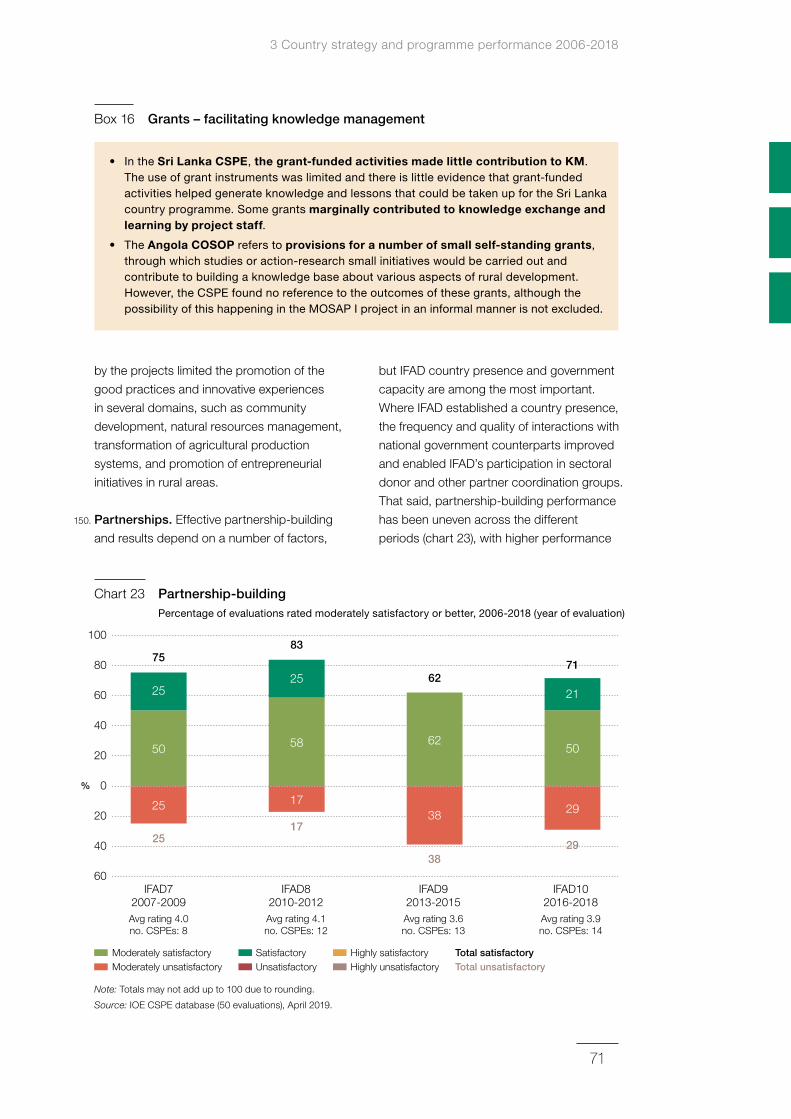
3 Country strategy and programme performance 2006-2018
71
by the projects limited the promotion of the
good practices and innovative experiences
in several domains, such as community
development, natural resources management,
transformation of agricultural production
systems, and promotion of entrepreneurial
initiatives in rural areas.
150. Partnerships. Effective partnership-building
and results depend on a number of factors,
but IFAD country presence and government
capacity are among the most important.
Where IFAD established a country presence,
the frequency and quality of interactions with
national government counterparts improved
and enabled IFAD’s participation in sectoral
donor and other partner coordination groups.
That said, partnership-building performance
has been uneven across the different
periods (chart 23), with higher performance
Box 16 Grants – facilitating knowledge management
• In the Sri Lanka CSPE, the grant-funded activities made little contribution to KM. The use of grant instruments was limited and there is little evidence that grant-funded activities helped generate knowledge and lessons that could be taken up for the Sri Lanka country programme. Some grants marginally contributed to knowledge exchange and learning by project staff.
• The Angola COSOP refers to provisions for a number of small self-standing grants, through which studies or action-research small initiatives would be carried out and contribute to building a knowledge base about various aspects of rural development. However, the CSPE found no reference to the outcomes of these grants, although the possibility of this happening in the MOSAP I project in an informal manner is not excluded.
60
40
20
20
40
60
80
100
%
IFAD72007-2009Avg rating 4.0no. CSPEs: 8
IFAD82010-2012Avg rating 4.1no. CSPEs: 12
IFAD102016-2018Avg rating 3.9no. CSPEs: 14
IFAD92013-2015Avg rating 3.6no. CSPEs: 13
25
50
25
17
58
38
62
29
50
21
71
83
25
75
2517
3829
62
0
Moderately satisfactory Satisfactory Highly satisfactoryModerately unsatisfactory Unsatisfactory Highly unsatisfactory
Total satisfactoryTotal unsatisfactory
Note: Totals may not add up to 100 due to rounding.
Source: IOE CSPE database (50 evaluations), April 2019.
Chart 23 Partnership‑building Percentage of evaluations rated moderately satisfactory or better, 2006-2018 (year of evaluation)
2019 Annual Report on Results and Impact of IFAD Operations
72
in 2007-2009 and 2010-2012, lower
performance in 2013-2015, and slightly better
performance in 2016-2018 to 71 per cent of
moderately satisfactory or better ratings.
151. The 2018 CSPEs report different levels of
partnership-building between IFAD and
government, multilateral organizations and
the private sector. In Angola, the 2005
COSOP identified “strategic links with partner
agencies” as a central element of its support
to agricultural and rural development in the
central highlands and in the rehabilitation
and reconstruction of social infrastructures.
The CSPE found solid evidence of IFAD
being valued by the Government as a
trustworthy partner able to adjust to various
circumstances (e.g. extending loans to
avoid delays in implementation). In addition,
IFAD’s commitment to the rural poor was
widely recognized and appreciated across
all ministries concerned. MOSAP I in Angola
was particularly successful in establishing
partnerships among the Food and Agriculture
Organization of the United Nations (FAO), IFAD
and the World Bank. The led to good results
at the policy, institutional and community
levels, and laid the foundation for sustainable
good practices for future relevant projects in
the country.
152. During the 15 years covered by the Tunisia
CSPE, partnerships between projects and
public services, research institutions, private
providers and civil society organizations have
been very important, despite the low interest
of some partners in the past. IFAD has not
diversified its partnerships at the government
level, and partnerships with other donors
and development agencies have remained
very modest at the operational level, despite
various medium-scale cofinancing initiatives.
Collaboration and synergies between
projects have been rare and not organized
in a specific framework, mostly due to
interventions’ different geographical location
and the absence of concrete incentives and
opportunities for collaboration.
153. Cooperation with the private sector has
become even more important with the
value chain approaches promoted by IFAD.
The Sri Lanka CSPE notes how IFAD has
maintained good working relationships at
central government level and with multiple
project implementing agencies. Collaboration
and partnerships with other development
agencies have been limited, and cofinancing
has been drastically reduced compared to the
period 1978-2002. Partnerships with NGOs
or farmers organizations have also been
limited. On the positive side, in recent years,
partnerships with the private sector have
become a prominent feature of the country
programme. However, the CSPE highlighted
the need to pay greater attention to enhancing
the additionality of public-funded support,
for example, by exploring the scope for cost/
risk-sharing mechanisms or complementary
investments in public infrastructure to
encourage agribusiness partners to invest in
and/or test innovative solutions.
154. In contrast, the Kenya CSPE highlights how
private-sector partnerships have continued to
be weak, despite the 2011 country evaluation
recommendations. The role of the private
sector was not effectively built at design for
the horticulture, dairy and cereal value chain
projects, and private-sector actors were
seen to have complementary but secondary
supporting roles as service providers or for
leveraging. Only in some recent operations
have certain private-sector actors (particularly
banks, agro-dealers and traders) taken a more
active role, and their involvement is likely to
expand further in the future.
155. The Burkina Faso CSPE reported a strong
partnership with the Government, while
remaining restricted at the level of the ministry
in charge of agriculture from a strategic point
of view. The mobilization of cofinancing with
technical and financial partners has been
important in general, as illustrated in box 17,
and particularly with the OPEC Fund for
International Development and the AfDB in
3 Country strategy and programme performance 2006-2018
73
Tunisia. However, technical partnerships have
remained weak, especially with FAO. At the
project level, many operational partnerships
have been established with NGOs and with
state and private institutions for technical
assistance, research and development. These
partnerships have been very effective with
research institutions, grass-roots operators
and producer organizations. However, such
partnerships with other institutions have
tended to suffer from a lack of expertise,
commitment and/or a sound project
approach.
156. Country‑level policy engagement. IFAD’s
Action Plan for Country-level Policy Dialogue
defines country-level policy dialogue as “a
process to engage, directly and indirectly,
with IFAD’s partner governments and other
country-level stakeholders, to influence policy
priorities or the design, implementation and
assessment of formal institutions (e.g. laws,
administrative rules), policies and programmes
that shape the economic opportunities for
large numbers of rural people to move out
of poverty.” Currently, IFAD uses the broader
concept of country-level policy engagement,
which adds to the above definition the notion
of collaboration and consideration of a range
of approaches that IFAD adopts to engage
in the policy process. However, performance
across periods shows a decline from
75 per cent in positive ratings in 2007-2009 to
only 43 per cent in 2016-2018 (chart 24).
157. The 2005 COSOP acknowledged that IFAD
had limited leverage in Angola through policy
dialogue, and was committed to focusing on
pro-poor agricultural development policies,
in partnership with the United Nations and
other agencies in the country. During the
implementation of MOSAP I, key decisions
had to be made, such as the selection of the
FFS approach as the extension methodology
to be adopted by the project, with FAO as a
service provider.
158. National high-level policies and plans for
agricultural and rural development did
exist, but there were gaps at the level of
Box 17 Corporate‑level evaluation on financial architecture
• IOE identifies three main categories of partnerships:a (i) cofinancing and other financial arrangements; (ii) knowledge and learning; and (iii) coordination and cooperation for various purposes and partnership outcomes.
• Cofinancing and national counterpart financing combine the financial resources of partners to support development efforts and are essential for scaling up.
• On the basis of IFAD’s reported data, over the 12-year period from 2007 to 2018, there was a slight tendency for the ratio of international cofinancing to decline and that of domestic counterpart funding to increase.
• Between 2007 and 2018, domestic counterpart funding formed 66 per cent of total cofinancing, while international cofinancing accounted for 47 per cent of total cofinancing.
• This was in line with the target for the overall cofinancing ratio under IFAD9 and IFAD10 (1.2:1), although the target has been raised to 1.4:1 under IFAD11.
• LAC is the region with the highest domestic cofinancing as a ratio to IFAD investment. The ratio for APR is low, comparable with ESA, and NEN has a less favourable ratio of domestic cofinancing to IFAD investment.
• There is scope for increasing international cofinancing from multilateral development finance institutions. In particular, opportunities may arise in connection with climate-related funding.
a IFAD. 2018. Building Partnerships For Enhanced Development Effectiveness – A review of country-level experiences and results. Evaluation synthesis. Rome: IFAD.
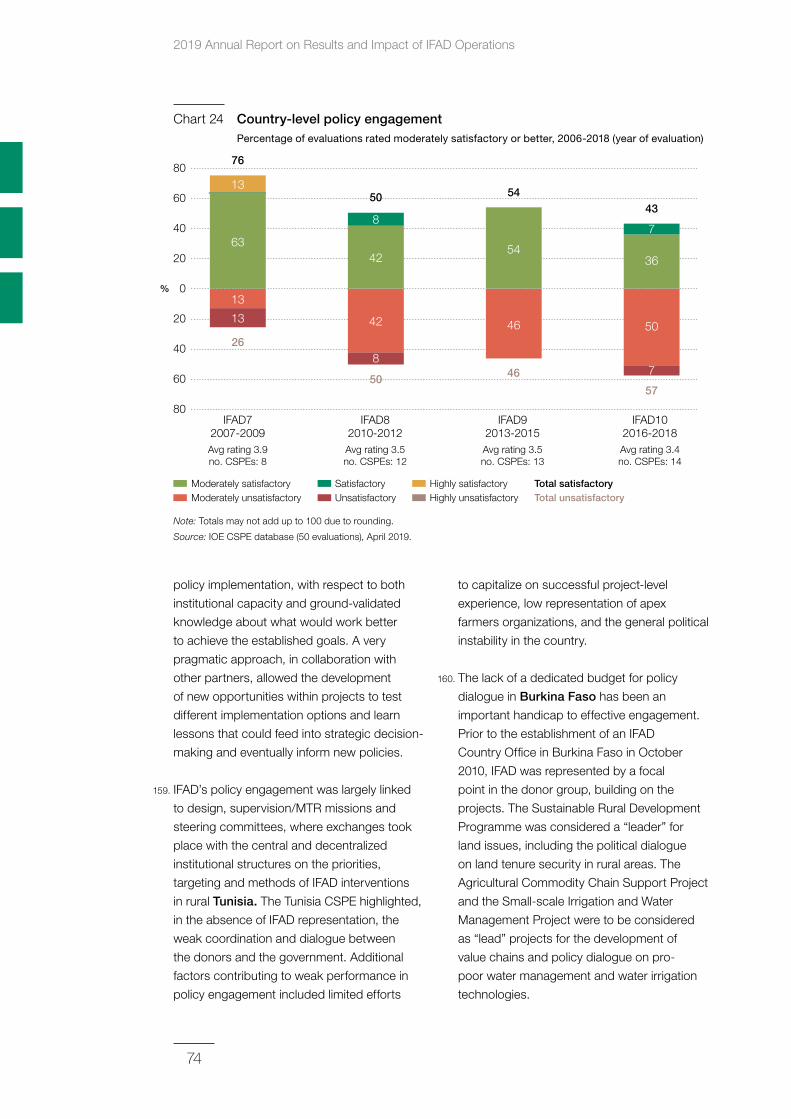
2019 Annual Report on Results and Impact of IFAD Operations
74
policy implementation, with respect to both
institutional capacity and ground-validated
knowledge about what would work better
to achieve the established goals. A very
pragmatic approach, in collaboration with
other partners, allowed the development
of new opportunities within projects to test
different implementation options and learn
lessons that could feed into strategic decision-
making and eventually inform new policies.
159. IFAD’s policy engagement was largely linked
to design, supervision/MTR missions and
steering committees, where exchanges took
place with the central and decentralized
institutional structures on the priorities,
targeting and methods of IFAD interventions
in rural Tunisia. The Tunisia CSPE highlighted,
in the absence of IFAD representation, the
weak coordination and dialogue between
the donors and the government. Additional
factors contributing to weak performance in
policy engagement included limited efforts
to capitalize on successful project-level
experience, low representation of apex
farmers organizations, and the general political
instability in the country.
160. The lack of a dedicated budget for policy
dialogue in Burkina Faso has been an
important handicap to effective engagement.
Prior to the establishment of an IFAD
Country Office in Burkina Faso in October
2010, IFAD was represented by a focal
point in the donor group, building on the
projects. The Sustainable Rural Development
Programme was considered a “leader” for
land issues, including the political dialogue
on land tenure security in rural areas. The
Agricultural Commodity Chain Support Project
and the Small-scale Irrigation and Water
Management Project were to be considered
as “lead” projects for the development of
value chains and policy dialogue on pro-
poor water management and water irrigation
technologies.
Chart 24 Country‑level policy engagement Percentage of evaluations rated moderately satisfactory or better, 2006-2018 (year of evaluation)
60
40
20
20
40
60
80
%
80IFAD7
2007-2009Avg rating 3.9no. CSPEs: 8
IFAD82010-2012Avg rating 3.5no. CSPEs: 12
IFAD102016-2018Avg rating 3.4no. CSPEs: 14
IFAD92013-2015Avg rating 3.5no. CSPEs: 13
13
13
63
8
8
42
42
46
54
50
7
36
7
4350
13
76
26
50 46
57
54
0
Moderately satisfactory Satisfactory Highly satisfactoryModerately unsatisfactory Unsatisfactory Highly unsatisfactory
Total satisfactoryTotal unsatisfactory
Note: Totals may not add up to 100 due to rounding.
Source: IOE CSPE database (50 evaluations), April 2019.
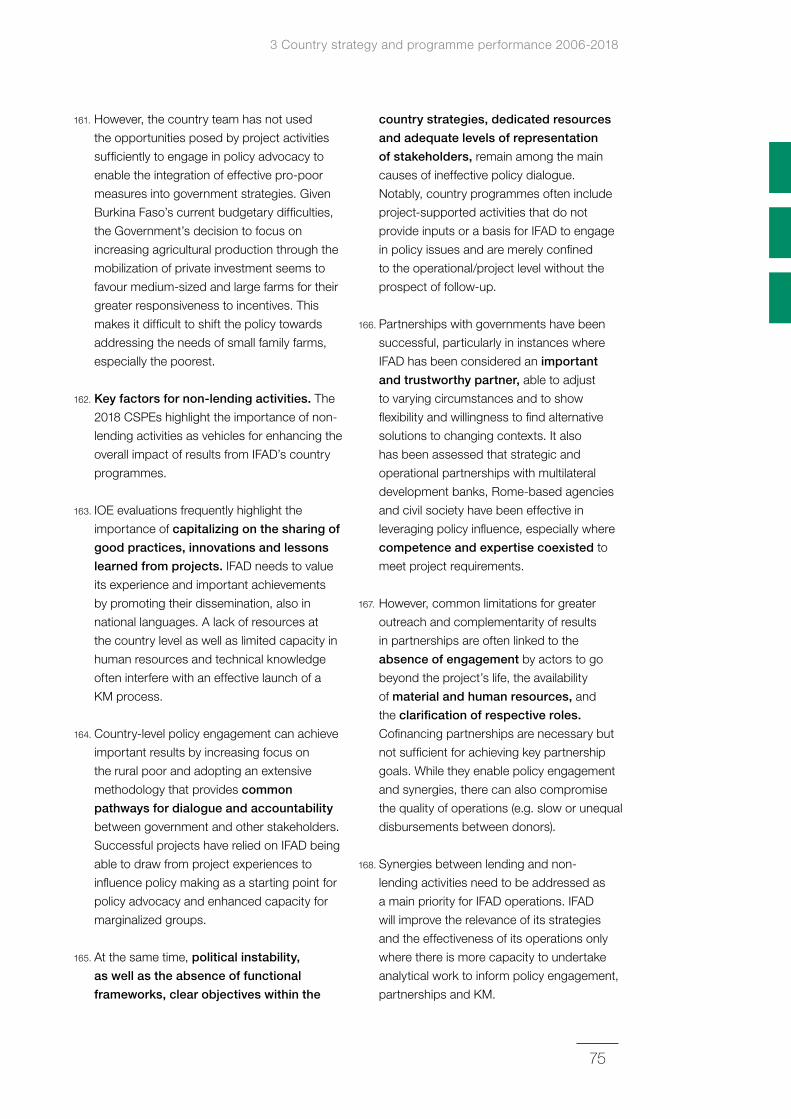
3 Country strategy and programme performance 2006-2018
75
161. However, the country team has not used
the opportunities posed by project activities
sufficiently to engage in policy advocacy to
enable the integration of effective pro-poor
measures into government strategies. Given
Burkina Faso’s current budgetary difficulties,
the Government’s decision to focus on
increasing agricultural production through the
mobilization of private investment seems to
favour medium-sized and large farms for their
greater responsiveness to incentives. This
makes it difficult to shift the policy towards
addressing the needs of small family farms,
especially the poorest.
162. Key factors for non‑lending activities. The
2018 CSPEs highlight the importance of non-
lending activities as vehicles for enhancing the
overall impact of results from IFAD’s country
programmes.
163. IOE evaluations frequently highlight the
importance of capitalizing on the sharing of
good practices, innovations and lessons
learned from projects. IFAD needs to value
its experience and important achievements
by promoting their dissemination, also in
national languages. A lack of resources at
the country level as well as limited capacity in
human resources and technical knowledge
often interfere with an effective launch of a
KM process.
164. Country-level policy engagement can achieve
important results by increasing focus on
the rural poor and adopting an extensive
methodology that provides common
pathways for dialogue and accountability
between government and other stakeholders.
Successful projects have relied on IFAD being
able to draw from project experiences to
influence policy making as a starting point for
policy advocacy and enhanced capacity for
marginalized groups.
165. At the same time, political instability,
as well as the absence of functional
frameworks, clear objectives within the
country strategies, dedicated resources
and adequate levels of representation
of stakeholders, remain among the main
causes of ineffective policy dialogue.
Notably, country programmes often include
project-supported activities that do not
provide inputs or a basis for IFAD to engage
in policy issues and are merely confined
to the operational/project level without the
prospect of follow-up.
166. Partnerships with governments have been
successful, particularly in instances where
IFAD has been considered an important
and trustworthy partner, able to adjust
to varying circumstances and to show
flexibility and willingness to find alternative
solutions to changing contexts. It also
has been assessed that strategic and
operational partnerships with multilateral
development banks, Rome-based agencies
and civil society have been effective in
leveraging policy influence, especially where
competence and expertise coexisted to
meet project requirements.
167. However, common limitations for greater
outreach and complementarity of results
in partnerships are often linked to the
absence of engagement by actors to go
beyond the project’s life, the availability
of material and human resources, and
the clarification of respective roles.
Cofinancing partnerships are necessary but
not sufficient for achieving key partnership
goals. While they enable policy engagement
and synergies, there can also compromise
the quality of operations (e.g. slow or unequal
disbursements between donors).
168. Synergies between lending and non-
lending activities need to be addressed as
a main priority for IFAD operations. IFAD
will improve the relevance of its strategies
and the effectiveness of its operations only
where there is more capacity to undertake
analytical work to inform policy engagement,
partnerships and KM.
2019 Annual Report on Results and Impact of IFAD Operations
76
Country strategies
169. Country strategic opportunities programmes
(COSOPs) are fundamental instruments
to determine IFAD’s strategic positioning
in the country and to articulate the mix of
interventions that will contribute to rural
poverty reduction. Results-based COSOPs
were introduced in 2006, which sharpened
their results orientation. Each CSPE includes
an assessment and ratings for COSOP
performance, which entails the review of
relevance and effectiveness of IFAD country
strategies. Based on these ratings, CSPEs
also generate an overall rating for COSOP
performance.
170. Chart 25 summarizes the ratings from the
50 CSPEs done between 2006 and 2018.
COSOP relevance is assessed as moderately
satisfactory or better in 82 per cent of
IFAD country strategies, effectiveness in
74 per cent, and COSOP performance in
77 per cent. Most ratings fall in the moderately
satisfactory zone (more than half), while
none of the country strategies is found to be
highly satisfactory for any criteria. COSOP
effectiveness has the highest percentage
(67 per cent) of moderately satisfactory ratings
and the highest percentage of unsatisfactory
ratings (26 per cent), as well as the lowest
average rating overall (3.8).
171. Cross‑cutting issues. CSPEs conducted in
2018 identified several cross-cutting issues
that warrant attention for improving ongoing
and future IFAD country strategies. However,
one size does not fit all, and the measures
to address the issues need to be differentiated
based on the fragility or income status of
the country.
172. IOE evaluations have frequently underlined
the need for IFAD to strengthen and support
its competitive advantage, where present,
as a champion for sustainable and pro-
poor agricultural and rural development. By
creating an enabling environment and directly
0
10
100
20
30
40
50
60
70
80
90
%
COSOP relevanceAvg rating 4.1
no. programmes: 50
COSOP performanceAvg rating 4.0
no. programmes: 39
COSOP effectivenessAvg rating 3.8
no. programmes: 42
Unsatisfactory Moderately satisfactory Satisfactory
18
56
26
67
23
56
2126
7
Note: COSOP performance is a composite rating based on the individual ratings for COSOP relevance and COSOP effectiveness based on the available evidence and the objective judgement of the evaluations.
Source: IOE CSPE database, April 2019.
Chart 25 Results of COSOP relevance, effectiveness and performance Percentage of country programmes rated moderately satisfactory or better, 2006-2018 (year of evaluation)
3 Country strategy and programme performance 2006-2018
77
supporting small-scale producers to improve
their livelihoods and raise themselves out of
poverty, new sustainable market opportunities
will emerge and reduce the vulnerability of
rural communities.
173. In order to do that, IFAD-supported projects
should first include a stronger focus on
women’s empowerment and youth
inclusion. The targeting strategy and
implementation approaches of projects
should fully integrate a gender equality
perspective and aim to generate sustainable
and attractive opportunities in the rural areas
to include women and youth in accessible
capacity development opportunities,
rural financial resources, and sustainable
livelihoods. Dedicated staff resources in
project coordination units, also shared
across interventions, are likely to be the most
successful approach.
174. In those instances where COSOPs have
focused on an intervention strategy to
support the rural poor, including women and
youth, to re-establish their productive capacity
and their progress towards food security
and better livelihoods, some empowering
methodologies have been established. By
facilitating dialogue between poor small-scale
producers and institutions, national methods
of agricultural extension at a large scale have
been implemented. Nevertheless, policy-
related agendas are still missing the “what”
and “how”, in particular in the management of
development initiatives and on fiduciary issues,
as well as some areas of key importance in
agricultural and rural development.
175. The establishment of solid partnerships
to achieve and scale up results has to be
supported by intensive and closer guidance
for projects to operate efficiently and
effectively in the country, and by a continued
presence to ensure the level of networking,
dialogue and coordination required to
achieve the ambitious expected results.
However, contextual factors often affect the
coherence of the comprehensive results from
partnerships and allow country programmes
to be driven more by events than a vision
which provides direction.
176. Government commitment and support for
private‑sector development are key for
IFAD to promote effective income-generating
activities in agriculture and rural development,
as well as to improve living conditions in
rural areas. Achieving food security through
higher incomes and greater food resilience
are central tenets of the public‑private‑
producers partnerships strategy. Where
adopted, it has brought renewed impetus
to the agriculture sector, and IFAD has been
well placed to align with the imperatives of
improving food security alongside a more
competitive, market-led, enterprise-driven
approach backed by government policy and
regulatory reform.
177. Where relevant and in line with the project’s
goals, grants contribute to promoting
exchanges between project staff and
policymakers, capacity-building, innovation
and knowledge-sharing. One issue related to
policy engagement is the difficulty in directly
linking grant interventions at the country or
regional level to policy reform, as, to a large
extent, such changes result from a multitude
of stakeholders. An improved integration of
projects and non-project grants to ensure
complementarity and synergies can fill design
gaps on cross-cutting issues.
178. Finally, there is an expectation that stronger
decentralization will help create new
opportunities for greater IFAD involvement in
country-level policy processes. However, it is
important to acknowledge that the capacity of
IFAD Country Offices is not always sufficient
to aggregate and share evidence across the
portfolio. With limited resources, complex
projects, wide geographical distribution of
activities and little time to engage in non-
lending activities, these offices are often under
pressure in supporting projects.
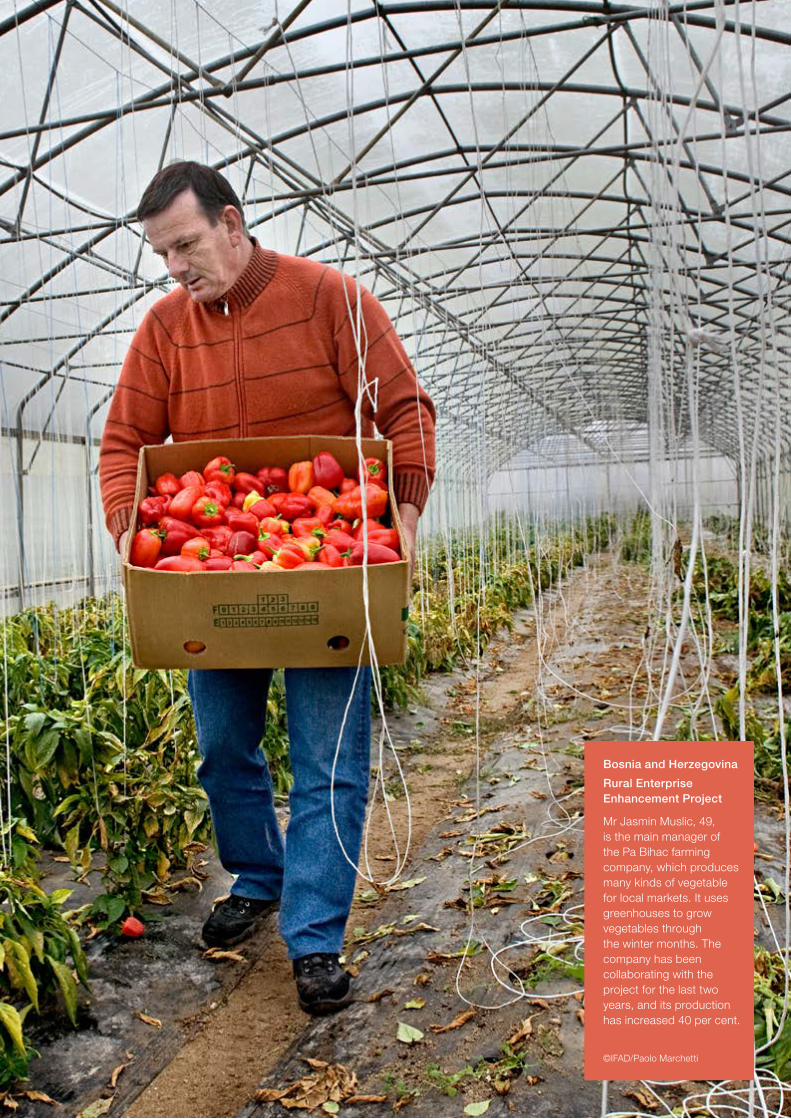
Bosnia and Herzegovina
Rural Enterprise Enhancement Project
Mr Jasmin Muslic, 49, is the main manager of the Pa Bihac farming company, which produces many kinds of vegetable for local markets. It uses greenhouses to grow vegetables through the winter months. The company has been collaborating with the project for the last two years, and its production has increased 40 per cent.
©IFAD/Paolo Marchetti
79
20 Each year, the ARRI uses the all evaluation data series for the analysis of operational performance by replenishment period to ensure a larger project sample size for this block analysis.
IFAD performance by replenishment
4
179. Introduction. Every three years IFAD
replenishes the Fund through contributions
from its Member States. Replenishments
are based on commitments IFAD makes that
effectively operationalize IFAD’s strategic
direction. Commencing in 2016, the Tenth
Replenishment of IFAD’s Resources (IFAD10)
coincided with both the start of the SDGs and
IFAD’s new Strategic Framework (2016-2025).
As such, IFAD10 served to operationalize
IFAD’s new strategic objectives designed to
meet the ambitious goals of 2030 Agenda –
the SDGs.
180. IFAD’s strategic framework aims to make IFAD
“bigger, better and smarter”. IFAD would
become bigger by mobilizing substantially
more funds and resources for investment
in rural areas. It would become better by
strengthening the quality of IFAD’s country
programmes through innovation, knowledge-
sharing, quality-at-entry and implementation
support, partnerships and policy engagement.
Finally, IFAD would become smarter by
delivering development results in a cost-
effective way that best responds to partner
countries’ evolving needs.
181. This special chapter examines IFAD’s
performance over replenishment periods
with a particular focus on IFAD10. It presents
high-level analysis with preliminary findings to
assess IFAD’s progress towards the “bigger,
better and smarter” aims of its Strategic
Framework and to flag potential issues. The
quantitative analysis examines and compares
two types of project samples: (i) approved;
and (ii) completed during the respective
replenishment periods. In the sections Bigger
and Smarter, the sample includes 37 projects
from IOE’s all evaluation data series20 that
completed in IFAD10. The projects in this
sample were completed between 2016 and
2017 and were approved between 2002 and
2012; no project in the sample was completed
in 2018. Therefore, in the section Better, the
indicative findings are based on triangulating
the quantitative analysis of the 37 projects
from IOE’s all evaluation data series by
block with the moving period analysis of
59 projects from IOE’s PCRV/PPE data series
and 73 projects from Management’s PCR
rating sample – as well as with the qualitative
findings. Although further analysis on a more
complete sample is required in order to
confirm these initial findings, they provide an
indication of issues highlighted in evaluations
that require attention to ensure the successful
achievement of IFAD’s strategic objectives.
Bigger
182. The global food crisis triggered a steep
rise in IFAD’s approved Programme of
Work in the Eighth Replenishment of
IFAD’s Resources (IFAD8). A trend analysis
from the Fifth Replenishment of IFAD’s
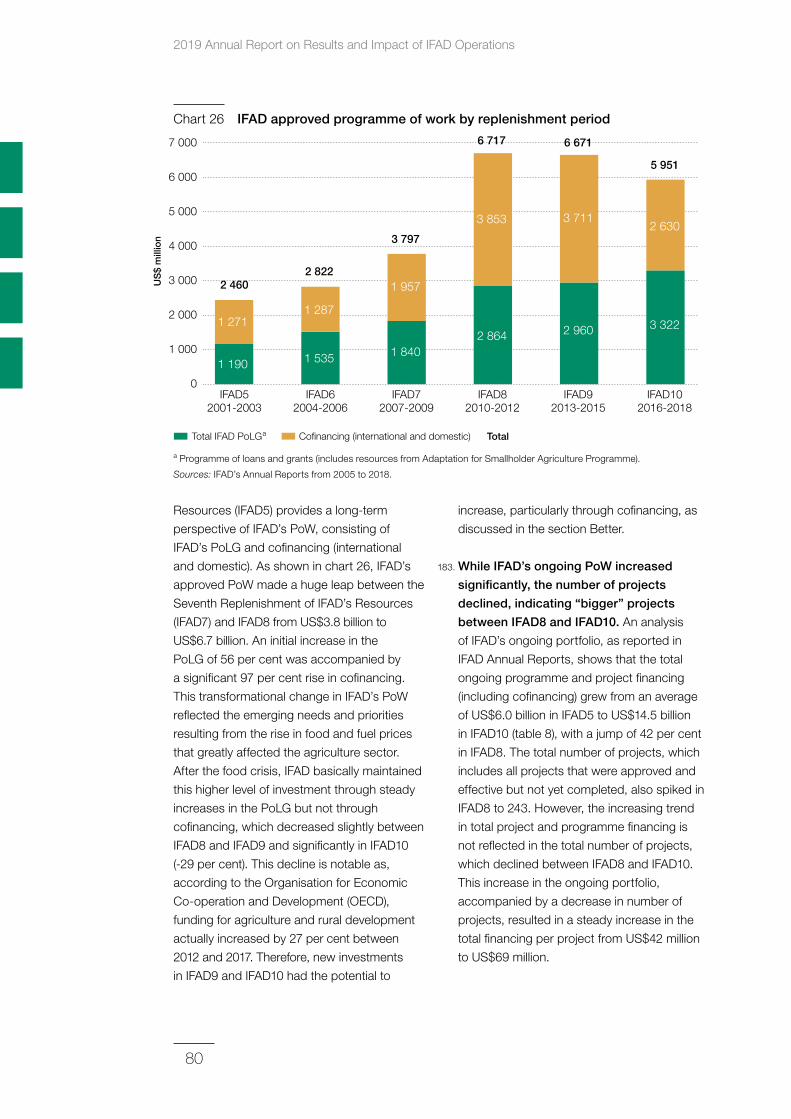
2019 Annual Report on Results and Impact of IFAD Operations
80
Resources (IFAD5) provides a long-term
perspective of IFAD’s PoW, consisting of
IFAD’s PoLG and cofinancing (international
and domestic). As shown in chart 26, IFAD’s
approved PoW made a huge leap between the
Seventh Replenishment of IFAD’s Resources
(IFAD7) and IFAD8 from US$3.8 billion to
US$6.7 billion. An initial increase in the
PoLG of 56 per cent was accompanied by
a significant 97 per cent rise in cofinancing.
This transformational change in IFAD’s PoW
reflected the emerging needs and priorities
resulting from the rise in food and fuel prices
that greatly affected the agriculture sector.
After the food crisis, IFAD basically maintained
this higher level of investment through steady
increases in the PoLG but not through
cofinancing, which decreased slightly between
IFAD8 and IFAD9 and significantly in IFAD10
(-29 per cent). This decline is notable as,
according to the Organisation for Economic
Co-operation and Development (OECD),
funding for agriculture and rural development
actually increased by 27 per cent between
2012 and 2017. Therefore, new investments
in IFAD9 and IFAD10 had the potential to
increase, particularly through cofinancing, as
discussed in the section Better.
183. While IFAD’s ongoing PoW increased
significantly, the number of projects
declined, indicating “bigger” projects
between IFAD8 and IFAD10. An analysis
of IFAD’s ongoing portfolio, as reported in
IFAD Annual Reports, shows that the total
ongoing programme and project financing
(including cofinancing) grew from an average
of US$6.0 billion in IFAD5 to US$14.5 billion
in IFAD10 (table 8), with a jump of 42 per cent
in IFAD8. The total number of projects, which
includes all projects that were approved and
effective but not yet completed, also spiked in
IFAD8 to 243. However, the increasing trend
in total project and programme financing is
not reflected in the total number of projects,
which declined between IFAD8 and IFAD10.
This increase in the ongoing portfolio,
accompanied by a decrease in number of
projects, resulted in a steady increase in the
total financing per project from US$42 million
to US$69 million.
a Programme of loans and grants (includes resources from Adaptation for Smallholder Agriculture Programme).
Sources: IFAD’s Annual Reports from 2005 to 2018.
Chart 26 IFAD approved programme of work by replenishment period
1 000
2 000
3 000
4 000
5 000
6 000
7 000U
S$
mill
ion
IFAD52001-2003
IFAD62004-2006
IFAD72007-2009
IFAD82010-2012
IFAD102016-2018
IFAD92013-2015
Total IFAD PoLGa
0
Co�nancing (international and domestic) Total
1 271
1 190
2 460
1 287
1 535
2 8221 957
1 840
3 853
2 864
3 711
2 960
6 671
3 797
6 717
2 630
3 322
5 951
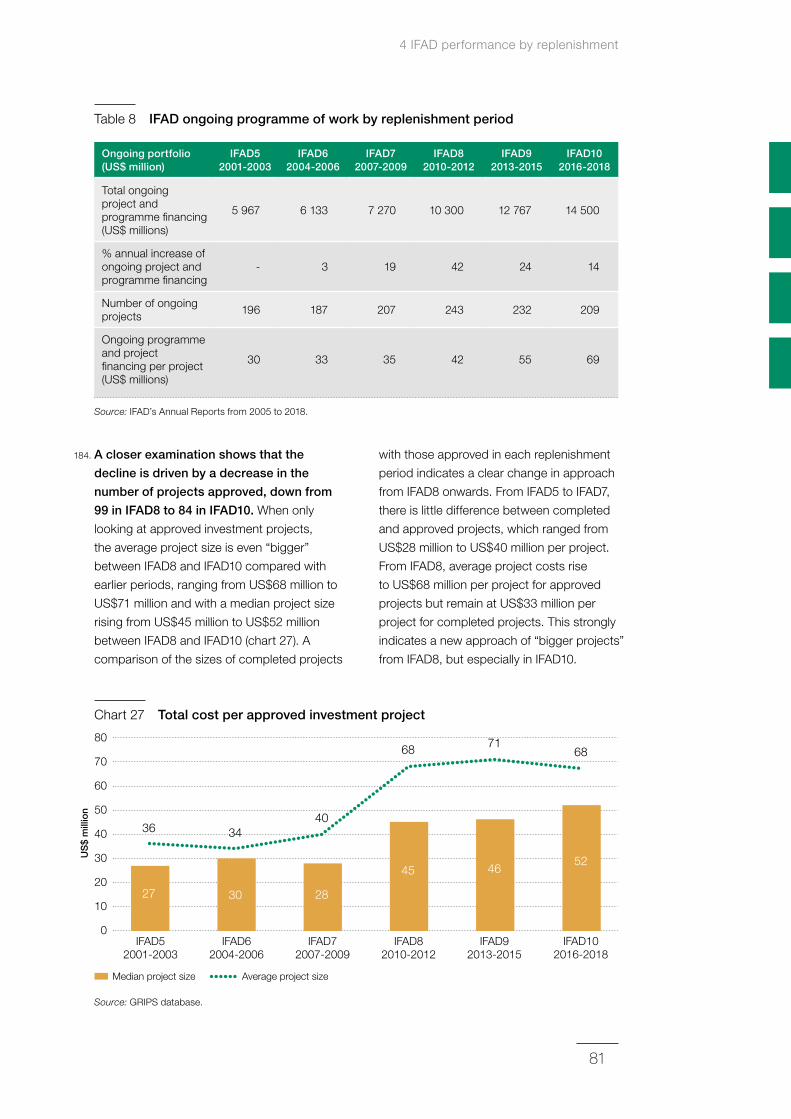
4 IFAD performance by replenishment
81
184. A closer examination shows that the
decline is driven by a decrease in the
number of projects approved, down from
99 in IFAD8 to 84 in IFAD10. When only
looking at approved investment projects,
the average project size is even “bigger”
between IFAD8 and IFAD10 compared with
earlier periods, ranging from US$68 million to
US$71 million and with a median project size
rising from US$45 million to US$52 million
between IFAD8 and IFAD10 (chart 27). A
comparison of the sizes of completed projects
with those approved in each replenishment
period indicates a clear change in approach
from IFAD8 onwards. From IFAD5 to IFAD7,
there is little difference between completed
and approved projects, which ranged from
US$28 million to US$40 million per project.
From IFAD8, average project costs rise
to US$68 million per project for approved
projects but remain at US$33 million per
project for completed projects. This strongly
indicates a new approach of “bigger projects”
from IFAD8, but especially in IFAD10.
Table 8 IFAD ongoing programme of work by replenishment period
Ongoing portfolio (US$ million)
IFAD5 2001‑2003
IFAD6 2004‑2006
IFAD7 2007‑2009
IFAD8 2010‑2012
IFAD9 2013‑2015
IFAD10 2016‑2018
Total ongoing project and programme financing (US$ millions)
5 967 6 133 7 270 10 300 12 767 14 500
% annual increase of ongoing project and programme financing
- 3 19 42 24 14
Number of ongoing projects 196 187 207 243 232 209
Ongoing programme and project financing per project (US$ millions)
30 33 35 42 55 69
Source: IFAD’s Annual Reports from 2005 to 2018.
Source: GRIPS database.
Chart 27 Total cost per approved investment project
0
10
20
30
40
50
60
70
80
IFAD52001-2003
IFAD62004-2006
IFAD72007-2009
IFAD82010-2012
IFAD92013-2015
Median project size Average project size
IFAD102016-2018
36
27
34
30
40
28
68
45
71
46
68
52US
$ m
illio
n
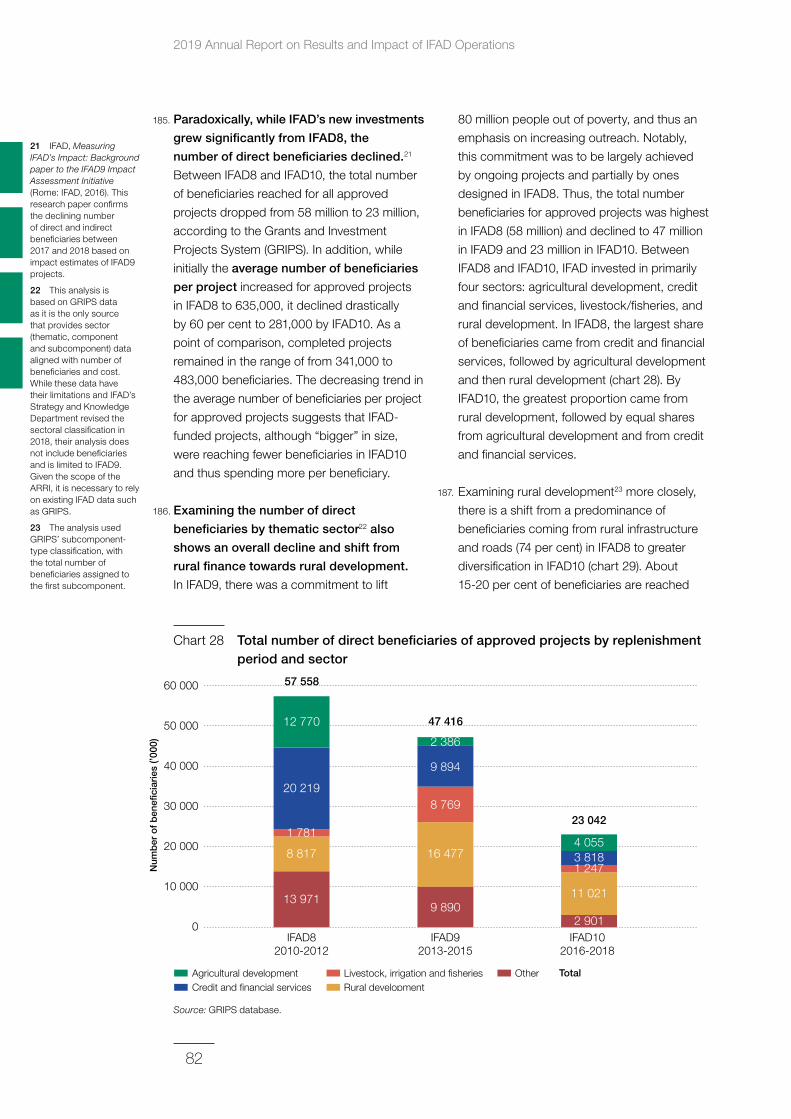
2019 Annual Report on Results and Impact of IFAD Operations
82
21 IFAD, Measuring IFAD’s Impact: Background paper to the IFAD9 Impact Assessment Initiative (Rome: IFAD, 2016). This research paper confirms the declining number of direct and indirect beneficiaries between 2017 and 2018 based on impact estimates of IFAD9 projects.
22 This analysis is based on GRIPS data as it is the only source that provides sector (thematic, component and subcomponent) data aligned with number of beneficiaries and cost. While these data have their limitations and IFAD’s Strategy and Knowledge Department revised the sectoral classification in 2018, their analysis does not include beneficiaries and is limited to IFAD9. Given the scope of the ARRI, it is necessary to rely on existing IFAD data such as GRIPS.
23 The analysis used GRIPS’ subcomponent-type classification, with the total number of beneficiaries assigned to the first subcomponent.
185. Paradoxically, while IFAD’s new investments
grew significantly from IFAD8, the
number of direct beneficiaries declined.21
Between IFAD8 and IFAD10, the total number
of beneficiaries reached for all approved
projects dropped from 58 million to 23 million,
according to the Grants and Investment
Projects System (GRIPS). In addition, while
initially the average number of beneficiaries
per project increased for approved projects
in IFAD8 to 635,000, it declined drastically
by 60 per cent to 281,000 by IFAD10. As a
point of comparison, completed projects
remained in the range of from 341,000 to
483,000 beneficiaries. The decreasing trend in
the average number of beneficiaries per project
for approved projects suggests that IFAD-
funded projects, although “bigger” in size,
were reaching fewer beneficiaries in IFAD10
and thus spending more per beneficiary.
186. Examining the number of direct
beneficiaries by thematic sector22 also
shows an overall decline and shift from
rural finance towards rural development.
In IFAD9, there was a commitment to lift
80 million people out of poverty, and thus an
emphasis on increasing outreach. Notably,
this commitment was to be largely achieved
by ongoing projects and partially by ones
designed in IFAD8. Thus, the total number
beneficiaries for approved projects was highest
in IFAD8 (58 million) and declined to 47 million
in IFAD9 and 23 million in IFAD10. Between
IFAD8 and IFAD10, IFAD invested in primarily
four sectors: agricultural development, credit
and financial services, livestock/fisheries, and
rural development. In IFAD8, the largest share
of beneficiaries came from credit and financial
services, followed by agricultural development
and then rural development (chart 28). By
IFAD10, the greatest proportion came from
rural development, followed by equal shares
from agricultural development and from credit
and financial services.
187. Examining rural development23 more closely,
there is a shift from a predominance of
beneficiaries coming from rural infrastructure
and roads (74 per cent) in IFAD8 to greater
diversification in IFAD10 (chart 29). About
15-20 per cent of beneficiaries are reached
Source: GRIPS database.
Chart 28 Total number of direct beneficiaries of approved projects by replenishment period and sector
IFAD82010-2012
IFAD102016-2018
IFAD92013-2015
Agricultural development Livestock, irrigation and �sheries OtherCredit and �nancial services Rural development
10 000
20 000
30 000
40 000
50 000
60 000
Total
0
1 781
8 817
13 971
20 219
12 770
8 769
16 477
9 890
9 894
2 386
1 247
11 021
2 901
3 8184 055
57 558
47 416
23 042
Num
ber
of
ben
e�ci
arie
s (’0
00)
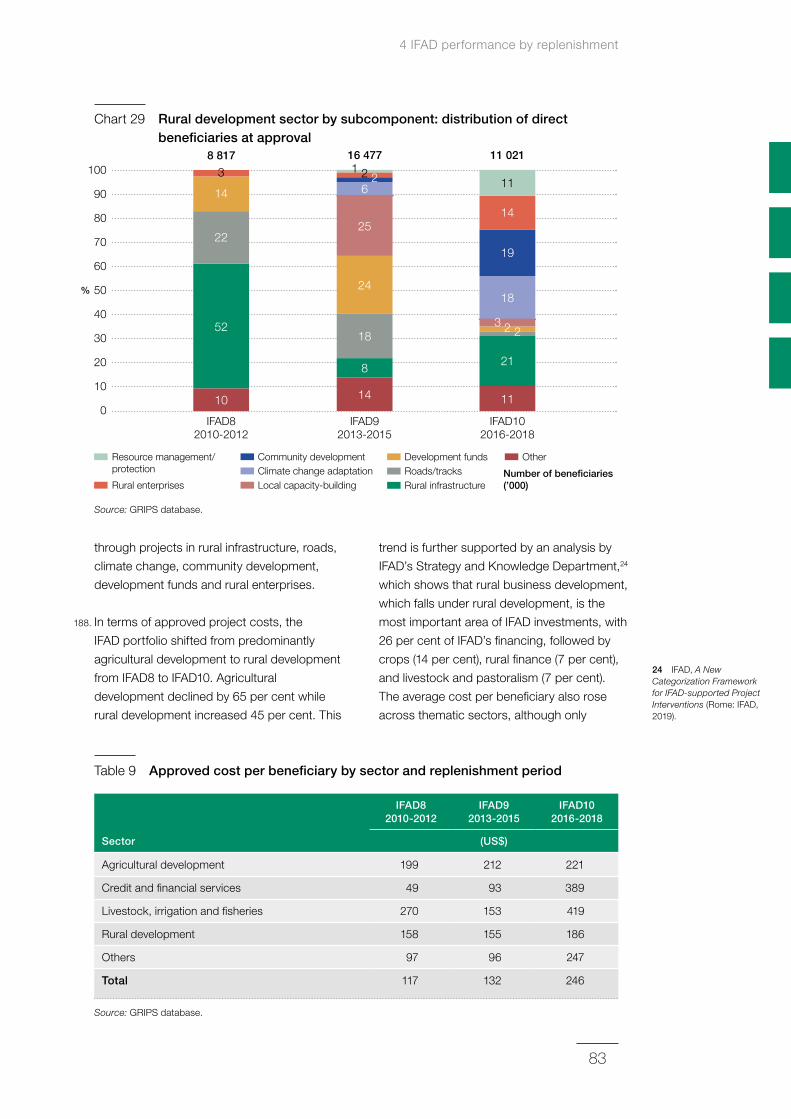
4 IFAD performance by replenishment
83
24 IFAD, A New Categorization Framework for IFAD-supported Project Interventions (Rome: IFAD, 2019).
through projects in rural infrastructure, roads,
climate change, community development,
development funds and rural enterprises.
188. In terms of approved project costs, the
IFAD portfolio shifted from predominantly
agricultural development to rural development
from IFAD8 to IFAD10. Agricultural
development declined by 65 per cent while
rural development increased 45 per cent. This
trend is further supported by an analysis by
IFAD’s Strategy and Knowledge Department,24
which shows that rural business development,
which falls under rural development, is the
most important area of IFAD investments, with
26 per cent of IFAD’s financing, followed by
crops (14 per cent), rural finance (7 per cent),
and livestock and pastoralism (7 per cent).
The average cost per beneficiary also rose
across thematic sectors, although only
Source: GRIPS database.
Chart 29 Rural development sector by subcomponent: distribution of direct beneficiaries at approval
IFAD82010-2012
IFAD102016-2018
IFAD92013-2015
Resource management/protection
Community development Development funds OtherRoads/tracksRural infrastructure
Climate change adaptationRural enterprises Local capacity-building
Number of bene�ciaries (’000)
10
100
20
30
40
50
60
70
80
90
%
0
22
52
10
14
3 26
25
24
18
8
14
1 8 817 16 477
2
19
18
3 2 2
21
11
11
11 021
14
Table 9 Approved cost per beneficiary by sector and replenishment period
Sector
IFAD8 2010‑2012
IFAD9 2013‑2015
IFAD10 2016‑2018
(US$)
Agricultural development 199 212 221
Credit and financial services 49 93 389
Livestock, irrigation and fisheries 270 153 419
Rural development 158 155 186
Others 97 96 247
Total 117 132 246
Source: GRIPS database.
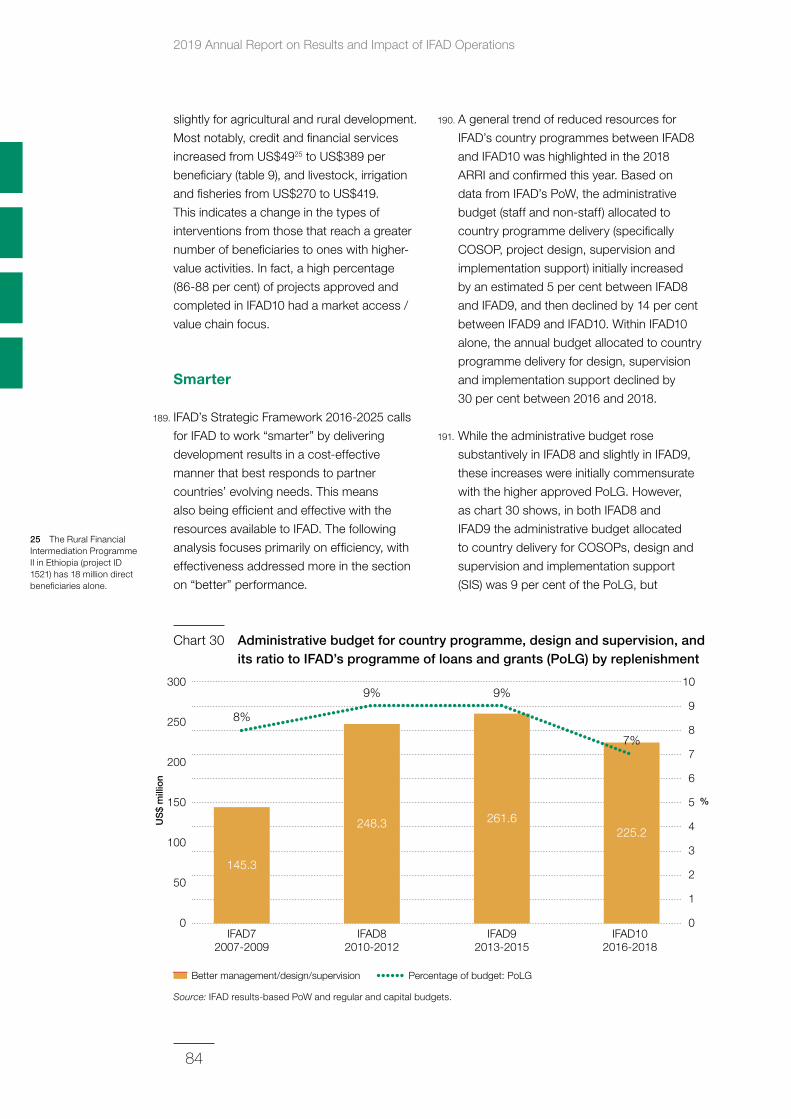
2019 Annual Report on Results and Impact of IFAD Operations
84
25 The Rural Financial Intermediation Programme II in Ethiopia (project ID 1521) has 18 million direct beneficiaries alone.
slightly for agricultural and rural development.
Most notably, credit and financial services
increased from US$4925 to US$389 per
beneficiary (table 9), and livestock, irrigation
and fisheries from US$270 to US$419.
This indicates a change in the types of
interventions from those that reach a greater
number of beneficiaries to ones with higher-
value activities. In fact, a high percentage
(86-88 per cent) of projects approved and
completed in IFAD10 had a market access /
value chain focus.
Smarter
189. IFAD’s Strategic Framework 2016-2025 calls
for IFAD to work “smarter” by delivering
development results in a cost-effective
manner that best responds to partner
countries’ evolving needs. This means
also being efficient and effective with the
resources available to IFAD. The following
analysis focuses primarily on efficiency, with
effectiveness addressed more in the section
on “better” performance.
190. A general trend of reduced resources for
IFAD’s country programmes between IFAD8
and IFAD10 was highlighted in the 2018
ARRI and confirmed this year. Based on
data from IFAD’s PoW, the administrative
budget (staff and non-staff) allocated to
country programme delivery (specifically
COSOP, project design, supervision and
implementation support) initially increased
by an estimated 5 per cent between IFAD8
and IFAD9, and then declined by 14 per cent
between IFAD9 and IFAD10. Within IFAD10
alone, the annual budget allocated to country
programme delivery for design, supervision
and implementation support declined by
30 per cent between 2016 and 2018.
191. While the administrative budget rose
substantively in IFAD8 and slightly in IFAD9,
these increases were initially commensurate
with the higher approved PoLG. However,
as chart 30 shows, in both IFAD8 and
IFAD9 the administrative budget allocated
to country delivery for COSOPs, design and
supervision and implementation support
(SIS) was 9 per cent of the PoLG, but
Source: IFAD results-based PoW and regular and capital budgets.
Chart 30 Administrative budget for country programme, design and supervision, and its ratio to IFAD’s programme of loans and grants (PoLG) by replenishment
0 0
300 10
9
8
7
6
5
4
3
2
150
100
150
200
250
%
IFAD72007-2009
IFAD82010-2012
IFAD102016-2018
IFAD92013-2015
Better management/design/supervision Percentage of budget: PoLG
145.3
248.3 261.6225.2
7%
9%
8%
9%
US
$ m
illio
n
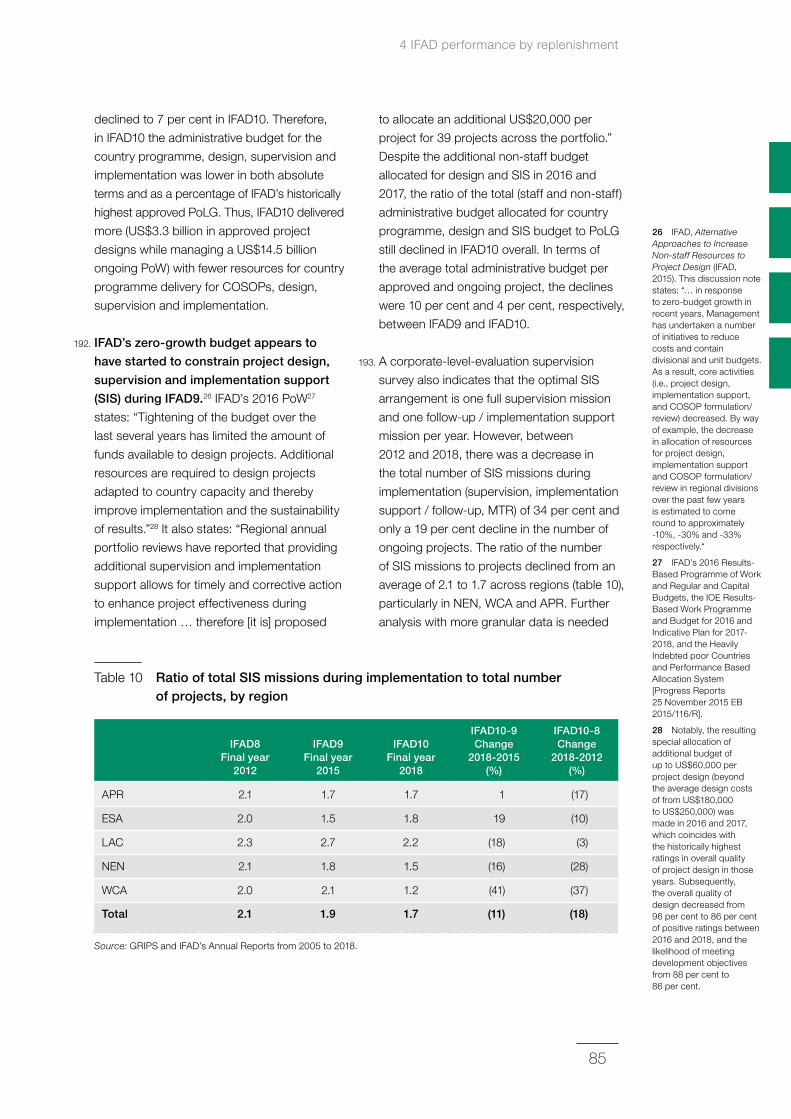
4 IFAD performance by replenishment
85
26 IFAD, Alternative Approaches to Increase Non-staff Resources to Project Design (IFAD, 2015). This discussion note states: “… in response to zero-budget growth in recent years, Management has undertaken a number of initiatives to reduce costs and contain divisional and unit budgets. As a result, core activities (i.e., project design, implementation support, and COSOP formulation/review) decreased. By way of example, the decrease in allocation of resources for project design, implementation support and COSOP formulation/review in regional divisions over the past few years is estimated to come round to approximately -10%, -30% and -33% respectively.“
27 IFAD’s 2016 Results-Based Programme of Work and Regular and Capital Budgets, the IOE Results-Based Work Programme and Budget for 2016 and Indicative Plan for 2017-2018, and the Heavily Indebted poor Countries and Performance Based Allocation System [Progress Reports 25 November 2015 EB 2015/116/R].
28 Notably, the resulting special allocation of additional budget of up to US$60,000 per project design (beyond the average design costs of from US$180,000 to US$250,000) was made in 2016 and 2017, which coincides with the historically highest ratings in overall quality of project design in those years. Subsequently, the overall quality of design decreased from 96 per cent to 86 per cent of positive ratings between 2016 and 2018, and the likelihood of meeting development objectives from 88 per cent to 86 per cent.
declined to 7 per cent in IFAD10. Therefore,
in IFAD10 the administrative budget for the
country programme, design, supervision and
implementation was lower in both absolute
terms and as a percentage of IFAD’s historically
highest approved PoLG. Thus, IFAD10 delivered
more (US$3.3 billion in approved project
designs while managing a US$14.5 billion
ongoing PoW) with fewer resources for country
programme delivery for COSOPs, design,
supervision and implementation.
192. IFAD’s zero‑growth budget appears to
have started to constrain project design,
supervision and implementation support
(SIS) during IFAD9.26 IFAD’s 2016 PoW27
states: “Tightening of the budget over the
last several years has limited the amount of
funds available to design projects. Additional
resources are required to design projects
adapted to country capacity and thereby
improve implementation and the sustainability
of results.”28 It also states: “Regional annual
portfolio reviews have reported that providing
additional supervision and implementation
support allows for timely and corrective action
to enhance project effectiveness during
implementation … therefore [it is] proposed
to allocate an additional US$20,000 per
project for 39 projects across the portfolio.”
Despite the additional non-staff budget
allocated for design and SIS in 2016 and
2017, the ratio of the total (staff and non-staff)
administrative budget allocated for country
programme, design and SIS budget to PoLG
still declined in IFAD10 overall. In terms of
the average total administrative budget per
approved and ongoing project, the declines
were 10 per cent and 4 per cent, respectively,
between IFAD9 and IFAD10.
193. A corporate-level-evaluation supervision
survey also indicates that the optimal SIS
arrangement is one full supervision mission
and one follow-up / implementation support
mission per year. However, between
2012 and 2018, there was a decrease in
the total number of SIS missions during
implementation (supervision, implementation
support / follow-up, MTR) of 34 per cent and
only a 19 per cent decline in the number of
ongoing projects. The ratio of the number
of SIS missions to projects declined from an
average of 2.1 to 1.7 across regions (table 10),
particularly in NEN, WCA and APR. Further
analysis with more granular data is needed
Table 10 Ratio of total SIS missions during implementation to total number of projects, by region
IFAD8 Final year
2012
IFAD9 Final year
2015
IFAD10 Final year
2018
IFAD10‑9 Change
2018‑2015 (%)
IFAD10‑8 Change
2018‑2012 (%)
APR 2.1 1.7 1.7 1 (17)
ESA 2.0 1.5 1.8 19 (10)
LAC 2.3 2.7 2.2 (18) (3)
NEN 2.1 1.8 1.5 (16) (28)
WCA 2.0 2.1 1.2 (41) (37)
Total 2.1 1.9 1.7 (11) (18)
Source: GRIPS and IFAD’s Annual Reports from 2005 to 2018.
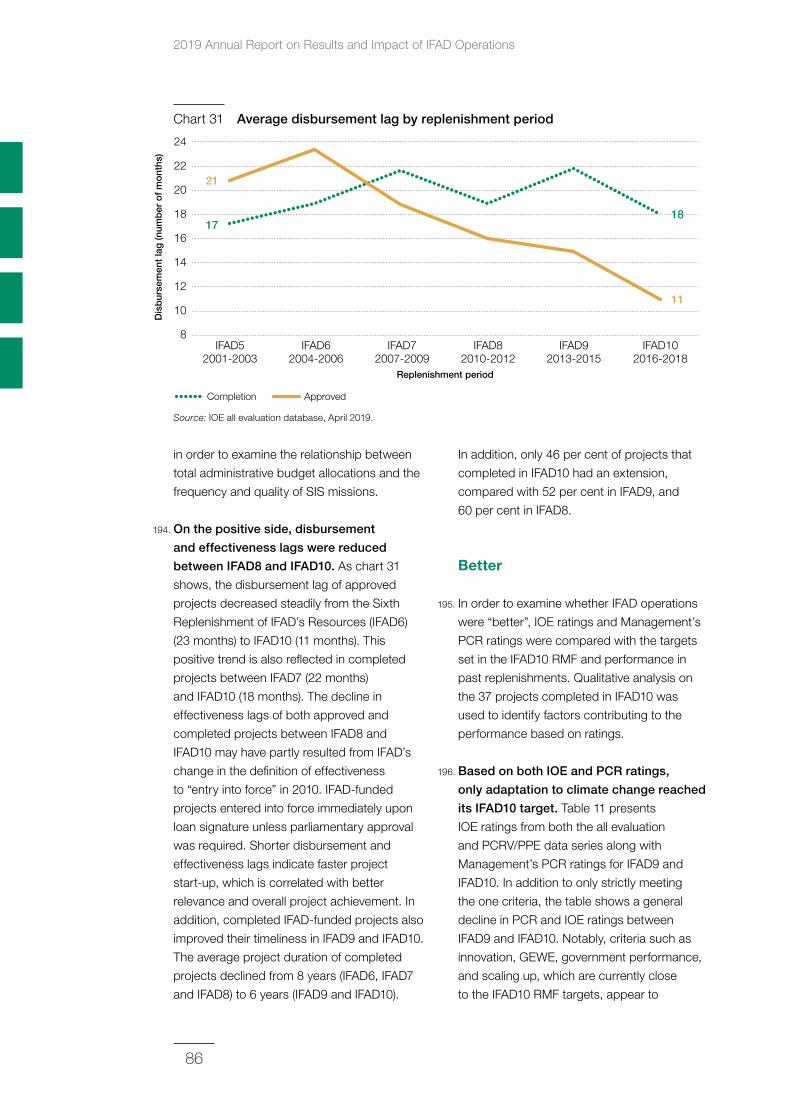
2019 Annual Report on Results and Impact of IFAD Operations
86
in order to examine the relationship between
total administrative budget allocations and the
frequency and quality of SIS missions.
194. On the positive side, disbursement
and effectiveness lags were reduced
between IFAD8 and IFAD10. As chart 31
shows, the disbursement lag of approved
projects decreased steadily from the Sixth
Replenishment of IFAD’s Resources (IFAD6)
(23 months) to IFAD10 (11 months). This
positive trend is also reflected in completed
projects between IFAD7 (22 months)
and IFAD10 (18 months). The decline in
effectiveness lags of both approved and
completed projects between IFAD8 and
IFAD10 may have partly resulted from IFAD’s
change in the definition of effectiveness
to “entry into force” in 2010. IFAD-funded
projects entered into force immediately upon
loan signature unless parliamentary approval
was required. Shorter disbursement and
effectiveness lags indicate faster project
start-up, which is correlated with better
relevance and overall project achievement. In
addition, completed IFAD-funded projects also
improved their timeliness in IFAD9 and IFAD10.
The average project duration of completed
projects declined from 8 years (IFAD6, IFAD7
and IFAD8) to 6 years (IFAD9 and IFAD10).
In addition, only 46 per cent of projects that
completed in IFAD10 had an extension,
compared with 52 per cent in IFAD9, and
60 per cent in IFAD8.
Better
195. In order to examine whether IFAD operations
were “better”, IOE ratings and Management’s
PCR ratings were compared with the targets
set in the IFAD10 RMF and performance in
past replenishments. Qualitative analysis on
the 37 projects completed in IFAD10 was
used to identify factors contributing to the
performance based on ratings.
196. Based on both IOE and PCR ratings,
only adaptation to climate change reached
its IFAD10 target. Table 11 presents
IOE ratings from both the all evaluation
and PCRV/PPE data series along with
Management’s PCR ratings for IFAD9 and
IFAD10. In addition to only strictly meeting
the one criteria, the table shows a general
decline in PCR and IOE ratings between
IFAD9 and IFAD10. Notably, criteria such as
innovation, GEWE, government performance,
and scaling up, which are currently close
to the IFAD10 RMF targets, appear to
Source: IOE all evaluation database, April 2019.
Chart 31 Average disbursement lag by replenishment period
8
10
12
14
16
18
20
22
24
IFAD52001-2003
IFAD62004-2006
IFAD72007-2009
IFAD82010-2012
IFAD92013-2015
Completion Approved
IFAD102016-2018
Replenishment period
17
21
18
11
Dis
bur
sem
ent
lag
(num
ber
of
mo
nths
)
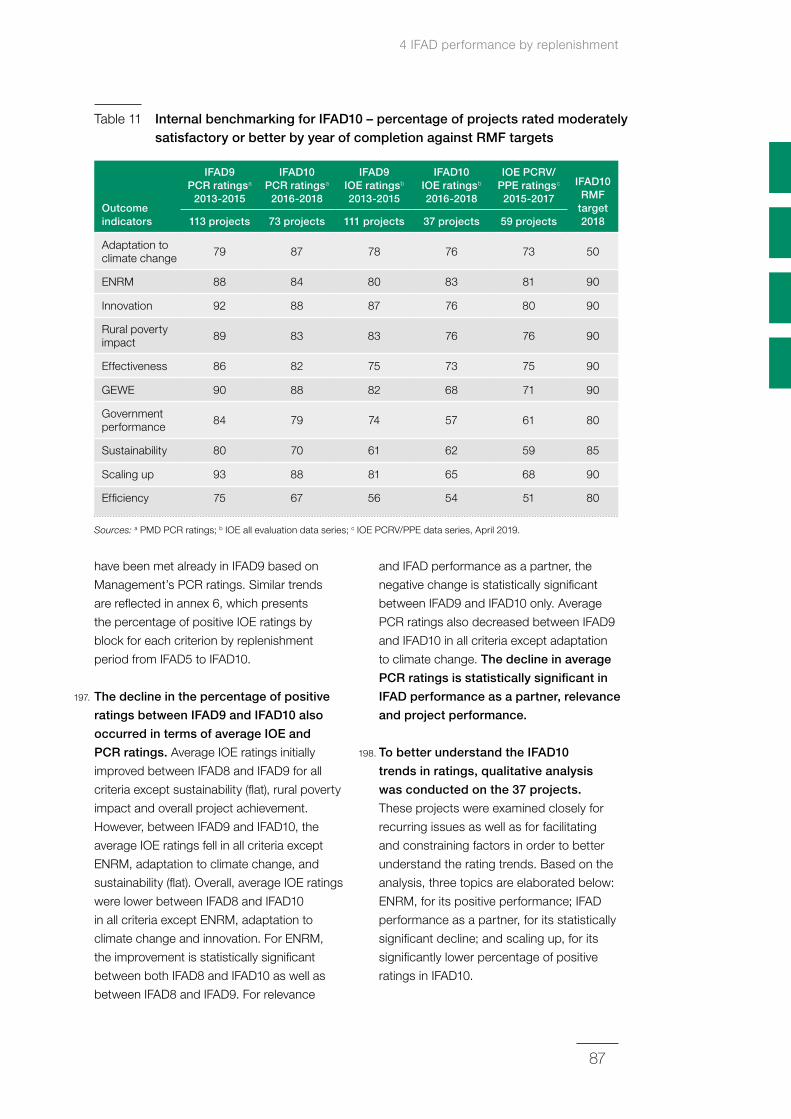
4 IFAD performance by replenishment
87
have been met already in IFAD9 based on
Management’s PCR ratings. Similar trends
are reflected in annex 6, which presents
the percentage of positive IOE ratings by
block for each criterion by replenishment
period from IFAD5 to IFAD10.
197. The decline in the percentage of positive
ratings between IFAD9 and IFAD10 also
occurred in terms of average IOE and
PCR ratings. Average IOE ratings initially
improved between IFAD8 and IFAD9 for all
criteria except sustainability (flat), rural poverty
impact and overall project achievement.
However, between IFAD9 and IFAD10, the
average IOE ratings fell in all criteria except
ENRM, adaptation to climate change, and
sustainability (flat). Overall, average IOE ratings
were lower between IFAD8 and IFAD10
in all criteria except ENRM, adaptation to
climate change and innovation. For ENRM,
the improvement is statistically significant
between both IFAD8 and IFAD10 as well as
between IFAD8 and IFAD9. For relevance
and IFAD performance as a partner, the
negative change is statistically significant
between IFAD9 and IFAD10 only. Average
PCR ratings also decreased between IFAD9
and IFAD10 in all criteria except adaptation
to climate change. The decline in average
PCR ratings is statistically significant in
IFAD performance as a partner, relevance
and project performance.
198. To better understand the IFAD10
trends in ratings, qualitative analysis
was conducted on the 37 projects.
These projects were examined closely for
recurring issues as well as for facilitating
and constraining factors in order to better
understand the rating trends. Based on the
analysis, three topics are elaborated below:
ENRM, for its positive performance; IFAD
performance as a partner, for its statistically
significant decline; and scaling up, for its
significantly lower percentage of positive
ratings in IFAD10.
Table 11 Internal benchmarking for IFAD10 – percentage of projects rated moderately satisfactory or better by year of completion against RMF targets
Outcome indicators
IFAD9 PCR ratingsa
2013‑2015
IFAD10 PCR ratingsa
2016‑2018
IFAD9 IOE ratingsb 2013‑2015
IFAD10 IOE ratingsb 2016‑2018
IOE PCRV/PPE ratingsc 2015‑2017
IFAD10 RMF
target 2018113 projects 73 projects 111 projects 37 projects 59 projects
Adaptation to climate change 79 87 78 76 73 50
ENRM 88 84 80 83 81 90
Innovation 92 88 87 76 80 90
Rural poverty impact 89 83 83 76 76 90
Effectiveness 86 82 75 73 75 90
GEWE 90 88 82 68 71 90
Government performance 84 79 74 57 61 80
Sustainability 80 70 61 62 59 85
Scaling up 93 88 81 65 68 90
Efficiency 75 67 56 54 51 80
Sources: a PMD PCR ratings; b IOE all evaluation data series; c IOE PCRV/PPE data series, April 2019.
2019 Annual Report on Results and Impact of IFAD Operations
88
29 IFAD, Corporate-Level Evaluation: IFAD’s financial architecture (Rome: IFAD, 2018).
30 Cofinancing is only one type of partnership (others being knowledge and learning, coordination, and cooperation) and may be limited based on a government’s strategy in working with multilateral agencies.
31 OECD.Stat. https://stats.oecd.org/Index.aspx?datasetcode=TABLE5, retrieved on 10 June 2019.
199. ENRM is the only criterion with a
positive trend in IFAD10. According to the
Evaluation Synthesis on Environment and
Natural Resource Management, successful
strategies in ENRM often feature: (i) strong
commitment and better integration of ENRM in
COSOPs; (ii) project designs that avoid doing
environmental harm and pursue opportunities;
(iii) governance and institutional set-ups
with the involvement of local community
organizations; (iv) participatory planning in
delivering project results; and (v) incentives
to encourage uptake of more sustainable
practices.
200. Preventive measures were successful
in raising awareness in ENRM for high‑
performing projects in IFAD10. In Senegal’s
PAFA, promotion of appropriate technical
methods for improving agricultural production
taking into account soil properties and water
constraints generated positive results. Another
facilitating factor in ENRM was linked to the
promotion of peaceful co-existence of different
groups (pastoralists, semi-pastoralists, and
settlers), as in Sudan’s Western Resources
Management Programme, where a new range
and pasture law positioned communities to
lobby against encroachment and become
involved in long-term interventions. In Mexico’s
Community-based Forestry Development
Project in Southern States, the creation
and strengthening of microenterprises
helped reduce the pressure on natural
forests, generated income alternatives, and
encouraged communities to conserve their
natural resources. In turn, technology transfer
favoured the efficient use of natural resources
and reduced forest degradation.
201. IFAD performance as a partner represents
a critical issue in IFAD10 as it is a
traditional strength that has begun to
decline. This decline is mostly linked to
recurring issues such as: high CPM turnover;
a lack of specialists in supervision missions;
and flaws in project design. In some instances,
a lack of dialogue with other development
agencies has compromised a project’s ability
to achieve successful outcomes. Factors
supporting positive performance have
been associated with: regular support and
prompt decision-making, design adjustment
during implementation, appropriate
technical expertise, and capitalizing on past
experiences. Performance was rated positively
where IFAD was considered a strategic ally in
technical and financial execution as well as a
neutral actor accepted by local communities.
202. The decline29 in cofinancing30 between
IFAD8 and IFAD10 also reflects on
the financing aspect of partnership.
Cofinancing peaked in IFAD8, fuelled by
the global food crisis. Notably, official
development assistance31 to agriculture
actually increased by 27 per cent between
2012 and 2017, well after the end of the food
crisis. Yet, the ratio of international cofinancing
for approved IFAD-funded projects declined
between IFAD8 and IFAD10 from 0.86 to 0.50,
indicating that IFAD did not manage to capture
a greater share of this growth. The lower ratio
of international cofinancing among projects
approved in IFAD10 may be related to reduced
resources and time for project design, as such
projects require additional time for planning
and coordination. The ratio of domestic
cofinancing decreased from 0.53 to 0.21
between IFAD8 and 10, which also may be a
reflection of IFAD’s performance as a partner
in relation to government.
203. Scaling up is a key principle of
engagement at the core of IFAD’s
operations according to the Strategic
Framework. Yet, thus far, performance
in IFAD10 has been lower compared to
IFAD9. Some recurring issues highlighted
in the 2017 Evaluation Synthesis on IFAD’s
Support to Scaling up of Results are exhibited
in the IFAD10 projects. These issues include:
a lack of government ownership; weak
coordination among non-lending activities;
and no sustainable exit strategy at design.
The lack of an exit strategy at design is a
4 IFAD performance by replenishment
89
32 LMS e-learning course on scaling up.
major inhibiting factor for scaling up in IFAD10
projects. The prospects for future scaling
up diminished in projects where innovative
funding arrangements failed to be developed
(as in Egypt’s Upper Egypt Rural Development
Project). In Sri Lanka’s Iranamadu Irrigation
Development Project, farmers did not
receive ongoing training, and marketing
arrangements were not institutionalized to
ensure sustainability. In some instances, the
mere replication of projects or their delegation
to subsequent IFAD interventions (as in
Armenia’s Rural Asset Creation Programme,
and the Dominican Republic’s Development
Project for Rural Poor Economic Organizations
of the Border Region) compromised the
process of scaling up.
204. For projects to be scaled up successfully,
it is important that they be aligned with
the country’s overall strategy.32 Country
programmes need to both “look backwards”,
by capitalizing on past experiences to
mitigate risks and develop a scaling up vision
from the beginning, and “look forward” to
identify means of financial sustainability.
Benefits derived from investments can be
sustainable beyond the project’s life only if
the pathways for sharing knowledge and
achieving a vision of long-term engagement
are considered. The Rural Financial Services
and Agribusiness Development Project in the
Republic of Moldova is a positive example of
sustainable profitability for beneficiaries due to
commitments for longer-term rural financing
going beyond project completion.
205. In sum, IFAD10 performance indicates
the challenge of achieving the Strategic
Framework’s vision for a “bigger, better
and smarter” organization. While IFAD10
project investments remained big and
were smarter in terms of reduced costs,
they are yet to prove better in quality. IFAD
experienced impressive growth in IFAD8,
which it maintained into IFAD10. Although the
PoLG grew steadily, budgetary resources for
country programme management, design
and SIS appear to have declined to a point
in IFAD10 where the ratio of administrative
budget to PoLG was below the IFAD7 level.
In a context of a zero-growth budget and
with the aim to be “smarter” by doing more
with less, IFAD has managed its growth by
designing fewer but larger projects. The ratio
of SIS missions to projects also decreased
between 2012 and 2018. From IFAD7, the
timeliness of projects improved, with reduced
disbursement lags and project duration.
206. However, a declining trend is observed
between IFAD9 and IFAD10 based on both
IOE and PCR ratings of completed projects.
Based on the statistically significant changes,
it can be said that IFAD demonstrated better
quality in ENRM, while performance was
weaker in relevance, IFAD performance as a
partner, and project performance. All other
criteria display declining trends between
IFAD9 and IFAD10; however, there is no
statistically significant change. Qualitative
analysis of better- and weaker-performing
criteria in IFAD10 highlights the importance of
technical expertise and support during project
design and implementation, and dialogue with
country stakeholders and partners, as well
as long-term engagement starting with the
design but going beyond project completion.
Moving forward into IFAD11, greater efforts are
required to enhance the quality of the project
portfolio. This entails: (i) strengthening IFAD’s
performance as a partner in the context of the
new decentralization model; (ii) enhancing the
technical quality in IFAD-funded projects and
SIS missions; and (iii) developing partnerships
for greater cofinancing and scaling up of
project impact.
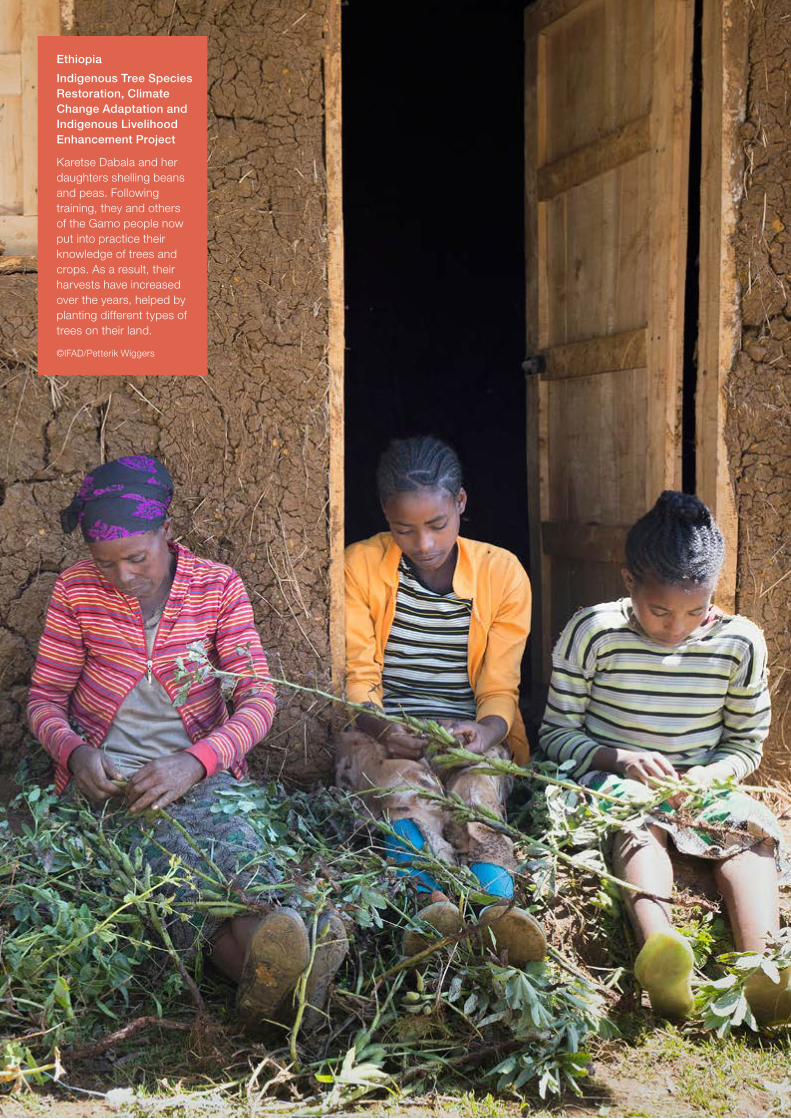
Ethiopia
Indigenous Tree Species Restoration, Climate Change Adaptation and Indigenous Livelihood Enhancement Project
Karetse Dabala and her daughters shelling beans and peas. Following training, they and others of the Gamo people now put into practice their knowledge of trees and crops. As a result, their harvests have increased over the years, helped by planting different types of trees on their land.
©IFAD/Petterik Wiggers
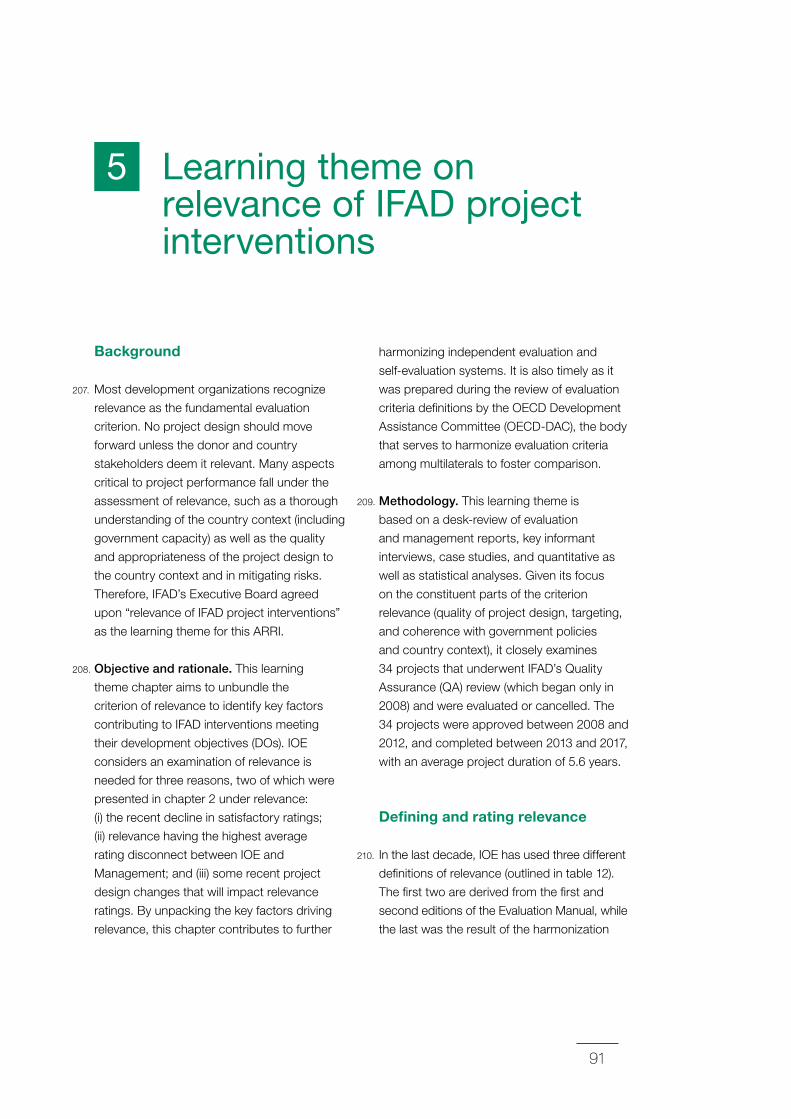
91
Learning theme on relevance of IFAD project interventions
5
Background
207. Most development organizations recognize
relevance as the fundamental evaluation
criterion. No project design should move
forward unless the donor and country
stakeholders deem it relevant. Many aspects
critical to project performance fall under the
assessment of relevance, such as a thorough
understanding of the country context (including
government capacity) as well as the quality
and appropriateness of the project design to
the country context and in mitigating risks.
Therefore, IFAD’s Executive Board agreed
upon “relevance of IFAD project interventions”
as the learning theme for this ARRI.
208. Objective and rationale. This learning
theme chapter aims to unbundle the
criterion of relevance to identify key factors
contributing to IFAD interventions meeting
their development objectives (DOs). IOE
considers an examination of relevance is
needed for three reasons, two of which were
presented in chapter 2 under relevance:
(i) the recent decline in satisfactory ratings;
(ii) relevance having the highest average
rating disconnect between IOE and
Management; and (iii) some recent project
design changes that will impact relevance
ratings. By unpacking the key factors driving
relevance, this chapter contributes to further
harmonizing independent evaluation and
self-evaluation systems. It is also timely as it
was prepared during the review of evaluation
criteria definitions by the OECD Development
Assistance Committee (OECD-DAC), the body
that serves to harmonize evaluation criteria
among multilaterals to foster comparison.
209. Methodology. This learning theme is
based on a desk-review of evaluation
and management reports, key informant
interviews, case studies, and quantitative as
well as statistical analyses. Given its focus
on the constituent parts of the criterion
relevance (quality of project design, targeting,
and coherence with government policies
and country context), it closely examines
34 projects that underwent IFAD’s Quality
Assurance (QA) review (which began only in
2008) and were evaluated or cancelled. The
34 projects were approved between 2008 and
2012, and completed between 2013 and 2017,
with an average project duration of 5.6 years.
Defining and rating relevance
210. In the last decade, IOE has used three different
definitions of relevance (outlined in table 12).
The first two are derived from the first and
second editions of the Evaluation Manual, while
the last was the result of the harmonization
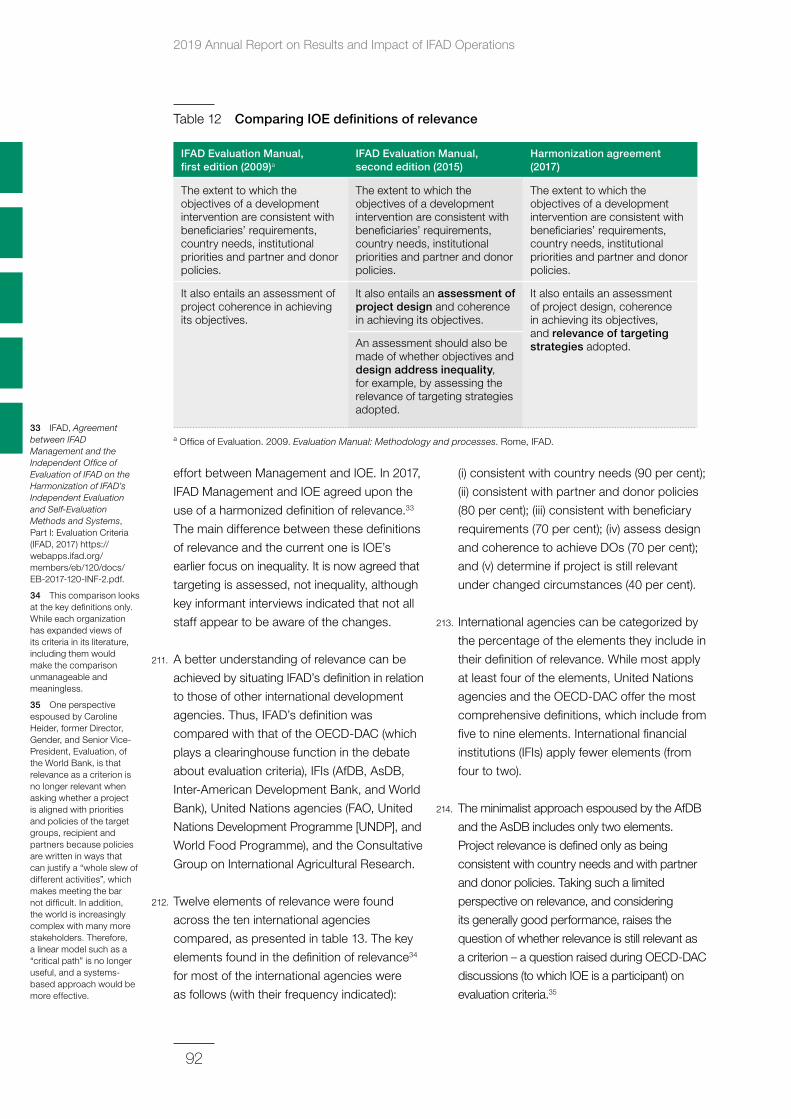
2019 Annual Report on Results and Impact of IFAD Operations
92
33 IFAD, Agreement between IFAD Management and the Independent Office of Evaluation of IFAD on the Harmonization of IFAD’s Independent Evaluation and Self-Evaluation Methods and Systems, Part I: Evaluation Criteria (IFAD, 2017) https://webapps.ifad.org/members/eb/120/docs/EB-2017-120-INF-2.pdf.
34 This comparison looks at the key definitions only. While each organization has expanded views of its criteria in its literature, including them would make the comparison unmanageable and meaningless.
35 One perspective espoused by Caroline Heider, former Director, Gender, and Senior Vice-President, Evaluation, of the World Bank, is that relevance as a criterion is no longer relevant when asking whether a project is aligned with priorities and policies of the target groups, recipient and partners because policies are written in ways that can justify a “whole slew of different activities”, which makes meeting the bar not difficult. In addition, the world is increasingly complex with many more stakeholders. Therefore, a linear model such as a “critical path” is no longer useful, and a systems-based approach would be more effective.
effort between Management and IOE. In 2017,
IFAD Management and IOE agreed upon the
use of a harmonized definition of relevance.33
The main difference between these definitions
of relevance and the current one is IOE’s
earlier focus on inequality. It is now agreed that
targeting is assessed, not inequality, although
key informant interviews indicated that not all
staff appear to be aware of the changes.
211. A better understanding of relevance can be
achieved by situating IFAD’s definition in relation
to those of other international development
agencies. Thus, IFAD’s definition was
compared with that of the OECD-DAC (which
plays a clearinghouse function in the debate
about evaluation criteria), IFIs (AfDB, AsDB,
Inter-American Development Bank, and World
Bank), United Nations agencies (FAO, United
Nations Development Programme [UNDP], and
World Food Programme), and the Consultative
Group on International Agricultural Research.
212. Twelve elements of relevance were found
across the ten international agencies
compared, as presented in table 13. The key
elements found in the definition of relevance34
for most of the international agencies were
as follows (with their frequency indicated):
(i) consistent with country needs (90 per cent);
(ii) consistent with partner and donor policies
(80 per cent); (iii) consistent with beneficiary
requirements (70 per cent); (iv) assess design
and coherence to achieve DOs (70 per cent);
and (v) determine if project is still relevant
under changed circumstances (40 per cent).
213. International agencies can be categorized by
the percentage of the elements they include in
their definition of relevance. While most apply
at least four of the elements, United Nations
agencies and the OECD-DAC offer the most
comprehensive definitions, which include from
five to nine elements. International financial
institutions (IFIs) apply fewer elements (from
four to two).
214. The minimalist approach espoused by the AfDB
and the AsDB includes only two elements.
Project relevance is defined only as being
consistent with country needs and with partner
and donor policies. Taking such a limited
perspective on relevance, and considering
its generally good performance, raises the
question of whether relevance is still relevant as
a criterion – a question raised during OECD-DAC
discussions (to which IOE is a participant) on
evaluation criteria.35
Table 12 Comparing IOE definitions of relevance
IFAD Evaluation Manual, first edition (2009)a
IFAD Evaluation Manual, second edition (2015)
Harmonization agreement (2017)
The extent to which the objectives of a development intervention are consistent with beneficiaries’ requirements, country needs, institutional priorities and partner and donor policies.
The extent to which the objectives of a development intervention are consistent with beneficiaries’ requirements, country needs, institutional priorities and partner and donor policies.
The extent to which the objectives of a development intervention are consistent with beneficiaries’ requirements, country needs, institutional priorities and partner and donor policies.
It also entails an assessment of project coherence in achieving its objectives.
It also entails an assessment of project design and coherence in achieving its objectives.
It also entails an assessment of project design, coherence in achieving its objectives, and relevance of targeting strategies adopted.An assessment should also be
made of whether objectives and design address inequality, for example, by assessing the relevance of targeting strategies adopted.
a Office of Evaluation. 2009. Evaluation Manual: Methodology and processes. Rome, IFAD.
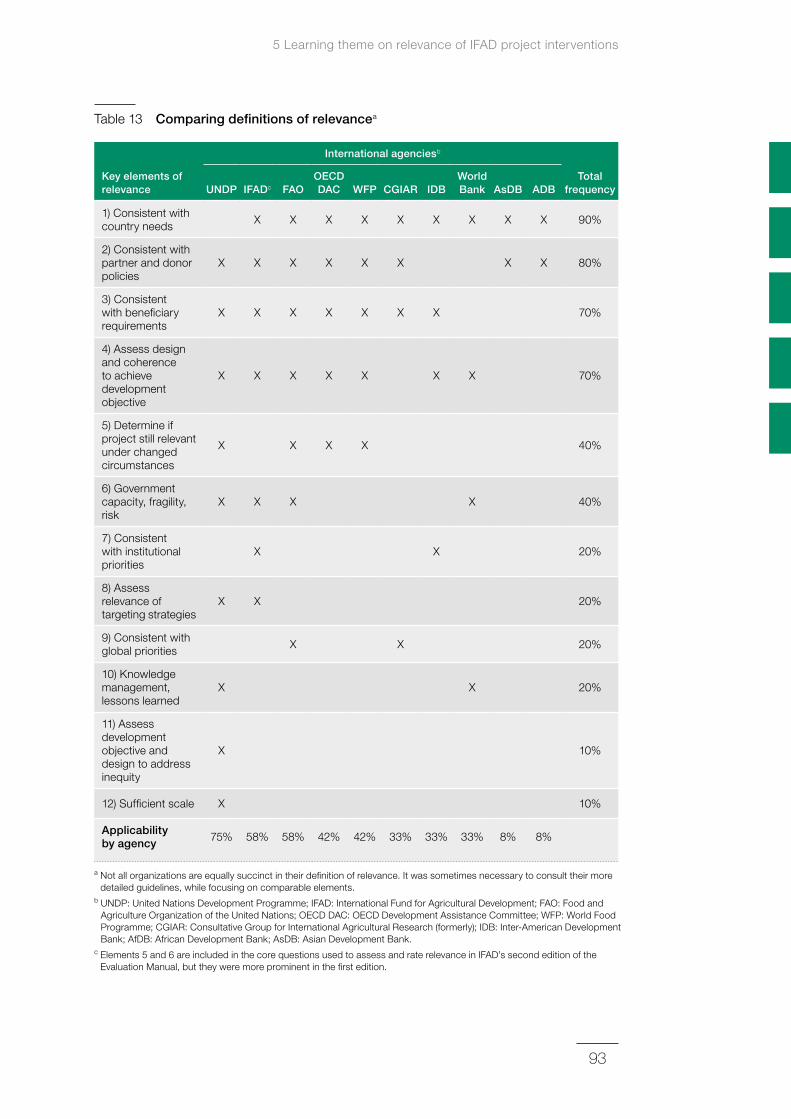
5 Learning theme on relevance of IFAD project interventions
93
Table 13 Comparing definitions of relevancea
Key elements of relevance
International agenciesb
Total frequencyUNDP IFADc FAO
OECD DAC WFP CGIAR IDB
World Bank AsDB ADB
1) Consistent with country needs X X X X X X X X X 90%
2) Consistent with partner and donor policies
X X X X X X X X 80%
3) Consistent with beneficiary requirements
X X X X X X X 70%
4) Assess design and coherence to achieve development objective
X X X X X X X 70%
5) Determine if project still relevant under changed circumstances
X X X X 40%
6) Government capacity, fragility, risk
X X X X 40%
7) Consistent with institutional priorities
X X 20%
8) Assess relevance of targeting strategies
X X 20%
9) Consistent with global priorities X X 20%
10) Knowledge management, lessons learned
X X 20%
11) Assess development objective and design to address inequity
X 10%
12) Sufficient scale X 10%
Applicability by agency
75% 58% 58% 42% 42% 33% 33% 33% 8% 8%
a Not all organizations are equally succinct in their definition of relevance. It was sometimes necessary to consult their more detailed guidelines, while focusing on comparable elements.
b UNDP: United Nations Development Programme; IFAD: International Fund for Agricultural Development; FAO: Food and Agriculture Organization of the United Nations; OECD DAC: OECD Development Assistance Committee; WFP: World Food Programme; CGIAR: Consultative Group for International Agricultural Research (formerly); IDB: Inter-American Development Bank; AfDB: African Development Bank; AsDB: Asian Development Bank.
c Elements 5 and 6 are included in the core questions used to assess and rate relevance in IFAD’s second edition of the Evaluation Manual, but they were more prominent in the first edition.
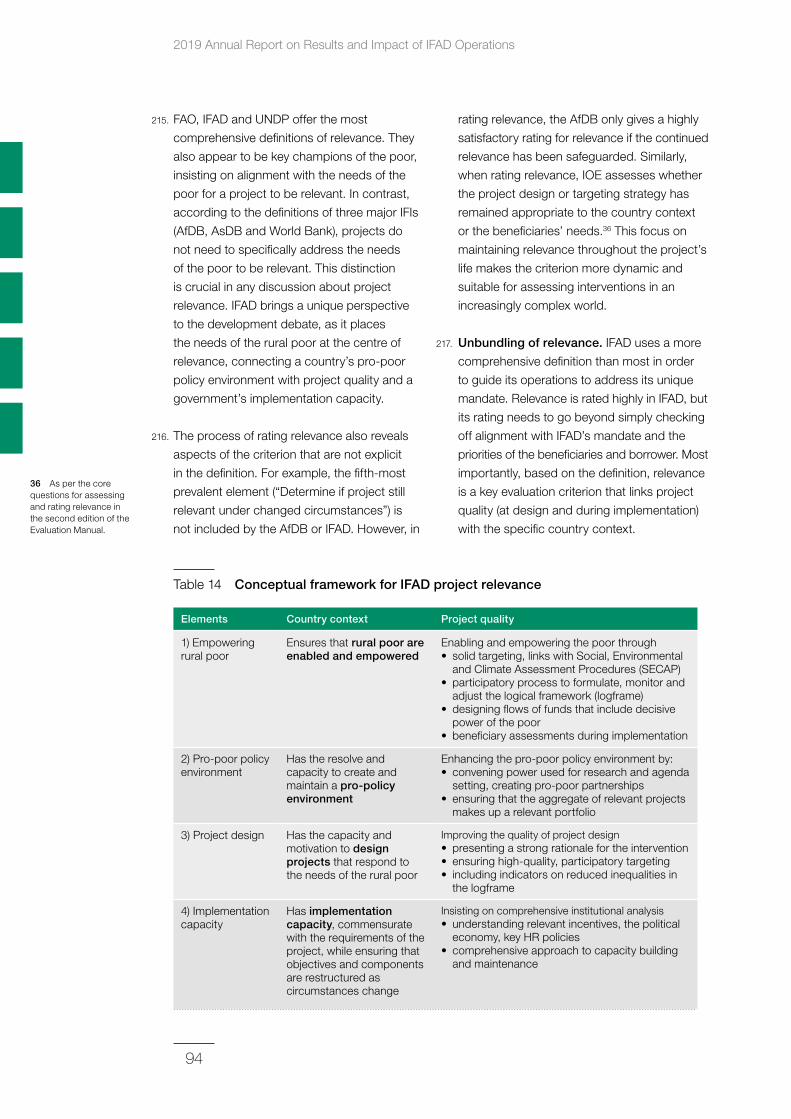
2019 Annual Report on Results and Impact of IFAD Operations
94
36 As per the core questions for assessing and rating relevance in the second edition of the Evaluation Manual.
215. FAO, IFAD and UNDP offer the most
comprehensive definitions of relevance. They
also appear to be key champions of the poor,
insisting on alignment with the needs of the
poor for a project to be relevant. In contrast,
according to the definitions of three major IFIs
(AfDB, AsDB and World Bank), projects do
not need to specifically address the needs
of the poor to be relevant. This distinction
is crucial in any discussion about project
relevance. IFAD brings a unique perspective
to the development debate, as it places
the needs of the rural poor at the centre of
relevance, connecting a country’s pro-poor
policy environment with project quality and a
government’s implementation capacity.
216. The process of rating relevance also reveals
aspects of the criterion that are not explicit
in the definition. For example, the fifth-most
prevalent element (“Determine if project still
relevant under changed circumstances”) is
not included by the AfDB or IFAD. However, in
rating relevance, the AfDB only gives a highly
satisfactory rating for relevance if the continued
relevance has been safeguarded. Similarly,
when rating relevance, IOE assesses whether
the project design or targeting strategy has
remained appropriate to the country context
or the beneficiaries’ needs.36 This focus on
maintaining relevance throughout the project’s
life makes the criterion more dynamic and
suitable for assessing interventions in an
increasingly complex world.
217. Unbundling of relevance. IFAD uses a more
comprehensive definition than most in order
to guide its operations to address its unique
mandate. Relevance is rated highly in IFAD, but
its rating needs to go beyond simply checking
off alignment with IFAD’s mandate and the
priorities of the beneficiaries and borrower. Most
importantly, based on the definition, relevance
is a key evaluation criterion that links project
quality (at design and during implementation)
with the specific country context.
Table 14 Conceptual framework for IFAD project relevance
Elements Country context Project quality
1) Empowering rural poor
Ensures that rural poor are enabled and empowered
Enabling and empowering the poor through• solid targeting, links with Social, Environmental
and Climate Assessment Procedures (SECAP)• participatory process to formulate, monitor and
adjust the logical framework (logframe)• designing flows of funds that include decisive
power of the poor• beneficiary assessments during implementation
2) Pro-poor policy environment
Has the resolve and capacity to create and maintain a pro‑policy environment
Enhancing the pro-poor policy environment by:• convening power used for research and agenda
setting, creating pro-poor partnerships• ensuring that the aggregate of relevant projects
makes up a relevant portfolio
3) Project design Has the capacity and motivation to design projects that respond to the needs of the rural poor
Improving the quality of project design• presenting a strong rationale for the intervention• ensuring high-quality, participatory targeting• including indicators on reduced inequalities in
the logframe
4) Implementation capacity
Has implementation capacity, commensurate with the requirements of the project, while ensuring that objectives and components are restructured as circumstances change
Insisting on comprehensive institutional analysis• understanding relevant incentives, the political
economy, key HR policies• comprehensive approach to capacity building
and maintenance
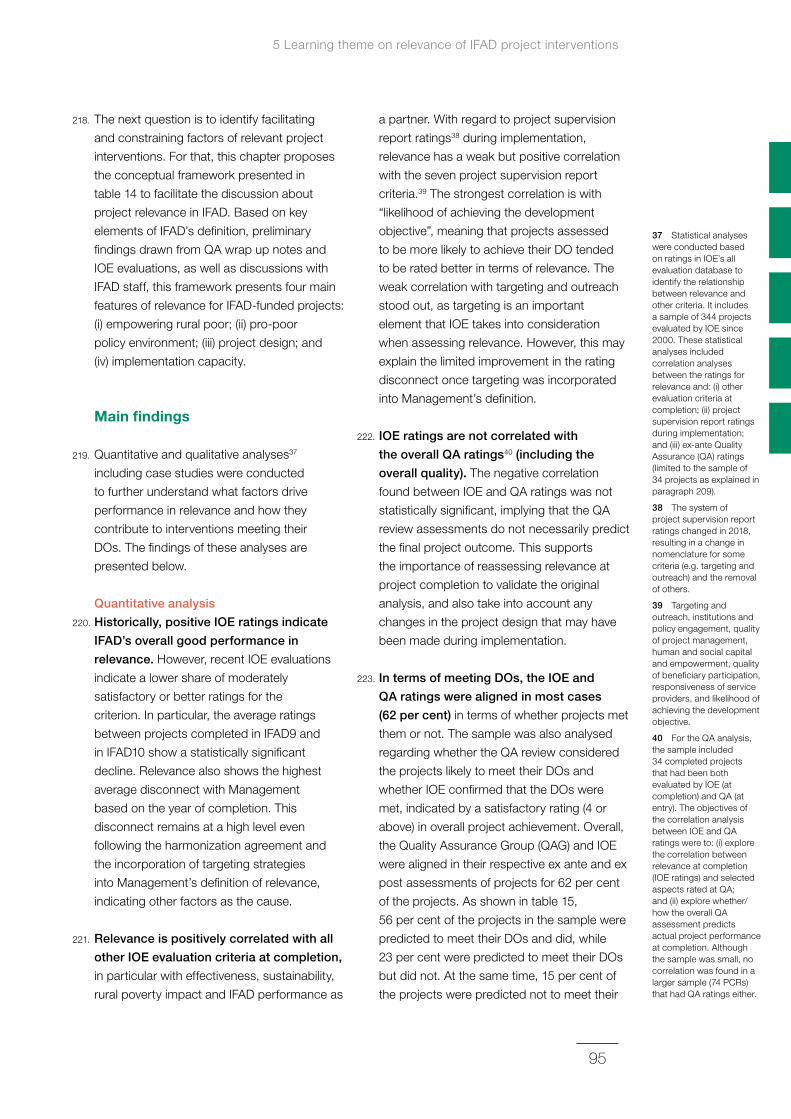
5 Learning theme on relevance of IFAD project interventions
95
37 Statistical analyses were conducted based on ratings in IOE’s all evaluation database to identify the relationship between relevance and other criteria. It includes a sample of 344 projects evaluated by IOE since 2000. These statistical analyses included correlation analyses between the ratings for relevance and: (i) other evaluation criteria at completion; (ii) project supervision report ratings during implementation; and (iii) ex-ante Quality Assurance (QA) ratings (limited to the sample of 34 projects as explained in paragraph 209).
38 The system of project supervision report ratings changed in 2018, resulting in a change in nomenclature for some criteria (e.g. targeting and outreach) and the removal of others.
39 Targeting and outreach, institutions and policy engagement, quality of project management, human and social capital and empowerment, quality of beneficiary participation, responsiveness of service providers, and likelihood of achieving the development objective.
40 For the QA analysis, the sample included 34 completed projects that had been both evaluated by IOE (at completion) and QA (at entry). The objectives of the correlation analysis between IOE and QA ratings were to: (i) explore the correlation between relevance at completion (IOE ratings) and selected aspects rated at QA; and (ii) explore whether/how the overall QA assessment predicts actual project performance at completion. Although the sample was small, no correlation was found in a larger sample (74 PCRs) that had QA ratings either.
218. The next question is to identify facilitating
and constraining factors of relevant project
interventions. For that, this chapter proposes
the conceptual framework presented in
table 14 to facilitate the discussion about
project relevance in IFAD. Based on key
elements of IFAD’s definition, preliminary
findings drawn from QA wrap up notes and
IOE evaluations, as well as discussions with
IFAD staff, this framework presents four main
features of relevance for IFAD-funded projects:
(i) empowering rural poor; (ii) pro-poor
policy environment; (iii) project design; and
(iv) implementation capacity.
Main findings
219. Quantitative and qualitative analyses37
including case studies were conducted
to further understand what factors drive
performance in relevance and how they
contribute to interventions meeting their
DOs. The findings of these analyses are
presented below.
Quantitative analysis
220. Historically, positive IOE ratings indicate
IFAD’s overall good performance in
relevance. However, recent IOE evaluations
indicate a lower share of moderately
satisfactory or better ratings for the
criterion. In particular, the average ratings
between projects completed in IFAD9 and
in IFAD10 show a statistically significant
decline. Relevance also shows the highest
average disconnect with Management
based on the year of completion. This
disconnect remains at a high level even
following the harmonization agreement and
the incorporation of targeting strategies
into Management’s definition of relevance,
indicating other factors as the cause.
221. Relevance is positively correlated with all
other IOE evaluation criteria at completion,
in particular with effectiveness, sustainability,
rural poverty impact and IFAD performance as
a partner. With regard to project supervision
report ratings38 during implementation,
relevance has a weak but positive correlation
with the seven project supervision report
criteria.39 The strongest correlation is with
“likelihood of achieving the development
objective”, meaning that projects assessed
to be more likely to achieve their DO tended
to be rated better in terms of relevance. The
weak correlation with targeting and outreach
stood out, as targeting is an important
element that IOE takes into consideration
when assessing relevance. However, this may
explain the limited improvement in the rating
disconnect once targeting was incorporated
into Management’s definition.
222. IOE ratings are not correlated with
the overall QA ratings40 (including the
overall quality). The negative correlation
found between IOE and QA ratings was not
statistically significant, implying that the QA
review assessments do not necessarily predict
the final project outcome. This supports
the importance of reassessing relevance at
project completion to validate the original
analysis, and also take into account any
changes in the project design that may have
been made during implementation.
223. In terms of meeting DOs, the IOE and
QA ratings were aligned in most cases
(62 per cent) in terms of whether projects met
them or not. The sample was also analysed
regarding whether the QA review considered
the projects likely to meet their DOs and
whether IOE confirmed that the DOs were
met, indicated by a satisfactory rating (4 or
above) in overall project achievement. Overall,
the Quality Assurance Group (QAG) and IOE
were aligned in their respective ex ante and ex
post assessments of projects for 62 per cent
of the projects. As shown in table 15,
56 per cent of the projects in the sample were
predicted to meet their DOs and did, while
23 per cent were predicted to meet their DOs
but did not. At the same time, 15 per cent of
the projects were predicted not to meet their
2019 Annual Report on Results and Impact of IFAD Operations
96
41 Six projects were selected from the original sample of 34 projects that had undergone both a QA review and IOE evaluation. The initial selection was based on their classification in terms of QA-predicted and IOE-assessed likelihood of meeting development objectives. The final selection ensured diversity in terms of: (i) region; and (ii) country income status (MIC/LIC), context (e.g. fragility), and sector. The six projects are: (i) Pro-Poor Partnerships for Agroforestry Development Project (Viet Nam); (ii) Mountain to Markets Programme (Albania); (iii) Rural Business Development Services Programme (Burkina Faso); (iv) Development Project for Rural Poor Economic Organizations of the Border Region (Dominican Republic); (v) Rural Microfinance and Livestock Support Programme (Afghanistan); and (vi) Fisheries Development Project (Eritrea).
42 IOE. 2019 Annual Report on Results and Impact of IFAD Operations (ARRI): Relevance of IFAD project interventions. Issues Paper (IFAD, 2019).
DOs and instead did, while 6 per cent were
predicted not to meet their DOs and did not.
224. A slightly higher proportion of projects
deemed “unlikely” to meet their DOs
(15 per cent) actually met them, according
to IOE. Among the projects that were
predicted to meet their DOs, it would be
expected that most would indeed do that;
while within the group of projects predicted
not to meet their DOs, most would indeed
fail. Within the group of projects that were
predicted to meet their DOs, 70 per cent
were actually successful at completion. In
this case, QAG and IOE were aligned in most
cases when projects were predicted to meet
their DOs. Nevertheless, the proportion of
successful projects is slightly higher within the
group of projects predicted not to meet their
DOs (72 per cent). This means that QAG
and IOE were not aligned in most cases
when projects were predicted not to meet
their DOs. This may indicate that “unlikely”
judgements trigger additional efforts and/
or design adjustments, which positively
contribute to project performance.
Qualitative analysis
225. Given that ex ante project design is not the
main determinant of project outcome and
the importance of “continued relevance”,
six case studies41 were prepared in order to
support the qualitative analysis and examine
project relevance throughout the project cycle
of design, implementation and completion.
The full list, description and rationale for
the selection of case-studies are included
in the issues paper found in the electronic
appendices.42 Key features of relevance drawn
from the conceptual framework in table 14 are
highlighted from four case studies presented
below: (i) empowering rural poor; (ii) pro-poor
policy environment; (iii) project design; and
(iv) implementation capacity.
226. Empowering the rural poor. The Afghanistan
Rural Microfinance and Livestock Support
Programme was predicted unlikely to meet
its DO by the QA, but did, based on IOE’s
assessment. Its DO was to provide sustainable
access to smallholders to appropriate
microfinance services and technical skills
required for more profitable enterprises.
The ambitious design was supported by the
introduction of a scheme targeting the ultra-
poor, which used a participatory rural appraisal
methodology, including social mapping,
wealth ranking and community interviews, to
identify beneficiary households. The strategy
allowed beneficiaries to graduate and access
microfinance institutions. The programme
also contributed to the Government of
Afghanistan’s key policy promoting the use of
Islamic financing, a design feature that worked
well and attracted significant attention in the
region. The adoption of the BRAC model,
targeting the ultra-poor, further ensured that
the targeted people actually benefited from
the project. This approach was supported
with a very good diagnostic stage, a targeting
strategy, participatory mechanisms and
gender awareness.
Table 15 Projects categorized by likelihood and actual project achievement (34 projects)
QA likelihood of achieving development objectives
IOE overall project achievement
“achieved” “unachieved” Total
“likely” 56% 23% 79%
“unlikely” 15% 6% 21%
Total 71% 29% 100%
Source: IOE evaluation database (PCRV/PPE), February 2019.
5 Learning theme on relevance of IFAD project interventions
97
227. Pro‑poor policy environment. The
Dominican Republic Project for Rural Poor
Economic Organizations of the Border
Region was predicted to meet its DOs, but
did not do so. The DO was to increase the
income and assets of men, women and
youth members of economic organizations
through participative, equitable and
environmentally sustainable development.
A number of quality enhancement and
assurance recommendations were properly
addressed in the design, such as the value
chain analysis and more comprehensive
training topics. However, the design only
outlined concrete actions on how to reach
women and youth, but not other poorer or
vulnerable groups. The underlying assumption
seemed to be that benefits would flow from
less-vulnerable groups to more-vulnerable
groups. Several issues also delayed the
project’s implementation, some being beyond
the project’s control, such as a presidential
election and the establishment of a new
government. These risks might have been
foreseen in the risk analysis, and mitigation
measures taken in a timely fashion. However,
the strategy of the country shifted during
implementation, and thanks to the CPM’s
efforts to transfer the project to a different
ministry, any negative outcomes were
mitigated. Overall, the project lacked sufficient
understanding of the institutional framework.
An institutional analysis could have avoided
much of the start-up delay, and allowed for
more effective and efficient implementation of
the project.
228. Project design “continued relevance”.
The Pro-Poor Partnerships for Agroforestry
Development Project in Viet Nam was
predicted to meet its DOs by the QA, which
was confirmed by IOE. It’s DO was to establish
a framework for sustainable and profitable
agroforestry development in Bac Kan
Province, targeting poor rural households. The
project is an example of how a solid PMU and
committed government can make a success
out of a poorly designed project. The original
design was very complex and ambitious
(six different outcomes), and uncorrelated
development paths were expected to
promote “new ideas”. It was not clear how to
operationalize the original design because of
the lack of details of key activities in the initial
years of implementation.
229. Highly relevant decisions were made after
project launch, such as: (i) simplifying the
set of activities and designing them as a
participatory process, supported through
a newly designed project manual; and
(ii) decentralizing a significant number of
project activities in close collaboration with
the government while building implementation
capacity among local government agents.
As a result, a key feature of the project was
its impressive efforts to improve its relevance
during implementation and attempt to achieve
the DOs in the course of implementation.
The project built sustainable, relevant
capacity, and introduced participatory and
accurate reallocation mechanisms of the
forestland titles.
230. Implementation capacity. The Eritrea
Fisheries Development Project was predicted
not to meet its DO and did not do so. The
project’s DO was to raise production and
productivity of the fisheries sector while
conserving fish stocks and the marine
ecosystem and supporting the restructuring
of the cooperative system. This project was
the first operation after a hiatus of about
20 years, and IFAD was the first IFI to have
a meaningful dialogue with the Government.
Eritrea was emerging from a war, but faced
an ongoing conflict with Ethiopia, with many
rural people drafted into the armed forces.
The government was lacking capacity at
virtually all levels, and the country had an
underdeveloped private sector, with the
central government determined to manage
projects through the public sector. IFAD
underestimated the border disputes between
Eritrea and Ethiopia, a situation that remains
challenging. As a consequence, the availability
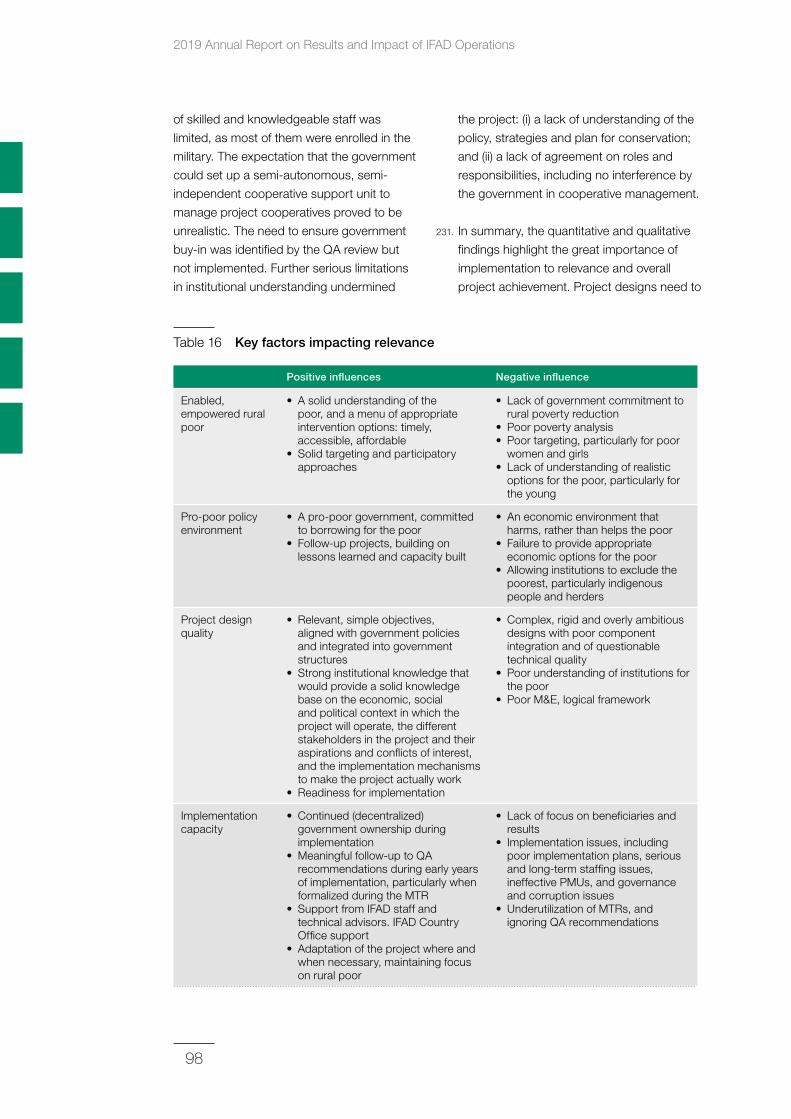
2019 Annual Report on Results and Impact of IFAD Operations
98
of skilled and knowledgeable staff was
limited, as most of them were enrolled in the
military. The expectation that the government
could set up a semi-autonomous, semi-
independent cooperative support unit to
manage project cooperatives proved to be
unrealistic. The need to ensure government
buy-in was identified by the QA review but
not implemented. Further serious limitations
in institutional understanding undermined
the project: (i) a lack of understanding of the
policy, strategies and plan for conservation;
and (ii) a lack of agreement on roles and
responsibilities, including no interference by
the government in cooperative management.
231. In summary, the quantitative and qualitative
findings highlight the great importance of
implementation to relevance and overall
project achievement. Project designs need to
Table 16 Key factors impacting relevance
Positive influences Negative influence
Enabled, empowered rural poor
• A solid understanding of the poor, and a menu of appropriate intervention options: timely, accessible, affordable
• Solid targeting and participatory approaches
• Lack of government commitment to rural poverty reduction
• Poor poverty analysis• Poor targeting, particularly for poor
women and girls• Lack of understanding of realistic
options for the poor, particularly for the young
Pro-poor policy environment
• A pro-poor government, committed to borrowing for the poor
• Follow-up projects, building on lessons learned and capacity built
• An economic environment that harms, rather than helps the poor
• Failure to provide appropriate economic options for the poor
• Allowing institutions to exclude the poorest, particularly indigenous people and herders
Project design quality
• Relevant, simple objectives, aligned with government policies and integrated into government structures
• Strong institutional knowledge that would provide a solid knowledge base on the economic, social and political context in which the project will operate, the different stakeholders in the project and their aspirations and conflicts of interest, and the implementation mechanisms to make the project actually work
• Readiness for implementation
• Complex, rigid and overly ambitious designs with poor component integration and of questionable technical quality
• Poor understanding of institutions for the poor
• Poor M&E, logical framework
Implementation capacity
• Continued (decentralized) government ownership during implementation
• Meaningful follow-up to QA recommendations during early years of implementation, particularly when formalized during the MTR
• Support from IFAD staff and technical advisors. IFAD Country Office support
• Adaptation of the project where and when necessary, maintaining focus on rural poor
• Lack of focus on beneficiaries and results
• Implementation issues, including poor implementation plans, serious and long-term staffing issues, ineffective PMUs, and governance and corruption issues
• Underutilization of MTRs, and ignoring QA recommendations
5 Learning theme on relevance of IFAD project interventions
99
be appropriate to countries’ implementation
capacities determined by institutional
analyses. The original project design needs to
be adapted as and when conditions change
in the country context. The case studies
provide a wide-ranging view of the quality
of relevance, but significantly, confirmed the
conceptual framework in table 14 and the key
elements of relevance presented there.
232. While there was no correlation between
QAG’s prediction and a project’s actual
success, it should be recalled that the QA
review’s objective was to improve the quality
of the project design, not to speculate on
eventual outcomes. In cases where QA
recommendations were implemented, as in
the case of Afghanistan, the DO was achieved.
Conversely, where QA recommendations were
ignored, it often led to failure in achieving the
DO, as in the case of Eritrea. In that case, QA
recommendations were not followed up, and
the QA prediction of unlikely achievement of
the DOs was confirmed. This suggests the
need for better accountability to ensure that
QA recommendations are followed up during
implementation.
233. Drawing from these six case studies, as well
as the findings from the quantitative and
qualitative analyses, table 16 presents the
positive and negative factors driving optimal
or continued relevance for IFAD project
interventions.
Lessons
234. Based on the findings and the case studies
presented in the previous chapters, this
chapter presents five key lessons regarding
relevance in project interventions.
235. Lesson 1. Ensuring the continued
relevance of a project intervention
requires adapting the design throughout
implementation. Relevance is not a fixed
assessment at design, a binary decision on
whether the project is relevant or not. Yet,
typically under “rationale”, design reports of
IFAD-funded projects just provide a simple
reassurance that the project targets the
rural poor and cites general government
and IFAD policies to confirm alignment.
This reflects more the simpler definition of
relevance of most IFIs rather than IFAD’s more
comprehensive definition.
236. A more suitable question at the design
stage may be whether the proposed project
is the most relevant investment to alleviate
the poverty of the intended beneficiaries.
That question is occasionally being asked
at the concept stage and brings about a
more meaningful discussion of relevance.
The design team should first identify those
policies that would help bring the intended
transformation and measure the expected
outcomes. Second, it should be explained
why a specific project would be the most
appropriate to support the key policies of
the country and how it is supposed to be
more cost-effective compared with other
possible interventions. Third, lessons from
similar operations that support the notion that
this is the most pertinent intervention for the
desired impact should be presented. Advice
and guidance should be sought from various
government ministries (including agriculture,
finance, planning or economy) regarding
whether and how IFAD should intervene to
contribute to a project, based on reliable
data and rigorous analysis that goes beyond
pleasing the government.
237. During implementation, continued relevance
is improved by regular consultations with
the beneficiaries and an ongoing policy
dialogue with the government, as well as close
monitoring with the implementing agency.
Consultations with the beneficiaries may be
done through beneficiary assessments or
empowering mechanisms that allow rural poor
people to influence the allocation of funding for
subprojects or ensure that they engage in the
evaluation of services delivered on their behalf
2019 Annual Report on Results and Impact of IFAD Operations
100
43 IFAD’s new project design process as of July 2018 foresees only one field mission, removing the second appraisal mission.
(e.g. constructions they have identified and
partially funded). In the interest of continued
relevance, the criterion would be assessed
during the concept quality discussion, the MTR
as well as at exit. The QA recommendations
do not appear to be optimally used, despite
the finding that the application of the QA
advice leads to better outcomes.
238. To further underline the importance of the
relevance debate, it should be recalled that,
unlike other IFIs (including the World Bank),
IFAD has poverty and the rural poor manifestly
in its definition of relevance. In a world that
must urgently address issues of climate
change affecting the poor, find decent jobs for
young people, and reduce increasing wealth
inequalities, organizations such as IFAD have
a major advantage, provided they continue to
push for the highest possible project relevance
as seen from the perspective of the rural poor.
Therefore, relevance needs to be revisited
throughout the life of the project in order
to support responsive and appropriate
adaptations to the design for the greatest
impact on rural poor people.
239. Lesson 2. Meaningful engagement
of beneficiaries in project design,
implementation and evaluation enhances
project relevance. The following two key
areas, when improved, would be likely to result
in higher relevance: (i) better understanding
of the needs and options of the beneficiaries,
based on intensive consultation; and
(ii) improved targeting.
240. Despite reported pressures to reduce field
time during project preparation,43 there is
no substitute for intensive dialogue. This
is required in order to acquire a profound
understanding of the issues, priorities and
expectations among the different categories
of rural poor people in the project area. That
understanding then translates into a diagnostic
and confirmation from the beneficiaries of their
commitment to action, a menu of appropriate
options that are relevant, accessible and
affordable are discussed, and priorities are
agreed and formalized in the logframe.
241. A solid mechanism to enable and empower
the rural poor is good targeting. As targeting
was the subject of the 2018 ARRI learning
theme, reference is made to that study.
In addition, this chapter recognizes three
key targeting shortcomings that may need
improvement: (i) reduce the mismatch between
the needs/capacities of the target groups and
the innovation proposed; (ii) improve follow-
through of targeting throughout the project
cycle; and (iii) ensure that all IFAD staff and
managers have a common understanding of
relevance and targeting.
242. Targeting has both contributed to relevance,
where done well, but also undermined
relevance where shortcomings were
found. The Bhutan Market Access and
Growth Intensification Project provides an
example of poor targeting. The evaluation
found that, when the project opened all
activities to all households, the subsistence
households could not fully participate due
to the beneficiary contribution requirements
(e.g. the beneficiary was expected to pay
70 per cent of the cost of the dairy cows).
This meant that the project benefited the most
“emerging commercial farming households”
that could fully benefit from the project
components. This unsatisfactory result could
have been predicted, as the focus of the
investments at design, in terms of investment
(US$10.97 million out of US$13.5 million), was
on the component targeted at better-off and
non-subsistence households.
243. Thus, highly relevant projects have good
targeting strategies and engage beneficiaries
in responding to these four simple questions:
(i) who are the poor; (ii) why are they poor;
(iii) what is the project going to do; and (iv) how
will it do it?
244. Lesson 3. The role of the government is
critical for relevance – in adopting pro‑poor
5 Learning theme on relevance of IFAD project interventions
101
policies, by insisting on pro‑poor design,
in providing adequate implementation
capacity, and by ensuring continued
relevance during and after the project’s
lifespan. Five areas would, when done
well, lead to improved relevance: (i) IFAD’s
role in policy advice and conflict resolution;
(ii) government ownership and simple designs;
(iii) implementation capacity commensurate
to beneficiary needs and project design;
(iv) governments managing risk; and (v) longer-
term engagement.
245. A government committed to borrowing for
the poor, maintaining pro-poor policies, and
designing pro-poor projects leads to more
relevant projects. This entails the government
having the willingness, resolve and capacity
to create and maintain a pro-poor policy
environment. The notion of country and
government are not the same, particularly in
project design. The country context includes
the views of different beneficiary groups,
government at the local and national levels,
the relevant private sector, and the community
organizations concerned. IFAD has developed
the tools and expertise to play its role as an
honest broker between these stakeholders
effectively. Country ownership must go
beyond the idea that “this is what government
wants”. This requires a needs assessment
that builds from the COSOP and rural sector
performance assessment of the Performance-
Based Allocation System.
246. Policy advice and conflict resolution for
relevance. In some countries, IFAD finds
like-minded governments, and IFAD’s focus
is on maintaining good relations, information
exchange, and fostering partnerships, as in
the Viet Nam case study. In other countries,
government priorities do not include the
rural poor, and IFAD’s focus is usually on
advocacy, partnerships of the willing, and
fostering champions. In other countries, there
may be actual discrimination against IFAD’s
specific subgroups (e.g. pastoralists, women,
youth and indigenous peoples). Advocacy
may require improving countries’ regulatory
frameworks to allow the poorest people
(including particularly vulnerable groups of
women, youth, pastoralists and indigenous
peoples) to compete on a level playing field.
247. An example where government policies
and practices diverge from IFAD’s
mandate centres around pastoralists,
who IFAD manifestly targets. As found in
the targeting learning theme, the issue of
mobility is complex and controversial, both
internationally as well as within particular
countries. Yet, in line with IFAD’s mandate,
there is an urgent need to cater to the needs –
in terms of health, education and livelihoods –
of pastoralists who want to continue leading a
mobile way of life. The two main reasons are
that: (i) pastoralism is an effective and efficient
way of using and managing natural resources
in the drylands; and (ii) areas with access to
water for settlement in these semi-arid and
arid regions cannot cater to the entire pastoral
population. However, the Ethiopia Second
Pastoral Community Development Project
interventions catered more to the needs of
pastoralists having to and wanting to settle,
but did not take sufficiently into account the
needs of the mobile population.
248. While most policy dialogue takes place in the
context of COSOPs, rather than projects, two
issues are important for project discussions
as well. The first issue is the variation over
time in some countries’ commitment to
the poor, or in their perception of IFAD’s
comparative advantages. For example, the
focus of the Dominican Republic’s Ministry of
Agriculture shifted during the implementation
of the Rural Poor Economic Organizations
of the Border Region project away from the
rural poor. Although the CPM managed to
find a better project champion in the Ministry
of Economics, the remedial action taken
did not occur in time to improve the overall
project achievement, which was evaluated
as moderately unsatisfactory. In Albania,
IFAD was the only IFI operating in the poor
2019 Annual Report on Results and Impact of IFAD Operations
102
mountainous areas, with limited support from
the national government. The government
had dropped two other projects prior to the
Mountains to Markets Project, and declined to
borrow anymore from IFAD upon its closure,
focusing on EU support for its eventual
membership. In both examples, IFAD needed
to detect earlier the shift in government focus
in order to allow for timely dialogue on how
IFAD could remain engaged and relevant.
249. Second, the notion of alignment to
government policy does not accurately
reflect or capture the reality of different
and sometimes conflicting views among
government units. Some CPMs are struggling
to balance conflicting pressures, and it is not
exceptional that a CPM is caught on the horns
of a dilemma, having to satisfy conflicting
demands of IFAD management and the
government, both of which may be politically
motivated. The compromises found do not
always improve the project’s relevance.
250. A lack of implementation readiness is often
related to limited ownership, which is a
key risk to project relevance. Ownership
does not have a widely shared or accepted
definition, but it is generally understood to
be a measure of government commitment –
first, to a participatory process of design
that responds to the key priorities of the
rural poor, and aligns with the government
policies, and second, to effective and
efficient implementation with assurances of
sustainability of the project’s results. This
government commitment may manifest itself
at widely differing levels, from ensuring timely
payment of counterpart funds, via maintaining
a pro-poor policy environment, to ensuring
that procurement follows the agreed rules
without government interference, and the
timely hiring of capable and motivated staff for
the PMU. A robust institutional assessment
may provide an early warning and a basis for
remedial action where ownership is not at the
level it is needed.
251. As to government’s risk management,
there is some concern, expressed by a
number of IFAD staff, about balancing risks
and concessional lending as well as about
the risk of moving into emergency relief rather
than development lending. IFAD’s mandate to
work with the rural poor means that its work
often includes a higher level of risk than for
IFIs working on the most promising economic
opportunities. Most countries accept the
higher risk, in return for projects that are
relevant for the most vulnerable parts of the
rural population, under highly concessional
terms. However, there is a concern that
with an increasing number of countries
transitioning to less concessional lending
terms, their risk tolerance might dwindle, as
the terms for graduating countries are less
concessional. At the same time, there are
still important pockets of rural poor people in
those countries.
252. As to the quality of mitigation, evaluations
indicate that the main risks are identified
during project design. However, the mitigation
of project risks was also an objective of IFAD’s
ex ante QA review. The QA recommendations
have been valuable, and the case studies
demonstrated that, when applied, the design
was likely to be improved. However, some
teams ignore the recommendations, which
may affect the achievement of the DO. Better
results may be achieved and risks may be
mitigated if: (i) the ex ante quality design
review assessed and rated relevance in terms
of the appropriateness of the project design to
the country context; and (ii) quality assurance
recommendations were included in the
terms of reference of all MTRs, which would
show how the recommendations had been
addressed during implementation.
253. Lesson 4. A lack of understanding of
institutional arrangements together with
the lack of implementation capacity ranks
as a main threat to improved relevance.
Weak implementation can cripple the
relevance of even the best designs. The
5 Learning theme on relevance of IFAD project interventions
103
average government performance rating in
the IOE evaluations is a modest 3.9, close to
the divide between (moderately) satisfactory
and unsatisfactory. IOE evaluations and QA
review comments, as well as the case studies,
indicate that three factors are particularly
helpful in successful implementation. These
are: (i) continued and sometimes decentralized
government ownership during implementation;
(ii) timely support from IFAD staff and technical
advisors and in particular support from IFAD
Country Offices; and (iii) the adaptation of the
project where and when necessary, while
maintaining the project’s focus on the rural
poor. It may thus seem somewhat surprising
that, given the positive impact of direct IFAD
support, the annual allocation for supervision
and implementation decreased after 2008
from US$50,000 per project to US$30,000,
prior to the accelerated decentralization. Given
IOE’s focus on continued relevance, and
the interesting example of the AfDB putting
a premium on efforts to ensure ongoing
relevance, it may be worth revisiting these
allocations. Even where preparation periods
are likely to be shorter, and designs left
somewhat incomplete, the previous allocation
for design (US$250,000), which is significantly
lower than other IFIs, should not be reduced,
at the risk of less relevant operations or
poorer quality. In addition, the budget for
implementation support appears inadequate
to fill in the gaps of a speeded-up preparation
process and to maintain quality and relevance
under changing circumstances.
254. Three ways to build and maintain local
capacity are: (i) contracting selected services
in from local institutions; (ii) working towards
longer-term engagements, including improved
KM; and (iii) optimizing IFAD’s decentralization.
Over time, many countries have built capacity
to undertake selected preparatory tasks in
the design of projects, such as social and
environmental research or technical training
on agricultural, hydrological or engineering
designs. Taken together, some of these
country systems are likely to meet IFAD
standards for contracting in their services,
thus improving relevance while building
capacity.
255. Longer-term engagement with selected
borrowers could break the persistence of
implementation and institutional issues. A
longer-term engagement, led by COSOPs and
informed by a solid portfolio review, would
help overcome the limits of project durations
of 5-6 years, which make solutions elusive
and not resolvable in the timespan of a typical
project. Setting longer-term policy and realistic
implementation goals would focus on “how
to” mechanisms to improve implementation
capacity and inform any new project with a
solid understanding of poverty and targeting.
Over time, and depending on the country, the
collaboration and mutual learning could be
built up, with greater dependence on selected
country systems, as suggested above and
in the 2017 ARRI learning theme on financial
management.
256. There also is an argument for continued
relevance, which is the direction the
discussion of the OECD-DAC is taking as well.
Continued relevance means monitoring during
implementation, ensuring that the intervention
is still appropriate to the government, the
context and the beneficiaries – making
adjustments throughout the life of the
project, but also throughout the life of
several projects. In fact, the trend towards
longer-term engagements may have actually
started at IFAD. As a response to reduced
design resources, there has been a rise in
the design of multiple phases of a project
through a number of additional financing and
second-phase approvals. A different example
of building longer-term relations is IFAD’s
decentralization. In 2018, IFAD accelerated its
decentralization process to regional hubs in
order to increase its relevance by being closer
to the countries and demonstrate a longer-
term commitment. Theoretically, this should
also allow greater involvement of government
in project design. IFAD’s newly introduced
2019 Annual Report on Results and Impact of IFAD Operations
104
transition framework foresees graduating
countries from highly subsidized loans to
other products.
257. The question is justified if this graduation
process may lead to governments designing
their own projects. Many governments
could design quality projects. However,
they may have difficulty designing projects
according to the specific requirements of a
wide range of donors. With every additional
requirement in the design of IFAD-funded
projects (climate change, youth and nutrition,
to name some recent ones), the design
capacities of many governments will be
stretched further. This increases the risk of
government officials distancing themselves
from the design process, an issue that is
being addressed under the new guidelines for
project preparation.
258. Lesson 5. Well‑functioning institutions
are a key determinant of higher relevance.
“Institutional arrangements” is a prominent
persistent issue raised by the QAG and IOE. A
lack of understanding of institutions leads to
the problems most often highlighted in both
the QAG comments and IOE evaluations:
slow implementation, overly ambitious and
complex projects that are poorly matched
to the limitations of existing capacity,
underperforming PMUs, ineffective and
inefficient training, missing important risks,
failure to address political economy issues or
use citizen accountability mechanisms, a lack
of ownership or commitment, and ambiguous
roles and responsibilities among the key
stakeholders.
259. As to the insufficient understanding of the
institutional arrangements, two elements
warrant attention: (i) a comprehensive
institutional assessment; and (ii) a depository
of institutional knowledge and experience.
While a solid institutional assessment should
be a prerequisite for any project design, it
need not be exhaustive. However, current
practice errs to the other extreme, with
projects routinely listing the number of
agents from Ministry of Agriculture records,
but without having done a training needs
assessment or incentives analysis. The point is
for the country team to be optimally informed
to design and implement the project, keeping
in mind the context in which the project will
operate, the stakeholders in the project,
and the mechanisms to make the project
actually work.
260. As to the context, there is a need for a
good understanding of the overall reform
challenges, possibly with an assessment
of the willingness to change among the key
stakeholders. Prior to approval, the following
areas of direct relevance to the project need
to be addressed: the key political economy
aspects; the availability and use of citizen
accountability mechanisms; the effectiveness
of public awareness communications,
opportunities and challenges; and the
incorporation of relevant results from the
mandatory social assessment in the design
and budget.
261. New institutional analysis is not required
for all projects, and some projects may utilize
the results of earlier analyses. This would
be facilitated by the creation of a depository
of past analyses, which may be developed
and housed online by an interested ministry,
national library or the IFAD website. The
depository would store institutional analyses
of previous projects, including those done
on behalf of partner organizations. It would
be particularly helpful to make use of that
knowledge and experience in managing
project risk, and to formulate specific
institutional indicators for logframes. In
countries with a long-standing collaboration
with IFAD, such as Burkina Faso as compared
to Eritrea, lessons from earlier implementation
experience should also provide some pointers
as to which aspects of an institutional
assessment would merit particular attention.
5 Learning theme on relevance of IFAD project interventions
105
44 Ranging from US$120,000 to US$400,000.
Way forward
262. Relevance will remain a key criterion in
IFAD-funded projects, as it confirms and
guides IFAD’s unique poverty orientation and
commitment to the rural poor. Relevance,
taken as a continuum, provides a linking
mechanism between project quality and
country context and allows for incremental
improvements, ensuring value for money for
the beneficiaries and the client.
263. All efforts to improve performance in
relevance will happen against a backdrop
of change at IFAD. There have been
profound staffing changes that continue
to pose a challenge to maintaining tacit
knowledge, as well as skills and attitudes
conducive to improved relevance. Should
budgets for consultants be reduced, this
would have a major impact on the ability of
CPMs to deliver. Currently, Management
is concerned that IFAD’s approval process
is: (i) too long and too costly;44 (ii) limiting
country ownership; (iii) lacking in detail
on components; and (iv) skewed towards
internal compliance. Management is currently
implementing a plan to reduce the design
process to about 12 months, while ensuring
stronger country ownership. There is a new
format for the design report that will “do away
with excessive background information.”
264. This pressure to prepare projects in a shorter
time frame may result in reduced opportunities
for dialogue with the beneficiaries, the
borrower, and among IFAD staff. This may
have negative effects on key elements of
relevance, including consultation, targeting,
and a solid institutional understanding. At the
same time, IFAD management is introducing
a new restructuring policy, which is intended
to make the restructuring of projects easier,
faster and cheaper. The two measures
combined (faster preparation and easier
restructuring) will make for a nimbler process
of designing new projects. While it is still too
early to judge, nonetheless, some risks to
relevance may be considered at this stage:
(i) “doing away with excessive background”
may undermine the knowledge base for many
projects; and (ii) the recent restructuring
of PMD – which affected the number and
quality of rural institutions and organizations
specialists, and entailed the downgrading of
P5-level CPM positions to P4 and filling them
with P3-level Programme Officers – may carry
the risk of less-experienced staff focusing on
processes, rather than engaging substantively
with governments.
265. As the analysis shows, achieving “optimal”
relevance depends on a range of factors.
Arguably, addressing two recurrent issues
would have a significant impact on project
relevance. They are: the weak understanding
of the institutional arrangements underlying
a project; and the ongoing issue of limited
implementation capacity in many countries.
These persistent issues indicate the need for
IFAD to adopt a continued relevance approach
that entails adaptive design in recognition
that relevance needs to be dynamic and
project interventions need to adapt in order to
remain relevant for the duration of the project.
Long-term engagement will also allow IFAD
to build a robust institutional knowledge base
of government institutions, implementation
capacities and context that may be used to
design projects in less time. Nonetheless,
as even the best project design may fail due
to changed socio-economic, political and
environmental contexts, the design must be
continually adapted through well-resourced
implementation support and earlier MTRs.
Thus, for continued relevance, a project
requires good analysis as part of the pre-
assessment, good capacities (government
and IFAD) to implement the design, and the
resources to adapt the design quickly or in a
responsive manner.
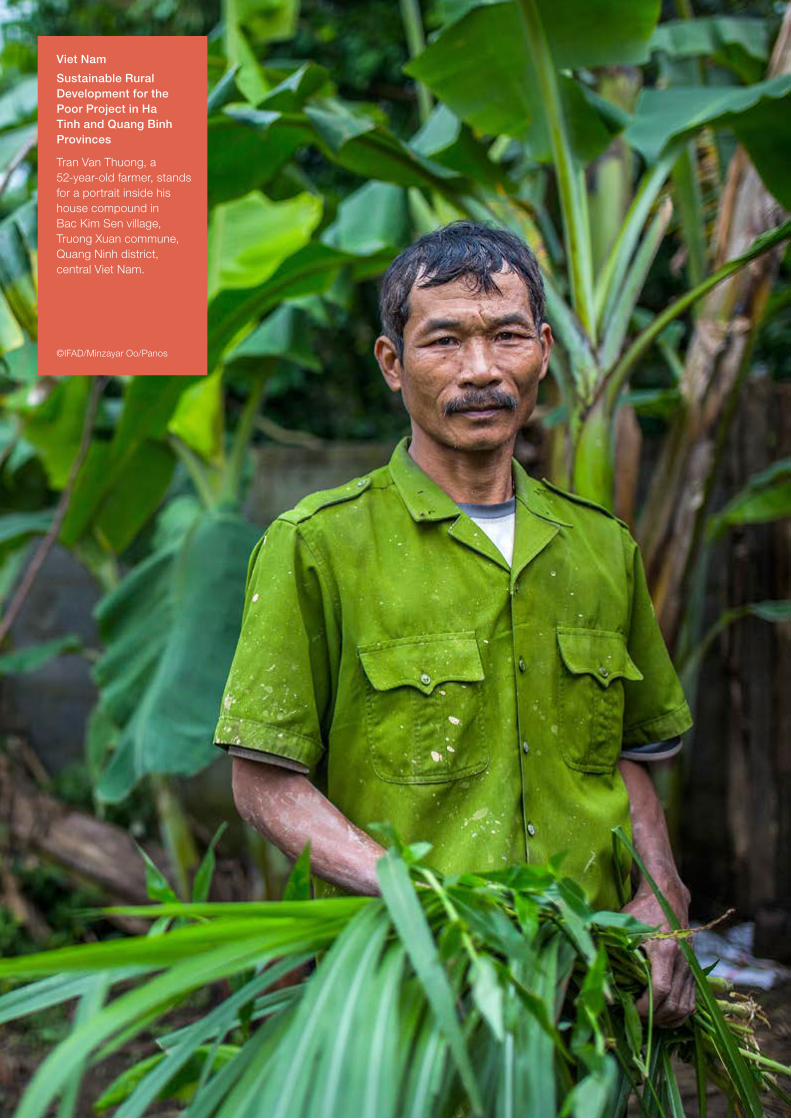
Viet Nam
Sustainable Rural Development for the Poor Project in Ha Tinh and Quang Binh Provinces
Tran Van Thuong, a 52-year-old farmer, stands for a portrait inside his house compound in Bac Kim Sen village, Truong Xuan commune, Quang Ninh district, central Viet Nam.
©IFAD/Minzayar Oo/Panos
107
Conclusions and recommendations
6
Conclusions
266. While most IOE ratings are positive, recent
trends in performance of IFAD‑funded
projects are flat or slightly declining.
This is punctuated by downward trends
in criteria such as IFAD’s performance as
a partner, relevance, rural poverty impact
and GEWE. Little progress has been made
in areas such as efficiency, sustainability
of benefits, and government performance.
These flat and declining trends are also
reflected in Management’s PCR ratings for all
criteria except GEWE. This – along with the
inclusion of sustainability of benefits in IFAD’s
composite project performance criterion
from 2016 – has contributed to lowering
IFAD project performance ratings compared
to the World Bank’s agricultural portfolio.
However, IFAD project performance is higher
than that of AsDB and AfDB, which share the
Fund’s definition.
267. Improving the quality of a “bigger” ongoing
PoW with fewer resources appears
challenging. IFAD’s Strategic Framework set
out to make IFAD “bigger, better and smarter”.
However, based on IFAD10 performance,
this vision appears ambitious with trade-offs.
While IFAD10 project investments remained
big and were smarter in terms of reducing
costs, they are yet to prove themselves
better in quality – except in ENRM. While new
investments increased, the actual number
of approved projects decreased, indicating
that country programme managers were
designing and supervising fewer but “bigger”
projects. IFAD also managed to improve its
average effectiveness lag and reduced the
number of extensions in IFAD10. However, the
lower direct administrative budget allocated
for country programme management,
design and SIS may have contributed to the
decline in project quality between IFAD9 and
IFAD10, particularly in relevance and IFAD’s
performance as a partner.
268. A shift in the nature of IFAD‑funded
projects from reaching high numbers of
beneficiaries to increasing investments
per beneficiary is possibly indicating
more value‑adding activities. Most projects
included in the 2019 sample take value chain
or market approaches involving the private
sector. This indicates the need for technical
expertise to design and support a larger
portfolio in market-oriented and private-sector-
driven projects, which were new to IFAD in
2008-2010 when many of these projects were
approved. In addition to managing a doubled
programme of work from IFAD8, IFAD was
also designing projects in new areas in which
it had limited expertise. Therefore, there is a
need for continued efforts to raise the overall
quality of IFAD’s performance with greater
technical expertise.
2019 Annual Report on Results and Impact of IFAD Operations
108
269. The importance of resources and
technical expertise is reiterated in the
positive trend in performance in the
ENRM criterion. Performance in ENRM
has improved steadily, from a low in 2010-
2012 to ranking third in best performance in
2015-2017. It is the only criterion that shows
a positive trend between IFAD9 and IFAD10.
This improvement in ENRM, as well as
adaptation to climate change until 2014-2016,
was supported by the creation of a unique
division on the environment and climate
change (now also including gender, youth
and nutrition) as well as the supplementary
funds for ASAP. During IFAD10, the Fund
entered into a decisive transition towards full
climate change mainstreaming in its country
strategies and project portfolios. However, the
positive trend did not continue in 2015-2017
for adaptation to climate change. This was
due in part to the lack of specific strategies on
climate at design and during implementation,
and weak national policies adopted by local
governments.
270. Although still the top‑ranking criterion, the
trend in IFAD performance as a partner
shifted in 2015‑2017, showing a decline
for the first time since 2008. Recurring
constraints include high staff turnover, weak
M&E, inaccurate funding at the design stage,
and a lack of specialists on supervision
missions. Nonetheless, IFAD remains a
valued and trusted partner – able to adjust
to varying circumstances and show flexibility
and willingness to find alternative solutions in
changing contexts. Consultations based at
IFAD Country Offices were deemed effective
and efficient for problem-solving, providing
timely support. However, additional measures
are still needed in order to learn from past
experience for scaled-up results. Capacity
within IFAD Country Offices was not always
sufficient to aggregate and share evidence
across the portfolio. With limited resources,
complex projects, wide geographical
distribution of activities and little time to
engage in non‑lending activities, IFAD
Country Offices are often under pressure
in supporting IFAD’s project portfolio.
271. For non‑lending activities, the absence
of engagement by actors to go beyond
the project’s life and the lack of material
and human resources and clarity of
respective roles remain obstacles
to productive partnership‑building.
IFAD’s need to catalyse new investments
and financial resources will require better
partnerships between sovereign governments,
civil society and the private sector. To date,
the Fund’s enhanced country presence has
facilitated knowledge-sharing among its
range of partners and across countries and
regions. However, this year, the previously
positive trend in KM has inverted, showing
a decline. Without adequate resources and
a clear definition of responsibilities, KM has
been weak at the national level and still far
from the ambitious interventions mentioned
in the COSOPs. In addition, country‑level
policy engagement continues to exhibit
a slow decline in performance. IFAD
faces some ongoing challenges linked to
political instability, a lack of legal frameworks
and resources, and an inadequate level of
representation of stakeholders.
272. Government performance as a partner
is a key criterion that accounts for the
overall performance of IFAD‑funded
projects. The principal component analysis
conducted this year indicated that positive
ratings in overall project achievement
6 Conclusions and recommendations
109
are correlated to good performance in
government as a partner, effectiveness and
rural poverty impact. However, government
performance still shows shortcomings
related to staffing issues, delays in financial
execution and implementation, and insufficient
procedures. As indicated in past ARRIs and
this year’s learning theme, building institutional
capacity at the national level is especially
important for good project design and
improved project relevance.
273. The analysis on the relevance of IFAD
project interventions highlights some
important lessons that need to be
considered in view of IFAD11. First,
relevance is not a fixed assessment at design,
and project interventions may need to adapt
to ensure their continued relevance. Second,
meaningful engagement of beneficiaries in
the design, implementation and evaluation
of projects enhances project relevance by
better understanding their needs. Third,
government commitment is critical to adopting
pro-poor policies and designs, in providing
adequate implementation capacity, and in
ensuring continued relevance during and
after the project’s lifespan. This entails the
government having the willingness and
capacity to create and maintain a pro-poor
policy environment. Fourth, the lack of
understanding of institutional arrangements
together with the absence of implementation
capacity ranks as a main threat to improved
relevance. Fifth, well-functioning institutions
are a key determinant of higher relevance.
Slow implementation, overly ambitious and
complex projects, underperforming PMUs
and a failure to address political economy
matters are some of the key prominent
issues leading to weak project performance.
A comprehensive institutional assessment,
a good understanding of the political and
economic context, and an identification of all
key stakeholders’ roles, accountabilities and
responsibilities should be prerequisites for any
project design.
Recommendations
274. The 2030 Agenda has set very ambitious
targets for governments to achieve with
IFAD’s support. Reaching these goals requires
commensurate resources and capacities
within IFAD and its partner countries. The
Executive Board is invited to adopt the
recommendations below, which seek to
address constraints in capacity and related
issues raised in the 2019 ARRI.
Recommendation 1
275. Dedicate more resources to country
programme delivery – specifically project
design, supervision and implementation –
to achieve the improved quality needed
for a “better” IFAD. IFAD’s aim to become
“bigger, better and smarter” appears
ambitious based on IFAD10 results. While
IFAD has managed to maintain a significantly
higher ongoing PoW since IFAD8, the
decline in budgetary resources dedicated
specifically to design, supervision and
implementation may have affected its quality,
with lower ratings across criteria in IFAD10.
“Better” results also require high-quality
technical expertise to support IFAD country
programmes and projects. To improve quality
standards, IFAD needs to plan and provide
the commensurate resources for country
programme management, design and
implementation.
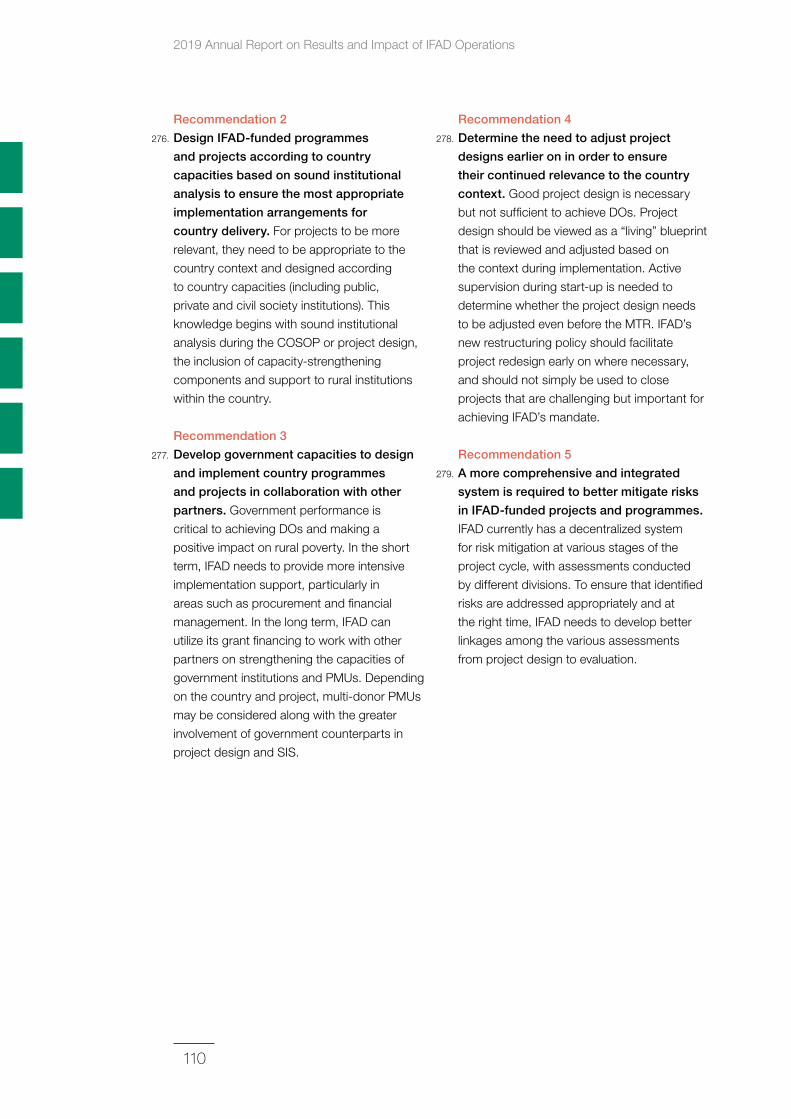
2019 Annual Report on Results and Impact of IFAD Operations
110
Recommendation 2
276. Design IFAD‑funded programmes
and projects according to country
capacities based on sound institutional
analysis to ensure the most appropriate
implementation arrangements for
country delivery. For projects to be more
relevant, they need to be appropriate to the
country context and designed according
to country capacities (including public,
private and civil society institutions). This
knowledge begins with sound institutional
analysis during the COSOP or project design,
the inclusion of capacity-strengthening
components and support to rural institutions
within the country.
Recommendation 3
277. Develop government capacities to design
and implement country programmes
and projects in collaboration with other
partners. Government performance is
critical to achieving DOs and making a
positive impact on rural poverty. In the short
term, IFAD needs to provide more intensive
implementation support, particularly in
areas such as procurement and financial
management. In the long term, IFAD can
utilize its grant financing to work with other
partners on strengthening the capacities of
government institutions and PMUs. Depending
on the country and project, multi-donor PMUs
may be considered along with the greater
involvement of government counterparts in
project design and SIS.
Recommendation 4
278. Determine the need to adjust project
designs earlier on in order to ensure
their continued relevance to the country
context. Good project design is necessary
but not sufficient to achieve DOs. Project
design should be viewed as a “living” blueprint
that is reviewed and adjusted based on
the context during implementation. Active
supervision during start-up is needed to
determine whether the project design needs
to be adjusted even before the MTR. IFAD’s
new restructuring policy should facilitate
project redesign early on where necessary,
and should not simply be used to close
projects that are challenging but important for
achieving IFAD’s mandate.
Recommendation 5
279. A more comprehensive and integrated
system is required to better mitigate risks
in IFAD‑funded projects and programmes.
IFAD currently has a decentralized system
for risk mitigation at various stages of the
project cycle, with assessments conducted
by different divisions. To ensure that identified
risks are addressed appropriately and at
the right time, IFAD needs to develop better
linkages among the various assessments
from project design to evaluation.
6 Conclusions and recommendations
111
280. 2020 ARRI learning theme. Pending the
decision on whether to retain learning themes
in the ARRI based on recommendations of
the External Peer Review of IFAD’s Evaluation
Function, the Evaluation Committee is invited
to choose one of the two proposed topics:
(i) Quality of IFAD’s supervision and
implementation support: Given the
observed decline in annual SIS missions
per project, this learning theme would
examine the quality of recent SIS missions
in terms of technical composition, expertise
and advice.
(ii) Efficiency: The efficiency criterion
measures how economically resources
and inputs (funds, expertise and time) are
converted into results. Greater emphasis is
now being placed on “value for resources”
and IFAD’s value for money proposition.
In this context, the learning theme would
explore the quality of results per dollar
invested in IFAD-funded projects.
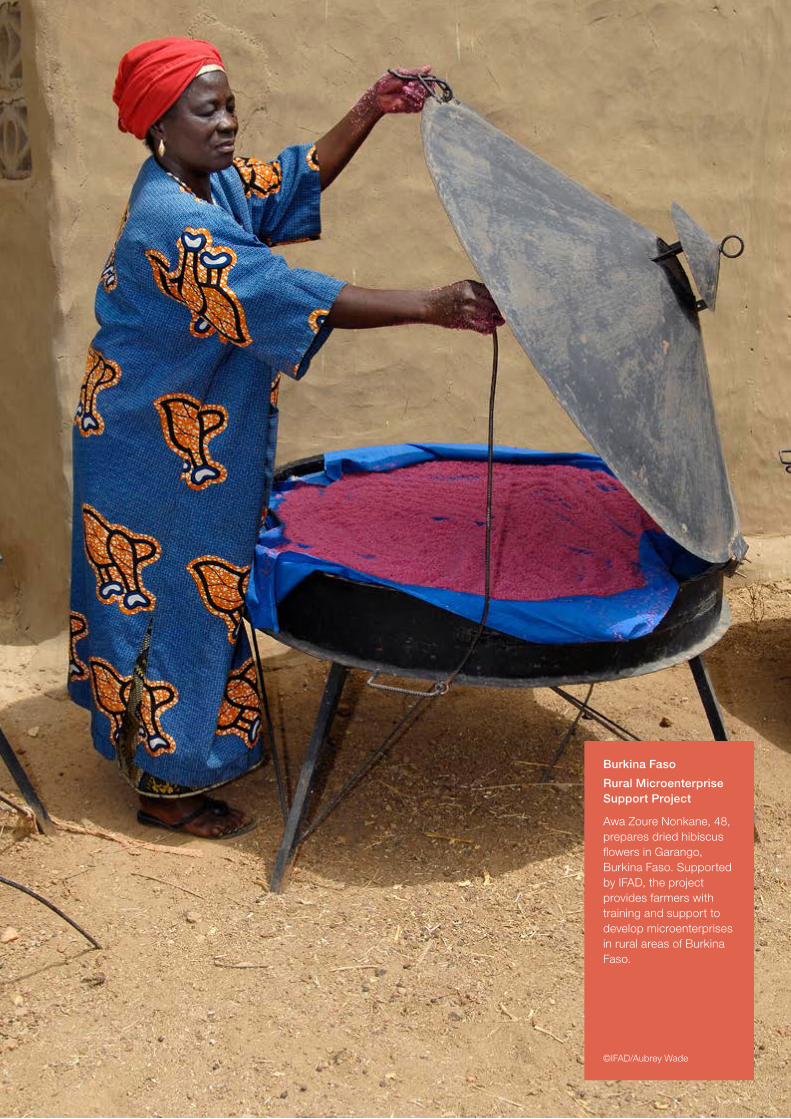
Burkina Faso
Rural Microenterprise Support Project
Awa Zoure Nonkane, 48, prepares dried hibiscus flowers in Garango, Burkina Faso. Supported by IFAD, the project provides farmers with training and support to develop microenterprises in rural areas of Burkina Faso.
©IFAD/Aubrey Wade
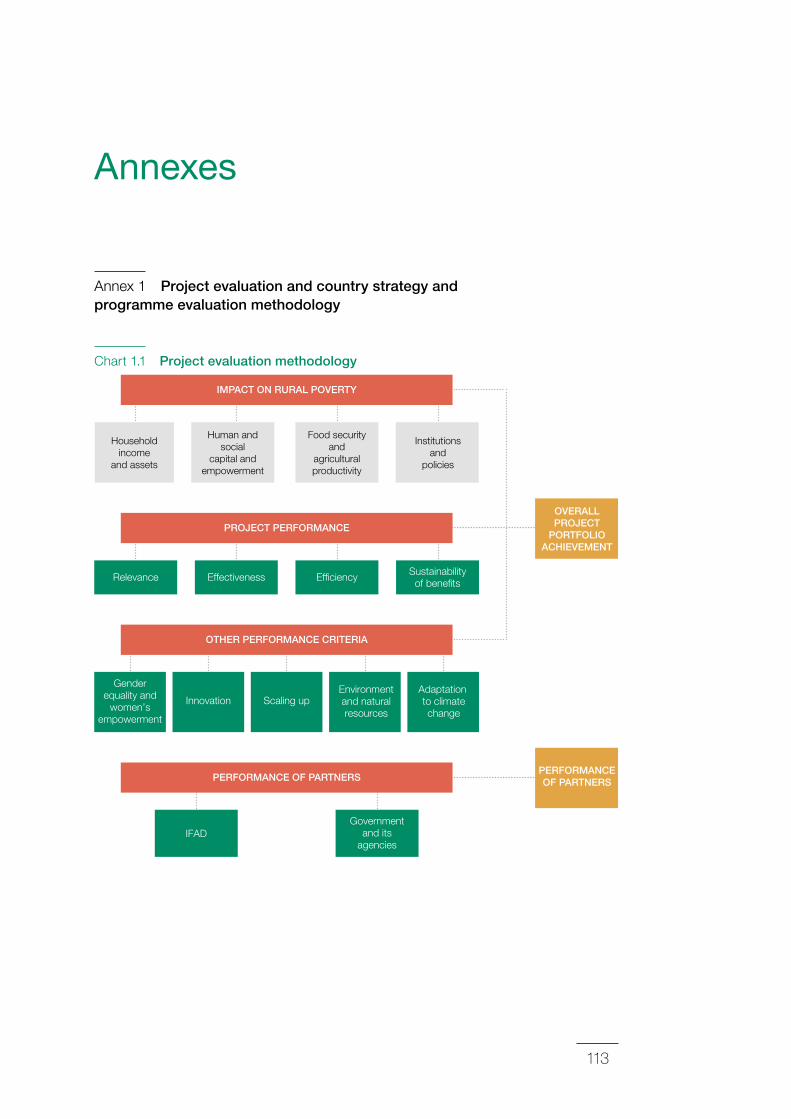
113
Annexes
Annex 1 Project evaluation and country strategy and programme evaluation methodology
Chart 1.1 Project evaluation methodology
Adaptation to climatechange
Scaling upInnovation
Genderequality and
women’sempowerment
Environmentand naturalresources
Governmentand its
agenciesIFAD
OVERALLPROJECT
PORTFOLIOACHIEVEMENT
PERFORMANCEOF PARTNERSPERFORMANCE OF PARTNERS
PROJECT PERFORMANCE
Effectiveness Ef�ciencyRelevance Sustainabilityof bene�ts
OTHER PERFORMANCE CRITERIA
IMPACT ON RURAL POVERTY
Householdincome
and assets
Institutionsand
policies
Food securityand
agriculturalproductivity
Human andsocial
capital andempowerment
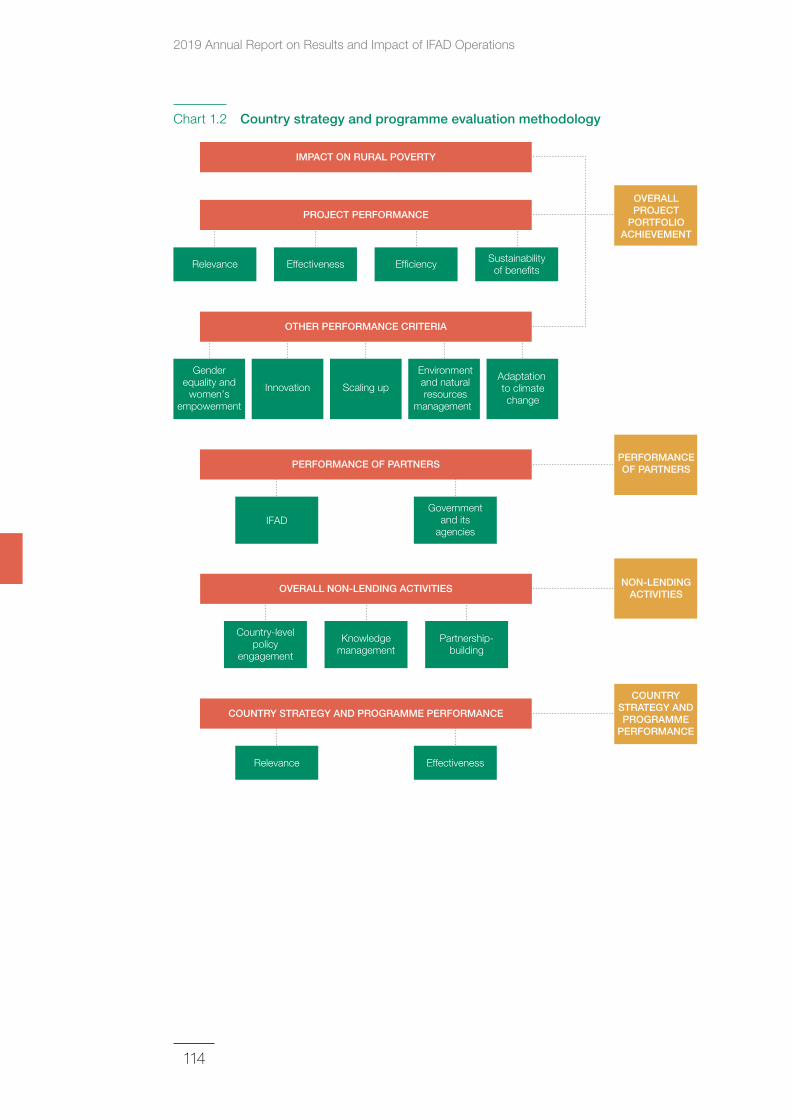
2019 Annual Report on Results and Impact of IFAD Operations
114
Chart 1.2 Country strategy and programme evaluation methodology
Adaptation to climatechange
Scaling upInnovation
Genderequality and
women’sempowerment
Environmentand naturalresources
management
IMPACT ON RURAL POVERTY
Governmentand its
agenciesIFAD
OVERALLPROJECT
PORTFOLIOACHIEVEMENT
PERFORMANCEOF PARTNERS
NON-LENDINGACTIVITIES
PERFORMANCE OF PARTNERS
EffectivenessRelevance
COUNTRY STRATEGY AND PROGRAMME
PERFORMANCE
COUNTRY STRATEGY AND PROGRAMME PERFORMANCE
Partnership-building
Knowledgemanagement
Country-levelpolicy
engagement
OVERALL NON-LENDING ACTIVITIES
PROJECT PERFORMANCE
Effectiveness Ef�ciencyRelevance Sustainabilityof bene�ts
OTHER PERFORMANCE CRITERIA
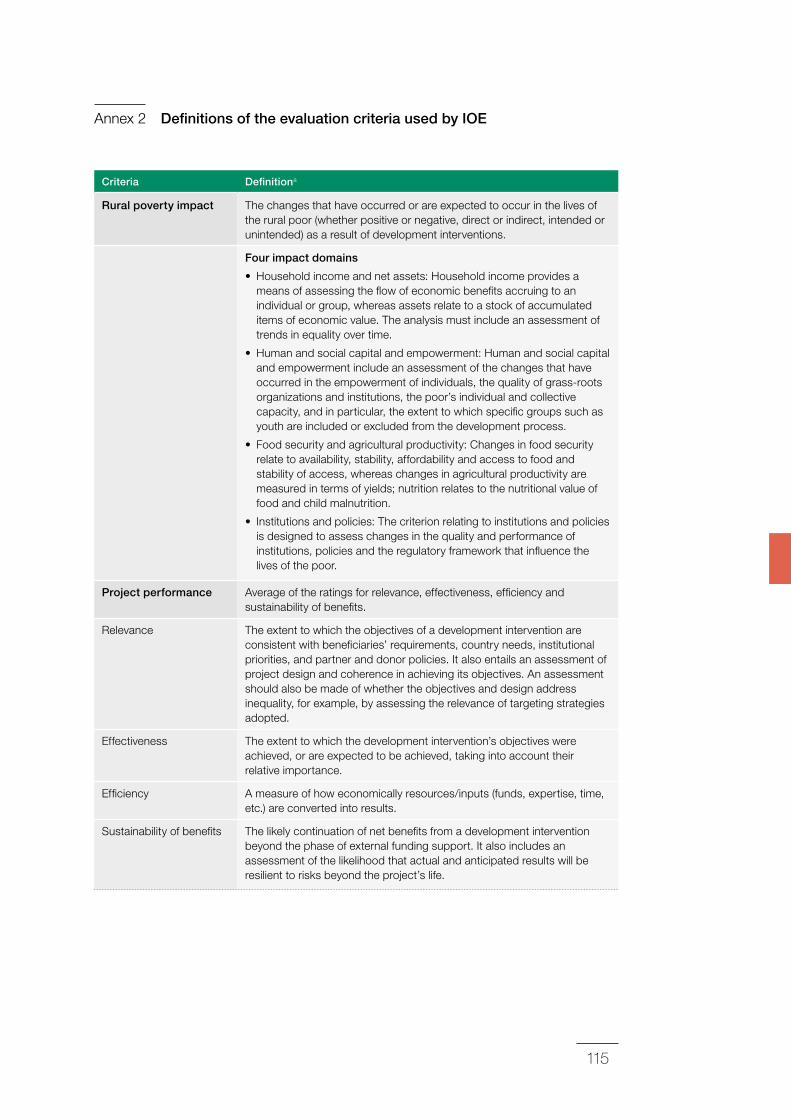
115
Annex 2 Definitions of the evaluation criteria used by IOE
Criteria Definitiona
Rural poverty impact The changes that have occurred or are expected to occur in the lives of the rural poor (whether positive or negative, direct or indirect, intended or unintended) as a result of development interventions.
Four impact domains
• Household income and net assets: Household income provides a means of assessing the flow of economic benefits accruing to an individual or group, whereas assets relate to a stock of accumulated items of economic value. The analysis must include an assessment of trends in equality over time.
• Human and social capital and empowerment: Human and social capital and empowerment include an assessment of the changes that have occurred in the empowerment of individuals, the quality of grass-roots organizations and institutions, the poor’s individual and collective capacity, and in particular, the extent to which specific groups such as youth are included or excluded from the development process.
• Food security and agricultural productivity: Changes in food security relate to availability, stability, affordability and access to food and stability of access, whereas changes in agricultural productivity are measured in terms of yields; nutrition relates to the nutritional value of food and child malnutrition.
• Institutions and policies: The criterion relating to institutions and policies is designed to assess changes in the quality and performance of institutions, policies and the regulatory framework that influence the lives of the poor.
Project performance Average of the ratings for relevance, effectiveness, efficiency and sustainability of benefits.
Relevance The extent to which the objectives of a development intervention are consistent with beneficiaries’ requirements, country needs, institutional priorities, and partner and donor policies. It also entails an assessment of project design and coherence in achieving its objectives. An assessment should also be made of whether the objectives and design address inequality, for example, by assessing the relevance of targeting strategies adopted.
Effectiveness The extent to which the development intervention’s objectives were achieved, or are expected to be achieved, taking into account their relative importance.
Efficiency A measure of how economically resources/inputs (funds, expertise, time, etc.) are converted into results.
Sustainability of benefits The likely continuation of net benefits from a development intervention beyond the phase of external funding support. It also includes an assessment of the likelihood that actual and anticipated results will be resilient to risks beyond the project’s life.
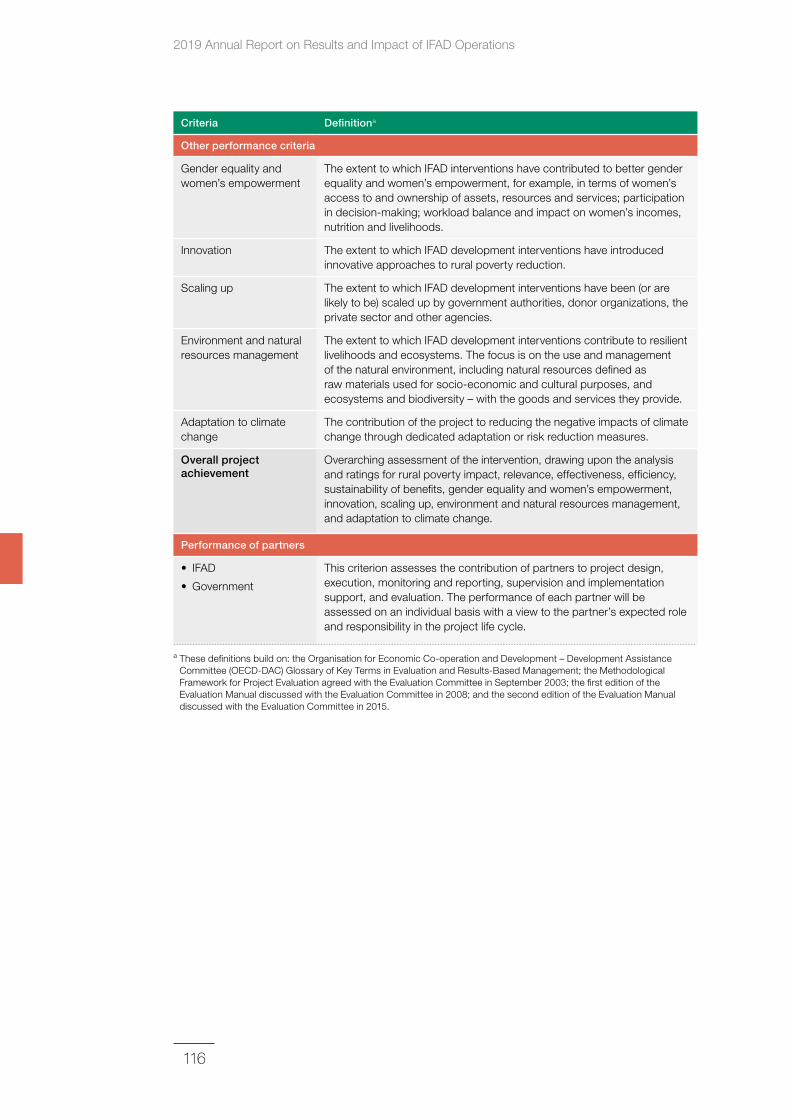
2019 Annual Report on Results and Impact of IFAD Operations
116
Criteria Definitiona
Other performance criteria
Gender equality and women’s empowerment
The extent to which IFAD interventions have contributed to better gender equality and women’s empowerment, for example, in terms of women’s access to and ownership of assets, resources and services; participation in decision-making; workload balance and impact on women’s incomes, nutrition and livelihoods.
Innovation The extent to which IFAD development interventions have introduced innovative approaches to rural poverty reduction.
Scaling up The extent to which IFAD development interventions have been (or are likely to be) scaled up by government authorities, donor organizations, the private sector and other agencies.
Environment and natural resources management
The extent to which IFAD development interventions contribute to resilient livelihoods and ecosystems. The focus is on the use and management of the natural environment, including natural resources defined as raw materials used for socio-economic and cultural purposes, and ecosystems and biodiversity – with the goods and services they provide.
Adaptation to climate change
The contribution of the project to reducing the negative impacts of climate change through dedicated adaptation or risk reduction measures.
Overall project achievement
Overarching assessment of the intervention, drawing upon the analysis and ratings for rural poverty impact, relevance, effectiveness, efficiency, sustainability of benefits, gender equality and women’s empowerment, innovation, scaling up, environment and natural resources management, and adaptation to climate change.
Performance of partners
• IFAD
• Government
This criterion assesses the contribution of partners to project design, execution, monitoring and reporting, supervision and implementation support, and evaluation. The performance of each partner will be assessed on an individual basis with a view to the partner’s expected role and responsibility in the project life cycle.
a These definitions build on: the Organisation for Economic Co-operation and Development – Development Assistance Committee (OECD-DAC) Glossary of Key Terms in Evaluation and Results-Based Management; the Methodological Framework for Project Evaluation agreed with the Evaluation Committee in September 2003; the first edition of the Evaluation Manual discussed with the Evaluation Committee in 2008; and the second edition of the Evaluation Manual discussed with the Evaluation Committee in 2015.
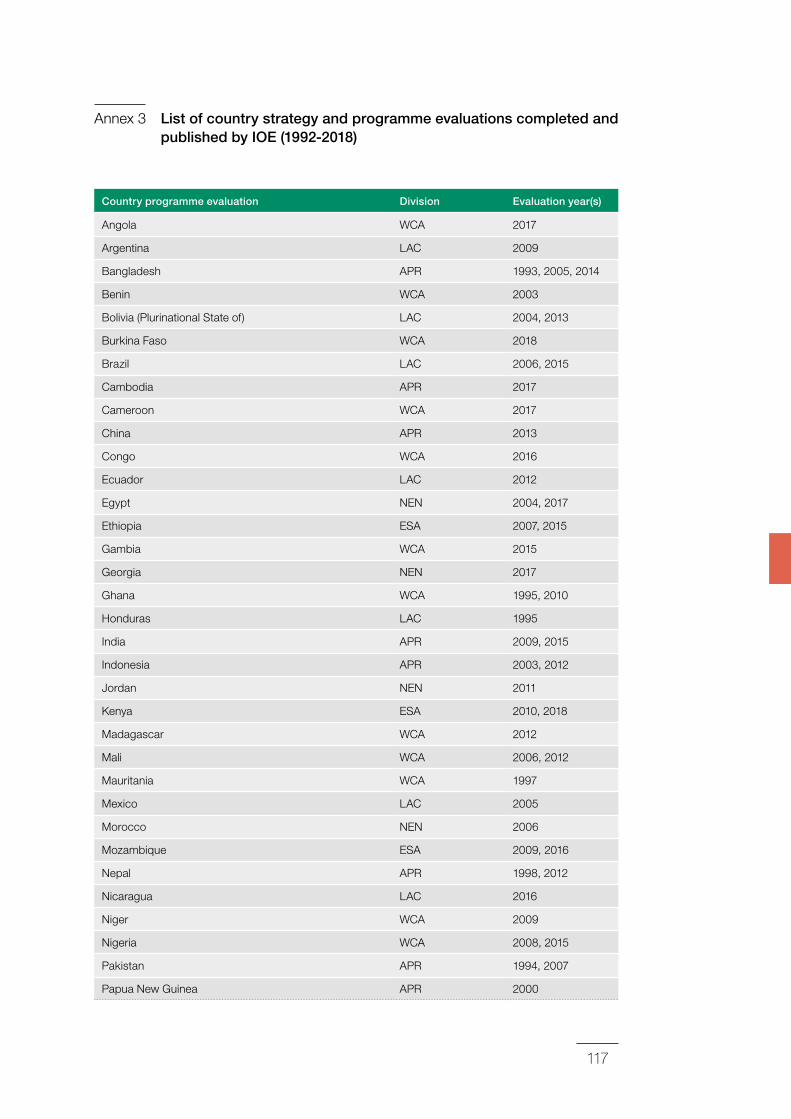
117
Annex 3 List of country strategy and programme evaluations completed and published by IOE (1992‑2018)
Country programme evaluation Division Evaluation year(s)
Angola WCA 2017
Argentina LAC 2009
Bangladesh APR 1993, 2005, 2014
Benin WCA 2003
Bolivia (Plurinational State of) LAC 2004, 2013
Burkina Faso WCA 2018
Brazil LAC 2006, 2015
Cambodia APR 2017
Cameroon WCA 2017
China APR 2013
Congo WCA 2016
Ecuador LAC 2012
Egypt NEN 2004, 2017
Ethiopia ESA 2007, 2015
Gambia WCA 2015
Georgia NEN 2017
Ghana WCA 1995, 2010
Honduras LAC 1995
India APR 2009, 2015
Indonesia APR 2003, 2012
Jordan NEN 2011
Kenya ESA 2010, 2018
Madagascar WCA 2012
Mali WCA 2006, 2012
Mauritania WCA 1997
Mexico LAC 2005
Morocco NEN 2006
Mozambique ESA 2009, 2016
Nepal APR 1998, 2012
Nicaragua LAC 2016
Niger WCA 2009
Nigeria WCA 2008, 2015
Pakistan APR 1994, 2007
Papua New Guinea APR 2000
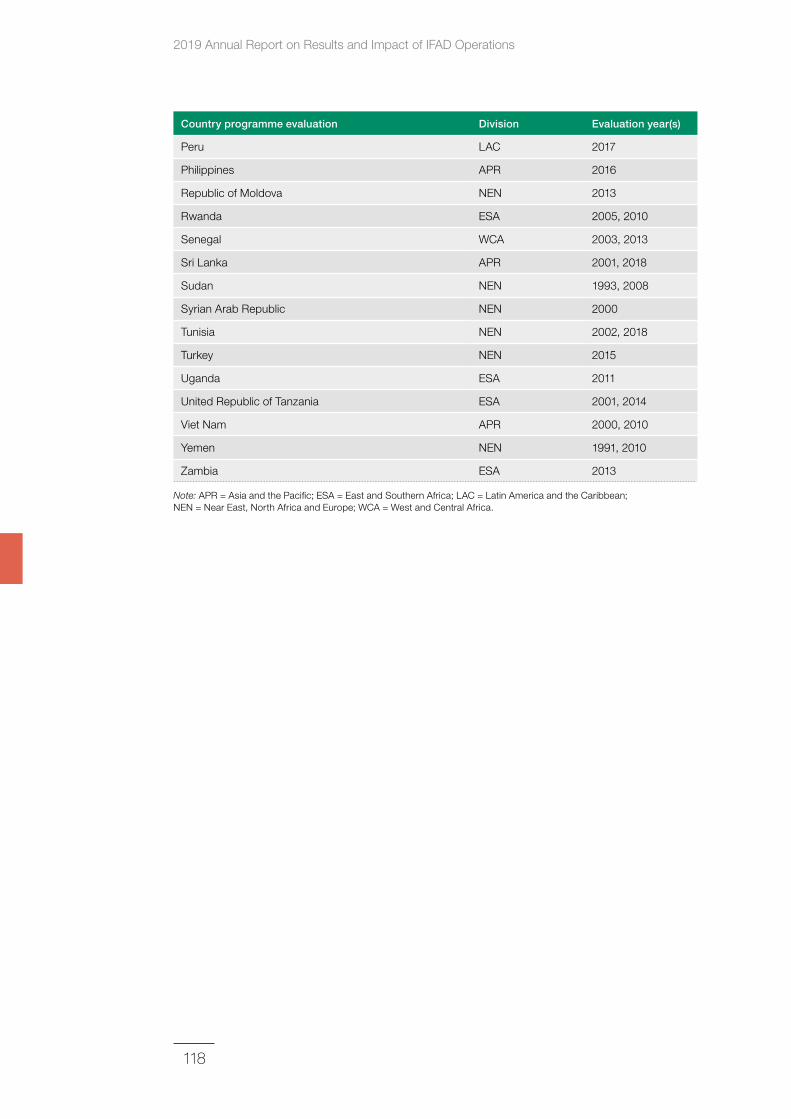
2019 Annual Report on Results and Impact of IFAD Operations
118
Country programme evaluation Division Evaluation year(s)
Peru LAC 2017
Philippines APR 2016
Republic of Moldova NEN 2013
Rwanda ESA 2005, 2010
Senegal WCA 2003, 2013
Sri Lanka APR 2001, 2018
Sudan NEN 1993, 2008
Syrian Arab Republic NEN 2000
Tunisia NEN 2002, 2018
Turkey NEN 2015
Uganda ESA 2011
United Republic of Tanzania ESA 2001, 2014
Viet Nam APR 2000, 2010
Yemen NEN 1991, 2010
Zambia ESA 2013
Note: APR = Asia and the Pacific; ESA = East and Southern Africa; LAC = Latin America and the Caribbean; NEN = Near East, North Africa and Europe; WCA = West and Central Africa.
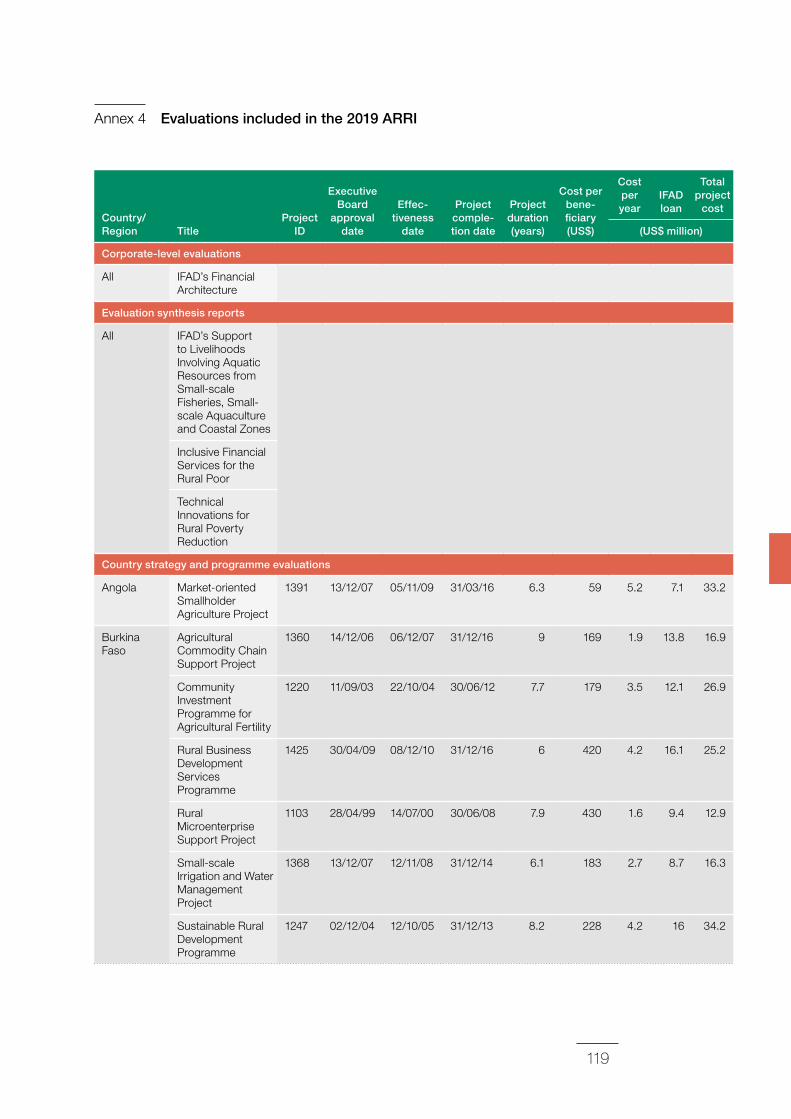
119
Annex 4 Evaluations included in the 2019 ARRI
Country/Region Title
Project ID
Executive Board
approval date
Effec‑ tiveness
date
Project comple‑ tion date
Project duration (years)
Cost per bene‑ ficiary (US$)
Cost per year
IFAD loan
Total project
cost
(US$ million)
Corporate‑level evaluations
All IFAD’s Financial Architecture
Evaluation synthesis reports
All IFAD’s Support to Livelihoods Involving Aquatic Resources from Small-scale Fisheries, Small-scale Aquaculture and Coastal Zones
Inclusive Financial Services for the Rural Poor
Technical Innovations for Rural Poverty Reduction
Country strategy and programme evaluations
Angola Market-oriented Smallholder Agriculture Project
1391 13/12/07 05/11/09 31/03/16 6.3 59 5.2 7.1 33.2
Burkina Faso
Agricultural Commodity Chain Support Project
1360 14/12/06 06/12/07 31/12/16 9 169 1.9 13.8 16.9
Community Investment Programme for Agricultural Fertility
1220 11/09/03 22/10/04 30/06/12 7.7 179 3.5 12.1 26.9
Rural Business Development Services Programme
1425 30/04/09 08/12/10 31/12/16 6 420 4.2 16.1 25.2
Rural Microenterprise Support Project
1103 28/04/99 14/07/00 30/06/08 7.9 430 1.6 9.4 12.9
Small-scale Irrigation and Water Management Project
1368 13/12/07 12/11/08 31/12/14 6.1 183 2.7 8.7 16.3
Sustainable Rural Development Programme
1247 02/12/04 12/10/05 31/12/13 8.2 228 4.2 16 34.2
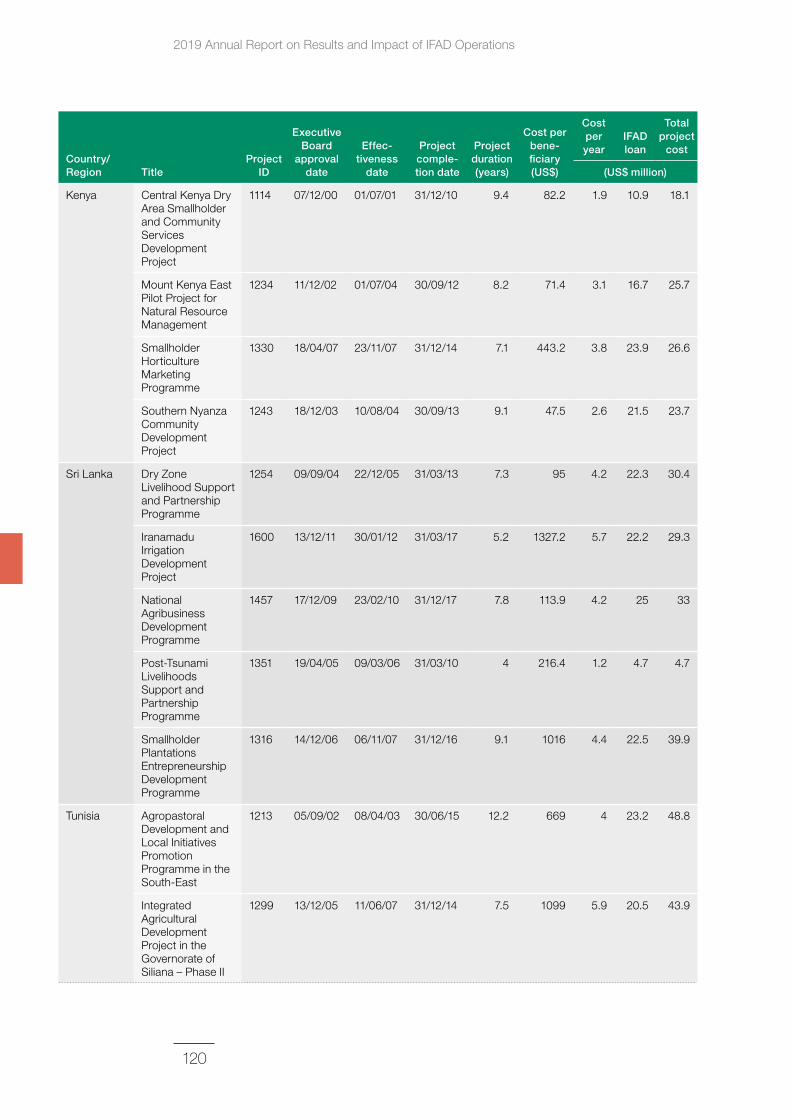
2019 Annual Report on Results and Impact of IFAD Operations
120
Country/Region Title
Project ID
Executive Board
approval date
Effec‑ tiveness
date
Project comple‑ tion date
Project duration (years)
Cost per bene‑ ficiary (US$)
Cost per year
IFAD loan
Total project
cost
(US$ million)
Kenya
Central Kenya Dry Area Smallholder and Community Services Development Project
1114 07/12/00 01/07/01 31/12/10 9.4 82.2 1.9 10.9 18.1
Mount Kenya East Pilot Project for Natural Resource Management
1234 11/12/02 01/07/04 30/09/12 8.2 71.4 3.1 16.7 25.7
Smallholder Horticulture Marketing Programme
1330 18/04/07 23/11/07 31/12/14 7.1 443.2 3.8 23.9 26.6
Southern Nyanza Community Development Project
1243 18/12/03 10/08/04 30/09/13 9.1 47.5 2.6 21.5 23.7
Sri Lanka
Dry Zone Livelihood Support and Partnership Programme
1254 09/09/04 22/12/05 31/03/13 7.3 95 4.2 22.3 30.4
Iranamadu Irrigation Development Project
1600 13/12/11 30/01/12 31/03/17 5.2 1327.2 5.7 22.2 29.3
National Agribusiness Development Programme
1457 17/12/09 23/02/10 31/12/17 7.8 113.9 4.2 25 33
Post-Tsunami Livelihoods Support and Partnership Programme
1351 19/04/05 09/03/06 31/03/10 4 216.4 1.2 4.7 4.7
Smallholder Plantations Entrepreneurship Development Programme
1316 14/12/06 06/11/07 31/12/16 9.1 1016 4.4 22.5 39.9
Tunisia Agropastoral Development and Local Initiatives Promotion Programme in the South-East
1213 05/09/02 08/04/03 30/06/15 12.2 669 4 23.2 48.8
Integrated Agricultural Development Project in the Governorate of Siliana – Phase II
1299 13/12/05 11/06/07 31/12/14 7.5 1099 5.9 20.5 43.9
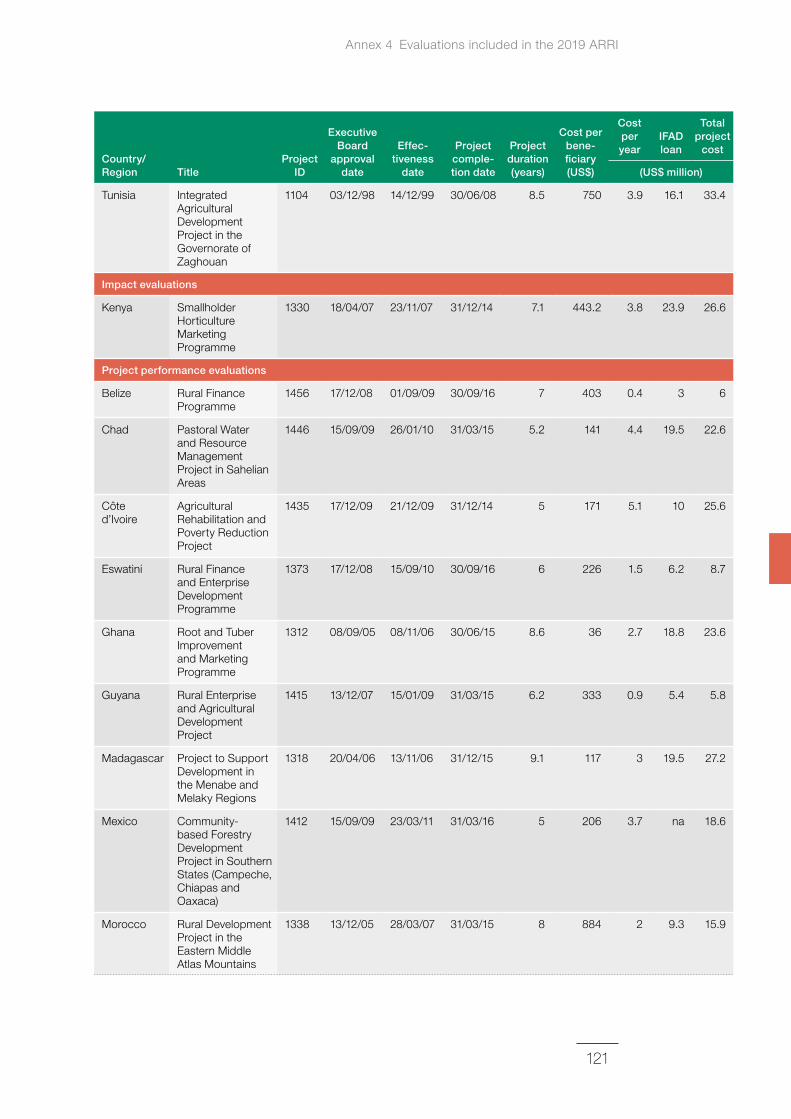
121
Country/Region Title
Project ID
Executive Board
approval date
Effec‑ tiveness
date
Project comple‑ tion date
Project duration (years)
Cost per bene‑ ficiary (US$)
Cost per year
IFAD loan
Total project
cost
(US$ million)
Tunisia Integrated Agricultural Development Project in the Governorate of Zaghouan
1104 03/12/98 14/12/99 30/06/08 8.5 750 3.9 16.1 33.4
Impact evaluations
Kenya Smallholder Horticulture Marketing Programme
1330 18/04/07 23/11/07 31/12/14 7.1 443.2 3.8 23.9 26.6
Project performance evaluations
Belize Rural Finance Programme
1456 17/12/08 01/09/09 30/09/16 7 403 0.4 3 6
Chad Pastoral Water and Resource Management Project in Sahelian Areas
1446 15/09/09 26/01/10 31/03/15 5.2 141 4.4 19.5 22.6
Côte d’Ivoire
Agricultural Rehabilitation and Poverty Reduction Project
1435 17/12/09 21/12/09 31/12/14 5 171 5.1 10 25.6
Eswatini Rural Finance and Enterprise Development Programme
1373 17/12/08 15/09/10 30/09/16 6 226 1.5 6.2 8.7
Ghana Root and Tuber Improvement and Marketing Programme
1312 08/09/05 08/11/06 30/06/15 8.6 36 2.7 18.8 23.6
Guyana Rural Enterprise and Agricultural Development Project
1415 13/12/07 15/01/09 31/03/15 6.2 333 0.9 5.4 5.8
Madagascar Project to Support Development in the Menabe and Melaky Regions
1318 20/04/06 13/11/06 31/12/15 9.1 117 3 19.5 27.2
Mexico Community-based Forestry Development Project in Southern States (Campeche, Chiapas and Oaxaca)
1412 15/09/09 23/03/11 31/03/16 5 206 3.7 na 18.6
Morocco Rural Development Project in the Eastern Middle Atlas Mountains
1338 13/12/05 28/03/07 31/03/15 8 884 2 9.3 15.9
Annex 4 Evaluations included in the 2019 ARRI
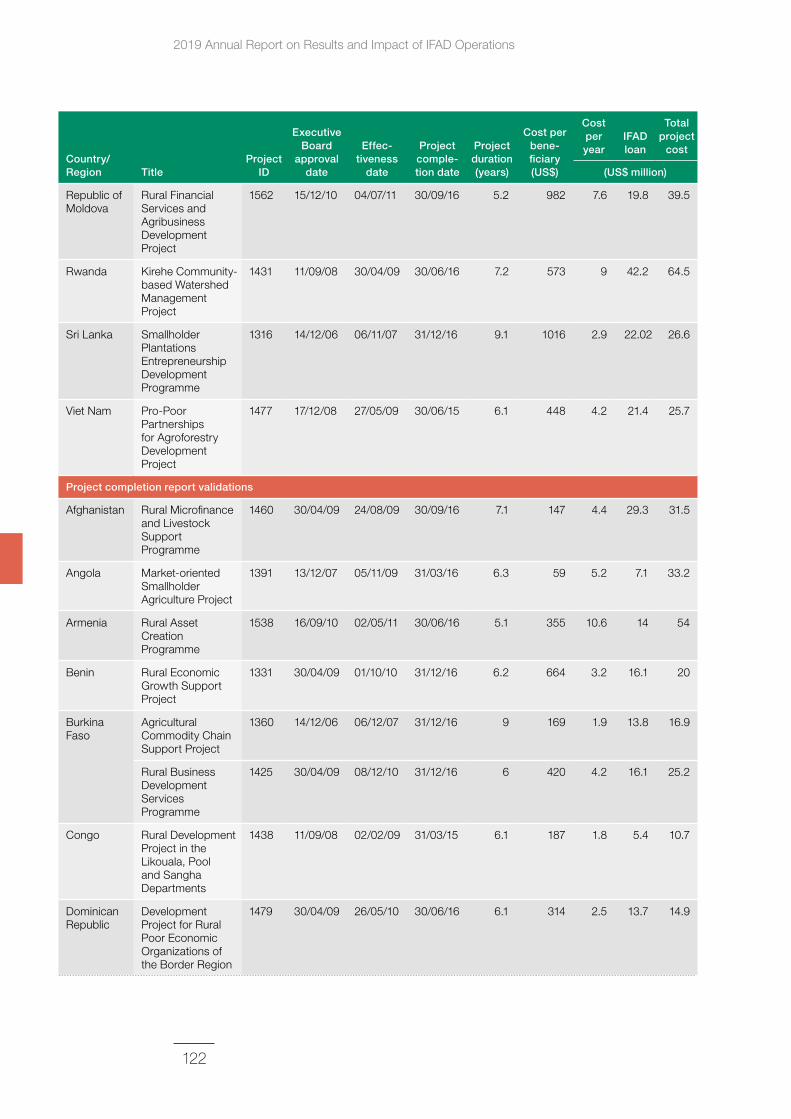
2019 Annual Report on Results and Impact of IFAD Operations
122
Country/Region Title
Project ID
Executive Board
approval date
Effec‑ tiveness
date
Project comple‑ tion date
Project duration (years)
Cost per bene‑ ficiary (US$)
Cost per year
IFAD loan
Total project
cost
(US$ million)
Republic of Moldova
Rural Financial Services and Agribusiness Development Project
1562 15/12/10 04/07/11 30/09/16 5.2 982 7.6 19.8 39.5
Rwanda Kirehe Community-based Watershed Management Project
1431 11/09/08 30/04/09 30/06/16 7.2 573 9 42.2 64.5
Sri Lanka Smallholder Plantations Entrepreneurship Development Programme
1316 14/12/06 06/11/07 31/12/16 9.1 1016 2.9 22.02 26.6
Viet Nam Pro-Poor Partnerships for Agroforestry Development Project
1477 17/12/08 27/05/09 30/06/15 6.1 448 4.2 21.4 25.7
Project completion report validations
Afghanistan Rural Microfinance and Livestock Support Programme
1460 30/04/09 24/08/09 30/09/16 7.1 147 4.4 29.3 31.5
Angola Market-oriented Smallholder Agriculture Project
1391 13/12/07 05/11/09 31/03/16 6.3 59 5.2 7.1 33.2
Armenia Rural Asset Creation Programme
1538 16/09/10 02/05/11 30/06/16 5.1 355 10.6 14 54
Benin Rural Economic Growth Support Project
1331 30/04/09 01/10/10 31/12/16 6.2 664 3.2 16.1 20
Burkina Faso
Agricultural Commodity Chain Support Project
1360 14/12/06 06/12/07 31/12/16 9 169 1.9 13.8 16.9
Rural Business Development Services Programme
1425 30/04/09 08/12/10 31/12/16 6 420 4.2 16.1 25.2
Congo Rural Development Project in the Likouala, Pool and Sangha Departments
1438 11/09/08 02/02/09 31/03/15 6.1 187 1.8 5.4 10.7
Dominican Republic
Development Project for Rural Poor Economic Organizations of the Border Region
1479 30/04/09 26/05/10 30/06/16 6.1 314 2.5 13.7 14.9
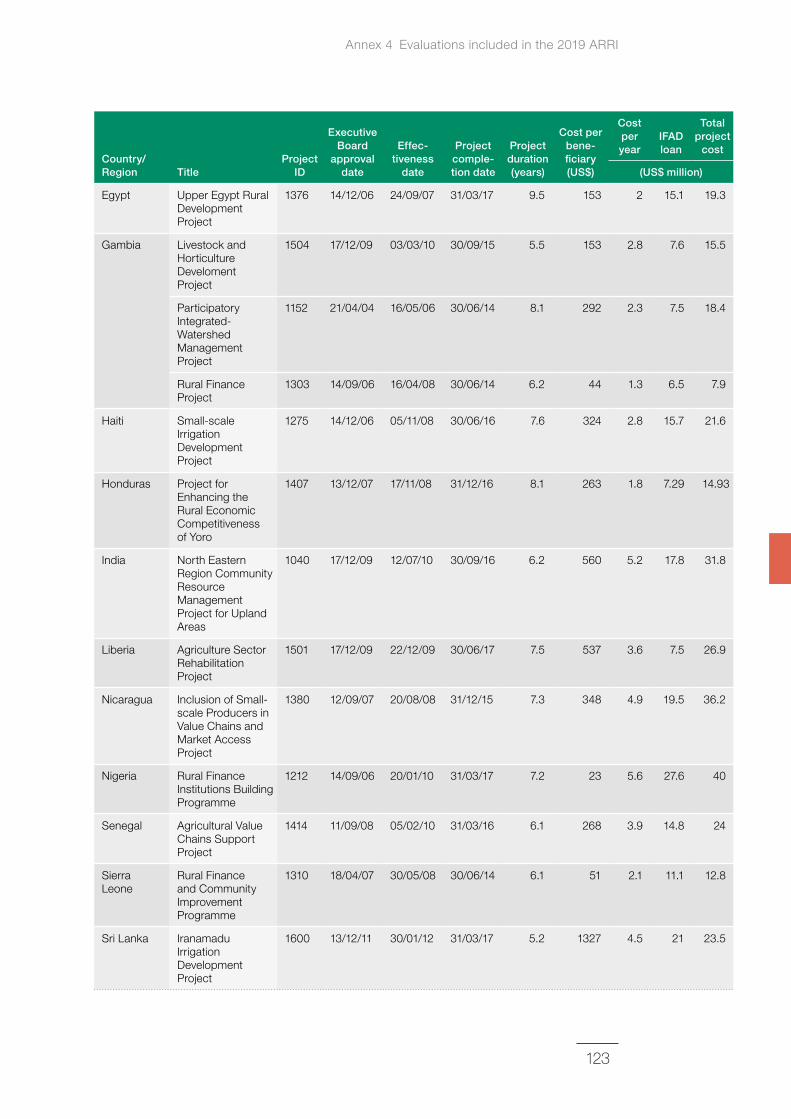
123
Country/Region Title
Project ID
Executive Board
approval date
Effec‑ tiveness
date
Project comple‑ tion date
Project duration (years)
Cost per bene‑ ficiary (US$)
Cost per year
IFAD loan
Total project
cost
(US$ million)
Egypt Upper Egypt Rural Development Project
1376 14/12/06 24/09/07 31/03/17 9.5 153 2 15.1 19.3
Gambia Livestock and Horticulture Develoment Project
1504 17/12/09 03/03/10 30/09/15 5.5 153 2.8 7.6 15.5
Participatory Integrated-Watershed Management Project
1152 21/04/04 16/05/06 30/06/14 8.1 292 2.3 7.5 18.4
Rural Finance Project
1303 14/09/06 16/04/08 30/06/14 6.2 44 1.3 6.5 7.9
Haiti Small-scale Irrigation Development Project
1275 14/12/06 05/11/08 30/06/16 7.6 324 2.8 15.7 21.6
Honduras Project for Enhancing the Rural Economic Competitiveness of Yoro
1407 13/12/07 17/11/08 31/12/16 8.1 263 1.8 7.29 14.93
India North Eastern Region Community Resource Management Project for Upland Areas
1040 17/12/09 12/07/10 30/09/16 6.2 560 5.2 17.8 31.8
Liberia Agriculture Sector Rehabilitation Project
1501 17/12/09 22/12/09 30/06/17 7.5 537 3.6 7.5 26.9
Nicaragua Inclusion of Small-scale Producers in Value Chains and Market Access Project
1380 12/09/07 20/08/08 31/12/15 7.3 348 4.9 19.5 36.2
Nigeria Rural Finance Institutions Building Programme
1212 14/09/06 20/01/10 31/03/17 7.2 23 5.6 27.6 40
Senegal Agricultural Value Chains Support Project
1414 11/09/08 05/02/10 31/03/16 6.1 268 3.9 14.8 24
Sierra Leone
Rural Finance and Community Improvement Programme
1310 18/04/07 30/05/08 30/06/14 6.1 51 2.1 11.1 12.8
Sri Lanka Iranamadu Irrigation Development Project
1600 13/12/11 30/01/12 31/03/17 5.2 1327 4.5 21 23.5
Annex 4 Evaluations included in the 2019 ARRI
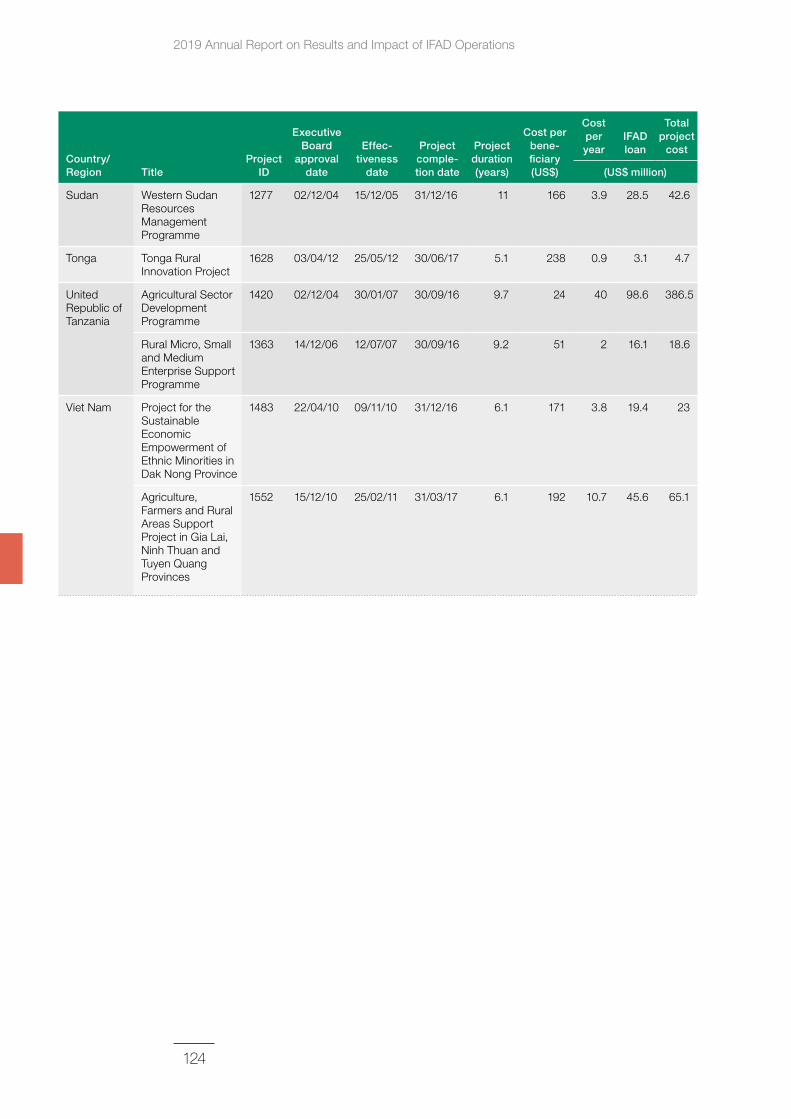
2019 Annual Report on Results and Impact of IFAD Operations
124
Country/Region Title
Project ID
Executive Board
approval date
Effec‑ tiveness
date
Project comple‑ tion date
Project duration (years)
Cost per bene‑ ficiary (US$)
Cost per year
IFAD loan
Total project
cost
(US$ million)
Sudan Western Sudan Resources Management Programme
1277 02/12/04 15/12/05 31/12/16 11 166 3.9 28.5 42.6
Tonga Tonga Rural Innovation Project
1628 03/04/12 25/05/12 30/06/17 5.1 238 0.9 3.1 4.7
United Republic of Tanzania
Agricultural Sector Development Programme
1420 02/12/04 30/01/07 30/09/16 9.7 24 40 98.6 386.5
Rural Micro, Small and Medium Enterprise Support Programme
1363 14/12/06 12/07/07 30/09/16 9.2 51 2 16.1 18.6
Viet Nam Project for the Sustainable Economic Empowerment of Ethnic Minorities in Dak Nong Province
1483 22/04/10 09/11/10 31/12/16 6.1 171 3.8 19.4 23
Agriculture, Farmers and Rural Areas Support Project in Gia Lai, Ninh Thuan and Tuyen Quang Provinces
1552 15/12/10 25/02/11 31/03/17 6.1 192 10.7 45.6 65.1
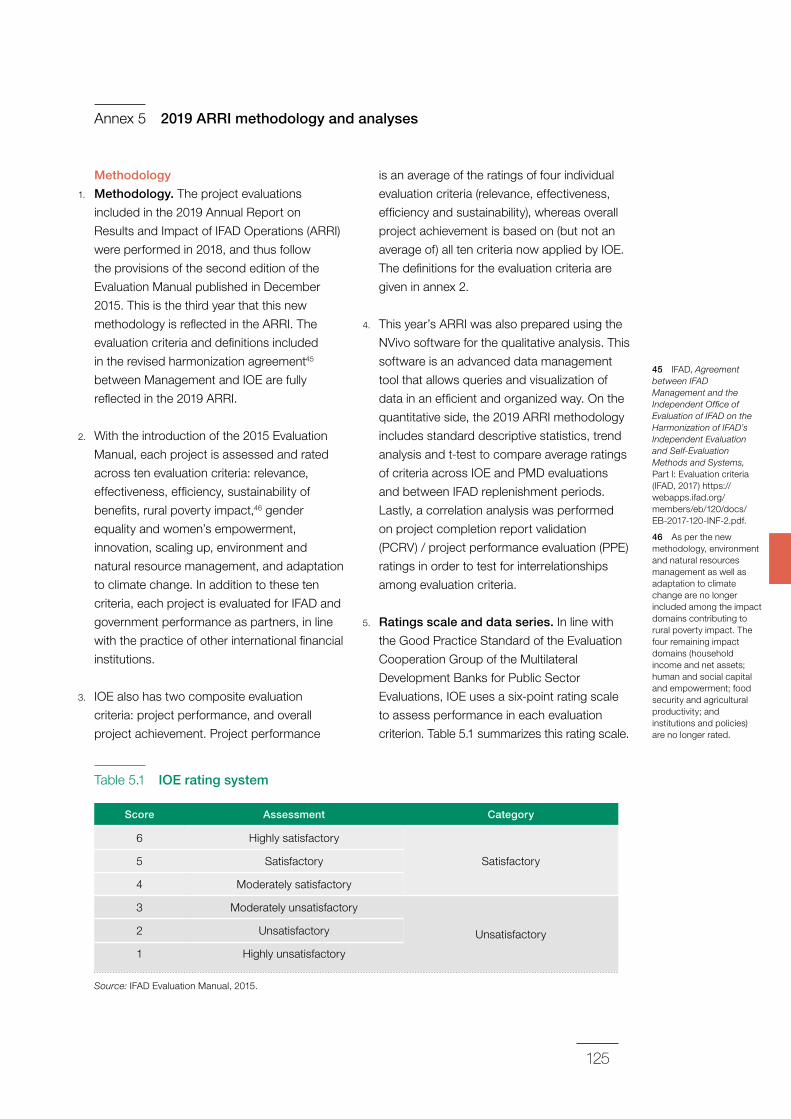
125
Annex 5 2019 ARRI methodology and analyses
Methodology
1. Methodology. The project evaluations
included in the 2019 Annual Report on
Results and Impact of IFAD Operations (ARRI)
were performed in 2018, and thus follow
the provisions of the second edition of the
Evaluation Manual published in December
2015. This is the third year that this new
methodology is reflected in the ARRI. The
evaluation criteria and definitions included
in the revised harmonization agreement45
between Management and IOE are fully
reflected in the 2019 ARRI.
2. With the introduction of the 2015 Evaluation
Manual, each project is assessed and rated
across ten evaluation criteria: relevance,
effectiveness, efficiency, sustainability of
benefits, rural poverty impact,46 gender
equality and women’s empowerment,
innovation, scaling up, environment and
natural resource management, and adaptation
to climate change. In addition to these ten
criteria, each project is evaluated for IFAD and
government performance as partners, in line
with the practice of other international financial
institutions.
3. IOE also has two composite evaluation
criteria: project performance, and overall
project achievement. Project performance
is an average of the ratings of four individual
evaluation criteria (relevance, effectiveness,
efficiency and sustainability), whereas overall
project achievement is based on (but not an
average of) all ten criteria now applied by IOE.
The definitions for the evaluation criteria are
given in annex 2.
4. This year’s ARRI was also prepared using the
NVivo software for the qualitative analysis. This
software is an advanced data management
tool that allows queries and visualization of
data in an efficient and organized way. On the
quantitative side, the 2019 ARRI methodology
includes standard descriptive statistics, trend
analysis and t-test to compare average ratings
of criteria across IOE and PMD evaluations
and between IFAD replenishment periods.
Lastly, a correlation analysis was performed
on project completion report validation
(PCRV) / project performance evaluation (PPE)
ratings in order to test for interrelationships
among evaluation criteria.
5. Ratings scale and data series. In line with
the Good Practice Standard of the Evaluation
Cooperation Group of the Multilateral
Development Banks for Public Sector
Evaluations, IOE uses a six-point rating scale
to assess performance in each evaluation
criterion. Table 5.1 summarizes this rating scale.
45 IFAD, Agreement between IFAD Management and the Independent Office of Evaluation of IFAD on the Harmonization of IFAD’s Independent Evaluation and Self-Evaluation Methods and Systems, Part I: Evaluation criteria (IFAD, 2017) https://webapps.ifad.org/members/eb/120/docs/EB-2017-120-INF-2.pdf.
46 As per the new methodology, environment and natural resources management as well as adaptation to climate change are no longer included among the impact domains contributing to rural poverty impact. The four remaining impact domains (household income and net assets; human and social capital and empowerment; food security and agricultural productivity; and institutions and policies) are no longer rated.
Table 5.1 IOE rating system
Score Assessment Category
6 Highly satisfactory
Satisfactory5 Satisfactory
4 Moderately satisfactory
3 Moderately unsatisfactory
Unsatisfactory2 Unsatisfactory
1 Highly unsatisfactory
Source: IFAD Evaluation Manual, 2015.
2019 Annual Report on Results and Impact of IFAD Operations
126
47 Introduced in the 2013 ARRI.
48 The all evaluation data series also stops in 2017 due to comparability with the PCRV/PPE data series and due to the small sample size of country strategy and programme evaluation (CSPE) projects completing in 2017.
49 For example, in the past it was mandatory for IOE to undertake an interim (project) evaluation before Management could proceed with the design of a second phase of the same operation.
50 Reporting by year of project completion is preferred to year of approval as this includes all the inputs and changes to the project, not just project design and appraisal. It is also preferred over presentation by year of evaluation results where there is a wide range of project approval dates, and sometimes very old projects are included. Presentation by year of project completion provides a more homogenous cohort.
51 Available online at https://www.ifad.org/en/web/ioe/arri.
6. The ratings, which are the foundation of
performance reporting in IOE evaluations, are
thereafter used in the analysis of the ARRI
for reporting on IFAD’s aggregate operational
performance. Therefore, in each independent
evaluation, IOE pays maximum attention
to ensuring that the ratings assigned are
based on evidence and follow a standard
methodology and process. Moreover,
comprehensive internal and external peer
reviews are organized in finalizing the
assessments and ratings of each evaluation,
also as a means to enhance objectivity and
minimize inter-evaluator variability.
7. As in recent ARRIs, the analysis is based
on two data series: (i) all evaluation data;
and (ii) PCRV/PPE data only. The 2019 ARRI
primarily presents analysis based on the PCRV/
PPE data series,47 which contains only ratings
from PCRVs, PPEs and impact evaluations (IEs)
of completed projects. As IOE has conducted
PCRVs for all completed projects since 2011,
covering the entire portfolio at exit, there are
no selection biases in the projects chosen
for evaluation. The PCRV/PPE data series
currently includes ratings from 228 evaluations
out of the total of 344 evaluations in the all
evaluation data series. In comparison to last
year’s database, the sample includes new
PCRVs, PPEs and IEs conducted mainly in
2018 and only two evaluations in 2017. As
the new PCRVs, PPEs and IEs completed
between 2014 and 2017, both data series stop
in 2017 in the last cohort.48
8. The all evaluation data series consists of
ratings from all evaluations conducted by IOE
since 2002. In addition to PCRV/PPE data, it
also includes country strategy and programme
evaluations (CSPEs), and therefore contains
evaluated projects that were not selected
randomly and followed other criteria.49 In
the 2019 ARRI, the all evaluation data series
is used to triangulate findings and for the
analysis benchmarking IFAD performance with
other IFIs, as the sample sizes provided by
the PCRV/PPE data series are currently too
small for this exercise. The analysis on project
evaluations has been carried out based on
the year of project completion,50 in line with
most other international financial institutions
(IFIs) and previous editions of the ARRI. Finally,
the ratings discussed in the CSPE section
(portfolio performance, non-lending activities
and COSOPs) come from a separate database
of CSPEs undertaken by IOE between
2006 and 2018. CSPEs are included in this
database based on year of evaluation.
9. Charts and tables showing the moving
averages of performance based on the
all evaluation data series are available in
the online appendices51 as they, overall,
support the trends of the PCRV/PPE data
series and, therefore, do not need to be
mentioned in comparison with the PCRV/
PPE data series. As in the past, the 2019
ARRI analyses independent evaluation ratings
grouped by IFAD replenishment periods,
starting with that for the Fifth Replenishment
of IFAD’s Resources (IFAD5, 2001-2003).
The results of the analysis of performance
by replenishment period are presented in
annex 6 and discussed in the special chapter
on IFAD replenishment (chapter 4), whereas
supplementary tables/charts are included in
the online appendices.
10. The qualitative analysis is based on the project
evaluations done in 2018 (PCRVs, PPEs, IEs
and CSPEs) as well as two evaluations done
in 2017 but not included in the 2018 ARRI,
the evaluation syntheses and a corporate-
level evaluation. For the complete overview
of the consulted evaluations of 2018, please
see annex 4.
11. Age of the portfolio. Of the 41 newly
evaluated projects included in this year’s
ARRI, 13 were approved between 2004
and 2006, 22 between 2007 and 2009, and
6 between 2010 and 2012. All projects are
completed and closed: 6 in 2014, 8 in 2015,
21 in 2016, and 6 in 2017. The average project
duration was 6.9 years. Only one project
127
had an implementation period of more than
10 years compared to 4 of the 36 evaluated in
the 2018 ARRI. Thus, although some projects
were designed ten or more years ago, a large
number of them were under implementation
until recently. However, given the age of the
portfolio of projects analysed in the ARRI,
it is important to note that the analysis of
performance does not take into account
recently designed projects.
12. The ARRI also assesses the performance of
IFAD country programmes beyond the project
level, using the assessments contained in
CSPEs. Historically, a total of 72 CSPEs have
been undertaken by IOE since the product
was introduced in the 1990s (see annex 3
for a complete list). Of these, 50 CSPEs have
been completed since 2006 based on a
consistent methodology including the use of
ratings, which allows for aggregating results
across country programmes. This year’s ARRI
include five new CSPEs carried out in Angola,
Burkina Faso, Kenya, Sri Lanka and Tunisia.
13. Analysis of ratings. As per past practice,
the ARRI uses three-year moving averages to
smoothen short-term fluctuations and highlight
long-term trends.52 The moving average is
particularly applicable to the “all data” series
as it includes projects that were not randomly
selected.
14. The main trends in performance are explained
through an analysis of the percentages
of projects that are rated as moderately
satisfactory or better. However, as requested
by the Evaluation Committee, the proportions
of ratings for each evaluation criteria falling
within the full range of the six-point rating
scale (i.e. from highly unsatisfactory to highly
satisfactory) used by IOE are available in the
online appendices. Moreover, at the request
of Management, non-lending performance
ratings are presented for the first time within
the full range of the six-point rating scale
(i.e. from highly unsatisfactory to highly
satisfactory) by replenishment period.
15. The overview section presents a detailed
analysis of ratings from 2007 to 2017. This
includes the distribution analysis of available
ratings in the PCRV/PPE data series in the
period, which provides a summary of the
mean, standard deviation (SD) and the
coefficient of variation by evaluation criteria.
The mean is presented together with the SD
along with the coefficient of variation for a
nuanced understanding of performance. The
coefficient of variation is a relative measure of
variability and is calculated as the ratio of the
SD to the mean.
16. These analyses are complemented by a
correlation analyses of PCRV/PPE ratings to
test for interrelationships among evaluation
criteria. The correlation analysis is presented
in the subsequent section and is followed
by a principal component analysis (PCA) to
understand how criteria relate to each other in
groups. A Student’s t-test was subsequently
performed to test the significance of the
difference in average ratings between IFAD
replenishment periods for each criterion, using
the all evaluation data series.
17. As with the trends analysis of the share of
moderately satisfactory or better presented in
the ARRI, annex 8 presents a trend analysis
of IOE and PCR ratings by evaluation criteria
using the PCRV/PPE data series and the
usual three-year moving average to smoothen
short-term fluctuations. This is complemented
by a presentation of the disconnect between
IOE and PCR ratings by three-year moving
average.
Test for correlation between evaluation
criteria
18. The most commonly followed approach to
evaluating project performance is an analysis
of the various evaluation criteria through
their ratings scale. This approach involves an
examination of ratings for individual criteria
in order to understand the performance
of projects (either the project is performing
well or not). However, this method may
52 Three-year moving averages were first used in the 2009 ARRI, before IOE started undertaking PCRVs/PPEs. A three-year moving average allows for the assessment of trends in performance over time, and also overcomes any bias that may result from the sample of projects evaluated, which are not chosen on a random basis. Three-year moving averages are calculated by adding evaluation results from three consecutive years.
Annex 5 2019 ARRI methodology and analyses
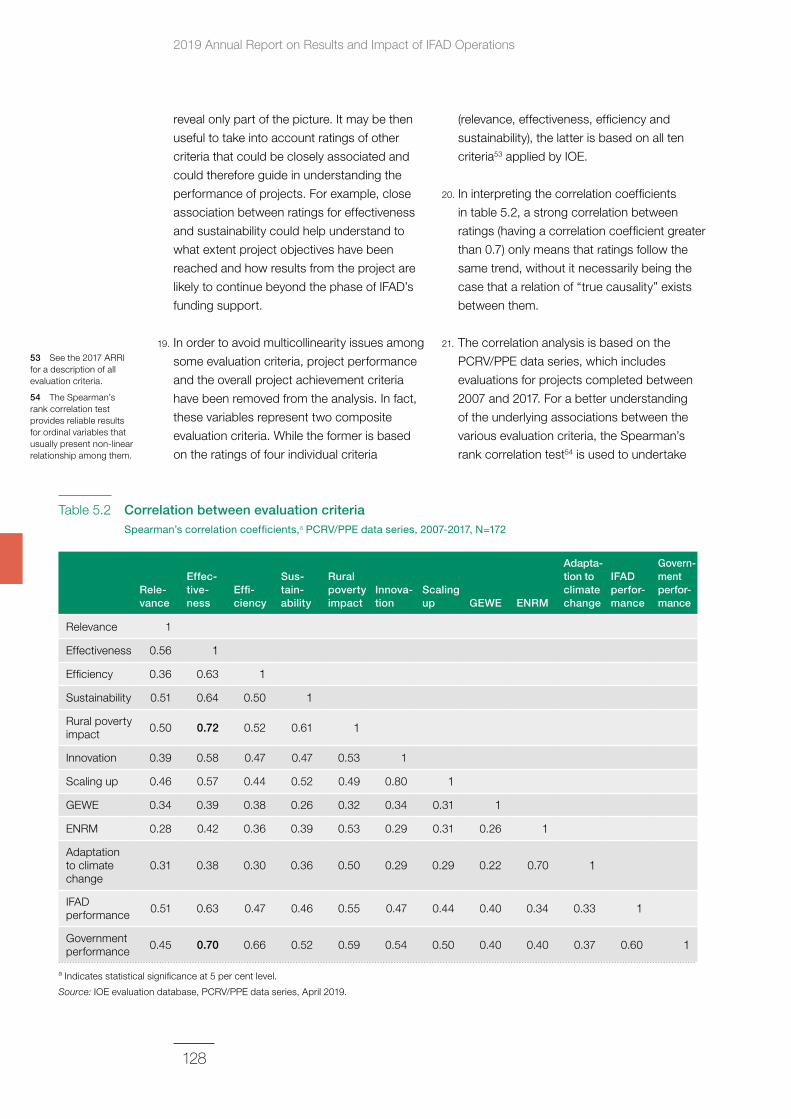
2019 Annual Report on Results and Impact of IFAD Operations
128
53 See the 2017 ARRI for a description of all evaluation criteria.
54 The Spearman’s rank correlation test provides reliable results for ordinal variables that usually present non-linear relationship among them.
reveal only part of the picture. It may be then
useful to take into account ratings of other
criteria that could be closely associated and
could therefore guide in understanding the
performance of projects. For example, close
association between ratings for effectiveness
and sustainability could help understand to
what extent project objectives have been
reached and how results from the project are
likely to continue beyond the phase of IFAD’s
funding support.
19. In order to avoid multicollinearity issues among
some evaluation criteria, project performance
and the overall project achievement criteria
have been removed from the analysis. In fact,
these variables represent two composite
evaluation criteria. While the former is based
on the ratings of four individual criteria
(relevance, effectiveness, efficiency and
sustainability), the latter is based on all ten
criteria53 applied by IOE.
20. In interpreting the correlation coefficients
in table 5.2, a strong correlation between
ratings (having a correlation coefficient greater
than 0.7) only means that ratings follow the
same trend, without it necessarily being the
case that a relation of “true causality” exists
between them.
21. The correlation analysis is based on the
PCRV/PPE data series, which includes
evaluations for projects completed between
2007 and 2017. For a better understanding
of the underlying associations between the
various evaluation criteria, the Spearman’s
rank correlation test54 is used to undertake
Table 5.2 Correlation between evaluation criteria
Spearman’s correlation coefficients,a PCRV/PPE data series, 2007-2017, N=172
Rele‑vance
Effec‑tive‑ness
Effi‑ciency
Sus‑tain‑ability
Rural poverty impact
Innova‑tion
Scaling up GEWE ENRM
Adapta‑tion to climate change
IFAD perfor‑mance
Govern‑ment perfor‑mance
Relevance 1
Effectiveness 0.56 1
Efficiency 0.36 0.63 1
Sustainability 0.51 0.64 0.50 1
Rural poverty impact 0.50 0.72 0.52 0.61 1
Innovation 0.39 0.58 0.47 0.47 0.53 1
Scaling up 0.46 0.57 0.44 0.52 0.49 0.80 1
GEWE 0.34 0.39 0.38 0.26 0.32 0.34 0.31 1
ENRM 0.28 0.42 0.36 0.39 0.53 0.29 0.31 0.26 1
Adaptation to climate change
0.31 0.38 0.30 0.36 0.50 0.29 0.29 0.22 0.70 1
IFAD performance 0.51 0.63 0.47 0.46 0.55 0.47 0.44 0.40 0.34 0.33 1
Government performance 0.45 0.70 0.66 0.52 0.59 0.54 0.50 0.40 0.40 0.37 0.60 1
a Indicates statistical significance at 5 per cent level.
Source: IOE evaluation database, PCRV/PPE data series, April 2019.
129
correlations. The correlation results are
also tested for statistical significance at the
5 per cent significance level. The results are
presented in a matrix form and show the
degree of association, i.e. the correlation
coefficient between the various criteria.
22. For the sake of simplicity, the different
correlation coefficient values could be
interpreted55 in the following way:
• for values between 0.90 and 1, the
correlation is very strong;
• for values between 0.70 and 0.89, the
correlation is strong;
• for values between 0.50 and 0.69, the
correlation is moderate;
• for values between 0.30 and 0.49, the
correlation is low;
• for values below 0.29, the correlation
is weak.
23. Table 5.2 shows the correlation of all the
indicators with one another. It is important to
ensure that there are no perfectly correlated
variables, which would mean that one of them
does not add information and can be deleted
before looking for significant correlations and
possibly clusters.
24. The results presented in table 5.2 show, for
example, that:
• All criteria are positively correlated.
• All correlations between criteria appear to
be statistically significant at the 5 per cent
level.
• Most correlations between criteria are
either moderate or low.
• The strongest correlation was observed
between rural poverty impact and
effectiveness (0.72), and between
government performance and effectiveness
(0.70).
• There is moderate correlation between
effectiveness vis-à-vis efficiency,
sustainability and IFAD performance, as
well as between sustainability and rural
poverty impact, and between government
performance and efficiency.
• Correlation with most criteria is stronger for
effectiveness than relevance (confirming
that quality of implementation has stronger
effects than does design).
• With the exception of relevance, correlation
between government performance and
other criteria is stronger than between IFAD
performance and other criteria, and this is
particularly the case for effectiveness and
efficiency.
Principal component analysis
25. In order to obtain a synthesis of the different
dimensions of the interrelationship among
evaluation criteria, a principle component
analysis (PCA) is used. This method describes
how evaluation criteria relate to each other
in groups, and helps identify components in
the data indicating when these criteria vary
similarly. The PCA captures the essence of
the data in a few principal components, which
convey the most variation in the dataset.
In order to ensure analysis on significant
relationships among evaluation criteria,
project performance and the overall project
achievement criteria have been removed from
the analysis, as these variables represent
two composite evaluation criteria. The criteria
GEWE and ENRM have been removed from
the PCA because of the weak correlation with
the other variables. In addition, adaptation to
climate change has been removed because of
its small sample size.
26. Methodology. The analysis is based upon
a polychoric PCA.56 This approach is based
on a nonlinear PCA, which is a method
of dimension reduction applied to ordinal
variables. This approach seems particularly
suitable because it preserves the ordinal
nature of the criteria, without assuming equal
difference between subsequent categories.
27. The PCA allows two interesting analysis.
The component loadings plot presents the
correlation between each criterion and each
component. A high correlation indicates that
a large proportion of a criterion is associated
55 There is no set rule in the interpretation of the correlation coefficient.
56 See Stanislav Kolenikov and Gustavo Angeles, The Use of Discrete Data in Principal Component Analysis for Socio-Economic Status Evaluation (Carolina, USA: University of North Carolina at Chapel Hill, 2005).
Annex 5 2019 ARRI methodology and analyses
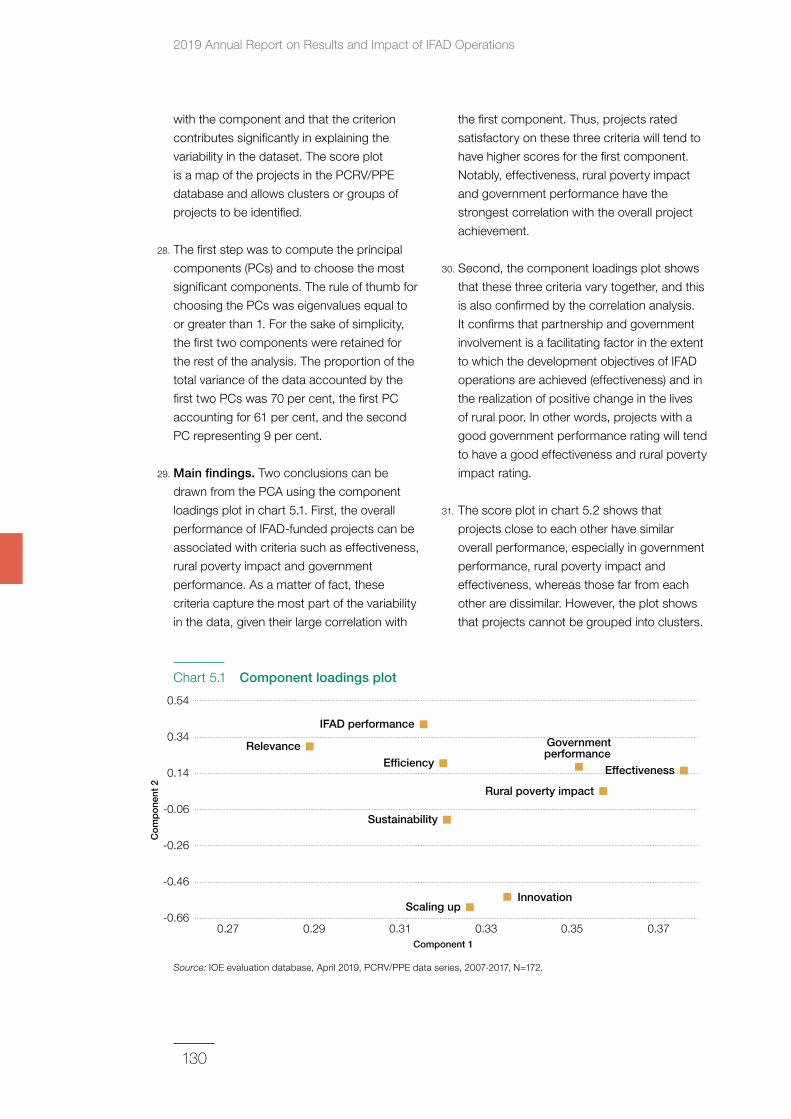
2019 Annual Report on Results and Impact of IFAD Operations
130
with the component and that the criterion
contributes significantly in explaining the
variability in the dataset. The score plot
is a map of the projects in the PCRV/PPE
database and allows clusters or groups of
projects to be identified.
28. The first step was to compute the principal
components (PCs) and to choose the most
significant components. The rule of thumb for
choosing the PCs was eigenvalues equal to
or greater than 1. For the sake of simplicity,
the first two components were retained for
the rest of the analysis. The proportion of the
total variance of the data accounted by the
first two PCs was 70 per cent, the first PC
accounting for 61 per cent, and the second
PC representing 9 per cent.
29. Main findings. Two conclusions can be
drawn from the PCA using the component
loadings plot in chart 5.1. First, the overall
performance of IFAD-funded projects can be
associated with criteria such as effectiveness,
rural poverty impact and government
performance. As a matter of fact, these
criteria capture the most part of the variability
in the data, given their large correlation with
the first component. Thus, projects rated
satisfactory on these three criteria will tend to
have higher scores for the first component.
Notably, effectiveness, rural poverty impact
and government performance have the
strongest correlation with the overall project
achievement.
30. Second, the component loadings plot shows
that these three criteria vary together, and this
is also confirmed by the correlation analysis.
It confirms that partnership and government
involvement is a facilitating factor in the extent
to which the development objectives of IFAD
operations are achieved (effectiveness) and in
the realization of positive change in the lives
of rural poor. In other words, projects with a
good government performance rating will tend
to have a good effectiveness and rural poverty
impact rating.
31. The score plot in chart 5.2 shows that
projects close to each other have similar
overall performance, especially in government
performance, rural poverty impact and
effectiveness, whereas those far from each
other are dissimilar. However, the plot shows
that projects cannot be grouped into clusters.
Chart 5.1 Component loadings plot
Source: IOE evaluation database, April 2019, PCRV/PPE data series, 2007-2017, N=172.
-0.46
-0.26
0.14
-0.06
0.34
0.54
0.27 0.29 0.31 0.33 0.35-0.66
0.37Component 1
Relevance
Innovation
Effectiveness
IFAD performance
Ef�ciency
Rural poverty impact
Sustainability
Scaling up
Governmentperformance
Co
mp
one
nt 2
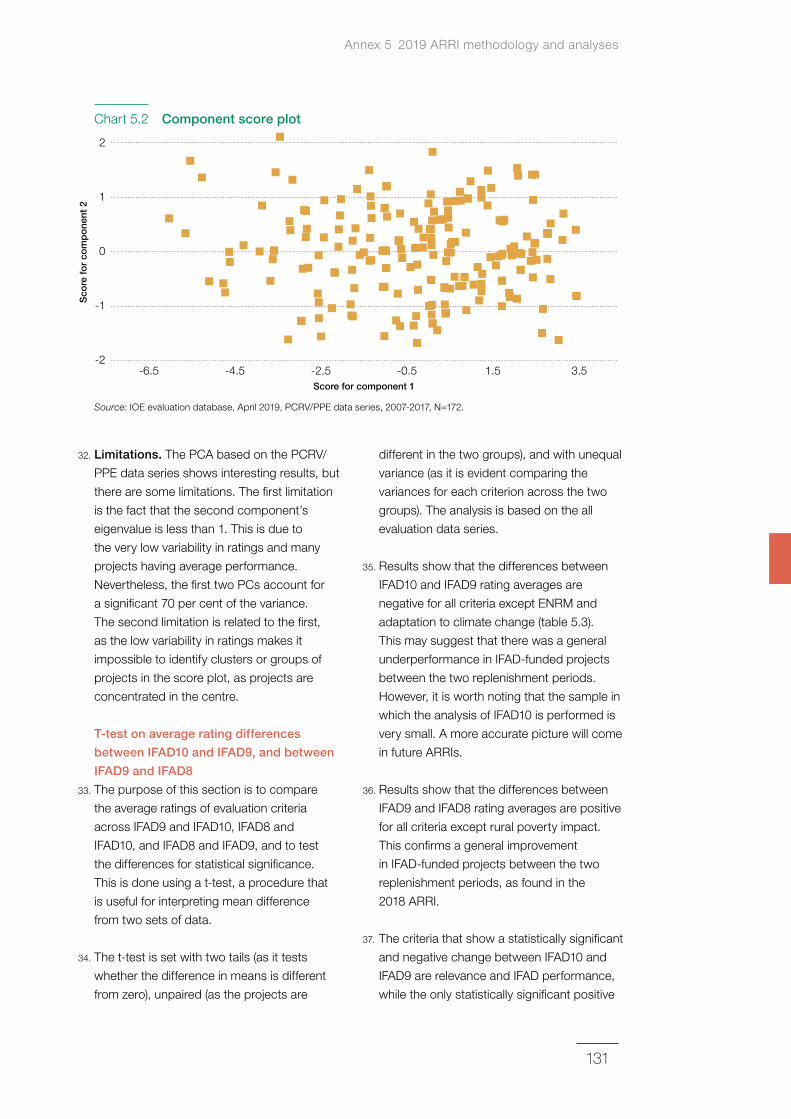
131
32. Limitations. The PCA based on the PCRV/
PPE data series shows interesting results, but
there are some limitations. The first limitation
is the fact that the second component’s
eigenvalue is less than 1. This is due to
the very low variability in ratings and many
projects having average performance.
Nevertheless, the first two PCs account for
a significant 70 per cent of the variance.
The second limitation is related to the first,
as the low variability in ratings makes it
impossible to identify clusters or groups of
projects in the score plot, as projects are
concentrated in the centre.
T‑test on average rating differences
between IFAD10 and IFAD9, and between
IFAD9 and IFAD8
33. The purpose of this section is to compare
the average ratings of evaluation criteria
across IFAD9 and IFAD10, IFAD8 and
IFAD10, and IFAD8 and IFAD9, and to test
the differences for statistical significance.
This is done using a t-test, a procedure that
is useful for interpreting mean difference
from two sets of data.
34. The t-test is set with two tails (as it tests
whether the difference in means is different
from zero), unpaired (as the projects are
different in the two groups), and with unequal
variance (as it is evident comparing the
variances for each criterion across the two
groups). The analysis is based on the all
evaluation data series.
35. Results show that the differences between
IFAD10 and IFAD9 rating averages are
negative for all criteria except ENRM and
adaptation to climate change (table 5.3).
This may suggest that there was a general
underperformance in IFAD-funded projects
between the two replenishment periods.
However, it is worth noting that the sample in
which the analysis of IFAD10 is performed is
very small. A more accurate picture will come
in future ARRIs.
36. Results show that the differences between
IFAD9 and IFAD8 rating averages are positive
for all criteria except rural poverty impact.
This confirms a general improvement
in IFAD-funded projects between the two
replenishment periods, as found in the
2018 ARRI.
37. The criteria that show a statistically significant
and negative change between IFAD10 and
IFAD9 are relevance and IFAD performance,
while the only statistically significant positive
Chart 5.2 Component score plot
Source: IOE evaluation database, April 2019, PCRV/PPE data series, 2007-2017, N=172.
-1
0
1
2
-6.5 -4.5 -2.5 -0.5 1.5-2
3.5Score for component 1
Sco
re f
or
com
po
nent
2
Annex 5 2019 ARRI methodology and analyses
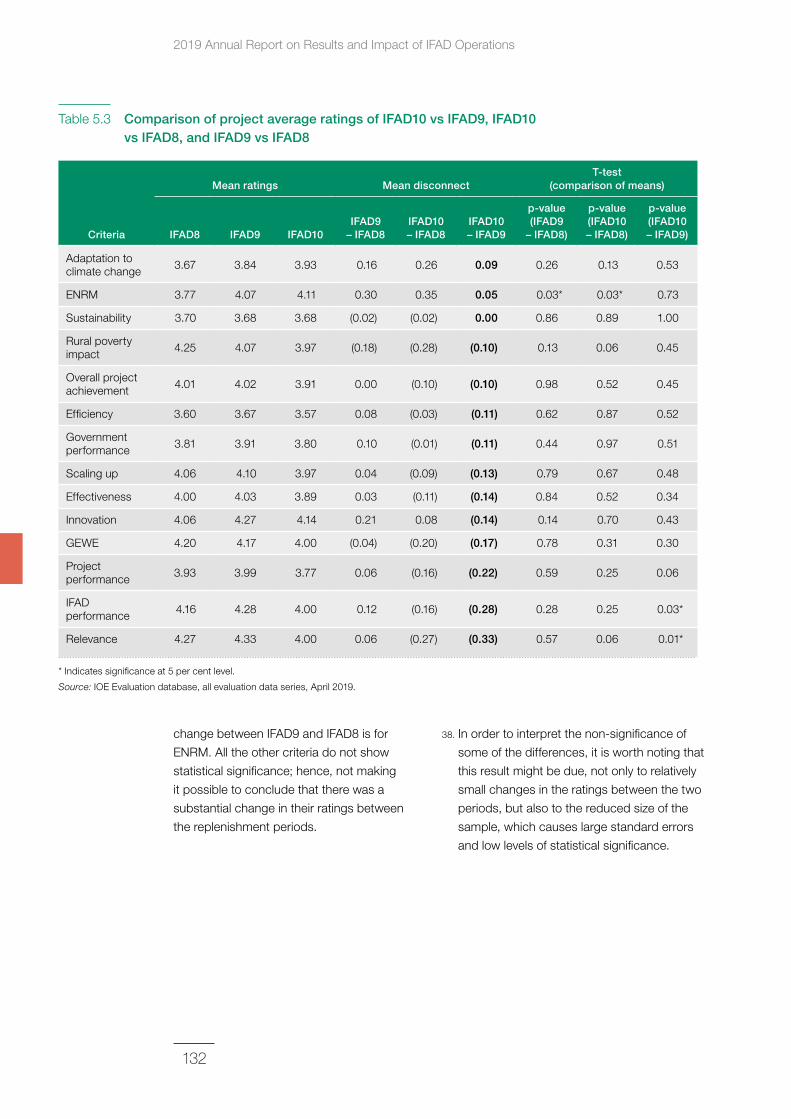
2019 Annual Report on Results and Impact of IFAD Operations
132
change between IFAD9 and IFAD8 is for
ENRM. All the other criteria do not show
statistical significance; hence, not making
it possible to conclude that there was a
substantial change in their ratings between
the replenishment periods.
38. In order to interpret the non-significance of
some of the differences, it is worth noting that
this result might be due, not only to relatively
small changes in the ratings between the two
periods, but also to the reduced size of the
sample, which causes large standard errors
and low levels of statistical significance.
Table 5.3 Comparison of project average ratings of IFAD10 vs IFAD9, IFAD10 vs IFAD8, and IFAD9 vs IFAD8
Criteria
Mean ratings Mean disconnectT‑test
(comparison of means)
IFAD8 IFAD9 IFAD10IFAD9
– IFAD8IFAD10 – IFAD8
IFAD10 – IFAD9
p‑value (IFAD9
– IFAD8)
p‑value (IFAD10 – IFAD8)
p‑value (IFAD10 – IFAD9)
Adaptation to climate change 3.67 3.84 3.93 0.16 0.26 0.09 0.26 0.13 0.53
ENRM 3.77 4.07 4.11 0.30 0.35 0.05 0.03* 0.03* 0.73
Sustainability 3.70 3.68 3.68 (0.02) (0.02) 0.00 0.86 0.89 1.00
Rural poverty impact 4.25 4.07 3.97 (0.18) (0.28) (0.10) 0.13 0.06 0.45
Overall project achievement 4.01 4.02 3.91 0.00 (0.10) (0.10) 0.98 0.52 0.45
Efficiency 3.60 3.67 3.57 0.08 (0.03) (0.11) 0.62 0.87 0.52
Government performance 3.81 3.91 3.80 0.10 (0.01) (0.11) 0.44 0.97 0.51
Scaling up 4.06 4.10 3.97 0.04 (0.09) (0.13) 0.79 0.67 0.48
Effectiveness 4.00 4.03 3.89 0.03 (0.11) (0.14) 0.84 0.52 0.34
Innovation 4.06 4.27 4.14 0.21 0.08 (0.14) 0.14 0.70 0.43
GEWE 4.20 4.17 4.00 (0.04) (0.20) (0.17) 0.78 0.31 0.30
Project performance 3.93 3.99 3.77 0.06 (0.16) (0.22) 0.59 0.25 0.06
IFAD performance 4.16 4.28 4.00 0.12 (0.16) (0.28) 0.28 0.25 0.03*
Relevance 4.27 4.33 4.00 0.06 (0.27) (0.33) 0.57 0.06 0.01*
* Indicates significance at 5 per cent level.
Source: IOE Evaluation database, all evaluation data series, April 2019.
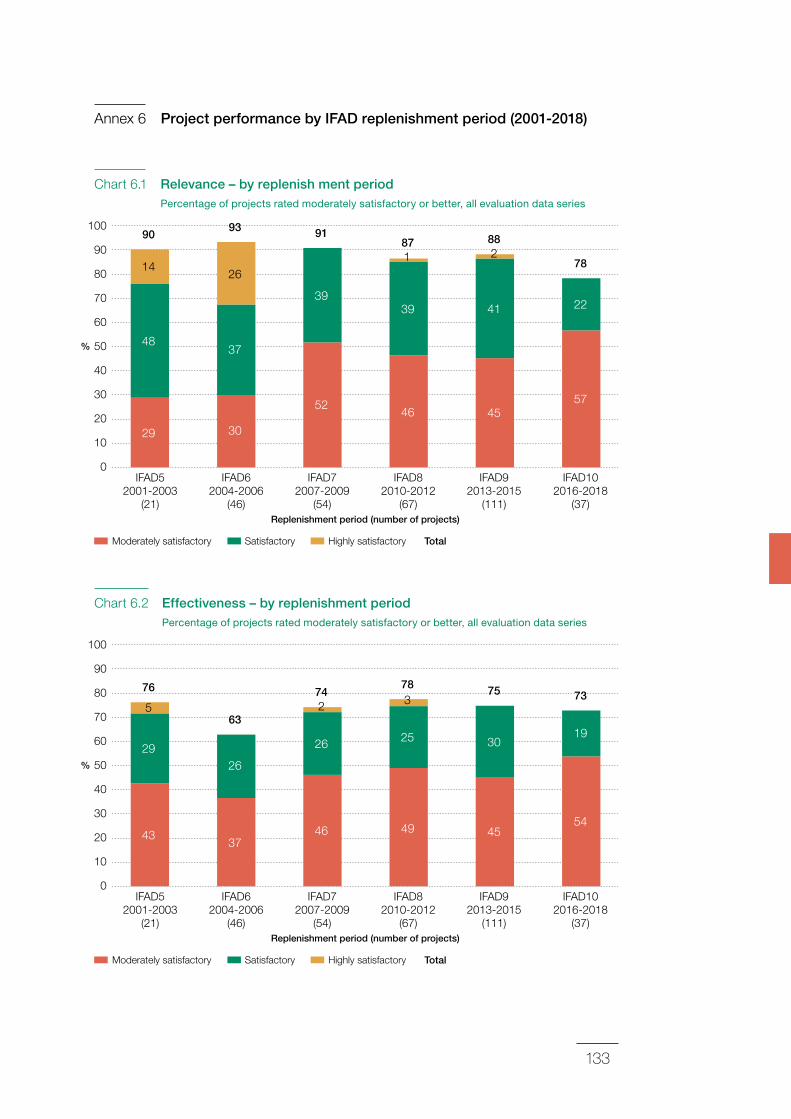
133
Annex 6 Project performance by IFAD replenishment period (2001‑2018)
Chart 6.2 Effectiveness – by replenishment period Percentage of projects rated moderately satisfactory or better, all evaluation data series
0
10
100
20
30
40
50
60
70
80
90
%
IFAD52001-2003
(21)
IFAD62004-2006
(46)
IFAD72007-2009
(54)
IFAD82010-2012
(67)
IFAD102016-2018
(37)
IFAD92013-2015
(111)Replenishment period (number of projects)
Moderately satisfactory Satisfactory Highly satisfactory Total
48
14
29
90
37
26
30
93
39
2
52
91
39
46
41
45
88
187
22
57
78
0
10
100
20
30
40
50
60
70
80
90
%
IFAD52001-2003
(21)
IFAD62004-2006
(46)
IFAD72007-2009
(54)
IFAD82010-2012
(67)
IFAD102016-2018
(37)
IFAD92013-2015
(111)Replenishment period (number of projects)
Moderately satisfactory Satisfactory Highly satisfactory Total
29
5
43
76
26
37
63
26
46
25
49
30
45
75274
378
19
54
73
Chart 6.1 Relevance – by replenish ment period Percentage of projects rated moderately satisfactory or better, all evaluation data series
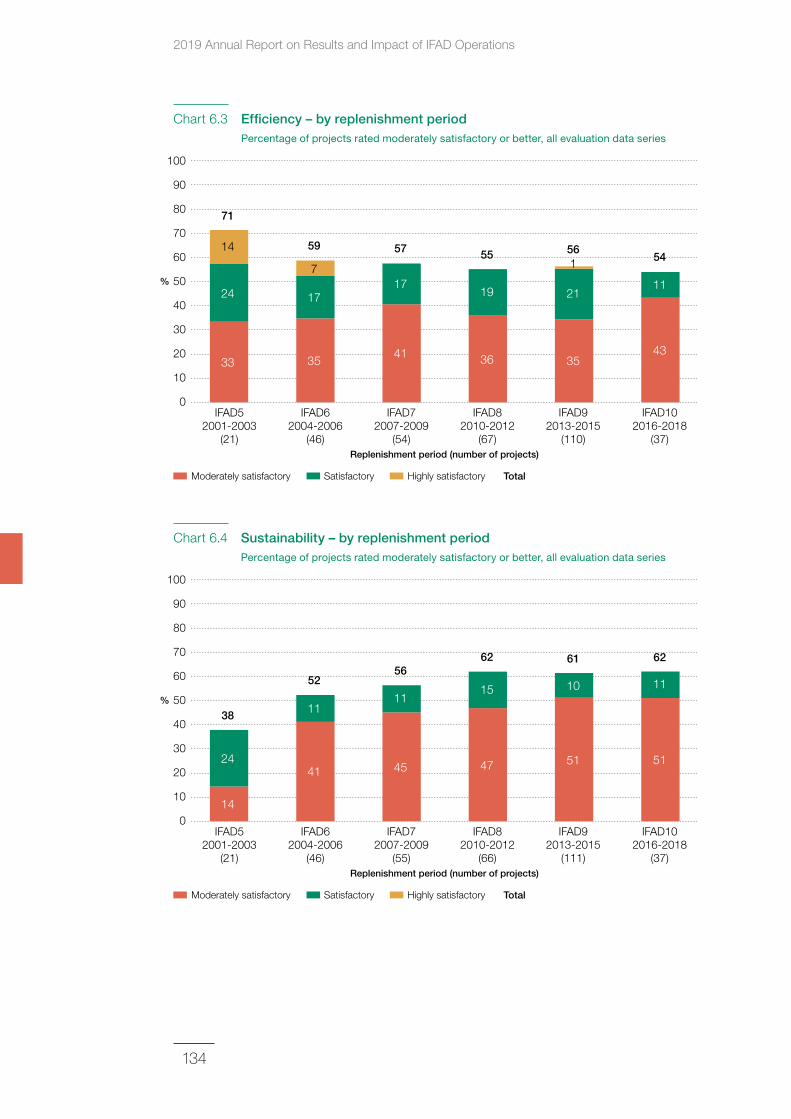
2019 Annual Report on Results and Impact of IFAD Operations
134
Chart 6.4 Sustainability – by replenishment period Percentage of projects rated moderately satisfactory or better, all evaluation data series
0
10
100
20
30
40
50
60
70
80
90
%
IFAD52001-2003
(21)
IFAD62004-2006
(46)
IFAD72007-2009
(54)
IFAD82010-2012
(67)
IFAD102016-2018
(37)
IFAD92013-2015
(110)Replenishment period (number of projects)
Moderately satisfactory Satisfactory Highly satisfactory Total
24
14
33
71
17
7
35
59
17
41
57
19
36
21
35
15655
11
43
54
0
10
100
20
30
40
50
60
70
80
90
%
IFAD52001-2003
(21)
IFAD62004-2006
(46)
IFAD72007-2009
(55)
IFAD82010-2012
(66)
IFAD102016-2018
(37)
IFAD92013-2015
(111)Replenishment period (number of projects)
Moderately satisfactory Satisfactory Highly satisfactory Total
24
14
3811
41
52
11
45
56
15
47
10
51
6162
11
51
62
Chart 6.3 Efficiency – by replenishment period Percentage of projects rated moderately satisfactory or better, all evaluation data series
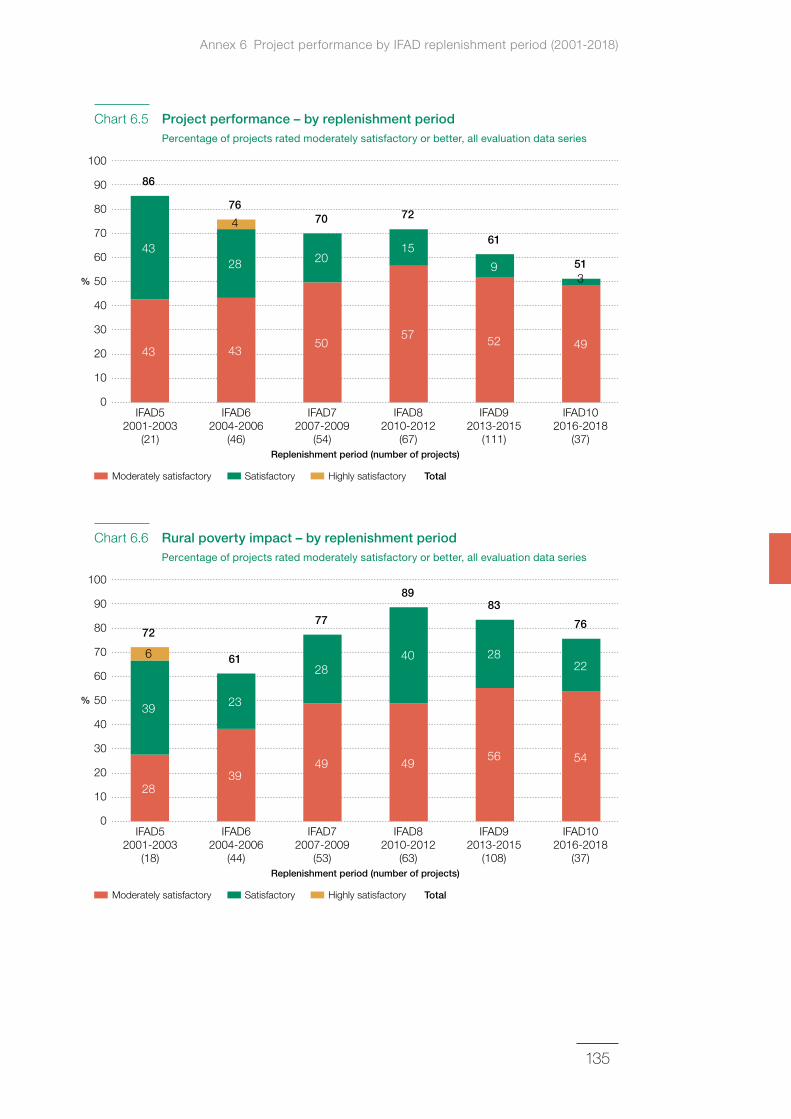
135
Chart 6.6 Rural poverty impact – by replenishment period Percentage of projects rated moderately satisfactory or better, all evaluation data series
0
10
100
20
30
40
50
60
70
80
90
%
IFAD52001-2003
(21)
IFAD62004-2006
(46)
IFAD72007-2009
(54)
IFAD82010-2012
(67)
IFAD102016-2018
(37)
IFAD92013-2015
(111)Replenishment period (number of projects)
Moderately satisfactory Satisfactory Highly satisfactory Total
43
43
86
28
4
43
76
20
50
70
15
57
9
52
61
72
3
49
51
0
10
100
20
30
40
50
60
70
80
90
%
IFAD52001-2003
(18)
IFAD62004-2006
(44)
IFAD72007-2009
(53)
IFAD82010-2012
(63)
IFAD102016-2018
(37)
IFAD92013-2015
(108)Replenishment period (number of projects)
Moderately satisfactory Satisfactory Highly satisfactory Total
39
6
28
72
23
39
6128
49
77
40
49
28
56
8389
22
54
76
Chart 6.5 Project performance – by replenishment period Percentage of projects rated moderately satisfactory or better, all evaluation data series
Annex 6 Project performance by IFAD replenishment period (2001-2018)
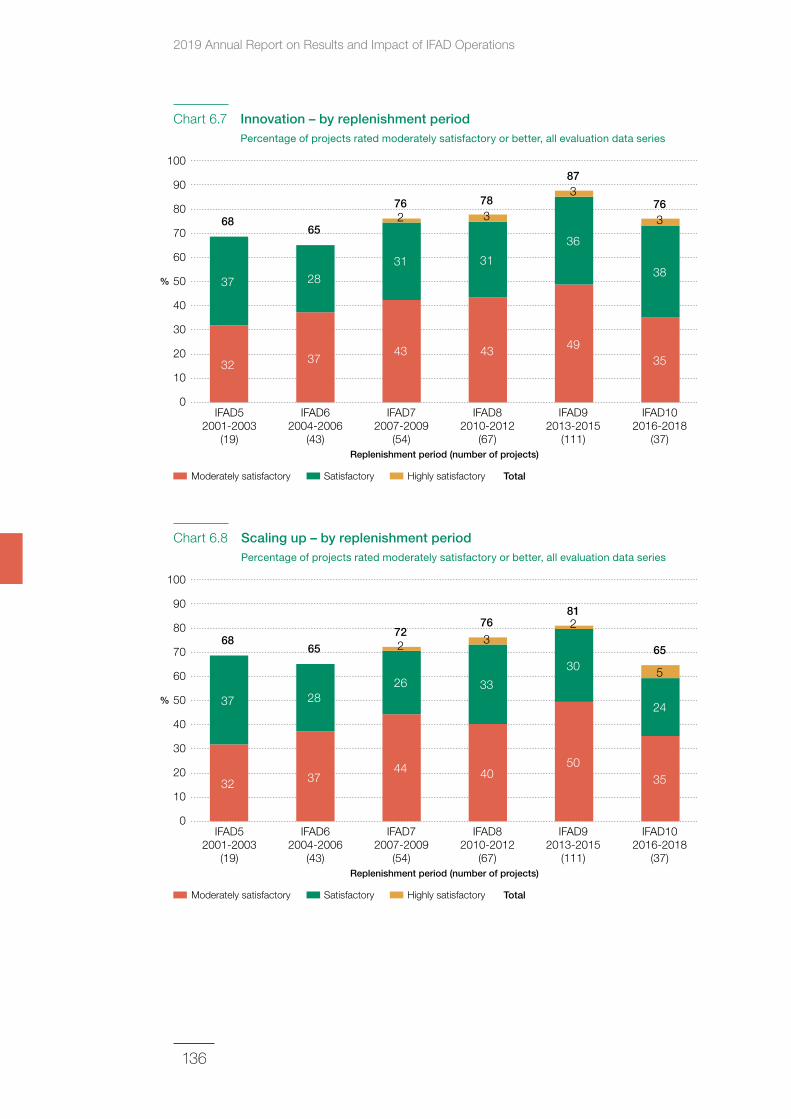
2019 Annual Report on Results and Impact of IFAD Operations
136
Chart 6.8 Scaling up – by replenishment period Percentage of projects rated moderately satisfactory or better, all evaluation data series
0
10
100
20
30
40
50
60
70
80
90
%
IFAD52001-2003
(19)
IFAD62004-2006
(43)
IFAD72007-2009
(54)
IFAD82010-2012
(67)
IFAD102016-2018
(37)
IFAD92013-2015
(111)Replenishment period (number of projects)
Moderately satisfactory Satisfactory Highly satisfactory Total
37
32
68
28
37
65
31
3
3
43
31
43
36
49
87
276
378
38
35
76
0
10
100
20
30
40
50
60
70
80
90
%
IFAD52001-2003
(19)
IFAD62004-2006
(43)
IFAD72007-2009
(54)
IFAD82010-2012
(67)
IFAD102016-2018
(37)
IFAD92013-2015
(111)Replenishment period (number of projects)
Moderately satisfactory Satisfactory Highly satisfactory Total
37
32
68
28
37
65
26
2
5
44
33
40
30
50
81
272
376
24
35
65
Chart 6.7 Innovation – by replenishment period Percentage of projects rated moderately satisfactory or better, all evaluation data series
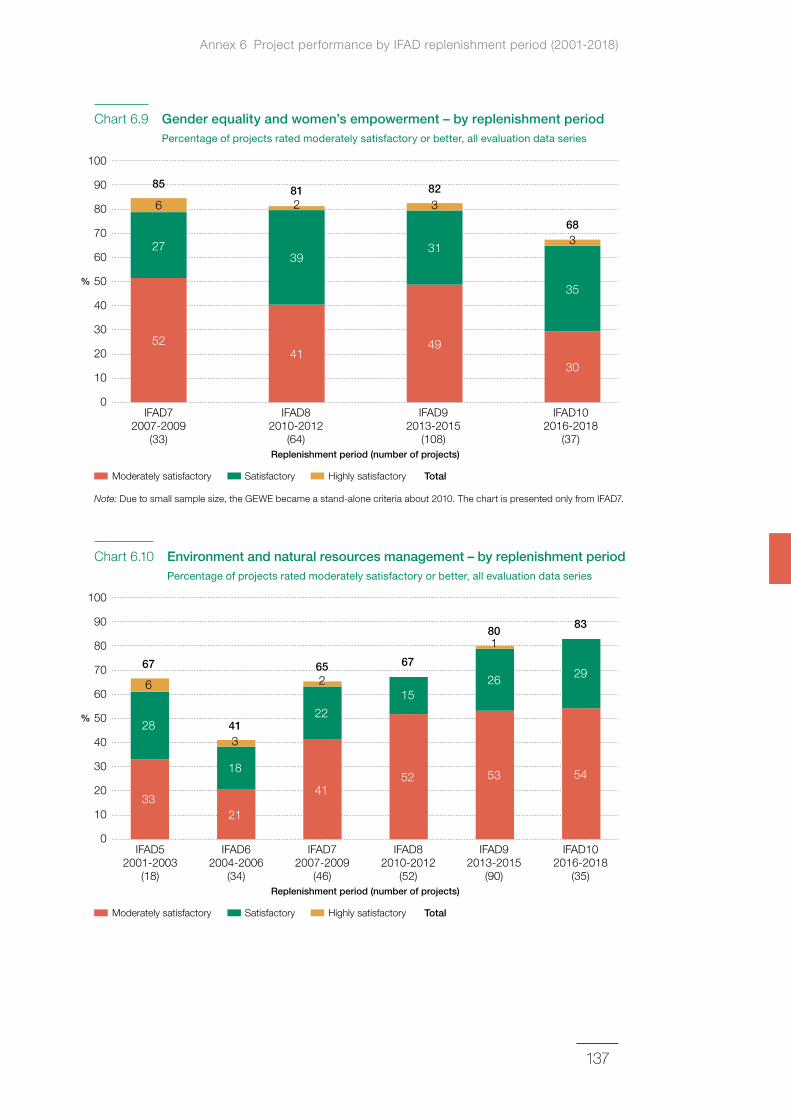
137
Chart 6.10 Environment and natural resources management – by replenishment period Percentage of projects rated moderately satisfactory or better, all evaluation data series
0
10
100
20
30
40
50
60
70
80
90
%
IFAD72007-2009
(33)
IFAD82010-2012
(64)
IFAD102016-2018
(37)
IFAD92013-2015
(108)Replenishment period (number of projects)
Moderately satisfactory Satisfactory Highly satisfactory Total
52
27
41
39
49
31
30
35
368
281
6
85
382
0
10
100
20
30
40
50
60
70
80
90
%
IFAD52001-2003
(18)
IFAD62004-2006
(34)
IFAD72007-2009
(46)
IFAD82010-2012
(52)
IFAD102016-2018
(35)
IFAD92013-2015
(90)Replenishment period (number of projects)
Moderately satisfactory Satisfactory Highly satisfactory Total
28
6
33
67
18
3
21
4122
41
65
15
52
26
53
180
2
6729
54
83
Chart 6.9 Gender equality and women’s empowerment – by replenishment period Percentage of projects rated moderately satisfactory or better, all evaluation data series
Note: Due to small sample size, the GEWE became a stand-alone criteria about 2010. The chart is presented only from IFAD7.
Annex 6 Project performance by IFAD replenishment period (2001-2018)
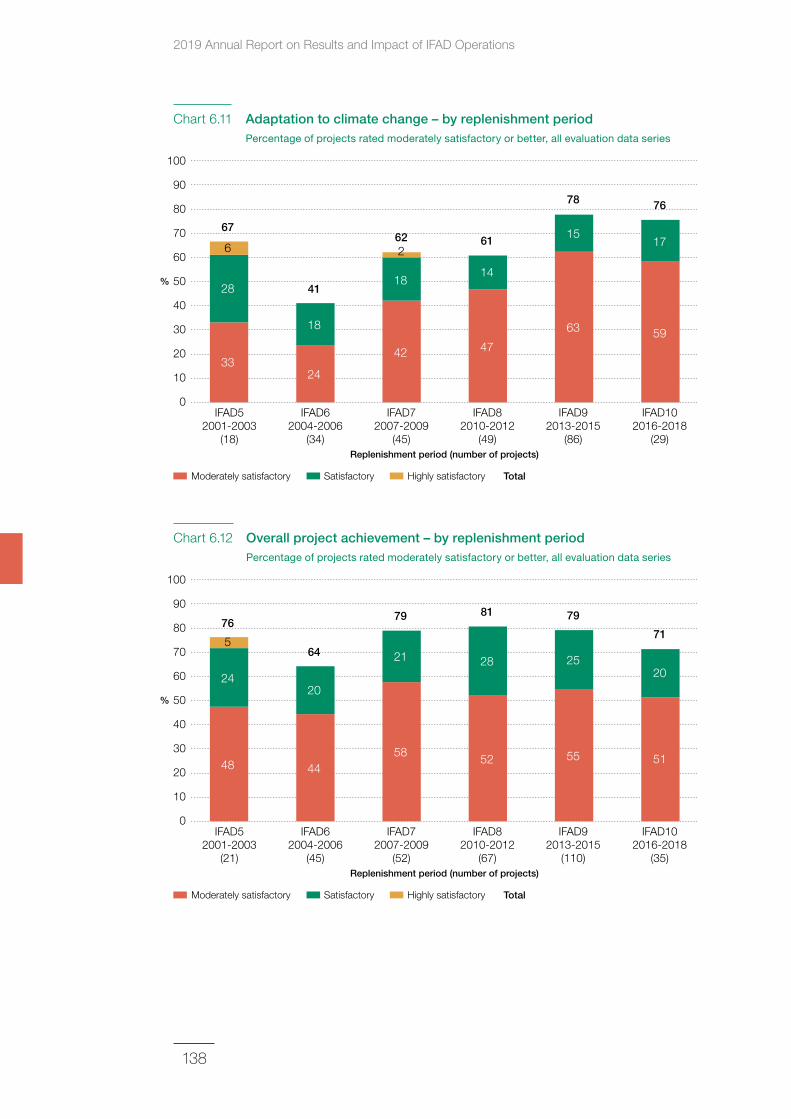
2019 Annual Report on Results and Impact of IFAD Operations
138
Chart 6.12 Overall project achievement – by replenishment period Percentage of projects rated moderately satisfactory or better, all evaluation data series
0
10
100
20
30
40
50
60
70
80
90
%
IFAD52001-2003
(18)
IFAD62004-2006
(34)
IFAD72007-2009
(45)
IFAD82010-2012
(49)
IFAD102016-2018
(29)
IFAD92013-2015
(86)Replenishment period (number of projects)
Moderately satisfactory Satisfactory Highly satisfactory Total
28
6
33
67
18
24
4118
42
62
14
47
15
63
78
261 17
59
76
0
10
100
20
30
40
50
60
70
80
90
%
IFAD52001-2003
(21)
IFAD62004-2006
(45)
IFAD72007-2009
(52)
IFAD82010-2012
(67)
IFAD102016-2018
(35)
IFAD92013-2015
(110)Replenishment period (number of projects)
Moderately satisfactory Satisfactory Highly satisfactory Total
24
5
48
76
20
44
64 21
58
79
28
52
25
55
7981
20
51
71
Chart 6.11 Adaptation to climate change – by replenishment period Percentage of projects rated moderately satisfactory or better, all evaluation data series
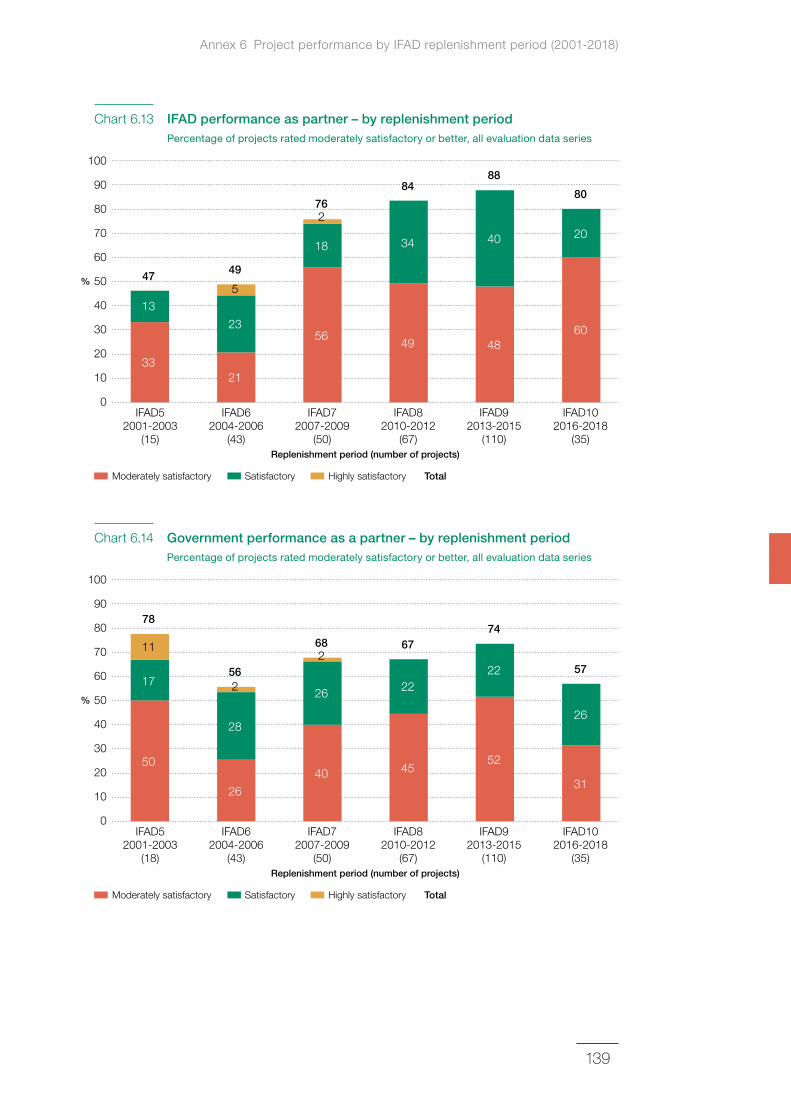
139
0
10
100
20
30
40
50
60
70
80
90
%
IFAD52001-2003
(15)
IFAD62004-2006
(43)
IFAD72007-2009
(50)
IFAD82010-2012
(67)
IFAD102016-2018
(35)
IFAD92013-2015
(110)Replenishment period (number of projects)
Moderately satisfactory Satisfactory Highly satisfactory Total
13
33
47
23
5
21
49
18
56
76
34
49
40
48
88
2
84
20
60
80
Chart 6.14 Government performance as a partner – by replenishment period Percentage of projects rated moderately satisfactory or better, all evaluation data series
0
10
100
20
30
40
50
60
70
80
90
%
IFAD52001-2003
(18)
IFAD62004-2006
(43)
IFAD72007-2009
(50)
IFAD82010-2012
(67)
IFAD102016-2018
(35)
IFAD92013-2015
(110)Replenishment period (number of projects)
Moderately satisfactory Satisfactory Highly satisfactory Total
17
11
50
78
28
2
26
56
26
40
68
22
45
22
52
74
267
26
31
57
Chart 6.13 IFAD performance as partner – by replenishment period Percentage of projects rated moderately satisfactory or better, all evaluation data series
Annex 6 Project performance by IFAD replenishment period (2001-2018)
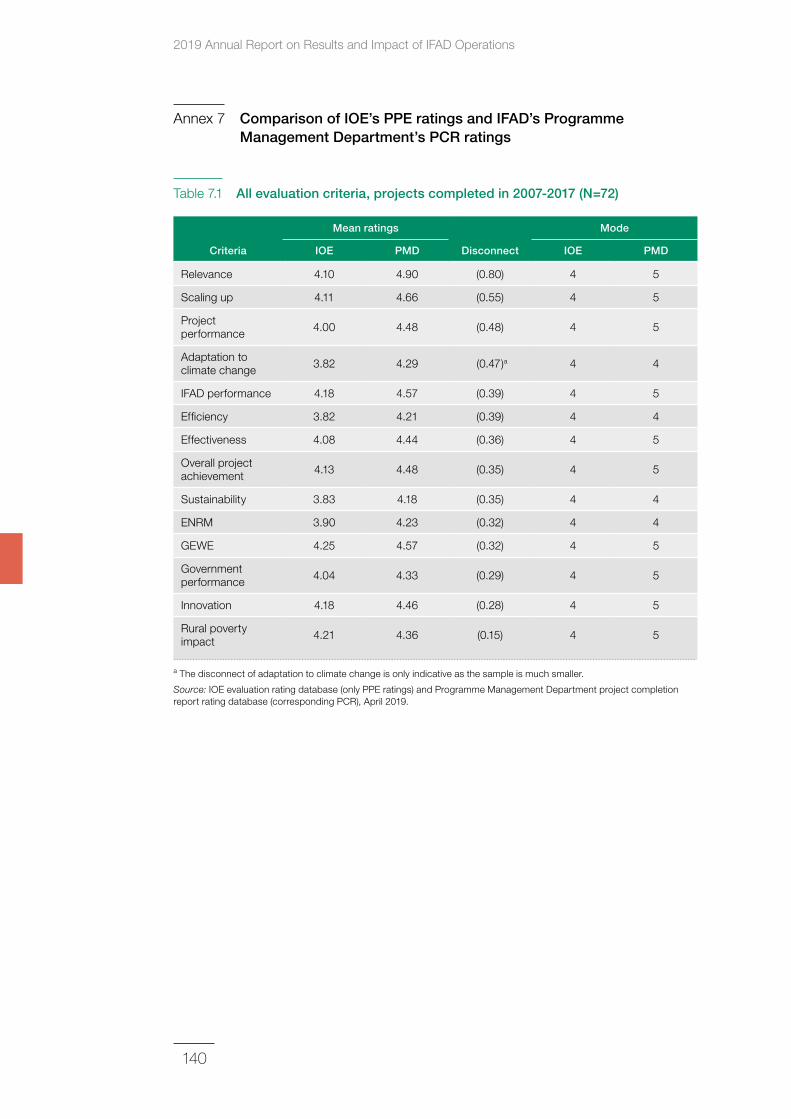
2019 Annual Report on Results and Impact of IFAD Operations
140
Annex 7 Comparison of IOE’s PPE ratings and IFAD’s Programme Management Department’s PCR ratings
Table 7.1 All evaluation criteria, projects completed in 2007‑2017 (N=72)
Criteria
Mean ratings
Disconnect
Mode
IOE PMD IOE PMD
Relevance 4.10 4.90 (0.80) 4 5
Scaling up 4.11 4.66 (0.55) 4 5
Project performance 4.00 4.48 (0.48) 4 5
Adaptation to climate change 3.82 4.29 (0.47)a 4 4
IFAD performance 4.18 4.57 (0.39) 4 5
Efficiency 3.82 4.21 (0.39) 4 4
Effectiveness 4.08 4.44 (0.36) 4 5
Overall project achievement 4.13 4.48 (0.35) 4 5
Sustainability 3.83 4.18 (0.35) 4 4
ENRM 3.90 4.23 (0.32) 4 4
GEWE 4.25 4.57 (0.32) 4 5
Government performance 4.04 4.33 (0.29) 4 5
Innovation 4.18 4.46 (0.28) 4 5
Rural poverty impact 4.21 4.36 (0.15) 4 5
a The disconnect of adaptation to climate change is only indicative as the sample is much smaller.
Source: IOE evaluation rating database (only PPE ratings) and Programme Management Department project completion report rating database (corresponding PCR), April 2019.
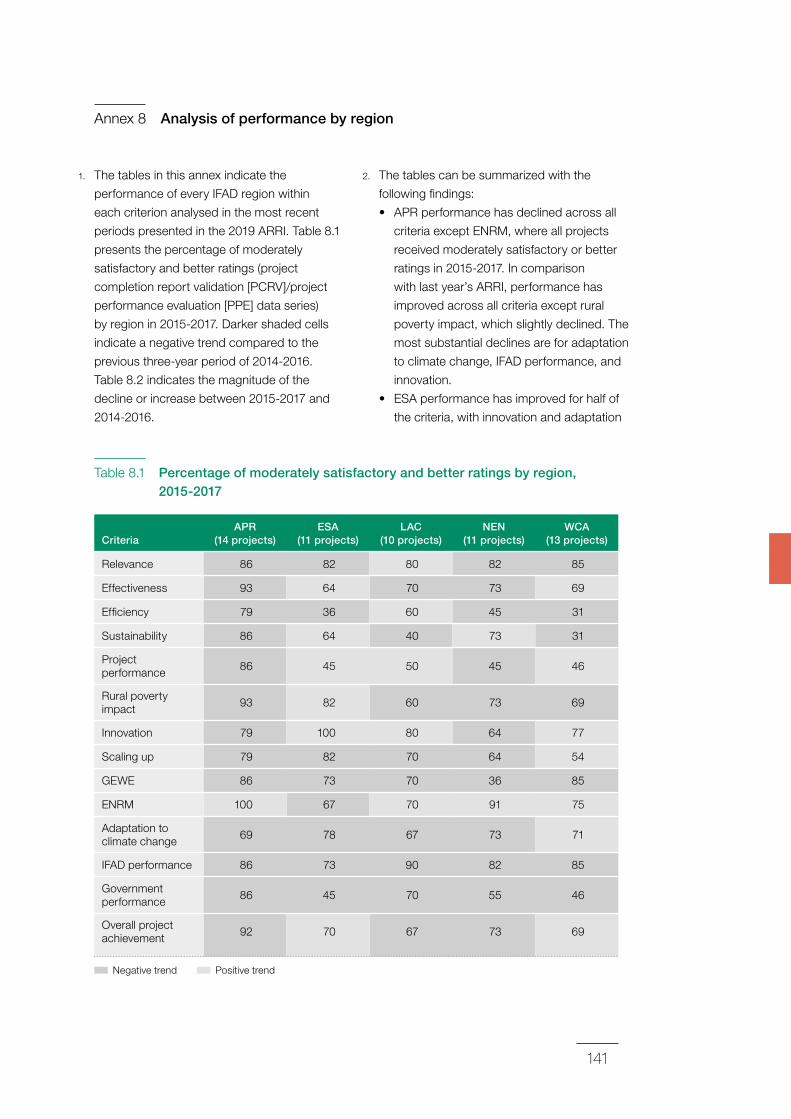
141
Annex 8 Analysis of performance by region
1. The tables in this annex indicate the
performance of every IFAD region within
each criterion analysed in the most recent
periods presented in the 2019 ARRI. Table 8.1
presents the percentage of moderately
satisfactory and better ratings (project
completion report validation [PCRV]/project
performance evaluation [PPE] data series)
by region in 2015-2017. Darker shaded cells
indicate a negative trend compared to the
previous three-year period of 2014-2016.
Table 8.2 indicates the magnitude of the
decline or increase between 2015-2017 and
2014-2016.
2. The tables can be summarized with the
following findings:
• APR performance has declined across all
criteria except ENRM, where all projects
received moderately satisfactory or better
ratings in 2015-2017. In comparison
with last year’s ARRI, performance has
improved across all criteria except rural
poverty impact, which slightly declined. The
most substantial declines are for adaptation
to climate change, IFAD performance, and
innovation.
• ESA performance has improved for half of
the criteria, with innovation and adaptation
Table 8.1 Percentage of moderately satisfactory and better ratings by region, 2015‑2017
CriteriaAPR
(14 projects)ESA
(11 projects)LAC
(10 projects)NEN
(11 projects)WCA
(13 projects)
Relevance 86 82 80 82 85
Effectiveness 93 64 70 73 69
Efficiency 79 36 60 45 31
Sustainability 86 64 40 73 31
Project performance 86 45 50 45 46
Rural poverty impact 93 82 60 73 69
Innovation 79 100 80 64 77
Scaling up 79 82 70 64 54
GEWE 86 73 70 36 85
ENRM 100 67 70 91 75
Adaptation to climate change 69 78 67 73 71
IFAD performance 86 73 90 82 85
Government performance 86 45 70 55 46
Overall project achievement 92 70 67 73 69
Negative trend Positive trend
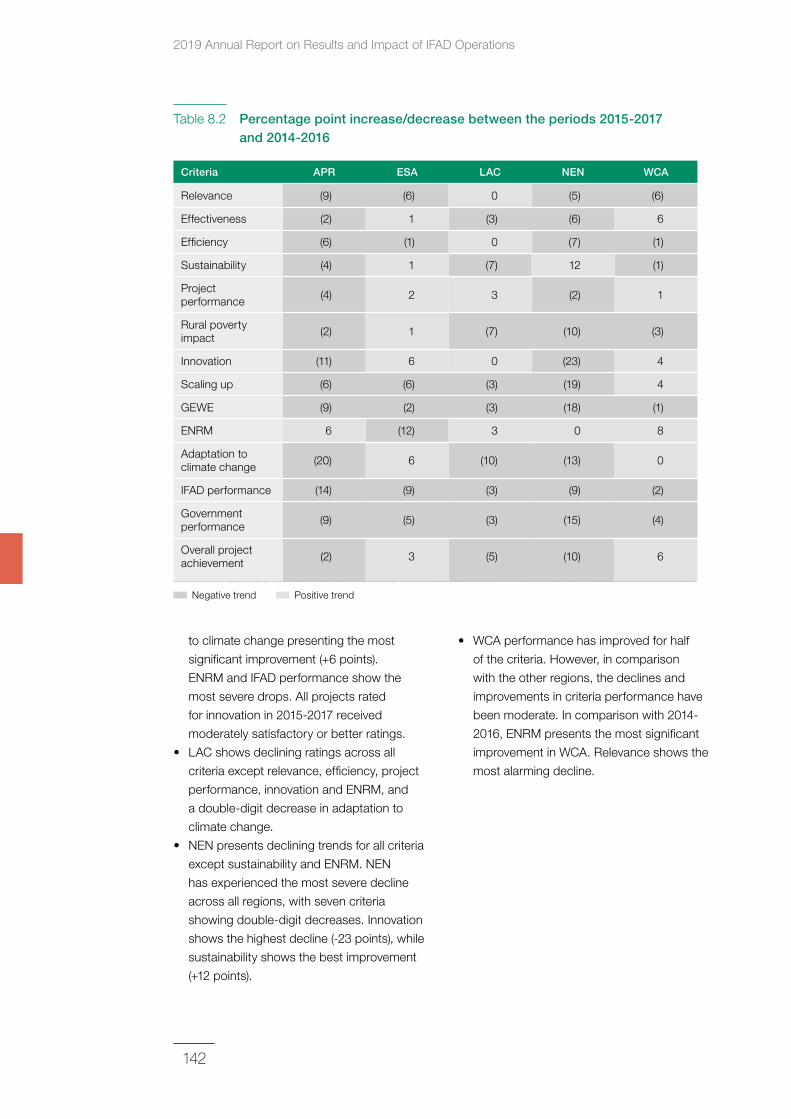
2019 Annual Report on Results and Impact of IFAD Operations
142
to climate change presenting the most
significant improvement (+6 points).
ENRM and IFAD performance show the
most severe drops. All projects rated
for innovation in 2015-2017 received
moderately satisfactory or better ratings.
• LAC shows declining ratings across all
criteria except relevance, efficiency, project
performance, innovation and ENRM, and
a double-digit decrease in adaptation to
climate change.
• NEN presents declining trends for all criteria
except sustainability and ENRM. NEN
has experienced the most severe decline
across all regions, with seven criteria
showing double-digit decreases. Innovation
shows the highest decline (-23 points), while
sustainability shows the best improvement
(+12 points).
• WCA performance has improved for half
of the criteria. However, in comparison
with the other regions, the declines and
improvements in criteria performance have
been moderate. In comparison with 2014-
2016, ENRM presents the most significant
improvement in WCA. Relevance shows the
most alarming decline.
Table 8.2 Percentage point increase/decrease between the periods 2015‑2017 and 2014‑2016
Criteria APR ESA LAC NEN WCA
Relevance (9) (6) 0 (5) (6)
Effectiveness (2) 1 (3) (6) 6
Efficiency (6) (1) 0 (7) (1)
Sustainability (4) 1 (7) 12 (1)
Project performance (4) 2 3 (2) 1
Rural poverty impact (2) 1 (7) (10) (3)
Innovation (11) 6 0 (23) 4
Scaling up (6) (6) (3) (19) 4
GEWE (9) (2) (3) (18) (1)
ENRM 6 (12) 3 0 8
Adaptation to climate change (20) 6 (10) (13) 0
IFAD performance (14) (9) (3) (9) (2)
Government performance (9) (5) (3) (15) (4)
Overall project achievement (2) 3 (5) (10) 6
Negative trend Positive trend
143
Annex 9 Response of IFAD Management to the 2019 Annual Report on Results and Impact of IFAD Operations
Introduction
1. Management welcomes the 2019 Annual
Report on Results and Impact of IFAD
Operations (ARRI), and finds most of the
recommendations balanced, intuitive and in
line with Management’s own thinking. While
the actions proposed by the Independent
Office of Evaluation of IFAD (IOE) have already
been identified by Management as part of the
commitments to the Eleventh Replenishment
of IFAD’s Resources (IFAD11), Management
will continue to strengthen efforts in these
areas as a result of the analysis and
recommendations presented in the ARRI.
2. Although it appreciates the candidness of the
ARRI and the in-depth analysis of the 2019
dataset, Management has reservations about the
methodology and analysis in two areas. The first
relates to the data and methodological limitations
of the ARRI, including the small sample size
and the lack of statistical significance of
the reported changes in performance. The
second concerns performance trends and the
factors the ARRI cites as driving these trends –
particularly in the Tenth Replenishment of
IFAD’s Resources (IFAD10). Management’s
detailed views on these issues are presented
in the sections below (Data and methodology,
and Overall performance trends).
3. The ARRI, the Report on IFAD’s Development
Effectiveness (RIDE) and the President’s
Report on the Implementation Status
of Evaluation Recommendations and
Management Actions (PRISMA) are
complementary but distinct tools within
the organization’s evaluation architecture
designed to further the Fund’s effectiveness,
transparency and credibility.
4. As evaluation is undertaken after project
closure, the 2019 ARRI has aggregated
ratings from projects that closed between
2007 and 2017, with a focus on three-year
rolling averages from 2015 to 2017 (based
on 59 completed projects) and the first two
years of IFAD10 (37 completed projects in
2016 and 2017). It has focused its qualitative
analysis on 41 new evaluations, including
project completion report validations, project
performance evaluations, impact evaluations,
and country strategy and programme
evaluations (CSPEs) conducted in the past
year. As noted in the ARRI, trends and ratings
are based on projects that were designed
about one decade ago or more, and the
report does not take into account recently
designed projects, ongoing projects or those
completed in the last year of IFAD10. The RIDE
contains a full holistic performance report
of the IFAD10 period, including data from
rigorous impact assessments, ratings from
all projects closed in IFAD10 (98 projects),
disbursement ratios, cofinancing, ratings
at design, and metrics of institutional
performance across a range of indicators.
Data and methodology
5. As mentioned by Management as a limitation
in the RIDE, sample size matters because
a small number of projects can have a
disproportionately large impact on results
presented as percentages. The sample size
in the ARRI is less than half that included
by Management in the RIDE. The ARRI’s
2015-2017 sample is based on 59 completed
projects compared to 113 in Management’s
sample. In addition, IOE’s IFAD10 sample is
based on 37 projects from 2016 and 2017
only, whereas Management’s sample in the
RIDE covers the entire IFAD10 period (2016-
2018) and is based on 98 projects. Therefore,
it would be helpful for the ARRI to: present the
analysis in terms of numbers and percentages,
as was done in the RIDE; and cite the number
of cases on which the qualitative analysis
is based. While performance has declined
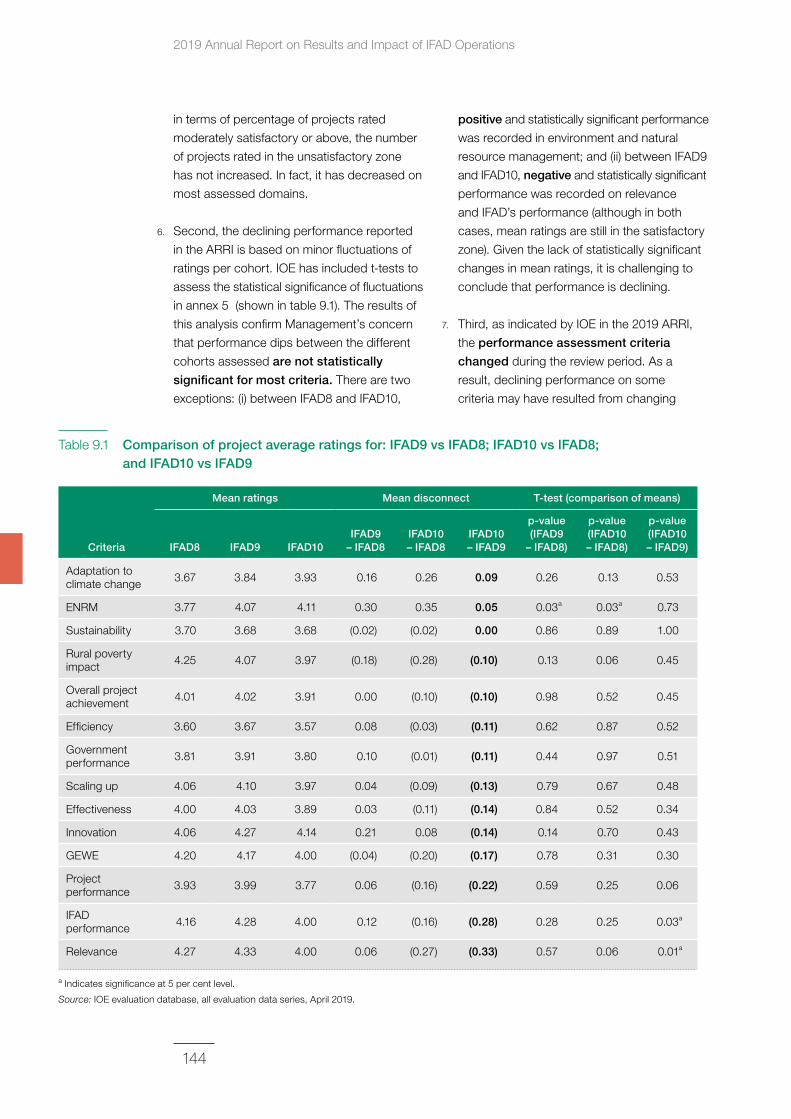
2019 Annual Report on Results and Impact of IFAD Operations
144
in terms of percentage of projects rated
moderately satisfactory or above, the number
of projects rated in the unsatisfactory zone
has not increased. In fact, it has decreased on
most assessed domains.
6. Second, the declining performance reported
in the ARRI is based on minor fluctuations of
ratings per cohort. IOE has included t-tests to
assess the statistical significance of fluctuations
in annex 5 (shown in table 9.1). The results of
this analysis confirm Management’s concern
that performance dips between the different
cohorts assessed are not statistically
significant for most criteria. There are two
exceptions: (i) between IFAD8 and IFAD10,
positive and statistically significant performance
was recorded in environment and natural
resource management; and (ii) between IFAD9
and IFAD10, negative and statistically significant
performance was recorded on relevance
and IFAD’s performance (although in both
cases, mean ratings are still in the satisfactory
zone). Given the lack of statistically significant
changes in mean ratings, it is challenging to
conclude that performance is declining.
7. Third, as indicated by IOE in the 2019 ARRI,
the performance assessment criteria
changed during the review period. As a
result, declining performance on some
criteria may have resulted from changing
Table 9.1 Comparison of project average ratings for: IFAD9 vs IFAD8; IFAD10 vs IFAD8; and IFAD10 vs IFAD9
Criteria
Mean ratings Mean disconnect T‑test (comparison of means)
IFAD8 IFAD9 IFAD10IFAD9
– IFAD8IFAD10 – IFAD8
IFAD10 – IFAD9
p‑value (IFAD9
– IFAD8)
p‑value (IFAD10 – IFAD8)
p‑value (IFAD10 – IFAD9)
Adaptation to climate change 3.67 3.84 3.93 0.16 0.26 0.09 0.26 0.13 0.53
ENRM 3.77 4.07 4.11 0.30 0.35 0.05 0.03a 0.03a 0.73
Sustainability 3.70 3.68 3.68 (0.02) (0.02) 0.00 0.86 0.89 1.00
Rural poverty impact 4.25 4.07 3.97 (0.18) (0.28) (0.10) 0.13 0.06 0.45
Overall project achievement 4.01 4.02 3.91 0.00 (0.10) (0.10) 0.98 0.52 0.45
Efficiency 3.60 3.67 3.57 0.08 (0.03) (0.11) 0.62 0.87 0.52
Government performance 3.81 3.91 3.80 0.10 (0.01) (0.11) 0.44 0.97 0.51
Scaling up 4.06 4.10 3.97 0.04 (0.09) (0.13) 0.79 0.67 0.48
Effectiveness 4.00 4.03 3.89 0.03 (0.11) (0.14) 0.84 0.52 0.34
Innovation 4.06 4.27 4.14 0.21 0.08 (0.14) 0.14 0.70 0.43
GEWE 4.20 4.17 4.00 (0.04) (0.20) (0.17) 0.78 0.31 0.30
Project performance 3.93 3.99 3.77 0.06 (0.16) (0.22) 0.59 0.25 0.06
IFAD performance 4.16 4.28 4.00 0.12 (0.16) (0.28) 0.28 0.25 0.03a
Relevance 4.27 4.33 4.00 0.06 (0.27) (0.33) 0.57 0.06 0.01a
a Indicates significance at 5 per cent level.
Source: IOE evaluation database, all evaluation data series, April 2019.
145
assessment standards rather than changing
performance. Management would like to
highlight one such criterion – scaling up – in
which performance appeared to have declined
in recent years, and where the “disconnect”
between Management and IOE ratings was
greatest. In their harmonization agreement
(2017), Management and IOE agreed to move
from assessing potential for scaling up to
scaling up itself. While Management did
not retroactively apply the new assessment
measure to projects completed in 2017, IOE
did. As a result, the two indicators are not
comparable either between Management and
IOE, or within IOE’s own dataset.
8. Fourth, Management believes that the specific
rating of rural poverty impact, currently used
in both the ARRI and the IFAD10 Results
Management Framework (RMF), is not
a robust measure of the impact of IFAD-
supported projects. This is because calculating
attributable impact requires a counterfactual-
based analysis. Instead, the findings on
rural poverty impact presented in the ARRI
are based on ratings that rely heavily on
qualitative data. For this reason, Management
has decided not to include the rural poverty
impact indicator in the IFAD11 RMF, and will
assess impact solely through rigorous impact
assessments in each replenishment cycle.
Management looks forward to engaging
with IOE in revising this rating criterion
(and its subdomains) as a follow-up to the
harmonization agreement and in line with best
practices from comparator organizations.
Overall performance trends
9. Notwithstanding the limitations mentioned
above, particularly the results reported in the
statistical analysis, Management notes that
the performance trends reported in the 2019
ARRI are similar to those in the 2018 ARRI and
Management’s own analysis in the RIDE. For
example, both the ARRI and RIDE indicate
weaker project performance on efficiency and
sustainability compared to other domains. As
noted in both reports, there is a strong positive
correlation between government performance,
sustainability and efficiency.
10. While the ARRI identifies drivers of good and
weak performance in each of the assessed
domains based on a qualitative review
of evaluations, Management would have
appreciated a deeper and more differentiated
analysis of underlying constraints related to
regional or country context. Management’s
analysis in the RIDE shows that weaker
performance was concentrated in West
and Central Africa; and within that region, in
countries with fragile situations.
11. At the country programme level, Management
is pleased to note that IOE has adopted
Management’s suggestion to present ratings
from CSPEs as three-year rolling averages.
Given the very small cohort of CSPEs each year
(five CSPEs were conducted in very different
contexts and regions for the 2019 ARRI), there
may be merit in moving away from an analysis
of aggregate ratings in the ARRI, which would
be in line with suggestions in the peer review.
12. In addition, the ARRI notes that partnership-
building improved while knowledge
management and policy engagement
declined. Management would have liked to
understand better the “disconnect” between
these three seemingly related criteria. At the
same time, Management agrees that there
is room for improvement in the performance
of non-lending activities. Through a series of
interlinked IFAD11 commitments, including the
partnership framework, dedicated resources
for policy engagement, and the cofinancing
strategy and action plan, Management is laying
the foundations for more robust engagement
in non-lending activities at the country level.
Initial performance trends over the IFAD10
replenishment period
13. The new chapter on the IFAD10 replenishment
period, which utilizes a partial dataset (37 out
of 98 projects completed in 2016 and 2017)
presents mixed results, linking an apparent
Annex 9 Response of IFAD Management to the 2019 Annual Report on Results and Impact of IFAD Operations
2019 Annual Report on Results and Impact of IFAD Operations
146
decline in quality to a reduction in country
programme management budgets and
frequency of supervision and implementation
support missions. This is an area that interests
Management, but there are two concerns.
First, no empirical evidence was included
in the report to demonstrate the causal
link between declining performance and
a decline in budgets or supervision of the
assessed projects. Second, none of the
individual project evaluations on which the
ARRI is based included recommendations
to increase the supervision budget and
frequency of supervision missions. The most
recurrent recommendations (as reported in the
2019 PRISMA) were to make designs more
realistic and less complex, improve targeting
and address weak implementation capacities.
14. Nonetheless, Management fully agrees
that implementation support is critical,
and it has strengthened supervision and
implementation support through: the
decentralization of technical, financial and
operational staff; and closer monitoring of
the portfolio, including actions on potential or
actual problem projects. As noted in the 2019
RIDE, as a result of Management’s efforts to
promote proactivity in the portfolio, quality
has improved, with a decline in the number of
problem projects and overall improvement in
project performance ratings.
15. In conclusion, Management believes that
instead of the frequency of missions or budget
allocations, the ARRI could have benefited
from more analysis of the effectiveness of
design, supervision and implementation
support, and the causal links between these
and weaker performance.
Recommendations to Management
16. In addition to the concrete actions included
in the RIDE and PRISMA, Management’s
detailed responses to the recommendations of
the 2019 ARRI are provided in table 9.2.
Table 9.2 Recommendations to Management
IOE recommendation Management response
1. Dedicate more resources to country programme delivery – specifically project design, supervision and implementation – to achieve the improved quality needed for a “better” IFAD.
IFAD’s aim to become “bigger, better and smarter” appears ambitious based on results thus far. While IFAD managed to maintain a significantly higher ongoing programme of work since IFAD8, the decline in budgetary resources dedicated specifically to design, supervision and implementation may have affected its quality, with lower ratings across criteria in IFAD10. “Better” results also require high-quality technical expertise to support IFAD country programmes and projects. To improve quality standards, IFAD needs to plan and provide the commensurate resources directly to country programme management, design and implementation.
Partially agreed. Management dedicates sufficient budget to country programme delivery, particularly in challenging contexts such as fragile situations and for problem projects. All projects are mandated to have at least one full supervision mission per year, with additional implementation support as needed, and problem projects must have two supervision missions. In some cases, actual expenditures go beyond allocations due to changing circumstances and emerging requirements during implementation.
Management’s own analysis of country programme budgets does not show a decline – it shows an average increase in supervision budget allocation and utilization per project due to a decline in the number of active projects over time.
Management believes that the overall positive ratings of design in recent years by the Quality Assurance Group are contradictory to the conclusion that design quality has declined. Going forward, Management will ensure that the quality of design is not compromised while meeting the ambitious IFAD11 targets on timeliness of design.
However, Management agrees that strong design, supervision and implementation are vital, and looks forward to working closely with IOE on further analysis of resources dedicated to country programme delivery.
147
IOE recommendation Management response
2. Design IFAD‑funded programmes and projects according to country capacities based on sound institutional analysis to ensure the most appropriate implementation arrangements or country delivery.
For projects to be more relevant, they need to be appropriate to the country context and designed according to country capacities (including public, private and civil society institutions). This knowledge begins with sound institutional analysis during the country strategic opportunity programme (COSOP) or project design, the inclusion of capacity-strengthening components and support to rural institutions within the country.
Agreed. This recommendation is already being addressed through the updated COSOP guidelines. Country teams conduct institutional and risk assessments during COSOP preparation to contextualize IFAD’s support in the country. Based on country context, COSOP objectives are being set with an increased focus on implementation capacity and delivery, particularly in contexts where capacity is weaker. Management will monitor implementation of new COSOP guidelines and adjust them as necessary.
3. Develop government capacities to design and implement country programmes and projects in collaboration with other partners.
Government performance is critical to achieving development objectives and making positive impacts on rural poverty. In the short term, IFAD needs to provide more intensive implementation support, particularly in areas such as procurement and financial management. In the long term, IFAD can utilize its grant financing to work with other partners on strengthening the capacities of government institutions and project management units. Depending on the country and project, multi-donor project management units may be considered along with the greater involvement of government counterparts in project design and supervision and implementation support.
Agreed. As outlined in the development effectiveness framework and reiterated in the IFAD11 business model, there has been an important shift in the organization from being inward-oriented to outward-looking. As a result, during IFAD10, IFAD implemented three complementary initiatives to improve in-country capacities: the Programme in Rural Monitoring and Evaluation (M&E) (PRiME); Advancing Knowledge for Agricultural Impact; and Deliver. Together, these unique initiatives in the rural development sector provide holistic capacity-building support in delivery and M&E in-country. In addition, building on the PRiME model, initiatives are already under way to strengthen capacity in financial management and procurement. However, Management agrees that retaining trained project staff is challenging. Through new initiatives such as the Faster Implementation of Project Start-up facility, Management is working towards smoother transitions between projects to address capacity challenges.
4. Determine the need to adjust project designs earlier on in order to ensure their continued relevance to the country context.
Good project design is necessary but not sufficient to achieve development objectives. Project design should be viewed as a “living” blueprint that is reviewed and adjusted based on the context during implementation. Active supervision during start-up is needed to determine whether the project design needs to be adjusted even before the mid-term review. IFAD’s new restructuring policy should facilitate project redesign early on when necessary, and should not simply be used to close projects that are challenging but important for achieving IFAD’s mandate.
Agreed. Management agrees with IOE’s conclusion, which is aligned with findings presented in the RIDE. Through the Operational Results Management System (ORMS), projects are assessed on a range of indicators during implementation, including continued relevance, with key indicators used as risk flags to identify potential problems early on. IFAD’s recently approved restructuring policy provides the options necessary for country teams to adjust and reorient projects during implementation. Management will continue to focus on strengthening performance by ensuring that all problem projects have performance improvement plans that indicate the level of action required (and restructuring if needed), and are closely monitored.
Annex 9 Response of IFAD Management to the 2019 Annual Report on Results and Impact of IFAD Operations
2019 Annual Report on Results and Impact of IFAD Operations
148
Learning theme
17. Management acknowledges the two learning
themes – efficiency and quality of IFAD’s
supervision and implementation support –
proposed by IOE for the Executive Board’s
consideration, and believes that both are
relevant and important for IFAD’s operations.
However, Management is concerned that
understanding root causes and drivers of
project-level efficiency is complex, and may be
better suited to a different evaluation product
such as a thematic or cluster evaluation (as
recommended by the peer review). In addition,
while it is necessary to assess the quality
of IFAD’s supervision and implementation
support, this may be premature given
that Management is currently revising the
supervision and implementation support
guidelines. Therefore, Management would
appreciate sufficient time following these
revisions before they are evaluated.
IOE recommendation Management response
5. A more comprehensive and integrated system is required to mitigate risks in IFAD‑funded projects and programmes.
IFAD currently has a decentralized system for risk mitigation at various stages of the project cycle, with assessments conducted by different divisions. To ensure that identified risks are addressed appropriately and at the right time, IFAD needs to develop better linkages among the various assessments from project design to evaluation.
Agreed. An important part of the IFAD11 business model is enhancing the Fund’s risk architecture from the operational to the organizational level. Management has already taken a number of actions to lay the foundations for this, including the development of a risk dashboard and a new risk function in the Programme Management Department that works closely with the Enterprise Risk Management Committee. Currently, both COSOPs and projects have an integrated risk framework that can be tracked during implementation through ORMS.

Independent Office of Evaluation
International Fund for Agricultural Development
Via Paolo di Dono, 44 - 00142 Rome, ItalyTel: +39 06 54591 - Fax: +39 06 5043463E-mail: [email protected]/evaluation
www.twitter.com/IFADeval
www.youtube.com/IFADevaluation