2019-2020 - Lower Murray Water
21
2019-2020
Transcript of 2019-2020 - Lower Murray Water

2019-2020

*As at Dec 2nd 2019
Strategy LMW actions to balance supply and demand
Heightened awareness Public information and water wise events
Reduce demand for potable water
Target Your Water Use campaign Pursue integrated water management strategies Deliver Schools Education Program Drought Response Committee to monitor supply and demand Deliver the Community Housing Retrofit Program
Improve use of existing supplies
Invest in metering and analytics to better understand water usage Manage carryover of water to maximise system reliability
Alternative water sources Identify opportunities to utilise alternative water through the Integrated Water Management Forum
WATER OUTLOOK 2019-20
AT A GLANCE
SEASONAL ALLOCATION 42% LEVEL 2 WATER RESTRICTIONS
LEVEL 1 WATER RESTRICTIONS
LIKELIHOOD OF WATER RESTRICTIONS
DARTMOUTH DAM STORAGE
54% 2019/20 current* 75% 2018/19
LEVEL 3 WATER RESTRICTIONS
HUME DAM STORAGE
34% 2019/20 current* 42% 2018/19
PERMANENT WATER
SAVING RULES
LEVEL 4 WATER RESTRICTIONS
DEMAND IS SET TO INCREASE OVER TIME USAGE IS MOSTLY RESIDENTIAL
As at Nov 1st 2019
2019/20
Water savings through restrictions
Lower Murray Water Annual Water Outlook 2019/20
3 LMW Water Outlook 2019-20
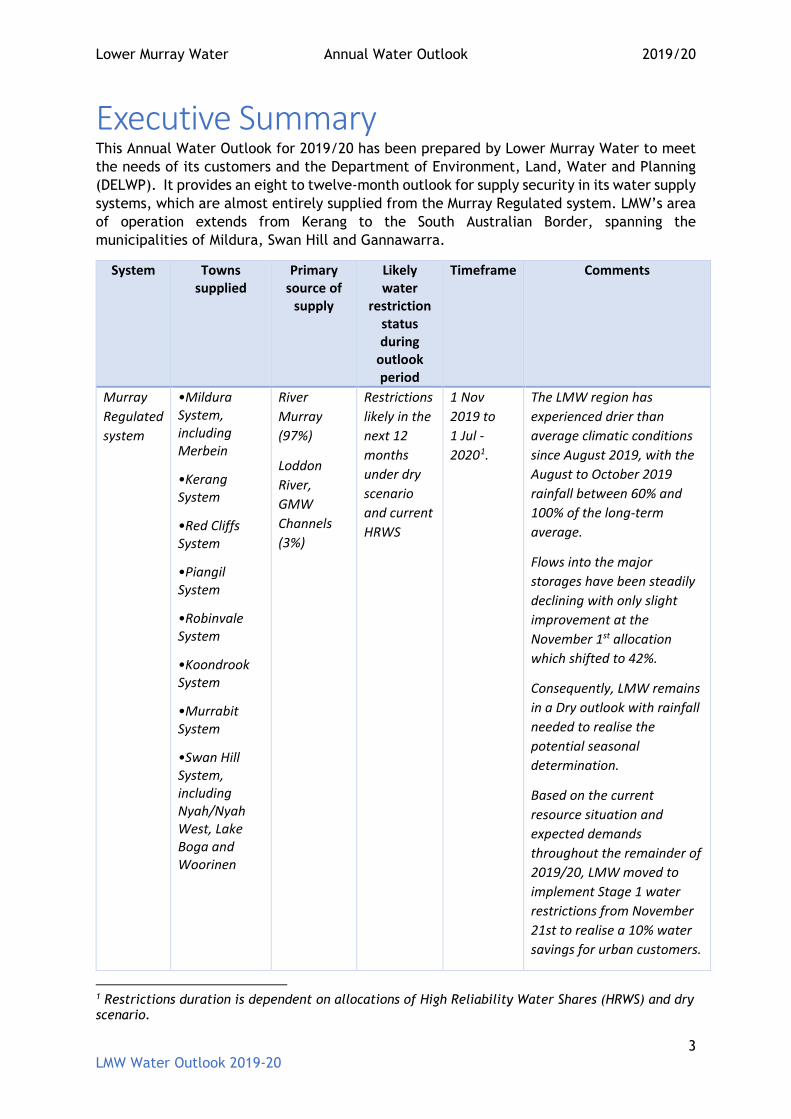
Executive Summary This Annual Water Outlook for 2019/20 has been prepared by Lower Murray Water to meet the needs of its customers and the Department of Environment, Land, Water and Planning (DELWP). It provides an eight to twelve-month outlook for supply security in its water supply systems, which are almost entirely supplied from the Murray Regulated system. LMW’s area of operation extends from Kerang to the South Australian Border, spanning the municipalities of Mildura, Swan Hill and Gannawarra.
System Towns supplied
Primary source of
supply
Likely water
restriction status during
outlook period
Timeframe Comments
Murray Regulated system
•Mildura System, including Merbein
•Kerang System
•Red Cliffs System
•Piangil System
•Robinvale System
•Koondrook System
•Murrabit System
•Swan Hill System, including Nyah/Nyah West, Lake Boga and Woorinen
River Murray (97%)
Loddon River, GMW Channels (3%)
Restrictions likely in the next 12 months under dry scenario and current HRWS
1 Nov 2019 to 1 Jul -20201.
The LMW region has experienced drier than average climatic conditions since August 2019, with the August to October 2019 rainfall between 60% and 100% of the long-term average.
Flows into the major storages have been steadily declining with only slight improvement at the November 1st allocation which shifted to 42%.
Consequently, LMW remains in a Dry outlook with rainfall needed to realise the potential seasonal determination.
Based on the current resource situation and expected demands throughout the remainder of 2019/20, LMW moved to implement Stage 1 water restrictions from November 21st to realise a 10% water savings for urban customers.
1 Restrictions duration is dependent on allocations of High Reliability Water Shares (HRWS) and dry scenario.

Lower Murray Water Annual Water Outlook 2019/20
4 LMW Water Outlook 2019-20
Table of Contents
- Introduction
- 2018/19 supply distribution
- Serving our Customers
- Committing to Environment and Region
- Recent climate conditions
- Water supply systems
- Climate outlook
- Forward outlook 2019/20
- Supply/demand shortfall 2019/20 and 20/21
- Short-term action plan

Lower Murray Water Annual Water Outlook 2019/20
5 LMW Water Outlook 2019-20
Introduction LMW is proud to be placed amongst the highest performing Water Corporations over 2018/19. Ours is one of the few hybrid water utilities in Victoria and is the most remote water corporation from Melbourne combining an urban water business with an irrigation water business, plus other functions delivered for private diverters and the Mallee Catchment Management Authority.
We have around 185 staff to provide services to around 74,000 urban customers, 4,700 irrigation water customers and several hundred private diverters. We are a resilient essential services provider with the mission to maintain reliable delivery services of safe drinking water and of irrigation water to support over $600 million per annum from our irrigation districts
LMW’s water systems LMW provides numerous services across the north-west of Victoria but our core business is centred on providing:
Potable drinking water to the urban and regional centres Urban wastewater treatment services Irrigation water and irrigation drainage services Untreated domestic and stock water supply to rural areas Reuse water.
Areas of Operation

Lower Murray Water Annual Water Outlook 2019/20
6 LMW Water Outlook 2019-20
2018/19 supply distribution Figure 1. Total Number of Customer connections across LMW districts 2018/19.
Figure 2. Total potable water volume supplied across LMW districts 2018/19
The total annual consumption of water was 15,647 ML across this population for 2018/19 Figures 1 and 2. The utility manages a variety of short- and long-term risk to its urban supply identified in Table 1.
1817455 436 44 12 306 258 102
4961
156
19281
1551 796
0
5000
10000
15000
20000
25000
Number of CustomersTotal: 30,175
824198 243 24 6 174 137 52
2267
99
10459
756 407
0
3000
6000
9000
12000
Potable Water Volume MLTotal: 15,647

Lower Murray Water Annual Water Outlook 2019/20
7 LMW Water Outlook 2019-20
Table 1. Risks to urban supply over the next 12 months include:
Risk Rank Infrastructure resilience 1
Climate change 2
Urban growth & supply demand 3
Water quality – ie Blue Green Algae 4
Serving our Customers LMW is proud to report having been placed among the highest performing Victorian Water Corporations for the following metrics in 2017-182. Urban KPI’s related to this score included:
Typical household bills (regional owner occupiers) The third lowest bills in our category at $906 for a typical annual bill.
Typical household bills (tenants) We recorded the largest bill decrease (21%) consistent with lower average water use per household and 2% decrease in our variable charge.
Number of complaints to Energy and Water Ombudsman (Victoria) relative to sector share
We received the lowest number of complaints relative to sector share at 3 per cent of complaints, while servicing 5 per cent of the regional customers.
Average minutes off water supply in the event of an interruption We recorded an average of 12.4 minutes off water supply for planned and unplanned interruptions combined, the fifth best result in Victoria.
Spills per 100 kilometres of sewer main We recorded the third best result in the State.
Spills to customer properties – fifth lowest We recorded the fifth best result in the State.
Benchmarking call centre performance We placed in the top quadrant of Customer Service Benchmarking Australia’s customer service index.
Water supply restrictions for non-payment of bills We recorded the fourth lowest rate of water supply restrictions placed on customers for non-payment of bills, representing a 64 per cent decrease on the previous year because we helped more customers enter into alternative payment arrangements.
2 ESC Water Performance Report 2017-18.

Lower Murray Water Annual Water Outlook 2019/20
8 LMW Water Outlook 2019-20
Committing to Environment and Region LMW recognises that changes in climatic conditions pose one of our biggest threats and we are working across several areas to build resilience and reduce risk for our urban supply.
We have provided our Emissions Reduction Pledge to the state, to reduce the amount of carbon released into the atmosphere from power generation. Our plan is to reduce emissions by 39% or 16,576t CO2e by 2024-25. In 2019-20 we will complete the following actions as the first steps towards our pledge reductions:
Conduct energy audits on sites with large electrical loads to identify commercially viable energy efficiency opportunities and implement the most attractive options.
Introduce demand management across our largest power using facilities
Explore alternate green power sources.
Climate change will also have an increasing impact on the availability of water from the Murray River. We recognise the importance of adapting to these impacts and in 2019-20 we will improve our resilience by:
Targeting our renewal program to maximise reductions in water loss from leaky pipes.
Working closely with the MDBA river managers by continuing to enhance the use of real time water usage data in our area.
Managing infrastructure risk
Key activities for 2019-20 toward the environment and water savings:
Conduct energy audits on sites with large electrical loads Introduce demand management across major plants Investigate alternate water sources Target reductions in water losses through our asset renewal program
Recent climate conditions The Bureau of Meteorology (BoM) reports the area averaged rainfall across the Murray-Darling Basin was 10.9 mm in September 2019, the ninth lowest in 120 years of records. Much of the Basin received below average to very much below average rainfall, with areas in Queensland and New South Wales recording their lowest September rainfall on record. Once again upper Murray catchments recorded below average rainfall.
Given the ongoing dry conditions, River Murray system inflows for September were very low, with about 305 GL of system inflow (excludes environmental, IVT and Snowy scheme contributions) being the lowest 4% of September months on record.
Lower Murray Water Annual Water Outlook 2019/20
9 LMW Water Outlook 2019-20
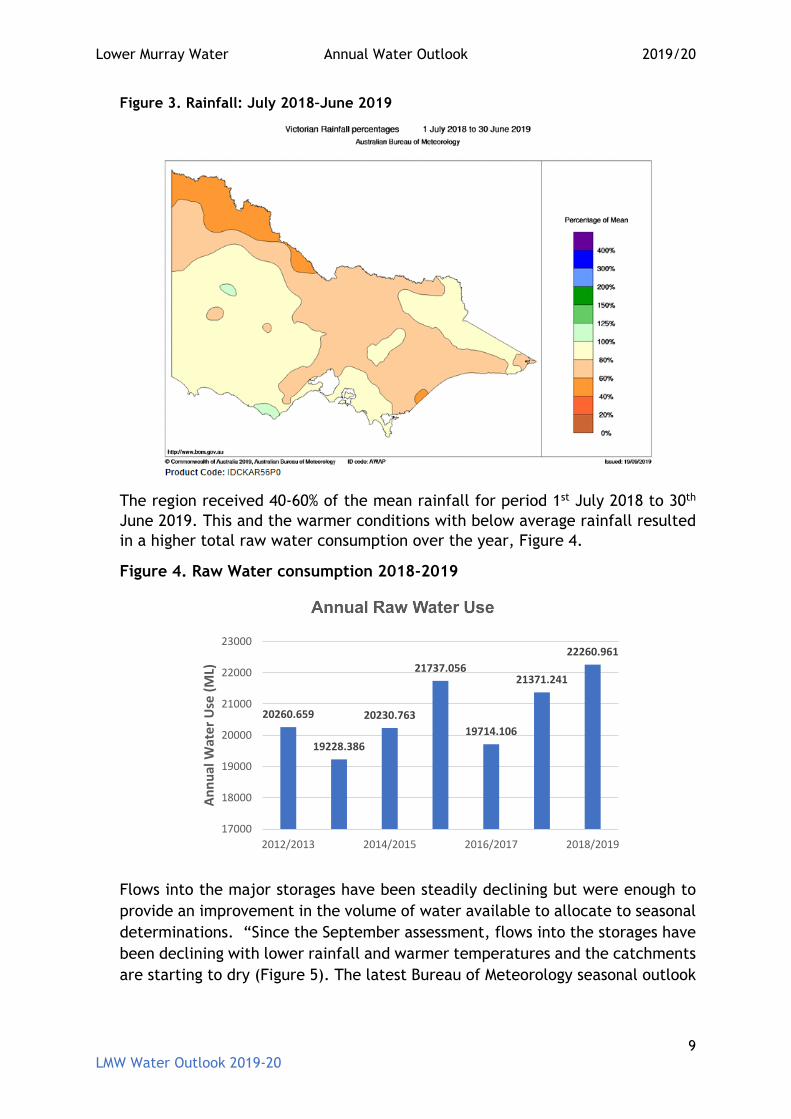
Figure 3. Rainfall: July 2018–June 2019
The region received 40-60% of the mean rainfall for period 1st July 2018 to 30th June 2019. This and the warmer conditions with below average rainfall resulted in a higher total raw water consumption over the year, Figure 4.
Figure 4. Raw Water consumption 2018-2019
Flows into the major storages have been steadily declining but were enough to provide an improvement in the volume of water available to allocate to seasonal determinations. “Since the September assessment, flows into the storages have been declining with lower rainfall and warmer temperatures and the catchments are starting to dry (Figure 5). The latest Bureau of Meteorology seasonal outlook
20260.659
19228.386
20230.763
21737.056
19714.106
21371.241
22260.961
17000
18000
19000
20000
21000
22000
23000
2012/2013 2014/2015 2016/2017 2018/2019
Annu
al W
ater
Use
(ML)

Lower Murray Water Annual Water Outlook 2019/20
10 LMW Water Outlook 2019-20
indicates there was below-average rainfall across all northern Victoria through October to November at 40–60% of the mean.
Figure 5. Rainfall: June 2019 – November 2019
The latest advice from Northern Victoria Resource Manager is for water users to consider available weather and climate information in conjunction with the seasonal determination outlooks when planning their water needs in 2019/20.
Water supply systems A description of Lower Murray Water’s 8 supply systems is provided:
• Mildura Water is pumped from the River Murray at Mildura through two conventional water treatment plants. The treated water is supplied to around 21,000 connections in the City of Mildura and surrounding rural-residential areas including the townships of Irymple, Merbein and Cardross. The Seventh Street treatment plant is designed for a capacity of 85 ML/d and the Mildura West plant has a capacity of 20 ML/d.
The average daily consumption for the summer months is normally below 50ML/d with occasional consumption in excess of this. Treated water pumping stations at Seventh Street and Mildura West distribute water to two water towers with a combined storage capacity of 3.03 ML. Additional booster pump stations and ground

Lower Murray Water Annual Water Outlook 2019/20
11 LMW Water Outlook 2019-20
level storages with a combined storage capacity of 37.6 ML allow the system to maintain pressures to the outlying areas on days of higher demand.
Merbein is supplied with treated water from the Mildura treatment plant via a 450 mm diameter transfer pipeline some 7.14 km long. The pipeline transfers water directly to the Merbein reticulation that includes a ground level storage of 7.5 ML capacity. During times of high demand, booster pumps of 150 L/s (13 ML/d) capacity, pump from the storage directly into the reticulation system to maintain optimum pressures.
• Red Cliffs The town of Red Cliffs (14 km south of Mildura) is an independent system, and services around 1,700 connections. A pumping station extracts water from the River Murray through a dissolved air flotation treatment plant to a 6 ML ground level storage. The treated water is delivered to a water tower near the town centre. Two rising mains of 300 mm and 375 mm diameter. The plant design capacity is 9.5 ML/d and the average daily consumption during the summer months is usually below 6.0 ML/d.
• Robinvale The town of Robinvale pumps water from the River Murray via a 300 mm pipeline to a conventional water treatment plant, which services around 1,000 connections. The maximum plant design capacity is 6 ML/d, with an average peak daily consumption during the summer months of approximately 4.0 ML/d, from a 3.6 ML ground storage and 0.3 ML water tower.
• Kerang Kerang is situated at the southern end of the Lower Murray Water region. Water is pumped either from the Loddon River, the River Murray (at Koondrook) or the Goulburn Murray Water 14/2 Channel and treated in a conventional treatment plant, which services around 2,100 connections. The maximum plant design capacity is 16.6 ML/d and average peak daily consumption has reached 7.2 ML/d during some summer periods.
• Piangil At Piangil, water is pumped from the River Murray to a “Package” conventional water treatment plant which services around 100 connections. The plant has a capacity of 0.7 ML/d. Treated water is then pumped to the existing 1.14 ML ground storage, situated on a high ridge east of the town. From this storage, the system is re-pressurised by pressure booster pumps for distribution into the town’s reticulation network.
• Koondrook Water is pumped from the Murray River to a conventional water treatment plant with a capacity of 3 ML/d. An above ground water storage of 2 ML and standpipe of 0.9 ML services around 500 connections.

Lower Murray Water Annual Water Outlook 2019/20
12 LMW Water Outlook 2019-20
• Murrabit The Murrabit system can pump water both from a Goulburn-Murray Water channel and the Murray River to a conventional water treatment plant of 0.2 ML/d. Treated water pumps supply a 50kL high level storage which services over 50 connections.
• Swan Hill The Rural City of Swan Hill is situated in the centre of the southern region of LMW. Raw water is pumped from the River Murray at Swan Hill to a conventional filtration and disinfection system with a capacity of 35.6 ML/d. The Swan Hill system also supplies Woorinen South, Nyah & Nyah West and Lake Boga, which together service around 7,000 connections. The average daily consumption is normally below 23 ML/d for this system. Treated water pumps deliver treated water to a 2.27 ML ground level storage and 0.68 ML water tower near the city centre. Two extra ground level storages, each of 4.0 ML capacity, and a 0.15 ML water tower are situated west of the city.
Woorinen South is supplied from Swan Hill system via a 10 km long 300 mm diameter pipe system together with a 2.0 ML ground level storage and associated re-lift pumps and chlorination facilities.
The townships of Nyah and Nyah West are supplied via a 27 km long, 300 mm diameter pipeline from the Swan Hill Water Treatment Plant. A 6 ML ground level storage, chlorination facility and re-lift pumps are situated at Nyah. Properties adjacent to this pipeline can access water for domestic or commercial supply.
Lake Boga is supplied via a 250 mm diameter pipeline from the Swan Hill Plant. A 0.9 ML ground level storage, chlorination facilities and 0.1 ML water tower together with associated re-lift pumps have been installed to maintain pressures on days of high demand.
Sources of Supply Lower Murray Water (LMW) sources 97% of its water from the Murray River with the remainder from Goulburn Murray Water irrigation channel systems. A bulk water entitlement of 30,971 ML is currently specified under the Bulk Entitlement (River Murray - Lower Murray Urban and Rural Water - Urban) Conversion Order 1999 as at June 2011. LMW supplements the bulk entitlement with purchases of additional water share and allocation volumes and currently holds 1,460 ML of high reliability water shares. The total entitlement held by LMW in July 2018/19 was 32,098 ML. Carryover is currently 7060ML.
Demand The current (unrestricted) demand is estimated to be 19,600 ML per year, based on the average annual demand over the three-year historical period 2013/14 to 2015/16. The number of residential customers within the region is forecast to increase from its current level of 29,300 to 38,300 by 2040 and to 51,000 by 2065. As a result, average annual demand is forecast to increase to 25,400 ML by 2040 and 33,100 ML by 2065.
Lower Murray Water Annual Water Outlook 2019/20
13 LMW Water Outlook 2019-20
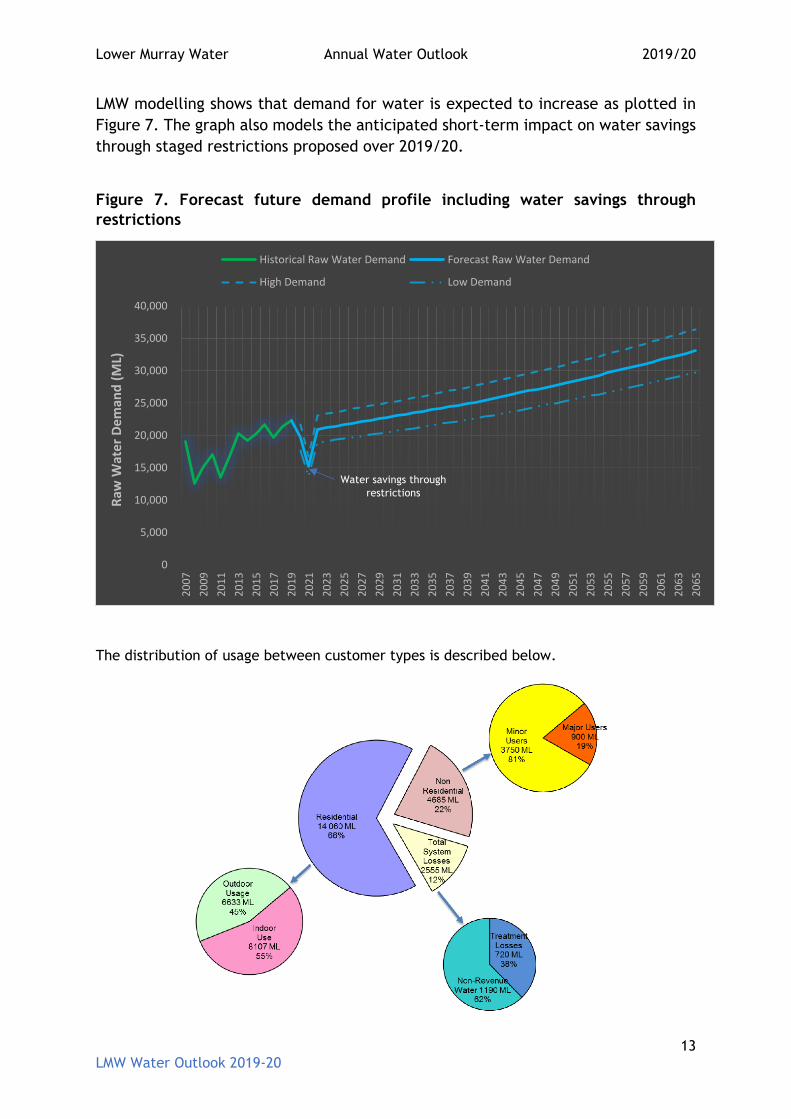
LMW modelling shows that demand for water is expected to increase as plotted in Figure 7. The graph also models the anticipated short-term impact on water savings through staged restrictions proposed over 2019/20.
Figure 7. Forecast future demand profile including water savings through restrictions
The distribution of usage between customer types is described below.
0
5,000
10,000
15,000
20,000
25,000
30,000
35,000
40,000
2007
2009
2011
2013
2015
2017
2019
2021
2023
2025
2027
2029
2031
2033
2035
2037
2039
2041
2043
2045
2047
2049
2051
2053
2055
2057
2059
2061
2063
2065
Raw
Wat
er D
eman
d (M
L)
Historical Raw Water Demand Forecast Raw Water Demand
High Demand Low Demand
Water savings through restrictions

Lower Murray Water Annual Water Outlook 2019/20
14 LMW Water Outlook 2019-20
Climate outlook Latest BoM data: The BoM reports that it has been the second-warmest January–September on record for Australia. Along the Murray, September minimum temperatures were below average while maximum temperatures were near average to above average. Looking ahead, the temperature outlook suggests maximum temperatures are very likely to be above median over the coming three months. Coupled with the rainfall outlook, a dry and hot spring and early summer looks likely. Climatic outlook over the next 3 months is presented in Figures 8 and 9 and suggests a dry outlook for the district.
Figure 8. Chance of exceeding median rainfall.
Figure 9. Chance of exceeding median temperature.

Lower Murray Water Annual Water Outlook 2019/20
15 LMW Water Outlook 2019-20
Forward outlook 2019/20 As of 1 July 2019, Lower Murray Water held 32,098 ML of high reliability water shares in the Regulated Murray system. The Northern Victorian Resource Manager announced on the 15th October 2019 an allocation of 38% for high reliability Murray system entitlements.
Total allocation held by LMW for the 2019/20 season as at 15th October 2019 and including carryover of 7060Ml from the 2018/19 season is 20,221 Ml. The next announcement including an outlook for the rest of the 2019/20 season will has a seasonal allocation outlook at 42%. Factors to consider in the forward outlook and planning for urban supply:
• LMW’s unrestricted usage in a typical year is around 20,500 Ml. • It is anticipated that although the historical major inflow to storages months
of spring are almost complete there will be further moderate increases to allocation volume.
• This means that LMW will most likely have enough allocation to meet its Urban customers demand for 2019/20.
However, given the dry outlook, low relative inflows to the Snowy Darling systems, (Figure 10), and low levels of water in the major storages, it is prudent that LMW introduce Stage 1 restrictions across its service area to reduce the likelihood of more severe restrictions later in the 2020/21 season.
Figure 10. Murray System inflows.
Potential impact on water supply
Water resource storages are lower than at the same time last year, with demand expected to steadily increase.

Lower Murray Water Annual Water Outlook 2019/20
16 LMW Water Outlook 2019-20
Supply/demand shortfall for 2019/20 & 20/21 The supply and demand volumes including carry-over have been estimated. Based on the current allocation outlook and continued low allocations into 2020/21 a forecast shortfall in water supply without restrictions has been determined at around 6,047ML by end of 20/21(Figure 11 2020-21).
Figure 11 Forecast Water Supply/Demand (ML), Indicative Supply/Demand balance with no restrictions
-10,000
-5,000
0
5,000
10,000
15,000
20,000
25,000
30,000
1 2 3 4 5 6 7 8 9 10 11 12
2019-20
Availability
Usage
Carryover

Lower Murray Water Annual Water Outlook 2019/20
17 LMW Water Outlook 2019-20
Short-term action plan Based on the current allocation and forward projection the LMW Board approved the commencement of preparations for stage 1 restrictions in October 2019. Since then, we have commenced communications to raise awareness ahead of the formal launch of Stage 1 water restrictions from November 21st 2019. If the drought conditions continue and less than full seasonal allocations are announced, a staged plan of action will be implemented, and weekly demand monitoring commenced. The timing of the implementation of any increase in restrictions will be based on outcomes from savings through Stage 1 and monitoring of the progressive seasonal allocation announcements. Demand reduction strategies have already started by LMW beyond its permanent water savings measures, with public awareness through local media highlighting the pending drought situation and providing information on wise water use. Water savings measures will be governed with introduction of By-Law No. 2 restrictions and through LMW’s Drought Response Plan. The seasonal allocations and cumulative demand will guide the most appropriate drought response (Stage 1 – 4) to be implemented.
A Drought Monitoring Committee has been convened and meets regularly to assess the drought situation in terms of climate data, river flows, seasonal allocations, cumulative water consumption for the year, bulk entitlements, temporary entitlements, compliance needs, and the current or proposed restriction levels.
Monitoring during a drought will involve separate processes including increased water quality monitoring where supply may be compromised by low flow or long
-10,000
-5,000
0
5,000
10,000
15,000
20,000
25,000
1 2 3 4 5 6 7 8 9 10 11 12
2020-21
Availability
Usage
Balance
Potential impact on water supply
There is a high likelihood of water restrictions this season, with Stage 1 implementation from late November onward.

Lower Murray Water Annual Water Outlook 2019/20
18 LMW Water Outlook 2019-20
detention times. The information will be reviewed collectively to evaluate the effectiveness of the drought response so any necessary adjustments can be made. All information collected and decisions made will be documented for evaluation in the post drought phase and for use in future drought planning.
Heightened awareness actions leading into restrictions will include:
- Undertake regular forward look projections based on MDBA and River Murray Resource manager updates;
- Establishing a Drought Monitoring Committee to guide decision making within the business;
- Prepare public awareness campaign and stakeholder management plan; - Train and educate staff; - Consider and or implement options for purchasing temporary water
entitlements based on justified business case;
Anticipated water savings through implementation of the drought response phases (Stage 1-4 restrictions) are summarised in Table 2. These estimates are based on historical data from the previous drought.
Table 2. Demand impact from staged restrictions.
Stage of Restriction % Reduction in Demand
% of Restrictable
Demand
% of Bulk Entitlement
Usage Phase 1 - Heightened Awareness 5 15 70
Phase 2 – Drought Response
Stage 1 10 30 63
Stage 2 15 45 60
Stage 3 25 75 53
Stage 4 30 100 49
Actions under Water Restrictions Staging: The timing of the implementation of restrictions will be based on results of monitoring the progressive seasonal allocation announcements. Triggering to quickly stage restrictions won’t give a true indication of allocation/storage levels and triggering too late may deliver high levels of restrictions and increased community stress.
The Drought Response Committee will assess the water supply and demand situation in relation to climate data and river conditions, but also evaluate the potential management and community impacts – social amenity etc.
Responses for each drought response phase are summarised in Table 3 (in order of increasing impact from water shortages).

Lower Murray Water Annual Water Outlook 2019/20
19 LMW Water Outlook 2019-20
Table 3. Responses for each ‘trigger’ phase of restriction
Trigger Responses Seasonal allocation below Stage 1 Response Trigger.
1. Establish public awareness campaign
2. Drought Monitoring Committee meets weekly
3. Consider implementation of Stage 1 Restrictions eg service agreements and community sentiment
4. Introduce advertising campaign using all appropriate forms of media
5. Monitor raw water extraction and perform regular checks of cumulative demand versus seasonal allocation curve
Seasonal allocation below Stage 2 Drought Response Trigger.
1. Consider implementation of Stage 2 Restrictions
2. Continue media advertising
3. Weekly monitoring of raw water extraction and check cumulative extraction against seasonal allocation entitlement curve
4. Key stakeholders – important to keep an open dialogue with Councils, Tourism, pool companies etc as DRT 2 has bigger consequences for social amenity
Seasonal allocation below Stage 3 Drought Response Trigger.
5. Consider implementation of Stage 3 Restrictions.
6. Continue media advertising.
7. Daily monitoring of storages.
8. Monitor storage volume response and perform regular forward look storage volume projections.
9. Identify and plan for implementation of emergency options.
10.Alternative supplies – standpipes may be introduced Seasonal allocation below Stage 4 Drought Response Trigger.
11.Consider implementation of Stage 4 Restrictions
12.Continue media advertising;
13.Continue weekly monitoring of raw water extraction and check cumulative extraction against seasonal allocation entitlement curve;
14. Implement emergency supply options; and
15.Tanker water to areas of critical shortage.

Lower Murray Water Annual Water Outlook 2019/20
20 LMW Water Outlook 2019-20
Other actions In addition to current demand management strategies, LMW may consider the actions described in table (4) to balance supply and demand.
Table 4. Alternate water supply and demand strategies
Strategy Action
Reduce demand for potable water
Deliver Schools Education Program - including participating in World Environmental Day, National Water Week and tours of the Mildura Water Treatment Plant
Improve use of existing supplies
Invest in metering and analytics to better understand water usage
Manage carryover of water to maximise system reliability
Alternative water sources
Identify opportunities to utilise alternative water through the Integrated Water Management Forum and customer waterwise education.

Lower Murray Water Annual Water Outlook 2019/20
21 LMW Water Outlook 2019-20