20181025 Smith River 2017-2018 copper monitoring report
19
Smith River Plain Dissolved Copper Monitoring Report 2017-2018 Prepared by: National Marine Fisheries Service Northern California Office Arcata, CA and California Department of Fish and Wildlife Arcata, CA
Transcript of 20181025 Smith River 2017-2018 copper monitoring report

Smith River Plain Dissolved Copper Monitoring Report
2017-2018
Prepared by:
National Marine Fisheries Service Northern California Office
Arcata, CA
and
California Department of Fish and Wildlife Arcata, CA
1
INTRODUCTION
The Smith River is one of the most pristine major rivers in California that is undammed and has much of its watershed in public ownership as U.S. Forest Service and National and State Park lands. However, much of the estuary and tributary streams to the estuary that provide important natal and non-natal habitats for rearing salmonids, including state and federally threatened coho salmon (Oncorhynchus kisutch), is held in private ownership. Most of these privately-owned lands are used for agricultural purposes, which are primarily dairy and lily bulb production. This area in the lower Smith River is called the Smith River Plain.
The Smith River Plain wetlands, sloughs, and streams have been modified to expedite navigation, transportation, logging, and agriculture. These modifications include diking, channelizing, removing woody debris, removing riparian vegetation, and dredging. Over 40 percent of the estuary has been converted for agricultural uses (Quinones and Mulligan 2005). Large scale, channel-altering floods in 1955 and 1964 added to the loss of habitat in the Smith River by decreasing pool depths, altering channel morphology, and increasing sediment deposition. Overall, these changes have greatly reduced habitat diversity and instream cover complexity in the Smith River Plain streams and estuary (McCain et al. 1995). Despite these degraded conditions, the Smith River Plain continues to provide critical natal and non-natal rearing habitat for salmonids, including state and federally listed coho salmon (Garwood and Bauer 2013, Parish and Garwood 2015, Parish and Garwood 2016, Walkley and Garwood 2017).
In the 1940s, most agriculture occurring in the watershed was cattle grazing and dairy farming. In the 1950s and 1960s, flower bulb production and other intensive agricultural uses began. By 1970, irrigated pastures and lily bulb farms covered about 4,000 acres on the coastal plain. Today, this area produces 90 percent of the easter lily (Lilium longiflorum) bulbs in the United States, although annual acreage committed to lily bulbs is usually less than a 1,000 acres. Lily bulb production fields are rotated with pasture for hay and cattle grazing. The production of lily flowers and bulbs requires pesticide applications to control pests (e.g., nematodes) and disease (e.g., fungus), and some of these pesticides can impact salmonids.
Coho salmon throughout northern California and southern Oregon are listed as one unit -Southern Oregon/Northern California Coast (SONCC) coho salmon - under the Endangered Species Act. In order to recover and eventually delist SONCC coho salmon throughout northern California, the Smith River itself must be restored and the SONCC coho salmon there rebuilt to sustainable levels (NMFS 2014, 2016). The Smith River is considered a “core” population for SONCC coho salmon, which means it will ultimately be a stronghold for recovery for the SONCC coho salmon Evolutionarily Significant Unit. Currently, this population is very small compared to recovery goals and is at high risk of extinction (NMFS 2014). The NMFS 2014 Southern Oregon/Northern California Coast (SONCC) Coho Salmon Recovery Plan (NMFS 2014) identified impaired water quality primarily due to pesticides in the Smith River Plain as a high stress to fry, juvenile, and smolt coho salmon. Agricultural practices were also considered a high threat to fry, juvenile, and smolt coho salmon.
This report is focused on defining dissolved copper concentrations in the Smith River plain to better understand potential exposure levels to coho salmon and other juvenile salmonids. However, NMFS is not overlooking the effects to critical habitat or essential fish habitat (e.g.,
2
coho salmon food), nor is it ignoring the toxic effects of the other pesticides that were found in surface water testing done by the North Coast Regional Water Quality Control Board (NCRWQCB 2018). Notably, the toxic effects of metals to salmonids may also be exacerbated by other types of contaminants such as pesticides (Forget et al. 1999).
Copper is used as a fungicide to control fungal diseases (e.g., Botrytis) on newly emergent and growing lily bulb plants. Lily bulb plants emerge from the ground during the fall/early winter and must be frequently sprayed with copper to control fungus during the rainy season and as new growth appears on plants (Miller 2018). Copper is the second highest pounds of pesticide applied during lily bulb production, which is of particular concern because of its high toxicity to aquatic life.
Dissolved copper can have an acute toxic effect to fish through exposure of the gill. Notable effects include disruption of Na ion regulation and a reduction in Na-K ATPase activity. A reduction in Na-K ATPase activity from copper exposure during the parr-smolt transformation process can impair the ability of smolts to transition to life at sea (Lorz and McPherson 1976; Beckman and Zaugg 1988). The Smith River Plain includes the Smith River estuary where smolt transformation is critical. These acute effects are the basis for traditional United States Environmental Protection Agency (USEPA) criteria (Santore et al. 2001; Grosell and Wood 2002). Dissolved copper is also neurobehavioral toxicant to salmonids at extremely low levels (e.g., 0.18 to 2.1 µg/L above background) (NMFS 2007), which are well below USEPA thresholds for concern that NCRWQCB (2018) used.
Even at these low levels, dissolved copper can inhibit or destroy neuron (nerve) cells and impair two important sensory and behavioral response systems: olfaction (sense of smell) (Sandahl et al. 2007) and the lateral line (Hernandez et al. 2006, Olivari.etal.2008). Fish use their sense of smell to identify predators and prey, assess potential mates, avoid pollutants, detect migratory cues, and navigate to their natal streams from the ocean. The lateral line is the visible line along the side of a fish consisting of a series of sense organs, which fish use to detect movement, pressure, and vibration in the surrounding water. When these senses are impaired, fish growth and survival suffers. For example, exposure to dissolved copper resulted in reduced olfaction and a compromised alarm response to a predator in a laboratory study of coho salmon (Sandahl et al. 2007), and concentrations of dissolved copper from 0.18 to 2.1 µg/L above background corresponded to reductions in predator avoidance behavior of approximately 8 to 57% (NMFS 2007). Background concentrations were defined as less than 3 µg/L, which is similar to the streams in this study area. Therefore, dissolved copper has the potential to limit the productivity and intrinsic growth potential of ESA-listed coho salmon populations by reducing the survival and lifetime reproductive success of individuals.
Water chemistry can affect the toxicity of copper when metal ions (e.g., Ca+) compete with copper for binding sites on gills and other cells, or when other inorganic and organic constituents bind to copper ions reducing their bioavailability. The toxicity of copper is closely related to water hardness, alkalinity, pH and dissolved organic carbon (DOC) in the water. Water harness refers to the presence of dissolved metal ions such as calcium and magnesium. Hardness in the Smith River is generally quite low, based on samples taken by the NCRWQCB, and such low hardness can increase the sensitivity of aquatic life to even low levels of contaminants
3
(NCRWQCB 2018). High hardness values can lower copper toxicity to a small degree, based on a controlled experiment with coho salmon (McIntyre et al. 2008), but the low levels found in most freshwater habitat occupied by Pacific salmon are not expected to provide “substantial” protection against copper toxicity (NMFS 2007). Alkalinity and pH regulate the binding of ions to copper. Anticipated ranges of water hardness, alkalinity and pH have little effect on sensory impairment, but can be important for mitigating acute toxicity, while DOC may reduce both acute and sensory toxicity of dissolved copper. However, DOC levels must be relatively high to significantly reduce sensory toxicity of dissolved copper (NMFS 2007; e.g., ~6 mg/L; McIntyre et al. 2008).).
The NCRWQCB has been conducting groundwater and surface water testing in the Smith River Plain since at least 2005, because of concerns to both human and aquatic health from pesticide exposure from lily bulb applications. In January 2018, the NCRWQCB released their Smith River Plain Surface Water and Sediment Monitoring Report 2013-2015 which documented the widespread presence of copper in the Smith River Plain with some samples exceeding the USEPA aquatic health criteria for reproductive and/or acute toxicity. However, as discussed above, traditional, water hardness based USEPA criteria do not take into account the neurobehavioral toxicity of extremely low levels of copper to coho salmon that would also reduce reproduction and survival (NMFS 2007, Sandahl et al. 2007, McIntyre et al. 2012). Samples taken by NCRWQCB (2018) between 2013 and 2015 from Delilah Creek, Morrison Creek, Lower and Upper Rowdy Creek, and Tilas Slough all exceeded the levels at which neurobehavioral effects for coho salmon have been predicted (0.18 µg/L above background) (NMFS 2007).
The private land owners of the lily bulb fields as well as CDFW and NMFS representatives and private individuals expressed concern with the sampling timing and location from the NCRWQCB report. There was concern that testing done by the NCRWQCB missed “first flush” or other noteworthy events when pesticide concentrations may be highest and did not adequately sample to eliminate natural copper sources or other anthropogenic sources (e.g., copper in road run-off) besides lily bulb fields. Furthermore, widespread sampling in streams occurring above and below lily fields was also needed to characterize spatial and temporal copper concentrations throughout the Smith River Plain. Therefore, NMFS, in cooperation with the California Department of Fish and Wildlife (CDFW) and NCRWQCB, undertook additional water sampling and copper analysis to better determine the risk of agricultural copper to coho salmon, their habitats, and other aquatic life in the Smith River Plain.

4
METHODS
The following methods were used to collect water samples that were tested for dissolved copper, hardness, and dissolved organic carbon testing at EPA certified labs. Fall 2017 samples were tested by North Coast Laboratories, Arcata, CA and 2018 samples were tested at Moore Twining and Associates, Inc., Fresno, CA. CDFW collected all water samples. All water samples were analyzed for dissolved copper
Location
Sampling locations were identified based on ease of access, previous sampling by NCRWQCB, and the proximity to lily bulb fields. Additional sampling locations were identified above lily bulb fields to determine potential local background levels of dissolved copper in areas not receiving runoff from lily bulb fields. All sample locations near county roads and highways were taken upstream and away from the road prism to minimize potential contamination from road residues.
Timing
Two sampling events were targeted; one in the fall 2017 (November 9 and 10, 2017) when streams first began flowing and the second after a significant rainfall event in the late-winter/Spring 2018 (March 3 and 4, 2018)(see Figure 1)
Figure 1. Mean daily discharge in cubic feet per second during the winter of 2017-2018 for the Smith River at the USGS Jed Smith gauging station, Del Norte County, CA.
Dissolved Copper and Water Hardness Procedure
Contamination avoidance
Wear sterile nitrile gloves when sampling. Avoid touching metal objects after putting on gloves and while sampling. Use one sterile sample bottle for collecting sample and another sterile sample bottle for
final filtrate sample.

5
Equipment and Supplies
Glass flask 4000 ml
Magnetic filter apparatus
Peristaltic pump
250 ml plastic sample bottles
42.5 mm diameter glass microfilters; pore size: 1.5 µm
Prepare Equipment
1. Rinse filter-flask and assembly with distilled water to remove any residual sediment from other sites.
2. Assemble filter- flask system with a new 42.5 mm glass microfilter ensuring filter is centered and covers filter apparatus. Collect water from sampling location (see specifics under ‘collect sample’ below) using a sterile 250 ml sampling bottle. Filter 250 ml of water (see specifics under ‘filter sample’ below). Rinse flask with filtrate by oscillating filtrate throughout flask for 5 seconds then poor out rinse. Repeat this step a total of three times prior to collecting final filtrate sample.
Collect Sample
Label the filtrate sample bottle with the date, location of the sample and sample site identifying number. Record sample number, location, date, time, collectors, spatial coordinates, water clarity, and notes on the water sample datasheet.
Collect sample using a sterile 250 ml sample bottle from area that is midstream, well mixed, and where you consider the area of most flow. Depending on the size of the water body, to collect samples either: wade into the water with the bottle or dip sample bottle by hand from boat, or lower a bucket from a bridge. Always collect the sample upstream of the person wading or upstream of the bow of a boat.
Filter Sample
Pour sample into the collecting funnel.
Manipulate hand pump to create a vacuum in the flask. Water should move from collecting funnel, through glass filter, and into flask.
Carefully remove rubber stopper from flask. Pour filtered liquid into a sterile sample bottle and apply cap.
Discard filter.

6
Deliver Sample
Complete chain of custody paperwork provided by North Coast Laboratories and Moore Twining and Associates, Inc. for each sample in blue or black ink. Chain of custody paperwork remains with the samples at all times and is signed by the collector when the samples are relinquished to the lab. It’s also signed by the receiver at the lab.
Return filled sample bottles to lab within two weeks of collection. The laboratory will preserve the Cu/ Hardness sample with acid. The sample will start to degrade if more than two weeks elapse before it is preserved.
Dissolved Organic Carbon Procedure
Equipment and Supplies
Glass flask 4000 ml
Magnetic filter apparatus
Peristaltic pump
250 ml plastic sample bottles
42.5 mm diameter glass microfilters; pore size: 1.5 µm
10 ml nylon luer lock syringe 25 mm diameter nylon syringe filter; pore size: 0.45 µm 40 ml brown glass sample bottle containing premeasured amount (0.5 ml) Phosphoric
Acid preservative.
Sample Collection
First follow all steps under the ‘Dissolved Copper and Water Hardness Procedure’ to obtain a 250 ml filtrate sample.
Draw 10 ml of filtrate from sample bottle into 10 ml nylon syringe. Screw on 25 mm nylon syringe filter and filter sample into a 40 ml glass sample bottle
containing Phosphoric Acid preservative. Repeat previous step 3 more times to fill 40 ml glass sample bottle.
Deliver Sample
See methods in previous section for dissolved copper and water hardness sample delivery section.

7
RESULTS
Fall 2017
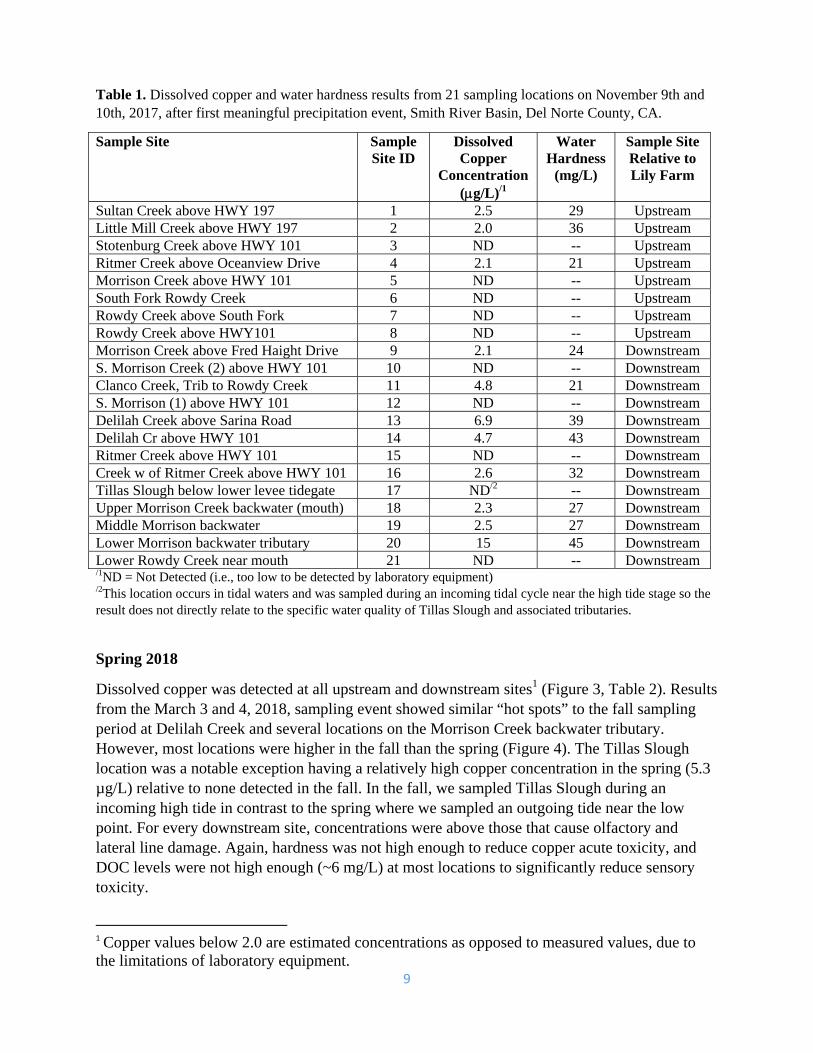
Results from the November 9 and 10, 2017, first flush sampling nearly always showed an increase in copper concentrations downstream from lily bulb fields when copper was detected (Figure 2, Table 1). Dissolved copper was detected at 8 of 13 downstream sites and 3 of 8 upstream sites. Note that the copper reporting limit used by the laboratory that processed fall samples is 2.0 µg/L, so the samples with “No Detections” may have contained dissolved copper at concentrations below 2.0 µg/L. For every site where dissolved copper was detected, concentrations were well above those that cause olfactory and lateral line damage. The highest concentration (15 µg/L) was at Lower Morrison Creek backwater tributary (Figure 2, Table 1). Some samples did not have copper detected and some sites had copper concentrations that were either from natural sources or other anthropogenic sources besides lily bulb field run-off (e.g., Sultan Creek and Little Mill Creek) (Figure 2, Table 1). Hardness does not appear to be high enough to reduce dissolved copper toxicity, ranging from 21 to 45 mg/L (Table 1). DOC was not sampled during this event. Note that the reporting limit for copper analyzed by North Coast Laboratories (fall samples) is 2.0 g/L so the “no detections” reported may in fact have had dissolved copper at concentrations below 2.0 g/L

8
Figure 2. Sampling sites and dissolved copper concentrations both upstream and downstream of lily fields, November 10 and 11, 2017, Del Norte County, CA.
9
Table 1. Dissolved copper and water hardness results from 21 sampling locations on November 9th and 10th, 2017, after first meaningful precipitation event, Smith River Basin, Del Norte County, CA.
Sample Site Sample Site ID
Dissolved Copper
Concentration (g/L)/1
Water Hardness
(mg/L)
Sample Site Relative to Lily Farm
Sultan Creek above HWY 197 1 2.5 29 Upstream Little Mill Creek above HWY 197 2 2.0 36 Upstream Stotenburg Creek above HWY 101 3 ND -- Upstream Ritmer Creek above Oceanview Drive 4 2.1 21 Upstream Morrison Creek above HWY 101 5 ND -- Upstream South Fork Rowdy Creek 6 ND -- Upstream Rowdy Creek above South Fork 7 ND -- Upstream Rowdy Creek above HWY101 8 ND -- Upstream Morrison Creek above Fred Haight Drive 9 2.1 24 Downstream S. Morrison Creek (2) above HWY 101 10 ND -- Downstream Clanco Creek, Trib to Rowdy Creek 11 4.8 21 Downstream S. Morrison (1) above HWY 101 12 ND -- Downstream Delilah Creek above Sarina Road 13 6.9 39 Downstream Delilah Cr above HWY 101 14 4.7 43 Downstream Ritmer Creek above HWY 101 15 ND -- Downstream Creek w of Ritmer Creek above HWY 101 16 2.6 32 Downstream Tillas Slough below lower levee tidegate 17 ND/2 -- Downstream Upper Morrison Creek backwater (mouth) 18 2.3 27 Downstream Middle Morrison backwater 19 2.5 27 Downstream Lower Morrison backwater tributary 20 15 45 Downstream Lower Rowdy Creek near mouth 21 ND -- Downstream /1ND = Not Detected (i.e., too low to be detected by laboratory equipment) /2This location occurs in tidal waters and was sampled during an incoming tidal cycle near the high tide stage so the result does not directly relate to the specific water quality of Tillas Slough and associated tributaries.
Spring 2018
Dissolved copper was detected at all upstream and downstream sites1 (Figure 3, Table 2). Results from the March 3 and 4, 2018, sampling event showed similar “hot spots” to the fall sampling period at Delilah Creek and several locations on the Morrison Creek backwater tributary. However, most locations were higher in the fall than the spring (Figure 4). The Tillas Slough location was a notable exception having a relatively high copper concentration in the spring (5.3 µg/L) relative to none detected in the fall. In the fall, we sampled Tillas Slough during an incoming high tide in contrast to the spring where we sampled an outgoing tide near the low point. For every downstream site, concentrations were above those that cause olfactory and lateral line damage. Again, hardness was not high enough to reduce copper acute toxicity, and DOC levels were not high enough (~6 mg/L) at most locations to significantly reduce sensory toxicity.
1 Copper values below 2.0 are estimated concentrations as opposed to measured values, due to the limitations of laboratory equipment.

10
Figure 3. Sampling sites and dissolved copper concentrations both upstream and downstream of lily fields, March 4 and 5, 2018, Del Norte County, CA.

11
Table 2. Dissolved copper, water hardness, and dissolved organic carbon results from 23 sampling locations on March 3rd and 4th, 2018, after a late winter precipitation event, Smith River Basin, Del Norte County, CA. ND indicates the level of DOC was too low to be detected by laboratory equipment.
Sample site Copper
concentration (µg/L)
Hardness mg/L
DOC (mg/L) Sample site
relative to lily farm
Sultan Cr. 1.1 -- 1.0 Upstream Little Mill Cr 0.64 -- 1.4 Upstream Stotenburg Cr 0.67 -- 1.4 Upstream Ritmer Cr 0.29 -- 1.2 Upstream Morrison Cr 1.0 -- ND Upstream S. Fork Rowdy Cr 0.65 -- 1.1 Upstream Rowdy Cr 0.72 -- ND Upstream Rowdy Cr. 0.26 -- ND Upstream Morrison Cr. 1.4 18 1.2 Downstream S. Morrison Cr (2) 0.50 -- ND Downstream Unnamed Trib to Rowdy Cr
1.0 -- 1.2 Downstream
S Morrison (1) 0.63 -- 1.7 Downstream Delilah Cr. 7.7 35 1.4 Downstream Delilah Cr. 3.9 -- ND Downstream Ritmer Cr. 0.95 -- 1.5 Downstream Unnamed creek w of Ritmer Cr.
1.3 -- 3.5 Downstream
Tillas Slough 5.3 58 1.6 Downstream Upper Morrison backwater (mouth)
1.2 -- 1.7 Downstream
Mid-morrison backwater
1.1 -- 1.6 Downstream
Lower Morrison backwater trib
6.0 76 ND Downstream
Lower Rowdy Creek
0.46 -- 2.3 Downstream
South Morrison Cr. @ Fred Haight Dr.
3.6 20 4.3 Downstream
Mid-Morrison Cr. Backwater trib
6.0 17 -- Downstream

12
Figure 4. Mean dissolved copper concentrations for upstream and downstream sites for Fall 2017 and Spring 2018. Bars around the mean are standard deviation from the mean.
Relationship to Aquatic Life Criteria (promulgated as a result of the California Toxics Rule)
While the purpose of this monitoring report is to better understand the potential source and exposure levels of dissolved copper concentrations for coho salmon in the Smith River plain, we provide a brief summary of the monitoring data in relationship to the adopted aquatic life criteria, which are enforceable standards that the North Coast Regional Water Quality Control Board uses. Note that the current aquatic life criteria, adopted after the completion of the California Toxics Rule in 2000, are not protective against some sublethal effects to salmonids (such as impacts to olfactory senses or the lateral line) discovered after 2000, but is an appropriate metric to assess other effects to salmonids, invertebrate organisms and other less sensitive species such as impacts to growth or mortality.
Because the CTR criteria for dissolved copper is influenced by water hardness, we present data for sampled sites with dissolved copper concentration and water hardness level. Due to limited

13
resources, only 17 water samples were tested for both dissolved copper concentrations and water hardness (Tables 1 and 2). A total of 14 water samples tested for both copper and hardness were in streams occurring below lily fields. Three control samples collected at streams absent of lily fields were also tested for copper and hardness.
Of the 14 water samples collected in waters below lily fields, seven (50%) exceeded the aquatic life criterion to protect freshwater from chronic toxicity impacts. These seven (50%) sites exceeded criterion continuous concentration (CCC) for freshwater aquatic life for reproductive and/or other toxicity (Figure 5). CCC is the chronic standard defined as the highest concentration of a pollutant to which aquatic life can be exposed for an extended period of time (four days) without deleterious effects (NCRWQCB 2018). A total of six water samples (43%) exceeded criterion maximum concentration (CMC) for freshwater aquatic life criteria for reproductive and/or acute toxicity (Figure 5). CMC is the acute standard defined as the highest concentration of a pollutant to which aquatic life can be exposed for a short period of time (one hour) without deleterious effects (NCRWQCB 2018). None of the three control samples exceeded CCC or CMC (Figure 5).
Figure 5. Dissolved copper concentrations and hardness in 17 of 44 surface water samples collected from November 2017 and March 2018, Smith River, California.
14
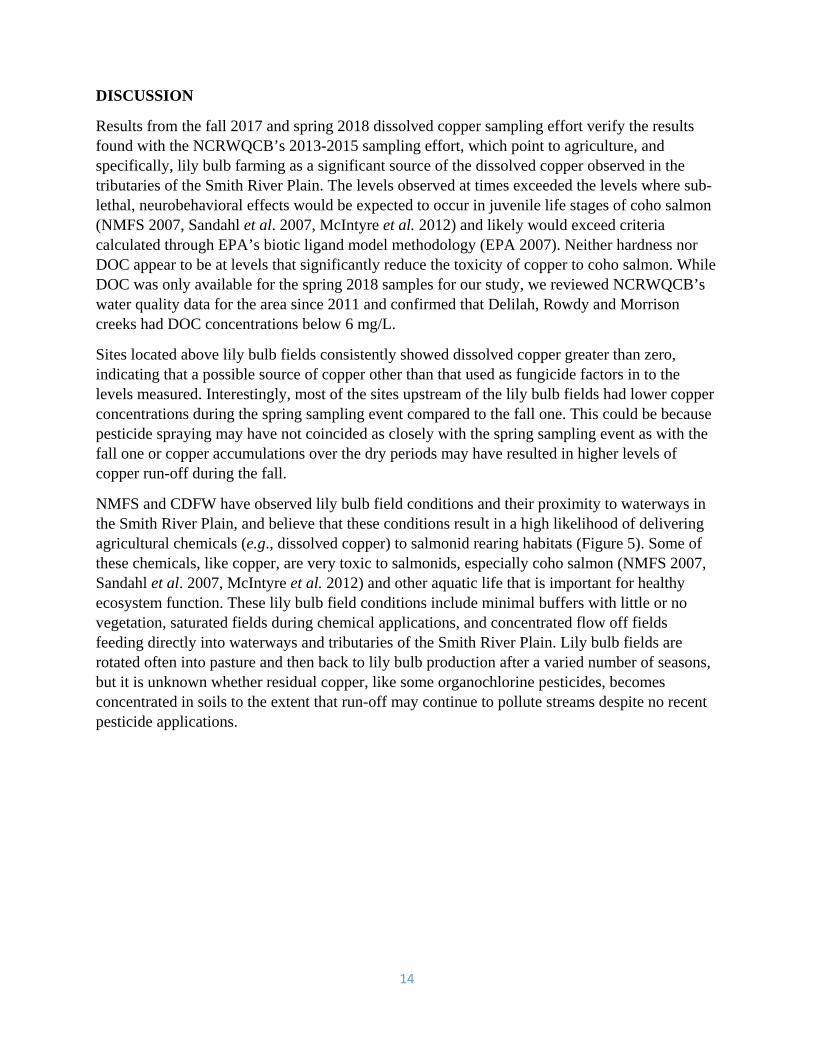
DISCUSSION
Results from the fall 2017 and spring 2018 dissolved copper sampling effort verify the results found with the NCRWQCB’s 2013-2015 sampling effort, which point to agriculture, and specifically, lily bulb farming as a significant source of the dissolved copper observed in the tributaries of the Smith River Plain. The levels observed at times exceeded the levels where sub-lethal, neurobehavioral effects would be expected to occur in juvenile life stages of coho salmon (NMFS 2007, Sandahl et al. 2007, McIntyre et al. 2012) and likely would exceed criteria calculated through EPA’s biotic ligand model methodology (EPA 2007). Neither hardness nor DOC appear to be at levels that significantly reduce the toxicity of copper to coho salmon. While DOC was only available for the spring 2018 samples for our study, we reviewed NCRWQCB’s water quality data for the area since 2011 and confirmed that Delilah, Rowdy and Morrison creeks had DOC concentrations below 6 mg/L.
Sites located above lily bulb fields consistently showed dissolved copper greater than zero, indicating that a possible source of copper other than that used as fungicide factors in to the levels measured. Interestingly, most of the sites upstream of the lily bulb fields had lower copper concentrations during the spring sampling event compared to the fall one. This could be because pesticide spraying may have not coincided as closely with the spring sampling event as with the fall one or copper accumulations over the dry periods may have resulted in higher levels of copper run-off during the fall.
NMFS and CDFW have observed lily bulb field conditions and their proximity to waterways in the Smith River Plain, and believe that these conditions result in a high likelihood of delivering agricultural chemicals (e.g., dissolved copper) to salmonid rearing habitats (Figure 5). Some of these chemicals, like copper, are very toxic to salmonids, especially coho salmon (NMFS 2007, Sandahl et al. 2007, McIntyre et al. 2012) and other aquatic life that is important for healthy ecosystem function. These lily bulb field conditions include minimal buffers with little or no vegetation, saturated fields during chemical applications, and concentrated flow off fields feeding directly into waterways and tributaries of the Smith River Plain. Lily bulb fields are rotated often into pasture and then back to lily bulb production after a varied number of seasons, but it is unknown whether residual copper, like some organochlorine pesticides, becomes concentrated in soils to the extent that run-off may continue to pollute streams despite no recent pesticide applications.

15
Figure 5. Evidence of concentrated flow and sediment (center of photo) from adjacent lily bulb field (background) entering roadside ditch (foreground) that is connected to Delilah Creek, a tributary to the Smith River on the Smith River Plain.
RECOMMENDATIONS
NMFS offers the following recommendations for reducing copper and other pesticide concentrations in Smith River Plain waterways and tributaries that provide natal and non-natal rearing habitat for coho salmon and other salmonids and aquatic life:
1) Collaboratively finalize the Smith River Plain Water Quality Management Plan by October 1, 2019, to ensure all parties work towards improving water quality in the Smith River Plain.
2) Verify upstream source concentrations of copper by season. 3) NMFS, lily bulb producers, the Tolowa Dee-ni’ Nation, NRCS, CDFW, NCRWQCB, the
California Department of Pesticide Regulation, and the Del Norte County RCD work together to develop effective best management practices (BMPs) for lily bulb production to reduce chemical contamination of the Smith River Plain watershed.
4) NMFS/CDFW/NCRWQB continue monitoring copper and other pesticides used on lily bulb fields, and potentially expand to additional areas and seasons to establish comprehensive baseline conditions. This baseline information, along with similar information collected after BMPs are in place, will allow NMFS to verify the effectiveness of BMPs. Laboratory analysis should be sensitive enough to estimate copper at 0.1 µg/L. NMFS and CDFW need improved access to sampling sites to better characterize potential sources of copper and effectiveness of BMPs.

16
ACKNOWLEDGEMENTS:
NMFS and CDFW would like to thank the NCRWQCB for funding the spring 2018 lab results. The NCRWQCB’s contribution was essential to the monitoring project, and remains a valuable partner in the North Coast.
REFERENCES
Beckman, B.R., and W.S. Zaugg. 1988. Copper intoxication in Chinook salmon (Oncorhynchus tshawytscha) induced by natural springwater: effects on gill Na-K ATPase, hematocrit, and plasma glucose. Canadian Journal of Fisheries and Aquatic Sciences 45(8): 1430-1435. Forget, J., J. Pavillon, B. Beliaeff, and G. Bocquene. 1999. Joint action of pollutant combinations (Pesticides and metals) on survival (LC50 values) and acetylcholinesterase activity of Tigriopus Brevicornis (Coperpoda, Harpacticoida). Environ. Toxicol. Chem. 18:912–918. Garwood, J., and S. Bauer. 2013. Field Note: Juvenile coho salmon detections in an Unnamed Tributary to the Smith River, Smith River, California. California Department of Fish & Wildlife, Arcata, CA. Grosell, M. and C.M. Wood. 2002. Copper uptake across rainbow trout gills: mechanism of apical entry. Journal of Experimental Biology 205: 1179-1188. Hernandez, P., C. Undurraga, V.E. Gallardo, and A. Reyes. 2010. Sublethal concentrations of waterborne copper induce cellular stress and cell death in zebrafish embryos and larvae. Biological Research 44(1):7-15. Lorz, H.W., and B.P. McPherson. Effects of copper or zinc in freshwater on the adaptation of seawater and ATPase activity and the effects of copper on migratory disposition of coho salmon (Oncorhynchus kisutch). In Pollution Symposium- 13th Pacific Science Congress Sublethal Effects of Pollution on Aquatic Organisms. Journal Of Fisheries Research Board of Canada 33(9):2023-2030 McCain, M., B. Devli-Craiy, C. Black, K. Worn, G. Goldsmith, J. Lowe, J. Benz, K. Heffner- McClellan, T. Keter, L. Salazar, L. Hoover, D. Webb, D. Pass. 1995. Smith River ecosystem analysis: basin and subbasin analyses and late-successional reserve assessment. Smith River National Recreation Area, Six Rivers National Forest. McIntyre, J.K., D.H. Baldwin, J.P. Meador, and N.L. Scholz. 2008. Chemosensory deprivation in juvenile coho salmon exposed to dissolved copper under varying water chemistry conditions Environmental Science and Technology 42:1352-1358. McIntyre, J.K., D.H. Baldwin, D.A Beauchamp, and N.L. Scholz. 2012. Low level copper exposures increase visibility and vulnerability of juvenile coho salmon to cutthroat trout predators. Ecological Applications vol. 22, No. 5, 1460-1471.

17
Miller, R. 2018. Personal communications. Lily bulb grower, Dahlstrom and Watt Bulb Farm, Inc., Smith River, CA NMFS. 2007. An overview of sensory effects on juvenile salmonids exposed to dissolved copper: applying a benchmark concentration approach to evaluate sublethal neurobehavioral toxicity. NOAA Technical Memorandum NMFS-NWFSC-83. NMFS. 2014. Southern Oregon/Northern California Coast Coho Salmon Recovery Plan. National Marine Fisheries Service, West Coast Region, Arcata, CA. Northcoast Regional Water Quality Control Board. 2018. Smith river plain surface water and sediment monitoring report 2013-2015. North Coast Region Surface Water Ambient Monitoring Program. SWAMP-MR-RB1-2018-0001. Olivari, F.A., P.P. Hernandez, and M.L. Allende. 2008. Acute copper exposure induces oxidative stress and cell death in lateral line hair cells of zebrafish larvae. Brain Research 1244:1-12. Parish, M. and J. Garwood. 2015. Distribution of juvenile salmonids and seasonally available aquatic habitats within the lower Smith River basin and estuary, Del Norte County, California. Final Report to the California Department of Fish and Wildlife, Fisheries Grants Restoration Program, Contract: P1310518. Smith River Alliance, Crescent City, CA. 62p. Parish, M. and J. Garwood. 2016. Winter distributions, movements, and habitat use by juvenile salmonids throughout the lower Smith River basin and estuary, Del Norte County, California. Final Report to the California Department of Fish and Wildlife, Fisheries Grants Restoration Program, Contract: P1410545. Smith River Alliance, Crescent City, CA. 51p. Quinones, R.M. and T.J. Mulligan. 2005. Habitat use by juvenile salmonids in the Smith River estuary, California. Transactions of the American Fisheries Society 134:1147-1158. Sandahl, J. F., D. H. Baldwin, J. J. Jenkins, and N. L. Scholz. 2007. A sensory system at the interface between urban stormwater runoff and salmon survival. Environmental Science and Technology 41:2998–3004. Santore, R.C., D.M. Di Toro, P.R. Paquin, H.E. Allen and J.S. Meyer. 2001. Biotic ligand model of the acute toxicity of metals. 2. Application to acute copper toxicity in freshwater fish and Daphnia. Environmental Toxicity and Chemistry, Vol. 20, No. 10 pp. 2397-2402. USEPA. 2007. Aquatic life ambient freshwater quality criteria-copper. US Environmental Protection Agency, Office of Water, EPA-822-R-07-001. Walkley, J. and J. Garwood. 2017. 2011-2016 Salmonid redd abundance and juvenile salmonid spatial structure in the Smith River Basin, California and Oregon. Final progress report to the California Department of Fish and Wildlife Fisheries Restoration Grants Program. Grantee Agreement: P1210524. Smith River Alliance, CA. 76p.
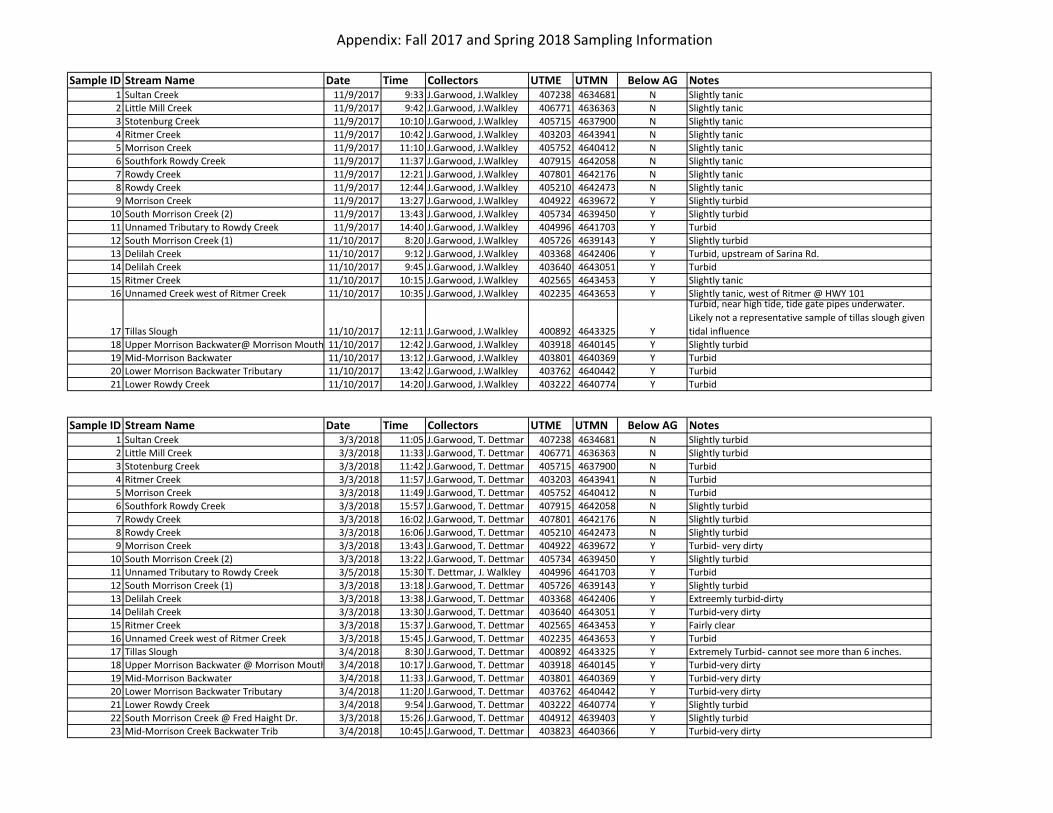
Appendix: Fall 2017 and Spring 2018 Sampling Information
Sample ID Stream Name Date Time Collectors UTME UTMN Below AG Notes1 Sultan Creek 11/9/2017 9:33 J.Garwood, J.Walkley 407238 4634681 N Slightly tanic
2 Little Mill Creek 11/9/2017 9:42 J.Garwood, J.Walkley 406771 4636363 N Slightly tanic
3 Stotenburg Creek 11/9/2017 10:10 J.Garwood, J.Walkley 405715 4637900 N Slightly tanic
4 Ritmer Creek 11/9/2017 10:42 J.Garwood, J.Walkley 403203 4643941 N Slightly tanic
5 Morrison Creek 11/9/2017 11:10 J.Garwood, J.Walkley 405752 4640412 N Slightly tanic
6 Southfork Rowdy Creek 11/9/2017 11:37 J.Garwood, J.Walkley 407915 4642058 N Slightly tanic
7 Rowdy Creek 11/9/2017 12:21 J.Garwood, J.Walkley 407801 4642176 N Slightly tanic
8 Rowdy Creek 11/9/2017 12:44 J.Garwood, J.Walkley 405210 4642473 N Slightly tanic
9 Morrison Creek 11/9/2017 13:27 J.Garwood, J.Walkley 404922 4639672 Y Slightly turbid
10 South Morrison Creek (2) 11/9/2017 13:43 J.Garwood, J.Walkley 405734 4639450 Y Slightly turbid
11 Unnamed Tributary to Rowdy Creek 11/9/2017 14:40 J.Garwood, J.Walkley 404996 4641703 Y Turbid
12 South Morrison Creek (1) 11/10/2017 8:20 J.Garwood, J.Walkley 405726 4639143 Y Slightly turbid
13 Delilah Creek 11/10/2017 9:12 J.Garwood, J.Walkley 403368 4642406 Y Turbid, upstream of Sarina Rd.
14 Delilah Creek 11/10/2017 9:45 J.Garwood, J.Walkley 403640 4643051 Y Turbid
15 Ritmer Creek 11/10/2017 10:15 J.Garwood, J.Walkley 402565 4643453 Y Slightly tanic
16 Unnamed Creek west of Ritmer Creek 11/10/2017 10:35 J.Garwood, J.Walkley 402235 4643653 Y Slightly tanic, west of Ritmer @ HWY 101
17 Tillas Slough 11/10/2017 12:11 J.Garwood, J.Walkley 400892 4643325 Y
Turbid, near high tide, tide gate pipes underwater.
Likely not a representative sample of tillas slough given
tidal influence
18 Upper Morrison Backwater@ Morrison Mouth 11/10/2017 12:42 J.Garwood, J.Walkley 403918 4640145 Y Slightly turbid
19 Mid‐Morrison Backwater 11/10/2017 13:12 J.Garwood, J.Walkley 403801 4640369 Y Turbid
20 Lower Morrison Backwater Tributary 11/10/2017 13:42 J.Garwood, J.Walkley 403762 4640442 Y Turbid
21 Lower Rowdy Creek 11/10/2017 14:20 J.Garwood, J.Walkley 403222 4640774 Y Turbid
Sample ID Stream Name Date Time Collectors UTME UTMN Below AG Notes1 Sultan Creek 3/3/2018 11:05 J.Garwood, T. Dettmar 407238 4634681 N Slightly turbid
2 Little Mill Creek 3/3/2018 11:33 J.Garwood, T. Dettmar 406771 4636363 N Slightly turbid
3 Stotenburg Creek 3/3/2018 11:42 J.Garwood, T. Dettmar 405715 4637900 N Turbid
4 Ritmer Creek 3/3/2018 11:57 J.Garwood, T. Dettmar 403203 4643941 N Turbid
5 Morrison Creek 3/3/2018 11:49 J.Garwood, T. Dettmar 405752 4640412 N Turbid
6 Southfork Rowdy Creek 3/3/2018 15:57 J.Garwood, T. Dettmar 407915 4642058 N Slightly turbid
7 Rowdy Creek 3/3/2018 16:02 J.Garwood, T. Dettmar 407801 4642176 N Slightly turbid
8 Rowdy Creek 3/3/2018 16:06 J.Garwood, T. Dettmar 405210 4642473 N Slightly turbid
9 Morrison Creek 3/3/2018 13:43 J.Garwood, T. Dettmar 404922 4639672 Y Turbid‐ very dirty
10 South Morrison Creek (2) 3/3/2018 13:22 J.Garwood, T. Dettmar 405734 4639450 Y Slightly turbid
11 Unnamed Tributary to Rowdy Creek 3/5/2018 15:30 T. Dettmar, J. Walkley 404996 4641703 Y Turbid
12 South Morrison Creek (1) 3/3/2018 13:18 J.Garwood, T. Dettmar 405726 4639143 Y Slightly turbid
13 Delilah Creek 3/3/2018 13:38 J.Garwood, T. Dettmar 403368 4642406 Y Extreemly turbid‐dirty
14 Delilah Creek 3/3/2018 13:30 J.Garwood, T. Dettmar 403640 4643051 Y Turbid‐very dirty
15 Ritmer Creek 3/3/2018 15:37 J.Garwood, T. Dettmar 402565 4643453 Y Fairly clear
16 Unnamed Creek west of Ritmer Creek 3/3/2018 15:45 J.Garwood, T. Dettmar 402235 4643653 Y Turbid
17 Tillas Slough 3/4/2018 8:30 J.Garwood, T. Dettmar 400892 4643325 Y Extremely Turbid‐ cannot see more than 6 inches.
18 Upper Morrison Backwater @ Morrison Mouth 3/4/2018 10:17 J.Garwood, T. Dettmar 403918 4640145 Y Turbid‐very dirty
19 Mid‐Morrison Backwater 3/4/2018 11:33 J.Garwood, T. Dettmar 403801 4640369 Y Turbid‐very dirty
20 Lower Morrison Backwater Tributary 3/4/2018 11:20 J.Garwood, T. Dettmar 403762 4640442 Y Turbid‐very dirty
21 Lower Rowdy Creek 3/4/2018 9:54 J.Garwood, T. Dettmar 403222 4640774 Y Slightly turbid
22 South Morrison Creek @ Fred Haight Dr. 3/3/2018 15:26 J.Garwood, T. Dettmar 404912 4639403 Y Slightly turbid
23 Mid‐Morrison Creek Backwater Trib 3/4/2018 10:45 J.Garwood, T. Dettmar 403823 4640366 Y Turbid‐very dirty