20180514 IR Q1 -IR roadshow booklet - abnamro.com€¦ · 5 1) Around 1,500 applications have been...
59
Investor Relations results Q1 2018 14 May 2018 roadshow booklet
Transcript of 20180514 IR Q1 -IR roadshow booklet - abnamro.com€¦ · 5 1) Around 1,500 applications have been...

Investor Relations
results Q1 2018
14 May 2018roadshow booklet

2
Q1 results presentation 3
Additional slides 18
− Profile 19
− Financials 34
− Risk management 43
− Capital, funding & liquidity 48
Important notice 58
Table of contents

3
Highlights of Q1, a solid quarter
Financial progress
Net profit at EUR 595m and ROE of 11.5%, reflecting a strong operating result offset by high impairments
NII remained strong, benefitting from loan growth, driven by corporate loans, including Dutch SMEs
Improved operating result led to a C/I ratio of 57.9%
Strong CET1 capital ratio of 17.5%
Strategic progress
Cost savings from transformation and business simplification coming through
Progress on IT transformation, digital and innovation
Private Banking transformation taking shape
Bringing more focus to CIB, update at Q2
A leading franchise in sustainability is developing
On track to achieve 2020 financial targets

4
1) Sum of incidental costs (2017): personnel expenses EUR 177m (restructuring provisions EUR 156m, sale PB Asia EUR 21m), other expenses EUR 228m (SME Derivatives EUR 139m, goodwill impairment EUR 36m, sale PB Asia 35m and some smaller items in total EUR 18m)
2) 9% excluding PB Asia divestment
Cost savings from transformation and business simplification coming through
Costs development 2015-2017 Business simplification: lower headcount & branches
Transformation progressing: cost savings enable investments in digital, innovation and growth initiatives
Digitalisation of processes and agile working methods lower headcount and size of retail branch network
Cost/income 57.9% in Q1 2018: on track to deliver EUR 0.9bn costs savings and 56-58% target by 2020 through further savings
Further cost savings come from existing programmes, mainly from further FTE reductions, IT run costs and extending agile way of working
FTEs (in ‘000) down 10%2)
260221 202
179
YE15 YE16 YE17 1Q18
Retail branches
22.0
21.7
20.0
19.6
4.5 4.3 4.0 4.1
26.5 26.0 24.0 23.7
YE15 YE16 YE17 1Q18
Internal External
5,22
8
5,58
2
5,17
5
250227
405-63
-467
Rep
orte
d20
15
Div
este
dac
tiviti
es
Sav
ings
Infla
tion
&le
vies
Inve
stm
ents
Bas
e 20
17
Inci
dent
als
Rep
orte
d20
17
-1%
EUR m
1)

5
1) Around 1,500 applications have been decommissioned from a YE2019 target of around 2,000 applications
Progress on IT transformation, digital and innovation
13 462
730
YE2015 Q1 2018 YE2018Target
What is achieved Future focus
Applications migrated to cloud 1)
Efficiency & speed IT run cost reduced and back-office
efficiency increased Agile way of working implemented
Cost discipline and next round of efficiency levers (AI, automation)
Further extend agile ways-of-working
IT infrastructure and system landscape IT transformation (start 2013) well on
track, milestones & savings secured Adoption of cloud
No new core systems, modernise system landscape
Fully leverage flexibility and scalability of cloud
Digitalisation Enhanced digital experience with award
winning apps: mobile, Tikkie, Grip Retail client sales and services now
59% online and increasing
Enhance client experience in key client journeys and establish ecosystems
Strengthen digital offering in Commercial and Private Banking, use ‘challenger’ lessons
Innovation & Partnering Key building blocks in place: digital
challenger concepts, API developer portal, Blockchain pilots
Focussed investments by Digital Investment Fund
Intensify partnerships (big and small) and leverage our API platform
Unlock potential of AI, open banking and Blockchain
1,51
2
947
869
YE2015 Q1 2018 YE2018Target
FTEs in operations in I&T
35% 59
%
65%
YE2015 Q1 2018 YE2018Target
Retail client sales and services online

6
Digital innovation enhancing customer experience, supporting future growth
Ready for open banking & PSD2 Tikkie App, Portal and API
Open banking enables new solutions and allows targeting of new clients
Capabilities in place to build and launch PSD2 propositions
API Developer Portal launched in 2017 to accelerate innovation with (FinTech) partners
Building developer community to foster API opportunities & innovation
GRIP App
Developed ahead of PSD2 c. 3m users, 80% of payment
requests paid ≤24hours, NPS +74 Recently launched in Germany Well embraced by Dutch SMEs,
corporates and charities
Tikkie API & Portal now adopted by third parties
Offers a convenient breakdown of personal income and expenses
Includes financial planning features to get a grip on spending
c.450k users, NPS +16
Co-developed with an experienced FinTech aggregator of data
Provides valuable insights for personalised client propositions, subject to data privacy rules

7
Private Banking transformation taking shape
AUM managed though an open architecture model Private Banking FTE reductionFTEs
Strong market positions
One private bank leveraging scale across Europe
Strong local brands with focus on NW-Europe
Asia divested, Luxembourg sale announced
Operational simplification and digitalisation progressing: harmonised client segments, service offering and platforms across countries resulting in cost savings, delivering scale and lower FTEs
Basel IV impact on private banking is neutral
Next steps & aspirations
Further invest in IT and digital banking to improve processes, client convenience and client portals
Improve C/I ratio and ROE in individual countries
Leveraging on a modern open architecture
Increase sustainable client assets to EUR 16bn by 2020 (>10bn Q1 2018)
Well positioned for organic NNA growth and bolt-on M&A
EUR bn
3,722
3,104
YE2015 Divestments Transformation 2018 Q1
-17% vs. YE2015
17
199 200
YE2015 2018 Q1
NL GE FR BE Other Divested

8
1) ABN AMRO was bookrunner in 11 green bond deals (o/w 8 from bank issuers) with a combined deal value of USD 1.6bn in 2017. ABN AMRO was structuring advisor and/or bookrunner on inaugural issues from SEB, Swedbank, Barclays, Hypo Vorarlberg, Deutsche Hyp and LBBW, and had repeat mandates from Berlin Hyp and DKB
Building a leading franchise in sustainability
x
Become partner of choice to support clients making a step-change towards a circular business model
Finance EUR 1bn in circular corporate loans by 2020 and reduce CO2 emission
Examples of circular transactions recently financed
− Bajes Kwartier, redevelopment of a former prison
− ‘Light as a service’ with smart LEDs
− Circular dismantling of airplanes
− Vibers, a new natural material to replace plastic
Support corporates with sustainability expertise Commitment to building a circular economy
First bank to issue a Dutch green bond in 2015
Track record as lead manager and structurer of green bonds for international banks and other issuers 1)
Global coordinator in Alfen IPO, an energy solutions provider of sustainable and innovative electricity grids
First Asian sustainability linked loan to a leading Asian agri-corporate
‘Circular Economy Investor’ Award
World Economic ForumDavos, 2018
Circularity: continued use and re-use of resources for the longest possible time. Reduce waste, address the problem of shrinking stocks of resources and reduce carbon emissions
Solar parking lot at TT Assen, the Netherlands

9
1) In this presentation all 2018 financials are presented in accordance with IFRS9, whereas historic financials are presented in accordance with IAS39
Solid quarter
Net profit of EUR 595m, down 3%
Limited effect of incidentals
Operating income up 4%, reflecting strong NII and good Equity Participations results
Operating expenses flat, despite new collective labour agreement
Impairments up, reflecting challenges in specific sectors such as Shipping and Offshore services (both oil & gas related) and Diamond & Jewellery
Key points 1)EUR m 2018 Q1 2017 Q1 Delta
IFRS9 IAS39
Net interest income 1,671 1,596 5%
Net fee and commission income 431 452 -5%
Other operating income 227 198 15%
Operating income 2,329 2,246 4%
o/w incidentals 25 31
Operating expenses 1,348 1,353 0%
o/w incidentals 46 41
Operating result 981 893 10%
Impairment charges 208 63
Income tax expenses 178 215 -17%
Profit 595 615 -3%

10
1) Corporate loans CIB: increase of EUR 3.3bn vs. Q4 2017 (o/w EUR 1.8bn reclassification from professional lending), and includes effect of USD depreciation (EUR -0.7bn). Effect of USD depreciation vs. Q1 2017 EUR -4.3bn
Client lending picking up through corporate loans
Mortgage client lending Corporate client lending
Mortgage loans flat in Q1, despite strong competition in Dutch mortgage market and rising amortisation levels
Corporate loan growth, reflecting strong growth in Dutch SMEs (in CB) and Financial Institutions, Food & Retail and a EUR 1.8bn reclass (in CIB) 1)
Stable volumes maintained for Consumer loans in Q1
Consumer loans client lending
EUR bn EUR bn EUR bnCAGR = 0% CAGR = 4% CB, 1% CIB (ex reclass) CAGR = 0%
150.
7
150.
6
150.
7
110
125
140
155
Q1 Q2 Q3 Q4 Q1
2017 201840
.1
38.9
42.2
39.1
39.6 40.8
20
30
40
50
Q1 Q2 Q3 Q4 Q1
2017 2018
CIB Commercial Banking
12.3
12.4
12.3
0
10
20
30
Q1 Q2 Q3 Q4 Q1
2017 2018
1)
11
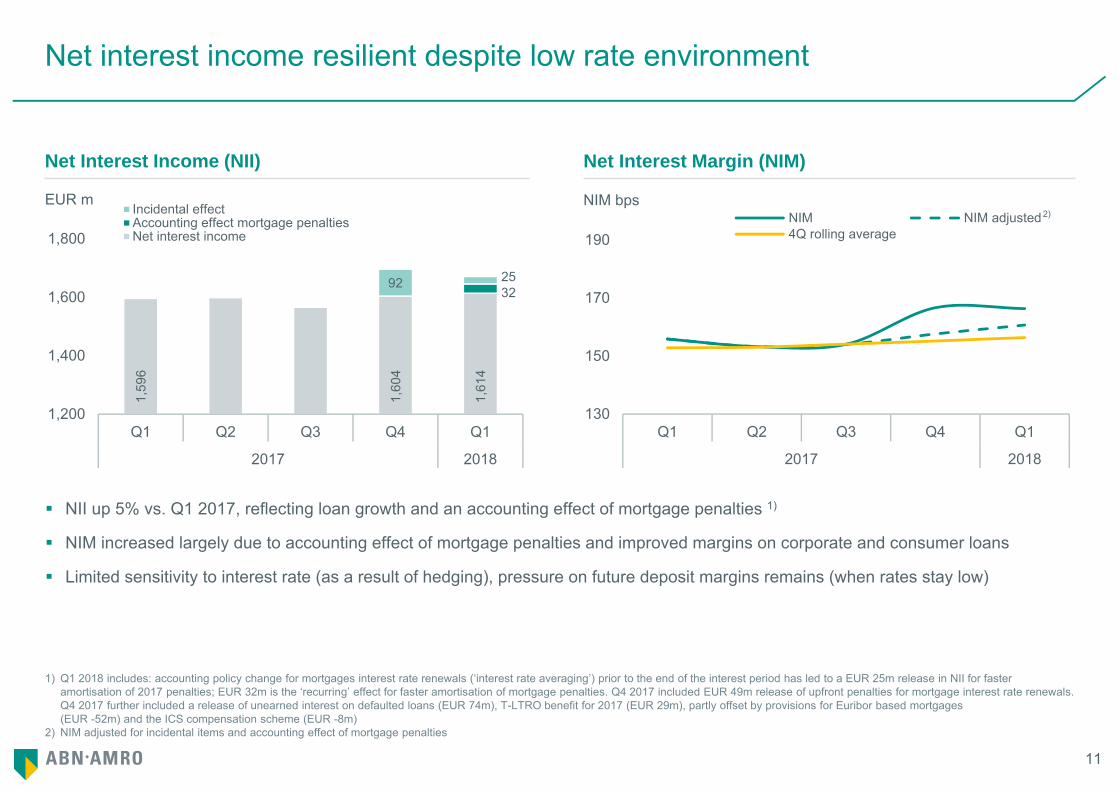
1) Q1 2018 includes: accounting policy change for mortgages interest rate renewals (‘interest rate averaging’) prior to the end of the interest period has led to a EUR 25m release in NII for faster amortisation of 2017 penalties; EUR 32m is the ‘recurring’ effect for faster amortisation of mortgage penalties. Q4 2017 included EUR 49m release of upfront penalties for mortgage interest rate renewals. Q4 2017 further included a release of unearned interest on defaulted loans (EUR 74m), T-LTRO benefit for 2017 (EUR 29m), partly offset by provisions for Euribor based mortgages (EUR -52m) and the ICS compensation scheme (EUR -8m)
2) NIM adjusted for incidental items and accounting effect of mortgage penalties
Net interest income resilient despite low rate environment
Net Interest Income (NII) Net Interest Margin (NIM)
NII up 5% vs. Q1 2017, reflecting loan growth and an accounting effect of mortgage penalties 1)
NIM increased largely due to accounting effect of mortgage penalties and improved margins on corporate and consumer loans
Limited sensitivity to interest rate (as a result of hedging), pressure on future deposit margins remains (when rates stay low)
EUR m NIM bps
1,59
6
1,60
4
1,61
4
92
1,200
1,400
1,600
1,800
Q1 Q2 Q3 Q4 Q1
2017 2018
Incidental effectAccounting effect mortgage penaltiesNet interest income
130
150
170
190
Q1 Q2 Q3 Q4 Q1
2017 2018
NIM NIM adjusted 2)4Q rolling average
3225
2)

12
Non-interest income is slightly up
Net fee income
Fees slightly lower vs. Q1 2017 reflecting the sale of PB Asia and lower fee income in Retail and CIB
Higher other income for the quarter, reflecting good Equity Participation results (EUR 102m) in CIB and a revaluation of the equensWordline stake (EUR 46m)
Lower accounting effects Q1 2018 (Q1 2017): hedge accounting EUR 24m (EUR 50m), CVA/DVA/FVA EUR -4m (EUR 23m)
EUR m EUR m
Other operating income
441
443
431
11
0
175
350
525
Q1 Q2 Q3 Q4 Q1
2017 2018
Net fee income PB Asia (sold)
198
176
227
114
0
200
400
600
Q1 Q2 Q3 Q4 Q1
2017 2018
Gain PB Asia (Q2) / Visa (Q4)Other incomeGuidance

13
Operating expenses trending down
Operating expenses 1) Transition operating expenses 2)
EUR m EUR m
Personnel expenses trending down, mainly reflecting lower FTE levels
Restructuring provision (EUR 31m) relates to reorganisation of control and support activities (in GF) and Markets (in CIB) 3)
Other expenses remained flat vs. Q1 2017, reflecting mainly I&T run cost savings offset by higher IT costs for innovation
1) Q1 2017 still includes costs for PB Asia activities, which were divested on 1 April 20172) Inflation & Levies up EUR 38m, o/w EUR 16m one-off CLA payment and EUR 4m regulatory levies, remainder being mainly wage inflation3) Q1 2018 incidentals: restructuring provision EUR 31m (Q1 2017 EUR 12m), one-off CLA effect EUR 16m
620
596
582
594
698
589
0
500
1,000
1,500
2,000
Q1 Q2 Q3 Q4 Q1
2017 2018
Personnel Other expenses Regulatory levies Incidentals
1,35
3
1,34
8
38
4419-28
-76
Q1 2017 Divestedactivities
Savings Inflation& levies
Invest-ments
Restruc-turing
Q1 2018

14
1) As of 2018 impairments are recognised under IFRS9 accounting rules, which replaced IAS39 accounting rules2) ECT has been reorganised into new CIB industry lending sectors. Impairments in ‘former ECT’ were EUR 97m over Q1 2018 (FY2017 EUR 186m, FY2016 EUR 209m)
High impairments in specific industry sectors
Impairments by business segment Breakdown Q1 2018 impairments
Higher impairments, largely recorded in stage 3 on defaulted loans and unrelated to IFRS9 implementation
Oil & gas related impairments particularly in Off-shore Support Vessels (Shipping) and Off-shore services 2)
Impairments on several CB clients, predominantly in healthcare
Diamond & Jewellery sector faces challenges causing impairments, portfolio declined in recent years
EUR m
4477
15263 -965 -34
208
-250
-125
0
125
250
Q1 Q2 Q3 Q4 Q1
2017 2018
RB CB CIB PB & GFIndustry sector Impairments Segment Comment
Shipping - OSV 46m CIB Global Transportation & Logistics,former ECT-Transportation
Dutch SMEs 44m CB Health care, manufacturing
Off-shore services 42m CIB Natural Resources, former ECT-Energy
Diamond & Jewellery 41m CIB
Commodities 8m CIB Part of Trade & Commodity Finance, , former ECT-Commodities
Other 27m All
Total 208m

15
1) Basel IV and draft CRR propose a change in calculation of derivative exposures and credit conversion factors for off-balance sheet items. The revised calculation results in a decreasing exposure measure for clearing guarantees by approximately EUR 55-60bn
Strong CET1 capital provides resilience against Basel IV impact
CET1 fully loaded capital Risk weighted assets
Strong CET1 ratio 17.5%, includes IFRS9 impact of -12bps
RWAs up, driven by credit risk reflecting loan growth to Dutch SMEs, CIB (mainly FIs, Food & Retail) as well as higher RWAs for defaulted loans
Fully loaded group leverage ratio at 4.0%, excluding a change in Clearing exposure measure improving the ratio by 0.5-0.6% 1)
MREL of 27.8% of RWA, on track to meet our 29.3% ambition by YE2019 (see appendix)
Leverage ratio fully loaded
Fully loaded CET1% RWA bn
106.
2
107.
9
2.3
-0.5
2017
Q4
Cre
dit
risk
Ops
. &M
arke
tris
k
2018
Q1
0.0%
-0.1%
4.1%
4.0%
2017
Q4
T1C
apita
l
Exp
osur
eM
easu
re
Gro
up20
18 Q
1
17.5
%
0.3%
-0.1% -0.3%
17.7
%20
17 Q
4(IA
S39
)
IFR
S9
Ret
aine
dea
rnin
gs
RW
A
2018
Q1

16
Capital management developments
Aim to meet fully loaded Basel IV CET1 requirements early in the phase-in period
Capital target range of 17.5-18.5% to be reviewed at YE2018, to reflect RWA developments under Basel III and Basel IV
Dividend pay-out of 50% of sustainable profit, from 2018
Additional distributions will be considered when capital is within or above the target range and depending on other circumstances, including regulatory and commercial considerations. Combined distribution amounts to at least 50% of sustainable profit
Capital management framework
Framework published on 7 Dec 2017 Awaiting regulatory decisions to be made
− Quantitative Impact Study (QIS)− EU implementation− Future supervisory decisions
Assessing opportunities for remediation Investigating opportunities for repricing and adapting business
mix and model
Regulatory: AMA, TRIM, FRTB, add-ons, NPL guidance Capital requirements, SREP & stress test Business developments Credit quality migration/developments Model reviews and updates FX movements Management actions
Basel III Capital & RWA drivers Basel IV RWA drivers

17
1) Excluding the gain on PB Asia sale the ROE was 13.4% and C/I was 61.2%2) Capital target range to be reviewed at YE20183) Sustainable profit excludes exceptional items that significantly distort profitability; examples from the past would have been the book gain on PB Asia sale (2017) and the provision for SME derivatives
(2016). Additional distributions will be considered when capital is within or above the target range, and are subject to other circumstances, including regulatory and commercial considerations
Financial targets
2017 2018 Q1 Targets
Return on Equity 14.5% 1) 11.5% 10-13%
Cost/Income ratio 60.1% 1) 57.9% 56-58%(by 2020)
CET1 ratio (FL) 17.7% 17.5% 17.5-18.5% 2)
(2018)
Dividend - per share (EUR)- pay-out ratio
1.4550%
-
50% of sustainable profit 3)
Additional distributionswill be considered 3)
Combined at least 50%

Additional slides

Profile

20
1) Source: ABN AMRO Group Economics, CBS Statline. Q1 2018 GDP for the Netherlands is estimated by ABN AMRO Group Economics
Strong Dutch economy and housing market
0
30
60
90
0
45
90
135
'08 '09 '10 '11 '12 '13 '14 '15 '16 '17 '18
Houses sold (rhs) House prices (lhs, 2015=100)
Dutch economy outperforming Eurozone 1) Strong performance Dutch housing market 1)
Dutch economy expected to drive further growth in client lending and asset quality improvements
GDP growth for the Netherlands expected to continue and again outperform average Eurozone growth for 2018
House prices have almost recovered to pre-crisis levels, transactions expected to come down due to scarcity in supply
GDP annualised, % Index # ‘000
0.0%
2.5%
5.0%
7.5%
Q2 Q3 Q4 Q1 Q2 Q3 Q4 Q1 (est.)
2016 2017 2018
Eurozone NL

21
Economic metrics 2016 2017 2018e 2019e
Netherlands GDP (% yoy) 2.1% 3.3% 3.3% 2.6%
Inflation (indexed % yoy) 0.1% 1.3% 1.5% 2.4%
Unemployment rate (%) 6.0% 4.9% 3.8% 3.5%
Government debt (% GDP) 62% 57% 53% 49%
Eurozone GDP (% yoy) 1.7% 2.5% 2.8% 2.3%
Inflation (indexed % yoy) 0.2% 1.5% 1.7% 1.4%
Unemployment rate (%) 10.0% 9.1% 8.0% 7.2%
Government debt (% GDP) 91% 90% 88% 84%Source: ABN AMRO Group Economics 19 April 2018
Dutch economic indicators strong in European context
International orientation, highly competitive: global rank no. 4 by the World Economic Forum
Sound financials: gov. debt 57%, budget deficit 1.1%
Large, persistent external surplus: current account +10.2%
Major recent reforms (retirement age, housing market); pension fund assets ~190%
Numbers as % GDP (2017)
Strong fundamentals NL
Dutch consumer spending Dutch consumer confidence% change vs. same month a year ago, CBS Seasonally adjusted confidence (end of period), CBS
-3%
0%
3%
6%
2015 2016 2017 2018
24
-30
-15
0
15
30
2015 2016 2017 2018
LT avg. of -2
Dutch bankruptcies# per month businesses & institutions, CBS
175
350
525
700
2015 2016 2017 2018

22
1) Transferred to Commercial Banking as of 1 April 20182) Including Private Banking in the Netherlands
Attractive combination of strong and complementary businesses
Retail Banking Commercial Banking Private Banking
Top 3 player in NL Prime bank for c.20% of
Dutch population Nr. 2 in new mortgage
production Nr. 2 in Dutch savings 2)
Leading digital offering, 24/7 Advice and Service Centres and 179 branches
Leveraging scale across Europe
Market leader in the Netherlands
3rd in Germany, 5th in France
Multi-channel client servicing
Focus on IT, digital banking and operational simplification
Leading player in the Netherlands
Sector-based offering to clients with a turnover EUR 1m-250m
Leading player in leasing and factoring in NW-Europe
±5m ±300k
Low capital intensity
Funding gap
retail clients
small enterprises 1)
±100k 6Funding surplus
Low capitalintensity
clients Present incountries
±65k 5Higher capital intensity
Funding balanced
clients Present incountries
Corp. & Inst. Banking
Leading player in the Netherlands
Sector-based offering to large corporates including ECT, FIs and Clearing
Capability-led growth for selected businesses and sectors in NW-Europe and globally
International presence in key financial and logistical hubs
±3k 16Higher capital intensity
Funding gap
clients Present incountries
23
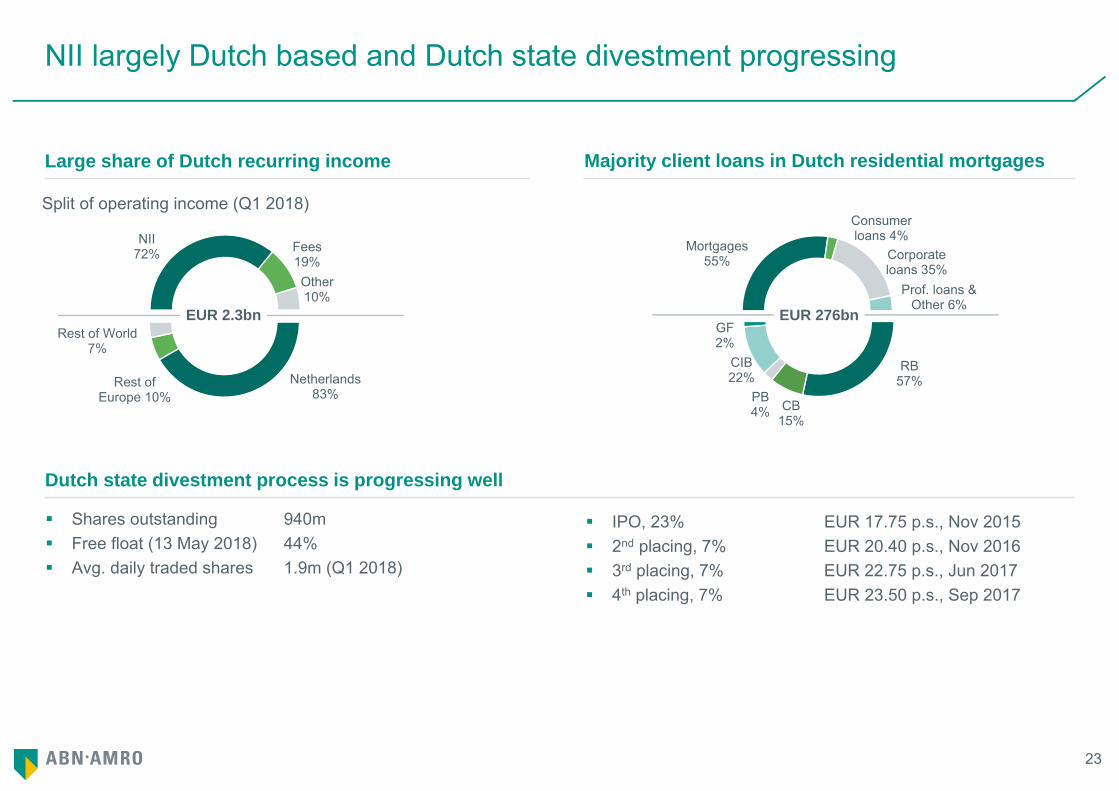
Mortgages 55%
Consumer loans 4%
Corporate loans 35%
Prof. loans & Other 6%
Majority client loans in Dutch residential mortgages
RB 57%
CB 15%
PB 4%
CIB 22%
GF 2%
EUR 276bn
Netherlands 83%
Rest of Europe 10%
Rest of World 7%
NII 72% Fees
19%Other 10%
EUR 2.3bn
Split of operating income (Q1 2018)
NII largely Dutch based and Dutch state divestment progressing
Large share of Dutch recurring income
Shares outstanding 940m Free float (13 May 2018) 44% Avg. daily traded shares 1.9m (Q1 2018)
Dutch state divestment process is progressing well
IPO, 23% EUR 17.75 p.s., Nov 2015 2nd placing, 7% EUR 20.40 p.s., Nov 2016 3rd placing, 7% EUR 22.75 p.s., Jun 2017 4th placing, 7% EUR 23.50 p.s., Sep 2017

24
Banking for better, for generations to come
Building on long-term strategic foundation Client
drivenInvest in
the futureModerate
risk profileSustainable
growth
Medium-term strategic priorities
Profile A relationship-driven, knowledgeable and digitally savvy bank in Northwest Europe with expertise in selected sectors globally
BringExpertise
Enhance ClientExperience
Innovate & Grow
DeliverFast
Share insights Personalised solutions Open up our network
Invest in convenient & inspiring apps and services Reimagined customer journeys Top-notch customer interface &
frictionless security Quick & transparent processes
Innovate in our core and innovate with new business models and growth initiatives
Become agile and accelerate change Focused control and support Simplify the business model

25
Strategic business initiatives towards 2020
AmbitionClient-driven Dutch retail bank with a digital footprint in Northwest-Europe
Growth initiatives Expand digital MoneYou
platform Further explore
cooperation with FinTechs
AmbitionClient driven, modern and knowledgeable NW-European private bank
Growth initiatives Grow in NW-Europe Focus on HNWI open to
innovation Harmonise platforms
Retail Banking Commercial Banking
AmbitionBest commercial bank in the Netherlands
Growth initiatives Sector-based growth
strategy in the Netherlands
Private Banking Corp. & Inst. Banking
AmbitionBest corporate & institutional bank in NL and selected sectors abroad
Growth initiatives Expand activities to mid-
large corporates in NW-Europe
Globally expand adjacent ECT sectors: food production, renewables, utilities, basic materials

26
Developing a future-proof IT landscape and accelerating IT development
IT transformation for speed, flexibility and lower cost
IT infrastructure landscape is being transformed supported by a clear architecture to facilitate continuous change
Private and public clouds enable scalability and shorter time-to-market
Modular designed IT interfaces for re-use and speed
Unlock potential value from data
Clean sweep of phased-out IT systems
Continuously phase-in further modernisations; no new core systems
Bank-wide implementation for IT-related change processes
Self-exploring multidisciplinary teams work in two-week sprints towards minimum viable products
Business lines in the lead on their own IT agenda
Automated testing and deployment of new software functionality
New mind-set accelerates IT development
Further extend agile ways-of-working, including DevOps and lean start-up
Accelerate: agile way-of-working
0%
50%
100%
2014 2015 2016 2017 2018T 2019T
Decommissioning applications in scopeMigration of applications to Cloud in scope
Conceptual representation of target-state IT landscape by 2020
Progress of our IT transformation (started in 2013)
100%(~730)
100%(~2,000)

27
Digitalisation to enhance client experience and improve efficiency
Continuous redesign of customer journeys and processes, leveraging digital competencies such as mobile, social, cloud, and big data
Enhance client experience in key client journeys
Integration of online and offline channels reducing operational hassle, increasing focus on specific client needs
Acceleration of structural improvement to customer journeys and internal processes
Enhancing client satisfaction through digitalisation Reducing FTEs and branches
Strong rationalisation of processes as services move from branches and call centers to mobile and online
Digitalisation primarily focused on most frequently used processes
Continued rationalisation of products and automation of processes
Digitalisation resulted in strong reduction of operational FTE
1,612
947 862
2014 2015 Q12018
2018Target
2015 Q1 2018
RB client sales and services digitally 35% 59%
Direct channel retail contacts
- Mobile banking 76% 85%
- Internet banking 24% 15%
Mortgage webcam advice - 55%
654
179
2008 2012 2015 Q12018
# FTEs operations I&T # Retail Banking branches

28
1) Safeguarding continuity
Priorities for banks are increasingly technologically driven
Strong increase in data, increasing importance of structure and integrity
Improved usage of data due to better analytics and advanced algorithms
Improve services and processes, e.g. process mining to detect bottle-necks
Transform service offering
Fundamental knowledge and insights to explore opportunities e.g. with advanced scenario planning
Safeguarding continuity Generating value from data
Fraud detection system with real time scoring of transactions
Security Operations Centre monitors network security
Identity and access security as a gate-keeper
Over 100bn access checks annually
Data profiling techniques to detect money laundering, malware attacks and phishing

29
An explorative strategy towards Open Banking, engaging in ecosystems
Explore open banking potential
Use broad user base of current apps as steppingstone
API Developer platform to explore opportunities & connect with developers
Digital challengers launched, competing with new competitors
Digitalisation of our advisory capabilities, e.g. with GRIP
Exploring the new playing field and learn by doing
Combining services with partners to deliver a broad value proposition
Speed up innovation and enhance more customer journeys with partners
Targeted initiatives
− Create platforms with 3rd party services, e.g. ‘Tikkie business’
− Distribute capabilities via 3rd parties, e.g. Tweadle (lending)
− Connect & partner with external APIs, e.g. additions to mobile app
Enabling broad adoption among existing clients and new clients
Accelerated exploration of new opportunities
Working with partners, also through Digital Impact Fund, e.g. Tink for Grip and CLS for Tweadle
Beyond Banking Days to identify concepts
Fully embedded in the business model
Engage in digital ecosystems Mutually reinforcing propositions

30
Exploring paradigm shifts and new business models
Incremental innovations to defend and extend products and services
Innovation labs to experiment with new business concepts
Paradigm shifts explored e.g. tokenisation, crypto econ., digital ID, quantum computing & circular economy
Intensify cooperation with partners to accelerate innovation, also through Digital Impact Fund
Partnering include the Dutch Blockchain coalition, R3, IBM, Accenture, Universities, Digital Asset Holding
Broad knowledge base on key technologies such as Artificial Intelligence, Blockchain and smart contracts
Challenger banks launched for retail, private and corporate clients
Agile organisations offering newly developed online propositions for self-directed clients
Large degree of autonomy, running their own IT and operations from separate locations
Share experience on new business concepts and technologies company-wide
Open mind-set and solid innovation capabilities Challenger Banks accelerate innovation
31
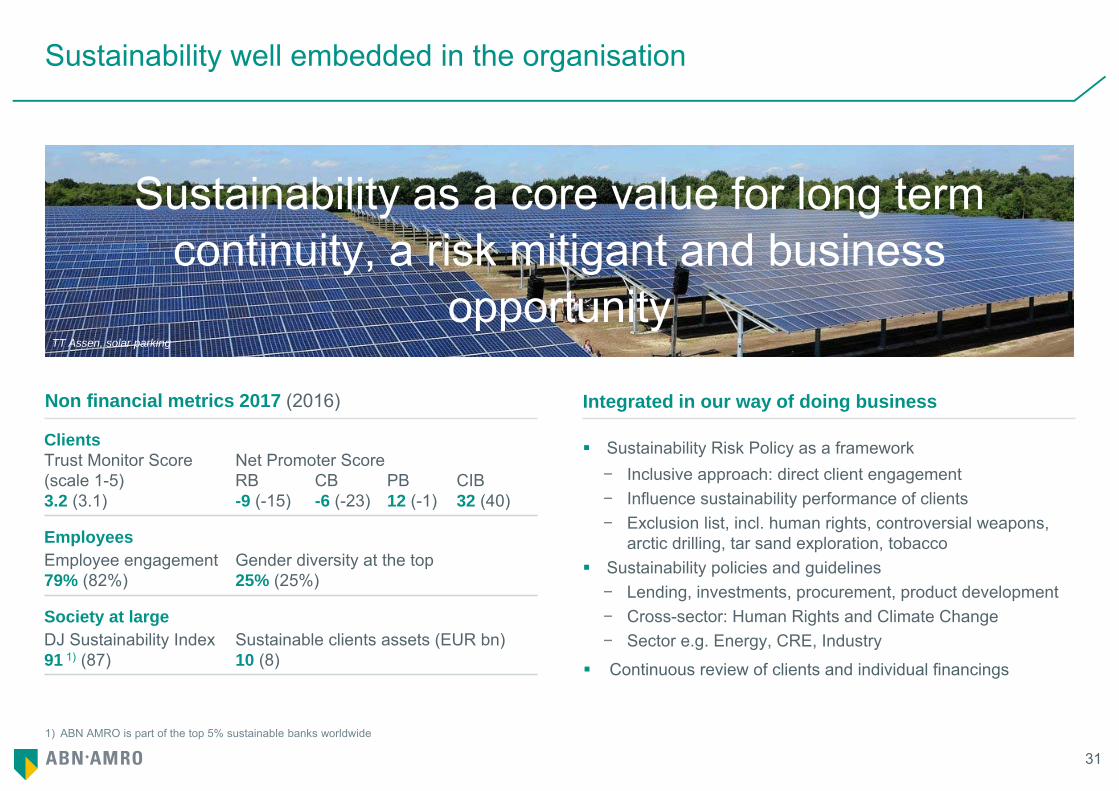
Sustainability as a core value for long term continuity, a risk mitigant and business
opportunity
1) ABN AMRO is part of the top 5% sustainable banks worldwide
Sustainability well embedded in the organisation
Sustainability Risk Policy as a framework − Inclusive approach: direct client engagement − Influence sustainability performance of clients − Exclusion list, incl. human rights, controversial weapons,
arctic drilling, tar sand exploration, tobacco Sustainability policies and guidelines
− Lending, investments, procurement, product development − Cross-sector: Human Rights and Climate Change− Sector e.g. Energy, CRE, Industry
Continuous review of clients and individual financings
Integrated in our way of doing business Non financial metrics 2017 (2016)
ClientsTrust Monitor Score Net Promoter Score(scale 1-5) RB CB PB CIB3.2 (3.1) -9 (-15) -6 (-23) 12 (-1) 32 (40)
EmployeesEmployee engagement Gender diversity at the top 79% (82%) 25% (25%)
Society at largeDJ Sustainability Index Sustainable clients assets (EUR bn)91 1) (87) 10 (8)
TT Assen, solar parking

32
Key themes sustainability
Climate Human Rights
Improve real estate portfolio to ‘A’ label by 2030
Own real estate energy label A by 2023
Double sustainable AuMto EUR 16bn by 2020 in Private Banking
Number 1 position in real estate sustainability benchmark (GRESB)
Circular economy Social entrepreneurship
First Human rights report by a bank worldwide
Focus on privacy, discrimination, labour and land related rights
Implementation of the Dutch Banking Sector Agreement on international responsible business conduct regarding human rights
Become partner of choice to support clients towards a circular business model
Aim by 2020: EUR 1bn circular assets and 1 megaton CO2 reduction
Recently several circular transactions financed
1st health related Impact Bond issued, in total six Social Impact Bonds
Increase impact banking loan portfolio to EUR 50m in upcoming years
Recently agreed on two loan participations reaching coffee farmers in Latin America and Uganda
33
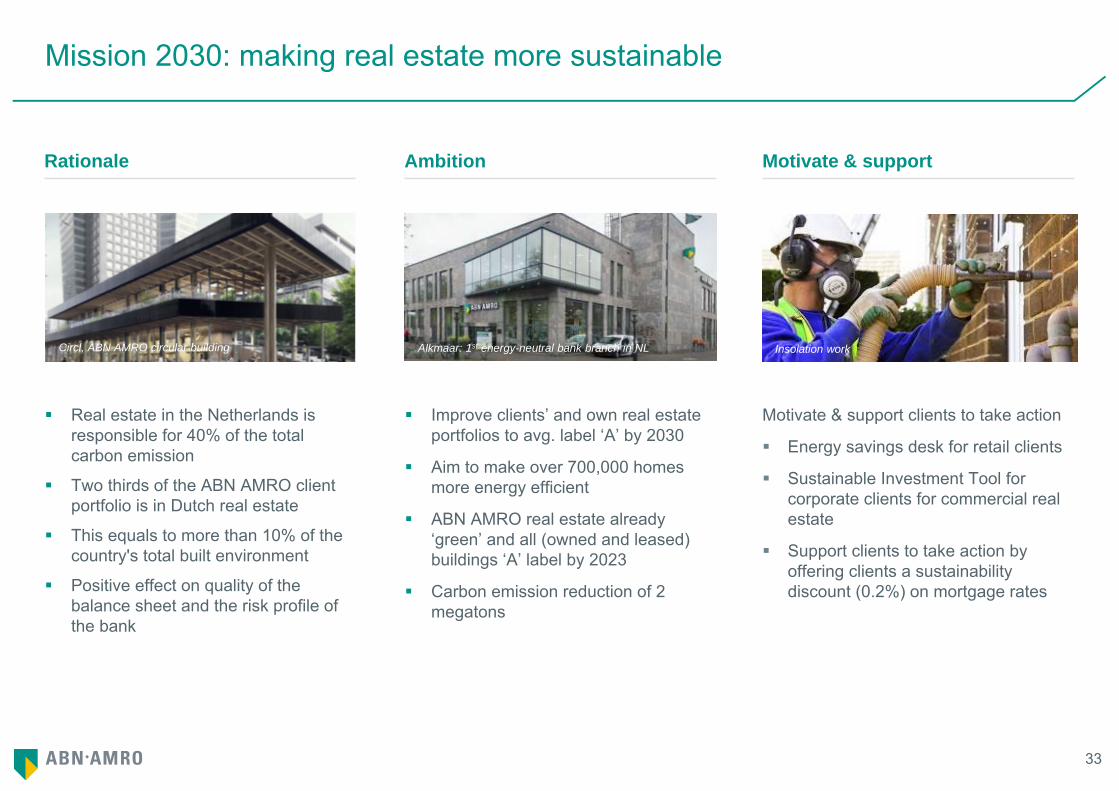
Mission 2030: making real estate more sustainable
Rationale Ambition
Real estate in the Netherlands is responsible for 40% of the total carbon emission
Two thirds of the ABN AMRO client portfolio is in Dutch real estate
This equals to more than 10% of the country's total built environment
Positive effect on quality of the balance sheet and the risk profile of the bank
Motivate & support
Improve clients’ and own real estate portfolios to avg. label ‘A’ by 2030
Aim to make over 700,000 homes more energy efficient
ABN AMRO real estate already ‘green’ and all (owned and leased) buildings ‘A’ label by 2023
Carbon emission reduction of 2 megatons
Motivate & support clients to take action
Energy savings desk for retail clients
Sustainable Investment Tool for corporate clients for commercial real estate
Support clients to take action by offering clients a sustainability discount (0.2%) on mortgage rates
Alkmaar: 1st energy-neutral bank branch in NLCircl, ABN AMRO circular building Insolation work

Financials

35
Solid Q1 2018 results
EUR m Q1 2018 Q1 2017 DeltaNet interest income 1,671 1,596 5%Net fee and commission income 431 452 -5%Other operating income 227 198 15%Operating income 2,329 2,246 4%Operating expenses 1,348 1,353 0%Operating result 981 893 10%Impairment charges 208 63Income tax expenses 178 215 -17%Profit 595 615 -3%
Profit−Retail Banking 303 326 -7%−Commercial Banking 109 132 -18%−Private Banking 66 53 23%−Corporate & Inst. Banking 74 88 -16%−Group Functions 44 16
Net interest margin (bps) 166 156Cost of risk (bps) 32 9
Earnings per share (EUR) 0.59 0.64Dividend per share (EUR) n/a n/a
36
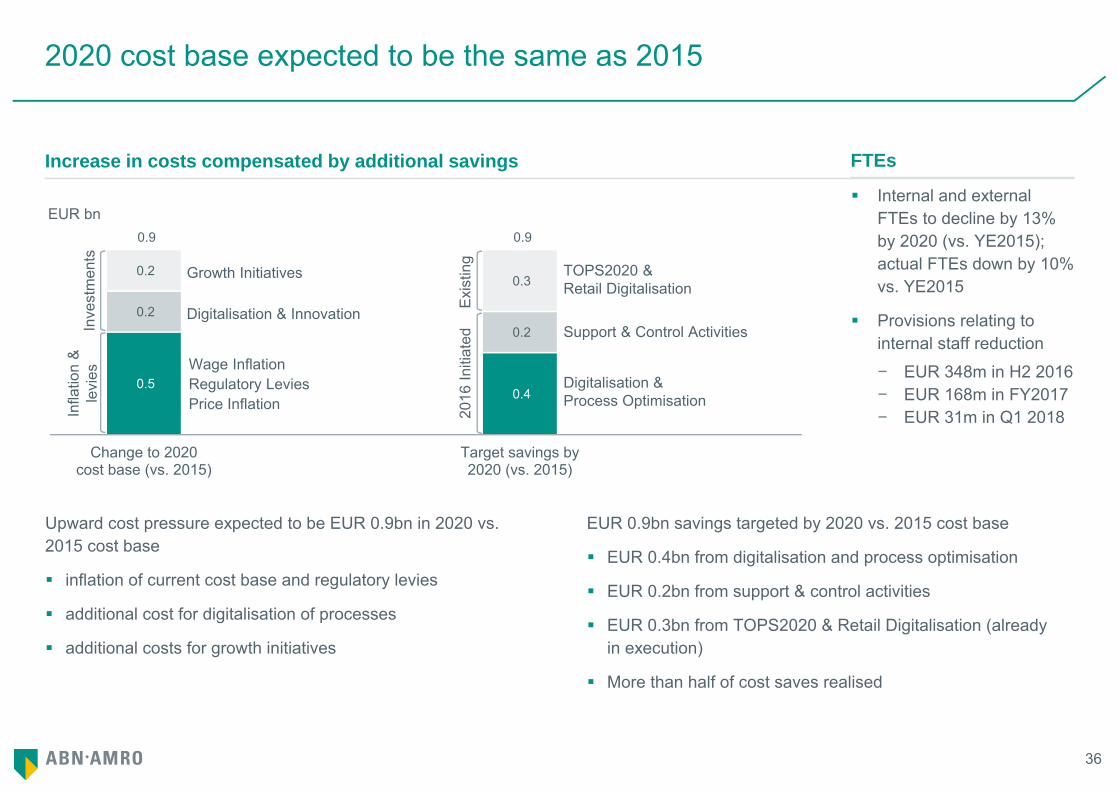
2020 cost base expected to be the same as 2015
0.5
0.2
0.2
0.4
0.2
0.3
0.9 0.9
Change to 2020cost base (vs. 2015)
Target savings by2020 (vs. 2015)
EUR bn
Inve
stm
ents
Infla
tion
&
levi
es
Exi
stin
g20
16 In
itiat
ed Support & Control Activities
TOPS2020 & Retail Digitalisation
Digitalisation & Process Optimisation
Wage InflationRegulatory LeviesPrice Inflation
Growth Initiatives
Digitalisation & Innovation
Upward cost pressure expected to be EUR 0.9bn in 2020 vs. 2015 cost base
inflation of current cost base and regulatory levies
additional cost for digitalisation of processes
additional costs for growth initiatives
Increase in costs compensated by additional savings
EUR 0.9bn savings targeted by 2020 vs. 2015 cost base
EUR 0.4bn from digitalisation and process optimisation
EUR 0.2bn from support & control activities
EUR 0.3bn from TOPS2020 & Retail Digitalisation (already in execution)
More than half of cost saves realised
FTEs
Internal and external FTEs to decline by 13% by 2020 (vs. YE2015); actual FTEs down by 10% vs. YE2015
Provisions relating to internal staff reduction
− EUR 348m in H2 2016− EUR 168m in FY2017− EUR 31m in Q1 2018

37
1) NII-at-risk is published twice a year, in Q2 (Q2 report) and in Q4 (annual report). In the calculation some floors are applied in the falling interest rate scenario: we apply a floor of 0bps for retail deposits and a floor of -100bps for market rates
Source: SNL, 3m EURIBOR and 10yr NL benchmark yields based on end of period
Interest income actively managed
Hedging the balance sheet against interest rate movements helps stabilise NII
NII, EUR bn Yield Conceptually, interest rate risk is managed by swapping both assets and liabilities to floating
In practice what we do is:− Wholesale funding and the liquidity buffer are swapped
individually to a floating rate− Loans and deposits are managed on a portfolio basis,
where only the net interest exposure is hedged with swap contracts
As a result, interest income is predominantly driven by the commercial margin and volume developments
NII-at-Risk from a 200bps gradual interest rate at YE2017 1)
− decline, in 12 months: around -0.5% (EUR -27m) in NII− rise, in 12 months: around 1.9% (EUR 106m) in NII
-1.0%
0.0%
1.0%
2.0%
3.0%
0
0.5
1
1.5
2
2014 2015 2016 2017 2018
NII (lhs)3mth Euro LIBOR (rhs)10yr NL (rhs)

38
Leading Retail Bank
Key strengths
Leading Retail Bank in the Netherlands with stable and recognised market positions and a loyal client base
Effective multi-label strategy with clear earnings model
Seamless omni-channel distribution, with best in class digital offering
Digital innovation driving digital sales of products and services
Low-risk model and resilient good financial performance
Strong client feeder for Private Banking
Financials and key indicators Financials and key indicators
EUR m Q1 2018 Q1 2017Net interest income 855 866Net fee and commission income 100 105Other operating income 5 4Operating income 960 976Operating expenses 551 543Operating result 409 432Loan impairments 4 -4Income tax expenses 102 110Profit for the period 303 326
Contribution group operating income 41.2% 43.4%Cost/income ratio 57.4% 55.7%Cost of risk (in bps) 1 -1
EUR bn Mar 2018 YE2017Client lending 157.6 157.6Client deposits 101.9 102.8Client assets 1) 113.9 115.1RWA 27.8 28.7FTEs (#) 5,139 5,192
1) Includes the migration of clients assets to Private Banking due to lowering of the AuM threshold at Private Banking in the Netherlands

39
Sector oriented Commercial Banking
Key strengths
Leading market positions and strong brand name
Sector oriented client portfolio and dedicated sector approach
Relationship-driven business model
Product expertise and capabilities
Risk reward steering and hurdle discipline
Strict credit risk management and monitoring
Growth focus leasing and factoring in NW-Europe
Financials and key indicators Financials and key indicators
EUR m Q1 2018 Q1 2017Net interest income 353 335Net fee and commission income 47 47Other operating income 9 11Operating income 409 393Operating expenses 222 224Operating result 187 169Loan impairments 44 -8Income tax expenses 34 44Profit for the period 109 132
Contribution group operating income 17.6% 17.5%Cost/income ratio 54.2% 57.0%Cost of risk (in bps) 50 -8
EUR bn Mar 2018 YE2017Client lending 40.8 39.6Client deposits 35.8 35.7RWA 24.6 23.8FTEs (#) 2,594 2,773

40
1) Q1 2017 includes results from private banking activities in Asia which were sold in Q2 20172) Q1 2018 client assets breakdown by type: 33% cash and 67% securities (incl. custody 20%). ‘Divested’ is client assets relating to the private banking activities in Asia which were sold in Q2 2017
Private Banking with focus on NW-Europe
One private bank, leveraging scale across core countries in NW-Europe through strong local brands
No. 1 private bank in NL, no. 3 in Germany and no. 5 in France
Modern open architecture model
Well positioned for NNA growth and bolt-on M&A
Funding contributor to the group
Financials and key indicators 1) Key strengths
EUR m Q1 2018 Q1 2017Net interest income 185 164Net fee and commission income 137 152Other operating income 12 18Operating income 333 334Operating expenses 240 269Operating result 94 65Loan impairments 5 -4Income tax expenses 23 16Profit for the period 66 53
Contribution group operating income 14.3% 14.9%Cost/income ratio 72.0% 80.4%Cost of risk (in bps) 20 -12
EUR bn Mar 2018 YE2017Client lending 12.3 12.4Client deposits 63.5 65.0Client assets 200.1 200.6RWA 9.3 9.4FTEs (#) 3,104 3,240
Client assets by geography 2)
110
90
191 199 205 201 200
66
2014 2015 2016 2017 2018 Q1
NL r.o. EuropeDivested Gross margin (bps)
EUR bn

41
Corporate & Institutional Banking with selective international presence
Key strengths
Sector oriented client portfolio and dedicated sector approach
Leading market positions and strong brand name
Relationship-driven business model
Product expertise and capabilities
Risk reward steering and hurdle discipline
Strict credit risk management and monitoring
Selective strategic growth areas
Financials and key indicators Financials and key indicators
EUR m Q1 2018 Q1 2017Net interest income 265 231Net fee and commission income 137 143Other operating income 126 103Operating income 528 477Operating expenses 1) 299 287Operating result 229 190Loan impairments 152 77Income tax expenses 3 25Profit for the period 74 88
Contribution group operating income 22.7% 21.2%Cost/income ratio 56.6% 60.1%Cost of risk (in bps) 105 52
EUR bn Mar 2018 YE2017Client lending 42.2 38.9Client deposits 16.3 18.0Professional lending 18.5 21.3Professional deposits 12.5 12.3RWA 38.8 37.7FTEs (#) 2,594 2,542
1) Q1 2018 includes a restructuring provision in Markets (EUR 7m in personnel expenses)

42
Group Functions for central support functions
Group Functions supports and controls the businesses
Through various disciplines: Strategy & Sustainability, Innovation & Technology, Finance incl. ALM & Treasury, Risk Management, Legal & Compliance, Group Audit, Communication and Human Resources
Financials and key indicators
EUR m Q1 2018 Q1 2017Net interest income 1) 13 -1Net fee and commission income 10 5Other operating income 74 62Operating income 98 66Operating expenses 1) 37 30Operating result 62 36Loan impairments 2 0Income tax expenses 16 21Profit for the period 44 16
EUR bn Q1 2018 YE2017Loans & Advances Customers 6.2 6.6Due to Customers 4.2 2.9RWA 7.3 6.5FTEs (#) 6,185 6,206
1) Q1 2018 includes several incidentals: release on mortgage penalty interest (EUR 25m in Net Interest Income), a positive revaluation related to equensWorldline (EUR 46m in other non-interest income) and a restructuring provision (EUR 24m in personnel expenses). Q1 2017 includes: a restructuring provision (EUR 12m in personnel expenses)

Risk management

44
Clean and strong balance sheet reflecting moderate risk profile
Total assets of EUR 397bn at 31 March 2018
Strong focus on collateralised lending
Loan portfolio matched deposits, long-term debt and equity
Limited reliance on short-term debt
Limited market risk and trading portfolios
Off-balance sheet commitments & contingent liabilities EUR 51bn
Current accounts
35%Demand
deposits 53%
Time deposits & other 12%
234.3bnEUR
Snr. unsecured
34%
Cov. bond 36%
CP/CD 17%
SubDebt 11%
Other 2%
85.3bnEUR
Liabilities HFT 3%
Banks 62%
Other 35%
30.6bnEUR
Cash/Cent banks 53%
Assets HFT 4%
Banks 20%
Other 23%
48.2bnEUR
Mortgages 55%
Consumer loans 4%
Corporate loans 33%
Other 8%
275.8bnEUR
Customer loans69%
Fin. investments
11%
Securities financing 5%
Derivatives 2%
Other 12%
Customer deposits
59%
Wholesale funding
21%
Securities financing 4%
Derivatives 2%
Other 8%
IFRS Equity 5%
Assets Liabilities & Equity

45
Impaired Impaired ImpairedCoverage Coverage Coverage
Risk ratios continue to improve
Residential mortgages1) Consumer loans1)
Strong Dutch economy continues to show low impaired customer loans2) (EUR 6.8bn or 2.5% of customer loan book)
Impaired ratio improved further for consumer & corporate loans and remained again stable for mortgages1)
Coverage ratio on customer loan book remained fairly stable at 33.2% (YE2017: 33.0%)1)
Corporate loans1)
Impaired ratio (Ihs) Coverage ratio (rhs)
0.7% 0.7%
13.0%
0%
10%
20%
30%
0%
1%
2%
3%
YE2016 YE2017 Q1 2018
4.1% 3.8%
52.6%
0%
30%
60%
90%
0%
4%
8%
12%
YE2016 YE2017 Q1 2018
5.4% 5.3%
36.6%
0%
25%
50%
75%
0%
4%
8%
12%
YE2016 YE2017 Q1 2018
1) As of 2018 impaired and coverage ratio are stage 3 ratios in accordance with IFRS9, historic ratios are in accordance with IAS39. Coverage ratios on mortgages and consumer loans were impacted by a reclass and transfer of impairment allowances from consumer loans to mortgages in Q1 2018
2) Impaired customer loans are total loans and advances customers stage 3 in accordance with IFRS9

46
-12
-6
0
6
12
2015 2016 2017 2018
Cost of risk 4Q Rolling cost of risk
Absolute change in mortgage loan book Q1 2018 vs. YE2012 (EUR bn) 1)
33.8
-12.0 -2.1 -23.4
Amortising Interestonly
100%
Partialinterest
only
Othertypes
Partial interest only
32%
Fullinterest only
25%Amortising
3%
Savings16%
Life& other
24%
Partial interest only
32%
Full interest only
18%Amortising
25%
Savings12%
Life & other13%
1) Q1 2018 production: c. 55% in 10-12yrs interest rate maturities, c. 35% >12yrs and c. 10% in 0-9yrs, totalling EUR 4bn. Redemptions were c. EUR 4bn in Q1 2018
Mortgage book benefits from housing recovery and regulatory changes
Low mortgage impairments Strong LtMV improvement, also for ‘>100%’ class
bpsCost of risk remained low, in line with strong Dutch housing market
Mortgage book composition changes towards amortising loans
17.1
%
24.8
% 11.0
%
12.9
%
32.5
%
1.8%
21.5
%
40.6
%
17.6
%
13.1
%
6.2%
1.0%
<50% 50-80% 80-90% 90-100% >100% Un-classified
YE2012Q1 2018
Q1 2018 avg indexed LtMV improved to 69% (66% excl. NHG)
EUR154bnYE2012
EUR 151bnQ1 2018
Estimated average through-the-cycle cost of risk of 5-7 bps

47
1) GLT is Global Transportation & Logistics, Natural Resources is Energy & Basic Materials and TCF is Trade Commodity Finance2) Q1 2018 Impairments of EUR 97m: o/w GTL EUR 46m; Natural Resources EUR 42m; Trade Commodity Finance EUR 8m. Q1 2017 Impairments of EUR 59m: o/w GTL EUR 25m; Natural Resources
EUR 11m; Trade Commodity Finance EUR 24m.
Impairments in sectors formerly known as ECT remain elevated
Transition of loans ‘former ECT’ 1) Impairment developments 2)
Gross carrying amount EUR bn GTL Natural
Resources TCF Total
Q1 2018 9.6 7.2 11.7 28.5
YE2017 9.6 7.0 11.6 28.2
- o/w Energy 6.2 6.2
- o/w Commodities 0.8 11.6 12.4
- o/w Transportation 9.6 9.6
Exposures in these sectors are largely USD denominated
EUR m
186
97
0
100
200
300
2013 2014 2015 2016 2017 Q1 2018
Former ECT sectors transferred into new CIB industry sectors: GTL, Natural Resources and TCF1)
Recovery in GTL observed in Dry Bulk & Container segments, however Tanker and Off-shore supply segments still face challenges
Off-shore segment in Natural Resources still struggles with overcapacity, although there is a growing sense the market is bottoming out
We remain cautious even though the oil price improvement led to lower FR&R inflow
Capital, Liquidity & Funding
49
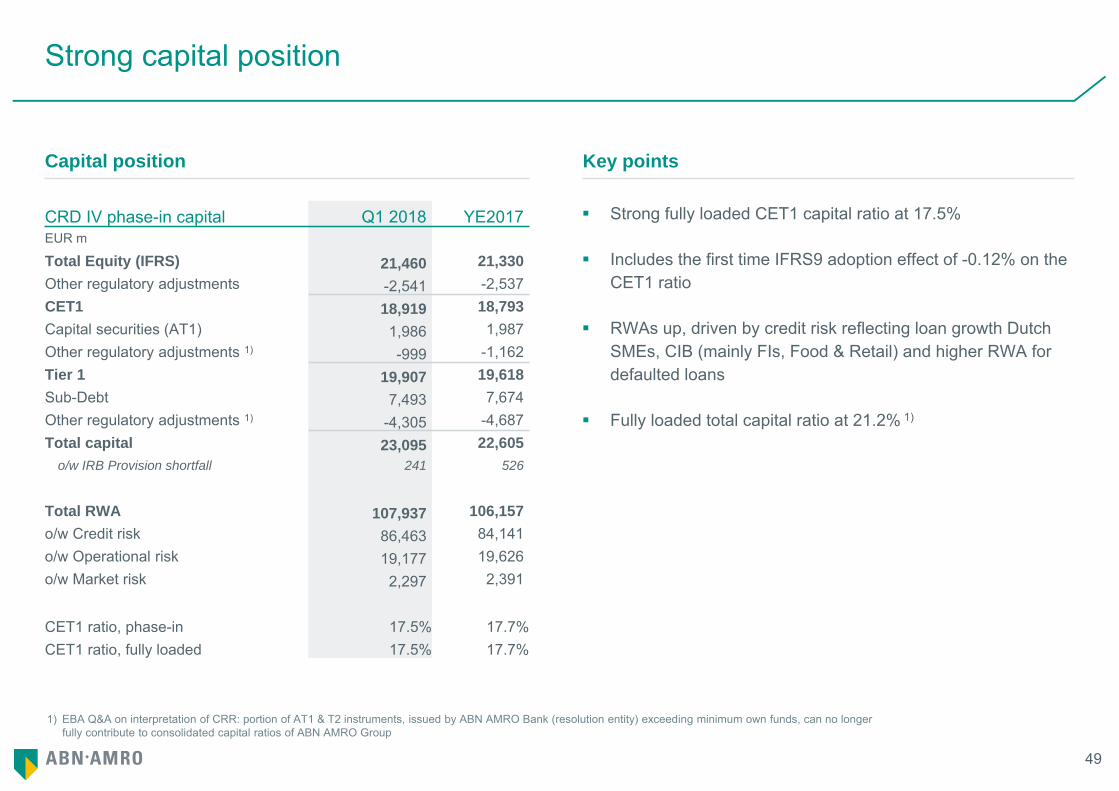
Strong capital position
Capital position Key points
Strong fully loaded CET1 capital ratio at 17.5%
Includes the first time IFRS9 adoption effect of -0.12% on the CET1 ratio
RWAs up, driven by credit risk reflecting loan growth Dutch SMEs, CIB (mainly FIs, Food & Retail) and higher RWA for defaulted loans
Fully loaded total capital ratio at 21.2% 1)
CRD IV phase-in capital Q1 2018 YE2017EUR m
Total Equity (IFRS) 21,460 21,330Other regulatory adjustments -2,541 -2,537CET1 18,919 18,793Capital securities (AT1) 1,986 1,987Other regulatory adjustments 1) -999 -1,162Tier 1 19,907 19,618Sub-Debt 7,493 7,674Other regulatory adjustments 1) -4,305 -4,687Total capital 23,095 22,605
o/w IRB Provision shortfall 241 526
Total RWA 107,937 106,157o/w Credit risk 86,463 84,141o/w Operational risk 19,177 19,626o/w Market risk 2,297 2,391
CET1 ratio, phase-in 17.5% 17.7%CET1 ratio, fully loaded 17.5% 17.7%
1) EBA Q&A on interpretation of CRR: portion of AT1 & T2 instruments, issued by ABN AMRO Bank (resolution entity) exceeding minimum own funds, can no longer fully contribute to consolidated capital ratios of ABN AMRO Group

50
1) Sustainable profit excludes exceptional items that significantly distort profitability; examples are book gain on PB Asia sale (2017) and provision for SME derivatives (2016)
Capital target range reflects Basel IV impact
Estimated Basel IV impact Capital target range
Basel IV impact estimated at around 35% RWA increase
Well placed for Basel IV given strong current CET1 of 17.5%
Final impact subject to EU implementation (2022), transitional arrangements (from 2022), ongoing business developments and mitigating actions
Capital target range of 17.5-18.5% CET1 ratio under Basel III for 2018
Dividend pay-out of 50% of sustainable profit1) from 2018 onwards. Additional distributions will be considered when capital is within or above target range. Combined at least 50%
ROE and C/I target ranges unchanged
Fully loaded CET1 ratio RWA bn
~ 35%
Basel IIIYE2017
Pro forma YE2017Basel IV at 72.5% floor
13.5%
4-5% 17.5-18.5%
Formertarget
Basel IV imple-mentation buffer
Target 2018
in B
asel
III t
erm
s

51
1) Sustainable profit excludes exceptional items that significantly distort profitability; examples are book gain on PB Asia sale (2017) and provision for SME derivatives (2016)
Dividend pay-out of 50% plus possible additional distributions
Capital use as percentage of sustainable profit from 2018
Dividend pay-out of 50% of sustainable profit, from 2018 onwards 1)
Additional distributions will be considered when capital is within or above the target range and depending on other circumstances, including regulatory and commercial considerations
Combined at least 50%
sustainable profit
Organic RWA developments
Modest profitable business growth
Credit quality developments
Modelling and regulatory developments
Dividend pay-out 50%
Other capital uses
Additions to CET1
Special dividends or share buy-backs
Inorganic growth

52
MREL framework now based on RWAs
Steering through profit retention, sub debt, NPS, balance sheet management and excludes use of senior unsecured
Increase of c. EUR 1.6bn in CET1 or eligible instruments required to meet 29.3% ambition of YE2019, assuming no change in RWAs
Implementation NPS in Dutch law expected in H2 2018. NPS issuance not before YE2018
1) ABN AMRO Bank appointed as resolution entity: therefore external MREL eligible instruments continue to be issued through ABN AMRO Bank
Capital ambitions on track
Fully loaded group leverage ratio at 4.0%
Negative impact EBA Q&A ruling on minority interest of -0.2%
Basel IV/CRR2 are estimated to decrease the exposure measure resulting in c. 0.5-0.6% improvement of the leverage ratio
Leverage ratio around ambition MREL on track towards ambition
Based on Own Funds (CET1, AT1, T2), subdebt and NPS 1)Leverage ratio (FL) based on Tier 1 (CET1 and AT1) capital
Ambit
ion
Ambit
ion
3.7%
4.1%
4.0%
4.0%
Q1 Q2 Q3 Q4 Q1 YE
2017 2018 2018
Leverage ratio Ambition YE2018 Exposure Measure
28.8
%
28.1
%
27.8
%
29.3
%
Q1 Q2 Q3 Q4 Q1 YE
2017 2018 2019
MREL (in RWAs) Ambition YE2019

53
Capital instruments provide a significant buffer of loss absorbing capacity
AT1 disclosures (31 March 2018)
Triggers TriggerLevels
CET1 ratio (phase in)
Distr. Items(EUR bn)
- ABN AMRO Group 7.000% 17.5% n/a- ABN AMRO Bank 5.125% 17.5% 18,310- ABN AMRO Bank Solo Consolidated 5.125% 16.5% n/a
Eligibility based on current understanding
Type Size (m) Loss absorption Callable Maturity Coupon ISIN Basel 3 /
CRD 4BRRDMREL
FSBTLAC
S&PALAC
Moody’sLGF
FitchQJD
Tier 1 : deeply subordinated notesOpCo AT1, 9/2015 EUR 1,000 Statutory Sep 2020 Perpetual 5.75% p.a. XS1278718686 OpCo AT1, 9/2017 EUR 1,000 Statutory Sep 2027 Perpetual 4.75% p.a. XS1693822634 Tier 2: subordinated notesOpCo T2, 4/2011 EUR 1,227 Statutory Bullet 27 Apr 2021 6.375% p.a. XS0619548216 GF OpCo T2, 4/2011 USD 595 Statutory Bullet 27 Apr 2022 6.250% p.a. XS0619547838 GF OpCo T2, 6/2011 USD 113 Statutory Bullet 15 May 2023 7.75% p.a. 144A: US00080QAD79
RegS:USN0028HAP03 GF OpCo T2, 6/2015 EUR 1,500 Statutory Jun 2020 30 Jun 2025 2.875% p.a. XS1253955469 OpCo T2, 7/2015 USD 1,500 Statutory Bullet 28 Jul 2025 4.750% p.a. XS1264600310
US00080QAF28 OpCo T2, 4/2016 SGD 450 Statutory Apr 2021 1 Apr 2026 4.75% p.a. XS1341466487 OpCo T2, 4/2016 USD 1,000 Statutory Bullet 18 Apr 2026 4.8% p.a. XS1392917784/
US00084DAL47 OpCo T2, 1/2016 EUR 1,000 Statutory Jan 2023 18 Jan 2028 2.875% p.a. XS1346254573 OpCo T2, 3/2016 USD 300 Statutory Bullet 8 Apr 2031 5.6% p.a. XS1385037558 OpCo T2, 3/2017 USD 1,500 Statutory Mar 2023 27 Mar 2028 4.40% p.a. XS1586330604
Subordinated notes (pari passu with T2)OpCo, 7/2012 EUR 1,000 Statutory Bullet 6 Jul 2022 7.125% p.a. XS0802995166 OpCo EUR 132 Statutory 2018-2025 Various instruments Overview dated at the date of this presentation. GF = grandfathered instruments, subject to annual amortisation

54
26.8
67.7
Wholesale maturities ≤1yr
Liquiditybuffer
Liquidity ratios and liquidity buffer actively managed
Funding primarily through client deposits
Largest part of Dutch consumer savings is with pension and life insurance industry
LtD ratio improved over the recent years
LCR and NSFR ratios comply with future requirements: each >100% in Q1 2018
Drivers liquidity buffer
Safety cushion in case of severe liquidity stress
Regularly reviewed for size and stress
Size in anticipation of LCR guidelines and regulatory focus on strengthening buffers
Unencumbered and valued at liquidity value
Focus is on optimising composition and negative carry
Solid ratios and strong buffer Loan-to-deposit ratio improved over time
Composition liquidity buffer
EUR bn, Mar 2018
2.5x
Buffer composition EUR bn % LCR
Government Bonds 31.8 47% Cash/Central Bank Deposits 24.5 36% Covered Bonds 2.4 3% Retained RMBS 2.1 3% Other 7.0 10% 98% of the liquidity buffer is LCR eligible
225253 /246156 =91.5%
115%
80%
100%
120%
140%
2014 2015 2016 2017 2018
55
Cov. Bonds 58%
Sr. Unsec. 42%
EUR 58%USD 42%
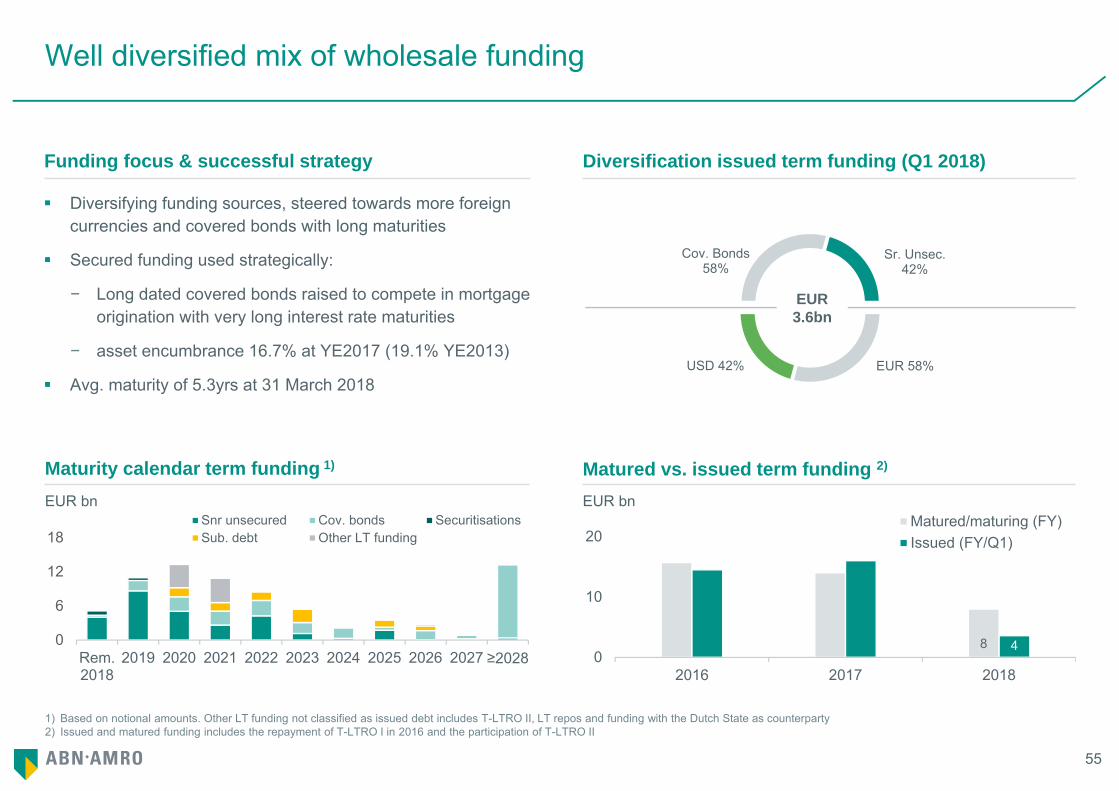
1) Based on notional amounts. Other LT funding not classified as issued debt includes T-LTRO II, LT repos and funding with the Dutch State as counterparty2) Issued and matured funding includes the repayment of T-LTRO I in 2016 and the participation of T-LTRO II
Well diversified mix of wholesale funding
Diversifying funding sources, steered towards more foreign currencies and covered bonds with long maturities
Secured funding used strategically:
− Long dated covered bonds raised to compete in mortgage origination with very long interest rate maturities
− asset encumbrance 16.7% at YE2017 (19.1% YE2013)
Avg. maturity of 5.3yrs at 31 March 2018
Funding focus & successful strategy Diversification issued term funding (Q1 2018)
Matured vs. issued term funding 2)Maturity calendar term funding 1)
8 40
10
20
2016 2017 2018
Matured/maturing (FY)Issued (FY/Q1)
EUR bn
0
6
12
18
Rem.2018
2019 2020 2021 2022 2023 2024 2025 2026 2027 ≥2028
Snr unsecured Cov. bonds SecuritisationsSub. debt Other LT funding
EUR bn
EUR3.6bn

56
1) Sr Un = Senior Unsecured, Sr Un Green = Senior Unsecured Green Bonds, CB = Covered Bond, RMBS = Residential Mortgage Backed Security, T2 = Tier 22) 3m£L = 3 months £ Libor , T= US Treasuries, 3m$L= 3 months US Libor, G=Gilt
Recent wholesale funding benchmark transactionsDeal of the Year (2016)
USD 300m 5.6%T2 Formosa due 2031
Most Impressive BankGreen/SRI Bond Issuer (2016)
Global Deal of the year 2017CBs due 2032 & 2037
The Cover
Type 1) Size (m) Maturity Spread (coupon) 2) Issue date Maturity date ISIN
YTD2018 benchmarks Sr Un Green EUR 750 7yrs m/s+28 (0.875%) 04.11.’18 04.22.’25 XS1808739459CB EUR 1,250 20yrs m/s+8 (1.45%) 04.04.’18 04.12.’38 XS1805353734CB EUR 2,000 15yrs m/s+2 (1.25%) 03.01.’18 10.01.’33 XS1747670922Sr Un (144A) USD 1,100 3yrs 2.65% 09.01.’18 19.01.’21 XS1743726835/US00084DAQ34Sr Un (144A) USD 750 3yrs 3m$L+41 09.01.’18 19.01.’21 XS1743726918/US00084DAR17
2017 benchmarks Sr Un GBP 600 4.5 yrs 1.375% 11.10.’17 (incl. tap) 07.06.’22 XS1701271709AT1 EUR 1,000 PNC10 4.75% 27.09.’17 22.09.’27 XS1693822634Sr Un GBP 550 3yrs 1.00% 07.07.’17 (incl. tap) 30.06.’20 XS1646904828Sr Un Formosa USD 450 5yrs 3m$L+80 19.07.’17 19.07.’22 XS1645476125T2 USD 1,500 11NC6 T+240 (4.40%) 20.03.’17 27.03.’28 XS1586330604Sr Un (144A) USD 1,350 2yrs 3m$L+64 11.01.’17 (incl. tap) 18.01.’19 XS1549579446/US00084DAP50Sr Un (144A) USD 1,650 2yrs T+93 (2.10%) 11.01.’17 (incl. tap) 18.01.’19 XS1549579529/US00084DAN03 CB EUR 2,000 15yrs m/s+15 (1.125%) 04.01.’17 12.01.’32 XS1548458014CB EUR 2,250 20yrs m/s+20 (1.375%) 04.01.’17 (incl. tap) 12.01.’37 XS1548493946
2016 benchmarks Sr Un GBP 300 2yrs 3m£L+50 23.11.’16 30.11.’18 XS1527536590Sr Un (144A) USD 750 3yrs T+90 (1.8%) 20.09.’16 20.09.’19 XS1492363848/US00084DAM20Sr Un Green EUR 500 6yrs m/s+52 (0.625%) 31.05.’16 31.05.’22 XS1422841202T2 (144A) USD 1,000 10yrs T+310 (4.8%) 18.04.’16 18.04.’26 XS1392917784/US00084DAL47CB EUR 2,250 15yrs m/s+26 (1%) 13.04.’16 13.04.’31 XS1394791492T2 Formosa USD 300 15yrs 3m$L+352.7 (5.6%) 08.04.’16 08.04.’31 XS1385037558T2 SGD 450 10NC5 SOR+271 (4.75%) 01.04.’16 01.04.’26 XS1341466487T2 EUR 1,000 12NC7 m/s+245 (2.875%) 18.01.’16 18.01.’28 XS1346254573CB EUR 1,250 10yrs m/s+11 (0.875%) 14.01.’16 14.01.’26 XS1344751968

57
Ratings of ABN AMRO Bank NV dated 6 February 2018. ABN AMRO provides this slide for information purposes only. ABN AMRO does not endorse Moody’s, Fitch or Standard & Poor’s ratings or views and does not accept any responsibility for their accuracy
Capital ratings are (S&P/Moody’s/Fitch): AT1: BB+ / not rated / BB+, T2: BBB / Baa2 / A-, SNP: BBB+/nr/nr DBRS provides unsolicited ratings for ABN AMRO Bank: A(high)/R-1(middle)/Stable
Credit ratings
S&P Moody’s Fitch
Rating structure Rating structure Rating structure Anchor BICRA 3 (pos) bbb+ Macro Score Strong + Viability Rating A Business position Adequate +0 Solvency Score a3 Qualifying Junior Debt +1 Capital & earnings Strong +1 Liquidity Score baa2 Support Rating Floor No floor Risk position Adequate +0 Financial Profile baa1 Issuer Default Rating A+/St Funding
LiquidityAverageAdequate +0 Adjustments +0
SACP a- Assigned adj. BCA baa1 ALAC +1 LGF +2Issuer Credit Rating A/Pos Government Support +1
Senior Unsecured Rating A1/St
15/09/2017The positive outlook on ABN AMRO stems from the positive economic trend we see for banks operating in the Netherlands“
21/12/2017“ABN AMRO's baseline credit assessment (BCA) of baa1 reflects the bank's overall good financial fundamentals including sound profitability and asset quality, solid capitalization and a robust liquidity position. The BCA further captures the bank's strongfootprint in the Dutch market, its balanced business mix between retail and commercial banking, and its private banking activity undertaken across Europe.”
15/12/2017“ABN AMRO’s VR reflects a strong Dutch franchise, complemented by the bank’s international private banking and energy, commodities and transportation franchises, which provide the bank with resilient revenue generation. The ratings factor in the bank’s solid risk-weighted capital ratios, expected gradual asset-quality improvements and a sound funding and liquidity profile. The ratings also factor in ABN AMRO’s predominantly Dutch focus and thus limited geographical diversification.”

58
For the purposes of this disclaimer ABN AMRO Group N.V. and its consolidated subsidiaries are referred to as "ABN AMRO“. This document (the “Presentation”) has been prepared by ABN AMRO. For purposes of this notice, the Presentation shall include any document that follows and relates to any oral briefings by ABN AMRO and any question-and-answer session that follows such briefings. The Presentation is informative in nature and is solely intended to provide financial and general information about ABN AMRO following the publication of its most recent financial figures. This Presentation has been prepared with care and must be read in connection with the relevant Financial Documents (latest Quarterly Report and Annual Financial Statements, "Financial Documents"). In case of any difference between the Financial Documents and this Presentation the Financial Documents are leading. The Presentation does not constitute an offer of securities or a solicitation to make such an offer, and may not be used for such purposes, in any jurisdiction (including the member states of the European Union and the United States) nor does it constitute investment advice or an investment recommendation in respect of any financial instrument. Any securities referred to in the Presentation have not been and will not be registered under the US Securities Act of 1933.
The information in the Presentation is, unless expressly stated otherwise, not intended for residents of the United States or any "U.S. person" (as defined in Regulation S of the US Securities Act 1933). No reliance may be placed on the information contained in the Presentation. No representation or warranty, express or implied, is given by or on behalf of ABN AMRO, or any of its directors or employees as to the accuracy or completeness of the information contained in the Presentation. ABN AMRO accepts no liability for any loss arising, directly or indirectly, from the use of such information. Nothing contained herein shall form the basis of any commitment whatsoever. ABN AMRO has included in this Presentation, and from time to time may make certain statements in its public statements that may constitute “forward-looking statements”. This includes, without limitation, such statements that include the words ‘expect’, ‘estimate’, ‘project’, ‘anticipate’, ‘should’, ‘intend’, ‘plan’, ‘probability’, ‘risk’, ‘Value-at-Risk (“VaR”)’, ‘target’, ‘goal’, ‘objective’, ‘will’, ‘endeavour’, ‘outlook’, 'optimistic', 'prospects' and similar expressions or variations on such expressions. In particular, the Presentation may include forward-looking statements relating but not limited to ABN AMRO’s potential exposures to various types of operational, credit and market risk. Such statements are subject to
uncertainties. Forward-looking statements are not historical facts and represent only ABN AMRO's current views and assumptions on future events, many of which, by their nature, are inherently uncertain and beyond our control. Factors that could cause actual results to differ materially from those anticipated by forward-looking statements include, but are not limited to, (macro)-economic, demographic and political conditions and risks, actions taken and policies applied by governments and their agencies, financial regulators and private organisations (including credit rating agencies), market conditions and turbulence in financial and other markets, and the success of ABN AMRO in managing the risks involved in the foregoing. Any forward-looking statements made by ABN AMRO are current views as at the date they are made. Subject to statutory obligations, ABN AMRO does not intend to publicly update or revise forward-looking statements to reflect events or circumstances after the date the statements were made, and ABN AMRO assumes no obligation to do so.
Disclaimer

WebsiteABN AMRO Group www.abnamro.com/ir
AddressGustav Mahlerlaan 101082 PP AmsterdamThe Netherlands
20180514 Investor Relations - Q1 2018


![MTU SmartGrid 20180514.pptx [Read-Only]gnu.ets.kth.se/~nt/tmp/protaut/slides/univ_mtu.pdf · • Power Systems Lab – Transformers, Ferroresonance, Relay testing, HIL – EMTP, Power](https://static.fdocuments.net/doc/165x107/5fd6a28c9fa5e044593b4cec/mtu-smartgrid-read-onlygnuetskthsenttmpprotautslidesunivmtupdf-a.jpg)