2018 UBS MLP & MIDSTREAM CONFERENCEs2.q4cdn.com/.../2018/AMID_Presentaiton_UBS-(Park-City)vf.pdf ·...
30
JANUARY 8 – 10, 2018 PARK CITY, UTAH 2018 UBS MLP & MIDSTREAM CONFERENCE
Transcript of 2018 UBS MLP & MIDSTREAM CONFERENCEs2.q4cdn.com/.../2018/AMID_Presentaiton_UBS-(Park-City)vf.pdf ·...

JANUARY 8 – 10, 2018PARK CITY, UTAH
2018 UBS MLP & MIDSTREAM CONFERENCE

This presentation includes forward-looking statements. These statements relate to, among other things, projections of operational volumetrics and
improvements, growth projects, cash flows and capital expenditures. We have used the words "anticipate,” "believe," "could," "estimate," "expect," "intend,"
"may,“ “path,” "plan,“ “potential,” "predict," "project," "should," "will," and similar terms and phrases to identify forward-looking statements in this presentation.
Although we believe the assumptions upon which these forward-looking statements are based are reasonable, any of these assumptions could prove to be
inaccurate and the forward-looking statements based on these assumptions could be incorrect. Our operations and future growth involve risks and uncertainties,
many of which are outside our control, and any one of which, or a combination of which, could materially affect our results of operations and whether the
forward-looking statements ultimately prove to be correct. Actual results and trends in the future may differ materially from those suggested or implied by the
forward-looking statements depending on a variety of factors, which are described in greater detail in our filings with the SEC. Construction of projects described
in this presentation is subject to risks beyond our control including cost overruns and delays resulting from numerous factors. In addition, we face risks
associated with the integration of acquired businesses, decreased liquidity, increased interest and other expenses, assumption of potential liabilities, diversion of
management’s attention, and other risks associated with acquisitions and growth. Please see our Risk Factor disclosures included in our Annual Report on Form
10-K for the year ended December 31, 2016 filed on March 28, 2017 and on Form 10-Q for the quarter ended September 30, 2017 filed on November 09, 2017.
All future written and oral forward-looking statements attributable to us or persons acting on our behalf are expressly qualified in their entirety by the previous
statements. This presentation shall not constitute an offer to sell, or a solicitation of an offer to buy, any securities. This presentation speaks only as of the date
on the cover page. We undertake no obligation to update any information contained herein or to publicly release the results of any revisions to any forward-
looking statements that may be made to reflect events or circumstances that occur, or that we become aware of, after the date of this presentation.
CAUTIONARY STATEMENT
2

AMERICAN MIDSTREAM OVERVIEW
American Midstream Partners, LP($ millions)
Asset Overview
Owns or has an ownership interest in approximately 5,100 miles of onshore and offshore natural gas, crude oil, NGL and saltwater pipelines
Assets Strategically located in:
Gulf of Mexico
Permian Basin
South Texas
Southeastern US
East Texas
35.7% equity interest in Delta House FPS with nameplate capacity of 100 MBbl/d oil and 240 MMcf/d gas processing capacity
17 gathering systems
8 processing plants, 4 fractionation facilities
7 interstate and 9 intrastate pipelines
6 terminal sites with approximately 6.7 MMBbls of storage capacity
A fleet of approximately 75 crude oil transportation trucks and 97 trailers
Enterprise Value $ 2,305
Distribution Coverage 1.0x
Equity Yield 12.0%
8.5% 2021 Senior Unsecured Note Yield 7.2%
Total Compliance Indebtedness $ 1,027
Compliance Leverage 4.6x
Total Outstanding Unit 72.0 million
1
1
2
Segment Gross Margin(3)
(1) as of 1/2/2018 • (2) Common and Preferred Units as of September 30, 2017 • (3) Nine months ended September 30, 2017
20%
11%9%
43%
16%
Gas Gathering and Processing Liquid PipelinesNatural Gas Transportation Offshore PipelinesTerminalling
3

CREATE A MORE FOCUSED AND SIMPLIFIED AMERICAN MIDSTREAM
Create a more focused and simplified American Midstream
Reallocate capital in core areas to drive cash flow predictability De-lever balance sheet and create equity value via reinvestment in strategically accretive transactions Focus on greater asset scale and density in core areas that will drive long-term growth
AMID has announced seven transformative transactions and successfully redeployed ~$450 million of capital since mid 2017
Simplify Business
De-Leverage
Drive Growth
Reducing business segments from six to four
Sold non-core propane business for $170 million
Selling terminal business, anticipated proceeds of approximately $400-$500 million
Transactions were balance sheet accretive, minimize need for external capital and
reducing leverage
Targeting long term leverage of 3.5x – 4.0x
Redeployed capital to higher growth assets with greater cash flow stability
Over $1.8 billion of growth transactions at ~7x multiple
Southcross acquisition creates an integrated growth platform in growing demand hub
4

Completed approximately $1.8 billion of growth transactions at accretive valuations
AMID’S REPOSITIONING UNDERWAY: PROVEN TRACK RECORD OF SUCCESS
Expand ScaleSouthcross Combination Announced Create $3 billion company
JP Energy Merger Completed Created $2 billion company
Focus on Core Gulf Coast, Southeast US and GoM Value Chain
Gulf Coast: Destin, Okeanos, TriStates, Wilprise Acquired Creates Gulf "Super System"
Gulf of Mexico: Panther Acquired Crude oil integration
Gulf of Mexico: Viosca Knoll pipeline Acquired "Super System" bolt-on
Gulf of Mexico: Delta House drop-downs Acquired Significant GoM growth opportunity
Gulf Coast: Pipeline JV with Targa Formed Repurpose underutilized asset
Southeast US: Trans-Union pipeline Acquired Expanding Southeast US footprint
Other Gulf of Mexico Roll-ups / bolt-ons In Process Consolidate high quality positions
Divest Non-Core Assets at Attractive Valuations
Propane segment divestiture Sold High-grade / redeploy capital
Terminals and other non-core divestitures In Process High-grade / redeploy capital
Goal Complete Opportunity / Action Result
5

SIMPLIFIED, INTEGRATED AND FEE-BASED MIDSTREAM VALUE CHAIN
Simplified, integrated and fee-based midstream value chain Simplified business position to maximize accretive opportunities in core areas
Reducing segments from Six to Four creating greater clarity and cash flow predictability
~ 9,100 miles of Natural Gas, NGL & Crude Pipelines
~ 1.0 Bcf/d of Natural Gas Treating and Processing Capacity
~ 110 MBbls/d Fractionation Capacity
~ 213,000 Horsepower of Compression
Predictable Cash Flow Pro-Forma Segment Gross Margin1
19%
14%10%
57%
Gas Gathering and Processing Liquid PipelinesNatural Gas Transportation Offshore Pipelines
6(1) Pro-forma margin is relative to the Southcross transaction

SOUTHCROSS ACQUISITION HIGHLIGHTS
FinancialTransforming
Accretive
Financial Strength
Transaction forms a $3 billion partnership
Pro forma partnership expected to generate annualized 2018 Adjusted EBITDA in excess of $300 million
Close transaction with $300 to $400 million of liquidity to support continued growth
Immediately accretive to AMID DCF per unit
Single – digit in 2018 and 2019, approaching double digits by 2020
Strong pro forma distribution coverage of 1.1x-1.3x
Initial trailing leverage near 4.5x with a path to 3.5x with in 18 months
Near term asset sales at attractive multiples minimize need for external capital
Captures full midstream value chain of gathering, treating, processing, fractionation, transportation and marketing
Transportation Natural gas end users
NGL endusers
NGL & residuemarketing
FractionationY-GradeGathering and compression
Well-head Source gas treating Gas processing
Transaction adds meaningful scale in AMID’s core operating areas
7

AMERICAN MIDSTREAM PRO FORMA ASSETS
Strong asset footprint in leading basins
8
AMERICAN MIDSTREAM PRO FORMA ASSETS

9
SUBSTANTIAL OPTIONALITY TO CONNECT SUPPLY WITH DEMAND
Integrated midstream platform facilitates movement of natural gas, crude oil and NGLs to high-growth demand markets along the Gulf Coast
Link key sources of supply (Permian, Eagle Ford, Gulf of Mexico) to South TX fractionation complex and Corpus Christi demand hub
Unmatched access to Corpus Christi ship channel and industrial complex
Exports to Mexico from additional demand pull
“Steel on steel” connectivity in AL & MS transmission market that connects supply with South East demand pull
Plan to connect every Southcross asset with a corresponding AMID asset
(1) Source: IHS
Ten year demand growth, 2017-2027(1)Natural GasNGLs
30%
35%
25%
75%40%

STRATEGIC ASSET PORTFOLIO

EASTERN GULF OF MEXICO MIDSTREAM PLATFORM
AMID’s integrated offshore midstream platformprovides Deepwater producers flow assurance and onshore market optionality
Assets cover over 10,0000 square miles Ability to interconnect with AMID systems located
in the shallow water and Gulf Coast regions Deepwater assets have a strong focus in the
Mississippi Canyon area
Mississippi Canyon production on AMID assets 52% of all gas production 25% of all oil production 98% of all NGL’s (post Cayenne startup 1/1/18)
Why Mississippi Canyon? Most prolific development areas in the GOM Holds 31% of GOM reserves Accounts for 30% of current GOM production
GOM Reserves(BOEM)
1.5
1.8
1.1
0.4Mississippi Canyon
Central Planning Area
Green Canyon
Western Planning Area
Projected Offshore Volumes1
(MMbtu/d)
32% Growth
1,198 1,350 1,417 1,479 1,581
0200400600800
1,0001,2001,4001,600
2016 2017 2018 2019 2020 11(1) Based on current production models and contract tenor

DEEPWATER PRODUCER ACTIVITY
Development Operator Start DateThunder Horse South BP 2016Odd Job LLOG 2016Otis LLOG 2016Son of Bluto 2 LLOG 2017Horn Mountain Deep Anadarko 2017Fourier Shell 2017Amethyst Stone Energy 2018King West Anadarko 2018Red Zinger LLOG 2018Mud Bug LLOG 2018Praline LLOG 2018Rampart Deep Gulf Energy 2018Crown & Anchor LLOG 2019Kaikias Shell 2019Stonefly LLOG 2019Appomattox Shell 2020
Deepwater Activity on AMID Assets
Dedicated Volumes (MMbtu/d)
1,165 1,232 1,307 1,420
185 185 172 161
-200 400 600 800
1,000 1,200 1,400 1,600
2017 2018 2019 2020
Dedicated Offshore Production Other Offshore
Current Development & Activity Eastern GOM Deepwater Platforms/PipelinesDeepwater activity (gas dedicated to AMID assets)
Deepwater blocks dedicated to AMID assets)
Gas, Oil, NGL’s (to AMID assets)Gas, NGL’s (to AMID assess)NGL’s (to AMID assets)
12
Deepwater activity (gas to 3 pty pipeline or undedicated)rd
AMID Pipelines

DELTA HOUSE OVERVIEW
Historical Volume (Gross)
Operating at peak capacity and underpinned by some of the leading Gulf of Mexico producers
Fee-based, semi-submersible floating production system and associated oil and gas export pipelines located in the highly prolific Mississippi Canyon region (MC254) of the deepwater Gulf of Mexico
Operated by LLOG, one of the leading producers in the Gulf of Mexico
AMID owns a 35.7% equity interest Upgraded nameplate capacity: 100 MBbl/d oil
and 240 MMcf/d gas in May 2017 Commenced operations in April 2015
12th tie-back completed in May 2017 Three to seven future tiebacks planned for the
development, which will keep Delta House operating at peak capacity for the foreseeable future
Delta House FPS can accommodate 18 risers (up to nine fields with dual flowlines)
Currently operating 10 risers, the additional 8 risers (four fields) provides further optionality to remain operating at peak capacity
Supported by long-term, volumetric-tiered, fee-based tariffs with ship-or-pay components and life-of-lease dedications
Directly connected to the Destin Pipeline, providing AMID additional fee-based revenue streams
Nameplate capacity (gas): 240 MMcf/d
Nameplate capacity (oil): 100 MBbl/d
53
6571
64 67 68 77
90 88
117
138153
162177
187 180
215
207
-30
10
50
90
130
170
210
250
0
20
40
60
80
100
120
Q3 2015 Q4 2015 Q1 2016 Q2 2016 Q3 2016 Q4 2016 Q1 2017 Q2 2017 Q3 2017
MM
cf/d
MB
bl/d
Crude Oil (LHS) Natural Gas(RHS)13
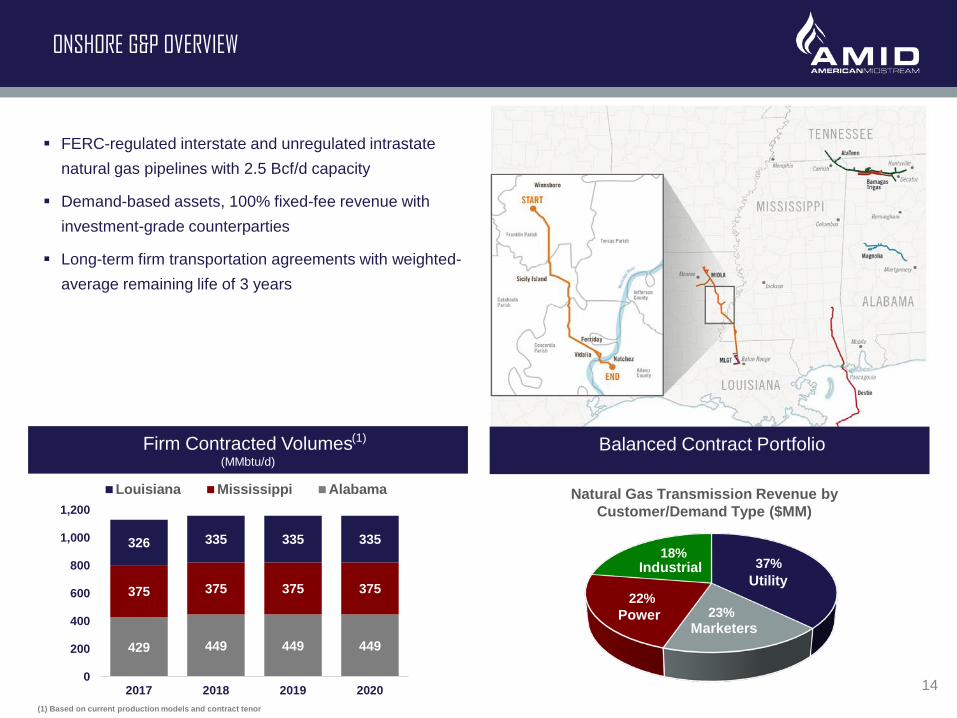
429 449 449 449
375 375 375 375
326 335 335 335
0
200
400
600
800
1,000
1,200
2017 2018 2019 2020
Louisiana Mississippi Alabama
ONSHORE G&P OVERVIEW
FERC-regulated interstate and unregulated intrastate natural gas pipelines with 2.5 Bcf/d capacity
Demand-based assets, 100% fixed-fee revenue with investment-grade counterparties
Long-term firm transportation agreements with weighted-average remaining life of 3 years
Firm Contracted Volumes (MMbtu/d)
(1)
37%
23%22%
18%
Natural Gas Transmission Revenue by Customer/Demand Type ($MM)
MarketersPower
IndustrialUtility
Natural Gas Transmission Revenue by Customer/Demand Type ($MM)
(1) Based on current production models and contract tenor
Balanced Contract Portfolio
14

NATURAL GAS TRANSMISSION OVERVIEW
Business Overview Assets located in some of the most prolific
producing basins including the Permian, East Texas, Eagle Ford and Bakken
Over 1,565 miles of high- and low-pressure natural gas and crude oil gathering systems
8 processing plants with ~325 MMcf/d of capacity
4 fractionation facilities with 17 MBbl/d of capacity Fleet of 75 crude oil transportation trucks and 95
trailers Approximately 20 NGL transportations trucks Significant acreage dedications in the Permian,
Eagle Ford and Bakken Connectivity to production fields, processing and
fractionation facilities and end-users via pipelines, truck and rail
Diversified customer base across the value chain
Top Onshore G&P Customers
Marketers
PowerIndustrial
UtilityG&P NGL Supply Liquid Sales
15

RESURGENCE OF ACTIVITY THROUGHOUT AMID’S FOOTPRINT
Anchor Producer with strong Eagle Ford footprint
recently announced accretive transaction
Increasing net acres to 9,700
Adds PDP reserves of 3.8 MMBoe
Average extended lateral EUR > 1,100 MBoe
Strong hedge profile with break even pricing ~$40/Bbl
Year over year Production growth of 120% in 2018
Multi-year drilling inventory with superior economics
Eagle Ford
East Texas
Permian
Source: Customer corporate presentations and Baker Hughes Rig Count 12/29/201716
Top Customer has over 2,900 drilling locations
90% of inventory economic at <$40/Bbl
Average EUR across dedicated acreage ~750 MBoe
~170,000 contiguous net acres
Prospective in multiple zones
Continued infrastructure buildout gives producers exposure to demand markets and South Texas export facilities
Twelve Month Growth: 152% Twelve Month Growth: 152%

FINANCIAL STRENGTH

66 78113
184 190
205
0
50
100
150
200
250
2013 2014 2015 2016 2017
Low Guidance High Guidance
CONSERVATIVE FINANCIAL PROFILE
Target long-term leverage of 3.5x – 4x with $300-$400 million of
liquidity, pro-forma for Southcross
Target ~1.1-1.3x average distribution coverage in 2017 and 2018
Potential monetization of additional non-core assets (Terminals
Business)
Continue to finance near-term growth opportunities through
internally funded capital
Proactively term-out bank debt to retain liquidity and reduce
senior secured indebtedness
Utilize equity capital to support growth objectives
Adjusted EBITDA1
2017 Guidance2 3
(in millions, except distribution coverage)
Low HighAdjusted EBITDA $190 $205 Growth Capital 65 85 Maintenance Capital 12 16 Distribution Coverage 1.1x 1.2x
Guidance(2)
33% CAGR
Six-Month Total Return
18(1) Adjusted EBITDA is a non-GAAP measure; see slide 23 for a reconciliation to its comparable GAAP measure • (2) Guidance does not include annualized pro-forma effect of acquisitions or divestitures • (3) Guidance as of 8/10/2017

25% - 35%
ACCRETIVE TRANSACTIONS OFFER MATERIAL EQUITY UPSIDE
Continued Execution
Value Creation
Seven highly accretive transactions, redeploying approximately $450 million of capital Capital re-allocation should reflect in meaningful Higher 2018 Adjusted EBITDA and
distributable cash flow Continued financial discipline and cash flow quality demonstrated by twenty-five
consecutive quarterly distributions
Capital reallocation adds significant and stable EBITDA accretion
Transactions offer NPV value of $4-$6 per unit
Net present value of transactions may have 25% to 35% equity uplift from current levels offering significant value
Illustrative Equity Value Creation1*
($0.70) - ($0.90)
$4.20 - $5.40 $18.00
(1) Equity value uplift based on a combination of a two stage discount cash flow model and a market based enterprise value multiple
*Cautionary Note: Equity value creation diagram is for illustrative purposes only. Dollar per unit amounts are not intended to indicate expected market price per unit. Market prices are always subject to change, volatility and risks beyond our control. Investors should conduct their own equity value analysis.
$17.00 $13.50
$-
$2.00
$4.00
$6.00
$8.00
$10.00
$12.00
$14.00
$16.00
$18.00
$20.00
Current Unit Price Change in Debt Potential TransactionUplift
Transaction - AdjustedEquity Value
$ pe
r Uni
t
19

EQUITY YIELD - CREDIT SPREAD IMPLIES MEANINGFUL UPSIDE
AMID Spread Analysis Comparative Spread Analysis1
AMID equity yield – 8.5% note credit spread show meaningful equity upside versus historical and MLP comparatives AMID equity yield – 8.5% note credit spread is approximately 480 bps
72 bps above one-year historical average AMID equity yield – 8.5% note credit spread discount versus Alerian equity yield – Bank of America Merrill Lynch high yield energy
index is approximately 320 bps 450 bps above three-year average
Normalized spread reversions to AMID historical or Alerian equity yield – Bank of America Merrill Lynch high yield energy index imply potential equity upside of approximately 10% - 20%
0
100
200
300
400
500
600
700
800
5.0%5.5%6.0%6.5%7.0%7.5%8.0%8.5%9.0%9.5%
10.0%
Spre
ad (b
ps)
Yiel
d to
Wor
st
AMID equity yield - 8.5% note credit spread (RHS) 8.5% Note (LHS)
20(1) 7 year average normalized for energy industry downturn from November 2014 – November 2016
Meaningful equity upside to historical spread
0
100
200
300
400
500
600
700
800
Spre
ad (b
ps)
AMID equity yield - 8.5% note credit spread
AMZ Index - BAML High Yield Energy Index
7 yr avg. AMZ Index - BAML High Yield Energy Index
AMID materially undervalued to historical industry spread

EV/EBITDA1 Equity Yield2
Price / DCF3 Distribution Coverage4
Mean: 9.2XMean: 10.3%
Mean: 7.5X
Mean: 1.2X
Note: Peer group includes BKEP, CEQP, DKL, GEL, MMLP, NGL, PBFX, SMLP and TLP1.) Bloomberg consensus EBITDA estimate FY 2018 2.) As of 01/2/2018
3.) Bloomberg DCF FY 2018 estimate4.) YTD quarterly average distribution coverage ratio as of September 30, 2017
21

APPENDIX: NON-GAAP FINANCIAL MEASURES

ADJUSTED EBITDA RECONCILIATION
($ in thousands)
2016 2015 2014
Nine Months Ended September 30,
2017 2016
Year Ended December 31,
Adjusted EBITDA $133,689 $131,831 $167,190 $100,721 $74,286(1) Transaction expenses for the year ended December 31, 2016 included JPE Merger costs of $7.2 million. The JPE Merger closed on March 8, 2017.(2)Amounts primarily represent adjustments related to depreciation, amortization and accretion, unrealized (gain) loss on derivatives, (gain) loss on asset sales, goodwill impairment related to our discontinued operations, transaction expenses and gain on sale on of the Propane Business.
Reconciliation of Net income (loss) attributable to the Partnership to Adjusted EBITDA:Net Income (Loss) attributable to the Partnership ($3,467) ($30,074) ($51,310) ($199,828) ($83,560)Add:
Depreciation, amortization and accretion expense 78,173 65,937 90,882 81,335 57,818Interest expense 43,769 22,395 18,197 17,686 13,379Debt issuance costs paid 2,235 3,987 5,328 2,244 7,034Unrealized (gain) loss on derivatives, net 2,288 2,431 (10,328) 495 (641)Non-cash equity compensation expense 6,067 4,285 5,658 5,080 3,415Corporate office relocation - - 9,096 - -Transaction expenses(1) 31,155 9,145 14,084 3,303 5,560Income tax expense 2,611 1,839 2,580 1,885 856Loss on impairment on property, plant and equipment - - 697 - 21,344Loss on impairment of noncurrent assets held for sale - - - - 673Loss on impairment of goodwill - - 2,654 148,488 -Loss on extinguishment of debt - - - - 1,634Distributions from unconsolidated affiliates 58,976 62,797 83,046 20,568 1,980General Partner contribution for cost reimbursement 34,614 5,000 7,500 3,000 -
Deduct:Earnings in unconsolidated affiliates 49,781 29,513 40,158 8,201 348Gain on revaluation of equity interest 32,383 - - - -Other income 241 342 - - -Construction and operating management agreement income - - 1,465 841 943Other post-employment benefits plan net periodic benefit 16 13 17 14 45Gain (loss) on sale of assets, net 4,064 (297) (688) (2,860) (4,087)
Net of impact of discontinued operations (2) 36,247 (13,660) (30,058) (22,661) (42,043)
23

This presentation includes forecasted and historical non-GAAP financial measures, including “Adjusted EBITDA” and “Distributable Cash Flow.” The tables included in this presentation includereconciliations of these forecasted and historical non-GAAP financial measures to the nearest comparable GAAP financial measures.
Adjusted EBITDA is a performance measure that is a non-GAAP financial measure. It has important limitations as an analytical tool because it excludes some, but not all, items that affect the mostdirectly comparable GAAP financial measure. Management compensates for the limitations of this non-GAAP measure as an analytical tool by reviewing the comparable GAAP measure,understanding the differences between the measures and incorporating these data points into management’s decision-making process.
You should not consider Adjusted EBITDA in isolation or as a substitute for, or more meaningful than analysis of, our results as reported under GAAP. Adjusted EBITDA may be defined differently byother companies in our industry. Our definition of this non-GAAP financial measure may not be comparable to similarly titled measure of other companies, thereby diminishing its utility.
Adjusted EBITDA is a supplemental non-GAAP financial measure used by our management and external users of our financial statements, such as investors, commercial banks, research analystsand others, to assess: the financial performance of our assets without regard to financing methods, capital structure or historical cost basis; the ability of our assets to generate cash flow to makecash distributions to our unitholders and our General Partner; our operating performance and return on capital as compared to those of other companies in the midstream energy sector, withoutregard to financing or capital structure; and the attractiveness of capital projects and acquisitions and the overall rates of return on alternative investment opportunities.
We define Adjusted EBITDA as net income (loss) attributable to the Partnership, plus interest expense, income tax expense, depreciation, amortization and accretion expense attributable to thePartnership, debt issuance costs paid during the period, distributions from investments in unconsolidated affiliates, transaction expenses primarily associated with our JPE Merger, Delta Houseacquisition, certain non-cash charges such as non-cash equity compensation expense, unrealized (gains) losses on derivatives and selected charges that are unusual, less construction andoperating management agreement income, other post-employment benefits plan net periodic benefit, earnings in unconsolidated affiliates, gains (losses) on the sale of assets, net, and selectedgains that are unusual. The GAAP measure most directly comparable to our performance measure Adjusted EBITDA is net income (loss) attributable to the Partnership.
In this presentation, we present projected Adjusted EBITDA guidance for 2017. We are unable to project net income (loss) attributable to the Partnership to provide the related reconciliations ofprojected Adjusted EBITDA to the most comparable financial measure calculated in accordance with GAAP, because the impact of changes in distributions from unconsolidated affiliates, operatingassets and liabilities, the volume and timing of payments received and utilized from our customers are out of our control and cannot be reasonably predicted. We provide a range for the forecast ofAdjusted EBITDA to allow for the variability in gain (loss) on sale of assets, timing of cash receipts and disbursements, customer utilization of our assets, interest expense and the impact on therelated reconciling items, many of which interplay with each other. Therefore, the reconciliation of Adjusted EBITDA to projected net income (loss) attributable to the Partnership is not availablewithout unreasonable effort.”
DCF is a significant performance metric used by us and by external users of the Partnership’s financial statements, such as investors, commercial banks and research analysts, to compare basiccash flows generated by us to the cash distributions we expect to pay the Partnership’s unitholders. Using this metric, management and external users of the Partnership’s financial statements canquickly compute the coverage ratio of estimated cash flows to planned cash distributions. DCF is also an important financial measure for the Partnership’s unitholders since it serves as an indicator ofthe Partnership’s success in providing a cash return on investment. Specifically, this financial measure may indicate to investors whether we are generating cash flow at a level that can sustain orsupport an increase in the Partnership’s quarterly distribution rates. DCF is also a quantitative standard used throughout the investment community with respect to publicly traded partnerships andlimited liability companies because the value of a unit of such an entity is generally determined by the unit’s yield (which in turn is based on the amount of cash distributions the entity pays to aunitholder). DCF will not reflect changes in working capital balances.
We define DCF as Adjusted EBITDA, less interest expense, normalized maintenance capital expenditures, and distributions related to the Series A, Series C, and Series D convertible preferred units.The GAAP financial measure most comparable to DCF is Net income (loss) attributable to the Partnership.
CAUTIONARY STATEMENT
24

AMERICAN MIDSTREAMASSET APPENDIX

TRACK RECORD OF TACTICAL GROWTH AT ATTRACTIVE MULTIPLES
• Drop-down of High Point System along with $15MM cash in exchange for $90MM of Series A Preferred Units issued to ArcLight
High Point System
• Acquisition of 66.7% interest in offshore crude oil gathering system for $12MM
MPOG
• Acquisition of Lavaca System for $104MM
Lavaca System
• Drop-down of 12.9% interest in Delta House for $162MM
Delta House
• Acquisition of 49.7% Destin pipeline, 66.7% in Okeanos pipeline, 60% in American Panther, 16.7% in Tri-States pipeline and 25.3% Wilprise pipeline $214MM aggregate purchase price
GoM Assets
• Merger completed creating over $2 billion value company; expanding infrastructure and service offerings
JP Energy
• Acquisition of all assets of Panther Asset Management for $52MM
Panther Operating
• Acquisition of VK pipeline for $32MM
Viosca Knoll
• Acquisition of Incremental 15.5% interest for $154MM
Delta House
2013 2014 20162015 2017
• Drop-down of 4 marine terminal sites for $64MM
Blackwater Terminal
• $470MM acquisition of Costar, including assets in East Texas, Permian and Bakken
Costar• Acquisition of
incremental 6.2% interest in Delta House for $49MM
Delta House
• Drop-down of incremental 1% interest in Delta House for $10MM
Delta House
• Joint venture with Targa NGL pipeline service for $3MM
Cayenne
• Acquisition of pipeline; expanding SE footprint for $48MM
Trans-Union
• Acquisition of Incremental 17% interest for $30MM
Destin
• Creating over $3 billion company
Southcross
Drop-downs
Merger or Acquisition
3rd party acquisitions & joint ventures
Over $1.8 billion of growth transactions completed at ~7x multiple
26

NATURAL GAS TRANSMISSION MARKET OVERVIEW
Natural Gas Transmission – Firm Markets LOUISIANA: 326,000 Dth/d Firm Transportation
MLGT: Unregulated intrastate system North LA: Entergy North Louisiana (Power), Angus
Chemical (Industrial) Baton Rouge: Entergy Baton Rouge (Utility), Exxon Baton
Rouge (Industrial), Georgia Pacific (Industrial) MIDLA: FERC regulated Natchez Line: Placed in-service 2Q 2017 backed by 15-yr
take-or pay agreements (Atmos, LMGA, BASF)
ALABAMA: 429,000 Dth/d Firm Transportation AlaTenn: FERC Regulated Supply connects with TGP, TETCO, CGT 50 delivery points provide direct service to industrial,
power, and utility end-users Bamagas/Trigas: Unregulated intrastate systems Two power plants (Calpine, Capital Power) Industrials: Ascend, Bunge, Linde
Magnolia: Unregulated intrastate system On-system CBM production, delivery to Transco
MISSISSIPPI: 375,000 Dth/d Firm Transportation Destin Onshore: FERC Regulated Connectivity to TGP, SNG, Transco, MEP, Gulf South,
FGT, Gulfstream Throughput driven by industrial, power, and utility demand
in Florida, Alabama, and Mississippi27

GAS GATHERING AND PROCESSING ASSETS
Longview Longview Rail Chatom
East Texas Permian Gulf Coast Eagle Ford
LocationTexas - Gregg, Rusk and
Smith CountiesTexas - Martin, Andrews, Dawson
and Gains CountiesChatom, Alabama; Bazor, Mississippi and Southern Louisiana and Mississippi
Texas - Lavaca County
Product Gas, NGL and Condensate Gas, NGL and Condensate Gas, NGL and Condensate Gas
Capacity 70 MMcf/d gas processing; 10 MBbl/d NGL fractionation
40 MMcf/d gas processing; 5 MBbl/d NGL fractionation
25 MMcf/d gas processing;2 MBbl/d NGL fractionation 220 MMcf/d
Facilities710 mile low and high pressure
gathering system, gas well and oil processing and depropanizer
50 mile gathering system, 5,000 HP compression, off-spec NGL
fractionation, pipeline connectivity and H2S treating
100 miles of gathering, sour gas processing, depropanizer and debutanizer, 90 MBbl/d NGL pipeline and 191-mile FERC-
regulated NGL pipeline
200 mile gathering system;30,000 HP ofcompression
Key Customers XTO, Linn, Targa, Eastman AJAX, Energy Transfer Venture, Enterprise Penn Virginia, Devon
Acreage Dedication - 30,000 acres - 70,000 acres
28

1,449 1,588 1,589 1,519 2,018 2,224 2,310 2,302
5,139 4,759
218 196 212 282 133
118 92 98
261 641
87% 89% 88% 84%94%
95% 96% 96%95%
88%
0%
20%
40%
60%
80%
100%
-
1,000
2,000
3,000
4,000
5,000
6,000
Q2 2015 Q3 2015 Q4 2015 Q1 2016 Q2 2016 Q3 2016 Q4 2016 Q1 2017 Q2 2017 Q3 2017
Util
izat
ion
(%)
MB
bls
Contracted Uncontracted Storage Utilization
TERMINALS ASSET OVERVIEW
Marine and Specialty Chemical Refined Products and Crude Oil
Harvey Westwego Brunswick Caddo Mills North Little Rock Cushing
LocationHarvey, LA
(Port of New Orleans)Westwgo, LA
(Port of New Orleans)Brunswick, GA
(Port of Brunswick)Caddo Mills, TX
(Dallas/Ft. Worth Area)North Little Rock,
ARCushing, OK
Product Petroleum/Chemical Chemical/Agricultural Chemical/Agricultural Refined Products Refined Products Crude Oil
Current Capacity 1,110 Mbbls 1,045 MBbls 221 MBbls 770 MBbls 550 MBbls 3,000 MBbls
Facilities 33 above-ground storage tanks
48 above-ground storage tanks
5 above-ground storage tanks
10 above-ground storage tanks
11 above-ground storage tanks
5 above-ground storage tanks
Transportation Modes
Truck, railcar, water vessel
Truck, railcar, water vessel
Truck, railcar, water vessel Truck and pipeline Truck, railcar,
pipeline Pipeline
Key Customers
Commodity brokers, refiners and chemical
manufacturers
Commodity brokers, refiners and chemical
manufacturers
Commodity brokers, refiners and chemical
manufacturers
Retail fuel distributors, refiners
and marketers
Retail fuel distributors, refiners
and marketers
Crude marketer and trader
6167
56 59 59 56 54 5660 60
0
20
40
60
80
Q22015
Q32015
Q42015
Q12016
Q22016
Q32016
Q42016
Q12017
Q22017
Q32017
MBb
ls/d
29

GULF OF MEXICO JOINT VENTURES AND INVESTMENTS
Delta House Floating production system located in the Mississippi
Canyon region in deepwater Gulf of Mexico; operated by LLOG exploration
10 wells online with life-of-lease dedication for production handling and a fixed fee-based structure on oil and gas export pipelines
Nameplate capacity of 100,000 Bbl/d oil and 240 MMcf/d of gas FERC-regulated gas pipeline
120-mile offshore portion moves gas from producing platforms, including Delta House to MP260 and continuing to Pascagoula processing plant
135-mile onshore portion transports gas to multiple pipelines and storage facilities in Mississippi
Okeanos Gas gathering system that connects multiple producer
platforms to MP260 Tri-States and Wilprise FERC-regulated NGL pipelines Tri-States receives gas from three plants and terminates at
Kenner Junction, feeding one fractionation facility and two NGL pipelines
Tri-States connects to Wilprise pipeline at Kenner Junction and terminates in Sorrento, Louisiana
Other AMID to operate ~110 miles of natural gas and saltwater
pipelines, including Henry Gas Gathering System
Interest Overview System Interest Held
Pipeline (miles) Product Design
Capacity
Delta House 35.7% - - -
Destin 66.7% 255 Natural Gas 1.2 Bcf/d
Okeanos 66.7% 100 Natural Gas 1.0 Bcf/d
Wilprise 25.3% 30 Liquids 60,000 Bbls/d
Tri-States 16.7% 161 Liquids 80,000 Bbls/d
Other 100% 200 Natural Gas / Saltwater n/a
Main Pass Oil Gathering 100% 98 Oil 160,000 Bbls/d
30