2018 SUBSCRIBER/NETWORK DATA REPORT
74
2018 SUBSCRIBER/NETWORK DATA REPORT Policy Competition and Economic Analysis Department
Transcript of 2018 SUBSCRIBER/NETWORK DATA REPORT

2018 SUBSCRIBER/NETWORK DATA REPORT
Policy Competition and Economic Analysis Department

Page | 1
TABLE OF CONTENTS Chapter One - Introduction --------------------------------------------------------------------------------------------------------------------2
Chapter Two - Telecoms Industry Review ---------------------------------------------------------------------------------------------5
Chapter Three - Subscriber Network Analysis for Mobile GSM & CDMA Operators ---------------------------9
Chapter Four -Subscriber Network Analysis for Fixed Telephony (Fixed/Fixed Wireless Operators) ----
----------------------------------------------------------------------------------------------------------------------------------------------------------------35
Chapter Five - Subscriber Network Analysis for Internet Service Providers Operators ----------------------46
Chapter Six - Subscriber Network Analysis for Other Operators ---------------------------------------------------------60

Page | 2
Chapter One
1. Introduction
The Nigerian Communications Commission (NCC) is the national Regulatory Agency of the
Communications Industry in Nigeria. The Commission is empowered by the Nigerian Communications
Act 2003 which requires among others to:
Facilitate private investment and entry into the Nigerian telecoms Market for the provision
of telecoms services as well as supply of equipment and facilities
Licensing companies to provide communications services
Create much needed conducive environment for investors in the telecoms environment
Ensure fair competition amongst players in the industry
Ensure subscribers are protected from unfair practices by telecommunications providers
The 2018 Year End Subscriber/ Network Report for the Nigerian Telecommunication Industry was
collated from Licensees that were responsive to the questionnaires administered by the Commission
for the period ending December 2018.
The questionnaires were administered to four (4) Categories of operators which include:
1. Mobile (GSM )
2. Fixed Telephony Operators (Fixed/ Fixed Wireless)
3. Internet Service Providers (ISPS)
4. Others Operators (Operators Other than Mobile & Fixed Telephony, ISP’s)
A synopsis of statistical highpoints in the report are stated below:
i. Telecoms Industry Network/Subscriber Statistics – Subscriber number increased with a
total of 27, 811,580, from 145,059,514 subscribers in 2017 to record high of 172,871,094
active voice subscriptions as at December 2018. This represent about 19.2% increase in
total subscription within the period under consideration. There are also a number of
other operators offering a bouquet of services ranging from not only Voice and Data
services, but also VAS, Infrastructure and collocations and other ICT Services.
ii. Teledensity – the measure of the level of adoption of telephony usage or the access to
telecommunication services in Nigeria grew from 103.61% as at the end of December,
2017 to 123.48 as at December 2018.

Page | 3
iii. Broadband Penetration stood at 31.48%, representing a total of 60,087,199 subscription
as at December, 2018.
iv. Contribution to the (GDP) – Telecoms industry contribution to the Nigerian Gross
Domestic Products has been on a steady rise from 8.66% as at December 2017 to 9.85% in
the Fourth Quarter, 2018
v. Investment inflow (Foreign Direct Investment) into the Nigerian Telecoms Industry was
approximately sixty eight billion US Dollars (USD68billion) as at Year 2018.However
CAPEX expenditure was collated as N307,038,011,184 based on responsive submissions
from Licensees on the Indicator “Investment”.
vi. Infrastructural Development - A substantial telecom infrastructure growth was
recorded by Telecoms providers, as at 2018
(1) a total of 52,160 Base Trans receiver Stations (BTS) and Colocation
Towers was recorded
(2) Microwave stood at 334,314km with 151 Gateways in use by the industry
(3) Fiber Optics Deployment stood at 84,580.7km(73,157.7 terrestrial fiber
& 11,423km submarine cable)
vii. Finance:
Category
Operating Cost (N)
2017
Revenue
(N) 2017
1 GSM 1,452,302,550,000 1,569,861,900,000
2 Fixed 3,787,700,000 4,047,900,000
3 ISP Operators 25,271,669,324 35,525,139,842
4
Other
Operators 237,368,834,358 349,220,147,183
Totals 1,718,730,753,682 1,958,655,087,025
Category
Operating Cost (N)
2018
Revenue
(N) 2018
1 GSM 1,461,019,890,000 1,784,754,010,000
2 Fixed 3,120,100,000 4,108,400,000
3 ISP Operators 36,861,669,324 43,829,309,568
4
Other
Operators 258,002,605,823 412,769,585,986
Totals 1,759,004,265,147 2,245,461,305,554

Page | 4
Revenue increased from N 1.958 Trillion in year 2017 to N 2.245 Trillion as at the end of Year 2018. This
represents a 14.64% increase in revenue Year on Year. Operating cost also increased from N1.718
Trillion in year 2017 to N 1.759 Trillion as at end of Year 2018.
viii. STAFF COUNT-2018
S/N GSM FIXED ISP OTHERS TOTAL
1. 7,567 858 2,388 2,332 13,145
The Total number of staff for responsive licensees at Year end 2018 stands at 13,145 staff. A
breakdown of the staff categories is disaggregated in the report of each category.
ix. Analysis of Base Stations and Towers across States-: The top five states with highest
number of base stations are Lagos- 4,764; Ogun- 1,931; Rivers- 1,676; FCT- 1,684 and Oyo-
1,303; while the states with the least number of base stations are: Yobe-205; Zamfara-
223; Gombe 286; Jigawa- 289; and Kebbi- 298. The number of existing base stations in
the country invariably affects the quality of service (QOS) within the country thereby
positively impacting the level of telephone penetration within the nation which equates
to attracting foreign investment and growth in the telecoms industry.
This report is further disaggregated to the four (4) categories earlier listed above, to evaluate the
performance of the Telecommunications Industry within Year 2018.

Page | 5
Chapter two
Telecoms Industry Review
TELECOM INDUSTRY REVIEW IN A YEAR- (December 2017- December 2018)
The year 2018 was quite an eventful year for the Nigerian Telecommunications Industry, having
achieved and surpassed the National Broadband Plan’s Broadband penetration target of 30% for
Nigeria by 2018. The Broadband penetration rate consistently increased month on month from 19.86%
in December 2017 to 31.48% as at December 2018.
The industry witnessed substantial improvement in quality of service and network coverage across
the country. Infrastructural deployment and upgrade was commendably improved, as most Mobile
Network Operators (MNOs) embraced massive investments in 4G networks and rollout of services,
which culminated in improved consumer satisfaction and increase in revenue streams as highlighted
below:
Total Active Voice Subscriptions (December 2017- December 2018)
Total Active Subscriptions increased from 145,059,514 as at December 2017 to 172871.094 as at
December 2018. Teledensity also grew from 103.61% to 123.48% respectively.
Segments by technology contained in active voice subscriptions reported as at December, 2018:
The Mobile GSM segment has consistently maintained a lead over other technologies like
CDMA, Fixed lines (wireless or wired) and Voice Over Internet Protocol (VOIP) segments
revealing that the universality of GSM has led to a reliable cell-phone service and improved
quality in both connection stability and ease. It is the most popular subscription type used in
the country.
The Mobile GSM segment subscription has the larger part of the reported subscription as at
December, 2018.
The subscription of GSM reported an increase of over 27.9 million subscriptions in the segment from the previous year reflecting a 19.3% increase in subscription count. Mobile GSM subscriptions grew from 144,631,678 in December, 2017 to 172,485,805 recorded in December, 2018.
Within the period under reviewed, the CDMA segment remained static as Multilink did not update its Network/Subscriber data due to technical/ operational challenges reported by the Operators. Total voice subscriptions stood at 124,092 as at December 2018 following the acquisition of Visafone by MTN Nigeria, all Visafone subscribers has been transferred to the GSM band.
The Fixed Wired/Wireless segment also experienced a decline as subscriptions decreased from 139,344 in December, and 2017 to 113,626 as at December, 2018.

Page | 6
An illustration of the Active Voice Subscription in the period under review is illustrated below in table 1:
Service Category Active
Subscriptions
(December’17)
Active Subscriptions
(December’18)
Difference (December’ 17 -
December’18
Percentage (%) Change
Mobile (GSM)
144,631,678
172,485,805
27,854,127
19.3
Mobile (CDMA) 217,566 124,092 (93,470) (42.96)
Fixed/Fixed Wireless
139,344 113,626 (25,718) (18.5)
Voice over Internet
Protocol(VoIP)
70,926
120,706
49,780
70.2
Total 145,059,514 172,871,094 27,811,580 19.2
Teledensity 103.61 123.48 19.87 19.2
Table 1: Active Voice segment (December, 2017 – December, 2018)
By technology, the Mobile (GSM) segment has 99.7, Mobile (CDMA) 0.1%, Fixed Wired/Wireless 0.1% and VoIP 0.1%.
Table 2: Active Voice Segment by Technology (as at December, 2018)
MOBILE (GSM) MOBILE (CDMA) FIXED WIRED/WIRELESS VOICE OVER INTERNET PROTOCOL (VoIP)
99.7% 0.1% 0.1% 0.1%

Page | 7
Figure 1: Percentage of Market Share of Service Deployment by Technology as at December, 2018
Figure 2: Total Active Voice Subscriptions (December 2017- Decembers 2018)
MOBILE (GSM) 99.7%
MOBILE (CDMA) 0.1%
FIXED
VOICE OVER INTERNET
Percentage of Market Share of Service Deployment by Technology as at December '18
MOBILE (GSM)
MOBILE (CDMA)
FIXEDWIRED/WIRELESSVOICE OVER INTERNETPROTOCOL(VoIP)
130,000,000
135,000,000
140,000,000
145,000,000
150,000,000
155,000,000
160,000,000
165,000,000
170,000,000
175,000,000
17-Dec 18-Jan 18-Feb 18-Mar 18-Apr 18-May 18-Jun 18-Jul 18-Aug 18-Sep 18-Oct 18-Nov 18-Dec
Series1 145,059147,296148,398149,2931.6E+081.6E+081.6E+08161,792 158,74 162,05 165,23 169,10 172,87
Total Active Voice Subscriptions: December'17 - December'18

Page | 8
Trend of Teledensity (December, 2017 – December, 2018)
Teledensity increased from 103.61% in December 2017 to 123.48% in December 2018. There has been a
consistent growth in teledensity from January 2018 to June 2018. A slight decrease in Teledensity was
observed in July 2018 (From 116.26 to 115.57). The growth in Teledensity continued from August 2018
to December 2018. As indicated in the table below. The sustained increased recorded across all
technologies (Mobile GSM, Mobile CDMA, Fixed Wired/Wireless and VoIP) and were attributed to
regulatory efforts of the Commission that provided the enabling environment for this growth as well
increased activities in operators promo offerings to gain market share.
Teledensity from December, 2017 - December, 2018
Dec’17
Jan ‘18 Feb’18 Mar’18 Apr’18 May’18 Jun’18 Jul’18 Aug’18 Sep’18 Oct’18 Nov’18 Dec’18
103.61 105.21 106 106.64 114.66 116.09 116.26 115.57 113.39 115.76 118.03 120.79 123.48
Table 3: Teledensity (December, 2017 - December, 2018)
Figure 4: Teledensity (December, 2017- December, 2018)
90
95
100
105
110
115
120
125
Teledensity: December'17 - December'18

Page | 9
Chapter Three
SUBSCRIBER NETWORK ANALYSIS FOR MOBILE GSM & CDMA OPERATORS
ANALYSIS OF 2018 YEAR END SUBSCRIBER / NETWORK DATA– MOBILE
A. NETWORK DATA 1a. Base Stations for Mobile: As at December, 2018 the total base stations owned by Mobile telecoms
operating companies increased to 30,637 base stations from 30,598 in December, 2017 across all
states of the Federation representing an increase of 6.02% from the previous year. As at December,
2018 MTN owned the highest number of base stations standing at 14,715 base stations; with others
owning AIRTEL- 7,966; GLO- 7,244; NTEL- 562; EMTS- 148 and SMILE- 2 base stations.
Figure 5: Number of Mobile (GSM/CDMA) Base Stations in Nigeria (2017 - 2018)
0
5000
10000
15000
20000
25000
30000
35000
MTN GLO AIRTEL EMTS SMILE NTEL TOTAL
BASE STATIONS OWNED BY MOBILE OPERATORS IN NIGERIA (2017-2018)
2017 2018

Page | 10
Figure 6: Number of Mobile (GSM/CDMA) Base Stations in Nigeria (2018)
1b. Per State Base Stations Analysis for Mobile: The top five states with highest number of base stations are Lagos- 4,734; Ogun- 1,931; FCT- 1,675; Rivers- 1,671; and Oyo- 1,300 while the states with the least number of base stations are: Yobe-205; Zamfara- 223; Jigawa- 289; Kebbi- 298 and Sokoto- 308. 2. Infrastructure Deployment in the Mobile Segment; includes all authorized operating telecommunications network provider authorized to design, deploy, provide, and operate their telecoms network infrastructure in issued public/private properties as contained in their respective license document within the country. There are several technologies deployed and operating in the country as seen below. 2a. Fiber Optics Deployment (km):
i. As at December, 2018, On-land Fiber Optics in km was deployed as follows:- MTN – 13,727km; GLO - 13,255km; AIRTEL – 8,558km; EMTS - 4,650km and NTEL - 180km. In this segment, a total of 40,370.3km of On-land Fiber Optics was deployed reflecting a decrease from 51,305km deployed reported for 2017.
0
5000
10000
15000
20000
25000
30000
35000
MTN GLO AIRTEL EMTS SMILE NTEL TOTAL
NUMBER OF BASE STATIONS (MOBILE) 2018

Page | 11
Figure 7. Fibre Optics On-Land Deployment in km (2017-2018)
ii. As at December, 2018, Submarine Fiber Optics in km was deployed by four Mobile
operators as follows: - MTN-1,500km; GLO- 9,800km; AIRTEL – 14km and NTEL - 70km with a total of 11,390km.
iii. A further analysis of the fibre optics deployed illustrated that of the 51,760.3km deployed as at December, 2018; 40,370.3km was on-land while 11,390km was submarine. MTN had the largest on-land with 13,727km deployed while GLO had the largest submarine of 9,800km as at December, 2018.
Figure 8: Fibre Optic On-Land and Submarine Deployment in Km (2017 – 2018)
0
10,000
20,000
30,000
40,000
50,000
60,000
MTN GLO AIRTEL EMTS NTEL TOTAL
FIBRE OPTICS ON-LAND DEPLOYMENT (KM) (2017-2018)
2017 2018
-
10,000
20,000
30,000
40,000
50,000
60,000
MTN GLO AIRTEL EMTS NTEL TOTAL
FIBRE OPTICS DEPLOYMENT-LAND & SUBMARINE (2017 - 2018)
2017 On-land 2017 Submarine 2018 On-land 2018 Submarine

Page | 12
2b. Microwave Radio in (km): As at December, 2018 the Mobile operators had deployed a total of 334,314km of microwave radio links. This indicates a growth from 304,070.93km of microwave radio reported for 2017. A further analysis of the microwave radio in km deployed illustrated that of the 334,314km links deployed as at December, 2018; MTN-137,565.89km; GLO had 72,128km; AIRTEL - 68,169km; EMTS - 48,958km; NTEL - 4,545km and 2,948km.
Figure 9: Microwave Radio in km (2017 – 2018)
2c. Trunks in Use: MTN, AIRTEL and EMTS had a total of 720,071Trunks (E1) in use as at December, 2018 indicating a decline from 908,296 Trunks (E1) reported as at December 2017. In summary, MTN had 391; AIRTEL had 713,443 and EMTS had 6,237 Trunks (E1) in use as at December, 2018.
Figure 10: Number of Trunks (E1) in use (2017 – 2018)
-
50,000.00
100,000.00
150,000.00
200,000.00
250,000.00
300,000.00
350,000.00
MTN GLO AIRTEL EMTS SMILE NTEL TOTAL
MICROWAVE RADIO IN KM (2017 - 2018)
2017 2018
-
100,000
200,000
300,000
400,000
500,000
600,000
700,000
800,000
900,000
1,000,000
MTN AIRTEL EMTS TOTAL
NUMBER OF TRUNKS (E1) IN USE 2017 - 2018
2017 2018

Page | 13
2d. Leased Lines in Use: EMTS, SMILE and NTEL had a total of 37 Leased lines in use as at December, 2018 indicating a slight decline from 41 reported as at December 2017. In summary, EMTS, SMILE and NTEL had 16; 14 and 7 Leased lines in use respectively as at December, 2018.
Figure 11: Number of Gateways in use (2017 – 2018)
2e. Gateways in Use: MTN, GLO, AIRTEL, SMILE and NTEL had a total of 63 Gateways in use as at December, 2018 indicating an increase from 24 reported as at December 2017. In summary, MTN had 2; GLO -3; AIRTEL -16, EMTS – 39, SMILE -2 and NTEL -1 Gateways in use as at December, 2018.
Figure 12: Number of Gateways in use (2017 – 2018)
0
5
10
15
20
25
30
35
40
45
MTN EMTS SMILE NTEL TOTAL
NUMBER OF LEASED LINES IN USE 2017 - 2018
2017 2018
-
10
20
30
40
50
60
70
MTN GLO AIRTEL EMTS SMILE NTEL INTERC TOTAL
NUMBER OF GATEWAYS IN USE (2017 - 2018)
2017 2018

Page | 14
B. SUBSCRIBER & SERVICE DATA – VOICE SUBSCRIPTIONS
1a. Subscriber Voice Data & Teledensity (All Segments): As at December, 2018 total active voice
subscriptions for the entire service category was 172,871,094 while Teledensity was 123.48%. This
indicates an increase of 19.2% from 145,059,514 reported in December 2017 with a Teledensity of
103.61%.
Figure 13: Subscriber Data- Active Voice Subscriptions & Teledensity (2002 - 2018)
1b. Subscriber Voice Data & Teledensity (Mobile GSM- 2018): In analyzing the annual Active Voice
Subscription for Mobile (GSM) Segment, total active voice subscriptions stood at 172,485,805 while
Teledensity was 123.48. This indicates that there was a 6.1% decline from 144,631,678 subscriptions
reported in December 2017 with Teledensity of 103.61%.
1c. Active Voice Subscriptions of Mobile Segment (2018): Market Share of Mobile Operators was
analyzed through the breakdown of operators each reflecting: MTN; GLO; AIRTEL; EMTS; SMILE;
NTEL; MULTILINKS & VISAFONE which respectively had 67,133,009; 45,255,297; 44,180,484; 15,917,015;
113,201; 7,505; 4,460 & 119,632 indicating that MTN; GLO; AIRTEL and EMTS each had 39%; 26%; 26%; &
9% while SMILE, NTEL, MULTILINKS & VISAFONE all had 0% share of the Mobile market segment.
-
20.00
40.00
60.00
80.00
100.00
120.00
140.00
-
20,000,000
40,000,000
60,000,000
80,000,000
100,000,000
120,000,000
140,000,000
160,000,000
180,000,000
200,000,000
2002 2004 2006 2008 2010 2012 2014 2016 2018
Total Active Voice Subscriptions (2002 - 2018)
Total
Teledensity

Page | 15
Figure 14: Market Share of Mobile Operators - 2018
Figure 15: Active Voice Subscriptions of Mobile Segment, 2017 – 2018
1d. In analysising the annual trend of the Active Voice Subscription services in the country, for all
market segments;- it is revealed that the growth in this service was ultimately driven by the mobile
(GSM) market segment as this segment accounted for 99.7%, while the Mobile (CDMA), Fixed
Wired/Wireless and VOIP market segments each accounted for 0.1%, 0.1% and 0.1% respectively of the
entire market share in terms of technology deployment as illustrated in:-Table 1 and figure 13 below:
39%
26%
26%
9% 0%0%0%0%
MARKET SHARE OF MOBILE OPERATORS (2018)
MTN GLO AIRTEL EMTS MULTILINKS VISAFONE SMILE NTEL
-
50,000,000
100,000,000
150,000,000
200,000,000
ACTIVE VOICE SUBSCRIPTIONS MOBILE (2017-2018)
2017 2018

Page | 16
Table 4: Percentage of Market Share of Service Deployment by Technology as at December, 2018
Figure 16: Percentage of Market Share of Service Deployment by Technology as at December, 2018
1e. Prepaid & Postpaid Mobile Voice Subscriptions – 2018:
i. Total prepaid voice subscriptions increased from 140,787,233 in December, 2017 to 168,020,223 in December, 2018 indicating a 19.3% growth in prepaid voice subscriptions in the year 2018.
ii. Similarly Postpaid voice subscriptions increased from 4,030,757 in December, 2017 to 4,589,674 in December, 2018 indicating an increase of 13.9% growth in postpaid voice subscriptions as at year end 2018.
iii. In summary, the above analysis indicates that about 97% of Mobile subscribers are prepaid subscriber while only about 3% are postpaid subscribers.
MOBILE (GSM) 99.7%
MOBILE (CDMA) 0.1%
FIXED WIRED/WIRELESS
VOICE OVER INTERNET PROTOCOL(VoIP) 0.1%
Percentage of Market Share of Service Deployment by Technology as at December '18
MOBILE (GSM)
MOBILE (CDMA)
FIXED WIRED/WIRELESS
VOICE OVER INTERNETPROTOCOL(VoIP)
MOBILE (GSM) MOBILE (CDMA) FIXED WIRED/WIRELESS VOICE OVER INTERNET PROTOCOL (VoIP)
99.7% 0.1% 0.1% 0.1%

Page | 17
Figure 17: Prepaid & Postpaid Voice Subscriptions- Mobile 2017 – 2018
Figure 18: Number of Active Voice Subscriptions per Region (2018)
-
20,000,000
40,000,000
60,000,000
80,000,000
100,000,000
120,000,000
140,000,000
160,000,000
180,000,000
MTN GLO AIRTEL EMTS MULTILINKS VISAFONE TOTAL
PREPAID & POSTPAID VOICE SUBSCRIPTIONS (2017-2018)
2017 PREPAID 2017 POSTPAID 2018 POSTPAID 2018 POSTPAID
-
2,000,000
4,000,000
6,000,000
8,000,000
10,000,000
12,000,000
14,000,000
16,000,000
South South South West South East North West North East North Central
ACTIVE VOICE SUBSCRIPTIONS PER REGION - 2018
MTN GLO AIRTEL EMTS SMILE NTEL MULTILINKS VISAFONE

Page | 18
Figure 19: Number of Active Voice Subscriptions per Region (2018)
1f. Total Number of Registered Mobile SIM-Based Subscribers: in line with the SIM Card registration
exercise mandated by the Commission, Mobile Operators as at December, 2018 had registered a total
of 257,819,527 subscribers in the country.
Figure 20: Total Number of Registered SIM- Based Subscribers (2018)
1g. Active Subscriptions to LTE/WIMAX (2018): As at December, 2018 Active Subscriptions to
LTE/WIMAX stood at 12,761,473 as reported by MTN, GLO, AIRTEL, EMTS, SMILE & NTEL. MTN had
the highest number of active 4G subscriptions with 5,760,328, AIRTEL - 4,412,299; GLO - 911,701; EMTS
- 901,771; SMILE - 538,308; and NTEL - 237,066 of 4G subscriptions. The graph below represents Active
Subscriptions to LTE/WIMAX during the period under review.
-
2,000,000
4,000,000
6,000,000
8,000,000
10,000,000
12,000,000
14,000,000
16,000,000
18,000,000
20,000,000
South South South West South East North West North East North Central
ACTIVE VOICE SUBSCRIPTIONS PER REGION - 2018
MTN GLO AIRTEL EMTS SMILE NTEL MULTILINKS VISAFONE
-
50,000,000
100,000,000
150,000,000
200,000,000
250,000,000
300,000,000
TOTAL NUMBER OF REGISTERED SIM-BASED SUBSCRIBERS- 2018

Page | 19
Figure 21: Active Subscriptions to LTE/WIMAX (2018)
1h. Machine to Machine (2018): This refers to the number of Mobile-Cellular machine to machine
subscriptions that are assigned for use in machines and devices for the exchange of data between
networked devices, and are not part of a consumer subscription. As at December, 2018 the number
of Mobile-Cellular machine-machine subscriptions as reported by MTN, GLO and EMTS was 598,010.
EMTS had the highest number of machine to machine subscriptions with 302,017, MTN had 162,060
while GLO recorded the least subscriptions with 133,933 as shown in Figure 18 below;
Figure 22: Machine to Machine Subscriptions (2018)
1i. Number of Data-Only Mobile-Broadband Subscriptions – Dongles (2018): This refers to subscriptions to mobile broadband services that allow access to the open Internet via hypertext transfer protocol (HTTP) and do not include voices services, i.e. Subscriptions that offer mobile broadband as a standalone service such as mobile-broadband subscriptions for data-cards, USB modem/dongle and tablets. MTN, GLO, AIRTEL and EMTS had a total number of 733,933 Data-Only Mobile-Broadband Subscriptions (Dongles) as at December, 2018.
0
2,000,000
4,000,000
6,000,000
8,000,000
10,000,000
12,000,000
14,000,000
MTN GLO AIRTEL EMTS SMILE NTEL TOTAL
ACTIVE SUBSCRIPTION TO LTE/WIMAX - 2018
0
200,000
400,000
600,000
MTN GLO EMTS TOTAL
MACHINE TO MACHINE 2017-2018
2017 2018

Page | 20
In summary, MTN, GLO, AIRTEL and EMTS had 73,132; 486,569; 152,226 and 22,006 Data-Only Mobile-Broadband Subscriptions (Dongles) respectively as at December, 2018.
Figure
23: Data-Only Broadband Subscriptions (2017 - 2018)
1j. Number of Data and Voice Mobile-Broadband Subscriptions – Smartphones (2018): These are the
subscriptions to mobile-broadband services that allow access to the open internet via hypertext
transfer protocol (HTTP) and in which data services are contracted together with voice
services(mobile voice and data plans)or as an add-on package to a voice plan. The number of Data
and Voice Mobile-Broadband subscriptions increased from 42,572,537 recorded in December, 2017 to
47,663,680 as at December, 2018. MTN, GLO, AIRTEL and EMTS each reported 18,158,002, 8,049,919,
11,557,945 and 9,897,814 subscriptions as at December, 2018.
Figure 24: Data and Voice Mobile-Broadband Subscriptions (2017 - 2018)
0
100,000
200,000
300,000
400,000
500,000
600,000
700,000
800,000
MTN GLO AIRTEL EMTS TOTAL
DATA-ONLY MOBILE-BROADBAND SUBSCRIPTION (2017-2018)
2017 2018
0
10,000,000
20,000,000
30,000,000
40,000,000
50,000,000
MTN GLO AIRTEL EMTS TOTAL
DATA & VOICE MOBILE BROADBAND SUBSCRIPTIONS (2017-2018)
2017 2018

Page | 21
1k. Mobile Voice Traffic Trend (2018): The graphs below represent the call traffic activities contained
in the year 2018 as reported by Mobile operators in the county.
i. Local and National Telephone Traffic in 2018: As at December, 2018 total outgoing Local and National Traffic was 121,935,927,123.15, while Total incoming Local and National Traffic was 107,352,541,744.62. MTN has the highest total outgoing and incoming Traffic of 90,569,577,625 and 87,055,450,054 respectively in 2018.
NATIONAL TELEPHONE TRAFFIC 2018
Outgoing Incoming Total
MTN 90,569,577,625.00 87,055,450,054.00 177,625,027,679.00
GLO 8,676,061,593.00 26,468,131.97 8,702,529,724.97
AIRTEL 16,625,741,609.00 13,324,007,122.00 29,949,748,731.00
EMTS 5,154,962,428.57 6,876,791,091.79 12,031,753,520.36
SMILE 140,571,754.00 10,866,146.00 151,437,900.00
NTEL 769,012,114 58,959,199 827,971,312
TOTAL 121,935,927,123.15 107,352,541,744.62 229,288,468,867.77 Table 5: Local and National Traffic in 2018
Figure 25: Local and National Telephone traffic – 2018
-
50,000,000,000.00
100,000,000,000.00
150,000,000,000.00
200,000,000,000.00
250,000,000,000.00
MTN GLO AIRTEL EMTS SMILE NTEL TOTAL
NATIONAL TELEPHONE TRAFFIC (2018)
Outgoing Incoming Total

Page | 22
ii. Outgoing and Incoming Mobile to (and) from International Traffic in 2018: As at December, 2018 Total Outgoing Mobile to International Traffic was 817,861,175.80 while Total incoming Mobile to International Traffic was 1,517,597,253.73. MTN reported the highest Outgoing Traffic of 488,667,550.87 and the highest Incoming Traffic of 1,071,081,222.10 for the period under review.
OUTGOING/ORIGINATING & INCOMING MOBILE TO/FROM INTERNATIONAL TRAFFIC- 2018
Outgoing Incoming Total
MTN 488,667,550.87 1,071,081,222.10 1,559,748,772.97
GLO 108,232,481.00 188,238,676.00 296,471,157.00
AIRTEL 140,818,002.00 257,634,011.00 398,452,013.00
EMTS 79,773,352.03 - 79,773,352.03
SMILE 283,350.00 5,132.00 288,482.00
NTEL 86,439.90 638,212.63 724,652.53
TOTAL 817,861,175.80 1,517,597,253.73 2,335,458,429.53 Table 6: Outgoing and Incoming Mobile to (and) from International Traffic in 2018
Figure 26. Outgoing and Incoming mobile to/from International traffic- 2018
-
500,000,000.00
1,000,000,000.00
1,500,000,000.00
2,000,000,000.00
2,500,000,000.00
MTN GLO AIRTEL EMTS SMILE NTEL TOTAL
OUTGOING/ORIGINATING & INCOMING MOBILE TO/FROM INTERNATIONAL (2018)
Outgoing Incoming Total

Page | 23
iii. Mobile (GSM/VoIP) to Mobile (GSM/VoIP) Voice Call Traffic in 2018:- As at December, 2018 total outgoing Mobile to Mobile minutes was 114,204,469,380.46 while total incoming Mobile to Mobile minutes was 71,896,803,812.89. MTN reported the highest Outgoing Traffic of 88,375,026,139 and the highest incoming Traffic of 54,967,340,762 for the period under review.
MOBILE TO MOBILE TRAFFIC 2018
Outgoing Incoming Total
MTN 88,375,026,139.00 54,967,340,762.00 143,342,366,901.00
GLO 8,676,061,593.43 26,468,131.97 8,702,529,725.40
AIRTEL 11,543,294,349.00 10,392,932,523.00 21,936,226,872.00
EMTS 4,700,503,431.45 6,440,237,051.06 11,140,740,482.51
SMILE 140,571,754.00 10,866,146.00 151,437,900.00
NTEL 769,012,113.58 58,959,198.86 827,971,312.44
TOTAL 114,204,469,380.46 71,896,803,812.89 186,101,273,193.35
Table 7: Mobile to Mobile Voice Traffic in 2018
Figure 27: Mobile to Mobile traffic -2018
iv. Mobile to Fixed Voice Call Traffic in 2018:- As at December, 2018 Total Outgoing Mobile to Fixed minutes was 2,871,847,152.95 while Total incoming Mobile to Mobile minutes was 2,694,604,389.13. MTN reported the highest Outgoing Traffic of 2,829,889,652.00 and the highest Incoming Traffic of 2,642,104,507.00 for the period under review.
MOBILE TO FIXED TRAFFIC 2018
Outgoing Incoming Total
MTN 2,829,889,652.00 2,642,104,507.00 5,471,994,159.00
GLO 7,646,001.63 24,356.45 7,670,358.08
AIRTEL 21,773,291.00 39,260,225.00 61,033,516.00
EMTS 12,538,208.32 13,215,300.68 25,753,509.00
TOTAL 2,871,847,152.95 2,694,604,389.13 5,566,451,542.08 Table 8: Mobile to Fixed Traffic in 2018
-
50,000,000,000.00
100,000,000,000.00
150,000,000,000.00
200,000,000,000.00
MTN GLO AIRTEL EMTS SMILE NTEL TOTAL
MOBILE TO MOBILE TRAFFIC (2018)
Outgoing Incoming Total

Page | 24
Figure 28: Mobile to Fixed traffic -2018
v. Number of Roaming Minutes in 2018: The Total Number of Mobile Roaming Minutes Outgoing and Incoming as at December 2018 for the Mobile Operators was 251,296,981.71.See Table 6 & Figure 25 below;
NUMBER OF ROAMING MINUTES 2018
Outgoing Incoming Total
MTN 181,220,499.67 46,978,998.00 228,199,497.67
GLO 603,744.00 2,275,740.00 2,879,484.00
AIRTEL 2,813,274.86 8,374,985.78 11,188,260.64
EMTS 3,374,691.85 5,655,047.55 9,029,739.40
TOTAL 188,012,210.38 63,284,771.33 251,296,981.71 Table 9: Total number of Roaming Minutes (2018)
Figure 29: Total number of Roaming Minutes -2018
-
1,000,000,000.00
2,000,000,000.00
3,000,000,000.00
4,000,000,000.00
5,000,000,000.00
6,000,000,000.00
MTN GLO AIRTEL EMTS TOTAL
MOBILE TO FIXED TRAFFIC (2018)
Outgoing Incoming Total
-
50,000,000.00
100,000,000.00
150,000,000.00
200,000,000.00
250,000,000.00
300,000,000.00
MTN GLO AIRTEL EMTS TOTAL
NUMBER OF ROAMING MINUTES (2018)
Outgoing Incoming Total

Page | 25
vi. National SMS in 2018: The Total Number of National SMS sent and received as at December 2018 was 30,481,715,377.73. See Table 7 & Figure 26 below;
SMS MESSAGES NATIONAL 2018
SMS Sent SMS Received Total
MTN 3,666,697,286.00 3,954,700,988.00 7,621,398,274.00
GLO 1,819,212,069.00 14,937,509,711.00 16,756,721,780.00
AIRTEL 3,594,341,585.00 1,533,525,249.00 5,127,866,834.00
EMTS 455,902,616.73 490,025,352.00 945,927,968.73
SMILE 25,541,051.00 786,670.00 26,327,721.00
NTEL 3,472,800.00 - 3,472,800.00
TOTAL 9,565,167,407.73 20,916,547,970.00 30,481,715,377.73 Table 10: Total number of Outgoing/Incoming Local/National SMS trend (2018)
Figure 30: Total Outgoing/ Incoming SMS, Mobile (2018)
vii. International SMS in 2018: The Total Number of International SMS sent as at December 2018 was 51,534,609.18 while total number of received International SMS reported was 92,954,952.18. See Table 8 & Figure 24 below;
SMS MESSAGES INTERNATIONAL 2018
SMS Sent SMS Received Total
MTN 31,270,494 16,628,738.00 47,899,232.00
GLO 5,387,480 4,218,995.00 9,606,475.00
AIRTEL 10,449,140.00 43,724,017.00 54,173,157.00
EMTS 3,972,938.18 28,256,218.18 32,229,156.36
SMILE 348,016.00 20,395.00 368,411.00
NTEL 106,541.00 106,589.00 213,130.00
TOTAL 51,534,609.18 92,954,952.18 144,489,561.36 Table 11: Total number of Outgoing/Incoming International SMS trend (2018)
-
5,000,000,000.00
10,000,000,000.00
15,000,000,000.00
20,000,000,000.00
25,000,000,000.00
30,000,000,000.00
35,000,000,000.00
MTN GLO AIRTEL EMTS SMILE NTEL TOTAL
SMS MESSAGES NATIONAL (2018)
SMS Sent SMS Received Total

Page | 26
Figure 31: Total Outgoing/ Incoming SMS, Mobile (2018)
C. SUBSCRIBER & SERVICE DATA – INTERNET SUBSCRIPTIONS
1a. Mobile Subscriber Internet Data- 2018: As at December, 2018 the total active internet
subscriptions for the mobile segment was 112,055,872 this reflects a 7.2% increase from 98,687,348
reported in December 2017.
Three of the four major GSM operators reported growth of AIRTEL 24.1; MTN 21.7% and GLO 3.9%
while EMTS declined by 1.38% for the period under review. EMTS decline is attributed to low gross
sales experienced within the year. The Mobile (GSM) market segment comprising of MTN; GLO;
AIRTEL & EMTS accounted for 111,632,516 of the Total Active Mobile internet subscriptions as at
December, 2018.
TOTAL NUMBER OF MOBILE INTERNET SUBSCRIPTIONS
2017 2018
MTN 36,069,597 43,899,957
GLO 26,997,817 28,054,948
AIRTEL 23,985,203 29,757,791
EMTS 11,338,839 9,919,820
SMILE 221,447 283,936
NTEL 44,136 75,191
MULTILINKS 4 4
VISAFONE 30,305 64,225
TOTAL 98,687,348 112,055,872 Table 12: Total Number of Active Mobile Internet Subscription- 2018
-
20,000,000
40,000,000
60,000,000
80,000,000
100,000,000
120,000,000
140,000,000
160,000,000
MTN GLO AIRTEL EMTS SMILE NTEL TOTAL
SMS MESSAGES INTERNATIONAL (2018)
SMS Sent SMS Received Total

Page | 27
Figure 32: Total Number of Active Mobile Subscriptions – (2017 - 2018)
1b. Broadband Penetration Statistics – December 2018:- The Broadband Penetration figure as at
December, 2018 stood at 31.48%. This figure is based on the United Nations Population Data estimate
of December 2017, that estimated Nigeria`s population to be 190,886,311. The total active 3G -
47,325,726 and 4G - 12,761,473 subscriptions as at December, 2018 was 60,087,199 which was used in
projecting broadband penetration rate as at December, 2018.
Figure 33: Broadband Penetration trend December, 2017 – December, 2018
-
20,000,000
40,000,000
60,000,000
80,000,000
100,000,000
120,000,000
TOTAL ACTIVE MOBILE INTERNET SUBSCRIPTIONS (2017-2018)
2017 2018
0.00%
5.00%
10.00%
15.00%
20.00%
25.00%
30.00%
35.00%
BB Penetration Dec'17 - Dec'18

Page | 28
BROADBAND PENETRATION RATE DECEMBER 2017 – DECEMBER 2018
3G Subscriptions 4G Subscriptions Total 3G & 4G BB Penetration Rate
Dec-17 34,460,636 3,454,859 37,915,495 19.86
Jan-18 34,481,029 3,636,118 38,117,147 19.97
Feb-18 34,666,214 3,878,917 38,545,131 20.19
Mar-18 34,745,044 3,970,876 38,715,920 20.28
Apr-18 39,452,793 4,811,919 44,264,712 23.19
May-18 42,321,337 5,080,336 47,401,673 24.83
Jun-18 42,537,774 5,410,804 47,948,578 25.12
Jul-18 42,599,021 5,595,675 48,194,696 25.25
Aug-18 42,913,992 5,932,257 48,846,249 25.59
Sep-18 44,552,559 9,649,215 54,201,774 28.39
Oct-18 45,889,471 11,047,823 56,937,294 29.83
Nov-18 47,089,658 11,875,820 58,965,478 30.89
Dec-18 47,325,726 12,761,473 60,087,199 31.48 Table 13. Total Active 3G & 4G Internet Subscriptions December 2017- December 2018
1c. Internet Usage Statistics – December 2018:- The total volume of data consumed by subscribers in
December, 2018 was 68,154.12TB indicating a 50% from 45,450.26 reported in December, 2017.
Figure 34: Internet Usage Statistics December, 2017 – December, 2018
45,450.26 46,175.05
41,308.38
48,417.70 49,121.36
52119.8550412.52
52084.17
54,644.50
60297.66
83,441.11
63953.768154.12
INTERNET USAGE STATISTICS IN TERABYTES (TB)DECEMBER'17 - DECEMBER'18

Page | 29
D. SUBSCRIBER & SERVICE DATA – PORTING TREND IN NIGERIA AS AT DECEMBER, 2018
1a. The Mobile (GSM) Number Porting Activities:- this segment reports porting activities across the
various Mobile GSM networks (MTN, GLO, AIRTEL & EMTS) in the country and analysis of these
activities is as shown below:
i. Table 11 below shows the trend of Nigeria’s porting activities from inception (May, 2013 to December, 2018) for the four (4) major GSM Operators. The analysis above illustrates that EMTS had the highest count of port-in subscribers [521,999] from other networks while AIRTEL, MTN and GLO are as follows [222,812]; [90,777] & [88,707] respectively.
ii. Similarly, our analysis from May, 2013 to December, 2018 reveals that MTN had the highest number of subscribers that ported-out [384,061] to other networks while AIRTEL, GLO & EMTS are as follows [218,728]; [185,367] & [118,032] respectively.
MTN GLO AIRTEL EMTS TOTAL
May‘13- December'18
May‘13- December'18
May‘13- December'18
May‘13- December'18
May‘13- December'18
Cumulative Port-In
90,777 88,707 222,812 521,999 924,295
Cumulative Port-Out
384,061 185,367 218,728 118,032 906,188
Total Porting Activities (Port-in and Port-out for the period May, 2013- December, 2018
1,830,483
Table 14: Cumulative Mobile Number Portability (May, 2013 – December, 2018)
Figure 35: Cumulative Mobile Number Portability (May, 2013 – December, 2018)
-
100,000
200,000
300,000
400,000
500,000
600,000
700,000
800,000
900,000
1,000,000
MTN GLO AIRTEL EMTS TOTAL
PORTING ACTIVITIES FROM INCEPTION (MAY'13 - DECEMBER'18)
Cumulative Port-In Cumulative Port-Out

Page | 30
1b. Port- In activities from December, 2017 – December, 2018:- The total number of Port- in numbers
from other networks between December, 2017 and year end 2018 for the four major Mobile (GSM)
operators stood at 95,606. See figure 31 below;
Figure 36: Ported – in (from other networks) numbers (Dec, 2017 – Dec, 2018)
1c. Ported – Out activities from December, 2017 – December, 2018:- The total of Port – Out numbers
to other networks between December, 2017 and year end 2018 for the four major Mobile (GSM)
operators stood at 94,556. See figure 32 below;
Figure 37: Ported – Out (to other networks) numbers (Dec, 2017 – Dec, 2018)
-
1,000
2,000
3,000
4,000
5,000
6,000
TOTAL NUMBER OF MOBILE GSM LINES PORTED-IN (DEC'17 - DEC'18)
MTN GLO AIRTEL EMTS
-
500
1,000
1,500
2,000
2,500
3,000
3,500
TOTAL NUMBER OF MOBILE GSM LINES PORTED-OUT (DEC'17 - DEC'18)
MTN GLO AIRTEL EMTS

Page | 31
E. FINANCIAL DATA – MOBILE (2018)
1a. Revenue: The Mobile operators as at December 2018 recorded a total revenue of N1, 784,754,010,000. This reflects an increase of 13.9% from N1, 569,861,900,000 revenue reported in 2017. See table 12 and figure 32 below:
TABLE 37: REVENUE (N Million)
2017 2018
MTN 884,067.00 1,037,068.00
GLO 157,286.00 165,891.21
AIRTEL 315,210.00 399,452.00
EMTS 195,720.00 166,919.00
SMILE 8,991.00 11,064.00
NTEL 8,587.90 4,359.80
Total 1,569,861.90 1,784,754.01 Table 15: Mobile Revenue (2017 – 2018)
Figure 38: Mobile Revenue (2017 - 2018)
-
200,000.00
400,000.00
600,000.00
800,000.00
1,000,000.00
1,200,000.00
1,400,000.00
1,600,000.00
1,800,000.00
MTN GLO AIRTEL EMTS SMILE NTEL Total
REVENUE 2017-2018
2017
2018

Page | 32
1b. Operating Cost: Similarly, the total Operating Cost as at December 2018 for the Mobile operators
stood at N1, 461,019, 890, 000. This illustrates a growth of 0.6% from revenue figures reported in 2017
which was N1, 452,302,550,000. See table 12 and figure 33 below;
TABLE 38: OPERATING COSTS (N Million)
2017 2018
MTN 685,532 768,421
GLO 156,062 165,165
AIRTEL 264,514 284,094
EMTS 304,609 217,085
SMILE 32,350 12,336
NTEL 9,236 13,918
Total 1,452,302.55 1,461,019.89 Table 16: Mobile Operating Cost (2017 – 2018)
Figure 39: Mobile Operating Cost (2017 –2018)
-
200,000
400,000
600,000
800,000
1,000,000
1,200,000
1,400,000
1,600,000
MTN GLO AIRTEL EMTS SMILE NTEL Total
OPERATING COST 2017 - 2018
2017
2018

Page | 33
1c. Assets: As at December 2018 total Assets for the Mobile operators stood at N 1,950,531,920,000.
This shows an increase of 130% from N 847,927,240,000 reported in December, 2017. See table 13 and
figure 34 below;
ASSETS (N Million)
2017 2018
MTN 36,026.12 939,555.00
GLO 439,108.00 552,464.00
AIRTEL 285,163.00 360,295.00
EMTS 25,510.00 27,304.00
SMILE 26,094.00 22,928.00
NTEL 36,026.12 47,985.92
Total 847,927.24 1,950,531.92 Table 17: Mobile Assets (2017 – 2018)
Figure 40: Mobile Assets (2017 – 2018)
-
200,000.00
400,000.00
600,000.00
800,000.00
1,000,000.00
1,200,000.00
1,400,000.00
1,600,000.00
1,800,000.00
2,000,000.00
MTN GLO AIRTEL EMTS SMILE NTEL Total
ASSETS 2017 - 2018
2017
2018

Page | 34
F. STAFF PROFILE – MOBILE (2018) The total number of Staff reported by the Mobile operators (MTN, GLO, Airtel, EMTS, Smile and Ntel)
as at December, 2018 was a total of 7,567 recording; 188 expatriates and 7,379 Nigerians. Further
breakdown in this category reveals that 4,926 of the Nigerian Staff are Male while the outstanding
2,453 are female. Similarly, 185 are male expatriates and 3 are female expatriates. See table 14 and
figure 35 below;
NUMBER OF STAFF (2018)
Nigerian Expatriate
Male Female Male Female
MTN 1,130 568 15 1
GLO 2,199 941 160 2
AIRTEL 416 157 6 -
EMTS 809 595 1 -
SMILE 123 83 3 -
NTEL 249 109 - -
Total 4,926 2,453 185 3 Table 18: Mobile Staff profile (2018)
Figure 41: Mobile Staff profile (2018)
-
500
1,000
1,500
2,000
2,500
3,000
3,500
4,000
4,500
5,000
MTN GLO AIRTEL EMTS SMILE NTEL Total
NUMBER OF STAFF (MOBILE) 2018
Nigerian Male Nigerian Female Expatriate Male Expatriate Female

Page | 35
Chapter Four
Subscriber Network Analysis for Fixed Telephony (Fixed/Fixed Wireless Operators)
The Fixed year end performance report depicts the analysis of the market as at December, 2018 which is as follows:
NETWORK DATA
1. Base Stations: As at December, 2018 Ipnx was the only operator with base stations; a total
number of 51 base stations. This records a slight increase of about 4% as the number stood at
49 Base stations in 2017.
INFRASTRUCTURE DEPLOYMENT
2. Fiber Optics: As December, 2018 MTN deployed 31,847km on land and 320km submarine fibre
optics; Globacom deployed 13,255km on land and 9,800km submarine fibre optics; 21st Century
deployed 8000km on land and 33km fibre optics while ipNX deployed 927.4km of on land fibre
optics. This makes an aggregate of 54,029km of On-land Fiber Optics deployed as at
December, 2018 signifying an increase of 13.69% from the 47,520km deployed in the year 2017.
Similarly an aggregate of 10,153km Submarine Fibre Optics was deployed by MTN, Globacom,
21st Century and IPNX during the period under review. Signifying a 0.99% increase from the
10,053km recorded in 2017.
FIBRE OPTICS NETWORK (in Km)
2017 2018
On-Land Submarine On-Land Submarine
MTN
25,823 220 31,847 320
GLOBACOM
13,255 9,800 13,255 9,800
21ST CENT 7,541 33 8,000 33
IPNX 900.5 N/A 927.4 N/A
TOTAL
47,520 10,053 54,029 10,153
Table 19: Fibre Optics Network (In Km)

Page | 36
Figure 42: Fibre Optics Deployed 2017 - 2018
3. Microwave Radio: Only IpNX reported a total of 329km in Microwave Radio deployment for
2018.
4. Trunks in Use: 21st Century, MTN and IPNX under the fixed telephony segment reported a
total of 1064km Trunks (E1) in use as at December, 2018.
NUMBER OF TRUNKS (E1) IN USE
2017 2018
MTN 368 391
21ST CENT 615 671
IPNX 2 2
TOTAL 985 1,064
Table 20: Number of Trunks (E1) In Use
-
10,000
20,000
30,000
40,000
50,000
60,000
On-Land Submarine On-Land Submarine
2017 2018
Fibre Optics deployed -Fixed Telephone Operators 2017 & 2018
MTN GLOBACOM 21ST CENT IPNX TOTAL

Page | 37
Figure 43: Trunks in Use (E1) 2018.
5. Gateways in Use: GLO, and ipNX reported a total of 9 Gateways as at December 2018. GLO
used 3, 21ST Century 3 and ipNX used 3 gateways too.
NUMBER OF GATEWAYS IN USE
2017 2018
GLOBACOM 3 3
21ST CENT 3 3
IPNX 2 3
TOTAL 8 9
TABLE 21: Gateways Use (E1) 2018
SUBSCRIBER AND SERVICES DATA
Total Active Voice Subscriptions: During the year under review two operators under the Fixed/ Fixed
wireless segment; MTN and Globacom reported a drop in their active subscriptions. While 21st Century
and IPNX each had 103,016 and 2,281 respectively. 21st Century had the highest active subscriptions of
103,016 for this segment as at December 2018, the total active voice subscriptions for the Fixed wired
/ Fixed wireless Telephone operators totaled 113,626 showing an increase from 112,479 recorded in
December, 2017 this indicates a 1.02% increase.
TOTAL ACTIVE VOICE SUBSCRIPTIONS
2017 2018
MTN 8,290 5,450
GLOBACOM 8,451 2,879
21ST CENTURY 93,178 103,016
IPNX 2,560 2,281
TOTAL 112,479 113,626
Table 22: Total Active Voice Subscriptions
0
200
400
600
800
1,000
1,200
MTN 21ST CENT IPNX TOTAL
NUMBER OF TRUNKS (E1) IN USE2017 & 2018
2017 2018

Page | 38
Figure 44: Total Active Voice Subscriptions (2017-2018)
Total Active Internet Subscriptions: As at December 2018 the Active Internet subscriptions for MTN, 21st Century and ipNX was totaled at 9,868. This indicated a further decrease from 2017 which was 11,962 subscriptions. The operators each recorded the following: IpNX with the highest 3,885, MTN 3,132 and 21st Century with the lowest 2,851 Subscriptions. Our analysis show that the internet usage for
the fixed wired and wireless network is being relegated and the likelihood that most subscribers have switched their lines to GSM lines.
Table 23: Total Active Internet Subscriptions
Figure 45: Total Active Internet Subscriptions (2017 – 2018)
0
20,000
40,000
60,000
80,000
100,000
120,000
MTN GLOBACOM 21ST CENT IPNX TOTAL
Total Active Voice Subscriptins- Fixed/Fixed Wireless Operators-2017 & 2018
2017 2018
0
5,000
10,000
15,000
MTN 21ST CENT IPNX TOTAL
Total Active Internet Subscriptions- Fixed Telephone Operator 2017 & 2018
2017 2018
TOTAL ACTIVE INTERNET SUBSCRIPTIONS
2017 2018
MTN 4,966 3,132
21ST CENT 2,882 2,851
IPNX 4,114 3,885
TOTAL 11,962 9,868

Page | 39
Fibre to the Home/ Building Subscriptions: As at December 2018 ipNX and MTN respectively installed
6,525 km and 2,928km of Fibre to Home / Building. This is a total of 9,453km of fibre deployed by both
operators.
FIBRE-TO-THE-HOME/BUILDING SUBSCRIPTIONS
2017 2018
MTN
2,560 2,928
IPNX
5,616 6,525
Table 24: Fibre-To-The-Home/Building Subscriptions
Figure 46: Fibre to the Home/Building Subscriptions 2017.
Number of subscriber by Internet Speed: As at December 2018, 211 users fell in the 256kbs – 1Mbps
Mbps category; 1,322 users subscribed to speeds between 2mbps-10mbps; 6,039 users between
10Mbps – 4G, category. There was no subscriptions in the 4G & above category as reported by ipNX
and 21st Century.
NUMBER OF SUBSCRIBERS BY INTERNET SPEED 2018
256kbs-1mbps 2mbps-10mbps 10mbps-4G 4G- above
21ST CENT 150 850 135 N/A
IPNX 61 472 5,904 N/A
TOTAL 211 1,322 6,039
Table 25: Number of Subscribers by Internet Speed 2018
0 1,000 2,000 3,000 4,000 5,000 6,000 7,000
2016
2017
Fibre to Home/ Building Subcriptions 2016 & 2017
IPNX MTN

Page | 40
Figure 47: No of Subscribers by Internet Speed 2018.
TRAFFIC DATA
Local and National Traffic (Outgoing): As at December, 2018, the total minutes generated for
local and national outgoing traffic (paid minutes) by fixed telephone operators;, 21st Century,
GLO and ipNX is 26,988,414; 2,049,056 and 536,897 respectively, making a total of 29,574,367
local & National Outgoing traffic. This signifies an increase of about 595,348 paid minutes
from 2017 that recorded 28979019 minutes.
Local and National Traffic (Incoming): As at December, 2018, the total minutes generated for local and national incoming traffic (paid minutes) by fixed telephone operators;, 21st Century, ipNX and Globacom is 26,950,590; 135,577 and 27,652 respectively, making a total of 27,113,819 local & National incoming traffic. This signifies an increase from 2017 which recorded 63,024 minutes. Analysis of the Total Outgoing and Incoming Local National Telephone Traffic data for this
market segment shows that a substantial portion of this traffic was generated on 21st Century
network.
LOCAL AND NATIONAL TELEPHONE TRAFFIC (IN MINUTES)
2018
Outgoing Incoming
GLOBACOM 2,049,056 27,652
21ST CENT 26,988,414 26,950,590
IPNX 536,897 135,577
TOTAL 29,574,367 27,113,819
Table 26: Local and National Telephone Traffic (In Minutes)
0
2,000
4,000
6,000
8,000
10,000
12,000
14,000
MTN 21ST CENT IPNX TOTAL
Total Active Internet Subscriptions- Fixed Telephone Operator 2017 & 2018
2017 2018

Page | 41
Figure 48: Total Number of Local & National Outgoing/ Incoming Calls (2018)
Total number of Fixed to Mobile traffic: Similarly as at December, 2018 the total number of
Outgoing Fixed to Mobile traffic increased from 101,315,161 minutes in 2017 to 138,467,700 minutes
indicating a of a 36.67% increase in the fixed to Mobile traffic in the year 2018.
Also the total number of Incoming Fixed to Mobile traffic as at December 2018 was 105,263,518
minutes compared to 65,172,961 reported in 2017 thereby indicating an increase of 61.5%
Analysis of the Fixed to the Mobile traffic for the fixed market segment shows that a
considerable percentage of this traffic was further generated on the 21st Century network.
OPERATORS FIXED TO MOBILE TRAFFIC 2018
Outgoing Incoming Total
MTN 57,558,173 - 57,558,173
GLOBACOM 2,171,561 1,065,795 3,237,356
21ST CENT 77,001,206 102,665,673 179,666,879
IPNX 1,736,760 1,532,050 3,268,810
TOTAL 138,467,700 105,263,518 243,731,218
Table 27: Fixed to Mobile Traffic 2018
GLOBACOM^ 2,049,056
21ST CENT^ 26,988,414
IPNX^ 536,897
TOTAL^ 29,574,367
0
5,000,000
10,000,000
15,000,000
20,000,000
25,000,000
30,000,000
35,000,000
GLOBACOM 21ST CENT IPNX TOTAL
Local and National Telephone Traffic (In Minutes)- Fixed Operators- 2018
2018 Outgoing 2018 Incoming

Page | 42
Figure 49: Total number of Fixed to Mobile traffic (2018)
Total number of Outgoing/ incoming Fixed Minutes International traffic:
As at December, 2018 the total number of Outgoing Fixed International traffic (minutes) for
21st Century and ipNX were 3,977,784; and 82,625 minutes respectively. While for Incoming
Fixed International traffic were 4,674,952 & 90,568 respectively for 21st Century and ipNX.
Over all the total number of Outgoing Fixed International traffic reported for the 21st Century and ipNX for 2018 was recorded at 4,060,409 this is a great decrease from the year 2017.as MTN and GLO had not submission for this indicator. While the total for Incoming fixed international traffic totaled 4,765,520 for 21st century and
ipNX for year 2018.
OUTGOING/ORIGINATING FIXED MINUTES INTERNATIONAL TELEPHONE TRAFFIC
2017 2018
Outgoing Incoming Total Outgoing Incoming Total
MTN 29,387,007
15,075,665
44,462,672
-
-
-
GLOBACOM 353,667
9,733,642
10,087,309
-
-
-
21ST CENT 4,137,499
4,878,122
9,015,621
3,977,784
4,674,952
8,652,736
IPNX 221,361
27,108
248,469
82,625
90,568
173,193
TOTAL 34,099,534
29,714,537
63,814,071
4,060,409
4,765,520
8,825,929
Table 28: Outgoing/Originating Fixed Minutes International Telephone Traffic
-
50,000,000
100,000,000
150,000,000
200,000,000
250,000,000
300,000,000
MTN GLOBACOM 21ST CENT IPNX TOTAL
Fixed to Mobile Traffic in Mins-2018
Outgoing Incoming Total

Page | 43
Figure 50: Total number of Outgoing/ Incoming Fixed Minutes International traffic (2018)
FINANCIAL DATA
Revenue: The total revenue as at December 2018 for the fixed telephone operators. (MTN,
Globacom, 21st Century and IPNX) was N4, 108,400,000 See table below for breakdown:
REVENUE (N Million)
2017 2018
MTN ** **
GLOBACOM ** **
21ST CENT 185,900,000 203,400,000
IPNX 3,862,000,000 3,905,000,000
Total 4,047,900,000 4,108,400,000
Table 29: Revenue (N Million) (** duplicated figures from enterprise submission)
Figure 51: Revenue Fixed telephone Operators (2017 & 2018)
-
1,000,000
2,000,000
3,000,000
4,000,000
5,000,000
6,000,000
7,000,000
8,000,000
9,000,000
GLOBACOM 21ST CENT IPNX TOTAL
Outgoing/ incoming Fixed Minutes Int'l Traffic 2018
2018 Outgoing 2018 Incoming 2018 Total
-
1,000,000,000
2,000,000,000
3,000,000,000
4,000,000,000
5,000,000,000
6,000,000,000
7,000,000,000
MTN GLOBACOM 21ST CENT IPNX TOTAL
Revenue- Fixed Operators- 2018
2017 2018

Page | 44
Operating Cost: Similarly, the total Operating Cost as at December 2018 for the fixed
telephone segment was N3, 120,100, 000. An increase from the total operating cost reported
in 2017 which was N3, 737,700,000 See table below for breakdown:
OPERATING COST (N Million)
2017 2018
MTN ** **
GLOBACOM ** **
21ST CENT 182,700,000 200,600,000
IPNX 3,585,000,000 2,919,500,000
TOTAL 3,767,700,000 3,120,100,000
Table 30: Operating Cost (N Million)** duplicated figures from enterprise submission)
Figure 52: Operating Cost for Fixed Telephone Operators (2018)
STAFF PROFILE
The total number of Staff reported by the fixed telephone operators (MTN, Globacom, 21st
Century and ipNX) as at December, 2018 was of 1,958; 30 are Expatriates while 1,928 are
Nigerians. A further breakdown reveals that 1320 of the Nigerian Staff are Male while 638 are
female.
NUMBER OF STAFF (2018)
Nigerian Expatriate
Male Female Male Female
MTN 1,130 568 15 1
GLOBACOM 30 - 13 -
21ST CENT 79 37 1 -
IPNX 81 33 - -
TOTAL 1,320 638 29 1 Table 31: Total Number of Staff (2018)
-
2,000,000,000
4,000,000,000
6,000,000,000
8,000,000,000
MTN GLOBACOM 21ST CENT IPNX TOTAL
Operating Cost- Fixed Operators-2018
2017 2018

Page | 45
Figure 53: Staff Profile (Nigerian/ Expatriate) for Fixed Telephone Operators (2018)
-
200
400
600
800
1,000
1,200
1,400
MTN GLOBACOM 21ST CENT IPNX TOTAL
Staff profile- Nigerian/Expatriate-Fixed Operators - 2018
Nigerian Male Nigerian Female Expatriate Male Expatriate Female

Page | 46
Chapter Five
Subscriber Network Analysis for Internet Service Providers Operators
INTRODUCTION:
Consistent with Section 89 subsection 3(c) of the Nigerian Communications Act 2003 (NCA 2003), the
Commission (NCC) regularly collates statistical information from Internet Service Providers (ISPs) and
produces reports on the industry statistics based on the information collected.
During the period under review, requests for submissions were forwarded to Ninety Eight (98) ISP licensees,
a total of Thirty Three (33) submissions were received for the 2018 Year End Subscriber/Network Data. The
number of submissions increased from 29 (Twenty Nine) in Year 2017 to 35 (Thirty Five) in year 2018, which
showed a 21% increase in operator compliance with the Commission’s directive.
1. The analysis was carried out based on the submissions from the following Operators:
2. NETWORK DATA:
a. Points of Presence (PoP):
As at December 2018, the number of Points of Presence was 987. This showed a significant increase of 238% over the previous year of 2017 which recorded a total of 292. Spectranet had the highest number of points of presence of 624 followed by Cobranet which had 80 in comparison with other ISPs. Entouche Networks, NetAccess and CBC EMEA had one (1) point of presence each. This was based on the submissions made in this category.
Spectranet recorded the highest figure with 73% PoP, Followed by Cobranet and Tizeti with 13% and 9% respectively, while others had 5% Point of Presence.
Figure 54: Analysis of Points of Presence (PoP)
spectranet73%
cobranet13%
Tizeti9%
others5%
No of PoPs
spectranet cobranet Tizeti others

Page | 47
Number Of Points Of Presence
Center Point Networks Ltd 12
CBC Emea 1
Cobranet Limited 80
TRAKATEL 2
Entouche Networks Nigeria Limited 1
Ekovolt Telco Limited 4
Electronic Connections Ltd 1
COSCHARIS 1
First Wave Networks 5
Futurecom Limited 1
ICSL 28
Ipnx Nigeria Limited 50
Is Internet Solutions Limited 8
Juniper Solutions Limited 8
Layer3 2
Main One 27
Netaccess 1
Netfocus 2
Sea Net Technologies Limited 0
Tizeti 76
Trefoil Networks 3
VDT Communications Limited 37
Winrock Nigria Limited 0
Priority Communication 1
Orange Business 2
Hyperia 5
Skymax 4
Spectranet 624
Zeta Web Nig. Ltd 1
TOTAL 987 Table 32: Showing Points of Operators Presence

Page | 48
b. Location of Access Provider: A significant number of the operators had service providers that were resident within Nigeria. Hyperia and Zeta-Web were the service providers with access providers outside Nigeria (Abu Dhabi and Amsterdam). The larger percentage of the service provision was derived from Lagos and Ogun States while others are from Abuja, Kaduna, Kano, Yola and South Eastern part of Nigeria. This analysis was based on the information from the operators who made submissions in this category.
LOCATION OF ACCESS PROVIDER
S/N
1 Cobranet Limited Cobranet HO, Lagos
2 Ekovolt Telco Limited Lagos
3 Infobip Lagos
4 Entouche Networks Nigeria Limited PH, Rivers
5 Coscharis Technologies Ltd Victoria Island, Lagos
6 Electronics Connection Ltd Kano
7 Hyperia Nigeria, Abu Dhabi South East, Nigeria
8 Is Internet Solutions Limited Lagos
9 Trakatel Lagos Enugu
10 Juniper Solutions Limited Lagos
11 Khal Victoria Island, Lagos
12 Layer3 Abuja
13 Netaccess Kaduna
14 Netcom Africa Lagos
15 Excelsimo Networks Ltd Lagos
16 Tizeti Lagos
17 Vdt Communications Limited Lagos & Abuja
18 Wavetek Nigeria Limited Lagos
19 Winrock Nigeria Limited Wuse 2, Abuja
20 Zeta-Web Nig. Ltd Amsterdam Lagos
21 Futurecom Lagos
22 Ipnx Nig Ltd Lagos, Ogun, Nasarawa, Port Harcourt, Abuja & Ibadan
23 Main One Lagos
24 Winrock Nig Ltd Lagos
25 Skymax Integrated Networks Yola Maiduguri Damaturu Mubi
26 Zeta-Web Nig Ltd Lagos
27 Platinum Index Data Lagos
28 Content Oasis FCT
29 Netfocus Lagos
30 VPS Lagos
31 Trefoil Lagos Table 33: Showing location of access providers

Page | 49
C. Installed Subscriber Capacity
In this category, Spectranet had the largest Installed capacity of 490,000mbps while VDT had 25,000mbps and Mobitel followed by 20,000mbps in the Installed capacity among the Operators that were analyzed. Priority Communications had the lowest installed subscriber capacity which was 2mbps
c. Installed Subscriber Capacity
1 Is Internet Solutions Limited 545 links
2 Center Point Network Ltd 14MBPS
3 Winrock Nig Ltd 494
4 Trakatel 20 Mbps/25Mbps
5 Centerpoint Technologies 1mbps
6 Cbc Emea 155mbps
7 Cobranet Limited 5Gbps
8 Coscharis Technologies Ltd 35
9 Electronic Connections Ltd 105mbps
10 Entouche Networks Nigeria Limited 250mbps
11 Ekovolt Telco Limited 400mbps
12 Futurecom Limited 155Mbps
13 ICSL 1Gbits
14 IPNX 155,000
15 Spectranet 490,000
16 Mobitel 20,000
17 Netaccess 38mbps
18 Tizeti 9,778
19 Trefoil 20MBPS
20 Skymax 1500MBPS
21 VDT Communications Limited Enterprise=10,000mbps, retail=25,000mbps
22 Priority Communication 2MBPS
23 Platinum Index Data 70MBPS
24 VPS Technologies Limited 30MBPS
25 Winrock Nigeria Limited 494mbps Table 34: Showing Installed Subscriber Capacity

Page | 50
d. Operator Bandwidth Capacity
This category recorded operator bandwidth capacity with Spectrant leading the pack with 45,800 mbps bandwidth capacity. IS Internet Limited had 8060mbps bandwidth capacity, followed by VDT recording 2760 Mbps.
NOS (d) Bandwidth Capacity
1 Coscharis Technologies Ltd 1 STM (155MBPS)
2 Center Point Network Ltd 20MBPS
3 Cbc Emea 155mbps
4 Cobranet Limited 2.7Gbps
5 Trakatel 45MBPS
6 Entouche Networks Nigeria Limited 10mb
7 Ekovolt Telco Limited 800MBPS
8 Electronic Connections Ltd 155/155 MBPS
9 First Wave Networks 20Mbps
10 Futurecom Limited 155Mbps
11 Hyperia 1344Mbps
12 ICSL 0.755G bits
13 Skymax 220MBPS
14 Ipnx Nigeria Limited 7.5Gbps
15 Is Internet Solutions Limited 8060 Mbps
16 Juniper Solutions Limited STM1
17 Main One 1.96T
18 Mobitel 45Mbps
19 Netaccess 45Mbps
20 Netfocus 4Mbps
21 Sea Net Technologies IMB/256 (CR)
22 Tizeti 2GBPS
23 Trefoil 20MBPS
24 VDT Communications Limited 2760Mbps
25 Winrock Nigeria Limited 930mbps
26 Skymax 220MBPS
27 Zeta-Web 140 Megs
28 Priority Communications Ltd 2MBPS
29 Platinum Index Data 56MBPS
30 VPS Technologies Limited 30MBPS
31 Spectranet Ltd 45,800 mbps Table 35: Distribution of Operators with Corresponding Bandwidth Capacity.

Page | 51
e. Access Speed Being Offered:
As at December 2018, the access speed offered by operators ranged from 250kbps to about 500mbps. Some operators like Layer 3, are able to grant unlimited speeds as shown in table 35 below, depending on the payment plan of the subscriber.
From the analysis of the access speed being offered by ISPs, Layer 3 has unlimited access speed while VDT ranged from 512kbps to 425mbps access speed. None of the other operators recorded access speeds of 1Gbps; the most common access speeds delivered to subscribers in the category ranged between 1mbps - 620mbps but less than 1GB. Operators like Cobranet, IS Internet Solutions, Juniper, Steam Broadcasting and Hyperia fall under this group; while Entouche networks provided access speeds in kbps. It should also be noted that some operators provided access speed ranging from kbps – Mbps such as VDT Communications, Steam Broadcasting and Netaccess. This analysis was based on the operators that made submission in this category.
Table 36: Access Speed Offered
NOS (e) Access Speed(s) Being Offered
1 CBC Emea 155mbps
2 Cobranet Limited 220Mbps
3 Entouche networks Nigeria Limited 1024kbps
4 Ekovolt Telco Limited 2mbps to 10mbps
5 Electronic Connections Ltd 10mbps and above
6 Is Internet Solutions Limited 256KBPS-2440MBPS
7 First Wave Networks 0-1mbps, 1-5mbps, 5-10mbps
8 Futurecom Limited 1Mbps, 2mbps,5mbps, 10mbps
9 Priority Communications Ltd 2MBPS
10 Trakatel 1MBPS, 2MBPS,5MBPS
11 Hyperia 1MB - 155MB
12 ICSL 1mb-2mbPS
13 Is Internet Solutions Limited 256Kbps - 620 Mbps
14 Juniper Solutions Limited 1MB-30Mbps
15 Layer 3 Unlimited
16 Mobitel 1MB-5MB
17 Netaccess 256/512/1.0mbps
18 Steam Broadcasting 256Kbps - 50Mbps
19 Tizeti 3 - 5Mbps
20 Trefoil 20MBPS
21 VDT Communications Limited 512Kbps, 425mbps
22 Wavetek 49mbps
23 Platinum Index Data 58MBPS
24 Skymax 2MBPS 3MBPS 6MBPS 10MBPS
25 VPS Technologies Limited 30MBPS

Page | 52
SUBSCRIBER & SERVICES DATA:
a. Total Wired Internet Subscriptions In December 2018, a comparative analysis of the submissions made in this category showed a huge decrease; in 2017, the total wired internet subscriptions submitted was 407 while the total wired
Table 36: Access Speed(s) Being Offered
Submitted in 2018 was 151 showing a decrease of 62% from 2017 to 2018. Winrock Nigeria Limited recorded the highest figure with 67 which accounted for 44% of wired internet in 2018, followed by CBC Emea with 45 subscriptions in total, while VPS recorded the lowest number of wired internet subscriptions with four (4) subscriptions
NOS (a) Number of Users Per Fixed [Wired] Internet Subscriptions
1 2017 2018
2 Vodacom Business Africa Nigeria Limited 164
3 Electronic Connections Ltd 90
4 Ekovolt Telco Limited 30
5 CBC Emea 45
6 Layer 3 48
7 Hotspot Network 10
8 Hyperia 4 4
9 Platinum Index Data 33
10 VPS Technologies limited 2 2
11 Winrock Nigeria Limited 61 67
Total 407 151 Table 37: Number of users per fixed [Wired] Subscriptions
Average Number of Users per Fixed Internet Subscriptions (Broadband)
Fixed broadband subscriptions increased from 196,826 subscribers in December, 2017 to 197,839 subscribers in December 2018, indicating an increase of 0.5%. Spectranet Ltd constituted 99% of the 2018 figure, the highest of all the Operators in this category. Trefoil and Netfocus recorded the least with 1 and 2 subscriptions respectively, contributing 0.16% and 0.33% respectively to the total.
NO (b) Average Number of Users Per Fixed Internet Subscriptions [Broadband]
1 2017 2018
2 IpNX Nigeria Limited 5
3 Cobranet limited 250 99
4 CBC Emea 28 45
5 Deston 3
6 Ekovolt Telco Limited 36
7 E-gate 4
8 First Wave Networks 1

Page | 53
9 Gulf Technologies Networks 2
10 Hotspot Network 9
11 Netfocus 1 2
12 GTS 30
13 Cyberspace Limited 754
14 Layer 3 48
15 Smartcity Broadband 105
16 Winrock 67
17 ICSL 330
18 Trefoil 1
19 Platinum Index Data 33
20 Wavetek 3
21 Spectranet Limited 195548 1972248249
22 Hyperia 2 10
Total 196826 197839
Table 38: Average number of users per fixed Broadband Internet subscriptions
b. DSL Internet Subscriptions
In this category, only KHAL communications made submissions with 69 DSL internet subscriptions in 2017. There were no submissions in 2018 to make comparison with.
Table 38: Showing the DSL internet subscription for 2018
c. Fiber to Home/Building
The analysis of this category shows that Fiber to Home subscriptions recorded 252 subscribers in December 2018, an increase of 24% from 203 in December 2017.
In December 2018, Cobranet Nigeria Limited recorded a total of 99 which accounted for 39% of the subscriptions in this category while Platinum Index data had the least subscription of 8 accounting for 3% of the subscriptions in this category.
NOS 4: Fibre to the Home/Building
1 2017 2018
2 KHAL Comms 18
3 Hotspot Networks 4
4 Cobranet Limited 100 99
5 Winrock 45 45
6 Layer 3 36
7 Winrock 45
8 Platinum Index Data 8
9 Content Oasis 55
Total 203 252
Table 39: Showing the Fibre to the Home/Building
NOS DSL Internet Subscriptions
1 2017 2018
2 KHAL 69
Total 69

Page | 54
d. Total Wireless Broadband Subscriptions
Total Wireless broadband subscriptions increased from 195,915 connections in December, 2017 to 199,232 in December 2018. In this category, Spectranet had the highest number with 197,249. An analysis of this category shows that the Total Wireless Broadband subscriptions increased by 0.6%.
NOS 6: Total Wireless Broadband Subscriptions
1 2017 2018
2 Electronic Connections 105
3 Cobranet 1,845
4 Netfocus 2
5 Center Point Networks Ltd 12
6 Trakatel 19
7 Spectranet Nig Ltd 195,915 197,249
8 Swiftalk
9 Hyperia
Total 195,915 199,232
Table 40: Showing total wireless broadband subscriptions
e. Average Number of Users per fixed Wireless Broadband Subscriptions
In December 2017, the average number of users per fixed Wireless broadband subscriptions was 2,159, while that for December, 2018 was 6,874. There was a 218% increase in the average number of users per fixed wireless broadband subscriptions from December, 2017 to December, 2018.
NO (a) Average Number of Users per Fixed Wireless Broadband Subscriptions
1 2017 2018
2 Entouche Networks 12 10
3 IDS Africa Limited 5
5 IS Internet Solutions Limited 5
6 Juniper Solutions Limited 95 94
7 NETCOM AFRICA 210
8 Cobranet 1,683
9 Interra Networks 4
10 Steam Broadcasting 15
11 Winrock 45 22
12 ICSL 40
13 Hyperia 55
14 Winrock Nig Ltd 22
15 Tizeti 6,475
16 Platinum Index Data 10
17 Ekovolt 12
18 Skymax 150
19 Futurecom Ltd 36 37
20 Netfocus 2 2
21 Wavetek 30
Total 2,159 6,874
Table 41: Showing Average Number of Users per Fixed Wireless Broadband Subscriptions

Page | 55
f. Total Number of Terrestrial Subscriptions [Fixed & Fixed Wireless]
During the period under review, the total number of terrestrial subscriptions reduced by 32% considerably from 4,547 as at December, 2017 to 3065 in December 2018. A comparative analysis of the operators that made submissions showed that only Seven (7) operators made input in this group, whereas in 2017, there were Nine (9) submissions made by operators.
NOS Total Number of Terrestial Subscriptions (Fixed and Fixed Wireless)
1 2017 2018
2 KHAL Comms 108
3 IDS Africa 5
4 IS Internet Solutions Limited 293 457
5 Juniper Solutions Limited 95 94
6 Netcom Africa 210
7 Cobranet 1783 1944
8 ICSL 330
9 Trefoil 1
10 Skymax 220
11 Trakatel 20 19
12 Steam Broadcasting 362
13 Vodacom Business Africa Nigeria Limited 1671
TOTAL 4547 3065
Table 42: Total Number of Terrestial Subscriptions (Fixed and Fixed Wireless)
g. Total Number of Satellite Subscriptions
Total number of Satellite subscriptions also reduced over the period from 3,106 in December, 2017 to 1,602 in 2018, indicating a decrease of 48%, this analysis was based on the submissions by seven (7) operators in this category.
NOS Total number of Satellite Internet Subscriptions
1 2017 2018
2 Content Oasis 3
3 Juniper Solutions Limited 1
4 Skymax Integrated Networks Ltd 10
5 Trefoil 1
6 IS Internet Solutions Limited 130 88
7 Cyberspace Limited
8 Sea Net Technologies Limited
9 Trefoil Networks
10 Steam Broadcasting 781
11 Hyperia 1509 1500
12 Vodacom Business Africa Nigeria Limited 109
13 Zeba-web 295
14 Zinox 281
Total 3106 1602
Table 43: Indicating the total Number of Internet subscription in 2018

Page | 56
h. Number of Internet Users per Region
In December, 2018, the total number of internet users in the six geopolitical zones for ISP’s was 211636, a 0.08% decrease from the 211,820 recorded as at December, 2017. The analysis of the breakdown is as follows:
a. South West had the highest number of users in 2017, with 161,056 or 76% of the total subscriptions.
b. South-South had 5% with 11,025 users; c. North West had 0.3% with 685 users; d. North-East had 0.29% with 630 users; e. North Central had 37,757 users which indicates 18% of the total number of users, f. South East had 0.22%, which was the least of all the regions with 483 users. A comparative
analysis of the users per region showed that, there were no improvement per region in the internet users and also, most operators did not respond in this category, which accounted for the overall decrease in comparison to 2017 internet users per region.
i. Number of Users by Internet Speed
In December 2018, out of a total of 226,349 users, 326 users fell in the 0-2Mbps category, representing 0.14% of the total user base; 8,826 users subscribed to speeds between 256Kbps-2Mbps, representing 3.9% of the total user base; 10,850 users between 2–10Mbps, representing 4.7% of the total user base; & 206,347 subscriptions in the 10mbps & above category, which makes 91% of the total.
Figure 55: Speed of Internet as delivered to consumers
0 - 1 mbps 1 - 5mbps 5 - 10mbps 10 - above
Series1 2.60% 4.35% 0.67% 92.45%
Number of internet users by speed
Series1

Page | 57
j. Subscriber Matrix (Internet Use) As at December, 2018, the following was recorded for internet use: Government- 1.14%; NGO- 0.16%; Multinational- 0.06%; Schools & Research Institutions- 0.19%; Residential/Individual –89.94%; Private Business – 3.132%; Cybercafés – 0.139%; Hospitals & Medical Research – 0.06%; Public Libraries – 0.0001%; Military – 0.0018%; Others – 5.13%.
Figure 56: Subscriber Matrix that use the Internet.
G. FINANCIAL DATA:
a. Revenue
As at December 2018, a total Revenue of N43, 829,309,568. (Forty Three Billion, Eight Hundred
and Twenty Nine Million, Three-Hundred and Nine Thousand, Five hundred and Sixty-Eight
Naira Only) was generated, 23.3% increase from the N35, 525,139,842.00 (Thirty Five Billion,
Five Hundred and Twenty Five Million, One-Hundred and Thirty Nine Thousand, Eight hundred
and Forty-Two Naira that was generated in 2017. Spectranet, Main One, Infobip and Tizeti had
24%, 22%, 21% and 9% respectively of the total revenue, making them the biggest Revenue
generating ISP’s in 2018.
Conversely, Entouche Networks had the least revenue in 2018, with N3, 905,000 (Three Million
Nine Hundred and Five Thousand Naira Only) only, or 0.005% of the total revenue generated
by ISP’s in 2018.
1.20% 0.17%0.05%
0.35%
89.20%
1.74%
0.09% 0.06%0.01%
0.02%
7.12%
SUBSCRIBERS MATRIX
Government NGOs Multinationals Schools & Research
Residential Private Business Cybercafes Hospitals
Public Libraries Military Others

Page | 58
b. Operating Cost
The value of Operating Cost increased from =N= 36,861,669,324.38 (Thirty Six Billion, Eight Hundred and Sixty One Million, Six and sixty Nine Thousand, Three Hundred and Twenty Four Naira Thirty Eight Kobo Only) in 2018 to =N=25,271,669,324.38 (Twenty Five Billion Two Hundred & Seventy One Million Six Hundred and Sixty Nine Thousand Three Hundred & Twenty Four Naira Thirty Eight Kobo Only. This indicates a decrease of 4511%. This is shown in Fig 5 below:
Figure 57: Operating Cost by ISP’s 2018
From the analysis of the submissions made, Spectranet recorded the highest operating cost in 2018, with
N11,590,000,000.00 while wavetek and Mainone were second and third with N10,000,000,000 and
N2,162,740,533.08 respectively. The three operators together make up 64% of the total operating cost for the
2018 financial year. The lowest in Operating Costs for the 2018 financial year came from IPNX Limited with N2,
919,000, making 0.007% of the total figure.
c. Staff Profile: As at December 2018, the number of staff of ISP operators increased to 3136 from 2,084 recorded in 2017. This showed a significant increase of 72% in the work force. There was a total of 2211 male and 683 female staff. A further breakdown reveals that 2,894 of the work force are Nigerians, while expatriates were 242.

Page | 59
Figure 58: Staff Profile as at December, 2018
Figure 57: Staff Profile as at December, 2018
0
50
100
150
200
250
300
350
400
NUMBER OF STAFF (2018)
Nigerian Male
Nigerian Female
Expatriate Male
Expatriate Female

Page | 60
Chapter Six
SUBSCRIBER / NETWORK DATA ANALYSIS – OTHER OPERATORS
Network Data: The Commission received a total of Twenty (20) submissions from Licensees of the Commission for the 2018 Year End Subscriber/Network Data for Operators Other than Mobile, Fixed Telephony and Internet Service Providers (ISP). These “Other Operators” provided ancillary telecom services such as Value Added Services (VAS), Collocation and Infrastructure Service providers, Long Distance Service Operators, Automated Vehicle Tracking services Interconnect Exchange and Metropolitan Fibre License Operators.
The number of submissions received decreased from Forty Three (43) in Year 2017 to twenty (20) as at Year 2018 signifying a 53% decrease over the number of submissions received. A breakdown of the Licensees and the type of services offered is presented below:
S/N Operator Type of Service
1. Interconnect Clearing House Nigeria Limited Interconnect, Co-location, MNP
2. IHS NIG LIMITED
Collocation, Managed Services and
Deployment
3. INT Towers Limited
Collocation, Managed Services and
Deployment
4. IHS TOWERS NIG LIMITED Infrastructure Service Provider
5. Medallion Communications Ltd Interconnect Clearing House
6. Solid Interconnectivity Services
Limited Interconnectivity Services
7. TxTlight Power Solutions Limited Value Added Service
8. ALPHA TECHNOLOGIES LIMITED Special Numbering Service
9. COLOPLUS WORLDWIDE
SERVICES LIMITED Collocation Services
10. NZMOBILE NIGERIA LIMITED Value Added Service
11. WORLDWIDE INDUSTRIAL
VENTURES LIMITED
Colocation and Infrastructure Sharing
Service.
12 ISOX Technologies Ltd Value Added Service

Page | 61
13 KIRUSA NIGERIA LIMITED Value Added Service
14 Nok360 Global Limited Value Added Service
15 Ip Int. Solution Services Limited Value Added Service
16 Genieng Communications Ltd Value Added Service
17 Phase 3 Telecom Limited National Long Distance
18 ATC Nigeria Wireless
Infrastructure Limited
Infrastructure Sharing & Collocation
Services
19 Neptune Global Services Limited Auto Vehicle Tracking Service
20 Vodacom Business Africa Nigeria
Limited National Driving License
Table 44: List of responsive Licensees and License category
A breakdown of the responses in terms of service categories indicate that the Value Added Service (VAS) license category, Automated Vehicle Tracking Services (AVTS) and Collocation and Infrastructure service categories top the list of responsive licensees received in this Category. VAS licensees account for 35% of responses while AVTS licenses account for 5% while colocation & Infrastructure licensees account for 30% and other licensees account for 30%.This distribution is shown in the pie chart below
Figure 58: Distribution of Licensing Categories of Responsive Operators
35%
5%30%
30%
LICENSING CATEGORIES OF RESPONSIVE OPERATORS
VAS OPERATORS
AVTS OPERATORS
COLLOCATION&INFRASTRUCTURE SHARINGOPERATORS
OTHER OPERATORS

Page | 62
These Operators provide telecommunications operations across the thirty-six (36) states and in at least each state of the geopolitical zones of the country.
Figure 59: Count of Coverage Locations by Number of Licensees.
Infrastructure Deployment:
i. Long Distance Cable Network (km); As at December, 2018 the total Long Distance cable deployed by Operators in this category was 11,395km. Interconnect Clearing House Ltd in the Country recorded 3,515km as at the end of year 2018. Phase 3 Telecom reported a long distance outlay of 6,000km in year 2018 while Broadbased Communications Ltd reported 1,375km build out as recorded in Year 2017.
ii. Fibre Optic Network (km); As at December, 2018 the total Fibre Optic Network deployed (leased and owned) by Other Operators was Twenty Three thousand Eight Hundred and Sixty point 85Kilometers of Fibre (23,860.85)km as against Twenty Three thousand Nine hundred and sixty seven point seventy five kilometers of fiber (23,967.75km) recorded in Year 2017. This is a 0.45% decrease of the fibre optic outlay of Year 2017. A breakdown of the composition of the fibre deployment indicates that 13,344 km was leased by Vodacom Business Africa Ltd, Broadbased Communications Ltd deployed 2,020.45km of fibre, Backbone Connectivity Network deployed 222km while Defcom Technologies Ltd, Interconnect Clearing House Limited, Alpha Technologies Ltd deployed and Txtlight Power Solutions Limited deployed 30km, 28km, 7km and 0.5km respectively. Breeze Micro ETG Integrated Services limited, Medallion Communications Ltd and solid Interconnectivity Services Limited also recorded 50km, 39km, 26km and 25km of fibre respectively. This is as shown in the figure below:
7
4
1 1
7
1 STATE 2 STATES 10 STATES 34 STATES 36 STATES & FCT
COUNT OF COVERAGE LOCATIONS BY NUMBER OF LICENSEES

Page | 63
Figure 60: Fibre Deployment by Other Operators (report inclusive from Year 2016-2018 submissions)
iii. Number of Trunks in use (E1):
The total number of E1 in use by Operators as at the end of Year 2018 Two thousand five Hundred and Fifty Two E1 (2,552) as against Six Thousand Seven Hundred and Fourteen (6,714) E1`s in Year 2017. Interconnect Clearing deployed 1,323 E1’s, Alpha Technologies deployed 60 E1, while solid Interconnectivity services deployed 902 E1.Geneing Communications Ltd deployed 88 E1 while Medallion Communications Ltd and Kirusa Nigeria Limited 88 and 2 E1`s respectively.
This is as shown in the figure below:
Figure 61: No. of Trunks in use (E1)
56%
4%
29%
9%2%
Operator Fibre Cable Outlay leased and Owned-2018
Vodacom
I.HS Towers
Main One Cable Coy
Broadbased Communication
OTHERS
0%2%4% 7%
35%52%
Status of E1 Deployment - Year 2018
Kirusa Nigeria Limited
Alpha Technologies Limited
Genieng Communications Ltd
Medallion Communications Ltd
Solid Interconnectivity ServicesLtd
Interconnect ClearinghouseNigeria Limited
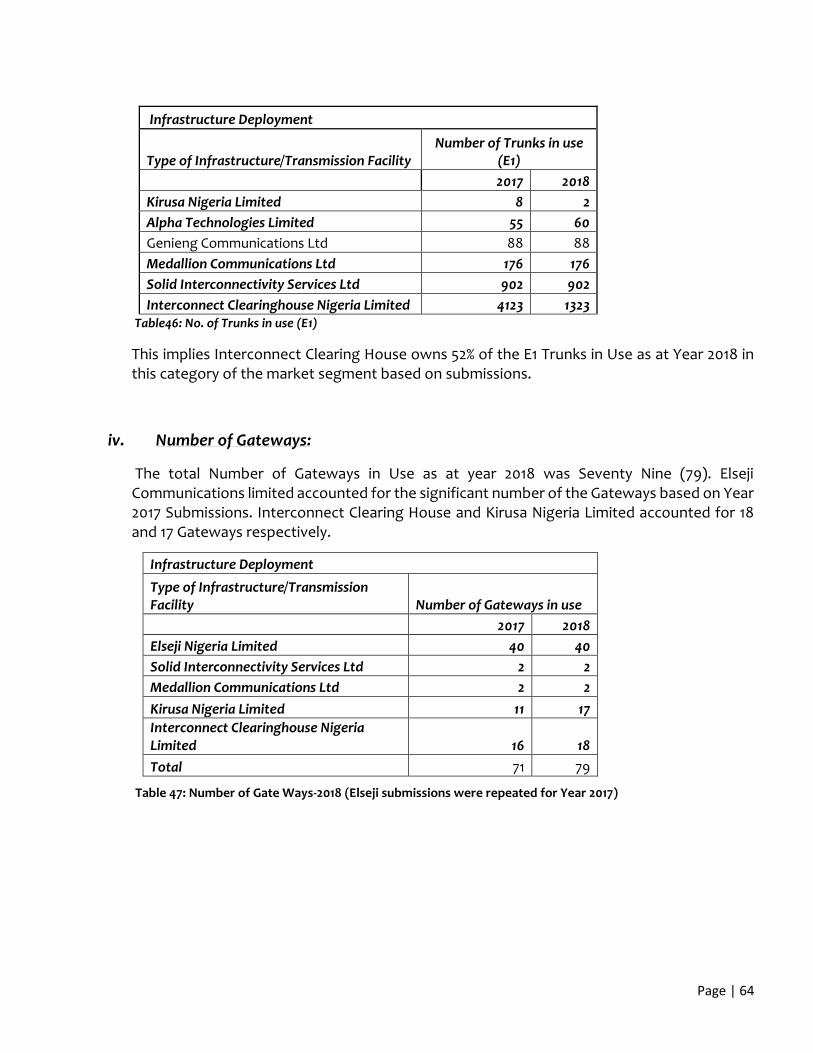
Page | 64
Table46: No. of Trunks in use (E1)
This implies Interconnect Clearing House owns 52% of the E1 Trunks in Use as at Year 2018 in this category of the market segment based on submissions.
iv. Number of Gateways:
The total Number of Gateways in Use as at year 2018 was Seventy Nine (79). Elseji Communications limited accounted for the significant number of the Gateways based on Year 2017 Submissions. Interconnect Clearing House and Kirusa Nigeria Limited accounted for 18 and 17 Gateways respectively.
Table 47: Number of Gate Ways-2018 (Elseji submissions were repeated for Year 2017)
Infrastructure Deployment
Type of Infrastructure/Transmission Facility Number of Trunks in use
(E1)
2017 2018
Kirusa Nigeria Limited 8 2
Alpha Technologies Limited 55 60
Genieng Communications Ltd 88 88
Medallion Communications Ltd 176 176
Solid Interconnectivity Services Ltd 902 902
Interconnect Clearinghouse Nigeria Limited 4123 1323
Infrastructure Deployment
Type of Infrastructure/Transmission Facility Number of Gateways in use
2017 2018
Elseji Nigeria Limited 40 40
Solid Interconnectivity Services Ltd 2 2
Medallion Communications Ltd 2 2
Kirusa Nigeria Limited 11 17
Interconnect Clearinghouse Nigeria Limited 16 18
Total 71 79

Page | 65
Figure 62; Number of Gateways deployed-2018
4b. Location of Mast and Towers:
There was a total Twenty One Thousand Four Hundred and Seventy One (21,471) BTS sites as at Year 2018 against the sum of Twenty Two Thousand Two Hundred and forty-five BTS sites reported (22,245) in year 2017.
This indicates a slight decrease of 3.5% in the number of base stations reported in Year 2017 compared to Year 2018. INT Towers Limited, IHS Nig Limited, IHS Towers Nig Limited reported decreased counts of towers in Year 2018 compared to Year 2017 while American Towers reported an increase in the count of Towers in yaer 2018 aggsinst 2017 as shown in the table below.
There were Eleven responsive (11) responsive Licensees in Year 2018 as against Nine (9) in year 2017 with two (2) licensees were repeated from Year 2016. These include IHS Nigeria Limited, IHS Towers Nigeria Limited, INT Towers Nigeria Limited, Communication Towers Nigeria, Vodacom Business Solution, Communication Towers, Colopus Worlwide and Tryphena &Tryphosa Limited. Specific Tools and Techniques Limited and Hot Spot Towers Asset was repeated from Year 2016.
Please find below a breakdown of the BTS sites per operator:
S/N Operator No. of BTS Site
(Year 2017)
No. of BTS Site
(Year 2018)
1. INT Towers Limited 10,098 9,772
2. IHS Nigeria Limted 5,975 5,858
3. IHS Towers Nig Limited 1,213 874
4. American Towers 4,755 4,761
51%
3%2%
21%
23%
Number of Gateways Deployed -2018
Elseji Nigeria Limited
Solid InterconnectivityServices Ltd
Medallion CommunicationsLtd
Kirusa Nigeria Limited
Interconnect ClearinghouseNigeria Limited

Page | 66
5. Hot Spot Tower Asset 142 142
6. Communication Towers Nigeria 33 33
7. Tryphena &Tryphosa Nig Limited 8 8
8. Worldwide Industrial Ventures Limited
8 8
9. Vodacom Business Africa 6 6
10. Coloplus Wordwide Services Limited 6 6
11. Specific Tools and Techniques Ltd 1 1
12 Medallion Communications -
Total 22,245 21,471
Table 47: Breakdown of Base Transmitting Station (BTS) (Specific Tools and Tech. and Hot Spot submitted Year2016 data)
Figure 63: Graphical representation of BTS Market Share (Submissions from Year 2017-2018)
The figure above illustrates that the IHS related consortium owns approximately 78% of the BTS sites and have an apparent dominance showing in this market segment.
27%
1%
46%
22%
4%0%
No of BTS Sites per Operator Market Share-2018
I.HS
Hot Sport Networks
INT Towers
ATC
I.HS Towers Limited
Others

Page | 67
Figure 64: No of BTS Site Deployment across select Operators. (Submissions from Year 2018)
Figure 65: State by State Graphical Distribution of BTS in Nigeria (Other Operators)
Figure 66: BTS Distribution by Geopolitical Zones
I.HS^ No of BTS Sites^ 5,858
No of BTS Sites^ 142
No of BTS Sites^ 9,772
No of BTS Sites^ 4761
No of BTS Sites^ 874No of BTS Sites^ 64
NO OF BTS SITES
No of BTS Sites Deployed by Operators
I.HS Hot Sport Networks INT Towers ATC I.HS Towers Limited Others
AB
IA
AB
UJA
AD
AM
AW
A
AN
AM
BR
A
BA
UC
HI
BA
YELS
A
BEN
UE
BO
RN
O
CR
OSS
RIV
ER
DEL
TA
EBO
NYI
EDO
EKIT
I
ENU
GU
GO
MB
E
IMO
JIG
AW
A
KA
DU
NA
KA
NO
KA
TSIN
A
KEB
BI
KO
GI
KW
AR
A
LAG
OS
NA
SAR
AW
A
NIG
ER
OG
UN
ON
DO
OSU
N
OYO
PLA
TEA
U
RIV
ERS
SOK
OTO
TAR
AB
A
UYO
YOB
E
ZAM
FAR
A
BTS Distribution Acrosss the States
13%
7%
17%
30%
14%
19%
BTS Distribution by Geopolitical Zones-2018
North West
North East
North Central
South West
South East
South South

Page | 68
The South West geopolitical zone has the highest concentration of BTS sites at 30% followed by the South-South and North Central Zones at 19% and 17 % respectively. The North East has the least number of BTS sites at 6%. The situation in the North East is attributable to the activities of insurgency in that geopolitical area that destroyed some BTS sites. Though the situation in the North East has improved build out apparently has been understandably slow.
Subscriber Data: The Subscriber Data for Operators in this market segment indicate varying Subscriber Matrix due to the different Service offerings and licenses held by each of the Operator. Hence, the basis of analysis is unique for each licensed Operator. Financial Data: The total revenue generated by Operators other than GSM, Fixed or ISP Operators in Year 2018 was
Four Hundred and Twelve Billion Seven Hundred and Sixty Nine Million Five Hundred and Eighty Five
Thousand Nine Hundred and Eighty Six Naira (#412,769,585,986) as against Three Hundred and Forty Nine
Billion Two Hundred and Twenty Million One hundred and Forty Seven Thousand One Hundred and Eighty
Three Naira Only (N349, 220,147,183) in Year 2017. This indicates an 18.2% increase in the revenue recorded in
Year 2018 3.2% percentage points over the 15% increase of revenue of year 2016 in Year 2017.
Revenue: As at Dec 2018
2017 2018
Txtlight power solutions limited 1,168,035,774 2,983,350,056
Worldwide Industrial ventures Limited 541,872,902 267,329,984
NZMobile Nigeria Limited 678,410,000 498,860,000
Coloplus World Services Limited 16,502,966
Alpha Technologies limited 196,148,465 227,270,250
Medallion Communication Limited 2,000,000,000 328,600,000
I.HS Towers Nigeria Limited 22,892,000,000 22,255,000,000
INT Towers Limited 132,139,000,000 166,606,000,000
I.HS Nigeria Limited 99,375,000,000 120,574,000,000
Interconnect Clearing House Limited 799,730,000 564,950,000
NOK360 Global Limited 65,424,167 13,370,117
Solid Interconnectivity Services Limited 18,248,244 16,797,664
Phase 3 Telecoms Limited 2,246,000,000 2,470,600,000
Ip Intergrated Solution Services Limited 3,461,020,271 4,190,525,070
Genieng Communications Limited 13,021,000 13,021,000
Kirusa Nigeria Limited 531,578,394 373,856,844
Isox Technologies Limited 655,000 755,000
ATC Nigeria Wireless 71,778,000,000 79,844,000,000
Neptune Global Services Limited 14,500,000 15,300,000
Vodacom Business Africa Limited 11,285,000,000 11,526,000,000
TOTAL 349,220,147,183 412,769,585,986
Table 48: Revenue Profile of Others` Operators

Page | 69
Figure 67: Revenue Profile of Others` Category of Operators for Years 2017-2018
Similarly, the total operating cost incurred by the Operators as at the end of December, 2018 was
Two Hundred and Fifty Eight Billion and Two Million Six hundred and Five thousand Eight Hundred
and Twenty Three Naira (#258,002,605,823) only as against Two Hundred and Thirty Seven Billion Three
Hundred and Sixty Eight Million Eight Hundred and Thirty Four Thousand Three Hundred and Fifty Eight Naira
(#237,368,834,358) only. This indicates an increase of 8.7% increase in the Operating cost of licensees
recorded between Years 2017 and 2018.This increase in Operating Cost may be a consequence of the
exchange rate effects in the industry.
As at Dec 2018
2017 2018
Coloplus Worldwide services Limited 14,694,694 -
NZMobile Nigeria Limited 605,920,000 437,420,000
Phase 3 Telecom 58,829,000,000 64,711,440,000
Txtlight power solutions limited 633,111,755 895,447,404
I.HS Towers Nigeria Limited 10,834,000,000 10,572,000,000
Worldwide Industrial Ventures Limited 379,561,701 167,555,499
Alpha Technologies Limited 112,346,682 203,145,845
Solidinterconnectivity Services Limited 15,532,713 69,974,495
Genieng Communications Ltd 178,535,000 239,872,000
Ip Integrated Solutions Services Ltd 2,938,983,037 3,255,009,639
Nzmobile Nigeria Limited 605,920,000 437,420,000
Layer3 Limited 1,098,664,174 977,882,091
Kirusa Nigeria Limited 419,900,000 453,630,199
Medallion Communications Limited 1,487,000,000 245,910,000
INT Towers Limited 66,113,000,000 78,707,000,000
050,000,000,000
100,000,000,000150,000,000,000200,000,000,000250,000,000,000300,000,000,000350,000,000,000400,000,000,000450,000,000,000
TXTL
IGH
T P
OW
ER …
WO
RLD
WID
E …
NZM
OB
ILE …
CO
LOP
LUS …
ALP
HA
…
MED
ALL
ION
…
I.H
S TO
WER
S …
INT
TOW
ERS …
I.H
S N
IGER
IA …
INTE
RC
ON
NEC
T …
NO
K3
60
GLO
BA
L …
SOLI
D …
PH
ASE
3 …
IP IN
TER
GR
ATE
D …
GEN
IEN
G …
KIR
USA
NIG
ERIA
…
ISO
X …
ATC
NIG
ERIA
…
NEP
TUN
E G
LOB
AL …
VO
DA
CO
M …
TOTA
L
Revenue Profile of Other Operators-2018
2017 2018

Page | 70
I.HS Nigeria Limited 35,405,000,000 42,805,000,000
Inteconnect Clearing House Limited 597,650,000 674,010,000
NOK360 Global Limited 68,081,566 54,729,012
IP INTERGRATED SOLUTION SERVICES LIMITED 2,938,983,037 3,255,009,639
Isox Technologies Limited 4,900,000 5,700,000
ATC Nigeria Wireless 41,791,000,000 38,859,000,000
Neptune Global Services Limited 7,050,000 7,450,000
Vodacom Business Africa Limited 12,290,000,000 10,968,000,000
TOTAL 237,368,834,358 258,002,605,823 Table 49: Operating Cost Profile of the Operators (Others)
Figure 68: Operating Cost Profile of Others` Category of Operators for Years 2017 & 2018
0
50,000,000,000
100,000,000,000
150,000,000,000
200,000,000,000
250,000,000,000
300,000,000,000
Operating Cost Profile of Other Operators-2018
2017 2018

Page | 71
Investments for Year 2018
Figure 69: Investment figures Operators
TABLE Investments (=N= Million) As at Dec 2018
2017 2018
I.HS Towers Nigeria Limited 1,442,000,000
INT Towers Limited 57,520,000,000
Interconnect Clearing House Limited 165,218,767 27,592,740
Ip Intergrated Solution Services Limited 68,163,000 62,558,372
Genieng Communications Limited
Isox Technologies Limited
ATC Nigeria Wireless 26,579,000,000 31,098,000,000
Vodacom Business Africa 417,000,000 966,000,000
TOTAL 84,749,381,767 32,154,151,112 Table 50: Investments of Operators 2017-2018
The Investment figure of Operators decreased from N84.7 Billion to N32.1 Billion in Year 2018. This is
a decrease of 62.1% of the investment figures recorded in Year 2017. The reason may be attributed to
the lack of response from Operators like (INT Towers Limited) for 2018 figures as well as low level of
responses from other Operators in the same market segment.
010,000,000,00020,000,000,00030,000,000,00040,000,000,00050,000,000,00060,000,000,00070,000,000,00080,000,000,00090,000,000,000
57,520,000,000
165,218,767
68,163,000
26,579,000,000
417,000,000
84,749,381,767
1,442,000,000 27,592,74062,558,372
31,098,000,000
966,000,000
32,154,151,112Investments of Other Operators-2018
2017 2018

Page | 72
Staff Profile:
As at December, 2018 the total staff strength of Others` Operator Category stood at Two Thousand Three Hundred and Eighty-Eight (2,388) staff. The total staff strength of each operator as at the end of Year 2018 is as shown on the last column.
Table 51: The distribution of staff per Operator
This Staff distribution consist of 1,935 Males and 453 Females. This implies that this category of Operators is still male dominated with 81% of staff are male while 19% are female.
Total
Male Female Male Female
Nok360 Global Limited 8 1 0 0 9
Genieng Communications Ltd 21 9 0 0 30
Ip Integrated Solutions Services Ltd 3 0 2 0 5
Phase3 Telecom Limited 187 10 1 198
Interconnect Clearing House 20 12 0 0 32
IHS Nigeria Limited 232 61 41 2 336
INT Towers Limited 643 126 769
IHS Towers Nigeria Limited 107 17 0 0 124
Medallion Communication Limited 20 12 1 0 33
Solid Interconnectivity Services Limited 6 5 0 0 11
Alpha Technologies Limited 25 5 0 0 30
Coloplus Wordwide Service Limited 10 2 0 0 12
Nzmobile Nigeria Limited 2 0 0 0 2
Worldwide Industry Ventures Ltd 16 1 0 0 17
Txtlight Power Solutions Limited 215 77 1 0 293
Layer3 Limited 50 16 0 0 66
Kirusa Nigeria Limited 4 2 0 0 6
Isox Technologies Limited 4 3 0 0 7
ATC Nigeria Wireless 167 33 6 1 207
Neptune Global Services limited 6 1 7
Vodacom Business Africa 136 57 1 194
TOTAL 1,882 450 53 3 2,388
Nigerian Expatriate
STAFF PROFILE AND COMPENSATION
TABLE : Number of Staff (2018)

Page | 73
Figure 70: Gender Distribution of Other Operators ‘Staff
Further Analysis shows the breakdown of Nigerian and Expatriate Staff of “Other Operators” category.
There are also a total of Two Thousand Three Hundred and Thirty Two (2,332) Nigerian Staff as against Sixty Three (56) expatriates. This implies that the 98% of staff are Nigerians while 2% are expatriates. This is the same percentage distribution with the comparison of last year.
Figure 71: Expatriate Distribution of Operator Staff
81%
19%
Percentage of Male vs Female -2018
Male
Female
98%
2%
Nigerian Staff Vs Expatriate -2018
Nigerian Staff
Expatriate Staff