©2018 Riddish Sudhir Morde ALL RIGHTS RESERVED
70
©2018 Riddish Sudhir Morde ALL RIGHTS RESERVED
Transcript of ©2018 Riddish Sudhir Morde ALL RIGHTS RESERVED

©2018
Riddish Sudhir Morde
ALL RIGHTS RESERVED

MICRO-3D PRINTING OF BIO-INSPIRED MICRONEEDLE WITH ENHANCED
ADHESION CAPABILITIES
By
RIDDISH SUDHIR MORDE
A thesis submitted to the
School of Graduate Studies
Rutgers, The State University of New Jersey
In partial fulfillment of the requirements
For the degree of
Master of Science
Graduate Program in Mechanical and Aerospace Engineering
Written under the direction of
Howon Lee
And approved by
_____________________________________
_____________________________________
_____________________________________
New Brunswick, New Jersey
January 2018

ii
ABSTRACT OF THE THESIS
Micro-3D Printing of Bio-inspired Microneedle with Enhanced Adhesion
Capabilities
by Riddish Sudhir Morde
Thesis Director:
Howon Lee
Microneedles (MNs) are an array of micron-sized needles that have been used as
an excellent alternative to invasive and painful hypodermic needles. Due to their micro-
scale structure, MNs can overcome the skin barrier without causing significant pain to the
patient. Micro-Electro-Mechanical system (MEMS) fabrication techniques have led to the
promising applications of MNs in biomedical field such as drug delivery and transdermal
bio sensing. However, current fabrication techniques for MNs are complicated and time
consuming. Another challenge is to achieve significant tissue adhesion over long periods.
Inspired by porcupine quill and honeybee stinger where intricate side profiles promote
adhesion to the skin tissue, here we present a micro 3D printed bio-inspired microneedle
with backward-facing curved fins. With this side-profile on the MN, the adhesion force is
significantly enhanced due to mechanical interlocking of the fins to the skin tissue. To
create backward-facing fins on the side of microneedle, we utilize photo-crosslinking
density gradient of the polymer to induce curvature in the fins that are horizontally attached

iii
to MNs. When such a microneedle is inserted into the skin, the curved fins extruded from
the microneedle surface create mechanical interlocking with the skin tissues, resulting in
enhanced adhesion of the needles. Geometrical parameters of fins including number of
fins, pitch and length is studied to determine optimal configuration to maximize the
adhesion performance of the microneedle. Piercing/pull-out test showed adhesion force of
single MN per unit area of 2.66 ± 0.33 N/cm2 showing ~20 times higher adhesion force to
the tissue compared to microneedles without fins. This unique design of bio-inspired
microneedle with enhanced adhesion capability has potential to be used for various
transdermal applications such as transdermal drug delivery and transdermal bio-sensing.

iv
ACKNOWLEDGEMENTS
I would like to thank my advisor, Dr. Howon Lee, for his continuous support and guidance
during the entirety of my research. His support and direction has helped me immensely in
the research process.
I would also like to thank the rest of my thesis committee, Dr. Jerry Shan and Dr.
Hao Lin for their willingness to join my thesis committee and the time that they took out
of their schedules to review my thesis.
I would also like to thank my lab mates. Chen Yang, Daehoon Han and Manish. It
has been great to work with and learn a lot from them. In addition, many thanks to all the
undergraduate students working in our lab who have made my time in the lab a fun
experience.
Most importantly, I would like to thank my parents for their constant support
throughout my college education. They have been amazingly supportive throughout this
whole process, and I would not be able to have completed my college education without
their help.

v
Table of Contents
Abstract ii
Acknowledgements iv
1 Introduction 01
1.1 Background 01
1.2 Microneedle: Advantages, Classification and Applications 02
1.3 Microneedle: Current Challenges 08
1.4 Approach 10
2 Design and Fabrication 14
2.1 Microneedle Design 14
2.2 Fabrication
2.2.1 Micro-3D Printing System
15
15
2.2.2 Microneedle Fabrication 17
2.2.3 Curing Depth and Bending Curvature Study 21
3 Microneedle with Enhanced Adhesion Capability 26
3.1 Skin Anatomy and Skin Models 26
3.2 Mechanical Testing
3.2.1 Mechanical Testing Setup
3.2.2 Piercing and Pull-out Tests
29
29
30
3.3 Study of the Effect of Design Parameters on Adhesion Capability
3.3.1 Effect of Number of fins on Piercing and Pull-out test
3.3.2 Effect of Rows of fins on Piercing and Pull-out test
3.3.3 Effect of Pitch of fins on Piercing and Pull-out test
36
37
39
41

vi
3.3.4 Effect of Length of fins on Piercing and Pull-out test
3.4 Effect of Different Skin Models on Adhesion Capability
3.4.1 Effect of Different Agarose Concentrations on Piercing and
Pull-out test
3.4.2 Effect of Fibrous Tissue on Piercing and Pull-out test
3.5 Practicality and Potential
4 Conclusion and Future Work
43
47
47
49
51
54
References 57

vii
List of Illustrations
Figure 1: Hypodermic needle tip compared with a silicon microneedle array
Figure 2: Microneedle Classification
Figure 3: Bio-inspiration
Figure 4: Previous work on Bioinspired Microneedle
Figure 5: SolidWorks Model of Microneedle
Figure 6: Projection micro-stereolithography (PuSL) setup and Fabrication process
Figure 7: System Overview
Figure 8: Concept of Crosslinking gradient
Figure 9: Fabricated Microneedle
Figure 10: Column Structure
Figure 11: Curing Depth and Bending Curvature study
Figure 12: Microanatomy of Skin
Figure 13: Compression test results
Figure 14: Mechanical Testing setup
Figure 15: Different Phases of Piercing-Pull out experiment
Figure 16: Data Smoothing
Figure 17: Actual Piercing-Pull out experiment
Figure 18: Finned Microneedle images for Non-fibrous skin tissue
Figure 19: Various Design parameters
Figure 20: Effect of Number of fins (circumferential axis) on piercing and pull-out
experiment.
Figure 21: Effect of Rows of fins (longitudinal axis) on piercing and pull-out experiment.

viii
Figure 22: Effect of Pitch of fins on piercing and pull-out experiment.
Figure 23: Effect of Length of fins on piercing and pull-out experiment.
Figure 24: Piercing and Pull out test for Optimal fin configuration.
Figure 25: Effect of Different agarose concentrations on piercing and pull-out experiment
Figure 26: Effect of Fibrous tissue sample on piercing and pull-out experiment
Figure 27: Finned Microneedle images for fibrous skin tissue
Figure 28: Stitching for large array Microneedle
Figure 29: Visualization of Enhanced Adhesion

ix
List of Tables
Table 1: MN performance comparison between previously reported papers and our
microneedle

1
1. Introduction
1.1 Background
The hypodermic needle was invented independently by Charles Gabriel Pravaz in France
and by Alexander Wood in England in 1853 [1]. Since then, it has become the most widely
used medical device, with an estimated 16 billion injections administered every year
worldwide [2]. Hypodermic needles can be used for a wide variety of medicines and are
usually inexpensive. They are generally made of stainless steel to assure the possibility of
easy sterilization and stiffness at the same time. One end of the needle is beveled to create
a sharp pointed tip letting the needle easily penetrate the skin. The other end is connected
to a syringe through a connector. The syringe consists of a plunger that fits into a barrel.
To collect the bio fluid or to contain the desired drug, the plunger can be pulled or pushed.
They are manufactured using a simple process known as tube drawing. Hypodermic
needles are available in various sizes. The length and diameter of the hypodermic needle
can vary according to the application and the fluid to deliver or absorb. Length of
hypodermic needle can be about 12-40mm and diameter about 0.25-2 mm [1].
Regardless of all these advantages, hypodermic needles present many drawbacks
and problems. First, hypodermic needle can be invasive and/or painful. This aspect can
generate fear in the patient. There have been reports indicating patients suffering from
needle-phobia, or “Belone phobia”, commonly avoid seeking medical and dental assistance
due to their fear of injections. Another example is given by devices for continuous glucose
monitoring (in diabetic patients): nowadays the most common systems rely on needle-type
chemical glucose sensors with a subcutaneous tip that is painful and uncomfortable for the
user [3]. The patient needs to be constantly monitored and so is the presence of the needle

2
for most of the time. The main cause of pain is given by shape and dimensions: if the needle
is long enough to reach the dermis and enter in contact with nerves, the piercing process
can be hurtful especially if the cross section is wide [3]. Another aspect is the limitation of
self-administration. Administration using hypodermic needles requires trained healthcare
personnel. This aspect not only adds to the administration cost, but it also increases the
patient time cost since patients must travel to hospitals/clinics. These two factors outweigh
the cost of vaccination itself. Another drawback of hypodermic needles is the risk of
infection and irritation of skin. Sometimes holes left by hypodermic needles are a pathway
for bacteria and may cause severe infections [4].
1.2 Microneedle: Advantages, Classification, and Applications
Microneedles (MNs) are minimally invasive devices that have been used as an excellent
alternative to traditional hypodermic needles. Due to their micro-scale structure, MNs can
overcome the skin barrier without causing significant pain to the patient. They were first
conceptualized in the 1970s, but it was not until the late 1990s when they became the
subject of significant research due to advances in microfabrication technology that enabled
their manufacture. Since then, these devices have been extensively investigated. Over the
last decade, extensive research has been carried out on MN technology using a wide variety
of materials and MN designs. One of the main purpose for the development of MN was the
effort to reduce the size to reduce pain without affecting the volume of fluid delivered or
extracted by using array. The typical dimensions of the MN array are about- 50-450 um
diameter and 150-1500 um height.

3
Figure 1: Hypodermic needle tip compared with a silicon microneedle array [4], [5]
Kaushik, et. al., conducted a study to compare the pain sensation caused due to
hypodermic needle and microneedle application to the forearm of human subjects. This
study was conducted on 12 volunteers. Each volunteer was treated with a smooth piece of
silicon, a MN array and hypodermic needle. After each treatment, subject was asked to rate
the pain on a 100-mm analog scale with anchors at one end reading “no pain” and the other
reading “worst pain”. Results from this study showed that pain caused due to hypodermic
needle was substantially more than microneedles. Moreover, microneedles did not cause
any damage or irritation to the skin whereas minor bleeding was seen at sites treated with
a hypodermic needle [7]. A similar study regarding pain sensation showed that MN array

4
caused significantly less pain compared to hypodermic needle [8]. The additional costs
incurred due to the use of hypodermic needle can be improved using a system that is easy
to manage and usable by the patient directly. It has been reported that microneedles can be
used for self-drug administration ([2], [3]). According to De Muth et. al. [4], the risk of
infection due to microorganisms is a result of many factors such as size and number of
holes created due to needle insertion, depth of holes, number of microorganisms entering
the skin and their nature [4]. There are several studies that indicate that the risk of infection
resulting from MN administration is minimal. Similarly, no significant skin irritation has
been reported in many studies involving MN insertion for drug delivery.
Over the last decade, extensive research has been carried out on MN technology using a
wide variety of materials and MN designs. MN can be classified based on following
categories-
(1) By material- Metal, Ceramic, Glass and Polymer MNs and
(2) By method of delivery- Solid, Coated, Dissolvable, Hollow and Swellable MNs.
Solid MNs use “poke and patch” approach to deliver drugs. Solid MNs are applied
to skin to create microchannel and then removed. This is followed by an application of a
transdermal patch with suitable drug formulation. The main limitation is the requirement
of a two-step process which may causes practicality issues for patients [9]. Coated MNs
are also called as coat and poke approach. In this case, MNs are coated with a drug
formulation prior to skin insertion. Once this MN is inserted into the skin, the coated drug
diffuses out. The main limitation of this method is restricted amount of drug that can be
coated on the MN. Various coating techniques have been developed to efficiently coat MN.
Dissolvable MNs are also known as poke and release approach. In this method, as soon as

5
the MN is inserted into the skin, MN tips dissolves in the skin. This drug is then released
over time. The release kinetics depends on dissolution rate of MN tip. The main limitation
of this type is the deposition of polymer in the skin, making them undesirable, if they are
used for an ongoing process [9]. Hollow MNs use poke and flow approach. This method
allows continuous delivery of molecules across the skin through MN bore using different
methods: diffusion, pressure, or electrically driven flow. The main limitations of hollow
MNs are the potential for clogging of the needle openings with tissue during skin insertion
[9] and the flow resistance, due to dense dermal tissue compressed around the MN tips
during insertion. Swellable MNs are also called as poke and swell approach. It is a
relatively new type of MN arrays prepared from hydrogel-forming matrices. After
application of the MN array to the skin, the inserted needle tips rapidly take up interstitial
fluid from the tissue, thus inducing diffusion of the drug from the patch through the swollen
micro-projections. Hydrogel-forming MNs are then removed intact from skin, leaving no
measurable polymer residue behind. However, the drug is included inside the hydrogel-
forming MN patch rather than in an external patch, thus limiting the quantity of drug that
can be delivered.

6
Figure 2: Microneedle classification (a) By material, (b) By method of delivery [9]

7
Since the 1990s, tremendous MN research has led to promising applications in the
field of biomedical engineering. MN are most commonly used for transdermal drug
delivery of drugs. Yanfeng Lu et. al. [11] developed polymeric microneedle for transdermal
drug delivery. Dacarbazine drug was loaded into a polypropylene fumarate (PPF) MN
array. The fabrication technique used was projection micro-stereo lithography (PuSL).
When this MN array penetrates the dermis, the encapsulated drug is released. Finally, in
vitro release kinetics tests were conducted to determine the amount of drug
released/delivered. Microneedles have also been used for blood extraction. Li et. al. [12]
developed high aspect ratio hollow nickel microneedles using drawing lithography and
electroplating fabrication technique. This MN was integrated with a self-recovery actuator
for blood extraction and transportation. This actuator was tested in vitro and on a live
rabbit. The same group further investigated the effects of different geometrical parameters
of MN including inner diameter, tip diameter and bevel angle on extraction and
transportation volumes of blood [13]. Microneedles have been recently used for the
detection of biomarkers. Traditional method of detecting biomarkers is through the
extraction of blood samples using needle/syringe. This involves handling of contaminated
blood, thus requiring additional time, costs and trained staff. Plus, use of hypodermic
needle/syringes can be painful. Corrie et. al. [14] proposed use of silicon MN arrays for
detection and extraction of biomarkers directly from serum-rich fluids in the skin. Silicon
MN were fabricated using deep reactive ion etching process (DRIE) and further coated
with a thin film of gold. They used this gold-coated MN to detect FluVax-vaccine in serum-
rich fluid. Another application of MN is in skin grafting. Traditionally, skin grafting has
been done using staples or sutures. These methods can cause skin irritation, redness,

8
bleeding, etc. Yang et. al [15] developed MN with swellable tip. These MN undergo swelling
by absorbing interstitial body fluids upon skin insertion, thereby mechanical interlocking
with skin tissue and enhancing tissue adhesion. Such swellable MN were used for skin
grafting. The performance of these MN was compared with conventional method of skin
grafting using staples. Results showed that skin grafting done using MN formed a
continuous contact with the underlying tissue whereas the same process done using staples
resulted in discontinuous contact with the underlying skin tissue. Therefore, MN can be
used for skin grafting in a minimally invasive manner [15].
1.3 Microneedle: Current Challenges
Over the years, several fabrication techniques have been used for developing microneedles.
These techniques have led to the potential applications of MN in biomedical field such as
drug delivery and transdermal bio sensing [16]. Micro molding is one of the most common
methods due to its excellent reproducibility and cost efficiency. To fabricate the final MN
sample using micro molding, a master template must be created using any micro-electro-
mechanical system (MEMS) based technique. The master template is further used to create
female mold and the final MN is fabricated from this female mold. Although this process
can be used for mass production of MN female molds, the MEMS-based techniques can be
very complicated, and they are usually very time-consuming process. Lee et. al. [16]
proposed a novel fabrication technique of microneedle using drawing lithography. This
fabrication process creates long hollow MN by drawing a thermosetting polymer from a
two-dimensional solid surface micropillars. The 3D microneedle is fabricated from
polymer materials without using light irradiation. Different types of MN can be fabricated
using this technique. However, it shows worse reproducibility because of dependence on

9
the dynamic interaction between surface and fluid [16]. Also, it requires the use of high
processing temperature to draw the polymers. Therefore, this limits the use of heat-
sensitive drugs.
Another challenge for the biomedical field is to achieve significant tissue adhesion.
For example, patients suffering from diabetes must take multiple injections throughout the
day/night to ensure right amount of glucose to be released at the right time. Thus, the
requirement is to have needle that can be used multiple times for long periods of time.
Hypodermic needles are being currently used for this purpose, but they are painful and can
cause significant tissue damage/bleeding. Use of MNs have recently been proposed for this
purpose. For example, skin grafting is usually done when a patient suffers from severe
burns, skin injuries or wounds. [15]. Traditionally, chemical adhesives, staples, or sutures
have been used for the application of skin grafting. Staples and sutures cause skin irritation,
skin tissue damage. Moreover, Chemical adhesives can lead to inflammatory response [17].
To overcome these issues, Kwak, et. al. [18] proposed a polymeric adhesive tape that
consists of high density mushroom-like micropillars. The tip of these micropillars has a
large contact area. It makes a conformal contact with underlying skin. Problems
encountered with chemical adhesives such as redness, skin irritation can be avoided by
using this type of adhesive tape. This new type of adhesive tape maintains adhesion
property even after 30 multiple cycles. While this new adhesive patch offers many
advantages over existing chemical adhesives, it was able to achieve only ~47% adhesive
strength of Chemical adhesives which is still very low. Therefore, there is a need to develop
a system that has high adhesion strength, and which does not maintain its adhesion
performance over time.

10
1.4 Approach
To solve the challenge of tissue adhesion, we looked at nature for inspiration. The mouth
part of “Anopheles stephensi” mosquito consists of a proboscis which is used to draw blood
from human skin [19]. The proboscis consists of many parts that have sharp features of
only a few microns. This allows them to pierce into the skin without causing any significant
pain sensation. “Apis cerana” worker honeybees have stingers with backward facing barbs
that are used for self-defense [20]. The geometry of the stinger enables painless insertion
and adhesion in the human skin to deliver poison. Similarly, porcupine quills have
microscopic backward-facing deployable barbs that are used for self-defense. Due to their
geometry, the barbs on the porcupine quills facilitate easy insertion but surprisingly,
difficult removal due to high tissue adhesion [21].
Figure 3: Bio inspiration (a) Porcupine quill [21], (b) Honey bee stinger [20], (c) and (d)
Worm parasites [22] [23]
Currently there have been few reports regarding the use of bioinspired microneedle
for improvement of tissue adhesion. Yang et. al. [15] developed microneedles inspired from

11
an endoparasite that can swell its proboscis to attach to its host’s intestinal wall. This unique
design of biphasic microneedles with swellable tips offers minimum penetration force and
yet significant adhesion strength through rapid swelling at the needle tips upon contact with
water (in tissue), leading to mechanical interlocking. Similarly, Kyung Cho. et. al. [24]
reported the unique geometry of micro-structured barbs on porcupine quill that enable easy
penetration into tissue and strong tissue adhesion during removal. They reproduced these
two properties using replica molded polyurethane quills.

12
Figure 4: Previous work on bioinspired microneedle. (a) Working principle of swellable
bio-inspired microneedle used for skin grafting [14]. Scale bar: 500 um, (b) Microneedle
inspired from porcupine quill [24]
While these findings on enhanced tissue adhesion performance are encouraging,
there are still few outstanding challenges. The fabrication technique used to develop the
microneedles is very complicated and time-consuming. Thus, there is need for a fabrication
process that is simple, fast and reliable. Another aspect is that the tissue-adhesion
performance of microneedles can be further improved.
To address the fabrication challenge for MNs with tissue-adhesion features, here
we use a projection micro-stereo lithography (PuSL) technique to fabricate three-
dimensional (3D) microneedle structure in a layer-by-layer fashion. This is a fast, reliable
and simple fabrication process compared to other existing microfabrication techniques
being used for MNs.
In this thesis work, we have developed a novel design of microneedle with
triangular shaped curved fins using micro-3D printing technique, PuSL. We utilize photo-
crosslinking density gradient of the polymer to induce curvature in the fins that are

13
horizontally attached to MNs. These are like the backward-facing barbs on a porcupine
quill or honey bee stinger. When such a microneedle is inserted into the skin, the curved
fins pointing away from the needle surface enable mechanical interlocking with the skin
tissues which leads to enhanced adhesion of the needles. Further ahead, to maximize the
adhesion performance, we studied effect of different geometrical parameters of MN fins
and selected an optimal configuration for the microneedle. We were able to achieve ‘~20’
times increase in the adhesion force compared to microneedles without any fins. Finally,
this micro-3D printing fabrication technique gives the unique ability to develop different
types of microneedle such as hollow, solid, dissolvable, etc. depending on the type of
application. This micro-3D bio-inspired microneedle with enhanced adhesion capability
has potential to be used for transdermal applications such as transdermal drug delivery,
transdermal bio sensing, etc.

14
2. Design and Fabrication
2.1 Microneedle Design
In chapter 1, a presentation of the basic ideas behind this project has been made. The
intention to realize a new polymeric, bioinspired structure for biomedical microneedle
application has been underlined. The main inspiration for this new structure came from
parasitic organisms already described previously paragraphs: The objective is to mimic the
hooks/fins of these creatures. The idea for this structure has been elaborated and it will be
presented in here.
The Microneedle arrays were designed using SolidWorks CAD software. As shown
in figure 5, a single microneedle has a conical frustum base support. The needle diameter
is 400 um and total length is 4000 um. Cone angle of the MN tip is 10° and the tip radius
is of 10 um. The fins extruded horizontally from the microneedle are of triangular shape.
The base of the triangle was 200 um and the height (length of the fin) is 650 um. The
number of fins along the circumferential length of the MN is 6 whereas the number of rows
of fins along the longitudinal length of the MN is 4. The pitch of the fins is set to 400 um.
A microneedle array with 4 individual bullet shaped microneedles was fabricated with a
rectangular base/substrate with thickness of 1500 um on 3 x 3 mm2 area. Surface area of
each MN is 5.5 mm2 and volume is 0.47 mm3.

15
Figure 5: SolidWorks model of Microneedle (2x2 array)
2.2 Fabrication
2.2.1 Micro-3D Printing System
A custom-built projection micro-stereolithography system (PuSL) has been used to
develop microneedle arrays. A 405 nm LED light source (Innovations in Optics, Woburn,
MA, USA) has been used the UV light source. The system consists of a digital projector
(ASUS B1M, USA). It is based on DLP4500® chipset from Texas instruments (Dallas,
TX, USA). It consists of a 0.45’’ DMD that has resolution of 1280 x 800 pixels. A coated
wafer stepper objective lens with an effective focal length of 97 mm and magnification of
0.2X was purchased from GCA Tropel (USA). The PuSL system has a resolution of 3.8
um/pixel and maximum intensity of 29.5 mw/cm2 when operated with 1 Amp current

16
supply using a power supply (Agilent, E3633A). The entire PuSL system is controlled and
programmed using LabVIEW. (National Instruments, USA). Figure 6 shows a simple
schematic of the PuSL and Figure 7 shows the actual 3D printing system overview.
The SolidWorks CAD model of Microneedle described in section 2.1 is saved into
STL format. The CAD file is then sliced with a specific layer thickness using a slicing
software called as Creation Workshop to obtain 2D cross-sectional images. Every sliced
image is sent to the DMD chip one-by-one to generate a light pattern. Figure 6(a) shows a
simple schematic of the PuSL system. This light pattern is projected on a surface covered
with liquid resin for a specific curing time to induce crosslinking. Once the layer forms,
the stage moves down, and the material is refreshed from the surface. For the next layer,
the stage moves up but this time, it moves exactly by a distance corresponding to the layer
thickness from the original position. This process is repeated until a 3D structure is
completed. Figure 6(b) shows fabrication process.
Figure 6: Projection micro-stereolithography setup and fabrication process (a) Schematic
of PuSL setup, (b) Fabrication process of microneedle array and resulting microneedle

17
Figure 7: System overview
2.2.2 Microneedle Fabrication
A 3D model of a 2x2 microneedle array with triangular shaped fins is designed using
SolidWorks and converted into STL format. The STL file is then sliced into 2D cross-
sectional images using Creation Workshop software. These images are then converted into
bmp format using Fast Stone Photo resizer software. Furthermore, a text file specifying
curing time and layer thickness for each image is prepared.
To fabricate microneedle array, PEGDA 250 has been used as monomer. PEGDA
is a FDA-approved polymer material with acceptable biosafety for clinical use [25]. Poly
(ethylene glycol) diacrylate (PEGDA) 250 was purchased from Sigma Aldrich. To make
this monomer photocurable, additional components are needed: photo-initiator and photo-
absorber. Photo-initiator is a component that generates free radicals when exposed to

18
radiation (UV or Visible). Photo-initiator used here is Phenylbis (2,4,6-trimethylbenzoyl)
phosphine oxide (Sigma Aldrich) with concentration of 3% (w/v). Photo-absorber is a
component that absorbs radiation (UV or Visible) to control light penetration depth. It is
used to control the curing depth of the polymer. Sudan I (Sigma Aldrich) with a
concentration 0.05% (w/v) has been used as the photo absorber. To prepare the
photocurable resin for printing, all three components are mixed in a non-transparent
container and a stirring several hours [3-4 hrs.] has been imposed. The following printing
process parameters were used to fabricate the microneedle sample: For the microneedle
surface, the layer thickness used is 50 um and curing time used is 0.8 s (Exposure dosage-
23.6 mW/cm2) and for the microneedle fins, a curing time of 1 s has been used.
Once the 3D structure is printed, it is rinsed with ethanol for 5 mins to remove any
resin residuals. Next, the sample is completely dried using air blower. The dry sample is
then inspected through an optical microscope (VWR, USA) for any mechanical damage or
printing errors. If there are no such errors, it is post cured in a UV oven (UVP, CL-1000)
for 10 mins
To print microneedle arrays, we first print the rectangular base/substrate, and then
the needles. Fabrication of curved fins on the MN with this printing direction can be tricky.
If the curved fins were bent upwards, they could be directly built on the supporting layers.
However, fabrication of downward curved fins is not easily possible because there is no
layer underneath to support the fins. Without the supporting layers, the fins cannot be
printed. One way to solve this problem is to print the microneedle upside-down. We
successfully printed the curved fins on the needle with this method, but the needles were
distorted. Also, the tip of MN was not sharp. Another way to print the curved fins is using

19
a support material. The support material provides support for the downward curved fins.
After the fabrication of the entire microneedle structure, the support structure can be
washed out. However, the support material is highly viscous and hence can sometimes clog
the tubes if not handled properly. Also, washing out the support material can be time-
consuming. It can take up to 1-2 days to completely remove the material supporting the
fins, thus, increasing the fabrication time.
To develop downward-facing curved fins, we rely on crosslinking gradient created
during fabrication and corresponding bending. The concept of our method is shown below:
Figure 8: Concept of crosslinking gradient (a) Schematic representation of curved fins, (b)
Comparison between microneedles before (i) and after post curing (ii)
Photo curable resin generates a crosslinking gradient in the resin when exposed to
UV light for a small irradiation time. This is because the upper side of the resin that is
directly exposed to UV light receives more energy than the other side of the resin ([26],
[27]). Hence, upper side of the resin has higher crosslinking density while the other side of

20
the resin has lower crosslinking density leaving uncured polymer in the partially
crosslinked network. When such a partially crosslinked network is immersed in a solvent,
the uncured polymer molecules diffuse out leaving behind loose spaces in the network.
Therefore, when this sample dries, it creates shrinking gradient which results in bending
towards the partially cured side. The bending curvature of the sample is highly dependent
on the crosslinking gradient. The greater the polymer-crosslinking density gradient is, the
higher the bending curvature is. Similarly, the polymer-crosslinking density gradient is
inversely proportional to curing time of the resin. Therefore, bending curvature is inversely
proportional to curing time. Once the bending curvature is formed, further UV irradiation
is given to permanently fix the curved shape as seen in figure 8(a). Also, figure 8(b) shows
microscopic images of microneedle before and after post curing. Please note that Figure 8
is inspired from Jerry Qi’s group paper [26]. Figure 9 shows the microscopic and SEM
images of the fabricated microneedle sample.
Figure 9: Fabricated microneedle (a) Microscopic images when MN (i) just fabricated, (ii)
After following treatment as shown in figure 8, (b) SEM image of microneedle (2x2 array)
with fins (Scale bar: 1 mm), (c) Enlarged view of MN fins (Scale bar: 50 um)

21
2.2.3 Curing depth and Bending Curvature Study
The previous section talks about the concept of inducing bending curvature of fins. To
enhance the microneedle adhesion performance, we hypothesized that the fins with higher
bending curvature would have higher interlocking with the tissue and therefore impose
higher adhesion force during the pull-out process. The two important process parameters
associated with MN fins are (1) Curing depth which is basically the thickness of the fins
and (2) Bending curvature. These two parameters are inversely proportional to each other
with respect to the curing time. Therefore, it is important to study the effect of the material
concentration on these two parameters and further characterize the material that gives best
adhesive performance.
The goal of this study is to select a PA and PI concentration of resin that gives
maximum bending curvature of fins for a given curing depth. We fabricated a column
structure with an array of horizontal cantilever beams. The structure has 4 columns and 6
rows of cantilever beams between each column. The distance between each column is kept
sufficiently long so that the beams do not touch the adjacent columns. The cantilever beam
layers are fabricated horizontally by a single exposure of UV light. Each successive
cantilever beam is exposed to an increasing exposure time. As the UV light shines, the
beam thickness begins to grow. The longer the UV light shines for, the thicker the
cantilever beam. Similarly, longer the UV light shines for, smaller is the bending curvature
of the beams. Figure 10(a) shows the design of the column structure. Next, each cantilever
beam is observed under an optical microscope (VWR, USA). Microscopic Images
(resolution: 1024x768 pixels) of several features of the microneedle such as radius of
curvature and thickness of fins are taken using a 5x microscopic objective lens.

22
Measurements of all these features has been done with image analysis software, ImageJ.
Measurements taken on the ImageJ software are in terms of pixels and must be converted
into an actual physical size of the image. This is done by using a specific pixel to microns
ratio, which can be calculated using a calibration scale. The conversion ratio of a 1024x768
resolution image taken from a 5x objective lens is about 1.265 um/pixels. Furthermore,
radius of curvature of MN fins is calculated by drawing a circle around the curved fins on
the ImageJ software. Finally, bending curvature of the MN fins is calculated by taking the
inverse of radius of curvature as shown in figure 10(b). The actual fabricated dimensions
of all these features are then compared with CAD design. Samples with standard error less
than 15 % were considered for mechanical testing, others were rejected.
Figure 10: Column structure (a) Design, (b) Fabricated sample and measurement of radius
of curvature using ImageJ.
Curing depth and bending curvature experiment has been conducted for PEGDA
250 resin with different PA concentrations and PI concentrations. For the PA study, three
solutions with different PA concentrations (0.02%, 0.05%, 0.08%) but same PI
concentrations (2%) were used. Similarly, for PI study, three solutions with different PI

23
concentrations (1%, 2%, 3%) while PA concentration (0.05%) was kept constant. Curing
time for the cantilever beams was varied from 0.7 to 1.7 seconds [Refer figure 11(a)].
Finally, we make a plot of curing time vs curing thickness and curing time vs bending
curvature.
As shown in figure 11 (b) and (c), regardless of the PA-PI concentration, the curing
depth always increases with time whereas the bending curvature always decreases with
time. From PA study, for a given curing time, the curing depth decreases with increase in
PA concentration whereas bending curvature increases with increase in PA concentration.
[Refer figure 11(b)]. Similarly, from PI study we see that, for a given curing time, the
curing thickness increases with increase in PI concentration whereas bending curvature
decreases with increase in PI concentration [Refer figure 11(c)].

24
Figure 11: Curing depth and Bending curvature study (a) Cantilever beams with different
bending curvature at 0.9, 1.1,1.3 and 1.5 seconds, (b) Plot of bending curvature and curing
depth vs curing time for PA study, (c) Plot of bending curvature and curing depth vs curing
time for PI study
25
Since a finite thickness of the fin is necessary to exert enough force, we have set
our selection criteria for PEGDA 250 resin concentration as follows: Select the PA/PI
concentration that gives maximum bending curvature for a 100 um thick microneedle fin
(Indicated by the black dotted line in figure 11(b) and (c)). Therefore, from the PA study,
we see that 0.05% PA (with 2% PI) gives the maximum bending curvature ~0.003 um-1
[Red dot in Figure 11 (b)] whereas from the PI study, we see that 3% PI (with 0.05% PA)
gives the maximum bending curvature ~0.003 um-1 [Red dot in Figure 11 (c)]. Hence, we
have selected PEGDA 250 with 3% PI and 0.05% PA for the fabrication of microneedle
with curved fins.

26
3. Microneedle with Enhanced Adhesion Capability
3.1 Skin Anatomy and Skin Models
Before moving on to mechanical testing of microneedles, it is important to specify the skin
composition and talk about the skin models used for mechanical testing. Figure 12 shows
the microanatomy of an actual skin. A detailed description of the skin has been mentioned
by Ventrelli, et. al. [14] There are three main layers: Epidermis, Dermis and Hypodermis.
Figure 12 also shows corresponding parameters of the skin composition. The outermost
layer is the epidermis. The outermost level of the epidermis is called stratum corneum and
it is mainly responsible for protection of the skin. This region is highly stiff, and the typical
thickness range is 50 um and 150 um (14). The following layer is Dermis. It is much thicker
than epidermis. (typical thickness is 500-2000 um). It contains the most part of all the
capillary tubes and nerve endings. This region is used for most of the transdermal
applications to extract blood samples. The last part is the Hypodermis. The thickness is
higher than the other two layers (about 30000 um) but the stiffness is quite low compared
to other layers.
Figure 12: Microanatomy of skin

27
The skin model considered for mechanical testing is agarose gel. Agarose
(BioReagent, for molecular biology; low EEO) was purchased from Sigma Aldrich. It is
available as a white powder which dissolves in near-boiling water (melting temperature:
85-90°C), and forms a gel when it cools (gelling temperature: 34-38°C). It is prepared
using agarose (white powder) and deionized water in Polystyrene storage boxes (2.5 x 2.5
x 2.5cm, Ted Pella). The following procedure was followed to prepare the agarose gel for
a given concentration of agarose: Obtain square mold to hold the agarose gel cube during
the test and fill mold with deionized water until it is completely full. Pour this into a 100ml
glass beaker. After this, place it onto the scale and tare it. Next, add agarose to the deionized
water so that it contains 2% weight percentage of agarose. (For example, for 100g of water
put in 2g of agarose). Place magnetic stirrer into beaker and then place beaker on a hot
plate with stirrer. Turn stirrer on and set temperature to 200 °C. After about 15-20 mins or
when the agarose powder is fully dissolved and clear solution is visible, pour solution into
mold. Once carefully poured into mold, place mold into refrigerator into 20 mins or wait
till the solution gels into a translucent white color and can be easily separated from mold
without attaching to the side walls. After making the gel, it can be placed in the mold during
the test.
Next, we studied the mechanical properties of agarose gel with different agarose
concentrations. Compression tests have been imposed to explore the compression modulus
of agarose gel samples with different agarose concentration. The typical agarose sample
size used was about 12 mm x 12 mm x 12mm. Stress-strain curves were plotted and
resulting compressive modulus have been successfully calculated by imposing a linear
fitting on the data collected. The results are shown in figure 13(a). The compression

28
modulus of agarose sample goes on increasing with the increase in agarose concentration.
As reported by Ventrelli et. al. [14], the typical young modulus of dermis level is between
10-30 KPa. Considering this aspect, we have chosen agarose gel with 2% agarose as a skin
model for all piercing-pull out experiments. The compression modulus of 2% agarose
sample from our experiment result is 22.75 ± 0.11 KPa. Agarose gel is a non-fibrous skin
model. We have also tested our microneedle performance on a fibrous skin model such as
chicken/white meat. Before testing the needles on fibrous skin model, compression tests
have been conducted on the chicken sample. Figure 13(b) shows the compression test
results. The compression modulus of fibrous tissue (chicken sample) from our experiment
result is 11.64 ± 0.01 KPa.

29
Figure 13: Compression test results (a) Stress-strain curve for different agarose gel
concentrations, (b) Stress-strain curve for different agarose gel concentrations.
3.2 Mechanical Testing
3.2.1 Mechanical Testing Setup
Custom-built mechanical testing system has been used to study the microneedle insertion
and pull-out process. A high precision miniature load cell (LCFD-1KG, Omega
Engineering) is driven by a linear stage from Thorlabs (UTS150CC, Newton, NJ). The load
cell capacity is 1 kg. The travel range and micro steps of linear motor are 25 mm and 0.05
um. The loading/unloading force is measured by the load cell and the loading displacement

30
is read by the linear stage. A data acquisition board and LabVIEW (National Instruments)
acquire both the signals. The insertion and pull out process is continuously observed by a
DSLR camera (EOS60D, Canon). Data from mechanical testing is collected using a self-
developed LabVIEW code (National Instruments, USA) and further analyzed using
OriginPro (OriginLab, USA).
For the piercing and pull-out experiment, the microneedle sample is first rinsed
with ethanol and air dried for 5 mins. The microneedle sample is then mounted upside-
down onto an aluminum disc using super glue (Gorilla glue). This disc is connected to a
load cell. The disc together with load cell forms the moving stage. The skin model used for
testing the microneedles is mounted on a fixed stage using tape [Refer figure 14].
Figure 14: Mechanical testing setup: (a) Schematic, (b) Experimental setup
3.2.2 Piercing and Pull-out Tests
To study the adhesion performance of MN, we conducted piercing pull-out tests. The
experimental setup and sample loading has been described in the previous section. After

31
loading the sample and the skin model on the testing system, the piercing and pull out test
is carried out with the following procedure: (1) Adjust the position of the microneedle tip
such that it just touches the skin model. Next, the microneedle is driven downward into
the skin model sample with an insertion depth of 3mm and at a speed of 0.08 mm/s. Once
it reaches the 3mm displacement, the stage stops. The microneedle stays inside for about
60 s (relaxation time). Next is the pull-out process, where the microneedle moves upward
at a rate of 0.08mm/s with a displacement of 3 mm. The signal from the load cell including
the force and displacement is synchronously recorded in the form of a load-displacement
curve using a LabVIEW code. The data collected from the experiment is used to plot a
force vs displacement curve. As shown in figure 15, right arrow direction represents
piercing process and left arrow direction represents pull out process. Similarly, positive
force is tensile whereas negative force is compressive. To understand the complete piercing
and pull out experiment in detail (figure 15), consider the following phases:
(1) Phase 1: Compression- In this phase, the microneedle tries to penetrate the skin model.
The skin model, due to its viscoelastic nature, is deformed and compressed when the needle
tip meets the top surface of the skin model. The needle, on the other hand, experiences
compressive load. The skin model continues to deform until a critical load is reached for
punctuation (Figure 15 A).
(2) Phase 2: Piercing/Penetration- Once the critical load is reached, a crack is initiated. The
skin model is punctured, and the needle penetrates the skin model. As it travels deeper, it
experiences compressive forces due to the surrounding skin model (Figure 15 B).
(3) Phase 3: Relaxation- Once the needle reaches the intended depth, it holds still. Due to
the viscoelastic nature of the skin model, it gradually recovers from its deformed state.

32
Hence, the compressive force decreases slowly and approaches a steady state after a certain
period (Figure 15 C).
(4) Phase 4: Pull out- In this phase, the needle is pulled out of the skin model. Due to the
viscoelastic nature of the skin model, the immediate skin model fibers that are in contact
with the needle surface move along with the MN. In doing so, the MN experiences tensile
force due to friction from contact surfaces. As the MN moves further, the tensile force goes
on increasing up to a critical point. At this critical point, the needle with the skin model
and the coefficient of frictions is now kinetic. This region is marked by a sudden drop in
the pull-out force. After this, the needle slides out of the skin model (Figure 15 D).
Figure 15: Different Phases of Piercing-Pull out experiment
The raw data is collected from the piercing and pull out test at a sampling rate of
1000 data points per second. The data collected has noise and must be converted to smooth
data using a smooth process. The method of adjacent averaging with 500 points of window

33
on OriginPro (OriginLabs) has been used to obtain a smooth load-displacement curve.
Figure 16(a) shows the force displacement curve plotted with raw data points. Figure 16(b)
shows force displacement curve after smoothing process.
Figure 16: Data smoothing (a) Force/displacement curve using Raw data, (b)
Force/displacement curve after using adjacent average method with a window of 500 points
Figure 14(b) represents actual force-displacement curve of finned needle and
smooth needle. Note that, we have used a 2x2 MN array for all mechanical testing
experiments. The finned needle used in this case has 24 (6 rows x 4 fins per row) fins. The
smooth needle is a control experiment with MN having no fins. We have selected 2%
agarose gel as a skin model for all mechanical testing experiments as the elastic modulus
of 2% agarose (19.31 KPa) is like that of the epidermis level of the skin (10-30KPa) [14].
The insertion speed used for the piercing process is 0.08mm/s. Insertion is followed by a
relaxation phase wherein a relaxation time of 60 s has been used for stress relaxation.
Similarly, the retraction speed used for the pull-out process is 0.08mm/s. From figure 17(a),
we can see that the compression and relaxation phase are same for both the cases. The
maximum force required to pull the needle out of skin sample has been defined as the pull-
out force or peak adhesion force. Similarly, the work of removal has been calculated by

34
considering the area under curve. Please note that we have considered only the tensile force
(positive work) for this calculation and it has been calculated from OriginPro. From the
curve, we can see that the pull-out force of finned needle (0.0170 ± 0.0010) is also higher
than smooth needles (0.0041 ± 0.0021 N). As shown in figure 17(a), the piercing phase and
pull out phase of finned needle is marked by “crests and trough” profile indicating the force
fluctuations caused due to presence of fins. No such fluctuations can be seen in case of
smooth needles. Therefore, we can conclude that the fins mechanically interlock with the
skin model and show higher pull-out force compared to smooth needle. Through this
experiment, we were able to achieve a ~4.5-fold increase in the pull-out force as compared
to smooth needle. Figure 17 (b) shows close-up views of the microneedle. The microneedle
fins remain intact even after the test is completed. Thus, the fins can penetrate the agarose
gel without any mechanical damage/breakage.

35
Figure 17: Actual Piercing-Pull out experiment (a)Force/Displacement curve, (b) Close-
up images of MN before, during and after piercing/ pull out experiment (Images captured
using 5x micro lens)
Figure 18 (a) and (b) shows the SEM image of the finned microneedle before and
after the piercing- pull out test. From figure 18(b), we can see that some agarose material
gets attached to the microneedle fins.

36
Figure 18: Finned Microneedle images for non-fibrous tissue (a) SEM image of finned
microneedle before the test, (b) SEM image of finned microneedle after the piercing-pull
out test.
3.3 Study of the Effect of Design Parameters on Adhesion Capability of Microneedles
To maximize the adhesion performance of finned MN, we conducted experiments to study
the effect of geometrical parameters of its fins. The MN geometrical parameters (Needle
diameter- 400 um and length- 4000 um) are constant for all experiments [Refer figure
19(a)] whereas the fin geometrical parameters have been varied. We have considered four
geometrical parameters of the fin, namely: Number of fins, Rows of fins, Pitch of fins and
Length of fins [Refer figure 19(b)].
Figure 19: Various design parameters (a) Fixed parameters(Needle), (b) Variable
parameters (i) Number of fins, (ii) Rows of fins, (iii) Pitch and (iv) Length
37
3.3.1 Effect of Number of fins on Piercing and Pull-out test
We first studied the effect of number of fins along the circumferential axis of MN. For this
experiment, we hypothesized that the pull-out force would increase with the number of fins
because each fin interlocks with the skin tissue resulting in enhanced adhesion. We
fabricated 6 samples of MN, each having a single row of fins and different number of fins.
Number of fins were varied from 1-6. Pitch of the fins is 200 um. Length of the fins is 200
um. Figure 20(a) represents the force per needle vs displacements curve for all samples.
We see that as the number of fins is increased, the pull-out force increases. The data from
the experiments proves the hypothesis to be true. Therefore, we can say that the pull-out
force is directly proportional to the number of fins along circumference. The maximum
pull-out force per needle [Refer Figure 20(b)] was observed in the case of finned needles
with 6 fins (0.032 ± 0.003 N). Thus, we were able to achieve a ~10-fold increase in the
pull-out force per needle as compared to the result with the smooth needle having no fins
(0.003 ± 0.001 N). The maximum number of fins that can be accommodated in a single row
is 6. If we increase the number of fins beyond 6, they start overlapping. No doubt, the pull-
out force will further increase if we increase the number of fins beyond 6 but this increase
in pull out force will be due to increase in the apparent diameter of the microneedle itself
and not just due to the mechanical interlocking of each fin.

38
Figure 20: Effect of number of fins (circumferential axis) on piercing and pull-out
experiment (a) Force per needle vs displacement plot representing finned MN with number
of fins from 1 to 6 and smooth microneedle with no fins. These values are obtained from
n=3 different samples, each sample was used twice, (b) Data shows maximum pull out
force per needle vs number of fins with error bars representing SD. For comparison of data,
one-way ANOVA was performed using Tukey’s Honest significant difference test at a
significance level of 0.05 (alpha level) ‘***’ and ‘**’ indicates a statistical difference with
p<0.001 and p<0.01.

39
3.3.2 Effect of Rows of fins on Piercing and Pull-out test
Next, we studied the effect of number of fins along the longitudinal axis of MN on piercing-
pull out test. For this experiment, we hypothesized that pull-out force would further
increase with the increase in the number of rows of MN fins. This is because each fin per
row will mechanically interlock with the skin model and thus result in better adhesion
performance. We fabricated 6 samples of MN, each having 6 fins along the circumferential
axis and different number of fins along longitudinal axis (different rows of fins). Pitch used
for the MN fins is 200 um and length of the fins is 650 um. Figure 21 (a) represents the
force per needle vs displacements curve for all samples. The results from this experiment
show an increase in the pull-out force with the number of rows of fins, hence, proving that
the hypothesis is valid. Thus, the maximum pull-out force per needle was observed in the
case of MN with 5 rows of fins (0.053 ± 0.006 N) [Refer Figure 21 (b)]. This represents
~18-fold increase in the pull-out force compared to that of smooth needles having no fins
(0.003 ± 0.001 N). For the figure 21 (b), we see that pull-out force is significantly reduced
when the rows of needle are increased beyond 5. For a fixed insertion depth (3000 um in
this case), the last row of fin is either very close to the top-surface of the agarose gel (when
number of rows is =6) or it is not completely inside the agarose gel (if the number of rows
is >6). Therefore, at the time of pull out, the agarose sample ruptures easily and the pull-
out force experienced by the needle is low. Hence, we see a decrease in the pull-out force
for the case of 6 number of rows [Refer figure 21(b)] and thus, we have not considered
increasing the number of rows beyond 6.

40
Figure 21: Effect of row of fins (longitudinal axis) on piercing and pull-out experiment
(a)Force per needle vs displacement plot representing finned MN with rows of fins from 1
to 6 and smooth microneedle with no fins. These values are obtained from n=3 different
samples, each sample was used twice for experiments, (b) Bar chart showing maximum
pull out force per needle vs number of fins with error bars representing SD. For comparison
of data, one-way ANOVA was performed using Tukey’s Honest significant difference test
at a significance level of 0.05 (alpha level) ‘***’ indicates a statistical difference with
p<0.001.

41
On comparing the results from the above experiments, we can say that the net
increase in maximum pull-out force is smaller for the number of rows experiment. This
could be because of the brittleness of the skin model (In this case, agarose gel). As the first
row of fins leaves the agarose gel skin model, it scrapes off some of the gel along its path,
thus leaving behind small spaces in the agarose gel. Due to this, the next row of fins
experiences relatively less force as it moves out. Thus, the overall increase in the maximum
pull-out force is relatively small. This means that, if we have two samples- the first sample
with a single row of six fins along the circumference and the second sample with two rows
and three fins each along the circumference, the first sample will show higher pull-out
force. This, however, may not be true if a skin model other than agarose gel is used.
3.3.3 Effect of Pitch of fins on Piercing and Pull-out test
From the previous two experiments, we studied that increase in pull out force due to rows
of fins is relatively small as compared to the number of fins along a single row. We
postulated that this could be because of the fins being too close to each other. Therefore,
we conducted a new experiment to understand how the distance between the consecutive
fins (pitch) affects pull-out force. We hypothesized that if the pitch of the fins is increased,
each fin per row will individually engage with the surrounding skin model and thus
contribute to the enhancement of adhesion. For this experiment, six MN samples were
considered. The total number of fins (Rows x number of fins- 3x6) was kept constant for
all six cases. The pitch of fins was varied from 200 um to 700 um. Length of the fins was
kept constant as 650 um. Figure 22 (a) shows the force per needle-displacement plot for all
cases. Result from figure 22 (b), shows that pitch of MN fins does not have a significant

42
impact on the pull-out force. The average maximum pull-out force of all MN samples was
approximately 0.044 ± 0.01 N. Thus, we would keep the pitch constant as 200 um.
Figure 22: Effect of pitch of fins on piercing and pull-out experiment (a) Force per needle
vs displacement plot representing Finned MN with pitch varying from 200 um to 700 um
and smooth microneedle with no fins. These values are obtained from n=2 different
samples, each sample was used thrice for experiments, (b) Bar chart showing maximum
pull out force per needle vs number of fins with error bars representing SD. Error bars
indicate standard deviation.

43
3.3.4 Effect of Length of fins on Piercing and Pull-out test
Next, we studied MN adhesion performance based on MN fin length. The rationale for this
experiment is that increase in length of the fins would increase the pull-out force because
as the fin size becomes larger, it points farther from the needle wall (increasing the apparent
diameter of the MN). Thus, increasing frictional resistance and leading to further
mechanical interlocking with the skin model. This results in enhanced tissue adhesion. In
this experiment, total six samples with different lengths were fabricated. The total number
of fins (rows x number of fins: 1x6) and pitch (200um) were kept the same for all six
samples. MN with six different lengths ranging from 250 um to 750 um were tested and
analyzed on 2% agarose gel. The force per needle vs displacement results show that the
maximum pull-out force initially increases with the length of fins. It achieves maximum
pull-out force per needle for a length of 450 um (0.046 ± 0.001 N). As the length is
increased further, the maximum pull-out force drops [Figure 23(a)]. With the same bending
curvature, if the length of fin is increased beyond a certain value, the tip of the fin starts to
point radially inwards, that is, facing towards the needle surface. Therefore, during pull-
out process, the fins do not interlock with the surrounding skin tissue. Thus, the pull-out
force significantly drops. We also theoretically calculated the optimal length of the fin
calculated as follows:

44
Thus, the theoretical value of optimal length of fin matches with the experimental
result. From the results shown in figure 23(b), a 15~ fold increase in pull out force
compared to the smooth needle. (0.003 ± 0.001 N) was achieved.
Figure 23: Effect of length of fins on piercing and pull-out experiment (a) Force per needle
vs displacement plot for different lengths of fins. These values are obtained from n=2
different samples, each sample was used thrice for experiments, (b) Bar chart showing
maximum pull out force per needle vs length of MN fins with error bars representing SD.

45
To achieve the maximum adhesion performance, we have selected an optimal fin
configuration based on the results of all the above experiments shown in figure 24(a). The
maximum pull-out force achieved with finned needle is 0.066 ± 0.004 N. (figure 24 (b) and
(c)). With this optimal fin configuration, we were able to achieve ~20-fold increase in the
pull-out force per needle as compared to the smooth needle (0.003 ± 0.001 N).

46
Figure 24: Piercing and pull-out experiment for optimal fin configuration (a) Schematic
of optimal design of microneedle with curved fins and microscopic image of a single
microneedle. (Scale bar: 200 um), Table represents the optimal fin configuration design
parameters that gives the maximum adhesion performance, (b) Force per needle vs
displacement plot representing rough MN with optimal fin configuration and smooth
microneedle used as a controlled experiment. These values are obtained from n=2 different
samples, each sample was used thrice for experiments, (c) Bar chart showing maximum
pull out force per needle vs type of needle with error bars representing SD. For comparison
of data, one-way ANOVA was performed using Tukey’s Honest significant difference test
at a significance level of 0.05 (alpha level) ‘***’ indicates a statistical difference with
p<0.001.

47
3.4 Effect of Different Skin Models on Adhesion Capability of Microneedle
3.4.1 Effect of Non-Fibrous Tissue on Piercing and Pull-out test
With this optimal MN configuration, we studied MN adhesion performance on different
skin models. First, we tested the MN on different agarose gel concentrations- (1-4%). The
compressive modulus of all the different agarose samples has been previously measured
and discussed in section 3.1. Figure 25 shows the piercing-pull out experiment results for
agarose gel with different concentrations (1-4%). The maximum pull-out force for the
finned MN keeps on increasing with increase in agarose concentration (percentage). We
also noticed that the change in maximum pull-out force between finned MN and smooth
MN is maximum in the case of 2% agarose gel.

48
Figure 25: Effect different agarose gel concentration on piercing and pull-out experiment:
(a) Force per needle vs displacement plot for different agarose concentration (1-4%)
representing rough MN (2x2 array) with curved fins and smooth microneedle with no fins
(2x2 array). These values are obtained from n=1 different samples, each sample was used
thrice for experiments, (b) Bar chart showing maximum pull out force per needle vs agarose
concentration with error bars representing SD. For comparison of data, one-way ANOVA
was performed using Tukey’s Honest significant difference test at a significance level of
0.05 (alpha level) ‘***’ indicates a statistical difference with p<0.001

49
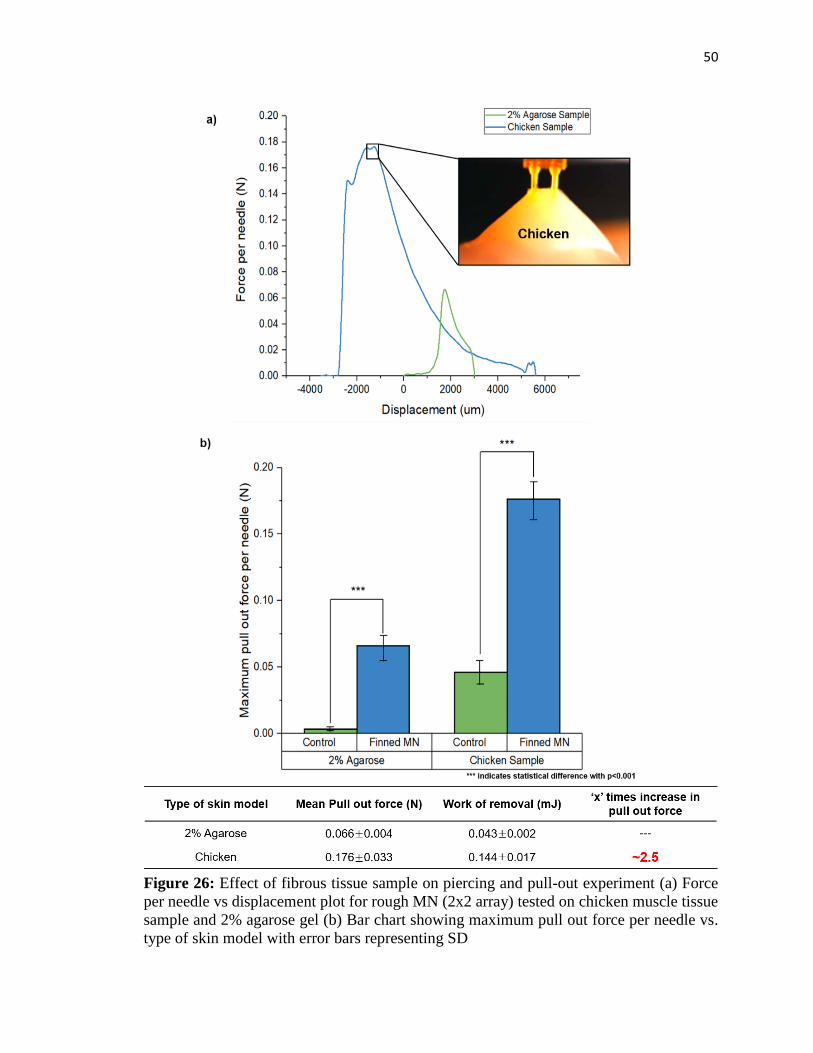
3.4.2 Effect of Fibrous Tissue on Piercing and Pull-out test
Next, we tested microneedle sample on white meat/chicken muscle tissue sample. For the
piercing and pull out test, small chicken samples were cut with following size: Length- 15
± 0.5 mm, width- 13 ± 0.7 mm and thickness 11 ± 0.5 mm. To successfully penetrate MN
into the chicken sample, the insertion rate was increased to 4 mm/s and the retraction speed
was kept same as all previous experiments- 0.08 mm/s. In addition, the insertion depth used
for this experiment is 6000 um. Results from the piercing pull out test suggest that the
tissue fibers of chicken sample mechanically interlock to the MN curved fins. This results
in higher pull out force per needle (0.176 ± 0.033) as shown in figure 26 (a) and (b).
Moreover, the curved fins drag fibrous tissue for a longer displacement generating
maximum pull out force after it has been pulled beyond the initial 6 mm. This pull-out
force is ~2.5 fold higher than the maximum pull out force of the MN in case of 2% agarose
gel. This is because the tissue fibers of white meat sample have higher fracture stress
compared to agarose sample. Thus, we can conclude that MN performs better in fibrous
tissue than non-fibrous tissue.
50
Figure 26: Effect of fibrous tissue sample on piercing and pull-out experiment (a) Force
per needle vs displacement plot for rough MN (2x2 array) tested on chicken muscle tissue
sample and 2% agarose gel (b) Bar chart showing maximum pull out force per needle vs.
type of skin model with error bars representing SD

51
Figure 27 (a) and (b) shows the SEM image of the finned microneedle before and after the
piercing- pull out test with fibrous tissue (chicken sample). Note that figure 27(c) shows
that some fibrous tissue is attached to the microneedle fins.
Figure 27: Finned microneedle images for fibrous tissue (a) SEM image of finned
microneedle before the piercing pull out test (Scale bar: 500 um), (b) SEM image of finned
microneedle after piercing pull out test (Scale bar: 500 um), (c) Enlarged SEM image of
MN fin (Scale bar: 100 um)
3.5 Practicality and potential
Further, ahead, we visually demonstrated the adhesion capability of our MN. The
3D printing system described in chapter 2 can be upgraded to extend the build area. This
feature can be achieved by adding two additional moving stages on the printing plane. To
increase the build area, the optical system remains fixed whereas the sample holder moves
in x and y direction. Thus, once a single area is exposed, the UV exposure is turned off and

52
the sample holder moves horizontally to the adjacent section and so on. In this way, we
fabricated a larger array (6x6) of microneedle sample as shown in figure 28.
Figure 28: Stitching for large array printing (step-and-repeat fabrication process)
This large MN array (6x6) sample was mechanically pierced into a chicken sample.
This chicken sample was then mounted upside down on a post. The MN pierced into this

53
chicken sample was loaded with of 20 grams weight as shown in figure 29 and at the same
time, a video was recorded. As shown in the figure 29 (a) and 29 (b), smooth MN (control)
sample comes off after 10 seconds after loading whereas, finned MN sample does not come
off even after a relatively longer time: five minutes. Thus, we can say that due to the
presence of curved fins on the MN, the tissue fibers of the chicken sample mechanically
interlock with the curved fins. In case of smooth needles, no such fins are present; therefore,
the adhesion force between the needle and chicken sample is not enough to hold the MN
for a longer time. Thus, MN with curved fins show enhanced adhesion capability.
Figure 29: Visualization of enhanced adhesion (a) Images showing microneedle w/o fins
(control) with 20 grams weight using thread at (i) t=0s and (ii) t=10 s and (b) Images
showing finned microneedle (6x6 array) loaded with 20 grams weight using thread at (i)
t=0s and (ii) t=5 mins

54
4. Conclusion and Future Work
In this research work, we have addressed two current issues in MN research: (1) Complex
fabrication process and (2) Low tissue adhesion. To overcome these challenges, we have
developed 3D-printed bioinspired microneedle with enhanced tissue adhesion capability.
Utilizing photo-crosslinking density gradient of the polymer, we fabricated MNs with
downward-facing curved fins, like the barbs on a porcupine quill or honeybee stinger.
When such a microneedle is inserted into the skin model, the curved fins mechanically
interlock with the skin tissue and thus leads to enhanced adhesion of the needles to skin
tissue.
Furthermore, to maximize the adhesive performance, we studied effect of different
geometrical parameters of MN fins such as number of MN fins, rows of MN fins, pitch of
MN fins and length of MN fins. Based on the results from these experiments, an optimal
configuration for the microneedle was selected. We were able to achieve ~20-fold increase
in the adhesion force compared to microneedles without any fins. Thus, MN with curved
fins offers higher pull out force indicating enhanced adhesion.
Following table shows the comparison of microneedle performance related
parameters found in literature. We have compared our results with previous reported papers
on microneedle adhesion performance.

55
Table 1: MN performance comparison: A comparison between previously reported works
related to microneedle adhesion and our microneedles in terms of design parameters and
mechanical performance of MN.
First, the design parameters are taken into consideration. Although, size of our MN
(diameter and length) of our MN is greater than others, our 3D printing has the capability
to fabricate up to 10x10 array of MN with smallest possible diameter of 100 um with an
aspect ratio up to 20. Secondly, our microneedle has shown a better mechanical
performance than all the previously reported work.
Finally, microneedle fabricated using 3D printing gives the unique ability to
develop different types of microneedle such as hollow, solid, coated, dissolvable and
swellable. Therefore, this novel microneedle array has a huge potential to be used for
transdermal applications such as transdermal drug delivery, transdermal bio sensing and
bioanalytic.
For the future work, to show the enhanced adhesion capability of this new
microneedle, a large array microneedle (12x12) will be fabricated and it will be

56
mechanically tested on an actual skin with an epidermis layer such as pig skin. This new
microneedle must be able to penetrate pig skin without any mechanical failure of the
needle/fins. Furthermore, drug delivery/bio sensing experiments using Rhodamine dye will
be carried out to show the potential of these new microneedles for practical applications.

57
References
[1] Devin V. McAllister, Mark G. Allen and Mark R. Prausnitz,” Microfabricated
Microneedles for Gene and Drug Delivery”, Annual Review of Biomedical Engineering,
02, pp. 289-313, 2000
[2] James J. Norman, Jaya M. Arya, Maxine A. McClain, Paula M. Frew, Martin I. Meltzer
and Mark R. Prausnitz,” Microneedle patches: Usability and acceptability for self-
vaccination against influenza”, Vaccine, 32, pp. 1856–1862, 2014
[3] Ahmed El-Laboudi, Nick S. Oliver, Anthony Cass, and Desmond Johnston, “Use of
Microneedle Array Devices for Continuous Glucose Monitoring: A Review”, Diabetes
technology and therapeutics, 15(1), 2013
[4] Peter C. DeMuth, Wilfredo F. Garcia-Beltran, Michelle Lim Ai-Ling, Paula T.
Hammond and Darrell J. Irvine, “Composite Dissolving Microneedles for Coordinated
control of Antigen and Adjuvant Delivery kinetics in Transcutaneous Vaccination”,
Advanced Functional Materials, 23, pp. 161–172, 2013
[5] Davis, Shawn P., Benjamin J. Landis, Zachary H. Adams, Mark G. Allen, and Mark R.
Prausnitz. "Insertion of microneedles into skin: measurement and prediction of insertion
force and needle fracture force." Journal of biomechanics 37(8), pp. 1155-1163, 2004
[6] Yeu-Chun Kim, Jung-Hwan Park and Mark R. Prausnitz,” Microneedles for drug and
vaccine delivery”, Advanced Drug Delivery Reviews, 64, pp. 1547–1568, 2012
[7] Kaushik S, Hord AH, Denson DD, McAllister DV, Smitra S, Allen MG, Prausnitz,”
Lack of pain associated with microfabricated microneedles”, Anesthesia and Analgesia,
92(2), pp. 502-4, 2001

58
[8] M. I. Haq. Smith D. N, John M., Kalavala C. Edwards, A. Anstey A. Morrissey, J. C.
Birchall, “Clinical administration of microneedles: skin puncture, pain and sensation”,
Biomedical Microdevices, 11(1), pp. 35-47, 2009
[9] Eneko Larrañeta, Rebecca E.M., Lutton A., David Woolfson, Ryan F. Donnelly,”
Microneedle arrays as transdermal and intradermal drug delivery systems, Materials
science, manufacture and commercial development”, Materials Science and Engineering:
R: Reports, 104, pp. 1-32, 2016
[10] Han J. G. E. Gardeniers, Regina Luttge, Erwin J. W. Berenschot, Meint J. de Boer,
Shuki Y. Yeshurun, Meir Hefetz, Ronny van’t Oever, and Albert van den Berg,” Silicon
Micromachined Hollow Microneedles for Transdermal Liquid Transport”, Journal of
microelectromechanical systems, 12(6), pp. 855-862, 2003.
[11] Lu, Yanfeng, Satya Nymisha Mantha, Douglas C. Crowder, Sofia Chinchilla, Kush
N. Shah, Yang H. Yun, Ryan B. Wicker, and Jae-Won Choi, "Microstereolithography and
characterization of poly (propylene fumarate)-based drug-loaded microneedle
arrays", Biofabrication, 7(4), 2015
[12] Kwang Lee, Hyungil Jung,” Drawing lithography for microneedles: A review of
fundamentals and biomedical applications”, BioMaterials, 33(30), pp. 7309-7326, 2012
[13] Li Chen Guo, Lee Chang Yeol, Lee Kwang, Hyungil Jung, “An optimized hollow
microneedle for minimally invasive blood extraction”, Biomedical Microdevices, 15(1),
pp. 17-25, 2013
[14] Ventrelli, Lucanos Marsilio Strambini, and Giuseppe Barillaro,” Microneedles for
Transdermal Bio sensing: Current Picture and Future Direction”, Advanced Healthcare
Materials, 4(17), pp. 2606-2640, 2015

59
[15] Yun Yang, Eoin D. O’Cearbhaill, Geoffroy C. Sisk, Kyeng Min Park, Woo Kyung
Cho, Martin Villiger, Brett E. Bouma, Bohdan Pomahac, and Jeffrey M. Karp, “A bio-
inspired swellable microneedle adhesive for mechanical interlocking with tissue”, Nature
communications, 4(1702), 2013
[16] Wang, Min, Lianzhe Hu, and Chenjie Xu, "Recent advances in the design of polymeric
microneedles for transdermal drug delivery and biosensing.", Lab on a Chip, 17(8), pp.
1373-1387
, 2017
[17] Vote BJ, Elder MJ.,” Cyanoacrylate glue for corneal perforations: a description of a
surgical technique and a review of the literature”, Clinical Experiment, Ophthalmology,
28, pp. 437–442, 2000
[18] Moon Kyu Kwak, Hoon-Eui Jeong, Kahp Y. Suh,” Rational Design and Enhanced
Biocompatibility of a Dry Adhesive Medical Skin”, Advanced Materials, 23(34), pp. 3949-
3953, 2011
[19] Ramasubramanian MK, Barham OM, Swaminathan V., “Mechanics of a mosquito
bite with applications to microneedle design”, Bio inspiration Biomimetics, 3(4), 2008
[20] Zi-Long Zhao, Hong-Ping Zhao and Xi-Qiao Structures, properties, and functions of
the stings of honey bees and paper wasps: a comparative study, Biology Open, 4(7), 921–
928, 2015
[21] W. Yang, C. Chao, J. McKittrick, Axial compression of a hollow cylinder filled with
foam: A study of porcupine quills, In Acta Biomaterialia, 9(2), 5297-5304, 2013
[22] R. A. Hammond,” The proboscis mechanism of Acantocephalus Ranae”, Journal of.
Experimental Biology, 45(2), pp. 203-213, 1966

60
[23] Waterdog, Necturus beyeri, Brent B. Nickol, “Fessisentis necturorum sp. n.
(Acanthocephala: Fessisentidae), a Parasite of the Gulf Coast”, The Journal of
Parasitology, 53(6), pp. 1292-1294, 1967
[24] Woo Kyung Cho, James A. Ankrum and Jeffrey M., “Micro structured barbs on the
North American porcupine quill enable easy tissue penetration and difficult removal”,
Proceedings of the National Academy of Sciences of the United States of America, 109(52),
pp.21289-21294, 2012
[25] Peng Xue, Xuyang Zhang, Yon Jin Chuah, Yafeng Wua, Yuejun Kang, “Flexible
PEGDA-based microneedle patches with detachable PVP–CD arrowheads for transdermal
drug delivery”, Royal Society of Chemistry, 5(92), pp. 75204-75209, 2015
[26] Zhao, Zeang, Jiangtao Wu, Xiaoming Mu, Haosen Chen, H. Jerry Qi, and Daining
Fang, “Desolvation induced origami of photocurable polymers by digital light
processing.”, Macromolecular rapid communications, 38(13), 2017
[27] Zhao, Zeang, Jiangtao Wu, Xiaoming Mu, Haosen Chen, H. Jerry Qi, and Daining
Fang, "Origami by frontal photopolymerization." Science Advances, 3(4), 2017
[28] Seong KY, Seo MS, Hwang DY, O'Cearbhaill ED, Sreenan S, Karp JM, Yang SY,”
A self-adherent, bullet-shaped microneedle patch for controlled transdermal delivery of
insulin”, Journal of Controlled Release, 16, pp. 0168-3659, 2017
[29] Jintian Ling, Lelun Jiang, Keyun Chen, Chengfeng Pan, Yan Li, Wei Yuan, Liang,”
Insertion and Pull Behavior of Worker Honeybee Stinger”, Journal of Bionic Engineering,
13(2), pp. 303-311, 2016