2018 PREQIN GLOBAL NATURAL RESOURCES REPORT SAMPLE...
11
2018 PREQIN GLOBAL NATURAL RESOURCES REPORT SAMPLE PAGES ISBN: 978-1-912116-10-2 $175 / £125 / €150 www.preqin.com
Transcript of 2018 PREQIN GLOBAL NATURAL RESOURCES REPORT SAMPLE...
2018PREQIN GLOBALNATURAL RESOURCESREPORT
SAMPLE PAGES
ISBN: 978-1-912116-10-2$175 / £125 / €150www.preqin.com

© Preqin Ltd. 2018 / www.preqin.com2
2018 PREQIN GLOBAL NATURAL RESOURCES REPORT - SAMPLE PAGES
PREQIN’S NATURAL RESOURCES DATA
Preqin’s natural resources data has helped thousands of natural resources professionals raise capital, identify investment opportunities, develop new business and form new partnerships. Constantly updated by a team of dedicated analysts, this comprehensive resource provides the most up-to-date information on all areas of natural resources.
www.preqin.com/naturalresources
CEO’s Foreword - Mark O’Hare 3
1: 2018 PREQIN GLOBAL NATURAL RESOURCES REPORT
Keynote Address: Making it Real - Maximilian Tomei, Galena Asset Management
6
2: OVERVIEW OF THE NATURAL RESOURCES INDUSTRY
Natural Resources in Context 10
Natural Resources: 2017 in Numbers 12
Improving Sentiment and Capital Being Put to Work - Tom Carr, Preqin
13
3: ASSETS UNDER MANAGEMENT AND DRY POWDER
Assets under Management and Dry Powder 16
4: FUNDRAISING
The Evolving Energy Market - Brian DeFee, Capstone Partners
20
2017 Fundraising Market 22
Funds in Market 24
In Focus: Regional Fundraising 26
North American Fundraising 27
European Fundraising 28
Asian Fundraising 29
Rest of World Fundraising 30
Understanding and De-Risking Farmland Investment - Detlef Schoen, Insight Investment
32
In Focus: Fundraising by Primary Strategy 34
Agriculture/Farmland Fundraising 35
Energy Fundraising 36
Metals & Mining Fundraising 37
Timberland Fundraising 38
Debt Fundraising 39
5: FUND MANAGERS
Fund Manager Outlook for 2018 42
Fund Manager Views on Investor Appetite 46
First-Time Fund Managers 47
Largest Fund Managers 48
6: ALTERNATIVE STRUCTURES
Alternative Structures 52
7: PERFORMANCE
Performance Overview 56
8: INVESTORS
Evolution of the Investor Universe 60
Investor Appetite for Natural Resources in 2018 62
Sample Investors to Watch in 2018 65
How Investors Source and Select Funds 66
Largest Investors by Region 67
Largest Investors by Type 68
9: INVESTMENT CONSULTANTS
Investment Consultant Outlook for 2018 70
10: FUND TERMS AND CONDITIONS
Fund Terms and Conditions 74
Investor Attitudes towards Fund Terms and Conditions 76
11: SECONDARY MARKET
Overview of the Secondary Market 78
12: SERVICE PROVIDERS
Placement Agents 80
Fund Administrators and Fund Auditors 83
Law Firms 84
CONTENTS

© Preqin Ltd. 2018 / www.preqin.com12
NATURAL RESOURCES: 2017 IN NUMBERS
SIZE OF THE INDUSTRY FUNDRAISING SUCCESS
$70bnAggregate capital raised
by the 85 unlisted natural resources funds closed in
2017.
19 MonthsAverage time spent in market by unlisted natural resources
funds closed in 2017.
CAPITAL CONCENTRATION KEY ISSUES
$870mnAverage size of unlisted natural resources funds
closed in 2017.
61%of capital raised in 2017 was
secured by the 10 largest funds closed.
27%of investors surveyed
consider each of performance and commodity pricing as the
key issues for 2018.
40%of fund managers surveyed consider each of volatility
in global markets and commodity pricing as the key
issues for 2018.
PERFORMANCE INVESTOR SENTIMENT
129.8Index points of the PrEQIn
Natural Resources Index (as at June 2017, rebased to 100
as at December 2007).
11.7%Median net IRR of vintage
2014 funds, the highest among vintage years
2010-2014.
81%of investors plan to commit the same amount of capital
or more to natural resources in 2018 than in 2017.
22%of investors surveyed have a positive perception of the
asset class.
$533bnNatural resources assets under management as at
June 2017.
$181bnDry powder held by natural resources funds as at June
2017.
2018 PREQIN GLOBAL NATURAL RESOURCES REPORT - SAMPLE PAGES 2. OVERVIEW OF THE NATURAL RESOURCES INDUSTRY

13
IMPROVING SENTIMENT AND CAPITAL BEING PUT TO WORK
- Tom Carr, Preqin
Going into 2018 the natural resources asset class finds itself at a point of
inflection: AUM has continued to break records and fundraising in 2017 is the third highest annual total on record. However, for the first time in a number of years managers have successfully put significant amounts of capital to work, with dry powder falling in H1 2017 for the first time since December 2009.
In light of generally improving macroeconomic conditions, including commodity price stabilization, attitudes towards the asset class are looking up, with investors expecting performance to improve.
However, despite the positives there are areas of concern around the industry; while fundraising in 2017 was strong, the number of funds reaching a final close was the lowest since 2010. Those managers with positive track records experienced fundraising success, whereas newer or more niche managers found fundraising much more challenging. With new managers potentially able to bring diversity and innovation to the space, the development of this trend in 2018 will be important for the evolution of the asset class. Furthermore, the industry continues to be dominated by energy, with growth in other natural resources assets struggling to see much movement in terms of capital raised or AUM.
FUNDRAISING – “THE HAVES AND HAVE NOTS”The 85 funds that held a final close in 2017 secured an aggregate $70bn, the third highest amount of capital raised annually but the lowest number of funds to hold a final close since 2010. This shows a continuation of a trend towards capital being increasingly being concentrated among a small band of large managers at the top of the market, with investors continuing to place their faith in the deal sourcing abilities of experienced managers with a proven track record in the space.
For the continued growth of the asset class, growth in the industry outside of North American energy is vital. In 2017, funds focused on Europe secured record levels of capital, and Europe’s share of total capital raised globally rose significantly from 10% in 2016 to 23% in 2017, as investors looked to diversify their geographic exposure. In terms of strategy, energy continues to dominate, accounting for 88% of capital raised in 2017. Looking to 2018, however, we may potentially see something of a change, with investors increasingly bullish on strategies such as agriculture/farmland, which a quarter of investors told us is currently presenting the best opportunities for investment.
The fundraising environment in 2018 looks challenging, with 241 funds looking to secure an aggregate $124bn in capital. While this represents a drop from the 273 funds in market in January 2017, 49% of those currently in market are looking to raise their first fund in a market where experience and a track record are something investors are increasingly gravitating towards.
CAPITAL IN THE MARKETNatural resources AUM has been rising year on year, and as at June 2017 stands at a record $533bn. However, the real story for the asset class is dry powder falling in H1 2017 for the first time in the best part of a decade. Considering fundraising remained strong through H1, this illustrates that after several years of managers struggling to find attractive deals in a volatile macro environment, they have managed to deploy significant amounts of capital in H1 2017. Digging further into this we can discern that the mega funds that have dominated fundraising over recent years are the ones that have successfully put this capital to work – the natural resources space is certainly moving at the top of the market.
IMPROVING SENTIMENTAfter a few years of concerns over natural resources performance affecting
investor sentiment and therefore capital commitments, 2018 was a year of considerable progress. While 21% of investors interviewed at the end of 2017 told Preqin that their investments in natural resources had fallen short of expectations over the past year, this is a significant improvement from 54% of those questioned at the end of 2016. Furthermore, 18% said their investments had exceeded expectations in 2017.
Despite improving sentiment with respect to the asset class as a whole, investors continue to express concerns that managers looking to secure capital in 2018 need to be aware of and allay if they are to have a successful fundraise. Twenty-seven percent and 25% of investors respectively told us that key issues in the natural resources space are commodity pricing and volatility in global markets – two very much linked concerns. Investors are looking for fund managers to generate alpha, while at the same time mitigating as much as possible the potential downside of commodity price movements driven by a geopolitical environment that is mostly both uncontrollable and unpredictable.
OUTLOOK FOR 2018Despite a number of years of struggling performance driven by commodity price falls, natural resources remains an important part of investors’ alternative assets portfolios as they continue to seek diversifying assets that can deliver yield in a continued low interest rate environment.
For the asset class to continue to grow it is vital that managers are able to demonstrate that they can successfully deploy capital, as we started to see in H1 2017. That, coupled with a considerable number of funds on the road in 2018 and improving investor sentiment, indicates that 2018 will likely be another strong year for the natural resources asset class.
2018 PREQIN GLOBAL NATURAL RESOURCES REPORT - SAMPLE PAGES 2. OVERVIEW OF THE NATURAL RESOURCES INDUSTRY
© Preqin Ltd. 2018 / www.preqin.com32
2018 PREQIN GLOBAL NATURAL RESOURCES REPORT - SAMPLE PAGES
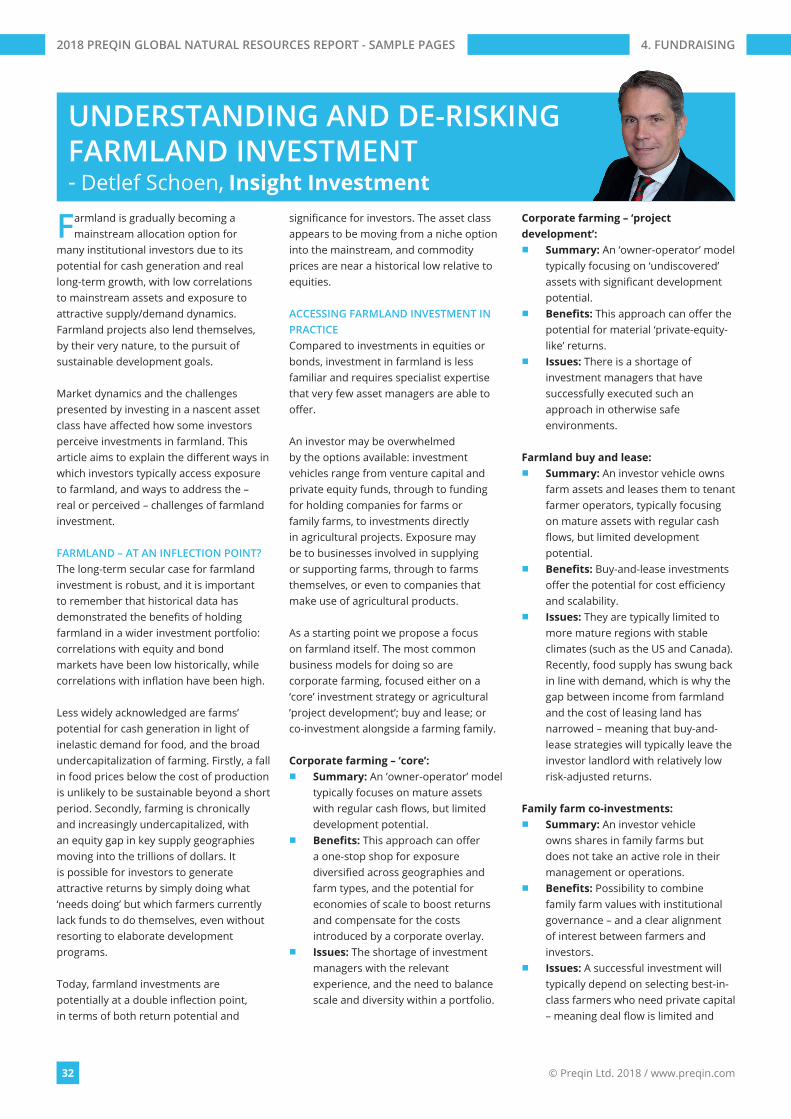
Farmland is gradually becoming a mainstream allocation option for
many institutional investors due to its potential for cash generation and real long-term growth, with low correlations to mainstream assets and exposure to attractive supply/demand dynamics. Farmland projects also lend themselves, by their very nature, to the pursuit of sustainable development goals.
Market dynamics and the challenges presented by investing in a nascent asset class have affected how some investors perceive investments in farmland. This article aims to explain the different ways in which investors typically access exposure to farmland, and ways to address the – real or perceived – challenges of farmland investment.
FARMLAND – AT AN INFLECTION POINT?The long-term secular case for farmland investment is robust, and it is important to remember that historical data has demonstrated the benefits of holding farmland in a wider investment portfolio: correlations with equity and bond markets have been low historically, while correlations with inflation have been high.
Less widely acknowledged are farms’ potential for cash generation in light of inelastic demand for food, and the broad undercapitalization of farming. Firstly, a fall in food prices below the cost of production is unlikely to be sustainable beyond a short period. Secondly, farming is chronically and increasingly undercapitalized, with an equity gap in key supply geographies moving into the trillions of dollars. It is possible for investors to generate attractive returns by simply doing what ‘needs doing’ but which farmers currently lack funds to do themselves, even without resorting to elaborate development programs.
Today, farmland investments are potentially at a double inflection point, in terms of both return potential and
significance for investors. The asset class appears to be moving from a niche option into the mainstream, and commodity prices are near a historical low relative to equities.
ACCESSING FARMLAND INVESTMENT IN PRACTICECompared to investments in equities or bonds, investment in farmland is less familiar and requires specialist expertise that very few asset managers are able to offer.
An investor may be overwhelmed by the options available: investment vehicles range from venture capital and private equity funds, through to funding for holding companies for farms or family farms, to investments directly in agricultural projects. Exposure may be to businesses involved in supplying or supporting farms, through to farms themselves, or even to companies that make use of agricultural products.
As a starting point we propose a focus on farmland itself. The most common business models for doing so are corporate farming, focused either on a ‘core’ investment strategy or agricultural ’project development’; buy and lease; or co-investment alongside a farming family.
Corporate farming – ‘core’: ■ Summary: An ’owner-operator’ model
typically focuses on mature assets with regular cash flows, but limited development potential.
■ Benefits: This approach can offer a one-stop shop for exposure diversified across geographies and farm types, and the potential for economies of scale to boost returns and compensate for the costs introduced by a corporate overlay.
■ Issues: The shortage of investment managers with the relevant experience, and the need to balance scale and diversity within a portfolio.
Corporate farming – ‘project development’:
■ Summary: An ‘owner-operator’ model typically focusing on ‘undiscovered’ assets with significant development potential.
■ Benefits: This approach can offer the potential for material ‘private-equity-like’ returns.
■ Issues: There is a shortage of investment managers that have successfully executed such an approach in otherwise safe environments.
Farmland buy and lease: ■ Summary: An investor vehicle owns
farm assets and leases them to tenant farmer operators, typically focusing on mature assets with regular cash flows, but limited development potential.
■ Benefits: Buy-and-lease investments offer the potential for cost efficiency and scalability.
■ Issues: They are typically limited to more mature regions with stable climates (such as the US and Canada). Recently, food supply has swung back in line with demand, which is why the gap between income from farmland and the cost of leasing land has narrowed – meaning that buy-and-lease strategies will typically leave the investor landlord with relatively low risk-adjusted returns.
Family farm co-investments: ■ Summary: An investor vehicle
owns shares in family farms but does not take an active role in their management or operations.
■ Benefits: Possibility to combine family farm values with institutional governance – and a clear alignment of interest between farmers and investors.
■ Issues: A successful investment will typically depend on selecting best-in-class farmers who need private capital – meaning deal flow is limited and
UNDERSTANDING AND DE-RISKING FARMLAND INVESTMENT - Detlef Schoen, Insight Investment
4. FUNDRAISING
4. FUNDRAISING
33
INSIGHT INVESTMENTOver many years Insight Farmland has built corporate farming expertise and strong institutional bridgeheads in key global agricultural geographies, with tried and tested people, processes and structures. As part of Insight Investment, a leading global asset manager, Insight Farmland benefits from the group’s superior infrastructure and systems, and with a team of seasoned veterans offers long-term investment solutions to clients seeking inflation protection, diversification away from the mainstream, a broad mix of assets with robust return expectations and the possibility of adding value through an appropriate ESG framework.
www.insightinvestment.com
investors may need to lock in capital for a long time. An element of project development may be necessary to compensate for the locking in of capital, potentially increasing the complexity and risks inherent within the investment.
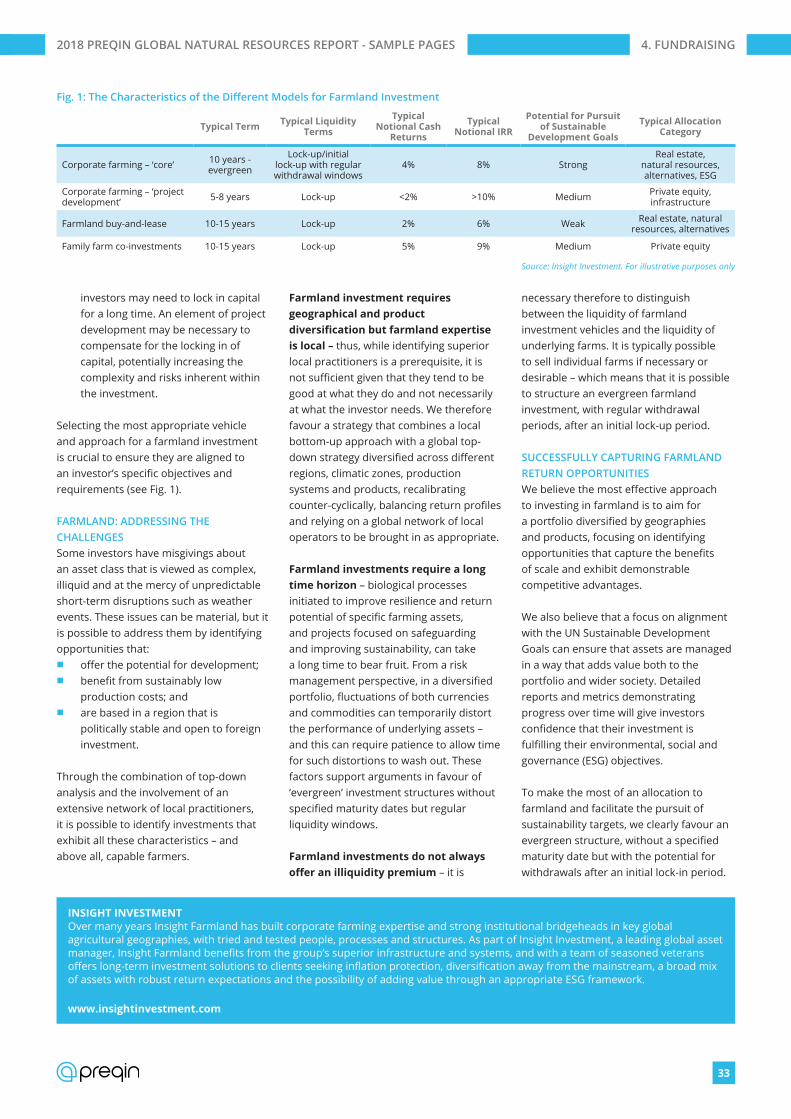
Selecting the most appropriate vehicle and approach for a farmland investment is crucial to ensure they are aligned to an investor’s specific objectives and requirements (see Fig. 1).
FARMLAND: ADDRESSING THE CHALLENGESSome investors have misgivings about an asset class that is viewed as complex, illiquid and at the mercy of unpredictable short-term disruptions such as weather events. These issues can be material, but it is possible to address them by identifying opportunities that:
■ offer the potential for development; ■ benefit from sustainably low
production costs; and ■ are based in a region that is
politically stable and open to foreign investment.
Through the combination of top-down analysis and the involvement of an extensive network of local practitioners, it is possible to identify investments that exhibit all these characteristics – and above all, capable farmers.
Farmland investment requires geographical and product diversification but farmland expertise is local – thus, while identifying superior local practitioners is a prerequisite, it is not sufficient given that they tend to be good at what they do and not necessarily at what the investor needs. We therefore favour a strategy that combines a local bottom-up approach with a global top-down strategy diversified across different regions, climatic zones, production systems and products, recalibrating counter-cyclically, balancing return profiles and relying on a global network of local operators to be brought in as appropriate.
Farmland investments require a long time horizon – biological processes initiated to improve resilience and return potential of specific farming assets, and projects focused on safeguarding and improving sustainability, can take a long time to bear fruit. From a risk management perspective, in a diversified portfolio, fluctuations of both currencies and commodities can temporarily distort the performance of underlying assets – and this can require patience to allow time for such distortions to wash out. These factors support arguments in favour of ‘evergreen’ investment structures without specified maturity dates but regular liquidity windows.
Farmland investments do not always offer an illiquidity premium – it is
necessary therefore to distinguish between the liquidity of farmland investment vehicles and the liquidity of underlying farms. It is typically possible to sell individual farms if necessary or desirable – which means that it is possible to structure an evergreen farmland investment, with regular withdrawal periods, after an initial lock-up period.
SUCCESSFULLY CAPTURING FARMLAND RETURN OPPORTUNITIESWe believe the most effective approach to investing in farmland is to aim for a portfolio diversified by geographies and products, focusing on identifying opportunities that capture the benefits of scale and exhibit demonstrable competitive advantages.
We also believe that a focus on alignment with the UN Sustainable Development Goals can ensure that assets are managed in a way that adds value both to the portfolio and wider society. Detailed reports and metrics demonstrating progress over time will give investors confidence that their investment is fulfilling their environmental, social and governance (ESG) objectives.
To make the most of an allocation to farmland and facilitate the pursuit of sustainability targets, we clearly favour an evergreen structure, without a specified maturity date but with the potential for withdrawals after an initial lock-in period.
Fig. 1: The Characteristics of the Different Models for Farmland Investment
Typical Term Typical Liquidity Terms
Typical Notional Cash
Returns
Typical Notional IRR
Potential for Pursuit of Sustainable
Development Goals
Typical Allocation Category
Corporate farming – ‘core’ 10 years - evergreen
Lock-up/initial lock-up with regular withdrawal windows
4% 8% StrongReal estate,
natural resources, alternatives, ESG
Corporate farming – ‘project development’ 5-8 years Lock-up <2% >10% Medium Private equity,
infrastructure
Farmland buy-and-lease 10-15 years Lock-up 2% 6% Weak Real estate, natural resources, alternatives
Family farm co-investments 10-15 years Lock-up 5% 9% Medium Private equity
Source: Insight Investment. For illustrative purposes only
2018 PREQIN GLOBAL NATURAL RESOURCES REPORT - SAMPLE PAGES
4. FUNDRAISING
35
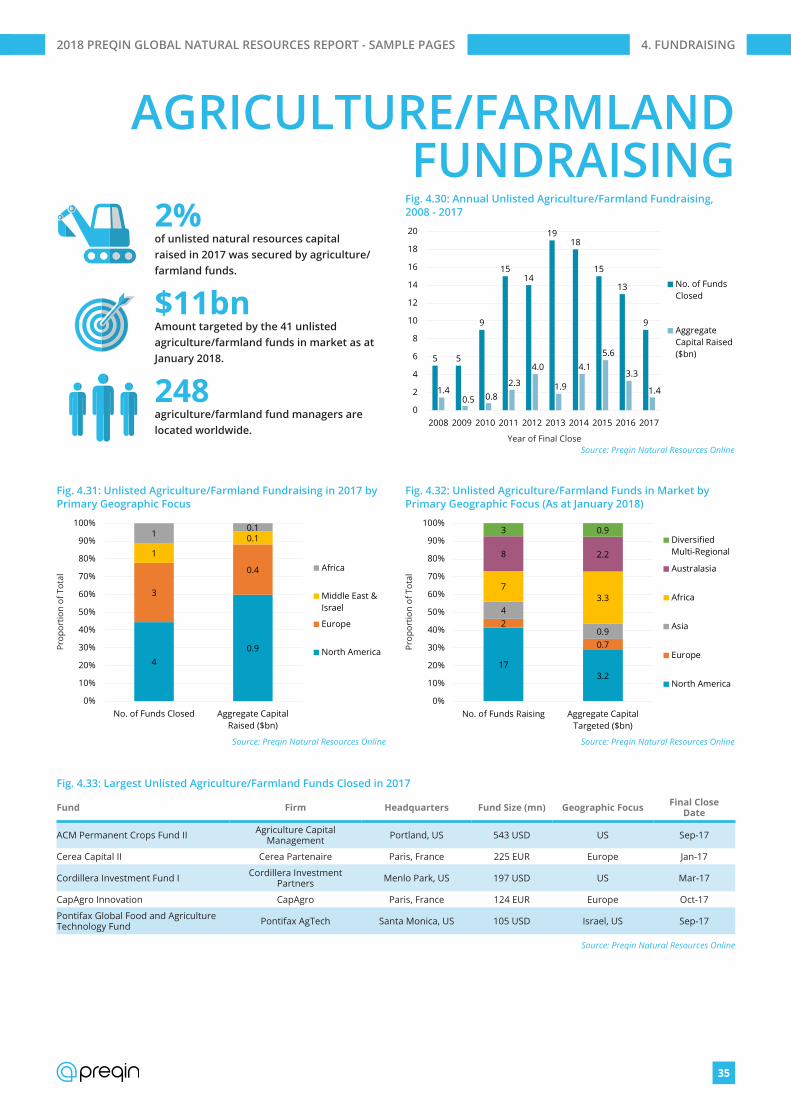
AGRICULTURE/FARMLAND FUNDRAISING
5 5
9
1514
1918
15
13
9
1.40.5 0.8
2.3
4.0
1.9
4.15.6
3.3
1.4
0
2
4
6
8
10
12
14
16
18
20
2008 2009 2010 2011 2012 2013 2014 2015 2016 2017
No. of FundsClosed
AggregateCapital Raised($bn)
Source: Preqin Natural Resources OnlineYear of Final Close
Fig. 4.30: Annual Unlisted Agriculture/Farmland Fundraising, 2008 - 2017
40.9
3
0.4
1
0.110.1
0%
10%
20%
30%
40%
50%
60%
70%
80%
90%
100%
No. of Funds Closed Aggregate CapitalRaised ($bn)
Africa
Middle East &Israel
Europe
North America
Source: Preqin Natural Resources Online
Prop
ortio
n of
Tot
al
Fig. 4.31: Unlisted Agriculture/Farmland Fundraising in 2017 by Primary Geographic Focus
173.2
2
0.7
4
0.9
73.3
8 2.2
3 0.9
0%
10%
20%
30%
40%
50%
60%
70%
80%
90%
100%
No. of Funds Raising Aggregate CapitalTargeted ($bn)
DiversifiedMulti-Regional
Australasia
Africa
Asia
Europe
North America
Source: Preqin Natural Resources Online
Prop
ortio
n of
Tot
al
Fig. 4.32: Unlisted Agriculture/Farmland Funds in Market by Primary Geographic Focus (As at January 2018)
2%of unlisted natural resources capital raised in 2017 was secured by agriculture/farmland funds.
$11bnAmount targeted by the 41 unlisted agriculture/farmland funds in market as at January 2018.
248agriculture/farmland fund managers are located worldwide.
Fig. 4.33: Largest Unlisted Agriculture/Farmland Funds Closed in 2017
Fund Firm Headquarters Fund Size (mn) Geographic Focus Final Close Date
ACM Permanent Crops Fund II Agriculture Capital Management Portland, US 543 USD US Sep-17
Cerea Capital II Cerea Partenaire Paris, France 225 EUR Europe Jan-17
Cordillera Investment Fund I Cordillera Investment Partners Menlo Park, US 197 USD US Mar-17
CapAgro Innovation CapAgro Paris, France 124 EUR Europe Oct-17
Pontifax Global Food and Agriculture Technology Fund Pontifax AgTech Santa Monica, US 105 USD Israel, US Sep-17
Source: Preqin Natural Resources Online
2018 PREQIN GLOBAL NATURAL RESOURCES REPORT - SAMPLE PAGES

© Preqin Ltd. 2018 / www.preqin.com56
2018 PREQIN GLOBAL NATURAL RESOURCES REPORT - SAMPLE PAGES
PERFORMANCE OVERVIEW
Although the natural resources industry has faced numerous challenges over
recent years, it appears poised for future growth, with AUM (the combination of dry powder and unrealized value) standing at a record $533bn as at June 2017. Given the growth of the asset class in recent years, and the strong performance of top-quartile funds (Fig. 7.1), it is becoming increasingly important for investors to have access to comprehensive, up-to-date data to conduct extensive due diligence. For fund managers, fund-level performance data and benchmarking capabilities are important to understand the competition and assess industry trends. Preqin holds net-to-LP performance data for more than 540 named unlisted natural resources funds.
NET IRRsFig. 7.2 shows the median net IRRs for natural resources funds compared to buyout, venture capital and infrastructure funds for vintage years 2004-2014. Natural resources funds have largely underperformed other strategies across the vintage range shown, with only three vintage years (2004, 2005 and 2008) in which the asset class is not the weakest performing of the strategies examined. The effects of the Global Financial Crisis-induced drop in commodity prices during 2009 are apparent, with the largest deficit
in comparison to the other private capital strategies occurring for vintage 2009, 2011 and 2012 funds.
Following the decrease in commodities pricing in 2009, returns have been increasingly varied (Fig. 7.3), suggesting the current natural resources landscape contains fewer low-risk opportunities. Except for 2013 and 2014 vintage funds, which are still very early on in their fund lifecycles, the standard deviation of 2009 vintage fund net IRRs is the greatest. This measure of risk remains relatively
high for the vintage years that followed, showing the potential for outsized returns when selecting the right funds, but also indicating that there have been poor performing funds.
PrEQIn INDEXThe PrEQIn Natural Resources Index captures the average returns earned by investors in their natural resources portfolios, based on the actual amount of money invested in natural resources partnerships (i.e. weighted by the size of each fund, and reflecting the timing of
-10%
0%
10%
20%
30%
40%
50%
2010 2011 2012 2013 2014
Top Quartile IRRBoundary
Median Net IRR
Bottom QuartileIRR Boundary
Source: Preqin Natural Resources Online
Net
IRR
sinc
e In
cept
ion
Vintage Year
Fig. 7.1: Unlisted Natural Resources - Median Net IRRs and Quartile Boundaries by Vintage Year (As at June 2017)
0%
5%
10%
15%
20%
25%
2004
2005
2006
2007
2008
2009
2010
2011
2012
2013
2014
NaturalResources
Buyout
Venture Capital
Infrastructure
Source: Preqin Natural Resources Online
Net
IRR
sinc
e in
cept
ion
Vintage Year
Fig. 7.2: Median Net IRRs by Vintage Year: Natural Resources vs. Other Private Capital Strategies (As at June 2017)
0%
5%
10%
15%
20%
25%
2004
2005
2006
2007
2008
2009
2010
2011
2012
2013
2014
StandardDeviation ofNet IRR
Median NetIRR
Source: Preqin Natural Resources OnlineVintage Year
Fig. 7.3: Unlisted Natural Resources - Risk/Return by Vintage Year
7. PERFORMANCE
© Preqin Ltd. 2018 / www.preqin.com62
2018 PREQIN GLOBAL NATURAL RESOURCES REPORT - SAMPLE PAGES
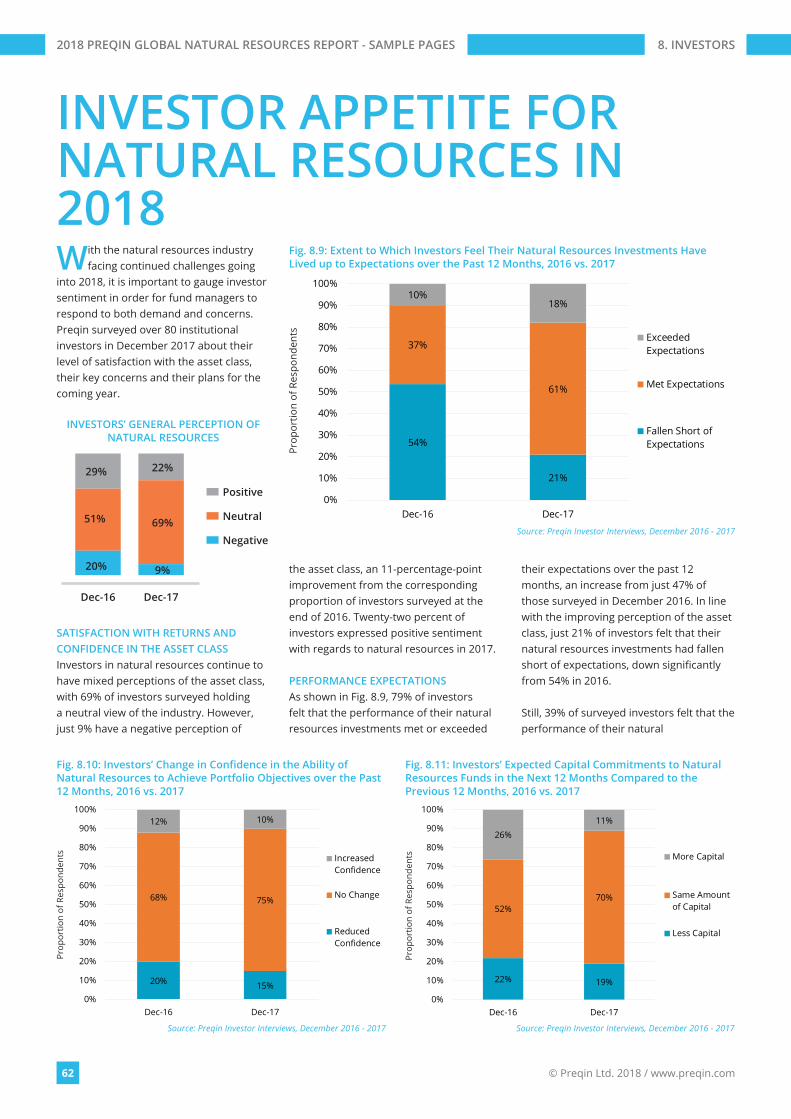
INVESTOR APPETITE FOR NATURAL RESOURCES IN 2018With the natural resources industry
facing continued challenges going into 2018, it is important to gauge investor sentiment in order for fund managers to respond to both demand and concerns. Preqin surveyed over 80 institutional investors in December 2017 about their level of satisfaction with the asset class, their key concerns and their plans for the coming year.
SATISFACTION WITH RETURNS AND CONFIDENCE IN THE ASSET CLASSInvestors in natural resources continue to have mixed perceptions of the asset class, with 69% of investors surveyed holding a neutral view of the industry. However, just 9% have a negative perception of
the asset class, an 11-percentage-point improvement from the corresponding proportion of investors surveyed at the end of 2016. Twenty-two percent of investors expressed positive sentiment with regards to natural resources in 2017.
PERFORMANCE EXPECTATIONSAs shown in Fig. 8.9, 79% of investors felt that the performance of their natural resources investments met or exceeded
their expectations over the past 12 months, an increase from just 47% of those surveyed in December 2016. In line with the improving perception of the asset class, just 21% of investors felt that their natural resources investments had fallen short of expectations, down significantly from 54% in 2016.
Still, 39% of surveyed investors felt that the performance of their natural
54%
21%
37%
61%
10%18%
0%
10%
20%
30%
40%
50%
60%
70%
80%
90%
100%
Dec-16 Dec-17
ExceededExpectations
Met Expectations
Fallen Short ofExpectations
Source: Preqin Investor Interviews, December 2016 - 2017
Prop
ortio
n of
Res
pond
ents
Fig. 8.9: Extent to Which Investors Feel Their Natural Resources Investments Have Lived up to Expectations over the Past 12 Months, 2016 vs. 2017
20% 15%
68% 75%
12% 10%
0%
10%
20%
30%
40%
50%
60%
70%
80%
90%
100%
Dec-16 Dec-17
IncreasedConfidence
No Change
ReducedConfidence
Source: Preqin Investor Interviews, December 2016 - 2017
Prop
ortio
n of
Res
pond
ents
Fig. 8.10: Investors’ Change in Confidence in the Ability of Natural Resources to Achieve Portfolio Objectives over the Past 12 Months, 2016 vs. 2017
22% 19%
52%70%
26%11%
0%
10%
20%
30%
40%
50%
60%
70%
80%
90%
100%
Dec-16 Dec-17
More Capital
Same Amountof Capital
Less Capital
Source: Preqin Investor Interviews, December 2016 - 2017
Prop
ortio
n of
Res
pond
ents
Fig. 8.11: Investors’ Expected Capital Commitments to Natural Resources Funds in the Next 12 Months Compared to the Previous 12 Months, 2016 vs. 2017
INVESTORS’ GENERAL PERCEPTION OF NATURAL RESOURCES
20%
51%
29%
9%
69%
22%
Dec-16 Dec-17
Positive
Neutral
Negative
8. INVESTORS

© Preqin Ltd. 2018 / www.preqin.com66
2018 PREQIN GLOBAL NATURAL RESOURCES REPORT - SAMPLE PAGES
HOW INVESTORS SOURCE AND SELECT FUNDSIn our December 2017 interviews with over 80 institutional investors, 18% revealed that they found it more difficult to identify attractive
natural resources fund opportunities in 2017 than in 2016, and 76% saw no change. With this in mind, we examine in more detail the processes that investors use to source and screen funds.
KEY STATS: AVERAGE SCREENING PROCESS FOR NATURAL RESOURCES FUNDS
MARKETING MATERIALS FAIL TO MEET THE NEEDS OF 36% OF INVESTORS – WHY?
Insufficient information on track record
Insufficient information on investment strategy
Insufficient information on fees/fund terms
Insufficient information on team
Past performance data not following appropriate reporting guidelines
48%
41%
28%
17%
17%
241Natural Resources
Funds in Market
Investors Screen
185Funds Each Year
Less than
9of These Funds Reach Second-
RoundScreening
Investors Commit to
1-2Funds Each
Year
METHODS USED BY INVESTORS TO SOURCE FUNDS: ■ Only internal sourcing (29%) ■ Mainly internal or consultant
recommendations, with some external approaches (18%)
■ Mix of internal and external recommendations (45%)
KEY REASONS FOR REJECTING A GP:
88 Lack of team track record (55%)
88 Lack of firm track record (45%)
88 Unfavourable fees/fund terms (45%)
MOST IMPORTANT FACTORS INVESTORS ASSESS
WHEN SELECTING NEW FUNDS:
89 Team track record (61%)
89 Team strategy experience (58%)
89 Firm track record (55%)
8. INVESTORS

The 2018 Preqin Global Alternatives Reports are the most detailed and comprehensive reviews of the alternative assets industry available, offering exclusive insight into the latest developments in the private equity, hedge fund, real estate, infrastructure, private debt and natural resources asset classes.
■ Access in-depth analysis and comprehensive statistics, helping you to understand the latest trends in fundraising, performance, investors, deals, fund managers, secondaries, fund terms, placement agents, consultants, law firms and much more.
■ View historical data alongside the most important industry developments. Read contributions from some of the industry’s leading figures.
■ Improve your presentations, marketing materials and company reports. ■ Discover the most important players in every area of the industry. ■ Answer key questions: Who is investing? How much has been raised? Where are the centres of
activity? Where is the capital going? What are the biggest deals? What is the outlook for the industry?
2018 PREQIN GLOBAL ALTERNATIVES REPORTS
For more information visit: www.preqin.com/reports
PAYMENT DETAILS: SHIPPING DETAILS:
Cheque enclosed (cheque payable to ‘Preqin’) Name:________________________________
Telephone:________________________________
Charge my: Visa Firm:________________________________
Email:________________________________
Mastercard Job Title:________________________________
Amex Address:________________________________
Please invoice me ________________________________
Currency: USD GBP EUR ________________________________
Card Number:________________________________
City:________________________________
Name on Card:________________________________
State:________________________________
Expiration Date:________________________________
Post/Zip:________________________________
Security Code:________________________________
Country:________________________________
COMPLETED ORDER FORMSPost (to Preqin):
NEW YORKOne Grand Central Place60 E 42nd StreetSuite 630New YorkNY 10165Tel: +1 212 350 0100Fax: +1 440 445 9595
LONDON3rd FloorVintners’ Place68 Upper Thames StreetLondonEC4V 3BJTel: +44 (0)20 3207 0200Fax: +44 (0)870 330 5892
SINGAPOREOne Finlayson Green#11-02Singapore049246
Tel: +65 6305 2200Fax: +65 6491 2240
SAN FRANCISCOOne Embarcadero CenterSuite 2850San FranciscoCA 94111
Tel: +1 415 316 0580 Fax: +1 440 445 9595
HONG KONGLevel 9, Central Building1-3 Pedder StreetCentral, Hong Kong
Tel: +852 3892 0200
American Express, four-digit code printed on the front of the card.
Visa and Mastercard, last three digits printed on the signature strip.
2018PREQIN GLOBALREAL ESTATEREPORT
ISBN: 978-1-907012-97-6$175 / £125 / €150www.preqin.com
2018PREQIN GLOBALINFRASTRUCTUREREPORT
ISBN: 978-1-907012-97-6$175 / £125 / €150www.preqin.com
2018PREQIN GLOBALPRIVATE DEBTREPORT
ISBN: 978-1-907012-97-6$175 / £125 / €150www.preqin.com
2018PREQIN GLOBALNATURAL RESOURCESREPORT
ISBN: 978-1-907012-97-6$175 / £125 / €150www.preqin.com
2018PREQIN GLOBALHEDGE FUNDREPORT
ISBN: 978-1-907012-97-6$175 / £125 / €150www.preqin.com
2018PREQIN GLOBALPRIVATE EQUITY &VENTURE CAPITALREPORT
ISBN: 978-1-907012-97-6$175 / £125 / €150www.preqin.com
I would like to purchase:
PRINTName First Copy Each Additional Copy Quantity Data Pack* 9Private Equity & Venture Capital $175/£125/€150 $90/£65/€75 $300/£215/€260
Hedge Funds $175/£125/€150 $90/£65/€75 $300/£215/€260
Real Estate $175/£125/€150 $90/£65/€75 $300/£215/€260
Infrastructure $175/£125/€150 $90/£65/€75 $300/£215/€260
Private Debt $175/£125/€150 $90/£65/€75 $300/£215/€260
Natural Resources $175/£125/€150 $90/£65/€75 $300/£215/€260
All Six Titles (25% Saving!) $785/£560/€675 $395/£280/€340 $1,350/£965/€1,160
Shipping Costs: $40/£10/€25 for single publication $20/£5/€12 for additional copies
(Shipping costs will not exceed a maximum of $60/£15/€37 per order when all shipped to same address. If shipped to multiple addresses then full postage rates apply for additional copies.)
If you would like to order more than 10 copies of one title, please contact us for a special rate
DIGITALName Single-User Licence Each Additional Copy Quantity Enterprise Licence** 9 Data Pack* 9Private Equity & Venture Capital $175/£125/€150 $90/£65/€75 $1,000/£715/€860 $300/£215/€260
Hedge Funds $175/£125/€150 $90/£65/€75 $1,000/£715/€860 $300/£215/€260
Real Estate $175/£125/€150 $90/£65/€75 $1,000/£715/€860 $300/£215/€260
Infrastructure $175/£125/€150 $90/£65/€75 $1,000/£715/€860 $300/£215/€260
Private Debt $175/£125/€150 $90/£65/€75 $1,000/£715/€860 $300/£215/€260
Natural Resources $175/£125/€150 $90/£65/€75 $1,000/£715/€860 $300/£215/€260
All Six Titles (25% Saving!) $785/£560/€675 $395/£280/€340 $4,500/£3,215/€3,860 $1,350/£965/€1,160
*Data packs feature all the chart and league table data in an Excel file. Must be purchased alongside the associated report.**Enterprise Licence allows for team-wide digital access.Please note all prices quoted throughout are exclusive of sales taxes.