2018 Edelman Trust Barometer 2018 Edelman Trust Barometer: Special Report: Brands and Social Media....
45
DO NOT DISTRIBUTE Analysis / narrative / design in progress DATA NOT FACT CHECKED #TrustBarometer 2018 Edelman Trust Barometer 1 Special Report: Brands and Social Media
Transcript of 2018 Edelman Trust Barometer 2018 Edelman Trust Barometer: Special Report: Brands and Social Media....
DO NOT DISTRIBUTE
Analysis / narrative / design in progress
DATA NOT FACT CHECKED
#TrustBarometer
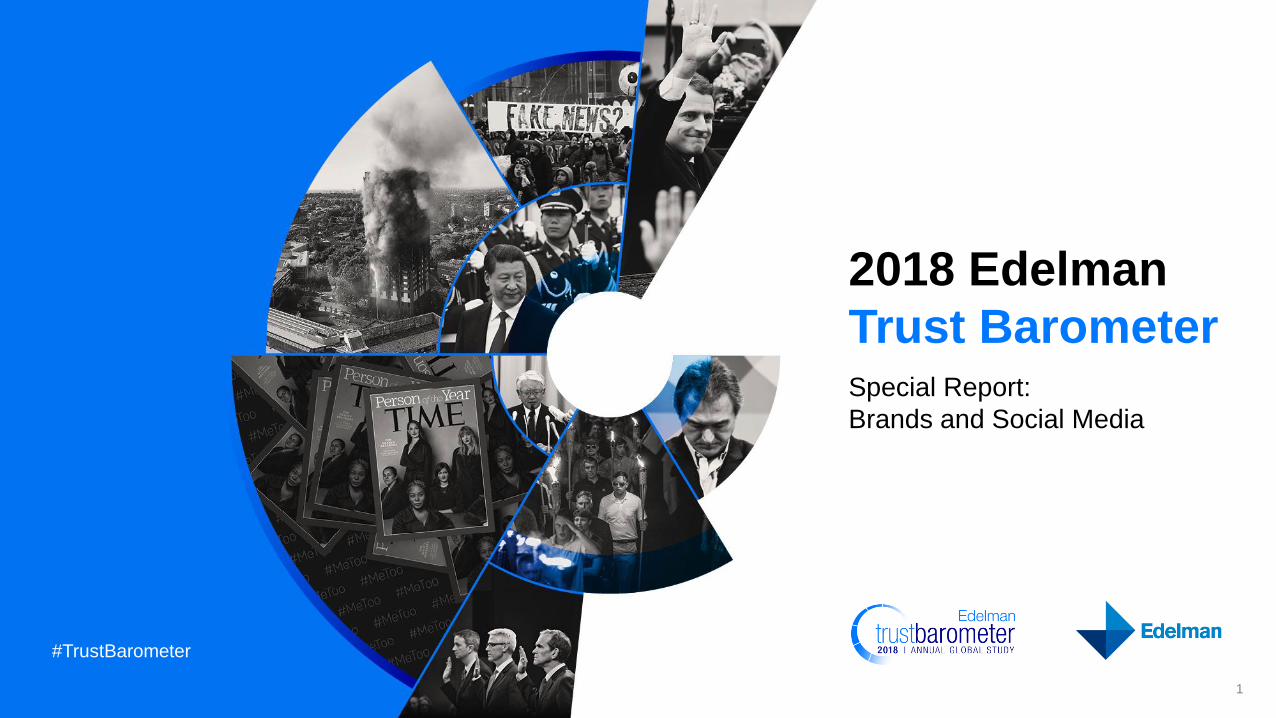
2018 Edelman
Trust Barometer
1
Special Report:
Brands and Social Media
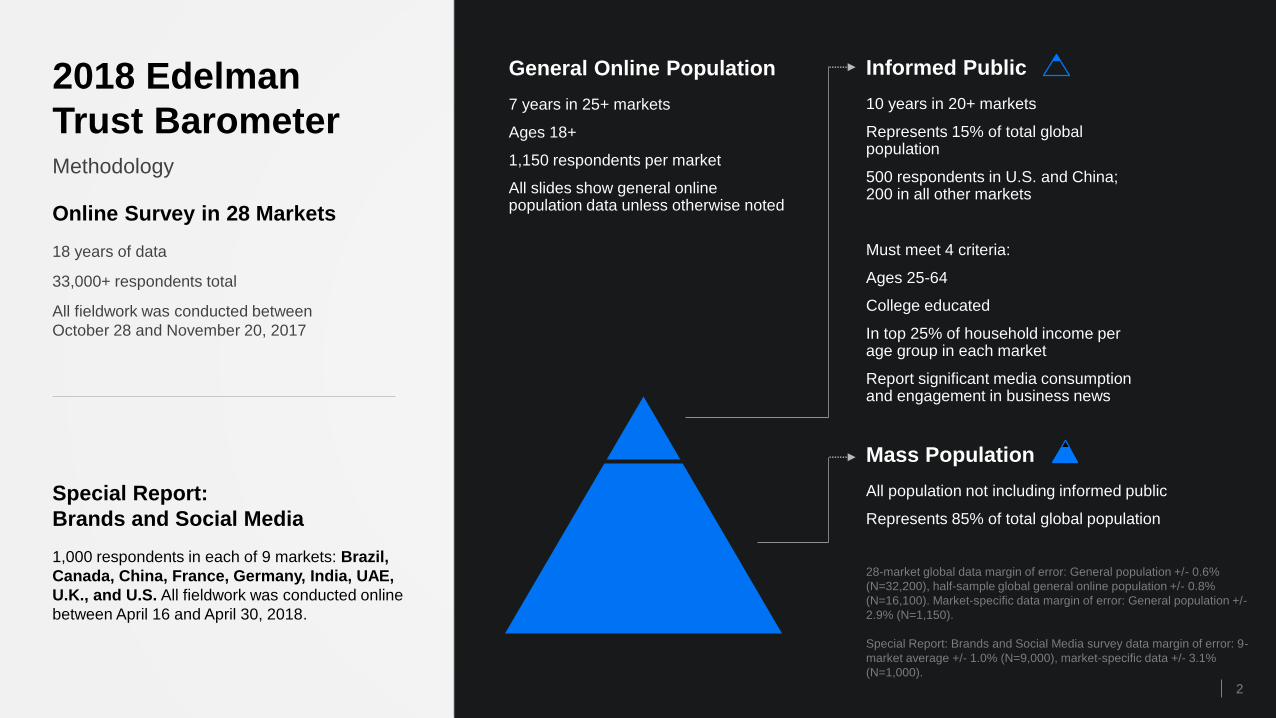
Online Survey in 28 Markets
18 years of data
33,000+ respondents total
All fieldwork was conducted between
October 28 and November 20, 2017
2
Methodology
2018 Edelman
Trust Barometer
General Online Population
7 years in 25+ markets
Ages 18+
1,150 respondents per market
All slides show general online population data unless otherwise noted
Mass Population
All population not including informed public
Represents 85% of total global population
Informed Public
10 years in 20+ markets
Represents 15% of total global population
500 respondents in U.S. and China; 200 in all other markets
Must meet 4 criteria:
Ages 25-64
College educated
In top 25% of household income per age group in each market
Report significant media consumption and engagement in business news
28-market global data margin of error: General population +/- 0.6%
(N=32,200), half-sample global general online population +/- 0.8%
(N=16,100). Market-specific data margin of error: General population +/-
2.9% (N=1,150).
Special Report: Brands and Social Media survey data margin of error: 9-
market average +/- 1.0% (N=9,000), market-specific data +/- 3.1%
(N=1,000).
Special Report:
Brands and Social Media
1,000 respondents in each of 9 markets: Brazil,
Canada, China, France, Germany, India, UAE,
U.K., and U.S. All fieldwork was conducted online
between April 16 and April 30, 2018.
43
30 31 32 32 32 33 33 34 35 3539 40 42 42 43 43 43 44 45 47 48 49
5255 56
61
6871
Glo
ba
l 2
8
Turk
ey
Au
str
alia
Ja
pa
n
Sw
ede
n
U.K
.
Fra
nce
Ire
land
Po
land
Ru
ssia
S. A
fric
a
Arg
en
tin
a
S. K
ore
a
Ge
rma
ny
U.S
.
Bra
zil
Colo
mbia
Ho
ng
Ko
ng
Sp
ain
Ita
ly
Ma
laysia
Me
xic
o
Ca
na
da
Sin
ga
po
re
The
Ne
therla
nd
s
UA
E
India
Indo
ne
sia
Ch
ina
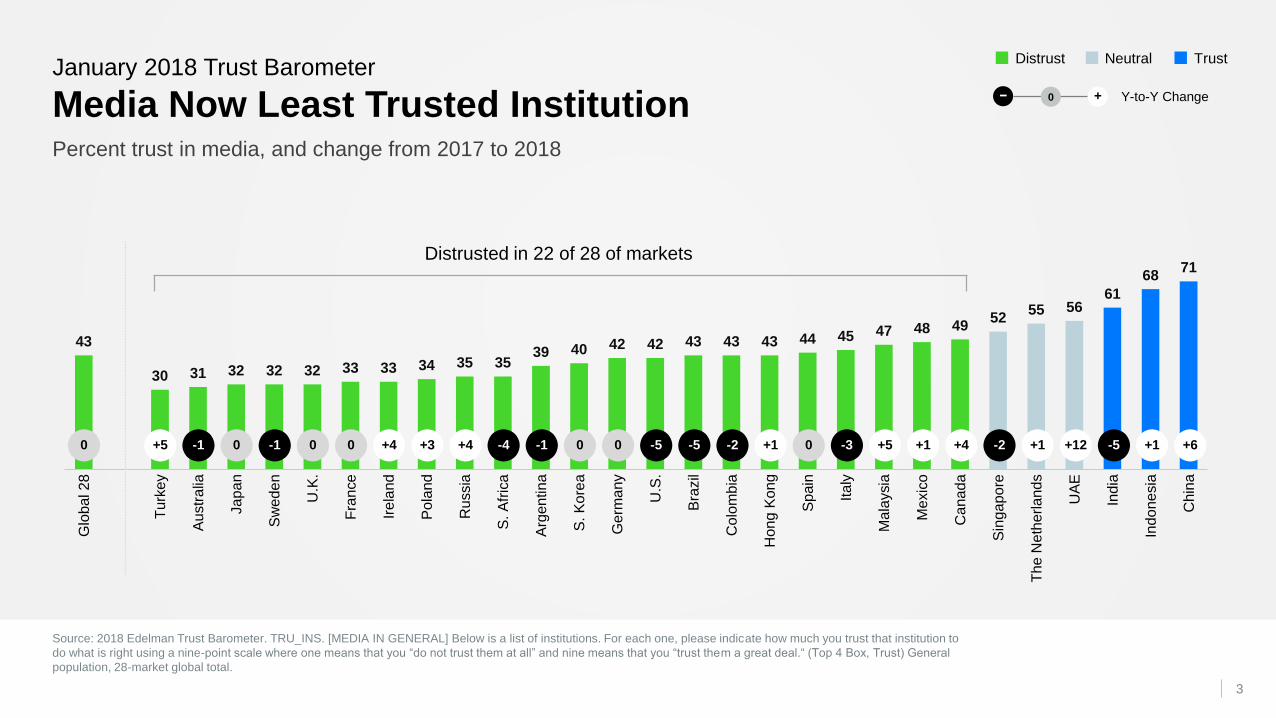
Source: 2018 Edelman Trust Barometer. TRU_INS. [MEDIA IN GENERAL] Below is a list of institutions. For each one, please indicate how much you trust that institution to
do what is right using a nine-point scale where one means that you “do not trust them at all” and nine means that you “trust them a great deal.“ (Top 4 Box, Trust) General
population, 28-market global total.
3
Percent trust in media, and change from 2017 to 2018
January 2018 Trust Barometer
Media Now Least Trusted Institution
TrustNeutralDistrust
Distrusted in 22 of 28 of markets
l llllllllllllllllllllllllllll0 +5 -1 0 -1 0 0 +4 +3 +4 -4 -1 0 0 -5 -5 -2 +1 0 -3 +5 +1 +4 -2 +1 +12 -5 +1 +6
Y-to-Y Change− +0

24 25 27 28 30
52 5562 63
U.K
.
Fra
nce
Ge
rma
ny
Ca
na
da
U.S
.
Bra
zil
UA
E
Ch
ina
India
4752 54 54 57
6874 76
83
U.K
.
Ge
rma
ny
Fra
nce
U.S
.
Ca
na
da
UA
E
Ch
ina
Bra
zil
India
58 61 61 62 6368 69
7580
U.S
.
Fra
nce
U.K
.
Bra
zil
UA
E
Ge
rma
ny
Ca
na
da
India
Ch
ina
Source: 2018 Edelman Trust Barometer. COM_MCL. When looking for general news and information, how much would you trust each type of source for general news and
information? Please use a nine-point scale where one means that you “do not trust it at all” and nine means that you “trust it a great deal.” (Top 4 Box, Trust), question
asked of half of the sample. General population, 9-market average.
4
Percent trust in traditional media, search engines and social media platforms,
and change from 2017 to 2018
January 2018 Trust Barometer
Traditional Media, Search Trusted; Social Media Not
lllllllll-2 -1 -4 -1 -11 -3 +8 +4 -6lllllllll+2 +15 +13 -3 +9 +9 +11 -4 +4
TrustNeutralDistrust
Y-to-Y Change− +0
Traditional Media Search Engines Social Media
lllllllll-7 -4 -5 -11 -1 +4 +8 -7 -4
66%
Global
63%
Global
41%
Global

5
At Risk: The Bond Between
People and Brands
5

Source: 2018 Edelman Trust Barometer: Special Report: Brands and Social Media. Q14. Which of the following do you consider to be among the best and most effective
ways for brands to be using social media to reach people like you? General population, 9-market average, among social media users.
6
Percent who say the following are among the best and most effective ways for brands to
be using social media to reach people like them
Social Media at
the Heart of Today’s Consumer Relationship
43
44
45
51
60
Communicate their purpose and values
Give people the opportunity to interact with a brand directly
Advertise their products
Introduce new products
Deliver customer service
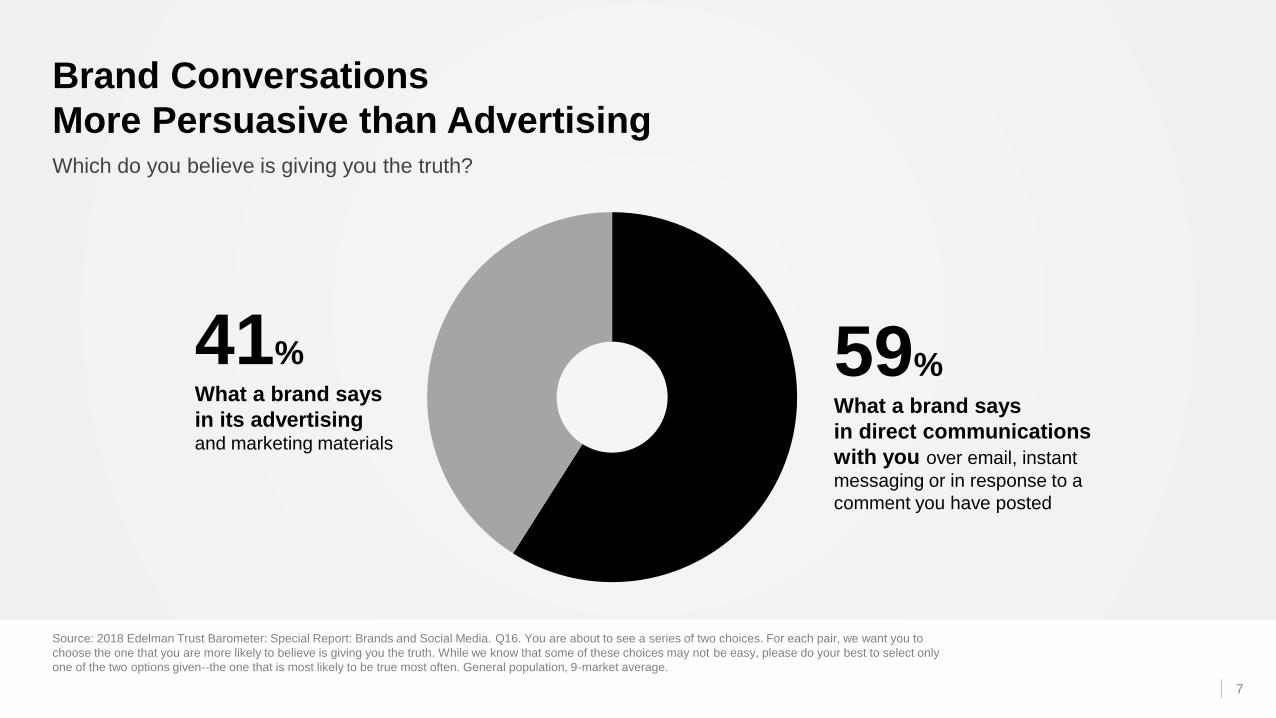
Source: 2018 Edelman Trust Barometer: Special Report: Brands and Social Media. Q16. You are about to see a series of two choices. For each pair, we want you to
choose the one that you are more likely to believe is giving you the truth. While we know that some of these choices may not be easy, please do your best to select only
one of the two options given--the one that is most likely to be true most often. General population, 9-market average.
7
Which do you believe is giving you the truth?
Brand Conversations
More Persuasive than Advertising
59%What a brand says
in direct communications
with you over email, instant
messaging or in response to a
comment you have posted
41%What a brand says
in its advertising and marketing materials
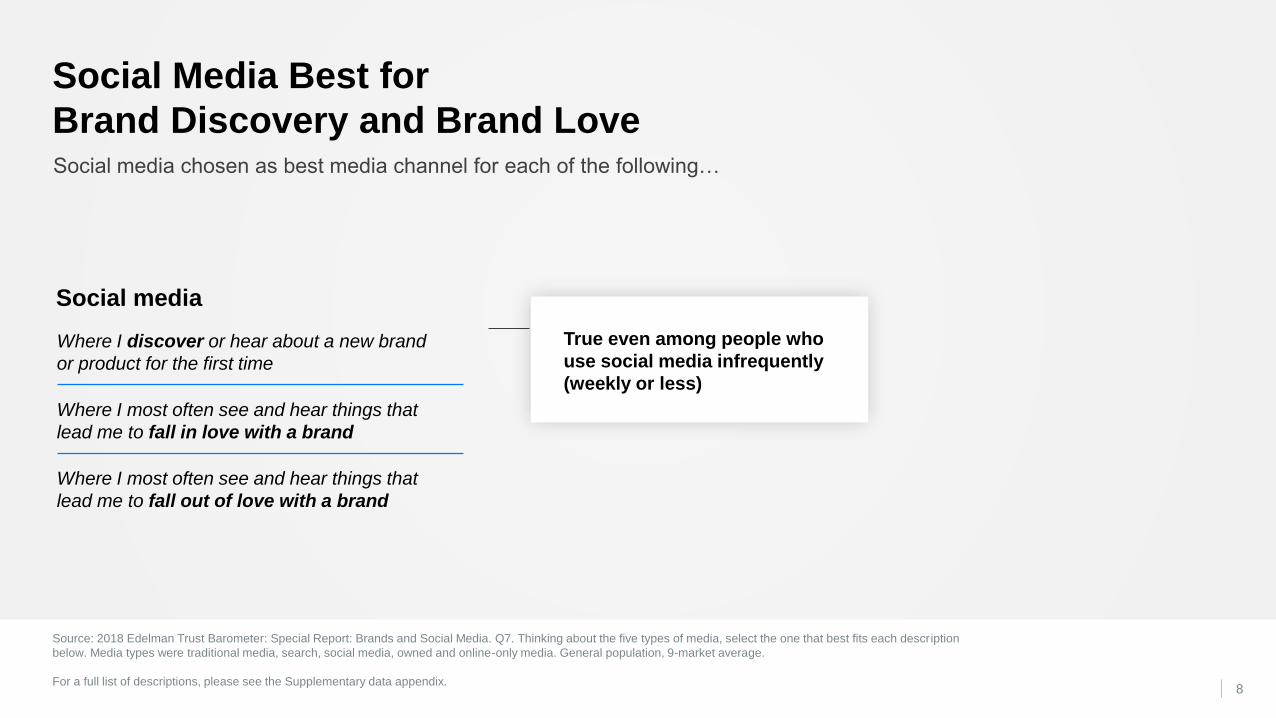
Source: 2018 Edelman Trust Barometer: Special Report: Brands and Social Media. Q7. Thinking about the five types of media, select the one that best fits each description
below. Media types were traditional media, search, social media, owned and online-only media. General population, 9-market average.
For a full list of descriptions, please see the Supplementary data appendix.8
Social media chosen as best media channel for each of the following…
Social Media Best for
Brand Discovery and Brand Love
True even among people who
use social media infrequently
(weekly or less)
Social media
Where I discover or hear about a new brand
or product for the first time
Where I most often see and hear things that
lead me to fall in love with a brand
Where I most often see and hear things that
lead me to fall out of love with a brand
50%
Source: 2018 Edelman Trust Barometer: Special Report: Brands and Social Media. Q13. Below is a list of statements. For each one, please rate how much you agree or
disagree with that statement using a 9-point scale where one means “strongly disagree” and nine means “strongly agree”. (Top 4 Box, Agree). General population, 9-
market average, and by age.
9
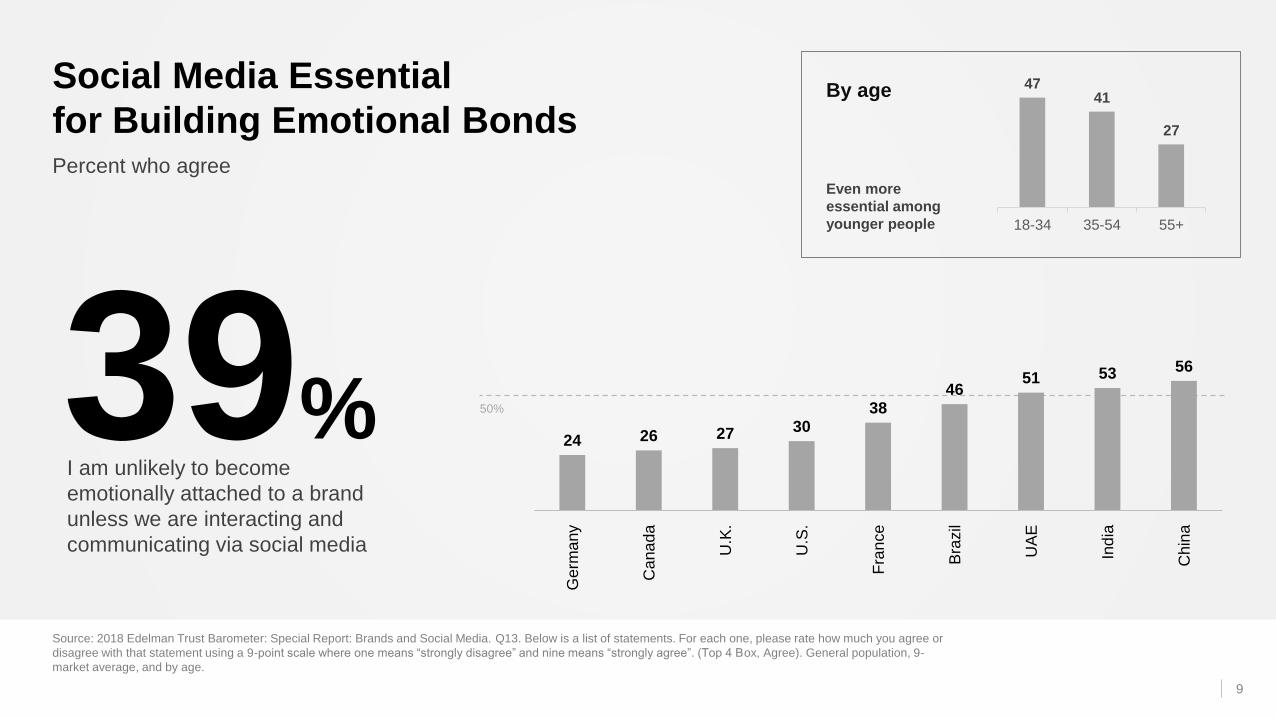
Percent who agree
Social Media Essential
for Building Emotional Bonds
24 26 27 3038
4651 53 56
Germ
any
Cana
da
U.K
.
U.S
.
Fra
nce
Bra
zil
UA
E
Ind
ia
Ch
ina
I am unlikely to become
emotionally attached to a brand
unless we are interacting and
communicating via social media
39%
4741
27
18-34 35-54 55+
By age
Even more
essential among
younger people

The Risk:
Without Trust, They Will Delete
Source: 2018 Edelman Trust Barometer: Special Report: Brands and Social Media. Q8. Below is a list of statements. For each one, please rate how much you
agree or disagree with that statement using a 9-point scale where one means “strongly disagree” and nine means “strongly agree”. (Top 4 Box, Agree). General
population, 9-market average, and by age and among social media users.
10
Percent who agree
2632 33
38 38 4044
48
55
Germ
any
Cana
da
U.K
.
Bra
zil
U.S
.
Fra
nce
Ind
ia
UA
E
Chin
a
Global
40%Say “I have deleted at least one of
my social media accounts in the past
year because I did not trust it to treat
my personal information properly”
50%
Younger people
more likely to delete
social media if they
don’t trust it to
properly use
personal information
By age 4441
31
18-34 35-54 55+
11
Concerns About Data and
Content Eroding Trust
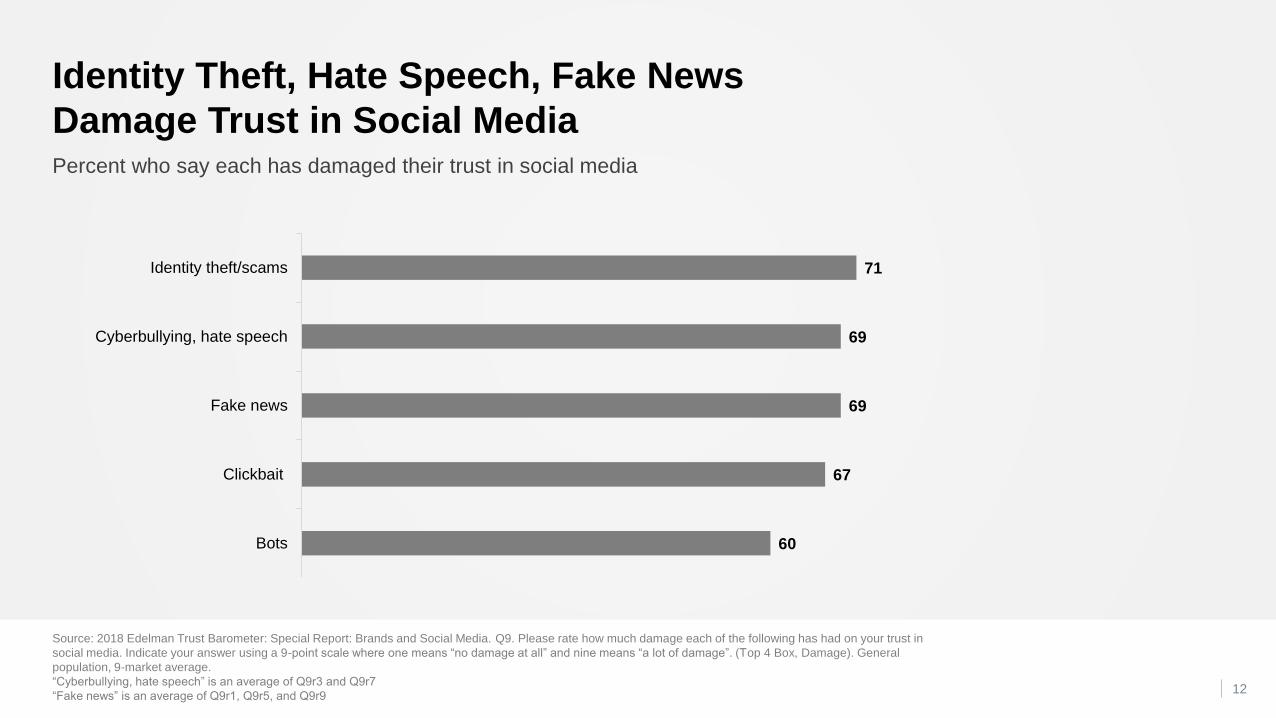
Source: 2018 Edelman Trust Barometer: Special Report: Brands and Social Media. Q9. Please rate how much damage each of the following has had on your trust in
social media. Indicate your answer using a 9-point scale where one means “no damage at all” and nine means “a lot of damage”. (Top 4 Box, Damage). General
population, 9-market average.
“Cyberbullying, hate speech” is an average of Q9r3 and Q9r7
“Fake news” is an average of Q9r1, Q9r5, and Q9r912
Percent who say each has damaged their trust in social media
Identity Theft, Hate Speech, Fake News
Damage Trust in Social Media
60
67
69
69
71
Bots
Clickbait
Fake news
Cyberbullying, hate speech
Identity theft/scams
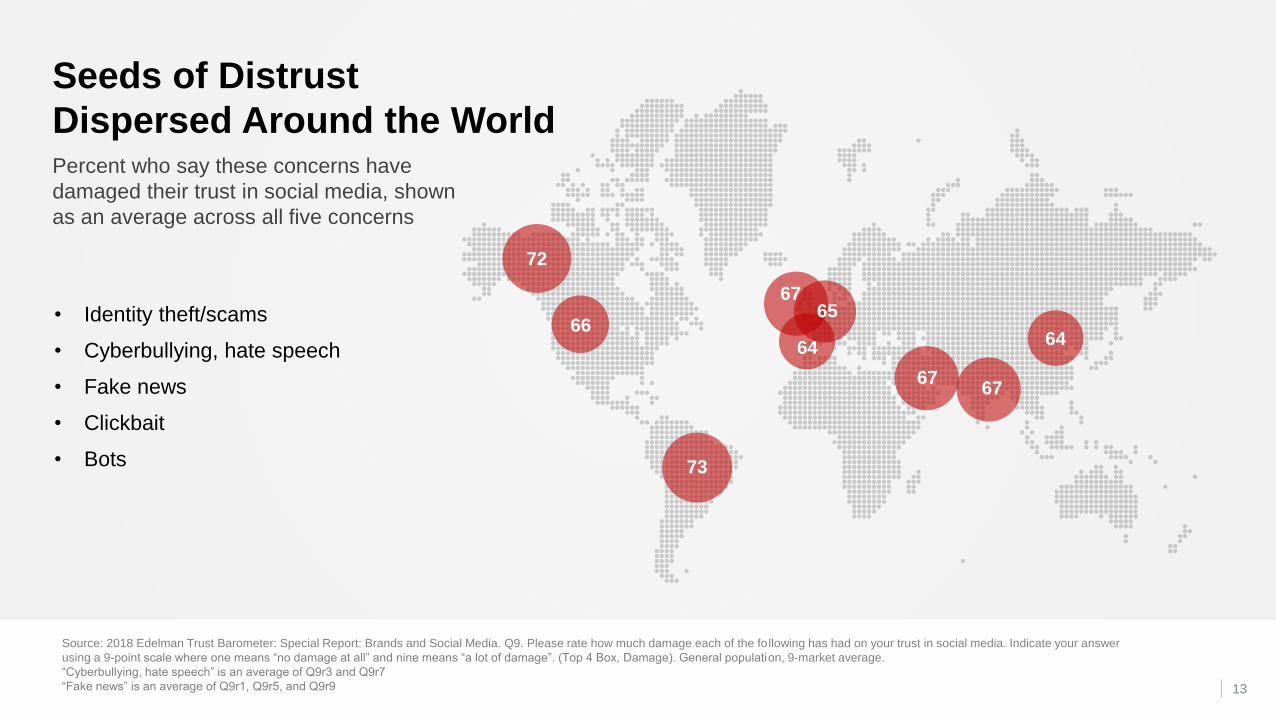
Percent who say these concerns have
damaged their trust in social media, shown
as an average across all five concerns
Seeds of Distrust
Dispersed Around the World
Source: 2018 Edelman Trust Barometer: Special Report: Brands and Social Media. Q9. Please rate how much damage each of the following has had on your trust in social media. Indicate your answer
using a 9-point scale where one means “no damage at all” and nine means “a lot of damage”. (Top 4 Box, Damage). General population, 9-market average.
“Cyberbullying, hate speech” is an average of Q9r3 and Q9r7
“Fake news” is an average of Q9r1, Q9r5, and Q9r9
• Identity theft/scams
• Cyberbullying, hate speech
• Fake news
• Clickbait
• Bots
64
72
66
6767
67
64
65
73
13
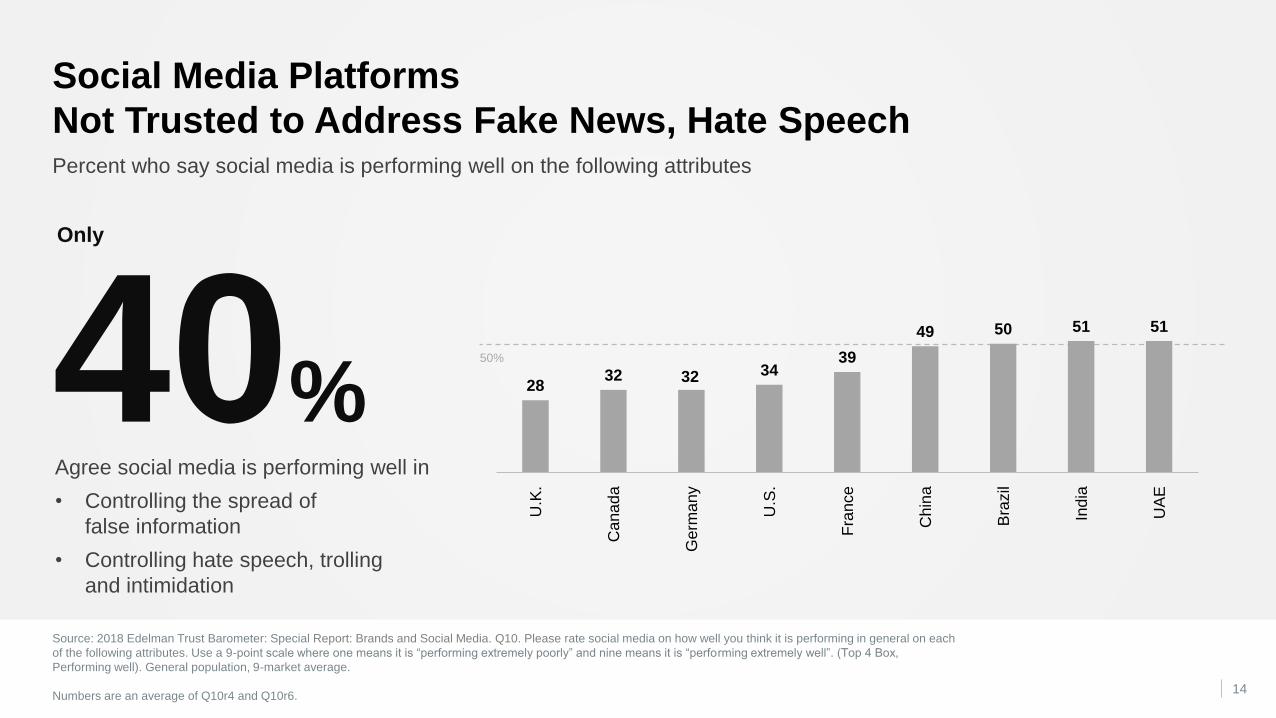
50%
Source: 2018 Edelman Trust Barometer: Special Report: Brands and Social Media. Q10. Please rate social media on how well you think it is performing in general on each
of the following attributes. Use a 9-point scale where one means it is “performing extremely poorly” and nine means it is “performing extremely well”. (Top 4 Box,
Performing well). General population, 9-market average.
Numbers are an average of Q10r4 and Q10r6.14
Social Media Platforms
Not Trusted to Address Fake News, Hate SpeechPercent who say social media is performing well on the following attributes
2832 32 34
39
49 50 51 51
U.K
.
Cana
da
Germ
any
U.S
.
Fra
nce
Chin
a
Bra
zil
Ind
ia
UA
E
Only
40%Agree social media is performing well in
• Controlling the spread of
false information
• Controlling hate speech, trolling
and intimidation
Source: 2018 Edelman Trust Barometer: Special Report: Brands and Social Media. Q8. Below is a list of statements. For each one, please rate how much you agree or
disagree with that statement using a 9-point scale where one means “strongly disagree” and nine means “strongly agree”. (Top 4 Box, Agree). General population, 9-
market average.
15
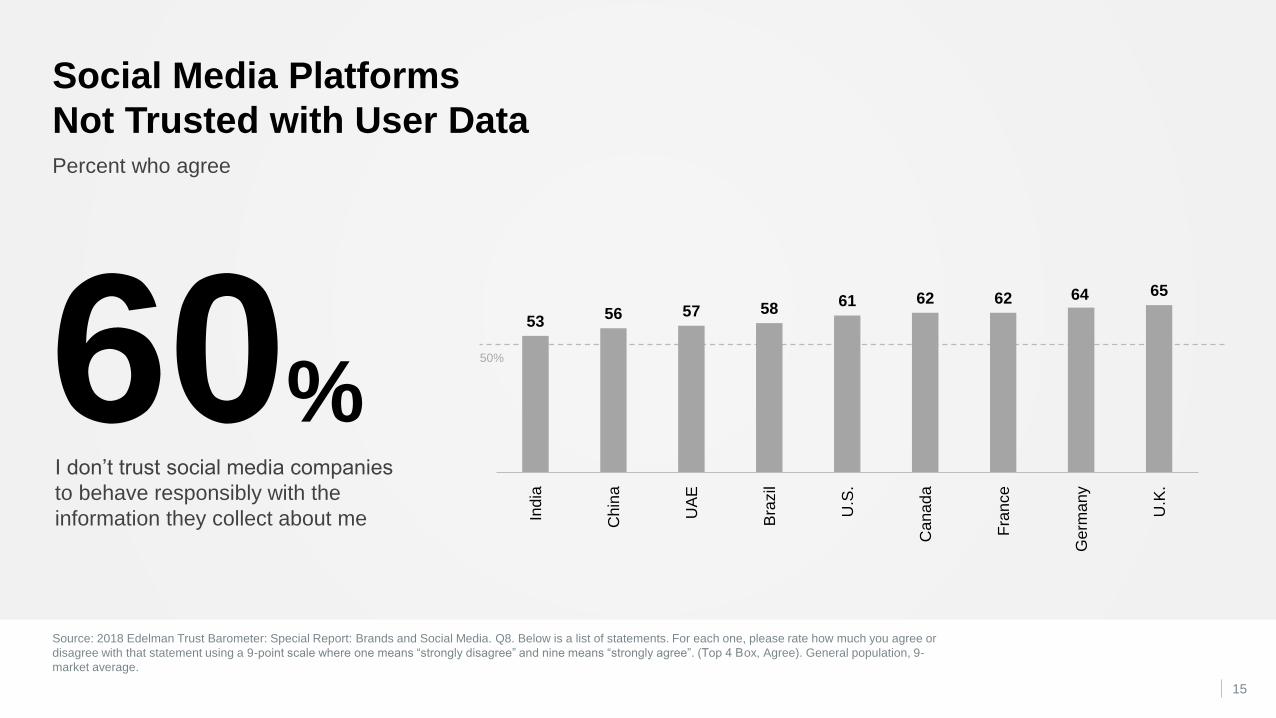
Percent who agree
Social Media Platforms
Not Trusted with User Data
50%
5356 57 58
61 62 62 64 65
Ind
ia
Chin
a
UA
E
Bra
zil
U.S
.
Cana
da
Fra
nce
Germ
any
U.K
.
60%I don’t trust social media companies
to behave responsibly with the
information they collect about me
50%
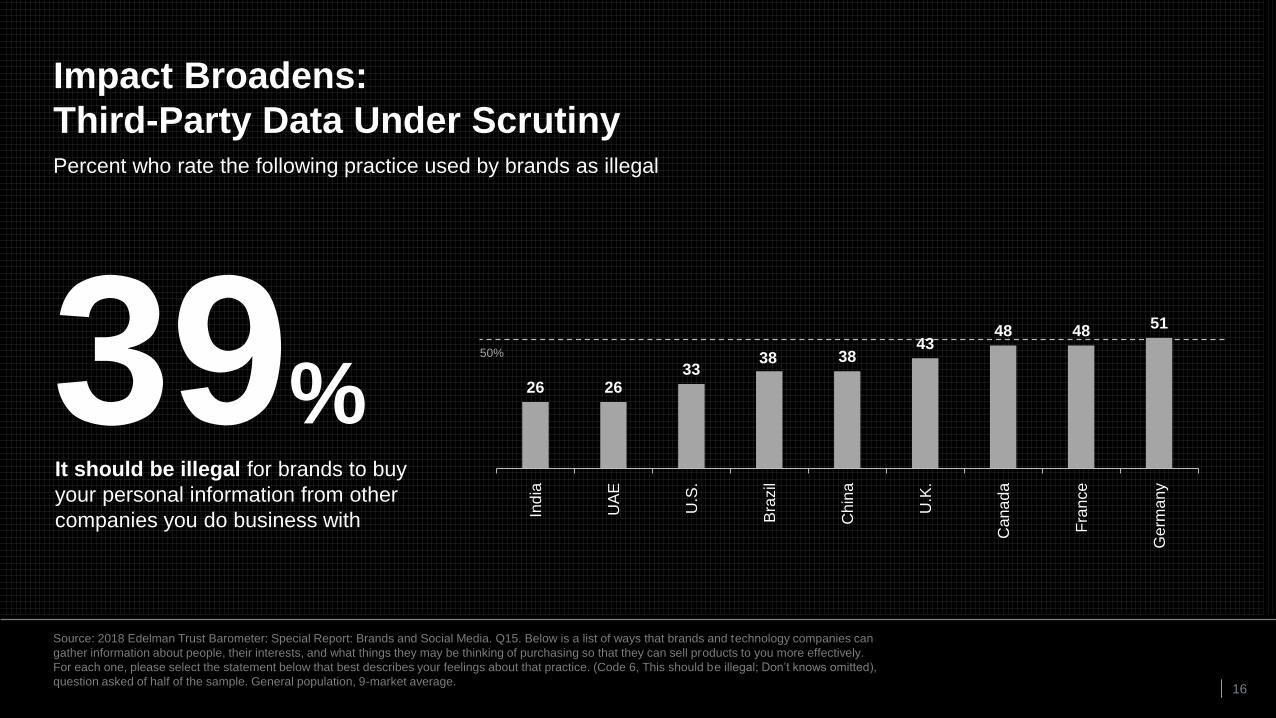
26 2633
38 3843
48 4851
Ind
ia
UA
E
U.S
.
Bra
zil
Chin
a
U.K
.
Cana
da
Fra
nce
Germ
any
Source: 2018 Edelman Trust Barometer: Special Report: Brands and Social Media. Q15. Below is a list of ways that brands and technology companies can
gather information about people, their interests, and what things they may be thinking of purchasing so that they can sell products to you more effectively.
For each one, please select the statement below that best describes your feelings about that practice. (Code 6, This should be illegal; Don’t knows omitted),
question asked of half of the sample. General population, 9-market average.16
Percent who rate the following practice used by brands as illegal
Impact Broadens:
Third-Party Data Under Scrutiny
39%It should be illegal for brands to buy
your personal information from other
companies you do business with

17
Brands Must Act
Source: 2018 Edelman Trust Barometer: Special Report: Brands and Social Media. Q13. Below is a list of statements. For each one, please rate how much you agree or
disagree with that statement using a 9-point scale where one means “strongly disagree” and nine means “strongly agree”. (Top 4 Box, Agree). General population, 9-market
average, and by age.
18
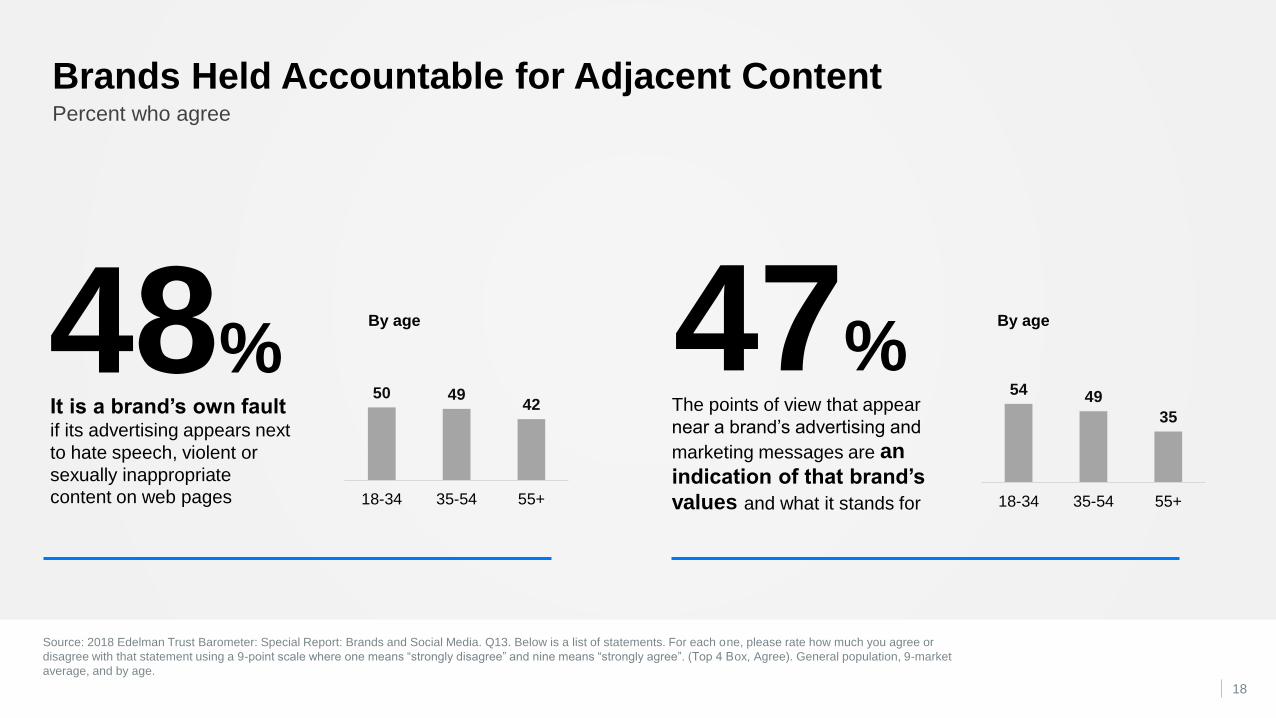
Percent who agree
Brands Held Accountable for Adjacent Content
48%It is a brand’s own fault if its advertising appears next
to hate speech, violent or
sexually inappropriate
content on web pages
The points of view that appear
near a brand’s advertising and
marketing messages are an
indication of that brand’s
values and what it stands for
50 4942
18-34 35-54 55+
47%By age By age
54 49
35
18-34 35-54 55+

Source: 2018 Edelman Trust Barometer: Special Report: Brands and Social Media. Q8. Below is a list of statements. For each one, please rate how much you agree or
disagree with that statement using a 9-point scale where one means “strongly disagree” and nine means “strongly agree”. (Top 4 Box, Agree). General population, 9-
market average.
19
Percent who agree that brands should pressure social media to…
Brands Expected to Pressure Platforms to
Address Fake News and Hate Speech
63 65 66 69 70 70 73 75 77
U.S
.
Germ
any
Fra
nce
Ca
na
da
Chin
a
U.K
.
UA
E
Bra
zil
Ind
ia
63 64 64 66 68 70 7074 76
U.S
.
Fra
nce
Germ
any
Chin
a
Cana
da
UA
E
U.K
.
Bra
zil
Ind
ia
70% 68%
Protect users from
offensive/harmful content
Global Global
Do more about false information
and fake news
Source: 2018 Edelman Trust Barometer: Special Report: Brands and Social Media. Q8. Below is a list of statements. For each one, please rate how much you agree or
disagree with that statement using a 9-point scale where one means “strongly disagree” and nine means “strongly agree”. (Top 4 Box, Agree). General population, 9-
market average.
20
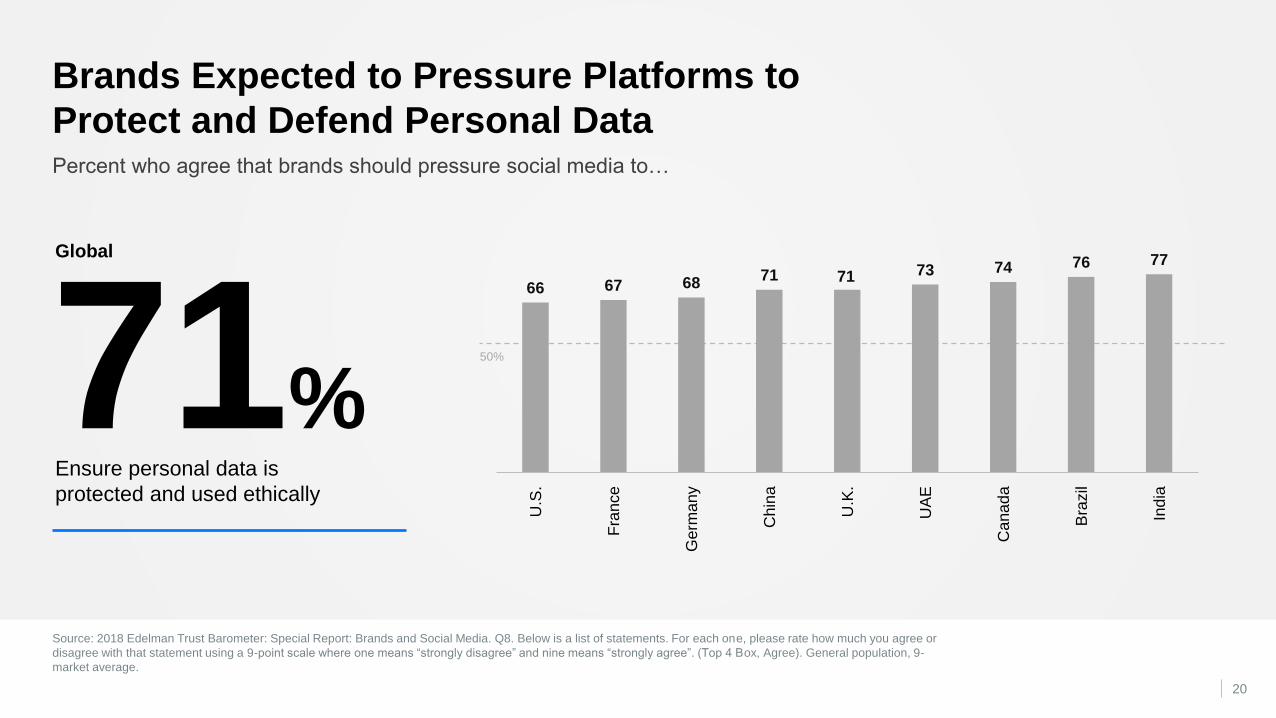
Percent who agree that brands should pressure social media to…
Brands Expected to Pressure Platforms to
Protect and Defend Personal Data
71%Ensure personal data is
protected and used ethically
50%
66 67 6871 71 73 74 76 77
U.S
.
Fra
nce
Germ
any
Chin
a
U.K
.
UA
E
Cana
da
Bra
zil
Ind
ia
Global
21
Brands Must Act
1. Give them a better deal for their data
2. Create trusted content on social media
3. Join forces to build trust in social media

22
1. Give Them a Better Deal
for Their Data
50%
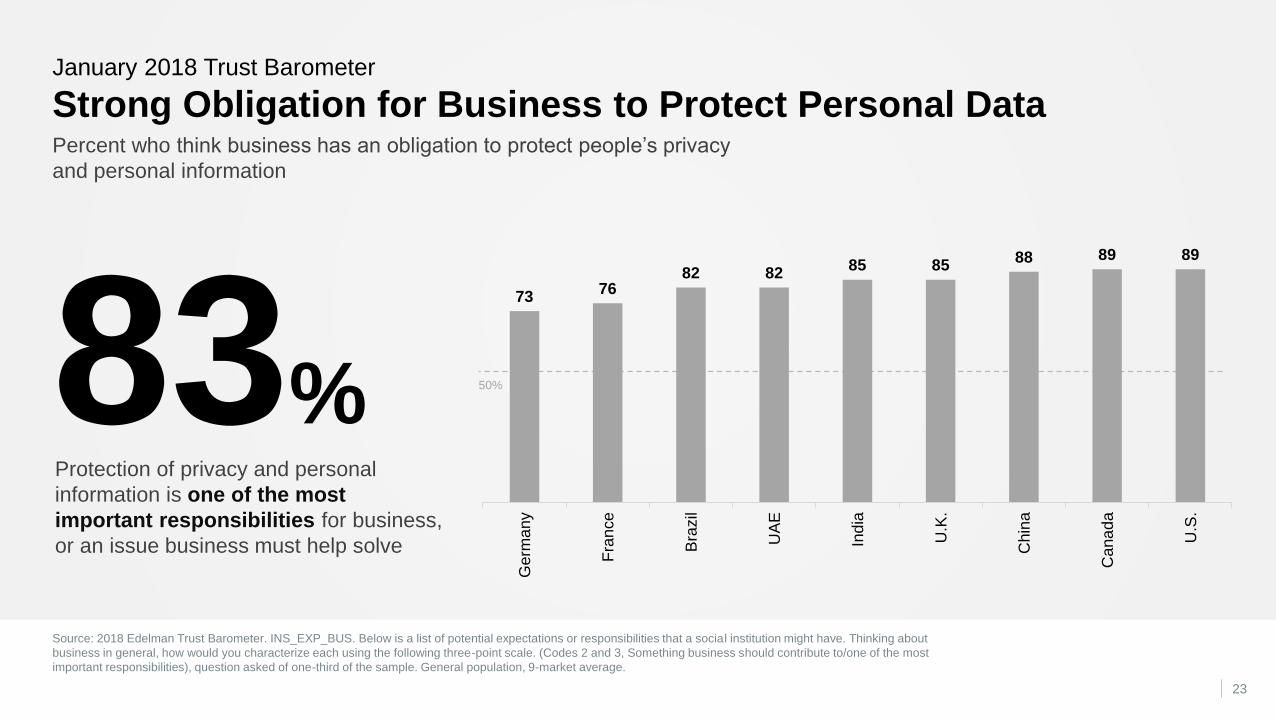
Source: 2018 Edelman Trust Barometer. INS_EXP_BUS. Below is a list of potential expectations or responsibilities that a social institution might have. Thinking about
business in general, how would you characterize each using the following three-point scale. (Codes 2 and 3, Something business should contribute to/one of the most
important responsibilities), question asked of one-third of the sample. General population, 9-market average.
23
Percent who think business has an obligation to protect people’s privacy
and personal information
January 2018 Trust Barometer
Strong Obligation for Business to Protect Personal Data
7376
82 8285 85
88 89 89
Germ
any
Fra
nce
Bra
zil
UA
E
Ind
ia
U.K
.
Chin
a
Cana
da
U.S
.
83%Protection of privacy and personal
information is one of the most
important responsibilities for business,
or an issue business must help solve
Source: 2018 Edelman Trust Barometer: Special Report: Brands and Social Media. Q13. Below is a list of statements. For each one, please rate how much you agree or
disagree with that statement using a 9-point scale where one means “strongly disagree” and nine means “strongly agree”. (Top 4 Box, Agree; Bottom 4 Box, Disagree).
General population, 9-market average, and by age.
24
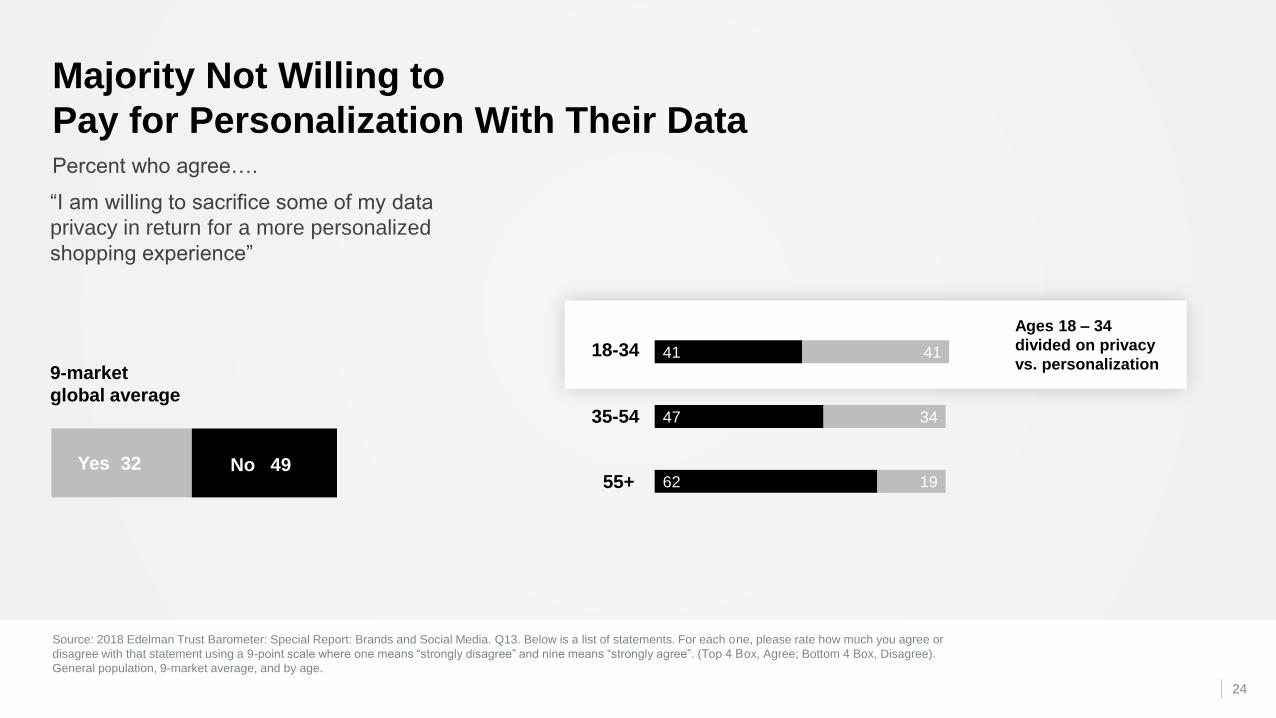
Percent who agree….
Majority Not Willing to
Pay for Personalization With Their Data
“I am willing to sacrifice some of my data
privacy in return for a more personalized
shopping experience”
9-market
global average
32 49Yes No
Ages 18 – 34
divided on privacy
vs. personalization18-34
35-54
55+ 62
47
41
19
34
41

Source: 2018 Edelman Trust Barometer: Special Report: Brands and Social Media. Q8. Below is a list of statements. For each one, please rate how much
you agree or disagree with that statement using a 9-point scale where one means “strongly disagree” and nine means “strongly agree”. (Top 4 Box, Agree).
General population, 9-market average.
25
Percent who agree
Data Policies Must Be More Clear
It is often difficult to understand
what information I am giving
platforms or applications access to
or permission to collect and use
58%50%
54 56 57 58 58 58 5962 63
Germ
any
Chin
a
U.S
.
Cana
da
Fra
nce
U.K
.
UA
E
Bra
zil
Ind
ia
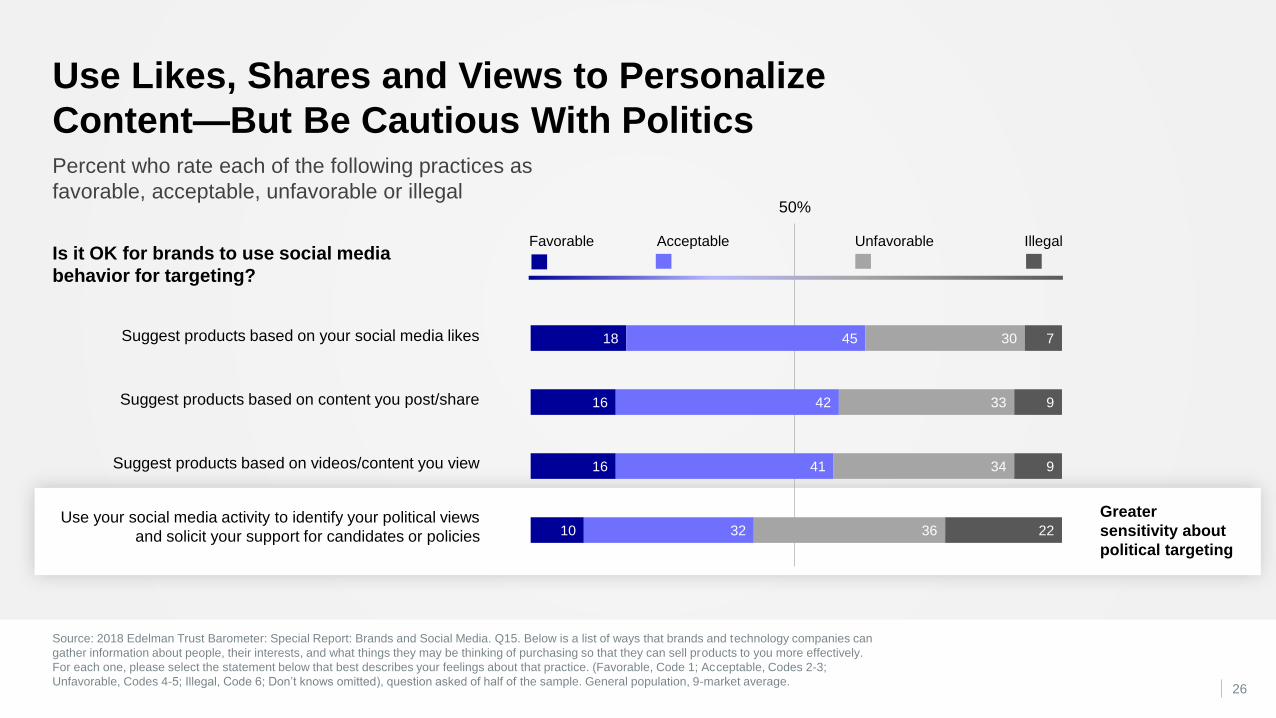
Source: 2018 Edelman Trust Barometer: Special Report: Brands and Social Media. Q15. Below is a list of ways that brands and technology companies can
gather information about people, their interests, and what things they may be thinking of purchasing so that they can sell products to you more effectively.
For each one, please select the statement below that best describes your feelings about that practice. (Favorable, Code 1; Acceptable, Codes 2-3;
Unfavorable, Codes 4-5; Illegal, Code 6; Don’t knows omitted), question asked of half of the sample. General population, 9-market average.26
Percent who rate each of the following practices as
favorable, acceptable, unfavorable or illegal
Use Likes, Shares and Views to Personalize
Content—But Be Cautious With Politics
Greater
sensitivity about
political targeting
Suggest products based on your social media likes
Suggest products based on content you post/share
Suggest products based on videos/content you view
Use your social media activity to identify your political views
and solicit your support for candidates or policies
Is it OK for brands to use social media
behavior for targeting?
10
16
16
18
32
41
42
45
36
34
33
30
22
9
9
7
Favorable Unfavorable IllegalAcceptable
50%
Favorable Unfavorable IllegalAcceptable
Source: 2018 Edelman Trust Barometer: Special Report: Brands and Social Media. Q15. Below is a list of ways that brands and technology companies can
gather information about people, their interests, and what things they may be thinking of purchasing so that they can sell products to you more effectively.
For each one, please select the statement below that best describes your feelings about that practice. (Favorable, Code 1; Acceptable, Codes 2-3;
Unfavorable, Codes 4-5; Illegal, Code 6; Don’t knows omitted), question asked of half of the sample. General population, 9-market average.27
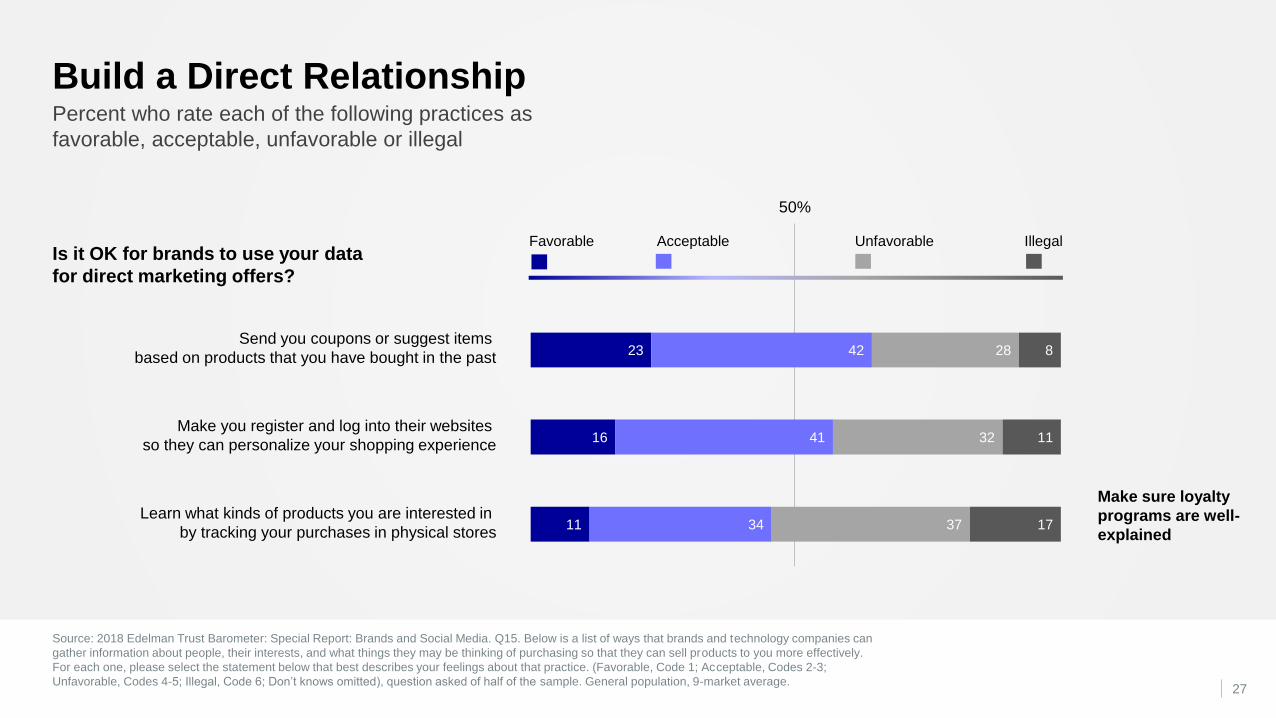
Percent who rate each of the following practices as
favorable, acceptable, unfavorable or illegal
Build a Direct Relationship
11
16
23
34
41
42
37
32
28
17
11
8
Is it OK for brands to use your data
for direct marketing offers?
Send you coupons or suggest items
based on products that you have bought in the past
Make you register and log into their websites
so they can personalize your shopping experience
Learn what kinds of products you are interested in
by tracking your purchases in physical stores
Make sure loyalty
programs are well-
explained
50%
50%
Source: 2018 Edelman Trust Barometer: Special Report: Brands and Social Media. Q15. Below is a list of ways that brands and technology companies can
gather information about people, their interests, and what things they may be thinking of purchasing so that they can sell products to you more effectively.
For each one, please select the statement below that best describes your feelings about that practice. (Favorable, Code 1; Acceptable, Codes 2-3;
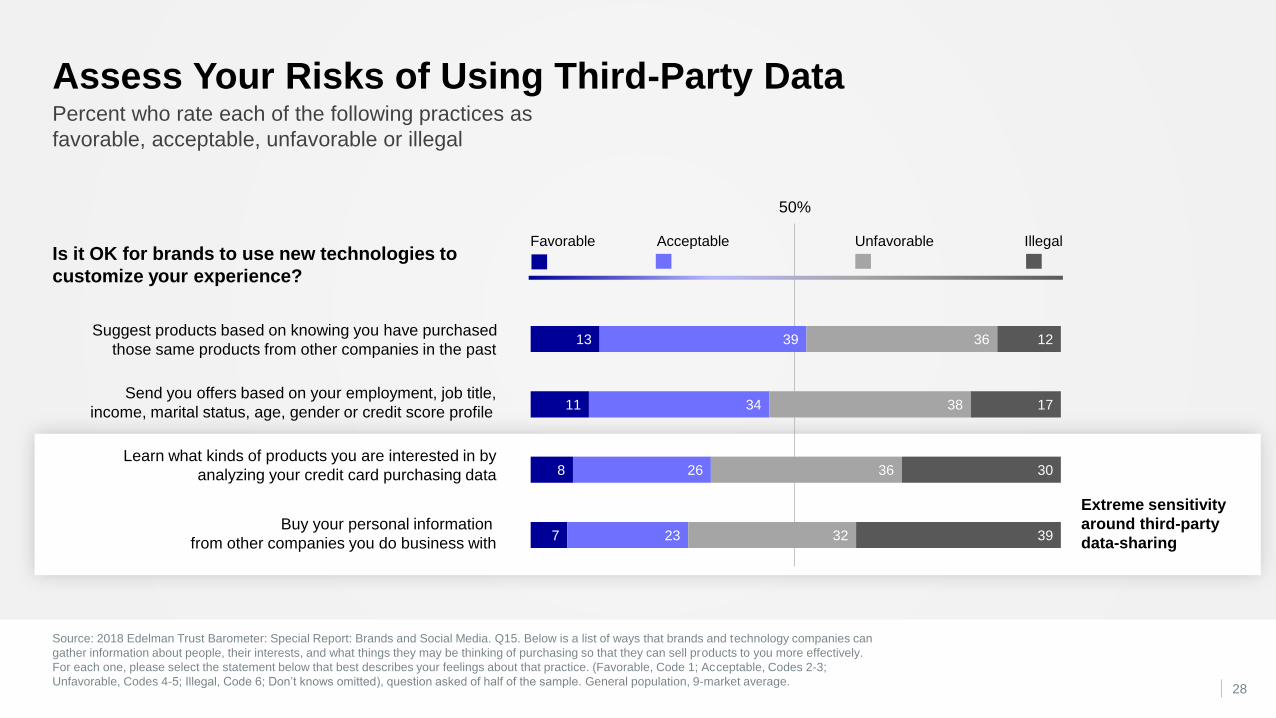
Unfavorable, Codes 4-5; Illegal, Code 6; Don’t knows omitted), question asked of half of the sample. General population, 9-market average.28
Assess Your Risks of Using Third-Party Data
7
8
11
13
23
26
34
39
32
36
38
36
39
30
17
12
Is it OK for brands to use new technologies to
customize your experience?
Suggest products based on knowing you have purchased
those same products from other companies in the past
Send you offers based on your employment, job title,
income, marital status, age, gender or credit score profile
Learn what kinds of products you are interested in by
analyzing your credit card purchasing data
Buy your personal information
from other companies you do business with
Extreme sensitivity
around third-party
data-sharing
Percent who rate each of the following practices as
favorable, acceptable, unfavorable or illegal
Favorable Unfavorable IllegalAcceptable

29
2. Create Trusted Content
on Social Media
Source: 2018 Edelman Trust Barometer: Special Report: Brands and Social Media. Q17. When you are judging whether or not to trust information or other content you see
on social media, how important is each of the following attributes in making your decision? Indicate your answer using a 9-point scale where one means it is “not at all
important” and nine means it is “critically important”. (Top 4 Box, Important), question asked of half of the sample. General population, 9-market average, among social
media users.30
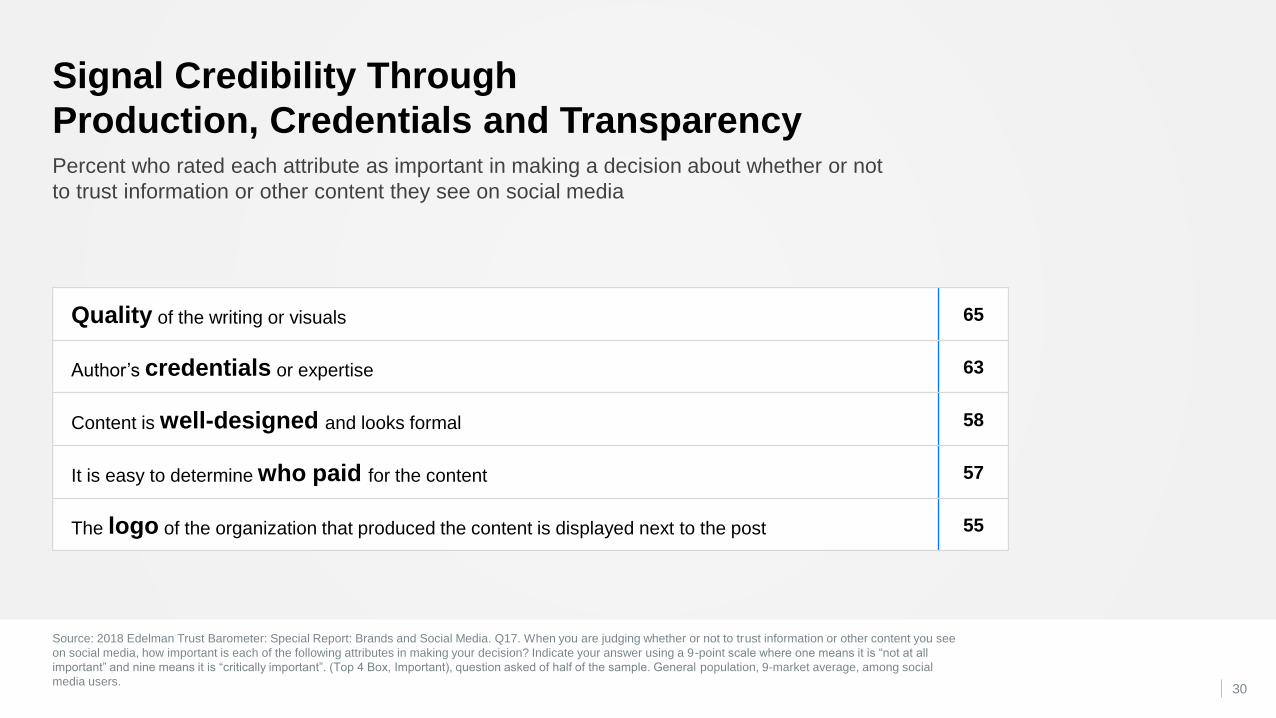
Percent who rated each attribute as important in making a decision about whether or not
to trust information or other content they see on social media
Signal Credibility Through
Production, Credentials and Transparency
Quality of the writing or visuals 65
Author’s credentials or expertise 63
Content is well-designed and looks formal 58
It is easy to determine who paid for the content 57
The logo of the organization that produced the content is displayed next to the post 55

Source: 2018 Edelman Trust Barometer: Special Report: Brands and Social Media. Q17. When you are judging whether or not to trust information or other content you see
on social media, how important is each of the following attributes in making your decision? Indicate your answer using a 9-point scale where one means it is “not at all
important” and nine means it is “critically important”. (Top 4 Box, Important), question asked of half of the sample. General population, 9-market average, among social
media users.31
Percent who rated each attribute as important in making a decision about whether or not
to trust information or other content they see on social media
Build a Strong Relationship
You have opted in to receive communications from this organization 59
It was placed on the platform by a brand you buy 56
Who liked, shared or sent you the content 53
Source: 2018 Edelman Trust Barometer: Special Report: Brands and Social Media. Q17. When you are judging whether or not to trust information or other content you see
on social media, how important is each of the following attributes in making your decision? Indicate your answer using a 9-point scale where one means it is “not at all
important” and nine means it is “critically important”. (Top 4 Box, Important), question asked of half of the sample. General population, 9-market average, among social
media users.32
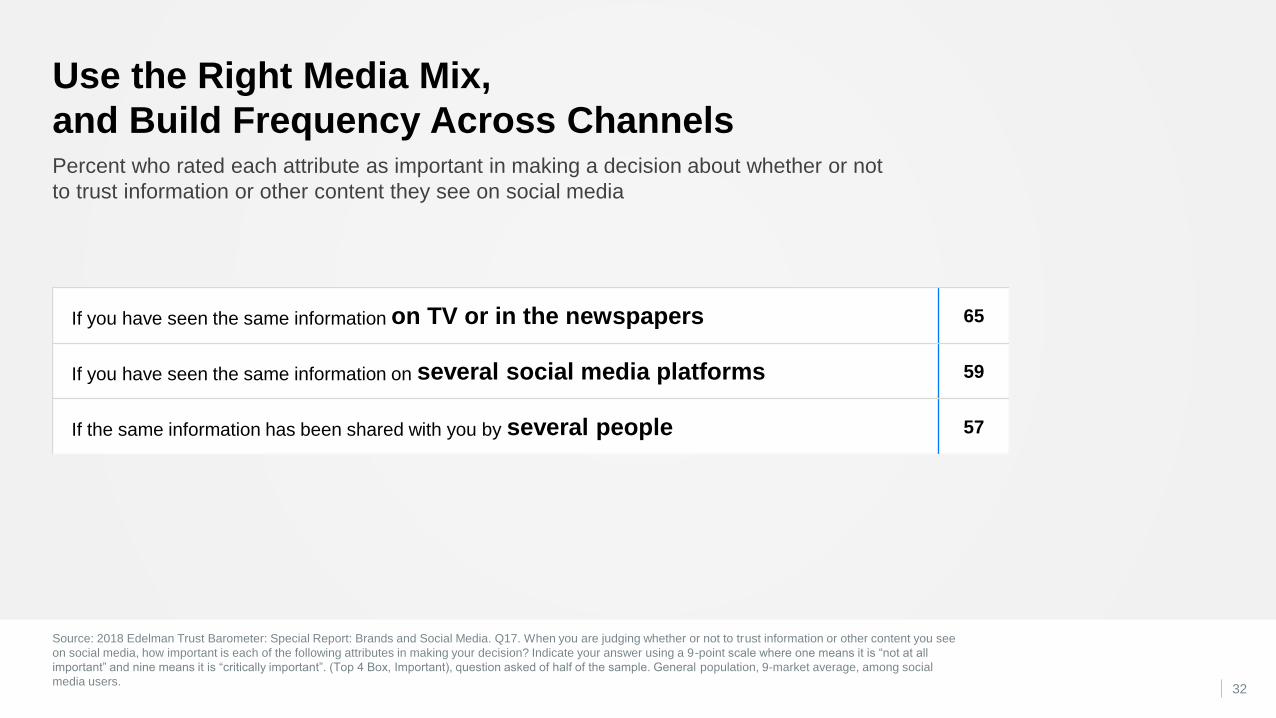
Percent who rated each attribute as important in making a decision about whether or not
to trust information or other content they see on social media
Use the Right Media Mix,
and Build Frequency Across Channels
If you have seen the same information on TV or in the newspapers 65
If you have seen the same information on several social media platforms 59
If the same information has been shared with you by several people 57
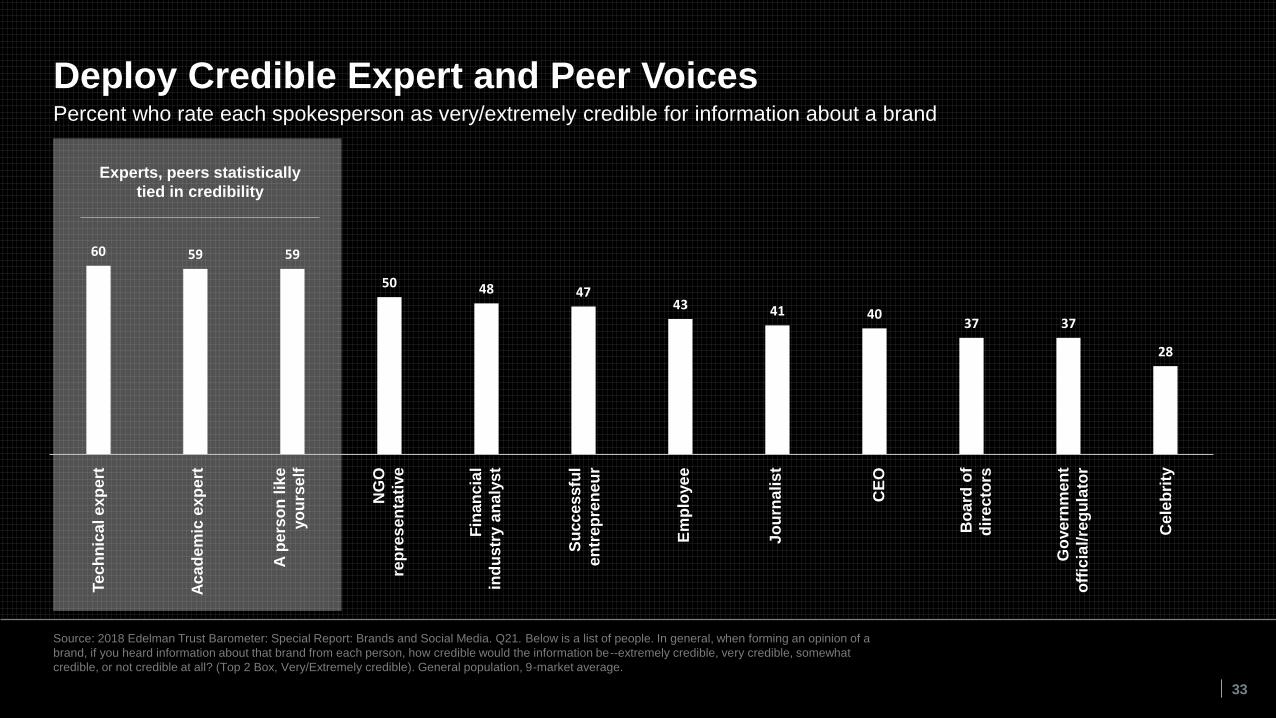
60 59 59
50 48 4743 41 40
37 37
28
Source: 2018 Edelman Trust Barometer: Special Report: Brands and Social Media. Q21. Below is a list of people. In general, when forming an opinion of a
brand, if you heard information about that brand from each person, how credible would the information be--extremely credible, very credible, somewhat
credible, or not credible at all? (Top 2 Box, Very/Extremely credible). General population, 9-market average.
33
Percent who rate each spokesperson as very/extremely credible for information about a brand
Deploy Credible Expert and Peer VoicesTe
ch
nic
al e
xp
ert
Ac
ad
em
ic e
xp
ert
A p
ers
on
lik
e
yo
urs
elf
NG
O
rep
res
en
tati
ve
Fin
an
cia
l
ind
us
try a
na
lys
t
Su
cc
es
sfu
l
en
tre
pre
ne
ur
Em
plo
ye
e
Jo
urn
ali
st
CE
O
Bo
ard
of
dir
ec
tors
Go
ve
rnm
en
t
off
icia
l/re
gu
lato
r
Cele
bri
ty
Experts, peers statistically
tied in credibility
DO NOT DISTRIBUTE
Analysis / narrative / design in progress
DATA NOT FACT CHECKED 34
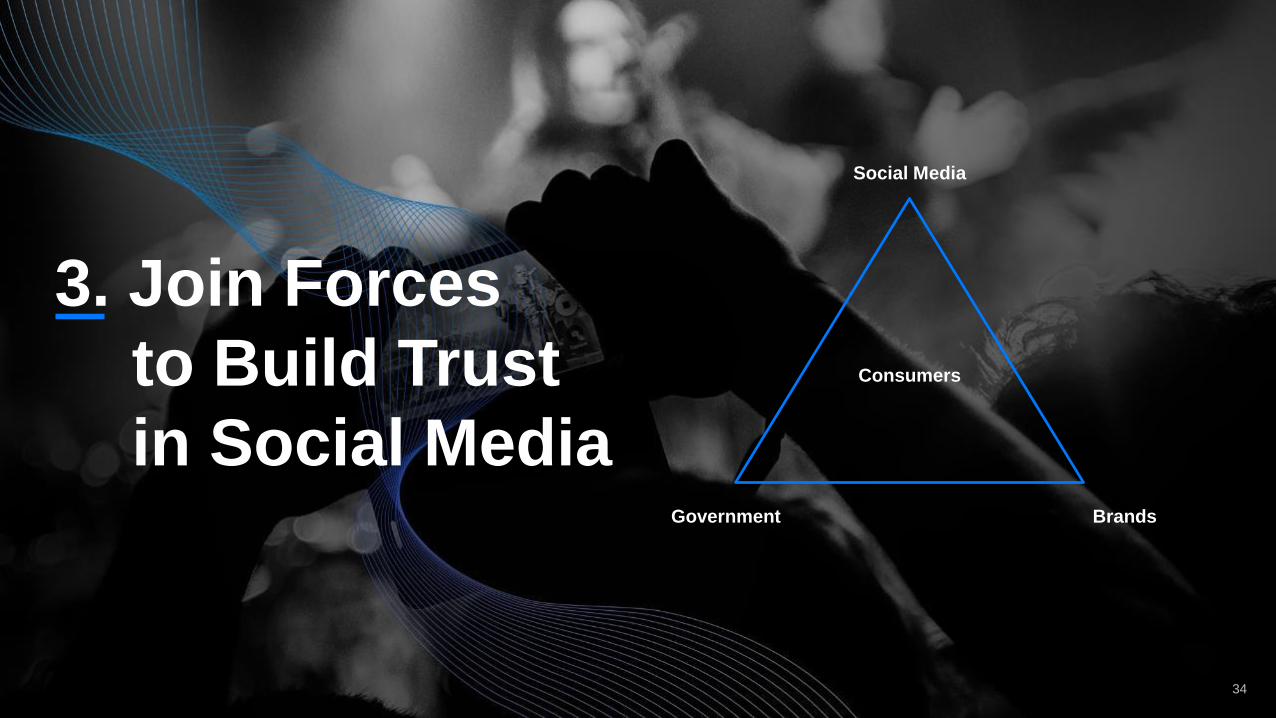
Social Media
Government Brands
Consumers
3. Join Forces
to Build Trust
in Social Media
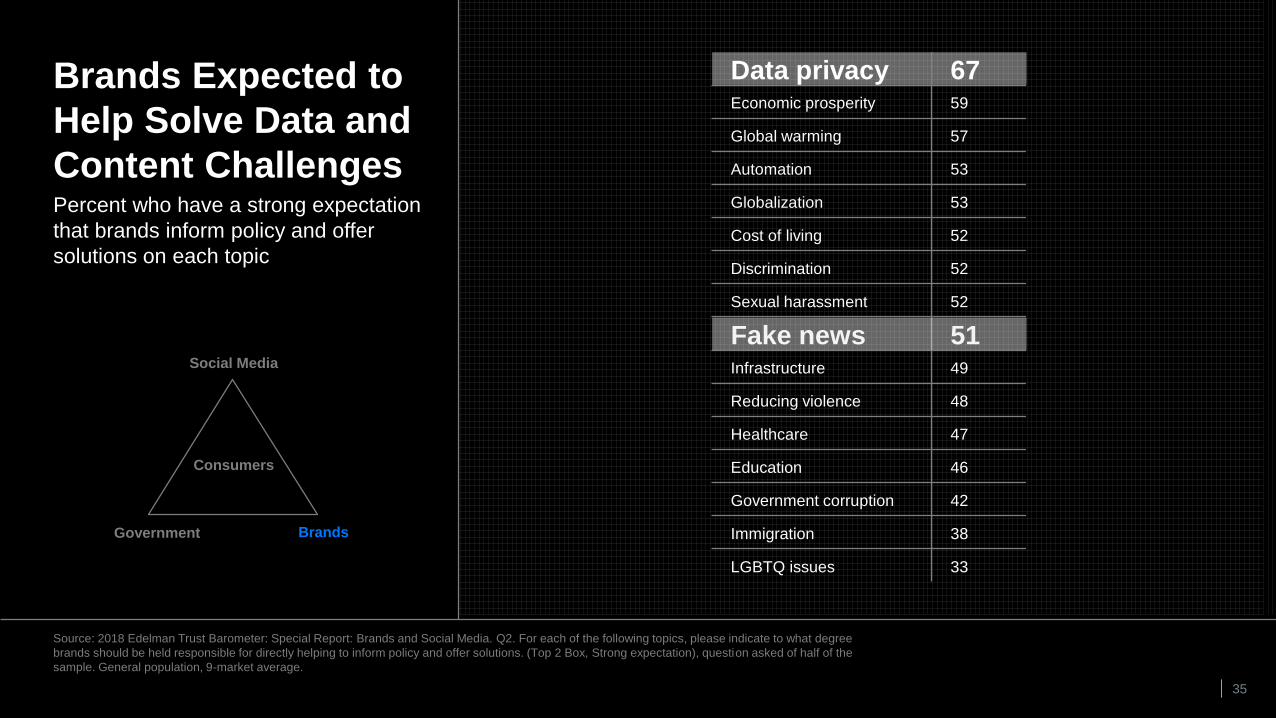
Percent who have a strong expectation
that brands inform policy and offer
solutions on each topic
Brands Expected to
Help Solve Data and
Content Challenges
Data privacy 67Economic prosperity 59
Global warming 57
Automation 53
Globalization 53
Cost of living 52
Discrimination 52
Sexual harassment 52
Fake news 51Infrastructure 49
Reducing violence 48
Healthcare 47
Education 46
Government corruption 42
Immigration 38
LGBTQ issues 33
Social Media
Government Brands
Consumers
Source: 2018 Edelman Trust Barometer: Special Report: Brands and Social Media. Q2. For each of the following topics, please indicate to what degree
brands should be held responsible for directly helping to inform policy and offer solutions. (Top 2 Box, Strong expectation), question asked of half of the
sample. General population, 9-market average.
35
Source: 2018 Edelman Trust Barometer: Special Report: Brands and Social Media. Q8. Below is a list of statements. For each one, please rate how much you agree
or disagree with that statement using a 9-point scale where one means “strongly disagree” and nine means “strongly agree”. (Top 4 Box, Agree). General population,
9-market average.
36
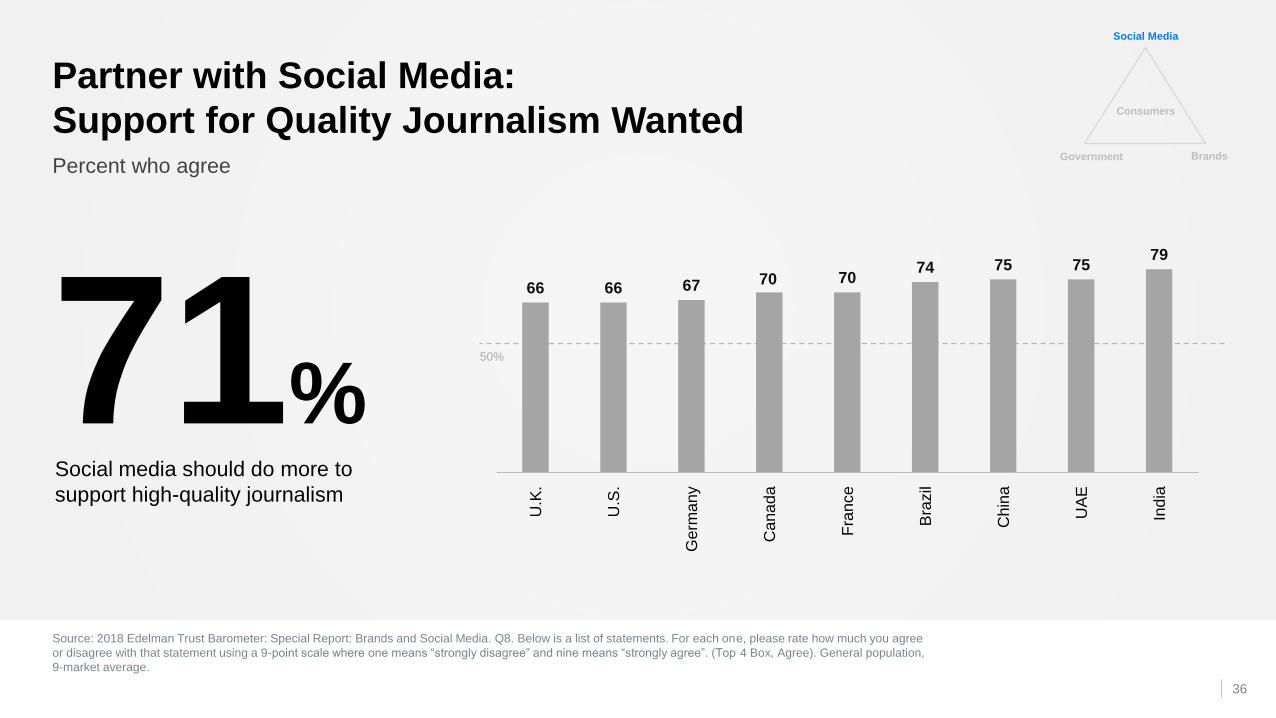
Percent who agree
Partner with Social Media:
Support for Quality Journalism Wanted
71%Social media should do more to
support high-quality journalism
50%
66 66 67 70 7074 75 75
79
U.K
.
U.S
.
Germ
any
Cana
da
Fra
nce
Bra
zil
Chin
a
UA
E
Ind
ia
Social Media
Government Brands
Consumers
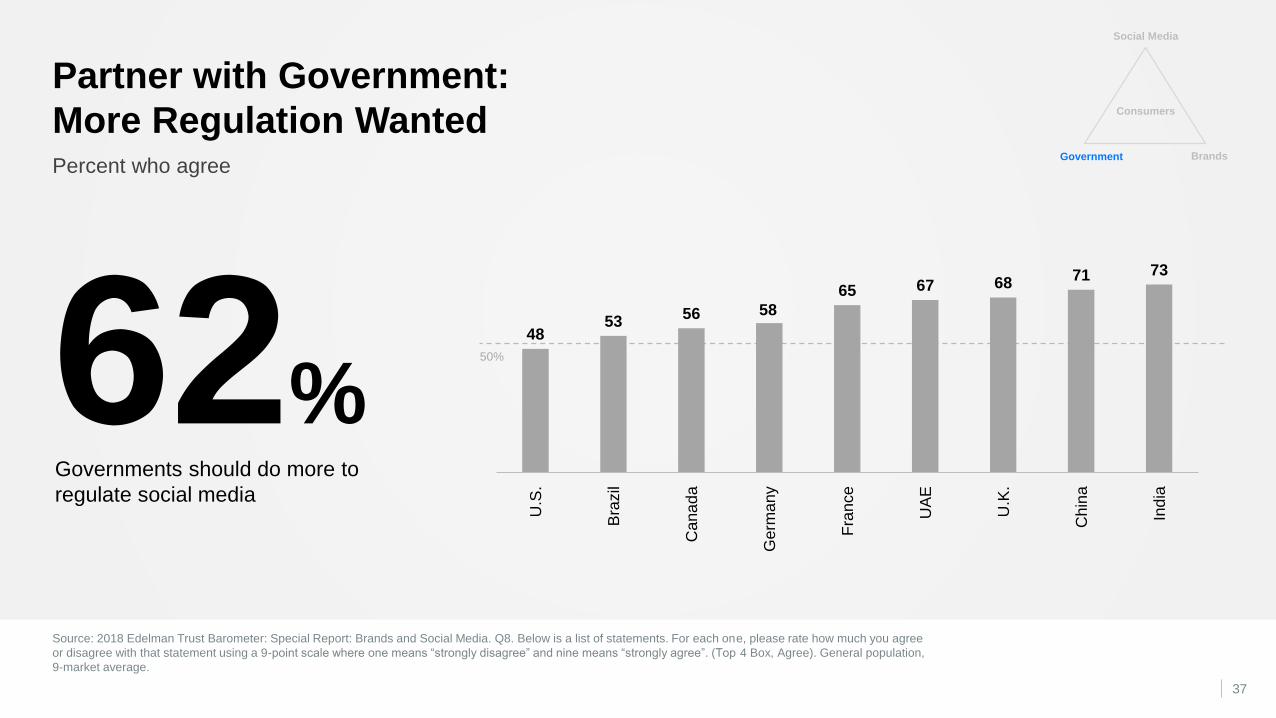
Source: 2018 Edelman Trust Barometer: Special Report: Brands and Social Media. Q8. Below is a list of statements. For each one, please rate how much you agree
or disagree with that statement using a 9-point scale where one means “strongly disagree” and nine means “strongly agree”. (Top 4 Box, Agree). General population,
9-market average.
37
Percent who agree
Partner with Government:
More Regulation Wanted
62%Governments should do more to
regulate social media
50%
4853
56 58
65 67 6871 73
U.S
.
Bra
zil
Cana
da
Germ
any
Fra
nce
UA
E
U.K
.
Chin
a
Ind
ia
Social Media
Government Brands
Consumers
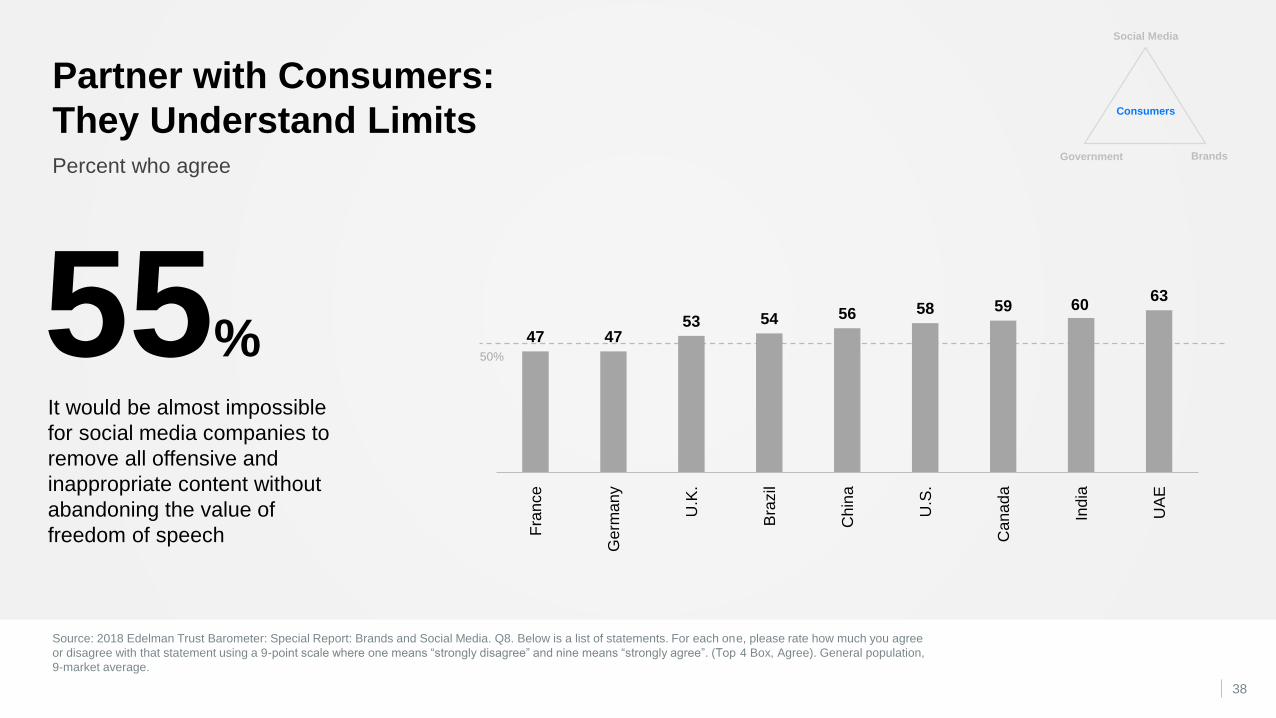
Source: 2018 Edelman Trust Barometer: Special Report: Brands and Social Media. Q8. Below is a list of statements. For each one, please rate how much you agree
or disagree with that statement using a 9-point scale where one means “strongly disagree” and nine means “strongly agree”. (Top 4 Box, Agree). General population,
9-market average.
38
Percent who agree
Partner with Consumers:
They Understand Limits
55% It would be almost impossible
for social media companies to
remove all offensive and
inappropriate content without
abandoning the value of
freedom of speech
50%
47 4753 54 56 58 59 60
63
Fra
nce
Germ
any
U.K
.
Bra
zil
Chin
a
U.S
.
Cana
da
Ind
ia
UA
E
Social Media
Government Brands
Consumers
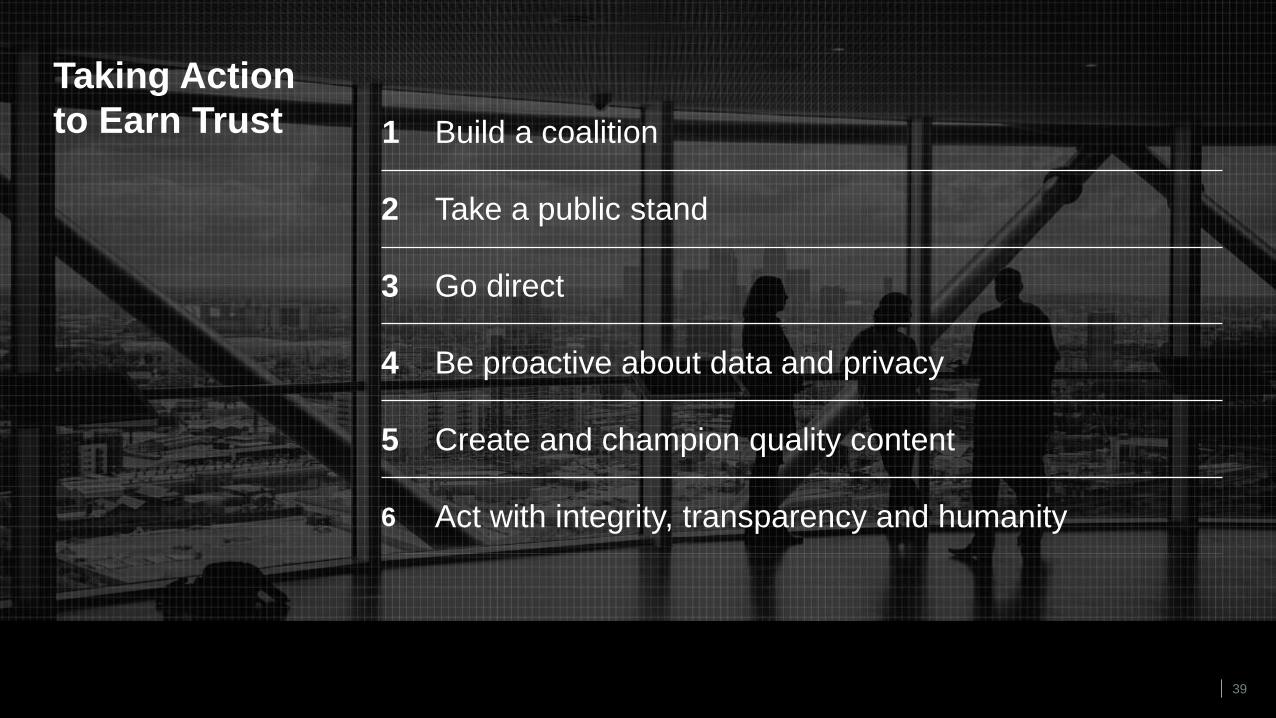
39
Taking Action
to Earn Trust 1 Build a coalition
2 Take a public stand
3 Go direct
4 Be proactive about data and privacy
5 Create and champion quality content
6 Act with integrity, transparency and humanity
40
Supplementary Data2018 Edelman Trust Barometer
Special Report: Brands and Social Media
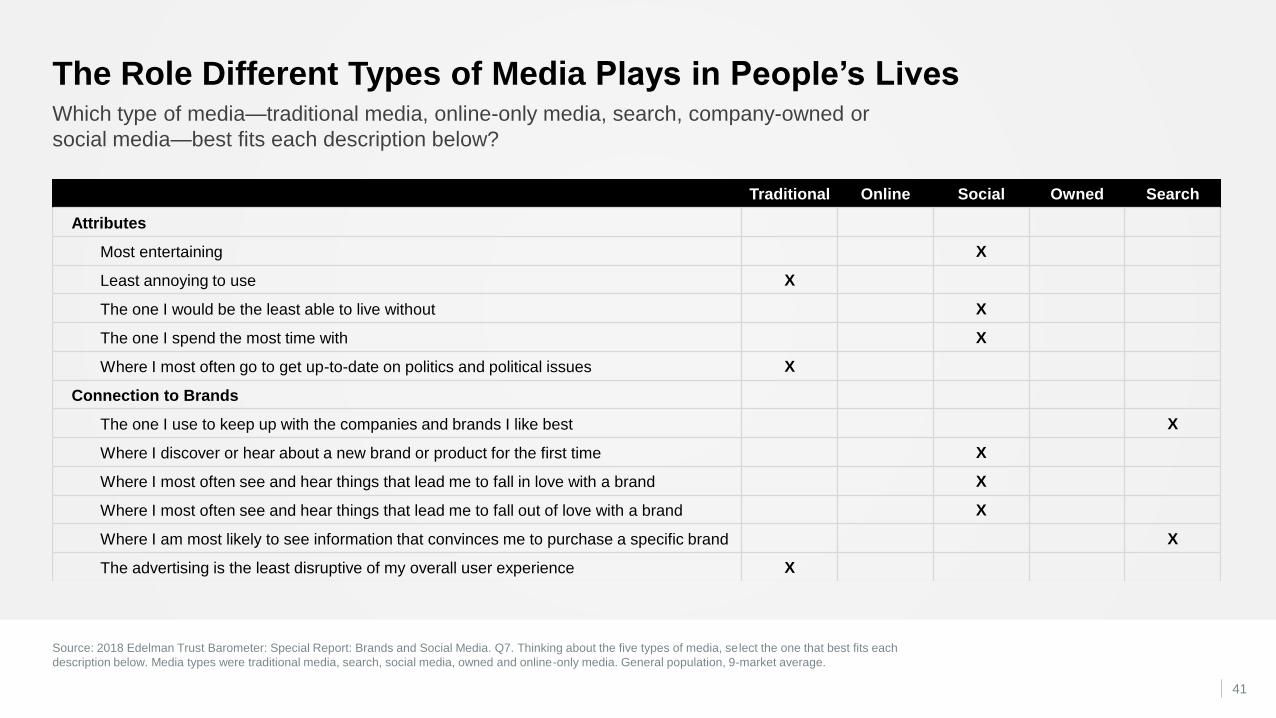
Source: 2018 Edelman Trust Barometer: Special Report: Brands and Social Media. Q7. Thinking about the five types of media, select the one that best fits each
description below. Media types were traditional media, search, social media, owned and online-only media. General population, 9-market average.
41
Which type of media—traditional media, online-only media, search, company-owned or
social media—best fits each description below?
The Role Different Types of Media Plays in People’s Lives
Traditional Online Social Owned Search
Attributes
Most entertaining X
Least annoying to use X
The one I would be the least able to live without X
The one I spend the most time with X
Where I most often go to get up-to-date on politics and political issues X
Connection to Brands
The one I use to keep up with the companies and brands I like best X
Where I discover or hear about a new brand or product for the first time X
Where I most often see and hear things that lead me to fall in love with a brand X
Where I most often see and hear things that lead me to fall out of love with a brand X
Where I am most likely to see information that convinces me to purchase a specific brand X
The advertising is the least disruptive of my overall user experience X
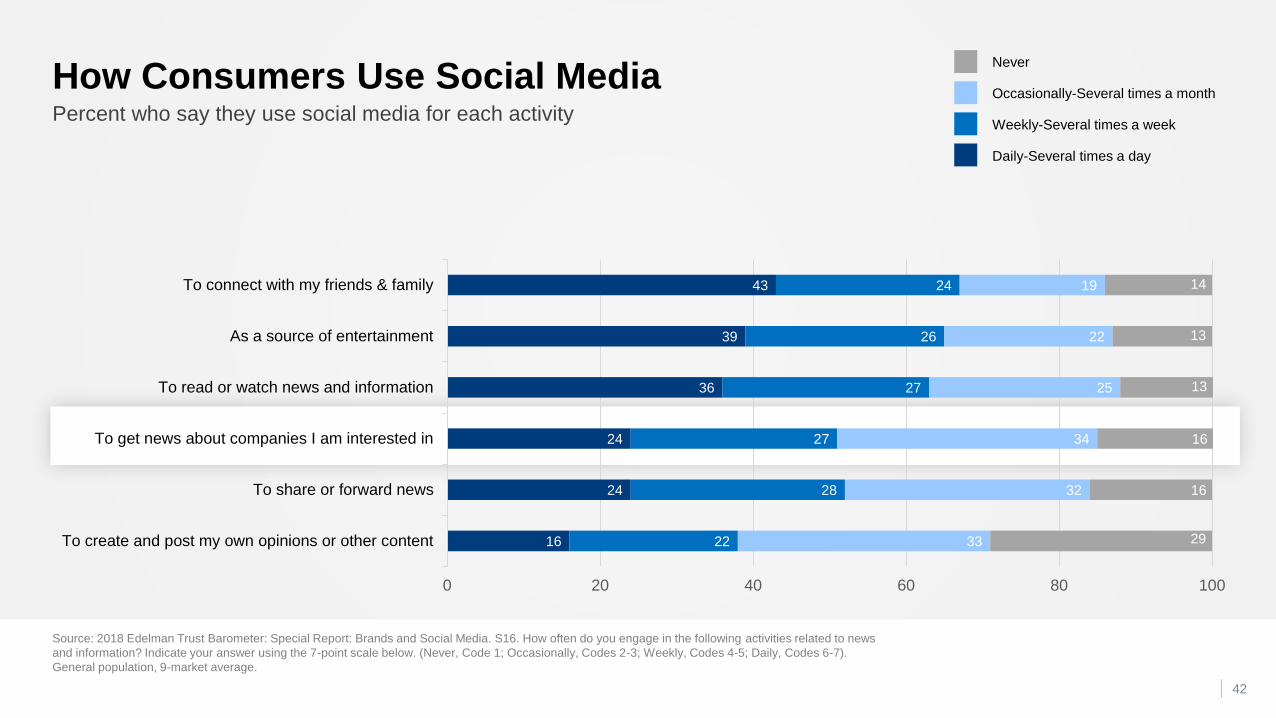
Source: 2018 Edelman Trust Barometer: Special Report: Brands and Social Media. S16. How often do you engage in the following activities related to news
and information? Indicate your answer using the 7-point scale below. (Never, Code 1; Occasionally, Codes 2-3; Weekly, Codes 4-5; Daily, Codes 6-7).
General population, 9-market average.
42
Percent who say they use social media for each activity
How Consumers Use Social Media
16
24
24
36
39
43
22
28
27
27
26
24
33
32
34
25
22
19
29
16
16
13
13
14
0 20 40 60 80 100
To create and post my own opinions or other content
To share or forward news
To get news about companies I am interested in
To read or watch news and information
As a source of entertainment
To connect with my friends & family
Never
Occasionally-Several times a month
Weekly-Several times a week
Daily-Several times a day
50%
Favorable Unfavorable IllegalAcceptable
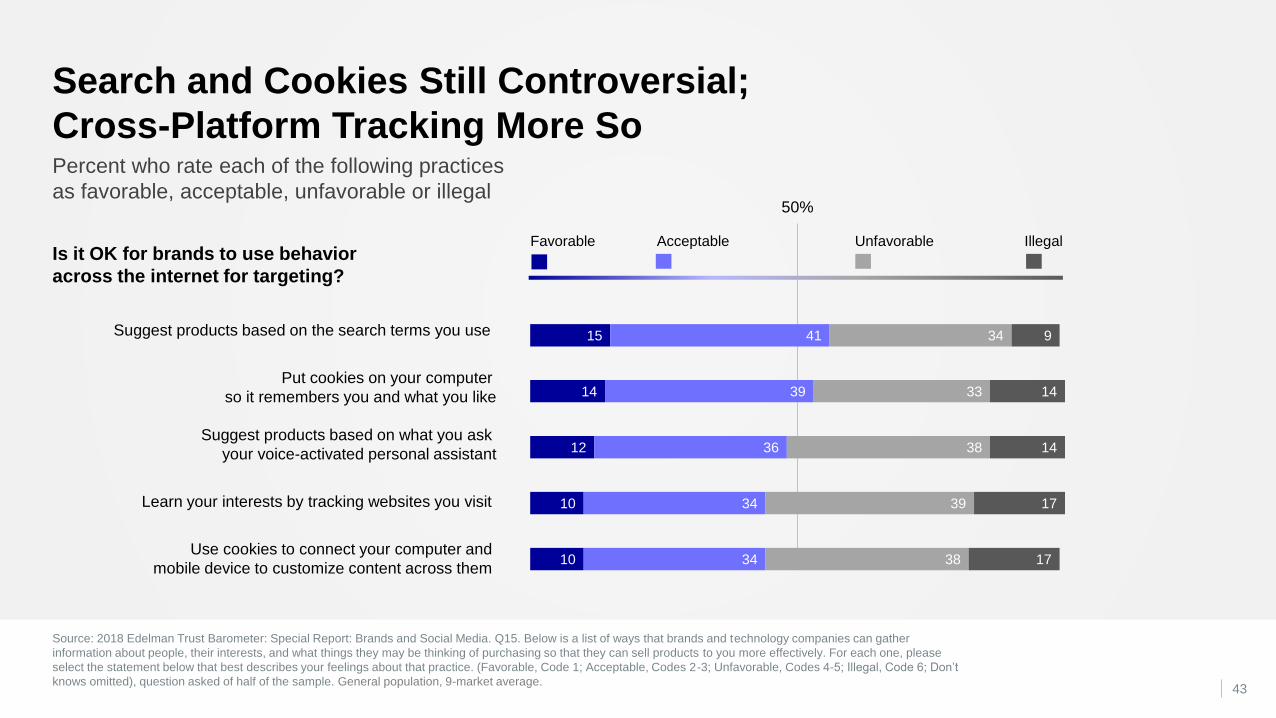
Source: 2018 Edelman Trust Barometer: Special Report: Brands and Social Media. Q15. Below is a list of ways that brands and technology companies can gather
information about people, their interests, and what things they may be thinking of purchasing so that they can sell products to you more effectively. For each one, please
select the statement below that best describes your feelings about that practice. (Favorable, Code 1; Acceptable, Codes 2-3; Unfavorable, Codes 4-5; Illegal, Code 6; Don’t
knows omitted), question asked of half of the sample. General population, 9-market average.43
Percent who rate each of the following practices
as favorable, acceptable, unfavorable or illegal
Search and Cookies Still Controversial;
Cross-Platform Tracking More So
10
10
12
14
15
34
34
36
39
41
38
39
38
33
34
17
17
14
14
9
Is it OK for brands to use behavior
across the internet for targeting?
Suggest products based on the search terms you use
Put cookies on your computer
so it remembers you and what you like
Suggest products based on what you ask
your voice-activated personal assistant
Learn your interests by tracking websites you visit
Use cookies to connect your computer and
mobile device to customize content across them
11
11
14
17
32
33
35
40
37
37
34
34
20
19
17
9
50%
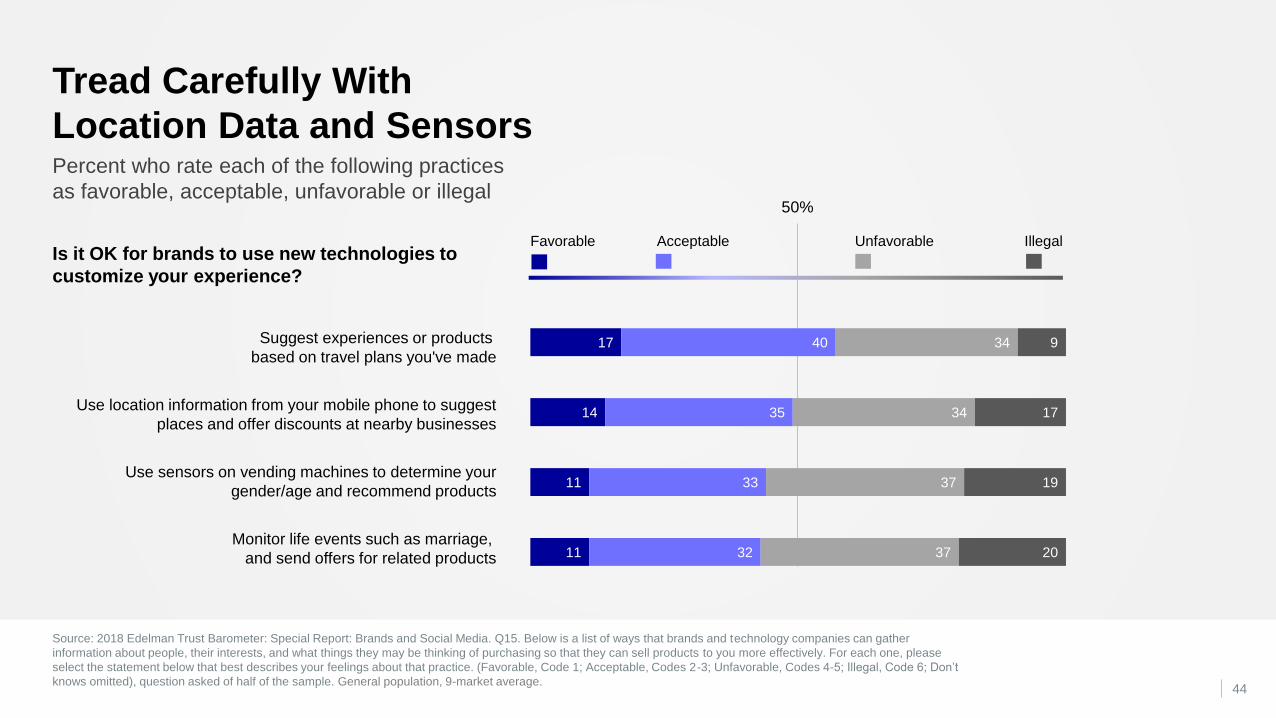
Source: 2018 Edelman Trust Barometer: Special Report: Brands and Social Media. Q15. Below is a list of ways that brands and technology companies can gather
information about people, their interests, and what things they may be thinking of purchasing so that they can sell products to you more effectively. For each one, please
select the statement below that best describes your feelings about that practice. (Favorable, Code 1; Acceptable, Codes 2-3; Unfavorable, Codes 4-5; Illegal, Code 6; Don’t
knows omitted), question asked of half of the sample. General population, 9-market average.44
Percent who rate each of the following practices
as favorable, acceptable, unfavorable or illegal
Tread Carefully With
Location Data and Sensors
Is it OK for brands to use new technologies to
customize your experience?
Favorable Unfavorable IllegalAcceptable
Suggest experiences or products
based on travel plans you've made
Use location information from your mobile phone to suggest
places and offer discounts at nearby businesses
Use sensors on vending machines to determine your
gender/age and recommend products
Monitor life events such as marriage,
and send offers for related products
Source: 2018 Edelman Trust Barometer: Special Report: Brands and Social Media. Q15. Below is a list of ways that brands and technology companies can gather
information about people, their interests, and what things they may be thinking of purchasing so that they can sell products to you more effectively. For each one, please
select the statement below that best describes your feelings about that practice. (Favorable, Code 1; Acceptable, Codes 2-3; Unfavorable, Codes 4-5; Illegal, Code 6; Don’t
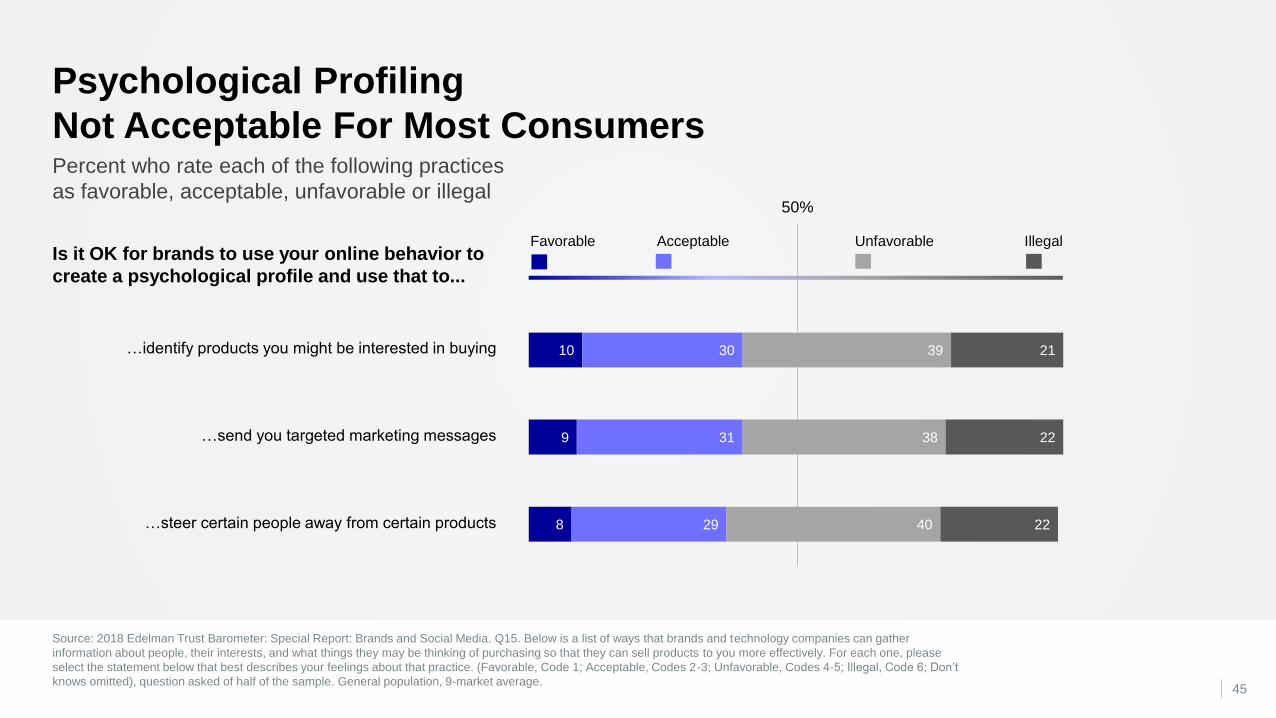
knows omitted), question asked of half of the sample. General population, 9-market average.45
Percent who rate each of the following practices
as favorable, acceptable, unfavorable or illegal
Psychological Profiling
Not Acceptable For Most Consumers
8
9
10
29
31
30
40
38
39
22
22
21
Is it OK for brands to use your online behavior to
create a psychological profile and use that to...
…identify products you might be interested in buying
…send you targeted marketing messages
…steer certain people away from certain products
Favorable Unfavorable IllegalAcceptable
50%