
2018 ANNUAL REPORT - Toll Brothers/media/Files/T/TollBrothers-IR/... · TOLL BROTHERS 2018 7 A...
84
2018 ANNUAL REPORT
Transcript of 2018 ANNUAL REPORT - Toll Brothers/media/Files/T/TollBrothers-IR/... · TOLL BROTHERS 2018 7 A...
2018 ANNUAL REPORT
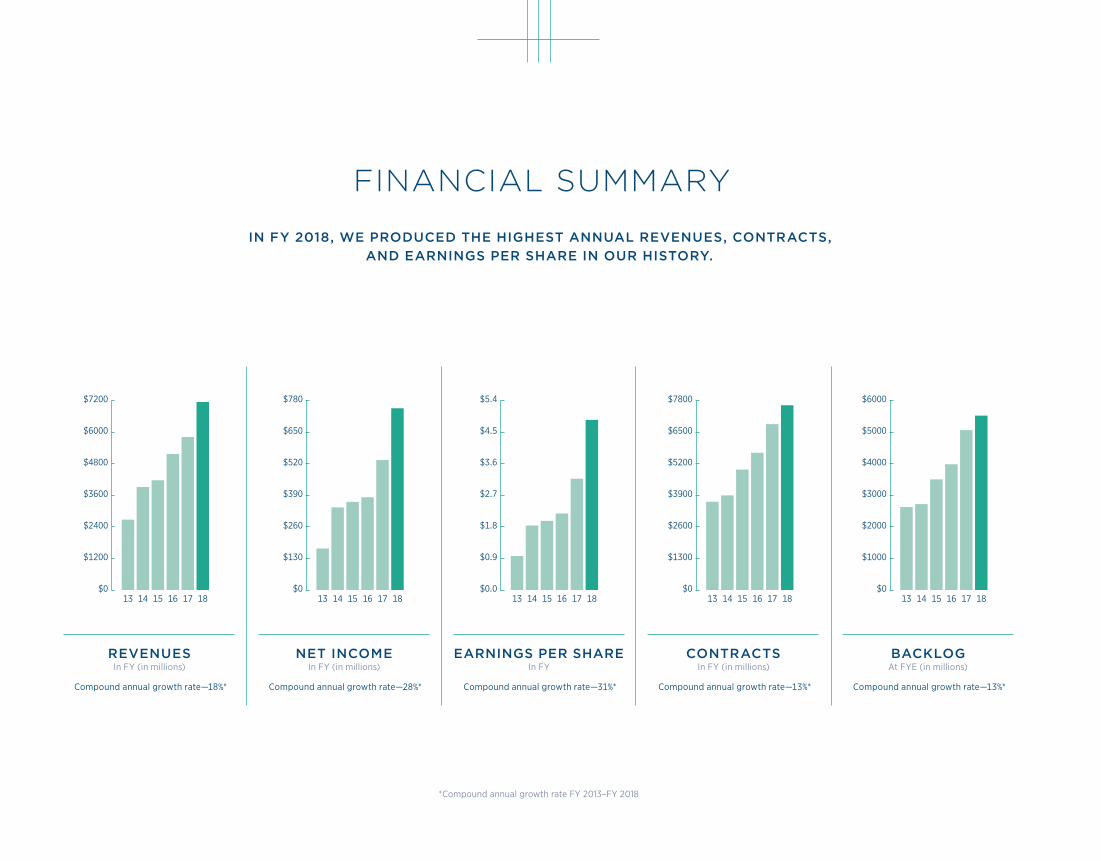
REVENUESIn FY (in millions)
Compound annual growth rate—18%*
NET INCOMEIn FY (in millions)
Compound annual growth rate—28%*
EARNINGS PER SHAREIn FY
Compound annual growth rate—31%*
CONTRACTSIn FY (in millions)
Compound annual growth rate—13%*
BACKLOGAt FYE (in millions)
Compound annual growth rate—13%*
*Compound annual growth rate FY 2013–FY 2018
FINANCIAL SUMMARY
IN FY 2018, WE PRODUCED THE HIGHEST ANNUAL REVENUES, CONTRACTS, AND EARNINGS PER SHARE IN OUR HISTORY.

The Solana | The Isles at Lakewood Ranch | Lakewood Ranch, FL

The Pradera | Toll Brothers at Whitewing | Gilbert, AZ
The Solitaire | Solano at Altair | Irvine, CA
Chancery Lane at Metro Crossing | Fremont, CA Artist’s Rendering
TOLL BROTHERS 2018 3
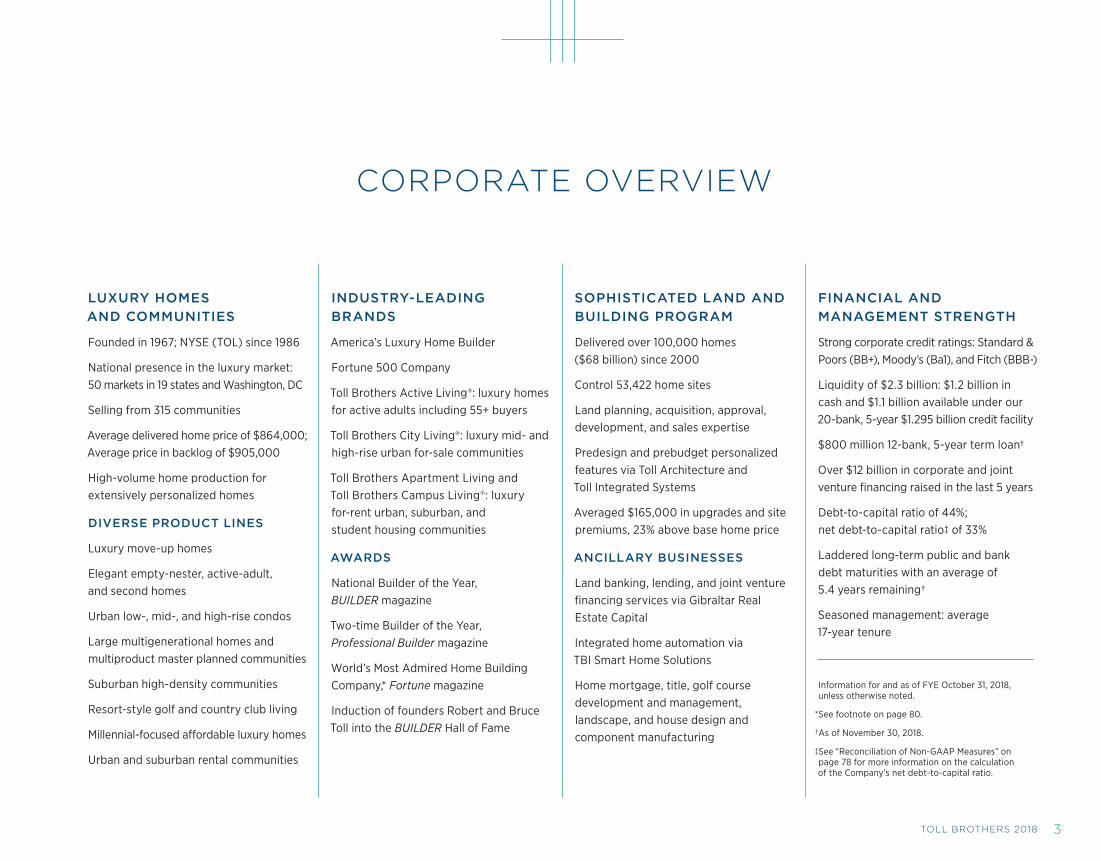
CORPORATE OVERVIEW
LUXURY HOMES AND COMMUNITIES
Founded in 1967; NYSE (TOL) since 1986
National presence in the luxury market: 50 markets in 19 states and Washington, DC
Selling from 315 communities
Average delivered home price of $864,000; Average price in backlog of $905,000
High-volume home production for extensively personalized homes
DIVERSE PRODUCT LINES
Luxury move-up homes
Elegant empty-nester, active-adult, and second homes
Urban low-, mid-, and high-rise condos
Large multigenerational homes and multiproduct master planned communities
Suburban high-density communities
Resort-style golf and country club living
Millennial-focused affordable luxury homes
Urban and suburban rental communities
INDUSTRY-LEADING BRANDS
America’s Luxury Home Builder
Fortune 500 Company
Toll Brothers Active Living®: luxury homes for active adults including 55+ buyers
Toll Brothers City Living®: luxury mid- and high-rise urban for-sale communities
Toll Brothers Apartment Living and Toll Brothers Campus Living®: luxury for-rent urban, suburban, and student housing communities
AWARDS
National Builder of the Year, BUILDER magazine
Two-time Builder of the Year, Professional Builder magazine
World’s Most Admired Home Building Company,* Fortune magazine
Induction of founders Robert and Bruce Toll into the BUILDER Hall of Fame
FINANCIAL AND MANAGEMENT STRENGTH
Strong corporate credit ratings: Standard & Poors (BB+), Moody’s (Ba1), and Fitch (BBB-)
Liquidity of $2.3 billion: $1.2 billion in cash and $1.1 billion available under our 20-bank, 5-year $1.295 billion credit facility
$800 million 12-bank, 5-year term loan†
Over $12 billion in corporate and joint venture financing raised in the last 5 years
Debt-to-capital ratio of 44%; net debt-to-capital ratio‡ of 33%
Laddered long-term public and bank debt maturities with an average of 5.4 years remaining†
Seasoned management: average 17-year tenure
Information for and as of FYE October 31, 2018, unless otherwise noted.
*See footnote on page 80.
†As of November 30, 2018.
‡See “Reconciliation of Non-GAAP Measures” on page 78 for more information on the calculation of the Company’s net debt-to-capital ratio.
SOPHISTICATED LAND AND BUILDING PROGRAM
Delivered over 100,000 homes ($68 billion) since 2000
Control 53,422 home sites
Land planning, acquisition, approval, development, and sales expertise
Predesign and prebudget personalized features via Toll Architecture and Toll Integrated Systems
Averaged $165,000 in upgrades and site premiums, 23% above base home price
ANCILLARY BUSINESSES
Land banking, lending, and joint venture financing services via Gibraltar Real Estate Capital
Integrated home automation via TBI Smart Home Solutions
Home mortgage, title, golf course development and management, landscape, and house design and component manufacturing

TOLL BROTHERS 20184
TX
CO
AZ
NV
CA
IDMI
IL
PA NJ
MDDE
CT
MANY
VA
NC
FL
WA
GEOGRAPHIC DIVERSIFICATION
$769
$759
$903
$1,031
$1,883
$178
TOTAL$5,523
BACKLOG*By segment at FYE 2018 (in millions)
Manhattan and Brooklyn, NYC Hoboken and Jersey City, NJ Philadelphia, PA Metro Washington, DC
CITY LIVING
8,021
9,192
9,447
17,000
8,308
1,454
HOME SITES CONTROLLED*By segment at FYE 2018
TOTAL53,422
$321
TOTAL $7,143
HOUSING REVENUES*By segment in FY 2018 (in millions)
$976
$2,209 $1,141
$1,045
$1,451
REGIONS NORTH: Connecticut, Illinois, Massachusetts, Michigan, New Jersey, New York
MID-ATLANTIC: Delaware, Maryland, Pennsylvania, Virginia
SOUTH: Florida, North Carolina, Texas
WEST: Arizona, Colorado, Idaho, Nevada, Washington
CALIFORNIA: Metro areas of Los Angeles, Palm Springs, Sacramento, San Diego, San Francisco, San Jose
*Includes MN, which the Company exited in FY 2018

The Henley | Reserve at Franklin Lakes | Franklin Lakes, NJ
The Lucida | Palomar at Pacific Highlands Ranch | San Diego, CA The Putnam | Westborough Village | Westborough, MA
The Burke Elite | Dawson Square | Bothell, WA55 West 17th | New York, NY The Villa Lago | Royal Palm Polo | Boca Raton, FL

The Bridleridge | Dominion Valley Country Club | Haymarket, VA

TOLL BROTHERS 2018 7
A RECORD YEAR IN FY 2018
With our broad geographic footprint and diverse product offerings, Toll Brothers has been
well-positioned to take advantage of the strong U.S. economy, improving demographics,
and the financial health of our affluent customer base. These were among the driving
factors that enabled us to deliver excellent results in FY 2018.
This year, we produced the highest revenues, contract value, and diluted earnings per share in
our 51-year history. In addition, our net income, home deliveries, contracts (in units) and year-
end backlog (in dollars and units) were the highest in over a decade. Our return on beginning
equity grew from 12.7% in FY 2017 to 16.5% in FY 2018. And our fourth-quarter revenues,
net income, and diluted earnings per share were the highest for any quarter in our history.
Compared to FY 2017, our FY 2018 net income and diluted earnings per share rose 40%
and 53%, our revenues and deliveries grew 23% and 16%, our contracts increased 11% in
dollars and 4% in units, and our backlog rose 9% in dollars and 4% in units. FY 2018 fourth-
quarter net income and diluted earnings per share rose 62% and 78%, while revenues and
deliveries rose 21% and 12%.
In our fourth quarter, despite a healthy economy, we saw a moderation in demand.
Fourth-quarter contracts declined 15% in dollars and 13% in units versus strong growth in
FY 2017’s fourth quarter. Fourth-quarter demand slowed to a per-community pace more
consistent with FY 2016’s fourth quarter, which was still strong.
In November through mid-December, we experienced further softening in demand, which
we attribute to the cumulative impact of rising interest rates, several years of home price
increases, and a shift in buyer sentiment.
California has seen the biggest decline. Significant price appreciation over the past few
years, fewer foreign buyers in certain communities, and the impact of rising interest rates all
contributed to this slowdown. But California is the world’s fifth-largest economy with diverse,
job-creating industries, including vibrant technology companies, a large concentration
of wealth, and desirable lifestyle options. With our attractive coastal California land, our
leading brand, and the state’s constrained supply of housing, we continue to believe in our
long-term position in the California market.
ECONOMIC FUNDAMENTALS REMAIN POSITIVE
There are a number of factors underpinning the economy that we believe are supportive
of the housing sector in the longer term and our upscale markets in particular.
Consumer confidence is near record levels. The nation is experiencing the lowest unem-
ployment rate in many decades. In the past few years, many of our customers have enjoyed
wealth creation through the stock market, salary increases, and home price appreciation.
Equity in existing homes is at an all-time high, providing significant liquidity for current
homeowners who want to upgrade to a new home.
DECEMBER 20, 2018
DEAR SHAREHOLDER

TOLL BROTHERS 20188
Demographic trends are favorable. Household formations are on the rise. The home-
ownership rate has increased from a historic low of 62.9% in 2016 to 64.4% today. That is
well below the peak of 69.2% in the second quarter of 2004. And there is still room to grow
to reach the average of 66.7% over the past 20 years.
New home supply remains constrained. Industry-wide production of single-family homes
is projected to be approximately 865,000 in 2018. This compares to 1.8 million at the last
peak in 2006 and the long-term average of 1 million single-family homes since 1970.
The 30-year mortgage rate is still quite low compared to historical norms. The credit
policies of mortgage lenders are much more disciplined than in the last cycle. These
restrictors of supply are in contrast to the last cycle when overbuilding, easy mortgages,
and buyer speculation resulted in a massive oversupply when the market softened.
The average age of the stock of existing homes in the United States is nearly 40 years. As
the only national home builder focused on the upscale market, Toll Brothers’ new homes
stand out against these older homes. We offer designs for today’s lifestyles, integrated
technology, energy efficiency, and ease of maintenance. And because our buyers, on
average, borrow less than 70% of their purchase price, they have the wherewithal to
extensively personalize their homes. Our average buyer makes a non-refundable deposit
of approximately $70,000 and adds over $160,000 in structural and designer options
and home site premiums to their base house.
A STRONGER, BETTER TOLL BROTHERS
For Toll Brothers, the past decade has been one of evolution, maturation, expansion, and
diversification of both our product lines and our geographic footprint. This has positioned
us well for continued long-term growth and to address potential challenges that we may
face in the near term.
Although we have operated as a national builder since the early 1990s, we had been more
heavily concentrated in the Boston-to-Washington, DC, corridor. Over the past decade, we
have repositioned and diversified our footprint. Our acquisitions of builders to enter new
markets in Seattle, Washington, in FY 2011 and Boise, Idaho, in FY 2016, and to significantly
expand our coastal California land position in FY 2014, combined with strategic land
acquisitions in western markets, have led to a geographic rebalancing. Our presence in
western states—Arizona, California, Colorado, Idaho, Nevada, Texas, and Washington (and
soon to include Utah and Oregon)—produced 58% of our revenues in FY 2018, up from
29% in FY 2011.
We have a tremendous variety of product lines to reach affluent customers across the
United States. Our home offerings include small, medium, and large, elegant single-family
move-up homes, attached townhomes, carriage homes, multiplex high-density properties,
active-adult and second-home communities, large multiproduct master plans, mid- and
high-rise urban condominiums, and urban and suburban rentals.
The Lounge | Parc Riverside | Toll Brothers Apartment Living | Washington, DC

The Siena | Royal Palm Polo | Boca Raton, FL

The Triana | Legacy at Seville | Gilbert, AZ
TOLL BROTHERS 2018 1 1
Our homes are appropriate for a wide variety of demographic groups. Our affluent baby
boomers, who average about 65 years of age at purchase, are catalyzing a robust active-
adult, empty-nester, and second-home market that operates differently from that of
move-up buyers. About 50% of our active-adult customers are all-cash buyers compared
to 20% company-wide. Approximately 19% of our homes in FY 2018 were purchased by
this demographic group.
Our move-up buyers continue to place a high priority on living in communities with access
to excellent schools, quality amenities, and convenience to work and culture, and in homes
with the most modern designs and technologies. Our land locations, home designs, and
personalization program are ideal for their lifestyles.
Millennials are finally making the transition from renters to buyers. After a decade or more
of earning solid incomes, many affluent millennials are making their first purchase a Toll
Brothers home. Nearly 22% of our contracts signed this year included one buyer 35 years
of age or under.
For those affluent customers who choose to rent instead of buy, we have our Toll Brothers
Apartment Living brand, which has a development pipeline of over 15,000 units. In FY 2018,
we recognized $56 million of pre-tax profit from this business, generating cash through
property sales, and development and management fees. This is a great standalone platform
and, even better, serves as a complement to our for-sale home building business.
A STURDY FINANCIAL FOUNDATION
We have built what we believe is a strong balance sheet while keeping our focus on
return on equity. We enjoy a solid liquidity position, low leverage, and long-dated debt
maturities. At FYE 2018, we had more than $2.3 billion of cash and available credit facilities,
a debt-to-capital ratio of 43.7% and a net debt-to-capital ratio‡ of 33.2%. Today, our
weighted-average debt maturity is 5.4 years, our weighted-average interest rate is 4.62%,
and we have only $250 million of public debt maturities in the next 3.2 years.
Our book value per share at FYE 2018 was $32.57, up from $28.82 a year earlier, and has
doubled since FYE 2012. We also have made progress in reducing our share count through
stock repurchases. Our fourth-quarter 2018 weighted-average share count was approximately
149.6 million shares, down 9% from a year ago. This contributed to the improvement in
our return on beginning equity from 12.7% in FY 2017 to 16.5% in FY 2018.
With our favorable liquidity position and the strength of our balance sheet, we will be able
to take advantage of land-buying opportunities and attractive builder acquisitions, pay
down debt, and invest in our Company through further share repurchases.
A GENERATIONAL CHANGE AND A BRIGHT FUTURE
In addition to the strong operational and financial results we achieved in FY 2018, we saw
the culmination of the transition in leadership that began when Doug Yearley assumed
the chief executive officer position in 2010. As previously announced, on October 31, 2018,
Bob Toll, co-founder, former chairman, and former chief executive officer, stepped down
from his role as executive chairman to become chairman emeritus. We will continue to
benefit from Bob’s knowledge, experience, and counsel as he will remain a member of the
Board of Directors and will serve as special advisor to the Company.
As we look to FY 2019, we thank our home buyers and renters, who choose us for the quality,
value, and service that define our Company; our suppliers and subcontractors, who help
translate our customers’ dreams into reality; and our capital providers and our shareholders,
who provide continued support.
We enter FY 2019 with a tremendous brand, a broad geographic footprint and diverse
product offerings, a well-located land portfolio in high-quality markets, and a strong
balance sheet. Most importantly, we have a tremendous team of Toll Brothers associates
who made FY 2018’s record results possible and are preparing us for a bright future.
ROBERT I. TOLLChairman Emeritus
DOUGLAS C. YEARLEY, JR.Chairman and Chief Executive Officer


The Monterey | Iron Oak at Alamo Creek | Danville, CA

TOLL BROTHERS 201814
EMBRACING TECHNOLOGY
Innovation is crucial to every facet of the home building industry today, and nowhere is the
drive to innovate more widespread than in operational excellence. Efficiency, precision, and
quality have been the focus of our technology initiatives in recent years, from production
through the customer experience.
Toll Integrated Systems, our manufacturing platform, is a leader in the industry in the high-
volume production and delivery of roof trusses, wall panels, and other home products.
Even though our homes are highly personalized, we have created an efficient, mechanized
process that allows us to manufacture these components and ship them directly to our
home sites.
In home design and architecture, virtual reality (VR) technology is making inroads in
enhancing the customer experience while achieving cost efficiencies. The use of VR
prototype homes in select markets has facilitated our ability to visualize and refine home
designs before we even break ground. For our home buyers, we have introduced similar
technology through our VR sales tools. These tools include our Kitchen 360 experience, in
which buyers can enter a virtual kitchen and envision their selections in a three-dimensional
space, as well as our VR model home tours, which allow customers to walk the model
home virtually before it is built.
As we remain steadfast in our drive to innovate by anticipating, understanding and
integrating new technologies into our everyday processes and our customers’ experiences,
we will continue to embrace the qualities that have made Toll Brothers the nation’s leading
builder of luxury homes.

The Rosslyn | The Ridings at North Branch | Gambrills, MD

TOLL BROTHERS 201816
A CULTURE OF FINANCIAL DISCIPLINE
Our 50+ years in the home building business have taught us that maintaining financial
discipline is as important as designing and building beautiful homes.
Our strong balance sheet is defined by modest leverage, solid liquidity, and long-dated debt
maturities. We ended FY 2018 with over $2.3 billion of cash and available credit facilities, a net
debt-to-capital ratio‡ of 33.2%, and weighted-average debt maturities exceeding five years.
To manage risk, each of our land acquisitions is reviewed and approved at the top of our
Company. In recent years, we have rebalanced our land strategy to increase land controlled
through options and reduce directly owned land. Optioned home sites now account for
about 40% of the total home sites we control versus 30% two years ago.
We also carefully structure other transactions to reduce risk and increase capital efficiency.
For some of our larger urban condominium projects, a number of our multi-year thousand-
plus home site master planned communities, and all of our rental projects, we form joint
ventures with equity partners, then secure project-specific bank construction loans.
Our reputation in the capital markets has enabled us to raise over $2 billion in the past
15 months. On the project finance side, we completed over $900 million of transactions
including new joint venture debt and equity capital raises, recapitalizations, and asset sales.
On the corporate finance side, in January 2018, we raised $400 million of 10-year debt
in the public markets at very attractive rates. And in November 2018, we increased our
multibank term loan facility to $800 million and extended the maturity to five years while
reducing our interest rate spread.
Our ability to access capital helps strengthen our balance sheet and prepare us for
future opportunities.
The Bayhill | Regency at Kimberton Glen | Phoenixville, PA
The Chatfield | Vista Point at Southshore | Aurora, CO
The Vallagio | Edgestone at Legacy | Frisco, TX

The Lucida | Palomar at Pacific Highlands Ranch | San Diego, CA

1425 Hudson Street | Hoboken, NJ Artist’s Rendering

TOLL BROTHERS 2018 1919
SERVING SWEET SPOTS IN THE LUXURY MARKET
We build communities defined by distinctive architecture that range from as few as 20
homes to as many as several thousand homes in large-scale master planned communities
featuring golf courses, tennis courts, fitness centers, pools, and hiking trails. We create
active-adult communities which appeal to buyers aged 55+. Our first-floor master-bedroom
designs attract empty-nesters and never-nesters who desire one-floor living. Some of our
smaller single-family and attached homes draw millennials buying their first home. Our
larger homes in move-up communities entice growing families. Many of these buyers
choose from our structural options to create personalized first-floor and lower-level
residential suites that enable multiple generations to share a home. Those who seek
urban high-rise living can select from our variety of high-rise condominiums built under
the Toll Brothers City Living brand. Or they can rent in our urban buildings developed
by Toll Brothers Apartment Living, which also develops suburban rental properties.
With a median price of approximately $685,000, our homes are accessible to a broad range
of buyers. It is our goal to be the brand of choice for affluent residential customers at every
stage of their active life cycles.
The Woodberry | Retreat at McLean | McLean, VA
The Verano | Sorrento Trail at Bella Vista Ranch | Reno, NV

The Bellwynn | Montgomery Farm Estates | Allen, TX
The Sutton | New York, NY
The Dandridge | Preserve at Kimberton Glen | Phoenixville, PA

TOLL BROTHERS 2018 21
22 Toll Brothers' 33-Year Financial Summary
26 Forward-Looking Statements
26 Management's Discussion and Analysis
46 Management's Annual Report on Internal Control Over Financial Reporting
47 Reports of Independent Registered Public Accounting Firm
48 Consolidated Balance Sheets
48 Consolidated Statements of Operations and Comprehensive Income
49 Consolidated Statements of Changes in Equity
50 Consolidated Statements of Cash Flows
51 Notes to Consolidated Financial Statements
78 Dividends
78 Reconciliation of Non-GAAP Measures
78 Stockholder Return Performance Graph
79 Corporate Directors and Officers
80 Corporate Information
FINANCIAL
TABLE OF CONTENTS

TOLL BROTHERS 201822
TOLL BROTHERS’ 33-YEAR FINANCIAL SUMMARY 1986–2018Summary Consolidated Statement of Operations Data (amounts in thousands, except per share data)
Year Ended October 31, 2018 2017 2016 2015 2014 2013 2012 2011 2010 2009 2008 2007 2006 2005 2004 2003 2002 2001 2000 1999 1998 1997 1996 1995 1994 1993 1992 1991 1990 1989 1988 1987 1986
Revenues $ 7,143,258 $ 5,815,058 $ 5,169,508 $ 4,171,248 $ 3,911,602 $ 2,674,299 $ 1,882,781 $ 1,475,881 $ 1,494,771 $ 1,755,310 $ 3,148,166 $ 4,635,093 $ 6,115,280 $ 5,759,301 $ 3,839,451 $ 2,731,044 $ 2,279,261 $ 2,180,469 $ 1,762,930 $ 1,438,171 $ 1,206,290 $ 968,253 $ 759,303 $ 643,017 $ 501,822 $ 392,560 $ 279,841 $ 175,971 $ 198,336 $ 176,864 $ 197,027 $ 134,856 $ 124,641
Pre-tax Income (loss) $ 933,916 $ 814,311 $ 589,027 $ 535,562 $ 504,582 $ 267,697 $ 112,942 $ (29,366) $ (117,187) $ (496,465) $ (466,787) $ 70,680 $ 1,126,616 $ 1,323,128 $ 647,432 $ 411,153 $ 347,318 $ 337,889 $ 230,966 $ 160,432 $ 132,523 $ 103,215 $ 85,793 $ 79,439 $ 56,840 $ 42,820 $ 27,493 $ 8,444 $ 16,801 $ 21,520 $ 40,803 $ 33,346 $ 23,718
Net income (loss) $ 748,151 $ 535,495 $ 382,095 $ 363,167 $ 340,032 $ 170,606 $ 487,146 $ 39,795 $ (3,374) $ (755,825) $ (297,810) $ 35,651 $ 687,213 $ 806,110 $ 409,111 $ 259,820 $ 219,887 $ 213,673 $ 145,943 $ 101,566 $ 84,704 $ 65,075 $ 53,744 $ 49,932 $ 36,177 $ 28,058 $ 16,538 $ 5,013 $ 9,988 $ 13,127 $ 24,074 $ 17,173 $ 11,861
Earnings (loss) per share — Diluted $ 4.85 $ 3.17 $ 2.18 $ 1.97 $ 1.84 $ 0.97 $ 2.86 $ 0.24 $ (0.02) $ (4.68) $ (1.88) $ 0.22 $ 4.17 $ 4.78 $ 2.52 $ 1.72 $ 1.46 $ 1.38 $ 0.98 $ 0.68 $ 0.55 $ 0.44 $ 0.36 $ 0.34 $ 0.25 $ 0.21 $ 0.12 $ 0.04 $ 0.08 $ 0.11 $ 0.20 $ 0.14 $ 0.11
Weighted-average number of shares — Diluted 154,201 169,487 175,973 184,703 185,875 177,963 170,154 168,381 165,666 161,549 158,730 164,166 164,852 168,552 162,330 151,083 150,959 154,734 149,651 149,744 153,441 149,049 147,516 145,440 142,620 133,868 132,936 125,648 118,856 119,880 120,612 121,540 111,812
Summary Consolidated Balance Sheet Data (amounts in thousands, except per share data)
At October 31, 2018 2017 2016 2015 2014 2013 2012 2011 2010 2009 2008 2007 2006 2005 2004 2003 2002 2001 2000 1999 1998 1997 1996 1995 1994 1993 1992 1991 1990 1989 1988 1987 1986
Cash and marketable securities $ 1,182,195 $ 712,829 $ 633,715 $ 928,994 $ 598,341 $ 825,480 $ 1,217,892 $ 1,139,912 $ 1,236,927 $ 1,908,894 $ 1,633,495 $ 900,337 $ 632,524 $ 689,219 $ 580,863 $ 425,251 $ 102,337 $ 182,840 $ 161,860 $ 96,484 $ 80,143 $ 147,575 $ 22,891 $ 27,772 $ 38,026 $ 32,329 $ 33,407 $ 31,475 $ 10,379 $ 9,160 $ 27,110 $ 18,009 $ 14,720
Inventory $ 7,598,219 $ 7,281,453 $ 7,353,967 $ 6,997,516 $ 6,490,321 $ 4,650,412 $ 3,732,703 $ 3,416,723 $ 3,241,725 $ 3,183,566 $ 4,127,475 $ 5,572,655 $ 6,095,702 $ 5,068,624 $ 3,878,260 $ 3,080,349 $ 2,551,061 $ 2,183,541 $ 1,712,383 $ 1,443,282 $ 1,111,863 $ 921,595 $ 772,471 $ 623,830 $ 506,347 $ 402,515 $ 287,844 $ 222,775 $ 240,155 $ 256,934 $ 206,593 $ 143,894 $ 66,543
Total assets $ 10,244,590 $ 9,445,225 $ 9,736,789 $ 9,206,515 $ 8,398,457 $ 6,811,782 $ 6,165,915 $ 5,048,478 $ 5,163,450 $ 5,624,972 $ 6,582,350 $ 7,214,739 $ 7,576,873 $ 6,336,251 $ 4,897,626 $ 3,779,440 $ 2,888,671 $ 2,525,014 $ 2,025,633 $ 1,662,810 $ 1,250,505 $ 1,113,012 $ 833,189 $ 686,703 $ 580,148 $ 470,441 $ 380,584 $ 312,424 $ 316,534 $ 348,163 $ 256,611 $ 181,765 $ 108,185
Debt
Loans payable $ 686,801 $ 637,416 $ 871,079 $ 1,000,439 $ 652,619 $ 107,222 $ 99,817 $ 106,556 $ 94,491 $ 472,854 $ 613,594 $ 696,814 $ 736,934 $ 250,552 $ 340,380 $ 281,697 $ 253,194 $ 362,712 $ 326,537 $ 213,317 $ 182,292 $ 189,579 $ 132,109 $ 59,057 $ 17,506 $ 24,779 $ 25,756 $ 49,943 $ 71,707 $ 95,508 $ 74,048 $ 55,545 $ 12,474Senior notes 2,861,375 2,462,463 2,694,372 2,689,801 2,638,241 2,305,765 2,065,334 1,484,204 1,536,005 1,578,212 1,139,895 1,138,065 1,136,235 1,134,575 840,737 543,170Subordinated notes 47,836 342,064 348,664 348,264 347,864 446,976 615,548 812,969 662,395 464,878 464,166 265,333 314,310 203,678 215,472 221,224 168,885 124,602 55,513 61,474 69,681 69,635 29,967 29,963Mortgage related debt 150,000 120,145 210,000 100,000 90,281 75,000 72,664 57,409 72,367 27,015 37,867 76,730 119,705 89,674 92,053 49,939 48,996 24,754 1,145 1,384 2,577 2,816 3,912 4,686 10,810 24,403 39,864 45,988 52,617 382 5,969Total $ 3,698,176 $ 3,220,024 $ 3,775,451 $ 3,790,240 $ 3,381,141 $ 2,487,987 $ 2,237,815 $ 1,648,169 $ 1,702,863 $ 2,125,917 $ 2,133,420 $ 2,260,273 $ 2,341,138 $ 1,822,665 $ 1,720,146 $ 1,490,354 $ 1,115,159 $ 1,049,861 $ 791,415 $ 678,628 $ 449,009 $ 506,466 $ 338,603 $ 278,441 $ 243,416 $ 204,474 $ 174,761 $ 145,320 $ 179,169 $ 217,806 $ 143,683 $ 85,894 $ 48,406
Stockholders’ Equity $ 4,760,199 $ 4,531,194 $ 4,229,292 $ 4,222,557 $ 3,854,376 $ 3,332,987 $ 3,121,700 $ 2,586,353 $ 2,555,453 $ 2,513,199 $ 3,237,653 $ 3,527,234 $ 3,415,926 $ 2,763,571 $ 1,919,987 $ 1,476,628 $ 1,129,509 $ 912,583 $ 745,145 $ 616,334 $ 525,756 $ 385,252 $ 314,677 $ 256,659 $ 204,176 $ 167,136 $ 136,605 $ 118,195 $ 94,959 $ 85,832 $ 73,305 $ 48,842 $ 31,405
Number of shares outstanding 146,163 157,205 161,783 174,847 175,046 169,353 168,637 165,729 166,408 164,725 160,369 157,008 153,899 154,943 149,642 146,644 140,432 139,112 143,580 145,814 147,742 137,102 135,674 134,552 133,692 133,276 132,348 131,248 118,736 119,652 120,168 120,268 119,972
Book value per share $ 32.57 $ 28.82 $ 26.14 $ 24.15 $ 22.02 $ 19.68 $ 18.51 $ 15.61 $ 15.36 $ 15.26 $ 20.19 $ 22.47 $ 22.20 $ 17.84 $ 12.83 $ 10.07 $ 8.04 $ 6.56 $ 5.19 $ 4.23 $ 3.56 $ 2.81 $ 2.32 $ 1.91 $ 1.53 $ 1.25 $ 1.03 $ 0.90 $ 0.80 $ 0.72 $ 0.61 $ 0.41 $ 0.26
Return on beginning Stockholders’ Equity 16.5% 12.7% 9.0% 9.4% 10.2% 5.5% 18.8% 1.6% (0.1%) (23.3%) (8.4%) 1.0% 24.9% 42.0% 27.7% 23.0% 24.1% 28.7% 23.7% 19.3% 22.0% 20.7% 20.9% 24.5% 21.7% 20.6% 14.0% 5.3% 11.7% 18.0% 49.3% 54.7% 122.5%
Home DataYear Ended October 31, 2018 2017 2016 2015 2014 2013 2012 2011 2010 2009 2008 2007 2006 2005 2004 2003 2002 2001 2000 1999 1998 1997 1996 1995 1994 1993 1992 1991 1990 1989 1988 1987 1986
Number of homes closed (1) 8,265 7,151 6,098 5,525 5,397 4,184 3,286 2,611 2,642 2,965 4,743 6,687 8,601 8,769 6,627 4,911 4,430 4,358 3,945 3,555 3,099 2,517 2,109 1,825 1,583 1,324 1,019 676 727 676 778 674 802
Sales value of homes closed (1)(3) $ 7,143,258 $ 5,815,058 $ 5,169,508 $ 4,171,248 $ 3,911,602 $ 2,674,299 $ 1,882,781 $ 1,475,881 $ 1,494,771 $ 1,755,310 $ 3,106,293 $ 4,495,600 $ 5,945,169 $ 5,759,301 $ 3,839,451 $ 2,731,044 $ 2,279,261 $ 2,180,469 $ 1,762,930 $ 1,438,171 $ 1,206,290 $ 968,253 $ 759,303 $ 643,017 $ 501,822 $ 392,560 $ 279,841 $ 175,971 $ 198,336 $ 176,864 $ 197,027 $ 134,856 $ 124,641
Revenues — % of completion (3) $ 41,873 $ 139,493 $ 170,111
Number of homes contracted 8,519 8,175 6,719 5,910 5,271 5,294 4,159 2,784 2,605 2,450 2,927 4,440 6,164 10,372 8,684 6,132 5,070 4,314 4,364 3,799 3,387 2,701 2,398 1,846 1,716 1,595 1,202 863 612 704 656 756 832
Sales value of homes contracted (3) $ 7,604,265 $ 6,828,277 $ 5,649,570 $ 4,955,579 $ 3,896,490 $ 3,633,908 $ 2,557,917 $ 1,604,827 $ 1,472,030 $ 1,304,656 $ 1,608,191 $ 3,010,013 $ 4,460,734 $ 7,152,463 $ 5,641,454 $ 3,475,992 $ 2,734,457 $ 2,158,536 $ 2,134,522 $ 1,627,849 $ 1,383,093 $ 1,069,279 $ 884,677 $ 660,467 $ 586,941 $ 490,883 $ 342,811 $ 230,324 $ 163,975 $ 185,255 $ 162,504 $ 190,680 $ 133,369
At October 31, 2018 2017 2016 2015 2014 2013 2012 2011 2010 2009 2008 2007 2006 2005 2004 2003 2002 2001 2000 1999 1998 1997 1996 1995 1994 1993 1992 1991 1990 1989 1988 1987 1986
Number of homes in backlog 6,105 5,851 4,685 4,064 3,679 3,679 2,569 1,667 1,494 1,531 2,046 3,950 6,533 8,805 6,709 4,652 3,342 2,702 2,746 2,327 1,892 1,551 1,367 1,078 1,025 892 621 438 251 366 338 460 378
Sales value of homes in backlog (2)(3) $ 5,522,523 $ 5,061,517 $ 3,984,065 $ 3,504,004 $ 2,719,673 $ 2,629,466 $ 1,669,857 $ 981,052 $ 852,106 $ 874,837 $ 1,325,491 $ 2,854,435 $ 4,488,400 $ 6,014,648 $ 4,433,895 $ 2,631,900 $ 1,858,784 $ 1,403,588 $ 1,425,521 $ 1,053,929 $ 814,714 $ 627,220 $ 526,194 $ 400,820 $ 370,560 $ 285,441 $ 187,118 $ 124,148 $ 69,795 $ 104,156 $ 95,765 $ 130,288 $ 74,194
Number of selling communities 315 305 310 288 263 232 224 215 195 200 273 315 300 230 220 200 170 155 146 140 122 116 100 97 80 67 62 42 41 40 26 21 15
Home sites
Owned 32,503 31,341 34,137 35,872 36,224 33,967 31,327 30,199 28,891 26,872 32,081 37,139 41,808 35,838 29,804 29,081 25,822 25,981 22,275 23,163 15,578 12,820 12,065 9,542 6,779 5,744 5,633 3,974 4,548 5,075 4,724 2,147 1,461Optioned 20,919 16,970 14,700 8,381 10,943 14,661 9,023 7,298 5,961 5,045 7,703 22,112 31,960 47,288 30,385 18,977 15,022 13,165 10,843 11,268 14,803 9,145 5,237 5,042 4,445 4,271 3,592 3,281 2,117 2,832 4,041 7,141 4,853
Total 53,422 48,311 48,837 44,253 47,167 48,628 40,350 37,497 34,852 31,917 39,784 59,251 73,768 83,126 60,189 48,058 40,844 39,146 33,118 34,431 30,381 21,965 17,302 14,584 11,224 10,015 9,225 7,255 6,665 7,907 8,765 9,288 6,314
(1) Excludes 88 units with an aggregate delivered value of $86.1 million in fiscal 2008 and 336 units with an aggregate delivered value of $263.3 million in fiscal 2007 that were accounted for using the percentage of completion accounting method.
(2) Net of $55.2 million and $170.1 million of revenues recognized in fiscal 2007 and 2006, respectively, under the percentage of completion accounting method. (3) In 000’s

TOLL BROTHERS 2018 23
TOLL BROTHERS’ 33-YEAR FINANCIAL SUMMARY 1986–2018Summary Consolidated Statement of Operations Data (amounts in thousands, except per share data)
Year Ended October 31, 2018 2017 2016 2015 2014 2013 2012 2011 2010 2009 2008 2007 2006 2005 2004 2003 2002 2001 2000 1999 1998 1997 1996 1995 1994 1993 1992 1991 1990 1989 1988 1987 1986
Revenues $ 7,143,258 $ 5,815,058 $ 5,169,508 $ 4,171,248 $ 3,911,602 $ 2,674,299 $ 1,882,781 $ 1,475,881 $ 1,494,771 $ 1,755,310 $ 3,148,166 $ 4,635,093 $ 6,115,280 $ 5,759,301 $ 3,839,451 $ 2,731,044 $ 2,279,261 $ 2,180,469 $ 1,762,930 $ 1,438,171 $ 1,206,290 $ 968,253 $ 759,303 $ 643,017 $ 501,822 $ 392,560 $ 279,841 $ 175,971 $ 198,336 $ 176,864 $ 197,027 $ 134,856 $ 124,641
Pre-tax Income (loss) $ 933,916 $ 814,311 $ 589,027 $ 535,562 $ 504,582 $ 267,697 $ 112,942 $ (29,366) $ (117,187) $ (496,465) $ (466,787) $ 70,680 $ 1,126,616 $ 1,323,128 $ 647,432 $ 411,153 $ 347,318 $ 337,889 $ 230,966 $ 160,432 $ 132,523 $ 103,215 $ 85,793 $ 79,439 $ 56,840 $ 42,820 $ 27,493 $ 8,444 $ 16,801 $ 21,520 $ 40,803 $ 33,346 $ 23,718
Net income (loss) $ 748,151 $ 535,495 $ 382,095 $ 363,167 $ 340,032 $ 170,606 $ 487,146 $ 39,795 $ (3,374) $ (755,825) $ (297,810) $ 35,651 $ 687,213 $ 806,110 $ 409,111 $ 259,820 $ 219,887 $ 213,673 $ 145,943 $ 101,566 $ 84,704 $ 65,075 $ 53,744 $ 49,932 $ 36,177 $ 28,058 $ 16,538 $ 5,013 $ 9,988 $ 13,127 $ 24,074 $ 17,173 $ 11,861
Earnings (loss) per share — Diluted $ 4.85 $ 3.17 $ 2.18 $ 1.97 $ 1.84 $ 0.97 $ 2.86 $ 0.24 $ (0.02) $ (4.68) $ (1.88) $ 0.22 $ 4.17 $ 4.78 $ 2.52 $ 1.72 $ 1.46 $ 1.38 $ 0.98 $ 0.68 $ 0.55 $ 0.44 $ 0.36 $ 0.34 $ 0.25 $ 0.21 $ 0.12 $ 0.04 $ 0.08 $ 0.11 $ 0.20 $ 0.14 $ 0.11
Weighted-average number of shares — Diluted 154,201 169,487 175,973 184,703 185,875 177,963 170,154 168,381 165,666 161,549 158,730 164,166 164,852 168,552 162,330 151,083 150,959 154,734 149,651 149,744 153,441 149,049 147,516 145,440 142,620 133,868 132,936 125,648 118,856 119,880 120,612 121,540 111,812
Summary Consolidated Balance Sheet Data (amounts in thousands, except per share data)
At October 31, 2018 2017 2016 2015 2014 2013 2012 2011 2010 2009 2008 2007 2006 2005 2004 2003 2002 2001 2000 1999 1998 1997 1996 1995 1994 1993 1992 1991 1990 1989 1988 1987 1986
Cash and marketable securities $ 1,182,195 $ 712,829 $ 633,715 $ 928,994 $ 598,341 $ 825,480 $ 1,217,892 $ 1,139,912 $ 1,236,927 $ 1,908,894 $ 1,633,495 $ 900,337 $ 632,524 $ 689,219 $ 580,863 $ 425,251 $ 102,337 $ 182,840 $ 161,860 $ 96,484 $ 80,143 $ 147,575 $ 22,891 $ 27,772 $ 38,026 $ 32,329 $ 33,407 $ 31,475 $ 10,379 $ 9,160 $ 27,110 $ 18,009 $ 14,720
Inventory $ 7,598,219 $ 7,281,453 $ 7,353,967 $ 6,997,516 $ 6,490,321 $ 4,650,412 $ 3,732,703 $ 3,416,723 $ 3,241,725 $ 3,183,566 $ 4,127,475 $ 5,572,655 $ 6,095,702 $ 5,068,624 $ 3,878,260 $ 3,080,349 $ 2,551,061 $ 2,183,541 $ 1,712,383 $ 1,443,282 $ 1,111,863 $ 921,595 $ 772,471 $ 623,830 $ 506,347 $ 402,515 $ 287,844 $ 222,775 $ 240,155 $ 256,934 $ 206,593 $ 143,894 $ 66,543
Total assets $ 10,244,590 $ 9,445,225 $ 9,736,789 $ 9,206,515 $ 8,398,457 $ 6,811,782 $ 6,165,915 $ 5,048,478 $ 5,163,450 $ 5,624,972 $ 6,582,350 $ 7,214,739 $ 7,576,873 $ 6,336,251 $ 4,897,626 $ 3,779,440 $ 2,888,671 $ 2,525,014 $ 2,025,633 $ 1,662,810 $ 1,250,505 $ 1,113,012 $ 833,189 $ 686,703 $ 580,148 $ 470,441 $ 380,584 $ 312,424 $ 316,534 $ 348,163 $ 256,611 $ 181,765 $ 108,185
Debt
Loans payable $ 686,801 $ 637,416 $ 871,079 $ 1,000,439 $ 652,619 $ 107,222 $ 99,817 $ 106,556 $ 94,491 $ 472,854 $ 613,594 $ 696,814 $ 736,934 $ 250,552 $ 340,380 $ 281,697 $ 253,194 $ 362,712 $ 326,537 $ 213,317 $ 182,292 $ 189,579 $ 132,109 $ 59,057 $ 17,506 $ 24,779 $ 25,756 $ 49,943 $ 71,707 $ 95,508 $ 74,048 $ 55,545 $ 12,474Senior notes 2,861,375 2,462,463 2,694,372 2,689,801 2,638,241 2,305,765 2,065,334 1,484,204 1,536,005 1,578,212 1,139,895 1,138,065 1,136,235 1,134,575 840,737 543,170Subordinated notes 47,836 342,064 348,664 348,264 347,864 446,976 615,548 812,969 662,395 464,878 464,166 265,333 314,310 203,678 215,472 221,224 168,885 124,602 55,513 61,474 69,681 69,635 29,967 29,963Mortgage related debt 150,000 120,145 210,000 100,000 90,281 75,000 72,664 57,409 72,367 27,015 37,867 76,730 119,705 89,674 92,053 49,939 48,996 24,754 1,145 1,384 2,577 2,816 3,912 4,686 10,810 24,403 39,864 45,988 52,617 382 5,969Total $ 3,698,176 $ 3,220,024 $ 3,775,451 $ 3,790,240 $ 3,381,141 $ 2,487,987 $ 2,237,815 $ 1,648,169 $ 1,702,863 $ 2,125,917 $ 2,133,420 $ 2,260,273 $ 2,341,138 $ 1,822,665 $ 1,720,146 $ 1,490,354 $ 1,115,159 $ 1,049,861 $ 791,415 $ 678,628 $ 449,009 $ 506,466 $ 338,603 $ 278,441 $ 243,416 $ 204,474 $ 174,761 $ 145,320 $ 179,169 $ 217,806 $ 143,683 $ 85,894 $ 48,406
Stockholders’ Equity $ 4,760,199 $ 4,531,194 $ 4,229,292 $ 4,222,557 $ 3,854,376 $ 3,332,987 $ 3,121,700 $ 2,586,353 $ 2,555,453 $ 2,513,199 $ 3,237,653 $ 3,527,234 $ 3,415,926 $ 2,763,571 $ 1,919,987 $ 1,476,628 $ 1,129,509 $ 912,583 $ 745,145 $ 616,334 $ 525,756 $ 385,252 $ 314,677 $ 256,659 $ 204,176 $ 167,136 $ 136,605 $ 118,195 $ 94,959 $ 85,832 $ 73,305 $ 48,842 $ 31,405
Number of shares outstanding 146,163 157,205 161,783 174,847 175,046 169,353 168,637 165,729 166,408 164,725 160,369 157,008 153,899 154,943 149,642 146,644 140,432 139,112 143,580 145,814 147,742 137,102 135,674 134,552 133,692 133,276 132,348 131,248 118,736 119,652 120,168 120,268 119,972
Book value per share $ 32.57 $ 28.82 $ 26.14 $ 24.15 $ 22.02 $ 19.68 $ 18.51 $ 15.61 $ 15.36 $ 15.26 $ 20.19 $ 22.47 $ 22.20 $ 17.84 $ 12.83 $ 10.07 $ 8.04 $ 6.56 $ 5.19 $ 4.23 $ 3.56 $ 2.81 $ 2.32 $ 1.91 $ 1.53 $ 1.25 $ 1.03 $ 0.90 $ 0.80 $ 0.72 $ 0.61 $ 0.41 $ 0.26
Return on beginning Stockholders’ Equity 16.5% 12.7% 9.0% 9.4% 10.2% 5.5% 18.8% 1.6% (0.1%) (23.3%) (8.4%) 1.0% 24.9% 42.0% 27.7% 23.0% 24.1% 28.7% 23.7% 19.3% 22.0% 20.7% 20.9% 24.5% 21.7% 20.6% 14.0% 5.3% 11.7% 18.0% 49.3% 54.7% 122.5%
Home DataYear Ended October 31, 2018 2017 2016 2015 2014 2013 2012 2011 2010 2009 2008 2007 2006 2005 2004 2003 2002 2001 2000 1999 1998 1997 1996 1995 1994 1993 1992 1991 1990 1989 1988 1987 1986
Number of homes closed (1) 8,265 7,151 6,098 5,525 5,397 4,184 3,286 2,611 2,642 2,965 4,743 6,687 8,601 8,769 6,627 4,911 4,430 4,358 3,945 3,555 3,099 2,517 2,109 1,825 1,583 1,324 1,019 676 727 676 778 674 802
Sales value of homes closed (1)(3) $ 7,143,258 $ 5,815,058 $ 5,169,508 $ 4,171,248 $ 3,911,602 $ 2,674,299 $ 1,882,781 $ 1,475,881 $ 1,494,771 $ 1,755,310 $ 3,106,293 $ 4,495,600 $ 5,945,169 $ 5,759,301 $ 3,839,451 $ 2,731,044 $ 2,279,261 $ 2,180,469 $ 1,762,930 $ 1,438,171 $ 1,206,290 $ 968,253 $ 759,303 $ 643,017 $ 501,822 $ 392,560 $ 279,841 $ 175,971 $ 198,336 $ 176,864 $ 197,027 $ 134,856 $ 124,641
Revenues — % of completion (3) $ 41,873 $ 139,493 $ 170,111
Number of homes contracted 8,519 8,175 6,719 5,910 5,271 5,294 4,159 2,784 2,605 2,450 2,927 4,440 6,164 10,372 8,684 6,132 5,070 4,314 4,364 3,799 3,387 2,701 2,398 1,846 1,716 1,595 1,202 863 612 704 656 756 832
Sales value of homes contracted (3) $ 7,604,265 $ 6,828,277 $ 5,649,570 $ 4,955,579 $ 3,896,490 $ 3,633,908 $ 2,557,917 $ 1,604,827 $ 1,472,030 $ 1,304,656 $ 1,608,191 $ 3,010,013 $ 4,460,734 $ 7,152,463 $ 5,641,454 $ 3,475,992 $ 2,734,457 $ 2,158,536 $ 2,134,522 $ 1,627,849 $ 1,383,093 $ 1,069,279 $ 884,677 $ 660,467 $ 586,941 $ 490,883 $ 342,811 $ 230,324 $ 163,975 $ 185,255 $ 162,504 $ 190,680 $ 133,369
At October 31, 2018 2017 2016 2015 2014 2013 2012 2011 2010 2009 2008 2007 2006 2005 2004 2003 2002 2001 2000 1999 1998 1997 1996 1995 1994 1993 1992 1991 1990 1989 1988 1987 1986
Number of homes in backlog 6,105 5,851 4,685 4,064 3,679 3,679 2,569 1,667 1,494 1,531 2,046 3,950 6,533 8,805 6,709 4,652 3,342 2,702 2,746 2,327 1,892 1,551 1,367 1,078 1,025 892 621 438 251 366 338 460 378
Sales value of homes in backlog (2)(3) $ 5,522,523 $ 5,061,517 $ 3,984,065 $ 3,504,004 $ 2,719,673 $ 2,629,466 $ 1,669,857 $ 981,052 $ 852,106 $ 874,837 $ 1,325,491 $ 2,854,435 $ 4,488,400 $ 6,014,648 $ 4,433,895 $ 2,631,900 $ 1,858,784 $ 1,403,588 $ 1,425,521 $ 1,053,929 $ 814,714 $ 627,220 $ 526,194 $ 400,820 $ 370,560 $ 285,441 $ 187,118 $ 124,148 $ 69,795 $ 104,156 $ 95,765 $ 130,288 $ 74,194
Number of selling communities 315 305 310 288 263 232 224 215 195 200 273 315 300 230 220 200 170 155 146 140 122 116 100 97 80 67 62 42 41 40 26 21 15
Home sites
Owned 32,503 31,341 34,137 35,872 36,224 33,967 31,327 30,199 28,891 26,872 32,081 37,139 41,808 35,838 29,804 29,081 25,822 25,981 22,275 23,163 15,578 12,820 12,065 9,542 6,779 5,744 5,633 3,974 4,548 5,075 4,724 2,147 1,461Optioned 20,919 16,970 14,700 8,381 10,943 14,661 9,023 7,298 5,961 5,045 7,703 22,112 31,960 47,288 30,385 18,977 15,022 13,165 10,843 11,268 14,803 9,145 5,237 5,042 4,445 4,271 3,592 3,281 2,117 2,832 4,041 7,141 4,853
Total 53,422 48,311 48,837 44,253 47,167 48,628 40,350 37,497 34,852 31,917 39,784 59,251 73,768 83,126 60,189 48,058 40,844 39,146 33,118 34,431 30,381 21,965 17,302 14,584 11,224 10,015 9,225 7,255 6,665 7,907 8,765 9,288 6,314
(1) Excludes 88 units with an aggregate delivered value of $86.1 million in fiscal 2008 and 336 units with an aggregate delivered value of $263.3 million in fiscal 2007 that were accounted for using the percentage of completion accounting method.
(2) Net of $55.2 million and $170.1 million of revenues recognized in fiscal 2007 and 2006, respectively, under the percentage of completion accounting method. (3) In 000’s

TOLL BROTHERS 2018 24
TOLL BROTHERS’ 33-YEAR FINANCIAL SUMMARY 1986–2018Summary Consolidated Statement of Operations Data (amounts in thousands, except per share data)
Year Ended October 31, 2018 2017 2016 2015 2014 2013 2012 2011 2010 2009 2008 2007 2006 2005 2004 2003 2002 2001 2000 1999 1998 1997 1996 1995 1994 1993 1992 1991 1990 1989 1988 1987 1986
Revenues $ 7,143,258 $ 5,815,058 $ 5,169,508 $ 4,171,248 $ 3,911,602 $ 2,674,299 $ 1,882,781 $ 1,475,881 $ 1,494,771 $ 1,755,310 $ 3,148,166 $ 4,635,093 $ 6,115,280 $ 5,759,301 $ 3,839,451 $ 2,731,044 $ 2,279,261 $ 2,180,469 $ 1,762,930 $ 1,438,171 $ 1,206,290 $ 968,253 $ 759,303 $ 643,017 $ 501,822 $ 392,560 $ 279,841 $ 175,971 $ 198,336 $ 176,864 $ 197,027 $ 134,856 $ 124,641
Pre-tax Income (loss) $ 933,916 $ 814,311 $ 589,027 $ 535,562 $ 504,582 $ 267,697 $ 112,942 $ (29,366) $ (117,187) $ (496,465) $ (466,787) $ 70,680 $ 1,126,616 $ 1,323,128 $ 647,432 $ 411,153 $ 347,318 $ 337,889 $ 230,966 $ 160,432 $ 132,523 $ 103,215 $ 85,793 $ 79,439 $ 56,840 $ 42,820 $ 27,493 $ 8,444 $ 16,801 $ 21,520 $ 40,803 $ 33,346 $ 23,718
Net income (loss) $ 748,151 $ 535,495 $ 382,095 $ 363,167 $ 340,032 $ 170,606 $ 487,146 $ 39,795 $ (3,374) $ (755,825) $ (297,810) $ 35,651 $ 687,213 $ 806,110 $ 409,111 $ 259,820 $ 219,887 $ 213,673 $ 145,943 $ 101,566 $ 84,704 $ 65,075 $ 53,744 $ 49,932 $ 36,177 $ 28,058 $ 16,538 $ 5,013 $ 9,988 $ 13,127 $ 24,074 $ 17,173 $ 11,861
Earnings (loss) per share — Diluted $ 4.85 $ 3.17 $ 2.18 $ 1.97 $ 1.84 $ 0.97 $ 2.86 $ 0.24 $ (0.02) $ (4.68) $ (1.88) $ 0.22 $ 4.17 $ 4.78 $ 2.52 $ 1.72 $ 1.46 $ 1.38 $ 0.98 $ 0.68 $ 0.55 $ 0.44 $ 0.36 $ 0.34 $ 0.25 $ 0.21 $ 0.12 $ 0.04 $ 0.08 $ 0.11 $ 0.20 $ 0.14 $ 0.11
Weighted-average number of shares — Diluted 154,201 169,487 175,973 184,703 185,875 177,963 170,154 168,381 165,666 161,549 158,730 164,166 164,852 168,552 162,330 151,083 150,959 154,734 149,651 149,744 153,441 149,049 147,516 145,440 142,620 133,868 132,936 125,648 118,856 119,880 120,612 121,540 111,812
Summary Consolidated Balance Sheet Data (amounts in thousands, except per share data)
At October 31, 2018 2017 2016 2015 2014 2013 2012 2011 2010 2009 2008 2007 2006 2005 2004 2003 2002 2001 2000 1999 1998 1997 1996 1995 1994 1993 1992 1991 1990 1989 1988 1987 1986
Cash and marketable securities $ 1,182,195 $ 712,829 $ 633,715 $ 928,994 $ 598,341 $ 825,480 $ 1,217,892 $ 1,139,912 $ 1,236,927 $ 1,908,894 $ 1,633,495 $ 900,337 $ 632,524 $ 689,219 $ 580,863 $ 425,251 $ 102,337 $ 182,840 $ 161,860 $ 96,484 $ 80,143 $ 147,575 $ 22,891 $ 27,772 $ 38,026 $ 32,329 $ 33,407 $ 31,475 $ 10,379 $ 9,160 $ 27,110 $ 18,009 $ 14,720
Inventory $ 7,598,219 $ 7,281,453 $ 7,353,967 $ 6,997,516 $ 6,490,321 $ 4,650,412 $ 3,732,703 $ 3,416,723 $ 3,241,725 $ 3,183,566 $ 4,127,475 $ 5,572,655 $ 6,095,702 $ 5,068,624 $ 3,878,260 $ 3,080,349 $ 2,551,061 $ 2,183,541 $ 1,712,383 $ 1,443,282 $ 1,111,863 $ 921,595 $ 772,471 $ 623,830 $ 506,347 $ 402,515 $ 287,844 $ 222,775 $ 240,155 $ 256,934 $ 206,593 $ 143,894 $ 66,543
Total assets $ 10,244,590 $ 9,445,225 $ 9,736,789 $ 9,206,515 $ 8,398,457 $ 6,811,782 $ 6,165,915 $ 5,048,478 $ 5,163,450 $ 5,624,972 $ 6,582,350 $ 7,214,739 $ 7,576,873 $ 6,336,251 $ 4,897,626 $ 3,779,440 $ 2,888,671 $ 2,525,014 $ 2,025,633 $ 1,662,810 $ 1,250,505 $ 1,113,012 $ 833,189 $ 686,703 $ 580,148 $ 470,441 $ 380,584 $ 312,424 $ 316,534 $ 348,163 $ 256,611 $ 181,765 $ 108,185
Debt
Loans payable $ 686,801 $ 637,416 $ 871,079 $ 1,000,439 $ 652,619 $ 107,222 $ 99,817 $ 106,556 $ 94,491 $ 472,854 $ 613,594 $ 696,814 $ 736,934 $ 250,552 $ 340,380 $ 281,697 $ 253,194 $ 362,712 $ 326,537 $ 213,317 $ 182,292 $ 189,579 $ 132,109 $ 59,057 $ 17,506 $ 24,779 $ 25,756 $ 49,943 $ 71,707 $ 95,508 $ 74,048 $ 55,545 $ 12,474Senior notes 2,861,375 2,462,463 2,694,372 2,689,801 2,638,241 2,305,765 2,065,334 1,484,204 1,536,005 1,578,212 1,139,895 1,138,065 1,136,235 1,134,575 840,737 543,170Subordinated notes 47,836 342,064 348,664 348,264 347,864 446,976 615,548 812,969 662,395 464,878 464,166 265,333 314,310 203,678 215,472 221,224 168,885 124,602 55,513 61,474 69,681 69,635 29,967 29,963Mortgage related debt 150,000 120,145 210,000 100,000 90,281 75,000 72,664 57,409 72,367 27,015 37,867 76,730 119,705 89,674 92,053 49,939 48,996 24,754 1,145 1,384 2,577 2,816 3,912 4,686 10,810 24,403 39,864 45,988 52,617 382 5,969Total $ 3,698,176 $ 3,220,024 $ 3,775,451 $ 3,790,240 $ 3,381,141 $ 2,487,987 $ 2,237,815 $ 1,648,169 $ 1,702,863 $ 2,125,917 $ 2,133,420 $ 2,260,273 $ 2,341,138 $ 1,822,665 $ 1,720,146 $ 1,490,354 $ 1,115,159 $ 1,049,861 $ 791,415 $ 678,628 $ 449,009 $ 506,466 $ 338,603 $ 278,441 $ 243,416 $ 204,474 $ 174,761 $ 145,320 $ 179,169 $ 217,806 $ 143,683 $ 85,894 $ 48,406
Stockholders’ Equity $ 4,760,199 $ 4,531,194 $ 4,229,292 $ 4,222,557 $ 3,854,376 $ 3,332,987 $ 3,121,700 $ 2,586,353 $ 2,555,453 $ 2,513,199 $ 3,237,653 $ 3,527,234 $ 3,415,926 $ 2,763,571 $ 1,919,987 $ 1,476,628 $ 1,129,509 $ 912,583 $ 745,145 $ 616,334 $ 525,756 $ 385,252 $ 314,677 $ 256,659 $ 204,176 $ 167,136 $ 136,605 $ 118,195 $ 94,959 $ 85,832 $ 73,305 $ 48,842 $ 31,405
Number of shares outstanding 146,163 157,205 161,783 174,847 175,046 169,353 168,637 165,729 166,408 164,725 160,369 157,008 153,899 154,943 149,642 146,644 140,432 139,112 143,580 145,814 147,742 137,102 135,674 134,552 133,692 133,276 132,348 131,248 118,736 119,652 120,168 120,268 119,972
Book value per share $ 32.57 $ 28.82 $ 26.14 $ 24.15 $ 22.02 $ 19.68 $ 18.51 $ 15.61 $ 15.36 $ 15.26 $ 20.19 $ 22.47 $ 22.20 $ 17.84 $ 12.83 $ 10.07 $ 8.04 $ 6.56 $ 5.19 $ 4.23 $ 3.56 $ 2.81 $ 2.32 $ 1.91 $ 1.53 $ 1.25 $ 1.03 $ 0.90 $ 0.80 $ 0.72 $ 0.61 $ 0.41 $ 0.26
Return on beginning Stockholders’ Equity 16.5% 12.7% 9.0% 9.4% 10.2% 5.5% 18.8% 1.6% (0.1%) (23.3%) (8.4%) 1.0% 24.9% 42.0% 27.7% 23.0% 24.1% 28.7% 23.7% 19.3% 22.0% 20.7% 20.9% 24.5% 21.7% 20.6% 14.0% 5.3% 11.7% 18.0% 49.3% 54.7% 122.5%
Home DataYear Ended October 31, 2018 2017 2016 2015 2014 2013 2012 2011 2010 2009 2008 2007 2006 2005 2004 2003 2002 2001 2000 1999 1998 1997 1996 1995 1994 1993 1992 1991 1990 1989 1988 1987 1986
Number of homes closed (1) 8,265 7,151 6,098 5,525 5,397 4,184 3,286 2,611 2,642 2,965 4,743 6,687 8,601 8,769 6,627 4,911 4,430 4,358 3,945 3,555 3,099 2,517 2,109 1,825 1,583 1,324 1,019 676 727 676 778 674 802
Sales value of homes closed (1)(3) $ 7,143,258 $ 5,815,058 $ 5,169,508 $ 4,171,248 $ 3,911,602 $ 2,674,299 $ 1,882,781 $ 1,475,881 $ 1,494,771 $ 1,755,310 $ 3,106,293 $ 4,495,600 $ 5,945,169 $ 5,759,301 $ 3,839,451 $ 2,731,044 $ 2,279,261 $ 2,180,469 $ 1,762,930 $ 1,438,171 $ 1,206,290 $ 968,253 $ 759,303 $ 643,017 $ 501,822 $ 392,560 $ 279,841 $ 175,971 $ 198,336 $ 176,864 $ 197,027 $ 134,856 $ 124,641
Revenues — % of completion (3) $ 41,873 $ 139,493 $ 170,111
Number of homes contracted 8,519 8,175 6,719 5,910 5,271 5,294 4,159 2,784 2,605 2,450 2,927 4,440 6,164 10,372 8,684 6,132 5,070 4,314 4,364 3,799 3,387 2,701 2,398 1,846 1,716 1,595 1,202 863 612 704 656 756 832
Sales value of homes contracted (3) $ 7,604,265 $ 6,828,277 $ 5,649,570 $ 4,955,579 $ 3,896,490 $ 3,633,908 $ 2,557,917 $ 1,604,827 $ 1,472,030 $ 1,304,656 $ 1,608,191 $ 3,010,013 $ 4,460,734 $ 7,152,463 $ 5,641,454 $ 3,475,992 $ 2,734,457 $ 2,158,536 $ 2,134,522 $ 1,627,849 $ 1,383,093 $ 1,069,279 $ 884,677 $ 660,467 $ 586,941 $ 490,883 $ 342,811 $ 230,324 $ 163,975 $ 185,255 $ 162,504 $ 190,680 $ 133,369
At October 31, 2018 2017 2016 2015 2014 2013 2012 2011 2010 2009 2008 2007 2006 2005 2004 2003 2002 2001 2000 1999 1998 1997 1996 1995 1994 1993 1992 1991 1990 1989 1988 1987 1986
Number of homes in backlog 6,105 5,851 4,685 4,064 3,679 3,679 2,569 1,667 1,494 1,531 2,046 3,950 6,533 8,805 6,709 4,652 3,342 2,702 2,746 2,327 1,892 1,551 1,367 1,078 1,025 892 621 438 251 366 338 460 378
Sales value of homes in backlog (2)(3) $ 5,522,523 $ 5,061,517 $ 3,984,065 $ 3,504,004 $ 2,719,673 $ 2,629,466 $ 1,669,857 $ 981,052 $ 852,106 $ 874,837 $ 1,325,491 $ 2,854,435 $ 4,488,400 $ 6,014,648 $ 4,433,895 $ 2,631,900 $ 1,858,784 $ 1,403,588 $ 1,425,521 $ 1,053,929 $ 814,714 $ 627,220 $ 526,194 $ 400,820 $ 370,560 $ 285,441 $ 187,118 $ 124,148 $ 69,795 $ 104,156 $ 95,765 $ 130,288 $ 74,194
Number of selling communities 315 305 310 288 263 232 224 215 195 200 273 315 300 230 220 200 170 155 146 140 122 116 100 97 80 67 62 42 41 40 26 21 15
Home sites
Owned 32,503 31,341 34,137 35,872 36,224 33,967 31,327 30,199 28,891 26,872 32,081 37,139 41,808 35,838 29,804 29,081 25,822 25,981 22,275 23,163 15,578 12,820 12,065 9,542 6,779 5,744 5,633 3,974 4,548 5,075 4,724 2,147 1,461Optioned 20,919 16,970 14,700 8,381 10,943 14,661 9,023 7,298 5,961 5,045 7,703 22,112 31,960 47,288 30,385 18,977 15,022 13,165 10,843 11,268 14,803 9,145 5,237 5,042 4,445 4,271 3,592 3,281 2,117 2,832 4,041 7,141 4,853
Total 53,422 48,311 48,837 44,253 47,167 48,628 40,350 37,497 34,852 31,917 39,784 59,251 73,768 83,126 60,189 48,058 40,844 39,146 33,118 34,431 30,381 21,965 17,302 14,584 11,224 10,015 9,225 7,255 6,665 7,907 8,765 9,288 6,314
(1) Excludes 88 units with an aggregate delivered value of $86.1 million in fiscal 2008 and 336 units with an aggregate delivered value of $263.3 million in fiscal 2007 that were accounted for using the percentage of completion accounting method.
(2) Net of $55.2 million and $170.1 million of revenues recognized in fiscal 2007 and 2006, respectively, under the percentage of completion accounting method. (3) In 000’s

TOLL BROTHERS 2018 25

TOLL BROTHERS 201826
FORWARD-LOOKING STATEMENTSCertain information included in this report or in other materials we have filed or will file with the SEC (as well as information included in oral statements or other written statements made or to be made by us) contains or may contain forward-looking statements within the meaning of Section 27A of the Securities Act of 1933, as amended, and Section 21E of the Securities Exchange Act of 1934, as amended. One can identify these statements by the fact that they do not relate to matters of strictly historical or factual nature and generally discuss or relate to future events. These statements contain words such as “anticipate,” “estimate,” “expect,” “project,” “intend,” “plan,” “believe,” “may,” “can,” “could,” “might,” “should,” and other words or phrases of similar meaning. Such statements may include, but are not limited to, information related to: market conditions; demand for our homes; anticipated operating results; home deliveries; financial resources and condition; changes in revenues; changes in profitability; changes in margins; changes in accounting treatment; cost of revenues; selling, general and administrative expenses; interest expense; inventory write-downs; home warranty and construction defect claims; unrecognized tax benefits; anticipated tax refunds; sales paces and prices; effects of home buyer cancellations; growth and expansion; joint ventures in which we are involved; anticipated results from our investments in unconsolidated entities; the ability to acquire land and pursue real estate opportunities; the ability to gain approvals and open new communities; the ability to sell homes and properties; the ability to deliver homes from backlog; the ability to secure materials and subcontractors; the ability to produce the liquidity and capital necessary to expand and take advantage of opportunities; and legal proceedings, investigations, and claims.
From time to time, forward-looking statements also are included in other reports on Forms 10-Q and 8-K; in press releases; in presentations; on our website; and in other materials released to the public. Any or all of the forward-looking statements included in this report and in any other reports or public statements made by us are not guarantees of future performance and may turn out to be inaccurate. This can occur as a result of incorrect assumptions or as a consequence of known or unknown risks and uncertainties. Many factors mentioned in this report or in other reports or public statements made by us, such as market conditions, government regulation and the competitive environment, will be important in determining our future performance. Consequently, actual results may differ materially from those that might be anticipated from our forward-looking statements.
Forward-looking statements speak only as of the date they are made. We undertake no obligation to publicly update any forward-looking statements, whether as a result of new information, future events or otherwise.
MANAGEMENT’S DISCUSSION AND ANALYSIS OF FINANCIAL CONDITION AND RESULTS OF OPERATIONS (“MD&A”)This discussion and analysis is based on, should be read together with, and is qualified in its entirety by, the Consolidated Financial Statements and Notes thereto. It also should be read in conjunction with the disclosure under “Forward-Looking Statements.”
When this report uses the words “we,” “us,” “our,” and the “Company,” they refer to Toll Brothers, Inc. and its subsidiaries, unless the context otherwise requires. References herein to fiscal year refer to our fiscal years ended or ending October 31.
Unless otherwise stated in this report, net contracts signed represents a number or value equal to the gross number or value of contracts signed during the relevant period, less the number or value of contracts canceled during the relevant period, which includes contracts that were signed during the relevant period and in prior periods. Backlog consists of homes under contract but not yet delivered to our home buyers (“backlog”).
OVERVIEW
Our Business We design, build, market, sell, and arrange financing for detached and attached homes in luxury residential communities. We cater to move-up, empty-nester, active-adult, and second-home buyers in the United States (“Traditional Home Building Product”). We also build and sell homes in urban infill markets through Toll Brothers City Living® (“City Living”). At October 31, 2018, we were operating in 19 states, as well as in the District of Columbia.
In the five years ended October 31, 2018, we delivered 32,436 homes from 683 communities, including 8,265 homes from 415 communities in fiscal 2018. At October 31, 2018, we had 638 communities containing approximately 53,400 home sites that we owned or controlled through options.
We are developing several land parcels for master planned communities in which we intend to build homes on a portion of the lots and sell the remaining lots to other builders. Two of these master planned communities are being developed 100% by us, and the remaining communities are being developed through joint ventures with other builders or financial partners.
In addition to our residential for-sale business, we also develop and operate for-rent apartments through joint ventures. See the section entitled “Toll Brothers Apartment Living/Toll Brothers Campus Living” below.
We operate our own architectural, engineering, mortgage, title, land development and land sale, golf course development and management, and landscaping subsidiaries. We also operate our own security company, TBI Smart Home Solutions, which provides homeowners with home automation and technology options. In addition, we operate our own lumber distribution, house component assembly, and manufacturing operations.
We have investments in various unconsolidated entities. We have investments in joint ventures (i) to develop land for the joint venture participants and for sale to outside builders (“Land Development Joint Ventures”); (ii) to develop for-sale homes (“Home Building Joint Ventures”); (iii) to develop luxury for-rent residential apartments, commercial space and a hotel (“Rental Property Joint Ventures”); and (iv) to invest in distressed loans and real estate and provide financing and land banking for residential builders and developers for the acquisition and development of land and home sites (“Gibraltar Joint Ventures”).
Financial Highlights In fiscal 2018, we recognized $7.14 billion of revenues and net income of $748.2 million, as compared to $5.82 billion of revenues and net income of $535.5 million in fiscal 2017.
In fiscal 2018 and 2017, the value of net contracts signed was $7.60 billion (8,519 homes) and $6.83 billion (8,175 homes), respectively. The value of our backlog at October 31, 2018 was $5.52 billion (6,105 homes), as compared to our backlog at October 31, 2017 of $5.06 billion (5,851 homes).
At October 31, 2018, we had $1.18 billion of cash and cash equivalents and approximately $1.13 billion available for borrowing under our $1.295 billion revolving credit facility (the “Revolving Credit Facility”) that matures in May 2021. At October 31, 2018, we had no outstanding borrowings under the Revolving Credit Facility and had outstanding letters of credit of approximately $165.4 million.
In February 2017, our Board of Directors approved the initiation of quarterly cash dividends to shareholders. During fiscal 2018 and 2017, we paid aggregate cash dividends of $0.41 and $0.24 per share, respectively to our shareholders. In December 2018, we declared a quarterly cash dividend of $0.11 which will be paid on January 25, 2019 to shareholders of record on the close of business on January 11, 2019.
At October 31, 2018, our total equity and our debt to total capitalization ratio were $4.77 billion and 0.44 to 1.00, respectively.
TOLL BROTHERS 2018 27
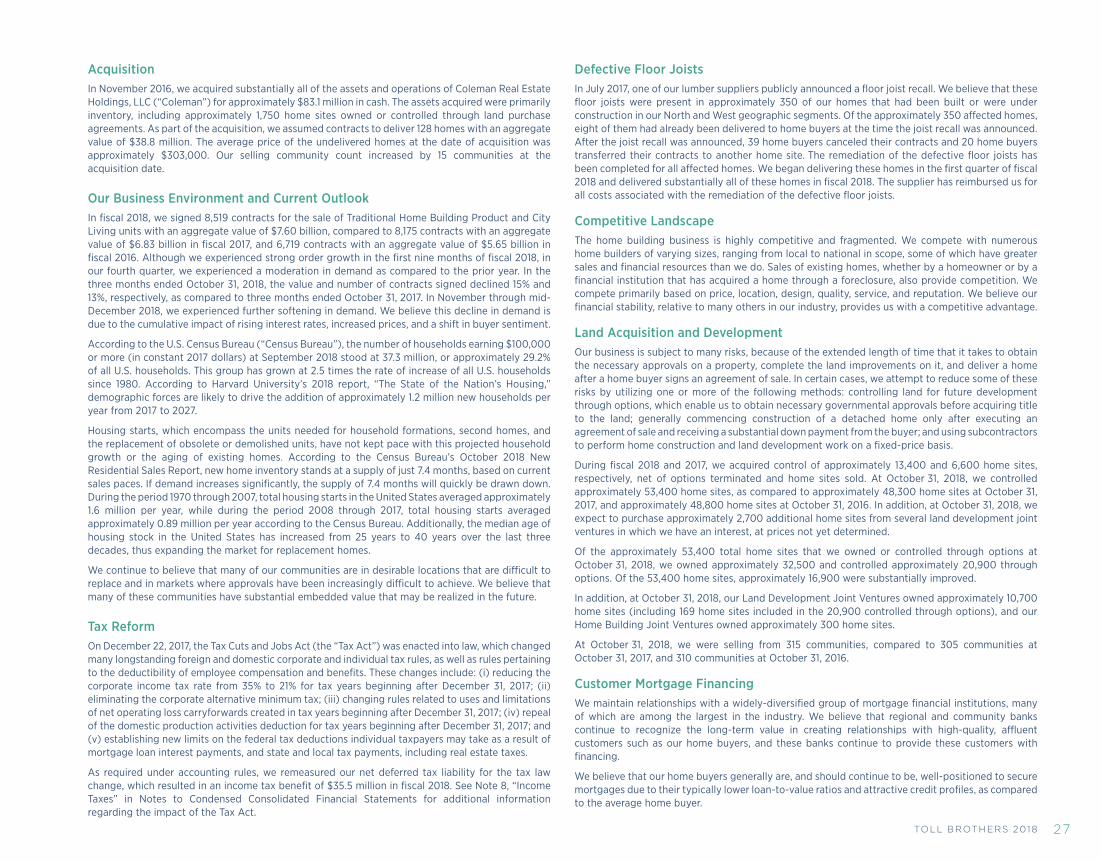
Acquisition In November 2016, we acquired substantially all of the assets and operations of Coleman Real Estate Holdings, LLC (“Coleman”) for approximately $83.1 million in cash. The assets acquired were primarily inventory, including approximately 1,750 home sites owned or controlled through land purchase agreements. As part of the acquisition, we assumed contracts to deliver 128 homes with an aggregate value of $38.8 million. The average price of the undelivered homes at the date of acquisition was approximately $303,000. Our selling community count increased by 15 communities at the acquisition date.
Our Business Environment and Current Outlook In fiscal 2018, we signed 8,519 contracts for the sale of Traditional Home Building Product and City Living units with an aggregate value of $7.60 billion, compared to 8,175 contracts with an aggregate value of $6.83 billion in fiscal 2017, and 6,719 contracts with an aggregate value of $5.65 billion in fiscal 2016. Although we experienced strong order growth in the first nine months of fiscal 2018, in our fourth quarter, we experienced a moderation in demand as compared to the prior year. In the three months ended October 31, 2018, the value and number of contracts signed declined 15% and 13%, respectively, as compared to three months ended October 31, 2017. In November through mid-December 2018, we experienced further softening in demand. We believe this decline in demand is due to the cumulative impact of rising interest rates, increased prices, and a shift in buyer sentiment.
According to the U.S. Census Bureau (“Census Bureau”), the number of households earning $100,000 or more (in constant 2017 dollars) at September 2018 stood at 37.3 million, or approximately 29.2% of all U.S. households. This group has grown at 2.5 times the rate of increase of all U.S. households since 1980. According to Harvard University’s 2018 report, “The State of the Nation’s Housing,” demographic forces are likely to drive the addition of approximately 1.2 million new households per year from 2017 to 2027.
Housing starts, which encompass the units needed for household formations, second homes, and the replacement of obsolete or demolished units, have not kept pace with this projected household growth or the aging of existing homes. According to the Census Bureau’s October 2018 New Residential Sales Report, new home inventory stands at a supply of just 7.4 months, based on current sales paces. If demand increases significantly, the supply of 7.4 months will quickly be drawn down. During the period 1970 through 2007, total housing starts in the United States averaged approximately 1.6 million per year, while during the period 2008 through 2017, total housing starts averaged approximately 0.89 million per year according to the Census Bureau. Additionally, the median age of housing stock in the United States has increased from 25 years to 40 years over the last three decades, thus expanding the market for replacement homes.
We continue to believe that many of our communities are in desirable locations that are difficult to replace and in markets where approvals have been increasingly difficult to achieve. We believe that many of these communities have substantial embedded value that may be realized in the future.
Tax Reform On December 22, 2017, the Tax Cuts and Jobs Act (the “Tax Act”) was enacted into law, which changed many longstanding foreign and domestic corporate and individual tax rules, as well as rules pertaining to the deductibility of employee compensation and benefits. These changes include: (i) reducing the corporate income tax rate from 35% to 21% for tax years beginning after December 31, 2017; (ii) eliminating the corporate alternative minimum tax; (iii) changing rules related to uses and limitations of net operating loss carryforwards created in tax years beginning after December 31, 2017; (iv) repeal of the domestic production activities deduction for tax years beginning after December 31, 2017; and (v) establishing new limits on the federal tax deductions individual taxpayers may take as a result of mortgage loan interest payments, and state and local tax payments, including real estate taxes.
As required under accounting rules, we remeasured our net deferred tax liability for the tax law change, which resulted in an income tax benefit of $35.5 million in fiscal 2018. See Note 8, “Income Taxes” in Notes to Condensed Consolidated Financial Statements for additional information regarding the impact of the Tax Act.
Defective Floor Joists In July 2017, one of our lumber suppliers publicly announced a floor joist recall. We believe that these floor joists were present in approximately 350 of our homes that had been built or were under construction in our North and West geographic segments. Of the approximately 350 affected homes, eight of them had already been delivered to home buyers at the time the joist recall was announced. After the joist recall was announced, 39 home buyers canceled their contracts and 20 home buyers transferred their contracts to another home site. The remediation of the defective floor joists has been completed for all affected homes. We began delivering these homes in the first quarter of fiscal 2018 and delivered substantially all of these homes in fiscal 2018. The supplier has reimbursed us for all costs associated with the remediation of the defective floor joists.
Competitive Landscape The home building business is highly competitive and fragmented. We compete with numerous home builders of varying sizes, ranging from local to national in scope, some of which have greater sales and financial resources than we do. Sales of existing homes, whether by a homeowner or by a financial institution that has acquired a home through a foreclosure, also provide competition. We compete primarily based on price, location, design, quality, service, and reputation. We believe our financial stability, relative to many others in our industry, provides us with a competitive advantage.
Land Acquisition and Development Our business is subject to many risks, because of the extended length of time that it takes to obtain the necessary approvals on a property, complete the land improvements on it, and deliver a home after a home buyer signs an agreement of sale. In certain cases, we attempt to reduce some of these risks by utilizing one or more of the following methods: controlling land for future development through options, which enable us to obtain necessary governmental approvals before acquiring title to the land; generally commencing construction of a detached home only after executing an agreement of sale and receiving a substantial down payment from the buyer; and using subcontractors to perform home construction and land development work on a fixed-price basis.
During fiscal 2018 and 2017, we acquired control of approximately 13,400 and 6,600 home sites, respectively, net of options terminated and home sites sold. At October 31, 2018, we controlled approximately 53,400 home sites, as compared to approximately 48,300 home sites at October 31, 2017, and approximately 48,800 home sites at October 31, 2016. In addition, at October 31, 2018, we expect to purchase approximately 2,700 additional home sites from several land development joint ventures in which we have an interest, at prices not yet determined.
Of the approximately 53,400 total home sites that we owned or controlled through options at October 31, 2018, we owned approximately 32,500 and controlled approximately 20,900 through options. Of the 53,400 home sites, approximately 16,900 were substantially improved.
In addition, at October 31, 2018, our Land Development Joint Ventures owned approximately 10,700 home sites (including 169 home sites included in the 20,900 controlled through options), and our Home Building Joint Ventures owned approximately 300 home sites.
At October 31, 2018, we were selling from 315 communities, compared to 305 communities at October 31, 2017, and 310 communities at October 31, 2016.
Customer Mortgage Financing We maintain relationships with a widely-diversified group of mortgage financial institutions, many of which are among the largest in the industry. We believe that regional and community banks continue to recognize the long-term value in creating relationships with high-quality, affluent customers such as our home buyers, and these banks continue to provide these customers with financing.
We believe that our home buyers generally are, and should continue to be, well-positioned to secure mortgages due to their typically lower loan-to-value ratios and attractive credit profiles, as compared to the average home buyer.

TOLL BROTHERS 201828
Toll Brothers Apartment Living/Toll Brothers Campus Living In addition to our residential for-sale business, we also develop and operate for-rent apartments through joint ventures. At October 31, 2018, we or joint ventures in which we have an interest controlled 44 land parcels as for-rent apartment projects containing approximately 15,400 units. These projects, which are located in the metro Boston to metro Washington, D.C. corridor; Los Angeles, San Francisco, San Diego and Fremont, California; Atlanta, Georgia; Dallas, Texas; and Phoenix, Arizona are being operated, are being developed or will be developed with partners under the brand names Toll Brothers Apartment Living, and Toll Brothers Campus Living.
In fiscal 2018, three of our Rental Property Joint Ventures sold their assets to unrelated parties for $477.5 million. These joint ventures had owned, developed, and operated multifamily rental properties located in suburban Washington, D.C. and Westborough, Massachusetts, and a student housing community in College Park, Maryland. From our investment in these joint ventures, we received cash of $79.1 million and recognized gains from these sales of $67.2 million in fiscal 2018, which is included in “Income from unconsolidated entities” in our Consolidated Statement of Operations and Comprehensive Income.
At October 31, 2018, we had approximately 1,750 units in for-rent apartment projects that were occupied or ready for occupancy, 1,400 units in the lease-up stage, 4,150 units under active development, and 8,100 units in the planning stage. Of the 15,400 units at October 31, 2018, 5,950 were owned by joint ventures in which we have an interest; approximately 3,000 were owned by us; and 6,450 were under contract to be purchased by us.
CONTRACTS AND BACKLOG The aggregate value of net sales contracts signed increased 11.4% in fiscal 2018, as compared to fiscal 2017, and 20.9% in fiscal 2017, as compared to fiscal 2016. The value of net sales contracts signed was $7.60 billion (8,519 homes) in fiscal 2018, $6.83 billion (8,175 homes) in fiscal 2017, and $5.65 billion (6,719 homes) in fiscal 2016. The increase in the aggregate value of net contracts signed in fiscal 2018, as compared to fiscal 2017, was due to increases in the number of net contracts signed and average value of each contract signed of 4% and 7%, respectively. The increase in the aggregate value of net contracts signed in fiscal 2017, as compared to fiscal 2016 was due mainly to an increase in the number of net contracts signed. The increases in the number of net contracts signed in each period was primarily due to increased demand. The increase in average price of net contracts signed in fiscal 2018, as compared to fiscal 2017, was principally due to a shift in the number of contracts signed to more expensive areas and/or products and price increases in fiscal 2018, as compared to fiscal 2017.
The value of our backlog at October 31, 2018, 2017, and 2016 was $5.52 billion (6,105 homes), $5.06 billion (5,851 homes), and $3.98 billion (4,685 homes), respectively. Approximately 96% of the homes in backlog at October 31, 2018 are expected to be delivered by October 31, 2019. The 9.1% increase in the value of homes in backlog at October 31, 2018, as compared to October 31, 2017, was due to our signing net contracts with a value of $7.60 billion in fiscal 2018, offset, in part, by home deliveries with an aggregate value of $7.14 billion in fiscal 2018.
The 27.0% increase in the value of homes in backlog at October 31, 2017, as compared to October 31, 2016, was primarily due to our signing net contracts with a value of $6.83 billion in fiscal 2017, offset in part, by home deliveries with an aggregate value of $5.82 billion in fiscal 2017.
For more information regarding revenues, net contracts signed, and backlog by geographic segment, see “Segments” in this MD&A.
CRITICAL ACCOUNTING POLICIES We believe the following critical accounting policies reflect the more significant judgments and estimates used in the preparation of our consolidated financial statements.
Inventory Inventory is stated at cost unless an impairment exists, in which case it is written down to fair value in accordance with U.S. generally accepted accounting principles (“GAAP”). In addition to direct land acquisition, land development, and home construction costs, costs also include interest, real estate taxes, and direct overhead related to development and construction, which are capitalized to inventory during periods beginning with the commencement of development and ending with the completion of construction. For those communities that have been temporarily closed, no additional capitalized interest is allocated to the community’s inventory until it reopens, and other carrying costs are expensed as incurred. Once a parcel of land has been approved for development and we open the community, it can typically take four or more years to fully develop, sell, and deliver all the homes in that community. Longer or shorter time periods are possible depending on the number of home sites in a community and the sales and delivery pace of the homes in a community. Our master planned communities, consisting of several smaller communities, may take up to 10 years or more to complete. Because our inventory is considered a long-lived asset under GAAP, we are required to regularly review the carrying value of each of our communities and write down the value of those communities when we believe the values are not recoverable.
OPERATING COMMUNITIES: When the profitability of an operating community deteriorates, the sales pace declines significantly, or some other factor indicates a possible impairment in the recoverability of the asset, the asset is reviewed for impairment by comparing the estimated future undiscounted cash flow for the community to its carrying value. If the estimated future undiscounted cash flow is less than the community’s carrying value, the carrying value is written down to its estimated fair value. Estimated fair value is primarily determined by discounting the estimated future cash flow of each community. The impairment is charged to cost of revenues in the period in which the impairment is determined. In estimating the future undiscounted cash flow of a community, we use various estimates such as (i) the expected sales pace in a community, based upon general economic conditions that will have a short-term or long-term impact on the market in which the community is located and on competition within the market, including the number of home sites available and pricing and incentives being offered in other communities owned by us or by other builders; (ii) the expected sales prices and sales incentives to be offered in a community; (iii) costs expended to date and expected to be incurred in the future, including, but not limited to, land and land development costs, home construction, interest, and overhead costs; (iv) alternative product offerings that may be offered in a community that will have an impact on sales pace, sales price, building cost, or the number of homes that can be built in a particular community; and (v) alternative uses for the property, such as the possibility of a sale of the entire community to another builder or the sale of individual home sites.
FUTURE COMMUNITIES: We evaluate all land held for future communities or future sections of operating communities, whether owned or optioned, to determine whether or not we expect to proceed with the development of the land as originally contemplated. This evaluation encompasses the same types of estimates used for operating communities described above, as well as an evaluation of the regulatory environment in which the land is located and the estimated probability of obtaining the necessary approvals, the estimated time and cost it will take to obtain those approvals, and the possible concessions that may be required to be given in order to obtain them. Concessions may include cash payments to fund improvements to public places such as parks and streets, dedication of a portion of the property for use by the public or as open space, or a reduction in the density or size of the homes to be built. Based upon this review, we decide (i) as to land under contract to be purchased, whether the contract will likely be terminated or renegotiated, and (ii) as to land we own, whether the land will likely be developed as contemplated or in an alternative manner, or should be sold. We then further determine whether costs that have been capitalized to the community are recoverable or should be written off. The write-off is charged to cost of revenues in the period in which the need for the write-off is determined.

TOLL BROTHERS 2018 29
The estimates used in the determination of the estimated cash flows and fair value of both current and future communities are based on factors known to us at the time such estimates are made and our expectations of future operations and economic conditions. Should the estimates or expectations used in determining estimated fair value deteriorate in the future, we may be required to recognize additional impairment charges and write-offs related to current and future communities and such amounts could be material.
We provided for inventory impairment charges and the expensing of costs that we believed not to be recoverable in each of the three fiscal years ended October 31, 2018, 2017, and 2016, as shown in the table below (amounts in thousands):
2018 2017 2016
Land controlled for future communities $ 2,820 $ 1,949 $ 3,142
Land owned for future communities 2,185 3,050 2,300Operating communities 30,151 9,795 8,365
$ 35,156 $ 14,794 $ 13,807
The table below provides, for the periods indicated, the number of operating communities that we reviewed for potential impairment, the number of operating communities in which we recognized impairment charges, the amount of impairment charges recognized, and, as of the end of the period indicated, the fair value of those communities, net of impairment charges ($ amounts in thousands):
Impaired operating communities
Three months ended:
Number of communities
testedNumber of
communities
Fair value of communities, net
of impairment charges
Impairment charges
recognized
Fiscal 2018:
January 31 64 5 $ 13,318 $ 3,736
April 30 65 4 $ 21,811 13,325
July 31 55 5 $ 43,063 9,065
October 31 43 6 $ 24,692 4,025
$ 30,151
Fiscal 2017:
January 31 57 2 $ 8,372 $ 4,000
April 30 46 6 $ 25,092 2,935
July 31 53 4 $ 5,965 1,360
October 31 51 1 $ 6,982 1,500
$ 9,795
Fiscal 2016:
January 31 43 2 $ 1,713 $ 600
April 30 41 2 $ 10,103 6,100
July 31 51 2 $ 11,714 1,250
October 31 59 2 $ 1,126 415
$ 8,365
Income Taxes – Valuation Allowance We assess the need for valuation allowances for deferred tax assets in each period based on whether it is more-likely-than-not that some portion of the deferred tax asset would not be realized. If, based on the available evidence, it is more-likely-than-not that such asset will not be realized, a valuation allowance is established against a deferred tax asset. The realization of a deferred tax asset ultimately depends on the existence of sufficient taxable income in either the carryback or carryforward periods under tax law. This assessment considers, among other matters, the nature, consistency, and magnitude of current and cumulative income and losses; forecasts of future profitability; the duration of statutory carryback or carryforward periods; our experience with operating loss and tax credit carryforwards being used before expiration; tax planning alternatives; and outlooks for the U.S. housing industry and broader economy. Changes in existing tax laws or rates could also affect our actual tax results. Due to uncertainties in the estimation process, particularly with respect to changes in facts and circumstances in future reporting periods, actual results could differ from the estimates used in our assessment that could have a material impact on our consolidated results of operations or financial position.
As a result of the enactment of the Tax Act into law, we remeasured our net deferred tax liability for the tax law change, which resulted in an income tax benefit of $35.5 million in fiscal 2018. See Note 8, “Income Taxes” in Notes to Consolidated Financial Statements for additional information regarding the impact of the Tax Act.
Our deferred tax assets consist principally of timing of deductibility of accrued expenses, inventory impairments, inventory valuation differences, state tax net operating loss carryforwards, and stock-based compensation expense. In accordance with GAAP, we assess whether a valuation allowance should be established based on our determination of whether it was more likely than not that some portion or all of the deferred tax assets would not be realized.
We file tax returns in the various states in which we do business. Each state has its own statutes regarding the use of tax loss carryforwards. Some of the states in which we do business do not allow for the carryforward of losses, while others allow for carryforwards for five years to 20 years.
For state tax purposes, we establish valuation allowances for deferred tax assets in certain jurisdictions where it is more-likely-than-not that the deferred tax asset would not be realized. Due to past and projected losses in certain jurisdictions where we did not have carryback potential and/or could not sufficiently forecast future taxable income, we had recorded a net cumulative valuation allowance against our state deferred tax assets at October 31, 2016. During fiscal 2016, we recognized new valuation allowances of $1.0 million. We did not recognize any new valuation allowances in fiscal 2018 and 2017. During fiscal 2017, due to improved operating results, we reversed $32.2 million of state deferred tax asset valuation allowances. No state deferred tax asset valuation allowances were reversed in fiscal 2018 and 2016.
Revenue and Cost Recognition Revenues and cost of revenues from home sales are recorded at the time each home is delivered and title and possession are transferred to the buyer.
For our standard attached and detached homes, land, land development, and related costs, both incurred and estimated to be incurred in the future, are amortized to the cost of homes closed based upon the total number of homes to be constructed in each community. Any changes resulting from a change in the estimated number of homes to be constructed or in the estimated costs subsequent to the commencement of delivery of homes are allocated to the remaining undelivered homes in the community. Home construction and related costs are charged to the cost of homes closed under the specific identification method. For our master planned communities, the estimated land, common area development, and related costs, including the cost of golf courses, net of their estimated residual value, are allocated to individual communities within a master planned community on a relative sales value basis. Any changes resulting from a change in the estimated number of homes to be constructed or in the estimated costs are allocated to the remaining home sites in each of the communities of the master planned community.

TOLL BROTHERS 201830
For high-rise/mid-rise projects, land, land development, construction, and related costs, both incurred and estimated to be incurred in the future, are generally amortized to the cost of units closed based upon an estimated relative sales value of the units closed to the total estimated sales value. Any changes resulting from a change in the estimated total costs or revenues of the project are allocated to the remaining units to be delivered.
FORFEITED CUSTOMER DEPOSITS: Forfeited customer deposits are recognized in “Other income-net” in our Consolidated Statements of Operations and Comprehensive Income in the period in which we determine that the customer will not complete the purchase of the home and we have the right to retain the deposit.
SALES INCENTIVES: In order to promote sales of our homes, we grant our home buyers sales incentives from time to time. These incentives will vary by type of incentive and by amount on a community-by-community and home-by-home basis. Incentives that impact the value of the home or the sales price paid, such as special or additional options, are generally reflected as a reduction in sales revenues. Incentives that we pay to an outside party, such as paying some or all of a home buyer’s closing costs, are recorded as an additional cost of revenues. Incentives are recognized at the time the home is delivered to the home buyer and we receive the sales proceeds.
On November 1, 2018, we adopted Accounting Standards Update ASU No. 2014-09, “Revenue from Contracts with Customers” (“ASU 2014-09”), which supersedes the revenue recognition requirements in Accounting Standards Codification Topic 605, “Revenue Recognition,” and most industry-specific guidance. See Note 1, “Significant Accounting Policies” in Notes to Consolidated Financial Statements for additional information regarding the impact of the adoption of ASU 2014-09.
Warranty and Self-Insurance WARRANTY: We provide all of our home buyers with a limited warranty as to workmanship and mechanical equipment. We also provide many of our home buyers with a limited 10-year warranty as to structural integrity. We accrue for expected warranty costs at the time each home is closed and title and possession are transferred to the home buyer. Warranty costs are accrued based upon historical experience. Adjustments to our warranty liabilities related to homes delivered in prior years are recorded in the period in which a change in our estimate occurs. Over the past several years, we have had a significant number of warranty claims related primarily to homes built in Pennsylvania and Delaware. See Note 7 – “Accrued Expenses” in Notes to Consolidated Financial Statements for additional information regarding these warranty charges.
SELF-INSURANCE: We maintain, and require the majority of our subcontractors to maintain, general liability insurance (including construction defect and bodily injury coverage) and workers’ compensation insurance. These insurance policies protect us against a portion of our risk of loss from claims related to our home building activities, subject to certain self-insured retentions, deductibles and other coverage limits (“self-insured liability”). We also provide general liability insurance for our subcontractors in Arizona, California, Colorado, Nevada, Washington, and certain areas of Texas, where eligible subcontractors are enrolled as insureds under our general liability insurance policies in each community in which they perform work. For those enrolled subcontractors, we absorb their general liability associated with the work performed on our homes within the applicable community as part of our overall general liability insurance and our self-insurance through our captive insurance subsidiary.
We record expenses and liabilities based on the estimated costs required to cover our self-insured liability and the estimated costs of potential claims and claim adjustment expenses that are not covered by our insurance policies. These estimated costs are based on an analysis of our historical claims and industry data, and include an estimate of claims incurred but not yet reported (“IBNR”).
We engage a third-party actuary that uses our historical claim and expense data, input from our internal legal and risk management groups, as well as industry data, to estimate our liabilities related to unpaid claims, IBNR associated with the risks that we are assuming for our self-insured liability and other required costs to administer current and expected claims. These estimates are subject to
uncertainty due to a variety of factors, the most significant being the long period of time between the delivery of a home to a home buyer and when a structural warranty or construction defect claim is made, and the ultimate resolution of the claim. Though state regulations vary, construction defect claims are reported and resolved over a prolonged period of time, which can extend for 10 years or longer. As a result, the majority of the estimated liability relates to IBNR. Adjustments to our liabilities related to homes delivered in prior years are recorded in the period in which a change in our estimate occurs.
The projection of losses related to these liabilities requires actuarial assumptions that are subject to variability due to uncertainties regarding construction defect claims relative to our markets and the types of product we build, insurance industry practices and legal or regulatory actions and/or interpretations, among other factors. Key assumptions used in these estimates include claim frequencies, severities and settlement patterns, which can occur over an extended period of time. In addition, changes in the frequency and severity of reported claims and the estimates to settle claims can impact the trends and assumptions used in the actuarial analysis, which could be material to our consolidated financial statements. Due to the degree of judgment required, and the potential for variability in these underlying assumptions, our actual future costs could differ from those estimated, and the difference could be material to our consolidated financial statements.
OFF-BALANCE SHEET ARRANGEMENTS We also operate through a number of joint ventures. We earn construction and management fee income from many of these joint ventures. Our investments in these entities are generally accounted for using the equity method of accounting. We are a party to several joint ventures with unrelated parties to develop and sell land that is owned by the joint ventures. We recognize our proportionate share of the earnings from the sale of home sites to other builders, including our joint venture partners. We do not recognize earnings from the home sites we purchase from these ventures at the time of our purchase; instead, our cost basis in the home sites is reduced by our share of the earnings realized by the joint venture from those home sites.
At October 31, 2018, we had investments in these entities of $431.8 million, and were committed to invest or advance up to an additional $39.5 million to these entities if they require additional funding. At October 31, 2018, we had agreed to terms for the acquisition of 169 home sites from two Land Development Joint Ventures for an estimated aggregate purchase price of $128.2 million. In addition, we expect to purchase approximately 2,700 additional home sites over a number of years from several of these joint ventures; the purchase price of these home sites will be determined at a future date.
The unconsolidated entities in which we have investments generally finance their activities with a combination of partner equity and debt financing. In some instances, we and our partners have guaranteed debt of certain unconsolidated entities. These guarantees may include any or all of the following: (i) project completion guarantees, including any cost overruns; (ii) repayment guarantees, generally covering a percentage of the outstanding loan; (iii) carry cost guarantees, which cover costs such as interest. real estate taxes, and insurance; (iv) an environmental indemnity provided to the lender that holds the lender harmless from and against losses arising from the discharge of hazardous materials from the property and non-compliance with applicable environmental laws; and (v) indemnification of the lender from “bad boy acts” of the unconsolidated entity.
In some instances, the guarantees provided in connection with loans to an unconsolidated entity are joint and several. In these situations, we generally have a reimbursement agreement with our partner that provides that neither party is responsible for more than its proportionate share or agreed-upon share of the guarantee; however, if the joint venture partner does not have adequate financial resources to meet its obligations under the reimbursement agreement, we may be liable for more than our proportionate share.
We believe that as of October 31, 2018, in the event we become legally obligated to perform under a guarantee of the obligation of an unconsolidated entity due to a triggering event, the collateral should be sufficient to repay all or a significant portion of the obligation. If it is not, we and our

TOLL BROTHERS 2018 31
partners would need to contribute additional capital to the entity. At October 31, 2018, we had guaranteed the debt of certain unconsolidated entities with loan commitments aggregating $1.34 billion, of which, if the full amount of the debt obligations were borrowed, we estimate $294.7 million to be our maximum exposure related to repayment and carry cost guarantees. At October 31, 2018, the unconsolidated entities had borrowed an aggregate of $1.06 billion, of which we estimate $254.7 million to be our maximum exposure related to repayment and carry cost guarantees. These maximum exposure estimates do not take into account any recoveries from the underlying collateral or any reimbursement from our partners.
For more information regarding these joint ventures, see Note 4, “Investments in Unconsolidated Entities” in the Notes to Consolidated Financial Statements.
The trends, uncertainties or other factors that negatively impact our business and the industry in general also impact the unconsolidated entities in which we have investments. We review each of our investments on a quarterly basis for indicators of impairment. A series of operating losses of an investee, the inability to recover our invested capital, or other factors may indicate that a loss in value of our investment in the unconsolidated entity has occurred. If a loss exists, we further review to determine if the loss is other than temporary, in which case we write down the investment to its fair value. The evaluation of our investment in unconsolidated entities entails a detailed cash flow analysis using many estimates including but not limited to, expected sales pace, expected sales prices, expected incentives, costs incurred and anticipated, sufficiency of financing and capital, competition, market conditions and anticipated cash receipts, in order to determine projected future distributions. Each of the unconsolidated entities evaluates its inventory in a similar manner. In addition, for our unconsolidated entities that own, develop, and manage for-rent residential apartments, we review rental trends, expected future expenses, and expected future cash flows to determine estimated fair values of the properties. See “Critical Accounting Policies - Inventory” contained in this MD&A for more detailed disclosure on our evaluation of inventory. If a valuation adjustment is recorded by an unconsolidated entity related to its assets, our proportionate share is reflected in income from unconsolidated entities with a corresponding decrease to our investment in unconsolidated entities. Based upon our evaluation of the fair value of our investments in unconsolidated entities, we recognized charges in connection with two Land Development Joint Ventures of $6.0 million in fiscal 2018 and $2.0 million in fiscal 2017 at one Land Development Joint Venture. We determined that no impairments of our investments occurred in fiscal 2016.
RESULTS OF OPERATIONS The following table compares certain items in our Consolidated Statements of Operations and Comprehensive Income and other supplemental information for fiscal 2018, 2017, and 2016 ($ amounts in millions, unless otherwise stated). For more information regarding results of operations by operating segment, see “Segments” in this MD&A.
Years ended October 31,
2018 2017
% Change 2018 vs.
2017 2016
% Change 2017 vs.
2016
Revenues 7,143.3 5,815.1 23% 5,169.5 12%
Cost of revenues 5,673.0 4,562.3 24% 4,144.1 10%
Selling, general and administrative 684.0 605.6 13% 533.1 14%
6,357.0 5,167.9 23% 4,677.2 10%
Income from operations 786.2 647.2 21% 492.3 31%
Other:
Income from unconsolidated entities 85.2 116.1 (27)% 40.7 185%
Other income - net 62.5 51.1 22% 56.0 (9)%
Income before income taxes 933.9 814.3 15% 589.0 38%
Income tax provision 185.8 278.8 (33)% 206.9 35%
Net income 748.2 535.5 40% 382.1 40%
Supplemental information:
Cost of revenues as a percentage of revenues 79.4% 78.5% 80.2%
SG&A as a percentage of revenues 9.6% 10.4% 10.3%
Effective tax rate 19.9% 34.2% 35.1%
Deliveries – units 8,265 7,151 16% 6,098 17%
Deliveries – average selling price* $ 864.3 $ 813.2 6% $ 847.7 (4)%
Net contracts signed – value $ 7,604.3 $ 6,828.3 11% $ 5,649.6 21%
Net contracts signed – units 8,519 8,175 4% 6,719 22%
Net contracts signed – average selling price* $ 892.6 $ 835.3 7% $ 840.8 (1)%
At October 31,
2018 2017
% Change 2018 vs.
2017 2016
% Change 2017 vs.
2016Backlog – value $ 5,522.5 $ 5,061.5 9% $ 3,984.1 27%
Backlog – units 6,105 5,851 4% 4,685 25%
Backlog – average selling price* $ 904.6 $ 865.1 5% $ 850.4 2%
* $ amounts in thousands. Note: Amounts may not add due to rounding.
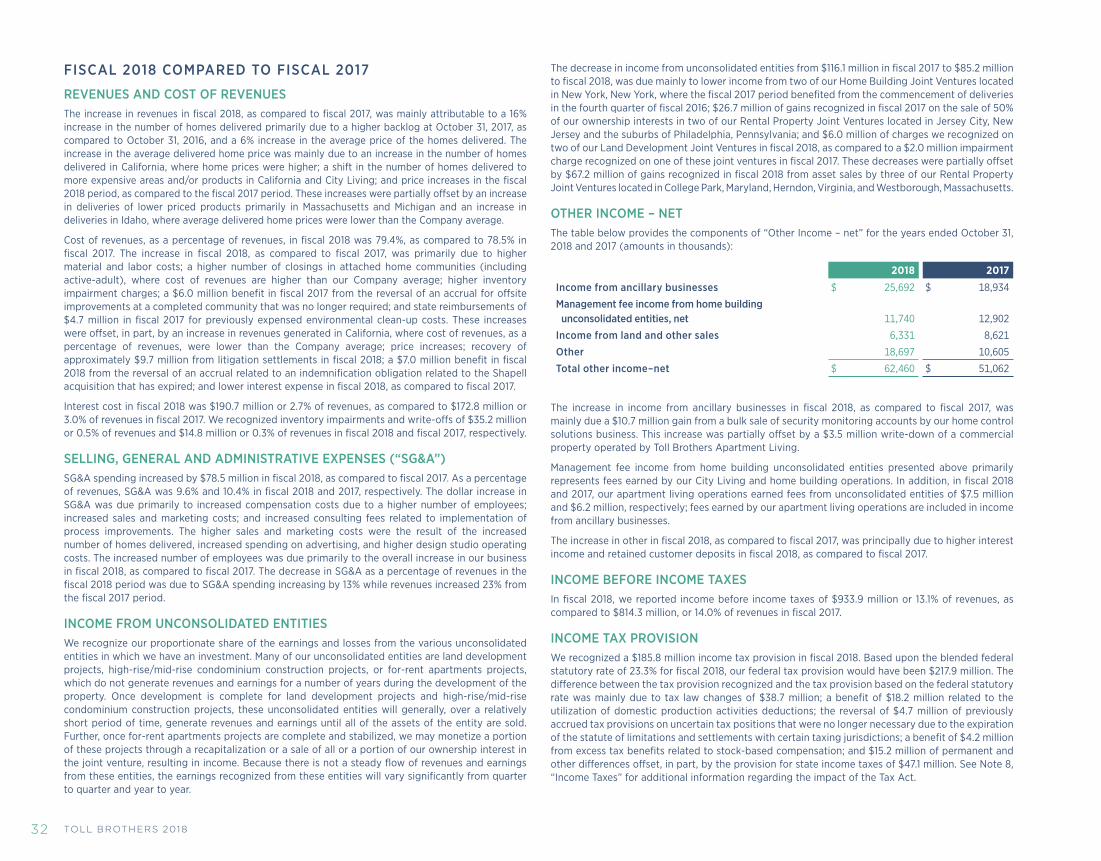
TOLL BROTHERS 201832
FISCAL 2018 COMPARED TO FISCAL 2017
REVENUES AND COST OF REVENUES The increase in revenues in fiscal 2018, as compared to fiscal 2017, was mainly attributable to a 16% increase in the number of homes delivered primarily due to a higher backlog at October 31, 2017, as compared to October 31, 2016, and a 6% increase in the average price of the homes delivered. The increase in the average delivered home price was mainly due to an increase in the number of homes delivered in California, where home prices were higher; a shift in the number of homes delivered to more expensive areas and/or products in California and City Living; and price increases in the fiscal 2018 period, as compared to the fiscal 2017 period. These increases were partially offset by an increase in deliveries of lower priced products primarily in Massachusetts and Michigan and an increase in deliveries in Idaho, where average delivered home prices were lower than the Company average.
Cost of revenues, as a percentage of revenues, in fiscal 2018 was 79.4%, as compared to 78.5% in fiscal 2017. The increase in fiscal 2018, as compared to fiscal 2017, was primarily due to higher material and labor costs; a higher number of closings in attached home communities (including active-adult), where cost of revenues are higher than our Company average; higher inventory impairment charges; a $6.0 million benefit in fiscal 2017 from the reversal of an accrual for offsite improvements at a completed community that was no longer required; and state reimbursements of $4.7 million in fiscal 2017 for previously expensed environmental clean-up costs. These increases were offset, in part, by an increase in revenues generated in California, where cost of revenues, as a percentage of revenues, were lower than the Company average; price increases; recovery of approximately $9.7 million from litigation settlements in fiscal 2018; a $7.0 million benefit in fiscal 2018 from the reversal of an accrual related to an indemnification obligation related to the Shapell acquisition that has expired; and lower interest expense in fiscal 2018, as compared to fiscal 2017.
Interest cost in fiscal 2018 was $190.7 million or 2.7% of revenues, as compared to $172.8 million or 3.0% of revenues in fiscal 2017. We recognized inventory impairments and write-offs of $35.2 million or 0.5% of revenues and $14.8 million or 0.3% of revenues in fiscal 2018 and fiscal 2017, respectively.
SELLING, GENERAL AND ADMINISTRATIVE EXPENSES (“SG&A”) SG&A spending increased by $78.5 million in fiscal 2018, as compared to fiscal 2017. As a percentage of revenues, SG&A was 9.6% and 10.4% in fiscal 2018 and 2017, respectively. The dollar increase in SG&A was due primarily to increased compensation costs due to a higher number of employees; increased sales and marketing costs; and increased consulting fees related to implementation of process improvements. The higher sales and marketing costs were the result of the increased number of homes delivered, increased spending on advertising, and higher design studio operating costs. The increased number of employees was due primarily to the overall increase in our business in fiscal 2018, as compared to fiscal 2017. The decrease in SG&A as a percentage of revenues in the fiscal 2018 period was due to SG&A spending increasing by 13% while revenues increased 23% from the fiscal 2017 period.
INCOME FROM UNCONSOLIDATED ENTITIES We recognize our proportionate share of the earnings and losses from the various unconsolidated entities in which we have an investment. Many of our unconsolidated entities are land development projects, high-rise/mid-rise condominium construction projects, or for-rent apartments projects, which do not generate revenues and earnings for a number of years during the development of the property. Once development is complete for land development projects and high-rise/mid-rise condominium construction projects, these unconsolidated entities will generally, over a relatively short period of time, generate revenues and earnings until all of the assets of the entity are sold. Further, once for-rent apartments projects are complete and stabilized, we may monetize a portion of these projects through a recapitalization or a sale of all or a portion of our ownership interest in the joint venture, resulting in income. Because there is not a steady flow of revenues and earnings from these entities, the earnings recognized from these entities will vary significantly from quarter to quarter and year to year.
The decrease in income from unconsolidated entities from $116.1 million in fiscal 2017 to $85.2 million to fiscal 2018, was due mainly to lower income from two of our Home Building Joint Ventures located in New York, New York, where the fiscal 2017 period benefited from the commencement of deliveries in the fourth quarter of fiscal 2016; $26.7 million of gains recognized in fiscal 2017 on the sale of 50% of our ownership interests in two of our Rental Property Joint Ventures located in Jersey City, New Jersey and the suburbs of Philadelphia, Pennsylvania; and $6.0 million of charges we recognized on two of our Land Development Joint Ventures in fiscal 2018, as compared to a $2.0 million impairment charge recognized on one of these joint ventures in fiscal 2017. These decreases were partially offset by $67.2 million of gains recognized in fiscal 2018 from asset sales by three of our Rental Property Joint Ventures located in College Park, Maryland, Herndon, Virginia, and Westborough, Massachusetts.
OTHER INCOME – NET The table below provides the components of “Other Income – net” for the years ended October 31, 2018 and 2017 (amounts in thousands):
2018 2017
Income from ancillary businesses $ 25,692 $ 18,934
Management fee income from home building unconsolidated entities, net 11,740 12,902
Income from land and other sales 6,331 8,621
Other 18,697 10,605
Total other income–net $ 62,460 $ 51,062
The increase in income from ancillary businesses in fiscal 2018, as compared to fiscal 2017, was mainly due a $10.7 million gain from a bulk sale of security monitoring accounts by our home control solutions business. This increase was partially offset by a $3.5 million write-down of a commercial property operated by Toll Brothers Apartment Living.
Management fee income from home building unconsolidated entities presented above primarily represents fees earned by our City Living and home building operations. In addition, in fiscal 2018 and 2017, our apartment living operations earned fees from unconsolidated entities of $7.5 million and $6.2 million, respectively; fees earned by our apartment living operations are included in income from ancillary businesses.
The increase in other in fiscal 2018, as compared to fiscal 2017, was principally due to higher interest income and retained customer deposits in fiscal 2018, as compared to fiscal 2017.
INCOME BEFORE INCOME TAXES In fiscal 2018, we reported income before income taxes of $933.9 million or 13.1% of revenues, as compared to $814.3 million, or 14.0% of revenues in fiscal 2017.
INCOME TAX PROVISION We recognized a $185.8 million income tax provision in fiscal 2018. Based upon the blended federal statutory rate of 23.3% for fiscal 2018, our federal tax provision would have been $217.9 million. The difference between the tax provision recognized and the tax provision based on the federal statutory rate was mainly due to tax law changes of $38.7 million; a benefit of $18.2 million related to the utilization of domestic production activities deductions; the reversal of $4.7 million of previously accrued tax provisions on uncertain tax positions that were no longer necessary due to the expiration of the statute of limitations and settlements with certain taxing jurisdictions; a benefit of $4.2 million from excess tax benefits related to stock-based compensation; and $15.2 million of permanent and other differences offset, in part, by the provision for state income taxes of $47.1 million. See Note 8, “Income Taxes” for additional information regarding the impact of the Tax Act.

TOLL BROTHERS 2018 33
We recognized a $278.8 million income tax provision in fiscal 2017. Based upon the federal statutory rate of 35%, our federal tax provision would have been $285.0 million. The difference between the tax provision recognized and the tax provision based on the federal statutory rate was due mainly to a $32.2 million benefit from the reversal of state deferred tax asset valuation allowances; a $12.8 million tax benefit from the utilization of the domestic production activities deduction; the reversal of $4.0 million of previously accrued tax provisions on uncertain tax positions that were no longer necessary due to the expiration of the statute of limitations and settlements with certain taxing jurisdictions; and $1.5 million of other permanent differences. These benefits were offset, in part, by the recognition of a $34.7 million provision for state income taxes; $1.0 million of accrued interest and penalties for previously accrued taxes on uncertain tax positions; and $8.6 million of other differences.
FISCAL 2017 COMPARED TO FISCAL 2016
REVENUES AND COST OF REVENUES The increase in revenues in fiscal 2017, as compared to fiscal 2016, was mainly attributable to a 17.3% increase in the number of homes delivered primarily due to a higher backlog at October 31, 2016, as compared to October 31, 2015, offset, in part, by a 4.1% decrease in the average price of the homes delivered. The decrease in the average delivered price was due to the impact of lower priced products delivered from communities acquired in our purchase of Coleman in November 2016 and a shift in the number of homes delivered to less expensive areas and/or products in the fiscal 2017 period, as compared to the fiscal 2016 period.
Cost of revenues, as a percentage of revenues, in fiscal 2017 was 78.5%, as compared to 80.2% in fiscal 2016. The decrease in fiscal 2017, as compared to fiscal 2016, was primarily due to the recognition in fiscal 2016 of $125.6 million (2.4% of revenues) of warranty charges primarily related to homes built in Pennsylvania and Delaware; a $6.0 million benefit in fiscal 2017 from the reversal of an accrual for offsite improvements at a completed community that was no longer required; state reimbursements of $4.7 million in fiscal 2017 for previously expensed environmental clean-up costs; and lower interest expense in the fiscal 2017 period, as compared to the fiscal 2016 period. These decreases were offset, in part, by a shift in the number of homes delivered to lower-margin buildings in our City Living segment; the impact of purchase accounting for the homes sold from communities acquired in our purchase of Coleman; higher material and labor costs; and a higher number of closings from lower-margin communities in our Traditional Home Building segment. See Note 7 – “Accrued Expenses” for additional information regarding these warranty charges.
Interest cost in fiscal 2017 was $172.8 million or 3.0% of revenues, as compared to $160.3 million or 3.1% of revenues in fiscal 2016. We recognized inventory impairments and write-offs of $14.8 million or 0.3% of revenues and $13.8 million or 0.3% of revenues in fiscal 2017 and fiscal 2016, respectively.
SELLING, GENERAL AND ADMINISTRATIVE EXPENSES (“SG&A”) SG&A spending increased by $72.5 million in fiscal 2017, as compared to fiscal 2016. As a percentage of revenues, SG&A increased to 10.4% in fiscal 2017 from 10.3% in fiscal 2016. The dollar increase in SG&A was due primarily to increased compensation costs due to a higher number of employees; increased sales and marketing costs; and increased spending on our upgrading of computer software. The higher sales and marketing costs were the result of the increased spending on advertising, higher model operating costs due to the increase in the average number of selling communities, and the increased number of homes delivered. The increased number of employees was due primarily to the overall increase in our business in fiscal 2017, as compared to fiscal 2016. The increase in SG&A as a percentage of revenues in the fiscal 2017 period was due to SG&A spending increasing by 13.6% while revenues increased 12.5% from the fiscal 2016 period.
INCOME FROM UNCONSOLIDATED ENTITIES The increase in income from unconsolidated entities in fiscal 2017, as compared to fiscal 2016, was due mainly to higher income recognized in fiscal 2017, as compared to fiscal 2016, from an increase in homes delivered at condominium projects and the sale of portions of our ownership interests in a
number of our joint ventures. We recognized $111.8 million of income from our Home Building, Rental Property, and Land Development Joint Ventures in fiscal 2017, as compared to $38.4 million of income in fiscal 2016. The increase in our income realized from these joint ventures was primarily attributable to $72.1 million of income realized from two of our Home Building Joint Ventures located in New York City, as compared to $12.9 million from these Home Building Joint Ventures in fiscal 2016, and $26.7 million of gains recognized in fiscal 2017 on the sale of 50% of our ownership interests in two of our Rental Property Joint Ventures located in Jersey City, New Jersey and the suburbs of Philadelphia, Pennsylvania; offset, in part, by a decrease in the number of lots delivered at one of our Land Development Joint Ventures in fiscal 2017 as compared to fiscal 2016 and a $4.9 million gain, in fiscal 2016, from the sale of our ownership interests in one of our joint ventures located in New Jersey.
OTHER INCOME – NET The table below provides the components of “Other Income – net” for the years ended October 31, 2017 and 2016 (amounts in thousands):
2017 2016
Income from ancillary businesses $ 16,276 $ 17,473
Gibraltar 2,658 6,646
Management fee income from home building unconsolidated entities, net 12,902 10,270
Income from land sales 8,621 13,327
Other 10,605 8,238
Total other income–net $ 51,062 $ 55,954
Management fee income from home building unconsolidated entities presented above primarily represents fees earned by our City Living and home building operations. In addition, in fiscal 2017 and 2016, our apartment living operations earned fees from unconsolidated entities of $6.2 million and $6.1 million, respectively; fees earned by our apartment living operations are included in income from ancillary businesses.
In fiscal 2016, our security monitoring business recognized a gain of $1.6 million from a bulk sale of security monitoring accounts in fiscal 2015, which is included in income from ancillary businesses above. The decline in income from Gibraltar was due primarily from the continuing monetization of its assets and a $1.3 million gain in fiscal 2016 from the sale of a 76% interest in certain assets of Gibraltar. See Note 4, “Investments in Unconsolidated Entities – Gibraltar Joint Ventures” for additional information on this transaction.
INCOME BEFORE INCOME TAXES In fiscal 2017, we reported income before income taxes of $814.3 million or 14.0% of revenues, as compared to $589.0 million, or 11.4% of revenues in fiscal 2016.
INCOME TAX PROVISION We recognized a $278.8 million income tax provision in fiscal 2017. Based upon the federal statutory rate of 35%, our federal tax provision would have been $285.0 million. The difference between the tax provision recognized and the tax provision based on the federal statutory rate was due mainly to a $32.2 million benefit from the reversal of state deferred tax asset valuation allowances; a $12.8 million tax benefit from the utilization of the domestic production activities deduction; the reversal of $4.0 million of previously accrued tax provisions on uncertain tax positions that were no longer necessary due to the expiration of the statute of limitations and settlements with certain taxing jurisdictions; and $1.5 million of other permanent differences. These benefits were offset in part, by the recognition of a $34.7 million provision for state income taxes; $1.0 million of accrued interest and penalties for previously accrued taxes on uncertain tax positions; and $8.6 million of other differences.

TOLL BROTHERS 201834
We recognized a $206.9 million income tax provision in fiscal 2016. Based upon the federal statutory rate of 35%, our federal tax provision would have been $206.2 million. The difference between our tax provision recognized and the tax provision based on the federal statutory rate was due mainly to the recognition of a $27.0 million provision for state income taxes; the recognition of a $2.1 million provision for uncertain tax positions taken; $2.0 million of accrued interest and penalties for previously accrued taxes on uncertain tax positions; and $3.9 million of other differences; offset by a $16.9 million tax benefit from the utilization of the domestic production activities deduction; the reversal of $11.2 million of previously accrued tax provisions on uncertain tax positions that were no longer necessary due to the expiration of the statute of limitations and settlements with certain taxing jurisdictions; and $7.0 million of other permanent deductions.
CAPITAL RESOURCES AND LIQUIDITY Funding for our business has been, and continues to be, provided principally by cash flow from operating activities before inventory additions, unsecured bank borrowings, and the public debt and equity markets.
Fiscal 2018 At October 31, 2018, we had $1.18 billion of cash and cash equivalents and approximately $1.13 billion available for borrowing under our Revolving Credit Facility.
Cash provided by operating activities during fiscal 2018 was $602.4 million. It was generated primarily from $748.2 million of net income plus $28.3 million of stock-based compensation, $25.3 million of depreciation and amortization, $35.2 million of inventory impairments and write-offs; and an increase of $57.9 million in accounts payable and accrued expenses; offset, in part, by a $143.6 million increase in inventory; an increase of $85.4 million in receivables, prepaid assets, and other assets; an increase of $38.9 million in mortgage loans held for sale; and a net deferred tax benefit of $21.9 million.
Cash provided by investing activities during fiscal 2018 was $81.3 million. The cash generated by investing activities was primarily related to $138.0 million of cash received as returns on our investments in unconsolidated entities, foreclosed real estate, and distressed loans offset, in part, by $28.2 million for the purchase of property and equipment and $27.5 million used to fund investments in unconsolidated entities.
We used $214.3 million of cash from financing activities in fiscal 2018, primarily for repurchase of $503.2 million of our common stock; the repayment of $92.7 million of other loans payable, net of new borrowings; and payment of $61.7 million of dividends on our common stock, offset, in part, by the net proceeds of $396.5 million from the issuance of $400.0 million aggregate principal amount of 4.35% Senior Notes due 2028, the borrowings of $29.9 million on our mortgage company loan facility, net of new borrowings; and the proceeds of $13.4 million from our stock-based benefit plans.
Fiscal 2017 At October 31, 2017, we had $712.8 million of cash and cash equivalents on hand and approximately $1.15 billion available for borrowing under our Revolving Credit Facility.
Cash provided by operating activities during fiscal 2017 was $965.0 million. It was generated primarily from $535.5 million of net income plus $28.5 million of stock-based compensation, $25.4 million of depreciation and amortization, $14.8 million of inventory impairments and write-offs; a net deferred tax provision of $185.7 million; a $129.7 million decrease in inventory; a decrease of $114.9 million in mortgage loans held for sale; and a $38.0 million increase in customer deposits; offset, in part, by a decrease of $140.5 million in accounts payable and accrued expenses.
Cash used in investing activities during fiscal 2017 was $7.7 million. The cash used in investing activities was primarily related to $122.3 million used to fund investments in unconsolidated entities, $83.1 million used for the acquisition of Coleman, and $28.9 million for the purchase of property and equipment, offset, in part, by $209.3 million of cash received as returns on our investments in
unconsolidated entities, foreclosed real estate, and distressed loans, and $18.0 million from net sales of restricted investments.
We used $878.2 million of cash from financing activities in fiscal 2017, primarily for the repayment of $687.5 million of senior notes; the repurchase of $290.9 million of our common stock; the repayment of $250.0 million on our Revolving Credit Facility, net of new borrowings under it; the repayment of $89.9 million on our mortgage company loan facility, net of new borrowings; the repayment of $42.9 million of other loans payable, net of new borrowings; and payment of $38.6 million of dividends on our common stock, offset, in part, by the net proceeds of $455.5 million from the issuance of $450.0 million aggregate principal amount of 4.875% Senior Notes due 2027, and the proceeds of $66.0 million from our stock-based benefit plans.
Fiscal 2016 At October 31, 2016, we had $633.7 million of cash and cash equivalents on hand and approximately $961.8 million available for borrowing under our Revolving Credit Facility.
Cash provided by operating activities during fiscal 2016 was $150.9 million. It was generated primarily from $382.1 million of net income plus $26.7 million of stock-based compensation, $23.1 million of depreciation and amortization, $13.8 million of inventory impairments and write-offs, and $19.3 million of deferred taxes; an increase of $524.6 million in accounts payable and accrued expenses; a $27.8 million increase in customer deposits; and a $6.0 million increase in income taxes payable; offset, in part, by the net purchase of $391.2 million of inventory; a $307.4 million increase in receivables, prepaid expenses, and other assets; and an increase of $124.9 million in mortgage loans originated, net of the sale of mortgage loans to outside investors.
Cash provided by investing activities during fiscal 2016 was $8.2 million. The cash provided by investing activities was primarily related to $97.4 million of cash received as returns on our investments in unconsolidated entities, foreclosed real estate, and distressed loans and $10.0 million of proceeds from the sale of marketable securities, offset, in part, by $69.7 million used to fund investments in unconsolidated entities and $28.4 million for the purchase of property and equipment.
We used $444.4 million of cash from financing activities in fiscal 2016, primarily for the repurchase of $392.8 million of our common stock; the repayment of $100.0 million from our credit facilities, net of new borrowing under them; and the repayment of $69.0 million of other loans payable, net of new borrowings, offset, in part, by $110.0 million of new borrowings under our mortgage company loan facility, net of repayments.
Other In general, our cash flow from operating activities assumes that, as each home is delivered, we will purchase a home site to replace it. Because we own a supply of several years of home sites, we do not need to buy home sites immediately to replace those that we deliver. In addition, we generally do not begin construction of our detached homes until we have a signed contract with the home buyer. Should our business remain at its current level or decline, we believe that our inventory levels would decrease as we complete and deliver the homes under construction but do not commence construction of as many new homes, as we complete the improvements on the land we already own, and as we sell and deliver the speculative homes that are currently in inventory, resulting in additional cash flow from operations. In addition, we might delay, decrease, or curtail our acquisition of additional land, which would further reduce our inventory levels and cash needs. At October 31, 2018, we owned or controlled through options approximately 53,400 home sites, as compared to approximately 48,300 at October 31, 2017; and approximately 48,800 at October 31, 2016. Of the approximately 53,400 home sites owned or controlled through options at October 31, 2018, we owned approximately 32,500. Of our owned home sites at October 31, 2018, significant improvements were completed on approximately 16,900 of them.
At October 31, 2018, the aggregate purchase price of land parcels under option and purchase agreements was approximately $2.53 billion (including $128.2 million of land to be acquired from

TOLL BROTHERS 2018 35
joint ventures in which we have invested). Of the $2.53 billion of land purchase commitments, we had paid or deposited $168.4 million and, if we acquire all of these land parcels, we will be required to pay an additional $2.29 billion. The purchases of these land parcels are scheduled over the next several years. In addition, we expect to purchase approximately 2,700 additional home sites over a number of years from several of these joint ventures. We have additional land parcels under option that have been excluded from the aforementioned aggregate purchase amounts since we do not believe that we will complete the purchase of these land parcels and no additional funds will be required from us to terminate these contracts.
During the past several years, we have made a number of investments in unconsolidated entities related to the acquisition and development of land for future home sites, the construction of luxury for-sale condominiums, and for-rent apartments. Our investment activities related to investments in and distributions of investments from unconsolidated entities are contained in the Consolidated Statements of Cash Flows under “Net cash provided by (used in) investing activities,” At October 31, 2018, we had investments in these entities of $431.8 million, and were committed to invest or advance up to an additional $39.5 million to these entities if they require additional funding. At October 31, 2018, we had purchase commitments to acquire land for apartment developments of approximately $272.6 million, of which we had outstanding deposits in the amount of $13.2 million. We intend to develop these apartment projects in joint ventures with unrelated parties in the future.
We have a $1.295 billion Revolving Credit Facility that is scheduled to expire in May 2021. Under the terms of the Revolving Credit Facility, our maximum leverage ratio (as defined in the credit agreement) may not exceed 1.75 to 1.00 and we are required to maintain a minimum tangible net worth (as defined in the credit agreement) of no less than approximately $2.50 billion. Under the terms of the Revolving Credit Facility, at October 31, 2018, our leverage ratio was approximately 0.54 to 1.00 and our tangible net worth was approximately $4.72 billion. Based upon the minimum tangible net worth requirement, our ability to repurchase our common stock was limited to approximately $2.41 billion as of October 31, 2018. At October 31, 2018, we had no outstanding borrowings under the Revolving Credit Facility and had outstanding letters of credit of approximately $165.4 million.
On October 31, 2018, we had a $500.0 million, five-year senior unsecured term loan facility (the “Term Loan Facility”) with a syndicate of banks which was scheduled to mature in August 2021. On November 1, 2018, we entered into an amendment to the Term Loan Facility to, among other things, (i) increase the size of the outstanding term loan to $800 million; (ii) extend the maturity date to November 1, 2023, with no principal payments being required before the maturity date; (iii) provide an accordion feature under which we may, subject to certain conditions set forth in the agreement, increase the Term Loan Facility up to a maximum aggregate amount of $1.0 billion; (iv) revise certain provisions to reduce the interest rate applicable on outstanding borrowings, and (v) modify certain provisions relating to existing financial maintenance and negative covenants.
We believe that we will have adequate resources and sufficient access to the capital markets and external financing sources to continue to fund our current operations and meet our contractual obligations. Due to the uncertainties in the economy and for home builders in general, we cannot be certain that we will be able to replace existing financing or find sources of additional financing in the future.
INFLATION The long-term impact of inflation on us is manifested in increased costs for land, land development, construction, and overhead. We generally enter into contracts to acquire land a significant period of time before development and sales efforts begin. Accordingly, to the extent land acquisition costs are fixed, subsequent increases or decreases in the sales prices of homes will affect our profits. Because the sales price of each of our homes is fixed at the time a buyer enters into a contract to purchase a home and because we generally contract to sell our homes before we begin construction, any inflation of costs in excess of those anticipated may result in lower gross margins. We generally attempt to minimize that effect by entering into fixed-price contracts with our subcontractors and material suppliers for specified periods of time, which generally do not exceed one year.
In general, housing demand is adversely affected by increases in interest rates and housing costs. Interest rates, the length of time that land remains in inventory, and the proportion of inventory that is financed affect our interest costs. If we are unable to raise sales prices enough to compensate for higher costs, or if mortgage interest rates increase significantly, affecting prospective buyers’ ability to adequately finance home purchases, our revenues, gross margins, and net income could be adversely affected. Increases in sales prices, whether the result of inflation or demand, may affect the ability of prospective buyers to afford new homes.
CONTRACTUAL OBLIGATIONSThe following table summarizes our estimated contractual payment obligations at October 31, 2018 (amounts in millions):
2013 2019 2020–2021 2022–2023 Thereafter Total
Senior notes (a) $ 481.8 $ 475.3 $ 993.5 $ 1,635.8 $ 3,586.4
Loans payable (a)(b) 97.5 557.2 29.2 100.4 784.3
Mortgage company loan facility (a)(c) 153.2 153.2
Operating lease obligations (d) 12.7 13.6 5.7 1.7 33.7
Purchase obligations (e) 1,823.3 723.9 290.9 144.8 2,982.9
Retirement plans (f) 9.7 14.3 13.8 55.4 93.2
$ 2,578.2 $ 1,784.3 $ 1,333.1 $ 1,938.1 $ 7,633.7
(a) Amounts include estimated annual interest payments until maturity of the debt. Of the amounts indicated, $2.9 billion of the senior notes, $686.8 million of loans payable, $150.0 million of the mortgage company loan facility, and $40.3 million of accrued interest were recorded on our October 31, 2018 Consolidated Balance Sheet.
(b) The 2020 – 2021 column above includes $500.0 million for the maturity of the Term Loan Facility. On November 1, 2018, we amended the Term Loan Facility to, among other things, increase the size of the outstanding term loan from $500.0 million to $800.0 million and extend the maturity date to November 1, 2023.
(c) In December 2018, we amended the mortgage company warehousing agreement to, among other things, extend the maturity date to December 6, 2019.
(d) In December 2018, we signed a 16-year lease agreement to lease approximately 163,000 square feet of office space for our new corporate headquarters. The terms of the lease require annual minimum lease payments starting at $2.8 million which escalate throughout the lease term. Payments under this lease are not included in the table above.
(e) Amounts represent our expected acquisition of land under purchase agreements and the estimated remaining amount of the contractual obligation for land development agreements secured by letters of credit and surety bonds. Of the total amount indicated, $40.1 million was recorded on our October 31, 2018 Consolidated Balance Sheet.
(f) Amounts represent our obligations under our deferred compensation plan, supplemental executive retirement plans and our 401(k) salary deferral savings plans. Of the total amount indicated, $68.6 million was recorded on our October 31, 2018 Consolidated Balance Sheet.

TOLL BROTHERS 201836
SEGMENTSWe operate in two segments: Traditional Home Building and City Living, our urban development division. Within Traditional Home Building, we operate in five geographic segments around the United States: (1) the North, consisting of Connecticut, Illinois, Massachusetts, Michigan, New Jersey, and New York; (2) the Mid-Atlantic, consisting of Delaware, Maryland, Pennsylvania, and Virginia; (3) the South, consisting of Florida, North Carolina, and Texas; (4) the West, consisting of Arizona, Colorado, Idaho, Nevada, and Washington, and (5) California.
In fiscal 2018, we acquired land and commenced development activities in the Salt Lake City, Utah and Portland, Oregon markets. We expect to open communities in these markets in fiscal 2019. In fiscal 2018, we discontinued the sale of homes in Minnesota. Our operations in Minnesota were immaterial to the North geographic segment.
The following tables summarize information related to revenues, net contracts signed, and income (loss) before income taxes by segment for fiscal years 2018, 2017, and 2016. Information related to backlog and assets by segment at October 31, 2018 and 2017, has also been provided.
Total Assets ($ amounts in millions):At October 31,
2018 2017
Traditional Home Building:
North $ 970.9 $ 1,075.0 Mid-Atlantic 1,130.4 1,121.0
South 1,237.7 1,184.9
West 1,580.2 1,275.3
California 2,734.0 2,630.0
Traditional Home Building 7,653.2 7,286.2
City Living 516.2 647.2
Corporate and other 2,075.2 1,511.8
Total $ 10,244.6 $ 9,445.2
“Corporate and other” is comprised principally of cash and cash equivalents, restricted cash, deferred tax assets, investments in our Rental Property Joint Ventures, expected recoveries from insurance carriers and suppliers, our Gibraltar investments and operations, manufacturing facilities, and our mortgage and title subsidiaries.

TOLL BROTHERS 2018 37
Income (Loss) Before Income Taxes ($ amounts in millions):
2018 2017% Change
2018 vs. 2017 2016% Change
2017 vs. 2016
Traditional Home Building:
North $ 56.5 $ 50.4 12% $ 77.0 (35)% Mid-Atlantic 90.6 105.7 (14)% (29.4) 460%
South 110.3 112.8 (2)% 128.6 (12)%
West 213.3 153.2 39% 127.3 20%
California 494.3 345.1 43% 335.2 3%
Traditional Home Building 965.0 767.2 26% 638.7 20%
City Living 78.1 193.9 (60)% 91.1 113%
Corporate and other (109.2) (146.8) 26% (140.8) (4)%
Total $ 933.9 $ 814.3 15% $ 589.0 38%
“Corporate and other” is comprised principally of general corporate expenses such as the offices of our executive officers; the corporate finance, accounting, audit, tax, human resources, risk management, information technology, marketing, and legal groups; interest income; income from certain of our ancillary businesses, including Gibraltar; and income from our Rental Property Joint Ventures and Gibraltar Joint Ventures.
Units Delivered and Revenues:Fiscal 2018 Compared to Fiscal 2017
Revenues ($ in millions) Units Delivered Average Delivered Price ($ in thousands)2018 2017 % Change 2018 2017 % Change 2018 2017 % Change
Traditional Home Building:
North $ 975.7 $ 775.5 26% 1,453 1,139 28% $ 671.5 $ 680.9 (1)% Mid-Atlantic 1,141.1 1,030.3 11% 1,800 1,681 7% 633.9 612.9 3%
South 1,045.4 924.0 13% 1,391 1,247 12% 751.5 741.0 1%
West 1,451.4 1,151.7 26% 2,130 1,783 19% 681.4 645.9 5%
California 2,208.7 1,550.5 42% 1,322 1,041 27% 1,670.7 1,489.4 12%
Traditional Home Building 6,822.3 5,432.0 26% 8,096 6,891 17% 842.7 788.3 7%
City Living 321.0 383.1 (16)% 169 260 (35)% 1,899.4 1,473.5 29%
Total $ 7,143.3 $ 5,815.1 23% 8,265 7,151 16% $ 864.3 $ 813.2 6%
Fiscal 2017 Compared to Fiscal 2016Revenues ($ in millions) Units Delivered Average Delivered Price ($ in thousands)
2017 2016 % Change 2017 2016 % Change 2017 2016 % Change
Traditional Home Building:
North $ 775.5 $ 814.5 (5)% 1,139 1,172 (3)% $ 680.9 $ 695.0 (2)%
Mid-Atlantic 1,030.3 895.7 15% 1,681 1,432 17% 612.9 625.5 (2)%
South 924.0 849.6 9% 1,247 1,093 14% 741.0 777.3 (5)%
West 1,151.7 903.7 27% 1,783 1,304 37% 645.9 693.0 (7)%
California 1,550.5 1,448.5 7% 1,041 1,006 3% 1,489.4 1,439.9 3%
Traditional Home Building 5,432.0 4,912.0 11% 6,891 6,007 15% 788.3 817.7 (4)%
City Living 383.1 257.5 49% 260 91 186% 1,473.5 2,829.7 (48)%
Total $ 5,815.1 $ 5,169.5 12% 7,151 6,098 17% $ 813.2 $ 847.7 (4)%

TOLL BROTHERS 201838
Net Contracts Signed:Fiscal 2018 Compared to Fiscal 2017
Net Contract Value ($ in millions) Net Contracted Units Average Contracted Price ($ in thousands)2018 2017 % Change 2018 2017 % Change 2018 2017 % Change
Traditional Home Building:
North $ 928.1 $ 898.9 3% 1,334 1,379 (3)% $ 695.7 $ 651.8 7% Mid-Atlantic 1,158.3 1,161.9 —% 1,799 1,838 (2)% 643.9 632.2 2%
South 1,132.7 1,003.5 13% 1,502 1,342 12% 754.1 747.8 1%
West 1,510.5 1,318.3 15% 2,133 2,032 5% 708.2 648.8 9%
California 2,596.9 2,177.9 19% 1,568 1,395 12% 1,656.2 1,561.2 6%
Traditional Home Building 7,326.5 6,560.5 12% 8,336 7,986 4% 878.9 821.5 7%
City Living 277.8 267.8 4% 183 189 (3)% 1,518.0 1,416.9 7%
Total $ 7,604.3 $ 6,828.3 11% 8,519 8,175 4% $ 892.6 $ 835.3 7%
Fiscal 2017 Compared to Fiscal 2016Net Contract Value ($ in millions) Net Contracted Units Average Contracted Price ($ in thousands)
2017 2016 % Change 2017 2016 % Change 2017 2016 % Change
Traditional Home Building:
North $ 898.9 $ 888.0 1% 1,379 1,259 10% $ 651.8 $ 705.3 (8)%
Mid-Atlantic 1,161.9 986.8 18% 1,838 1,607 14% 632.2 614.1 3%
South 1,003.5 916.8 9% 1,342 1,229 9% 747.8 746.0 —%
West 1,318.3 1,096.7 20% 2,032 1,508 35% 648.8 727.3 (11)%
California 2,177.9 1,418.5 54% 1,395 930 50% 1,561.2 1,525.3 2%
Traditional Home Building 6,560.5 5,306.8 24% 7,986 6,533 22% 821.5 812.3 1%
City Living 267.8 342.8 (22)% 189 186 2% 1,416.9 1,843.0 (23)%
Total $ 6,828.3 $ 5,649.6 21% 8,175 6,719 22% $ 835.3 $ 840.8 (1)%

TOLL BROTHERS 2018 39
Backlog at October 31:Backlog at October October 31, 2018 Compared to October 31, 2017
Backlog Value ($ in millions) Backlog Units Average Backlog Price ($ in thousands)2018 2017 % Change 2018 2017 % Change 2018 2017 % Change
Traditional Home Building:
North $ 768.5 $ 816.1 (6)% 1,098 1,217 (10)% $ 699.9 $ 670.6 4% Mid-Atlantic 758.8 741.6 2% 1,142 1,143 —% 664.4 648.8 2%
South 903.2 815.9 11% 1,166 1,055 11% 774.6 773.4 —%
West 1,031.1 972.0 6% 1,400 1,397 —% 736.5 695.7 6%
California 1,883.3 1,495.1 26% 1,133 887 28% 1,662.2 1,685.6 (1)%
Traditional Home Building 5,344.9 4,840.7 10% 5,939 5,699 4% 900.0 849.4 6%
City Living 177.6 220.8 (20)% 166 152 9% 1,069.7 1,452.7 (26)%
Total $ 5,522.5 $ 5,061.5 9% 6,105 5,851 4% $ 904.6 $ 865.1 5%
October 31, 2017 Compared to October 31, 2016Backlog Value ($ in millions) Backlog Units Average Backlog Price ($ in thousands)2017 2016 % Change 2017 2016 % Change 2017 2016 % Change
Traditional Home Building:
North $ 816.1 $ 692.8 18% 1,217 977 25% $ 670.6 $ 709.1 (5)%
Mid-Atlantic 741.6 610.0 22% 1,143 986 16% 648.8 618.7 5%
South 815.9 736.4 11% 1,055 960 10% 773.4 767.1 1%
West 972.0 766.5 27% 1,397 1,020 37% 695.7 751.5 (7)%
California 1,495.1 867.7 72% 887 533 66% 1,685.6 1,627.9 4%
Traditional Home Building 4,840.7 3,673.4 32% 5,699 4,476 27% 849.4 820.7 3%
City Living 220.8 310.7 (29)% 152 209 (27)% 1,452.7 1,486.5 (2)%
Total $ 5,061.5 $ 3,984.1 27% 5,851 4,685 25% $ 865.1 $ 850.4 2%

TOLL BROTHERS 201840
FISCAL 2018 COMPARED TO FISCAL 2017
Traditional Home BuildingNORTH
Year ended October 31,2018 2017 % Change
Units Delivered and Revenues: Revenues ($ in millions) $ 975.7 $ 775.5 26%
Units delivered 1,453 1,139 28%
Average delivered price ($ in thousands) $ 671.5 $ 680.9 (1)%
Net Contracts Signed: Net contract value ($ in millions) $ 928.1 $ 898.9 3%
Net contracted units 1,334 1,379 (3)%
Average contracted price ($ in thousands) $ 695.7 $ 651.8 7%
Cost of revenues as a percentage of revenues 86.7% 84.8%
Income before income taxes ($ in millions) $ 56.5 $ 50.4 12%
Number of selling communities at October 31, 57 51 12%
The increase in the number of homes delivered in fiscal 2018, as compared to fiscal 2017, was mainly due to increases in the number of homes closed in Michigan, New Jersey, and New York, which were attributable to the increased number of homes in backlog in those markets at October 31, 2017, as compared to the number of homes in backlog at October 31, 2016. In addition, revenue in fiscal 2017 was impacted by the defective floor joists issue that is further discussed in “Overview – Defective Floor Joists” in this MD&A. The decrease in the average price of homes delivered in fiscal 2018, as compared to fiscal 2017, was mainly due to a shift in the number of homes delivered to less expensive areas and/or products in fiscal 2018, as compared to fiscal 2017, particularly in Massachusetts and Michigan.
The decrease in the number of net contracts signed in fiscal 2018, as compared to fiscal 2017, was mainly due to a decrease in the average number of selling communities in the fiscal 2018 periods, as compared to the fiscal 2017 periods. The increase in the average sales price of net contracts signed in fiscal 2018, as compared to fiscal 2017, was principally attributable to shifts in the number of contracts signed to more expensive areas and/or products in fiscal 2018, as compared to fiscal 2017, particularly in Michigan and New Jersey.
The increase in income before income taxes in fiscal 2018, as compared to fiscal 2017, was principally attributable to higher earnings from increased revenues, offset, in part, by higher cost of revenues, as a percentage of revenues in fiscal 2018, as compared to fiscal 2017. The increase in the cost of revenues, as a percentage of revenues, was primarily due to higher inventory impairment charges, a shift in product mix/areas to lower-margin areas, and higher material and labor costs in fiscal 2018, as compared to fiscal 2017.
Inventory impairment charges were $19.7 million in fiscal 2018, as compared to $6.5 million in fiscal 2017. During fiscal 2018, we determined that the pricing assumptions used in prior impairment reviews for one operating community located in Connecticut needed to be reduced, primarily due to a lack of improvement and/or a decrease in customer demand as a result of weaker than expected
market conditions. As a result of this reduction in expected sales prices, we determined that this community was impaired. Accordingly, the carrying value of this community was written down to its estimated fair value resulting in a charge to income before income taxes of $12.0 million in fiscal 2018. In addition, during fiscal 2018, primarily due to a lack of improvement and/or a decrease in customer demand, we decided to sell the remaining lots in bulk sales in two communities, located in Illinois and Minnesota, rather than sell and construct homes as previously intended. The carrying values of these communities were written down to their estimated fair values resulting in a charge to income before income taxes of $4.4 million in fiscal 2018.
MID-ATLANTIC
Year ended October 31,2018 2017 % Change
Units Delivered and Revenues: Revenues ($ in millions) $ 1,141.1 $ 1,030.3 11%
Units delivered 1,800 1,681 7%
Average delivered price ($ in thousands) $ 633.9 $ 612.9 3%
Net Contracts Signed: Net contract value ($ in millions) $ 1,158.3 $ 1,161.9 —%
Net contracted units 1,799 1,838 (2)%
Average contracted price ($ in thousands) $ 643.9 $ 632.2 2%
Cost of revenues as a percentage of revenues 84.4% 82.1%
Income (loss) before income taxes ($ in millions) $ 90.6 $ 105.7 (14)%
Number of selling communities at October 31, 62 64 (3)%
The increase in the number of homes delivered in fiscal 2018, as compared to fiscal 2017, was mainly due to an increase in the number of homes closed in Pennsylvania and Maryland, which was attributable to an increase in the number of homes in backlog in those markets at October 31, 2017, as compared to the number of homes in backlog at October 31, 2016. The increase in the average price of homes delivered in fiscal 2018, as compared to fiscal 2017, was primarily due to a shift in the number of homes delivered to more expensive areas and/or products in fiscal 2018, as compared to fiscal 2017.
The decrease in the number of net contracts signed in fiscal 2018, as compared to fiscal 2017, was principally due to a decrease in the average number of selling communities partially offset by an increase in demand in fiscal 2018, as compared to fiscal 2017.
The decrease in income before income taxes in fiscal 2018, as compared to fiscal 2017, was mainly due to increases in cost of revenues, as a percent of revenues, and a higher impairment charge recognized on one of our Land Development Joint Ventures in fiscal 2018, as compared to fiscal 2017. These decreases were partially offset by higher earnings from increased revenues. The increase in cost of revenues, as a percentage of revenues, was mainly due to increased material and labor costs; a $6.0 million benefit in fiscal 2017 from the reversal of an accrual for offsite improvements at a completed community that was no longer required; and higher inventory impairment charges in fiscal 2018, as compared to fiscal 2017. In fiscal 2018, inventory impairment charges were $9.8 million, as compared to $6.9 million in fiscal 2017. In fiscal 2018, we decided to sell a portion of the lots in a

TOLL BROTHERS 2018 41
bulk sale in one community located in Maryland, primarily due to increases in site costs and a lack of improvement in customer demand as a result of weaker than expected market conditions. The carrying value of this community was written down to its estimated fair value resulting in a charge to income before income taxes in fiscal 2018 of $6.7 million. During fiscal 2017, we determined that the pricing assumptions used in prior impairment reviews for one operating community located in Maryland needed to be reduced primarily due to a lack of improvement and/or a decrease in customer demand as a result of weaker than expected market conditions. As a result of this reduction in expected sales prices, we determined that this community was impaired. Accordingly, the carrying value of this community was written down in fiscal 2017 to its estimated fair value resulting in a charge to income before taxes of $3.9 million.
In fiscal 2018 and 2017, we recognized impairment charges of $4.0 million, and $2.0 million, respectively, related to one Land Development Joint Venture located in Maryland. In fiscal 2017, we determined that we should increase the development costs assumptions used in prior impairment reviews of this joint venture. As a result of these cost increases, we determined that our investment in this joint venture was impaired and we concluded that the impairment was other than temporary. Accordingly, the carrying value of our investment in this joint venture was written down to its estimated fair value resulting in a charge to income before taxes of $2.0 million in fiscal 2017. Further, in the third quarter of fiscal 2018, we and our partner decided to sell the land in this joint venture rather than continue development and sell finished lots as previously intended, primarily due to continued cost increases and reduced demand in that market. We determined that our investment in this joint venture was further impaired and we concluded that the impairment was other than temporary. Accordingly, the carrying value of our investment in this joint venture was written down to its estimated fair value resulting in a charge to income before taxes of $4.0 million in fiscal 2018.
SOUTH
Year ended October 31,2018 2017 % Change
Units Delivered and Revenues: Revenues ($ in millions) $ 1,045.4 $ 924.0 13%
Units delivered 1,391 1,247 12%
Average delivered price ($ in thousands) $ 751.5 $ 741.0 1%
Net Contracts Signed: Net contract value ($ in millions) $ 1,132.7 $ 1,003.5 13%
Net contracted units 1,502 1,342 12%
Average contracted price ($ in thousands) $ 754.1 $ 747.8 1%
Cost of revenues as a percentage of revenues 83.3% 81.5%
Income before income taxes ($ in millions) $ 110.3 $ 112.8 $ (2)%
Number of selling communities at October 31, 69 73 (5)%
The increase in the number of homes delivered in fiscal 2018, as compared to fiscal 2017, was mainly due to the increased number of homes in backlog as of October 31, 2017, as compared to the number of homes in backlog at October 31, 2016.
The increase in the number of net contracts signed in fiscal 2018, as compared to fiscal 2017, was mainly due to an increase in demand, offset, in part, by a decrease in the average number of selling communities in fiscal 2018, as compared to fiscal 2017.
The decrease in income before income taxes in fiscal 2018, as compared to fiscal 2017, was principally due to a higher cost of revenues, as a percentage of revenues, offset, in part, by higher earnings from increased revenues. The increase in cost of revenues, as a percentage of revenues, in fiscal 2018, as compared to fiscal 2017, was primarily due to higher material and labor costs in fiscal 2018, as compared to fiscal 2017.
WEST
Year ended October 31,2018 2017 % Change
Units Delivered and Revenues: Revenues ($ in millions) $ 1,451.4 $ 1,151.7 26%
Units delivered 2,130 1,783 19%
Average delivered price ($ in thousands) $ 681.4 $ 645.9 5%
Net Contracts Signed: Net contract value ($ in millions) $ 1,510.5 $ 1,318.3 15%
Net contracted units 2,133 2,032 5%
Average contracted price ($ in thousands) $ 708.2 $ 648.8 9%
Cost of revenues as a percentage of revenues 78.2% 79.3%
Income before income taxes ($ in millions) $ 213.3 $ 153.2 $ 39%
Number of selling communities at October 31, 83 73 14%
The increase in the number of homes delivered in fiscal 2018, as compared to fiscal 2017, was mainly due to the increased number of homes in backlog at October 31, 2017, as compared to the number of homes in backlog at October 31, 2016. The increase in the average delivered price of homes delivered in fiscal 2018, as compared to fiscal 2017, was primarily due to a shift in the number of homes delivered to more expensive areas and/or products and price increases in fiscal 2018, as compared to fiscal 2017, offset, in part, by an increase in deliveries in Idaho, where average delivered home prices are lower than our Company average, in fiscal 2018, as compared to fiscal 2017.
The increase in the number of net contracts signed in fiscal 2018, as compared to fiscal 2017, was principally due to an increase in demand partially offset by a decrease in the average number of selling communities in fiscal 2018, as compared to fiscal 2017. The increase in the average value of each contract signed in fiscal 2018, as compared to fiscal 2017, was mainly due to a shift in the number of contracts signed to more expensive areas and/or products and price increases in fiscal 2018, as compared to fiscal 2017.
The increase in income before income taxes in fiscal 2018, as compared to fiscal 2017, was due mainly to higher earnings from increased revenues in fiscal 2018, as compared to fiscal 2017.

TOLL BROTHERS 201842
CALIFORNIA
Year ended October 31,2018 2017 % Change
Units Delivered and Revenues: Revenues ($ in millions) $ 2,208.7 $ 1,550.5 42%
Units delivered 1,322 1,041 27%
Average delivered price ($ in thousands) $ 1,670.7 $ 1,489.4 12%
Net Contracts Signed: Net contract value ($ in millions) $ 2,596.9 $ 2,177.9 19%
Net contracted units 1,568 1,395 12%
Average contracted price ($ in thousands) $ 1,656.2 $ 1,561.2 6%
Cost of revenues as a percentage of revenues 72.9% 72.8%
Income before income taxes ($ in millions) $ 494.3 $ 345.1 $ 43%
Number of selling communities at October 31, 38 38 —%
The increase in the number of homes delivered in fiscal 2018, as compared to fiscal 2017, was mainly due to to the increased number of homes in backlog at October 31, 2017, as compared to the number of homes in backlog at October 31, 2016. The increase in the average price of homes delivered in fiscal 2018, as compared to fiscal 2017, was primarily due to a shift in the number of homes delivered to more expensive areas and/or products and increased selling prices of homes delivered in fiscal 2018, as compared to fiscal 2017.
The increase in the number of net contracts signed in fiscal 2018, as compared to fiscal 2017, was due mainly to an increase in the average number of selling communities in Northern California, offset, in part, by a decrease in demand in Southern California. The increase in the average value of each contract signed in fiscal 2018, as compared to fiscal 2017, was mainly due to a shift in the number of contracts signed to more expensive areas and/or products and increased selling prices in fiscal 2018, as compared to fiscal 2017.
The increase in income before income taxes in fiscal 2018, as compared to fiscal 2017, was primarily due to higher earnings from the increased revenues in fiscal 2018, as compared to fiscal 2017, and a $7.0 million benefit in fiscal 2018 from the reversal of an accrual related to an indemnification obligation related to the Shapell acquisition that has expired.
CITY LIVING
Year ended October 31,2018 2017 % Change
Units Delivered and Revenues: Revenues ($ in millions) $ 321.0 $ 383.1 (16)%
Units delivered 169 260 (35)%
Average delivered price ($ in thousands) $ 1,899.4 $ 1,473.5 29%
Net Contracts Signed: Net contract value ($ in millions) $ 277.8 $ 267.8 4%
Net contracted units 183 189 (3)%
Average contracted price ($ in thousands) $ 1,518.0 $ 1,416.9 $ 7%
Cost of revenues as a percentage of revenues 75.1% 67.6%
Income before income taxes ($ in millions) $ 78.1 $ 193.9 $ (60)%
Number of selling communities at October 31, 6 6 —%
The decrease in the number of homes delivered in fiscal 2018, as compared to fiscal 2017, was principally due to the commencement of deliveries in fiscal 2017 at three buildings (located in Hoboken, New Jersey; New York City; and Bethesda, Maryland). These decreases were partially offset by closings at one building, located in Hoboken, New Jersey, where deliveries commenced in fiscal 2018. The increase in the average price of homes delivered in fiscal 2018, as compared to fiscal 2017, was primarily due to a shift in the number of homes delivered to more expensive buildings in fiscal 2018, as compared to fiscal 2017. In fiscal 2018, 37% of the units delivered were located in New York, New York, where home prices were higher, as compared to 21% in fiscal 2017.
The decrease in the number of net contracts signed in fiscal 2018, as compared to fiscal 2017, was primarily due to a reduction of available inventory and a decrease in demand in fiscal 2018, as compared to fiscal 2017. The increase in the average sales price of net contracts signed in fiscal 2018, as compared to fiscal 2017, was principally due to a shift to sales in more expensive buildings in fiscal 2018, as compared to fiscal 2017.
The decrease in income before income taxes in fiscal 2018, as compared to fiscal 2017, was mainly due to a decrease in earnings from our investments in unconsolidated entities; lower earnings from decreased revenues; a shift in the number of homes delivered to buildings with lower margins in fiscal 2018, as compared to fiscal 2017; $4.7 million recognized in connection with a previously deferred gain in fiscal 2017; and a state reimbursement of $4.7 million of previously expensed environmental clean-up costs received in fiscal 2017.
In fiscal 2018, earnings from our investments in unconsolidated entities were $6.9 million, as compared to $73.1 million in fiscal 2017. Fiscal 2017 benefited from the commencement of deliveries from two Home Building Joint Ventures in the fourth quarter of fiscal 2016. The tables below provide information related to deliveries and revenues and net contracts signed by our Home Building Joint Ventures, for the periods indicated, and the related backlog for the dates indicated ($ amounts in millions):

TOLL BROTHERS 2018 43
Year ended October 31,2018 Units
2017 Units
2018 $
2017 $
Deliveries and revenues 14 123 $ 65.7 $ 407.1
Net contracts signed 102 69 $ 245.6 $ 123.2
At October 31,2018 Units
2017 Units
2018 $
2017 $
Backlog 134 46 $ 279.0 $ 99.1
CORPORATE AND OTHER
In fiscal 2018 and 2017, loss before income taxes was $109.2 million and $146.8 million, respectively. The decrease in the loss before income taxes in fiscal 2018, as compared to fiscal 2017, was principally attributable to a $42.1 million increase in earnings from our investments in unconsolidated entities and higher income earned by our ancillary businesses in fiscal 2018, as compared to fiscal 2017, offset, in part, by higher SG&A costs. The increase in earnings from our investments in unconsolidated entities in fiscal 2018, as compared to fiscal 2017, was mainly due to $67.2 million of gains recognized in fiscal 2018 from asset sales by three of our Rental Property Joint Ventures located in College Park, Maryland, Herndon, Virginia, and Westborough, Massachusetts, partially offset by $26.7 million of gains recognized in fiscal 2017 related to the sale of 50% of our ownership interests in two of our Rental Property Joint Ventures located in Jersey City, New Jersey, and the suburbs of Philadelphia, Pennsylvania. The increase in SG&A costs in fiscal 2018, as compared to fiscal 2017, was due primarily to increased compensation costs due to our increased number of employees primarily related to our increased business activity.
FISCAL 2017 COMPARED TO FISCAL 2016
Traditional Home BuildingNORTH
Year ended October 31,2017 2016 % Change
Units Delivered and Revenues: Revenues ($ in millions) $ 775.5 $ 814.5 (5)%
Units delivered 1,139 1,172 (3)%
Average delivered price ($ in thousands) $ 680.9 $ 695.0 (2)%
Net Contracts Signed: Net contract value ($ in millions) $ 898.9 $ 888.0 1%
Net contracted units 1,379 1,259 10%
Average contracted price ($ in thousands) $ 651.8 $ 705.3 (8)%
Cost of revenues as a percentage of revenues 84.8% 82.6%
Income before income taxes ($ in millions) $ 50.4 $ 77.0 $ (35)%
Number of selling communities at October 31, 51 56 (9)%
The decrease in the number of homes delivered in fiscal 2017, as compared to fiscal 2016, was mainly due to the defective floor joists issue. The decrease in the average price of homes delivered in fiscal 2017, as compared to fiscal 2016, was primarily attributable to a shift in the number of homes delivered to less expensive areas and/or products in fiscal 2017, as compared to fiscal 2016. For additional information regarding the defective floor joists issue, see “Overview – Defective Floor Joists” in this MD&A.
The increase in the number of net contracts signed in fiscal 2017, as compared to fiscal 2016, was mainly due to improved market conditions in Connecticut, Michigan, New York, and New Jersey, offset, in part by a decrease in the number of selling communities and a decrease in Massachusetts where demand has declined. The decrease in the average sales price of net contracts signed in fiscal 2017, as compared to fiscal 2016, was principally attributable to a shift in the number of contracts signed to less expensive areas and/or products in fiscal 2017, as compared to fiscal 2016, particularly in Michigan, where we had a significant increase in the number of contracts signed in multifamily and active-adult communities.
The decrease in income before income taxes in fiscal 2017, as compared to fiscal 2016, was principally attributable to lower earnings from decreased revenues and higher cost of revenues, as a percentage of revenues in fiscal 2017, as compared to fiscal 2016. The increase in the cost of revenues, as a percentage of revenues, was primarily due to a change in product mix/areas to lower-margin areas and higher material and labor costs in fiscal 2017, as compared to fiscal 2016.
MID-ATLANTIC
Year ended October 31,2017 2016 % Change
Units Delivered and Revenues: Revenues ($ in millions) $ 1,030.3 $ 895.7 15%
Units delivered 1,681 1,432 17%
Average delivered price ($ in thousands) $ 612.9 $ 625.5 (2)%
Net Contracts Signed: Net contract value ($ in millions) $ 1,161.9 $ 986.8 18%
Net contracted units 1,838 1,607 14%
Average contracted price ($ in thousands) $ 632.2 $ 614.1 3%
Cost of revenues as a percentage of revenues 82.1% 95.8%
Income (loss) before income taxes ($ in millions) $ 105.7 $ (29.4) 460%
Number of selling communities at October 31, 64 76 (16)%
The increase in the number of homes delivered in fiscal 2017, as compared to fiscal 2016, was mainly due to an increase in the number of homes closed in the region, which was attributable to an increase in the number of homes in backlog in those markets at October 31, 2016, as compared to the number of homes in backlog at October 31, 2015. The decrease in the average price of homes delivered in fiscal 2017, as compared to fiscal 2016, was primarily due to a shift in the number of homes delivered to less expensive areas and/or products in fiscal 2017, as compared to fiscal 2016.
The increase in the number of net contracts signed in fiscal 2017, as compared to fiscal 2016, was principally due to increases in demand in fiscal 2017, as compared to fiscal 2016.
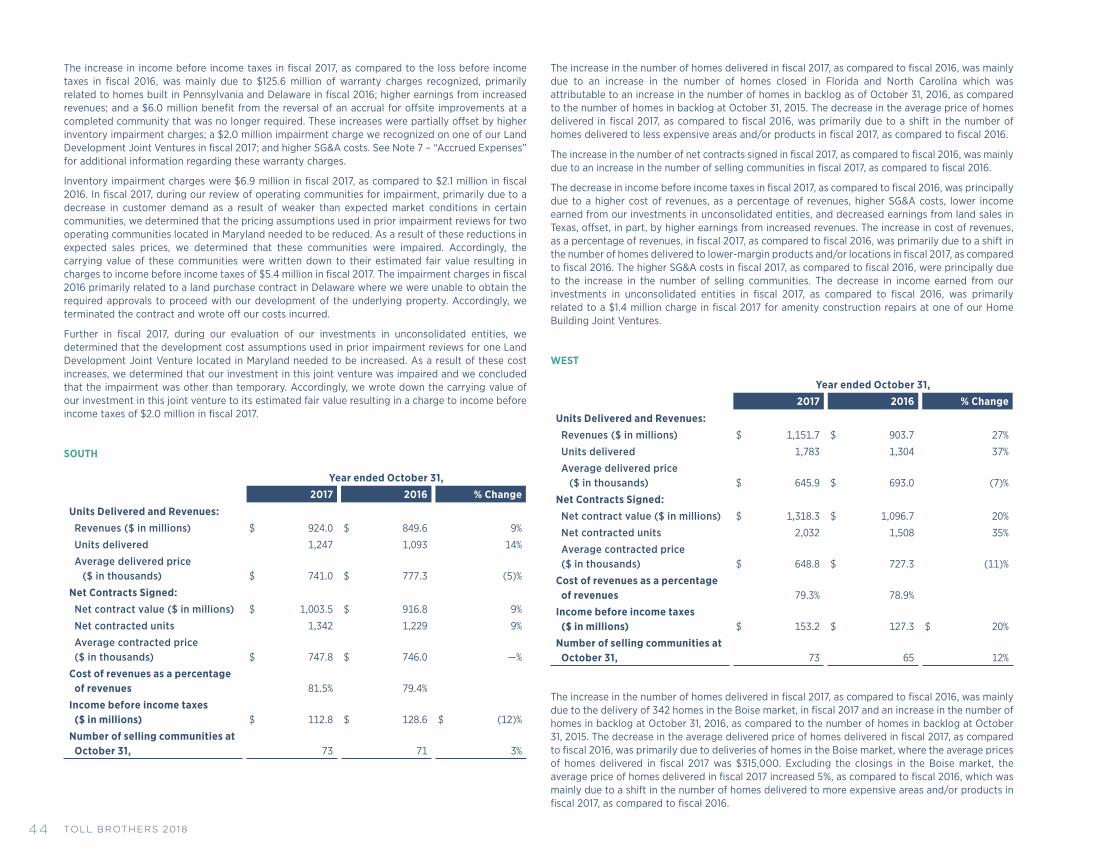
TOLL BROTHERS 201844
The increase in income before income taxes in fiscal 2017, as compared to the loss before income taxes in fiscal 2016, was mainly due to $125.6 million of warranty charges recognized, primarily related to homes built in Pennsylvania and Delaware in fiscal 2016; higher earnings from increased revenues; and a $6.0 million benefit from the reversal of an accrual for offsite improvements at a completed community that was no longer required. These increases were partially offset by higher inventory impairment charges; a $2.0 million impairment charge we recognized on one of our Land Development Joint Ventures in fiscal 2017; and higher SG&A costs. See Note 7 – “Accrued Expenses” for additional information regarding these warranty charges.
Inventory impairment charges were $6.9 million in fiscal 2017, as compared to $2.1 million in fiscal 2016. In fiscal 2017, during our review of operating communities for impairment, primarily due to a decrease in customer demand as a result of weaker than expected market conditions in certain communities, we determined that the pricing assumptions used in prior impairment reviews for two operating communities located in Maryland needed to be reduced. As a result of these reductions in expected sales prices, we determined that these communities were impaired. Accordingly, the carrying value of these communities were written down to their estimated fair value resulting in charges to income before income taxes of $5.4 million in fiscal 2017. The impairment charges in fiscal 2016 primarily related to a land purchase contract in Delaware where we were unable to obtain the required approvals to proceed with our development of the underlying property. Accordingly, we terminated the contract and wrote off our costs incurred.
Further in fiscal 2017, during our evaluation of our investments in unconsolidated entities, we determined that the development cost assumptions used in prior impairment reviews for one Land Development Joint Venture located in Maryland needed to be increased. As a result of these cost increases, we determined that our investment in this joint venture was impaired and we concluded that the impairment was other than temporary. Accordingly, we wrote down the carrying value of our investment in this joint venture to its estimated fair value resulting in a charge to income before income taxes of $2.0 million in fiscal 2017.
SOUTH
Year ended October 31,2017 2016 % Change
Units Delivered and Revenues: Revenues ($ in millions) $ 924.0 $ 849.6 9%
Units delivered 1,247 1,093 14%
Average delivered price ($ in thousands) $ 741.0 $ 777.3 (5)%
Net Contracts Signed: Net contract value ($ in millions) $ 1,003.5 $ 916.8 9%
Net contracted units 1,342 1,229 9%
Average contracted price ($ in thousands) $ 747.8 $ 746.0 —%
Cost of revenues as a percentage of revenues 81.5% 79.4%
Income before income taxes ($ in millions) $ 112.8 $ 128.6 $ (12)%
Number of selling communities at October 31, 73 71 3%
The increase in the number of homes delivered in fiscal 2017, as compared to fiscal 2016, was mainly due to an increase in the number of homes closed in Florida and North Carolina which was attributable to an increase in the number of homes in backlog as of October 31, 2016, as compared to the number of homes in backlog at October 31, 2015. The decrease in the average price of homes delivered in fiscal 2017, as compared to fiscal 2016, was primarily due to a shift in the number of homes delivered to less expensive areas and/or products in fiscal 2017, as compared to fiscal 2016.
The increase in the number of net contracts signed in fiscal 2017, as compared to fiscal 2016, was mainly due to an increase in the number of selling communities in fiscal 2017, as compared to fiscal 2016.
The decrease in income before income taxes in fiscal 2017, as compared to fiscal 2016, was principally due to a higher cost of revenues, as a percentage of revenues, higher SG&A costs, lower income earned from our investments in unconsolidated entities, and decreased earnings from land sales in Texas, offset, in part, by higher earnings from increased revenues. The increase in cost of revenues, as a percentage of revenues, in fiscal 2017, as compared to fiscal 2016, was primarily due to a shift in the number of homes delivered to lower-margin products and/or locations in fiscal 2017, as compared to fiscal 2016. The higher SG&A costs in fiscal 2017, as compared to fiscal 2016, were principally due to the increase in the number of selling communities. The decrease in income earned from our investments in unconsolidated entities in fiscal 2017, as compared to fiscal 2016, was primarily related to a $1.4 million charge in fiscal 2017 for amenity construction repairs at one of our Home Building Joint Ventures.
WEST
Year ended October 31,2017 2016 % Change
Units Delivered and Revenues: Revenues ($ in millions) $ 1,151.7 $ 903.7 27%
Units delivered 1,783 1,304 37%
Average delivered price ($ in thousands) $ 645.9 $ 693.0 (7)%
Net Contracts Signed: Net contract value ($ in millions) $ 1,318.3 $ 1,096.7 20%
Net contracted units 2,032 1,508 35%
Average contracted price ($ in thousands) $ 648.8 $ 727.3 (11)%
Cost of revenues as a percentage of revenues 79.3% 78.9%
Income before income taxes ($ in millions) $ 153.2 $ 127.3 $ 20%
Number of selling communities at October 31, 73 65 12%
The increase in the number of homes delivered in fiscal 2017, as compared to fiscal 2016, was mainly due to the delivery of 342 homes in the Boise market, in fiscal 2017 and an increase in the number of homes in backlog at October 31, 2016, as compared to the number of homes in backlog at October 31, 2015. The decrease in the average delivered price of homes delivered in fiscal 2017, as compared to fiscal 2016, was primarily due to deliveries of homes in the Boise market, where the average prices of homes delivered in fiscal 2017 was $315,000. Excluding the closings in the Boise market, the average price of homes delivered in fiscal 2017 increased 5%, as compared to fiscal 2016, which was mainly due to a shift in the number of homes delivered to more expensive areas and/or products in fiscal 2017, as compared to fiscal 2016.

TOLL BROTHERS 2018 45
The increase in the number of net contracts signed in fiscal 2017, as compared to fiscal 2016, was principally due to the 458 contracts we signed in the Boise market during fiscal 2017; increases in demand primarily in Nevada and Arizona; and an increase in the number of selling communities in Nevada. These increases were offset, in part, by lower demand and a decrease in selling communities in Colorado and Washington. The net contracts signed in the Boise market also reduced our average contracted price for fiscal 2017, as compared to fiscal 2016. Excluding contracts signed in the Boise market, the average value of each contract signed in fiscal 2017, increased by 2%, as compared to fiscal 2016.
The increase in income before income taxes in fiscal 2017, as compared to fiscal 2016, was due mainly to higher earnings from the increased revenues in fiscal 2017, as compared to fiscal 2016.
CALIFORNIA
Year ended October 31,2017 2016 % Change
Units Delivered and Revenues: Revenues ($ in millions) $ 1,550.5 $ 1,448.5 7%
Units delivered 1,041 1,006 3%
Average delivered price ($ in thousands) $ 1,489.4 $ 1,439.9 3%
Net Contracts Signed: Net contract value ($ in millions) $ 2,177.9 $ 1,418.5 54%
Net contracted units 1,395 930 50%
Average contracted price ($ in thousands) $ 1,561.2 $ 1,525.3 2%
Cost of revenues as a percentage of revenues 72.8% 72.6%
Income before income taxes ($ in millions) $ 345.1 $ 335.2 $ 3%
Number of selling communities at October 31, 38 37 3%
The increase in the number of homes delivered in fiscal 2017, as compared to fiscal 2016, was mainly due to an increase in the number of homes sold and settled in fiscal 2017, as compared to fiscal 2016, offset, in part, by a decrease in the number of homes in backlog at October 31, 2016, as compared to the number of homes in backlog at October 31, 2015. The increase in the average price of homes delivered in fiscal 2017, as compared to fiscal 2016, was primarily due to a shift in the number of homes delivered to more expensive areas and/or products and increased selling prices of homes delivered in fiscal 2017, as compared to fiscal 2016.
The increase in the number of net contracts signed in fiscal 2017, as compared to fiscal 2016, was due mainly to an increase in demand and an increase in the average number of selling communities in our southern California markets in fiscal 2017, as compared to fiscal 2016.
The increase in income before income taxes in fiscal 2017, as compared to fiscal 2016, was primarily due to higher earnings from the increased revenues, offset, in part, by higher SG&A, as a percent of revenues.
CITY LIVING
Year ended October 31,2017 2016 % Change
Units Delivered and Revenues: Revenues ($ in millions) $ 383.1 $ 257.5 49%
Units delivered 260 91 186%
Average delivered price ($ in thousands) $ 1,473.5 $ 2,829.7 (48)%
Net Contracts Signed: Net contract value ($ in millions) $ 267.8 $ 342.8 (22)%
Net contracted units 189 186 2%
Average contracted price ($ in thousands) $ 1,416.9 $ 1,843.0 (23)%
Cost of revenues as a percentage of revenues 67.6% 66.3%
Income before income taxes ($ in millions) $ 193.9 $ 91.1 $ 113%
Number of selling communities at October 31, 6 5 20%
The increase in the number of homes delivered in fiscal 2017, as compared to fiscal 2016, was principally due to the commencement of deliveries in fiscal 2017 at three buildings (located in Hoboken, New Jersey; New York City; and Bethesda, Maryland). These increases were partially offset by a decrease in closings at one building, located in New York City, where there were fewer available units remaining in fiscal 2017, as compared to fiscal 2016, and at a community located in Philadelphia, Pennsylvania, which settled out in fiscal 2016. The decrease in the average price of homes delivered in fiscal 2017, as compared to fiscal 2016, was primarily due to a shift in the number of homes delivered to less expensive buildings in fiscal 2017, as compared to fiscal 2016.
The increase in the number of net contracts signed in fiscal 2017, as compared to fiscal 2016, was primarily due to strong sales at a building located in Jersey City, New Jersey, which opened in the third quarter of fiscal 2017. This increase was partially offset by a decrease at a building located in Hoboken, New Jersey which benefited from strong sales in fiscal 2016 due to its opening in the fourth quarter of fiscal 2015 and a decrease at a building in New York City, where there were fewer available units remaining in fiscal 2017, as compared to fiscal 2016. The decrease in the average sales price of net contracts signed in fiscal 2017, as compared to fiscal 2016, was principally due to a shift to less expensive buildings in fiscal 2017, as compared to fiscal 2016.
The increase in income before income taxes in fiscal 2017, as compared to fiscal 2016, was mainly due to a $60.2 million increase in earnings from our investments in unconsolidated entities; higher earnings from increased revenues; and state reimbursement of $4.7 million of previously expensed environmental clean-up costs received in the fiscal 2017 period, offset, in part, by a shift in the number of homes delivered to buildings with a lower margin.

TOLL BROTHERS 201846
In fiscal 2017 and 2016, mainly due to the commencement of deliveries from two City Living Home Building Joint Ventures in the fourth quarter of fiscal 2016, we recognized $73.1 million and $12.9 million in earnings, respectively, from our investments in unconsolidated entities. The tables below provide information related to deliveries and revenues and net contracts signed by our City Living Home Building Joint Ventures, for the periods indicated, and the related backlog for the dates indicated ($ amounts in millions):
Year ended October 31,2017
Units2016 Units
2017 $
2016 $
Deliveries and revenues 123 32 $ 407.1 $ 90.5
Net contracts signed 69 25 $ 123.2 $ 90.7
At October 31,2017
Units2016 Units
2017 $
2016 $
Backlog 46 114 $ 99.1 $ 408.5
CORPORATE AND OTHER
In fiscal 2017 and 2016, loss before income taxes was $146.8 million and $140.8 million, respectively. The increase in the loss before income taxes in fiscal 2017, as compared to fiscal 2016, was principally attributable to higher SG&A costs; a $4.9 million gain recognized in fiscal 2016 from the sale of our ownership interest in one of our joint ventures located in New Jersey; lower earnings from Gibraltar; losses incurred by a one of our Rental Property Joint Ventures which commenced operations of a hotel in February 2017; and a gain of $1.6 million recognized in the fiscal 2016 period, from a bulk sale of security monitoring accounts by our home security monitoring business in fiscal 2015. These increases were partially offset by gains of $26.7 million in fiscal 2017 related to the sales of 50% of our ownership interests in two of our Rental Property Joint Ventures located in Jersey City, New Jersey and the suburbs of Philadelphia, Pennsylvania. The increase in SG&A costs in fiscal 2017, as compared to fiscal 2016, was due to increased compensation costs, due to our increased number of employees related to our increased business activity and increased spending on upgrading our computer software.
QUANTITATIVE AND QUALITATIVE DISCLOSURES ABOUT MARKET RISK We are exposed to market risk primarily due to fluctuations in interest rates. We utilize both fixed-rate and variable-rate debt. For fixed-rate debt, changes in interest rates generally affect the fair market value of the debt instrument, but not our earnings or cash flow. Conversely, for variable-rate debt, changes in interest rates generally do not affect the fair market value of the debt instrument, but do affect our earnings and cash flow. We do not have the obligation to prepay fixed-rate debt prior to maturity, and, as a result, interest rate risk and changes in fair market value should not have a significant impact on our fixed-rate debt until we are required or elect to refinance it.
The following table shows our debt obligations by scheduled maturity, weighted-average interest rates, and estimated fair value as of October 31, 2018 ($ amounts in thousands):
Fixed-rate debt Variable-rate debt (a)
Fiscal year of maturity Amount
Weighted- average
interest rate (%) Amount
Weighted- average
interest rate (%)
2019 $ 422,338 3.65% $ 150,150 4.20%
2020 259,305 6.66% 150 1.73%
2021 9,131 5.33% 500,150 3.70%
2022 430,241 5.86% 150 1.73%
2023 409,797 4.40% 150 1.73%
Thereafter 1,513,519 4.89% 12,910 2.23%Bond discounts, premiums, and deferred issuance costs, net (8,501) (1,314)
Total $ 3,035,830 4.94% $ 662,346 3.78%
Fair value at October 31, 2018 $ 2,955,704 $ 663,660
(a) Based upon the amount of variable-rate debt outstanding at October 31, 2018, and holding the variable-rate debt balance constant, each 1% increase in interest rates would increase the interest incurred by us by approximately $6.6 million per year.
MANAGEMENT’S ANNUAL REPORT ON INTERNAL CONTROL OVER FINANCIAL REPORTING Our management is responsible for establishing and maintaining adequate internal control over financial reporting, as such term is defined in the Securities Exchange Act Rule 13a-15(f). Internal control over financial reporting is a process designed to provide reasonable assurance regarding the reliability of financial reporting and the preparation of financial statements for external purposes in accordance with generally accepted accounting principles. Internal control over financial reporting includes those policies and procedures that: (i) pertain to the maintenance of records that in reasonable detail accurately and fairly reflect the transactions and dispositions of the assets of the company; (ii) provide reasonable assurance that transactions are recorded as necessary to permit preparation of financial statements in accordance with generally accepted accounting principles, and that receipts and expenditures of the company are being made only in accordance with authorizations of management and directors of the company; and (iii) provide reasonable assurance regarding prevention or timely detection of unauthorized acquisition, use, or disposition of the company’s assets that could have a material effect on the financial statements. Because of its inherent limitations, internal control over financial reporting may not prevent or detect misstatements. Also, projections of any evaluation of effectiveness to future periods are subject to the risk that controls may become inadequate because of changes in conditions, or that the degree of compliance with the policies or procedures may deteriorate.
Under the supervision and with the participation of our management, including our principal executive officer and our principal financial officer, we conducted an evaluation of the effectiveness of our internal control over financial reporting based on the framework in Internal Control — Integrated Framework issued by the Committee of Sponsoring Organizations of the Treadway Commission (2013 Framework). Based on this evaluation under the framework in Internal Control — Integrated Framework, our management concluded that our internal control over financial reporting was effective as of October 31, 2018.
Our independent registered public accounting firm, Ernst & Young LLP, has issued its report, which is included herein, on the effectiveness of our internal control over financial reporting.

TOLL BROTHERS 2018 47
REPORT OF INDEPENDENT REGISTERED PUBLIC ACCOUNTING FIRM
To the Shareholders and the Board of Directors of Toll Brothers, Inc.
OPINION ON INTERNAL CONTROL OVER FINANCIAL REPORTING
We have audited Toll Brothers, Inc.’s internal control over financial reporting as of October 31, 2018, based on criteria established in Internal Control-Integrated Framework issued by the Committee of Sponsoring Organizations of the Treadway Commission (2013 framework) (the COSO criteria). In our opinion, Toll Brothers, Inc. (the Company) maintained, in all material respects, effective internal control over financial reporting as of October 31, 2018, based on the COSO criteria.
We also have audited, in accordance with the standards of the Public Company Accounting Oversight Board (United States) (PCAOB), the 2018 consolidated financial statements of the Company and our report dated December 20, 2018 expressed an unqualified opinion thereon.
BASIS OF OPINION
The Company’s management is responsible for maintaining effective internal control over financial reporting and for its assessment of the effectiveness of internal control over financial reporting included in the accompanying Management’s Annual Report on Internal Control Over Financial Reporting. Our responsibility is to express an opinion on the Company’s internal control over financial reporting based on our audit. We are a public accounting firm registered with the PCAOB and are required to be independent with respect to the Company in accordance with the U.S. federal securities laws and the applicable rules and regulations of the Securities and Exchange Commission and the PCAOB.
We conducted our audit in accordance with the standards of the PCAOB. Those standards require that we plan and perform the audit to obtain reasonable assurance about whether effective internal control over financial reporting was maintained in all material respects.
Our audit included obtaining an understanding of internal control over financial reporting, assessing the risk that a material weakness exists, testing and evaluating the design and operating effectiveness of internal control based on the assessed risk, and performing such other procedures as we considered necessary in the circumstances. We believe that our audit provides a reasonable basis for our opinion.
DEFINITION AND LIMITATIONS OF INTERNAL CONTROL OVER FINANCIAL REPORTING
A company’s internal control over financial reporting is a process designed to provide reasonable assurance regarding the reliability of financial reporting and the preparation of financial statements for external purposes in accordance with generally accepted accounting principles. A company’s internal control over financial reporting includes those policies and procedures that (1) pertain to the maintenance of records that, in reasonable detail, accurately and fairly reflect the transactions and dispositions of the assets of the company; (2) provide reasonable assurance that transactions are recorded as necessary to permit preparation of financial statements in accordance with generally accepted accounting principles, and that receipts and expenditures of the company are being made only in accordance with authorizations of management and directors of the company; and (3) provide reasonable assurance regarding prevention or timely detection of unauthorized acquisition, use, or disposition of the company’s assets that could have a material effect on the financial statements.
Because of its inherent limitations, internal control over financial reporting may not prevent or detect misstatements. Also, projections of any evaluation of effectiveness to future periods are subject to the risk that controls may become inadequate because of changes in conditions, or that the degree of compliance with the policies or procedures may deteriorate.
Philadelphia, Pennsylvania December 20, 2018
REPORT OF INDEPENDENT REGISTERED PUBLIC ACCOUNTING FIRM
To the Shareholders and the Board of Directors of Toll Brothers, Inc.
OPINION ON FINANCIAL STATEMENTS
We have audited the accompanying consolidated balance sheets of Toll Brothers, Inc. (the Company) as of October 31, 2018 and 2017, the related consolidated statements of operations and comprehensive income, changes in equity and cash flows for each of the three years in the period ended October 31, 2018, and the related notes (collectively referred to as the “consolidated financial statements”). In our opinion, the consolidated financial statements present fairly, in all material respects, the financial position of the Company at October 31, 2018 and 2017, and the results of its operations and its cash flows for each of the three years in the period ended October 31, 2018, in conformity with U.S. generally accepted accounting principles.
We also have audited, in accordance with the standards of the Public Company Accounting Oversight Board (United States) (PCAOB), the Company’s internal control over financial reporting as of October 31, 2018, based on criteria established in Internal Control-Integrated Framework issued by the Committee of Sponsoring Organizations of the Treadway Commission (2013 framework) and our report dated December 20, 2018 expressed an unqualified opinion thereon.
BASIS OF OPINION
These financial statements are the responsibility of the Company’s management. Our responsibility is to express an opinion on the Company’s financial statements based on our audits. We are a public accounting firm registered with the PCAOB and are required to be independent with respect to the Company in accordance with the U.S. federal securities laws and the applicable rules and regulations of the Securities and Exchange Commission and the PCAOB.
We conducted our audits in accordance with the standards of the PCAOB. Those standards require that we plan and perform the audit to obtain reasonable assurance about whether the financial statements are free of material misstatement, whether due to error or fraud. Our audits included performing procedures to assess the risks of material misstatement of the financial statements, whether due to error or fraud, and performing procedures that respond to those risks. Such procedures included examining, on a test basis, evidence regarding the amounts and disclosures in the financial statements. Our audits also included evaluating the accounting principles used and significant estimates made by management, as well as evaluating the overall presentation of the financial statements. We believe that our audits provide a reasonable basis for our opinion.
We have served as the Company’s auditor since 1983.
Philadelphia, Pennsylvania December 20, 2018
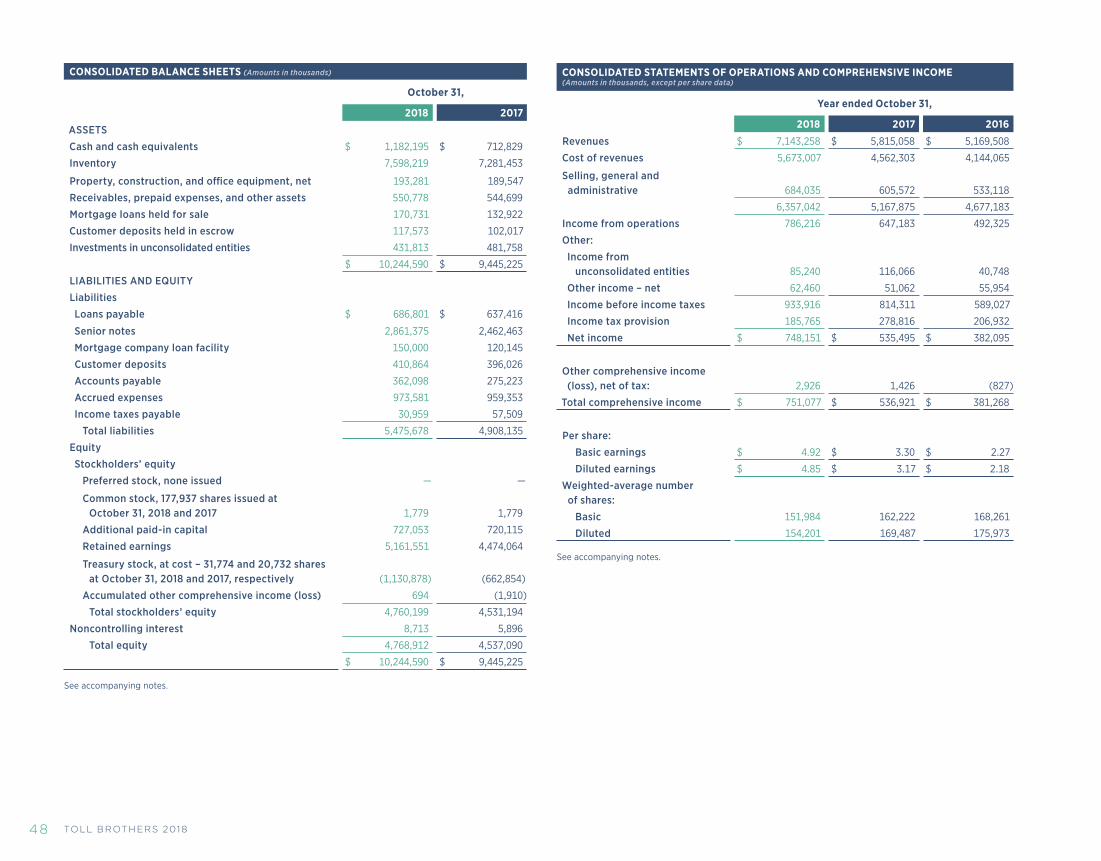
TOLL BROTHERS 201848
CONSOLIDATED BALANCE SHEETS (Amounts in thousands)
October 31,
2018 2017
ASSETS
Cash and cash equivalents $ 1,182,195 $ 712,829
Inventory 7,598,219 7,281,453
Property, construction, and office equipment, net 193,281 189,547
Receivables, prepaid expenses, and other assets 550,778 544,699
Mortgage loans held for sale 170,731 132,922
Customer deposits held in escrow 117,573 102,017
Investments in unconsolidated entities 431,813 481,758
$ 10,244,590 $ 9,445,225
LIABILITIES AND EQUITY
Liabilities
Loans payable $ 686,801 $ 637,416
Senior notes 2,861,375 2,462,463
Mortgage company loan facility 150,000 120,145
Customer deposits 410,864 396,026
Accounts payable 362,098 275,223
Accrued expenses 973,581 959,353
Income taxes payable 30,959 57,509
Total liabilities 5,475,678 4,908,135
Equity
Stockholders’ equity
Preferred stock, none issued — —
Common stock, 177,937 shares issued at October 31, 2018 and 2017 1,779 1,779
Additional paid-in capital 727,053 720,115
Retained earnings 5,161,551 4,474,064
Treasury stock, at cost – 31,774 and 20,732 shares at October 31, 2018 and 2017, respectively (1,130,878) (662,854)
Accumulated other comprehensive income (loss) 694 (1,910)
Total stockholders’ equity 4,760,199 4,531,194
Noncontrolling interest 8,713 5,896
Total equity 4,768,912 4,537,090
$ 10,244,590 $ 9,445,225
See accompanying notes.
CONSOLIDATED STATEMENTS OF OPERATIONS AND COMPREHENSIVE INCOME (Amounts in thousands, except per share data)
Year ended October 31,
2018 2017 2016
Revenues $ 7,143,258 $ 5,815,058 $ 5,169,508
Cost of revenues 5,673,007 4,562,303 4,144,065
Selling, general and administrative 684,035 605,572 533,118
6,357,042 5,167,875 4,677,183
Income from operations 786,216 647,183 492,325
Other:
Income from unconsolidated entities 85,240 116,066 40,748
Other income – net 62,460 51,062 55,954
Income before income taxes 933,916 814,311 589,027
Income tax provision 185,765 278,816 206,932
Net income $ 748,151 $ 535,495 $ 382,095
Other comprehensive income (loss), net of tax: 2,926 1,426 (827)
Total comprehensive income $ 751,077 $ 536,921 $ 381,268
Per share:
Basic earnings $ 4.92 $ 3.30 $ 2.27
Diluted earnings $ 4.85 $ 3.17 $ 2.18
Weighted-average number of shares:
Basic 151,984 162,222 168,261
Diluted 154,201 169,487 175,973
See accompanying notes.

TOLL BROTHERS 2018 49
CONSOLIDATED STATEMENTS OF CHANGES IN EQUITY (Amounts in thousands)
Common Stock
Additional Paid-in Capital
Retained Earnings Treasury Stock
Accumulated Other
Comprehensive Loss
Stock- holder’s Equity
Non-controlling
Interest Total EquityShares $ $ $ $ $ $ $ $
Balance, November 1, 2015 177,931 1,779 728,125 3,595,202 (100,040) (2,509) 4,222,557 5,522 4,228,079
Net income 382,095 382,095 382,095
Purchase of treasury stock (392,772) (392,772) (392,772)
Exercise of stock options and stock based compensation issuances 6 (26,294) 16,770 (9,524) (9,524)
Employee stock purchase plan issuances (46) 1,130 1,084 1,084
Stock-based compensation 26,679 26,679 26,679
Other comprehensive loss (827) (827) (827)
Loss attributable to noncontrolling interest — (16) (16)
Capital contribution — 404 404
Balance, October 31, 2016 177,937 1,779 728,464 3,977,297 (474,912) (3,336) 4,229,292 5,910 4,235,202
Net income 535,495 535,495 535,495
Purchase of treasury stock (290,881) (290,881) (290,881)
Exercise of stock options and stock based compensation issuances (36,896) 101,799 64,903 64,903
Employee stock purchase plan issuances 81 1,140 1,221 1,221
Stock-based compensation 28,466 28,466 28,466
Dividends declared (38,728) (38,728) (38,728)
Other comprehensive income 1,426 1,426 1,426
Loss attributable to noncontrolling interest — (14) (14)
Balance, October 31, 2017 177,937 1,779 720,115 4,474,064 (662,854) (1,910) 4,531,194 5,896 4,537,090Cumulative effect adjustment upon
adoption of ASU 2016-09 and ASU 2018-02 372 1,413 (322) 1,463 1,463
Net income 748,151 748,151 748,151
Purchase of treasury stock (503,159) (503,159) (503,159)
Exercise of stock options and stock based compensation issuances (21,789) 33,969 12,180 12,180
Employee stock purchase plan issuances 43 1,166 1,209 1,209
Stock-based compensation 28,312 28,312 28,312
Dividends declared (62,077) (62,077) (62,077)
Other comprehensive income 2,926 2,926 2,926
Loss attributable to noncontrolling interest — (15) (15)
Capital contribution — 2,832 2,832
Balance, October 31, 2018 177,937 1,779 727,053 5,161,551 (1,130,878) 694 4,760,199 8,713 4,768,912

TOLL BROTHERS 201850
CONSOLIDATED STATEMENTS OF CASH FLOWS (Amounts in thousands)
Year Ended October 31,
2018 2017 2016
Cash flow provided by operating activities:
Net income $ 748,151 $ 535,495 $ 382,095
Adjustments to reconcile net income to net cash provided by operating activities:
Depreciation and amortization 25,259 25,361 23,121
Stock-based compensation 28,312 28,466 26,679
Income from unconsolidated entities (85,240) (116,066) (40,748)
Distributions of earnings from unconsolidated entities 86,099 134,291 15,287
Income from foreclosed real estate and distressed loans (1,551) (4,937) (8,390)
Deferred tax (benefit) provision (21,930) 217,864 19,252
Change in deferred tax valuation allowances (32,154) 1,018
Inventory impairments and write-offs 35,156 14,794 13,807
Other 3,111 1,395 (1,739)
Changes in operating assets and liabilities
(Increase) decrease in inventory (143,598) 129,666 (391,178)
Origination of mortgage loans (1,449,494) (1,217,274) (1,275,047)
Sale of mortgage loans 1,410,627 1,332,207 1,150,156
(Increase) decrease in receivables, prepaid expenses, and other assets (85,414) 42,405 (321,847)
(Decrease) increase in customer deposits (718) 37,967 27,838
(Increase) decrease in accounts payable and accrued expenses 57,927 (140,463) 524,553
(Decrease) increase in income taxes payable (4,296) (23,970) 6,028
Net cash provided by operating activities 602,401 965,047 150,885
Year Ended October 31,
2018 2017 2016
Cash flow provided by (used in) investing activities:
Purchase of property and equipment — net (28,232) (28,872) (28,426)
Sale and redemption of marketable securities and restricted investments — net 18,049 10,000
Investments in unconsolidated entities (27,491) (122,334) (69,655)
Return of investments in unconsolidated entities 133,190 195,505 47,806
Investment in foreclosed real estate and distressed loans (966) (710) (1,133)
Return of investments in foreclosed real estate and distressed loans 4,765 13,765 49,619
Acquisition of a business (83,088)
Net cash provided by (used in) investing activities 81,266 (7,685) 8,211
Cash flow provided by (used in) financing activities:
Proceeds from issuance of senior notes 400,000 455,483
Proceeds from loans payable 2,630,835 1,621,043 2,443,496
Debt issuance costs (3,531) (4,449) (4,903)
Principal payments of loans payable (2,690,164) (1,999,357) (2,497,585 )
Redemption of senior notes (687,500)
Proceeds from stock-based benefit plans 13,392 66,000 6,986
Purchase of treasury stock (503,159) (290,881) (392,772)
Dividends paid (61,704) (38,587)
Receipts related to noncontrolling interest, net 30 404
Net cash used in financing activities (214,301) (878,248) (444,374)
Net increase (decrease) in cash and cash equivalents 469,366 79,114 (285,278)
Cash and cash equivalents, beginning of period 712,829 633,715 918,993
Cash and cash equivalents, end of period $ 1,182,195 $ 712,829 $ 633,715
See accompanying notes.

TOLL BROTHERS 2018 51
NOTES TO CONSOLIDATED FINANCIAL STATEMENTS
1. SIGNIFICANT ACCOUNTING POLICIES
Basis of Presentation The consolidated financial statements include the accounts of Toll Brothers, Inc. (the “Company,” “we,” “us,” or “our”), a Delaware corporation, and its majority-owned subsidiaries. All significant intercompany accounts and transactions have been eliminated. Investments in 50% or less owned partnerships and affiliates are accounted for using the equity method unless it is determined that we have effective control of the entity, in which case we would consolidate the entity.
References herein to fiscal year refer to our fiscal years ended or ending October 31.
Use of Estimates The preparation of financial statements in conformity with U.S. generally accepted accounting principles (“GAAP”) requires management to make estimates and assumptions that affect the amounts reported in the financial statements and accompanying notes. Actual results could differ from those estimates.
Cash and Cash Equivalents Liquid investments or investments with original maturities of three months or less are classified as cash equivalents.
Inventory Inventory is stated at cost unless an impairment exists, in which case it is written down to fair value in accordance with the Financial Accounting Standards Board (“FASB”) Accounting Standards Codification (“ASC”) 360, “Property, Plant, and Equipment” (“ASC 360”). In addition to direct land acquisition costs, land development costs, and home construction costs, costs also include interest, real estate taxes, and direct overhead related to development and construction, which are capitalized to inventory during the period beginning with the commencement of development and ending with the completion of construction. For those communities that have been temporarily closed, no additional capitalized interest is allocated to a community’s inventory until it reopens. While the community remains closed, carrying costs such as real estate taxes are expensed as incurred.
We capitalize certain interest costs to qualified inventory during the development and construction period of our communities in accordance with ASC 835-20, “Capitalization of Interest” (“ASC 835-20”). Capitalized interest is charged to cost of revenues when the related inventory is delivered. Interest incurred on home building indebtedness in excess of qualified inventory, as defined in ASC 835-20, is charged to the Consolidated Statements of Operations and Comprehensive Income in the period incurred.
Once a parcel of land has been approved for development and we open one of our typical communities, it may take four or more years to fully develop, sell, and deliver all the homes in such community. Longer or shorter time periods are possible depending on the number of home sites in a community and the sales and delivery pace of the homes in a community. Our master planned communities, consisting of several smaller communities, may take up to 10 years or more to complete. Because our inventory is considered a long-lived asset under GAAP, we are required, under ASC 360, to regularly review the carrying value of each community and write down the value of those communities for which we believe the values are not recoverable.
OPERATING COMMUNITIES: When the profitability of an operating community deteriorates, the sales pace declines significantly, or some other factor indicates a possible impairment in the recoverability of the asset, the asset is reviewed for impairment by comparing the estimated future undiscounted cash flow for the community to its carrying value. If the estimated future undiscounted cash flow is less than the community’s carrying value, the carrying value is written down to its estimated fair value. Estimated fair value is primarily determined by discounting the estimated
future cash flow of each community. The impairment is charged to cost of revenues in the period in which the impairment is determined. In estimating the future undiscounted cash flow of a community, we use various estimates such as (i) the expected sales pace in a community, based upon general economic conditions that will have a short-term or long-term impact on the market in which the community is located and on competition within the market, including the number of home sites available and pricing and incentives being offered in other communities owned by us or by other builders; (ii) the expected sales prices and sales incentives to be offered in a community; (iii) costs expended to date and expected to be incurred in the future, including, but not limited to, land and land development, home construction, interest, and overhead costs; (iv) alternative product offerings that may be offered in a community that will have an impact on sales pace, sales price, building cost, or the number of homes that can be built on a particular site; and (v) alternative uses for the property such as the possibility of a sale of the entire community to another builder or the sale of individual home sites.
FUTURE COMMUNITIES: We evaluate all land held for future communities or future sections of operating communities, whether owned or under contract, to determine whether or not we expect to proceed with the development of the land as originally contemplated. This evaluation encompasses the same types of estimates used for operating communities described above, as well as an evaluation of the regulatory environment applicable to the land and the estimated probability of obtaining the necessary approvals, the estimated time and cost it will take to obtain the approvals, and the possible concessions that may be required to be given in order to obtain them. Concessions may include cash payments to fund improvements to public places such as parks and streets, dedication of a portion of the property for use by the public or as open space, or a reduction in the density or size of the homes to be built. Based upon this review, we decide (i) as to land under contract to be purchased, whether the contract will likely be terminated or renegotiated, and (ii) as to land owned, whether the land will likely be developed as contemplated or in an alternative manner, or should be sold. We then further determine whether costs that have been capitalized to the community are recoverable or should be written off. The write-off is charged to cost of revenues in the period in which the need for the write-off is determined.
The estimates used in the determination of the estimated cash flows and fair value of both current and future communities are based on factors known to us at the time such estimates are made and our expectations of future operations and economic conditions. Should the estimates or expectations used in determining estimated fair value deteriorate in the future, we may be required to recognize additional impairment charges and write-offs related to current and future communities and such amounts could be material.
Variable Interest Entities We are required to consolidate variable interest entities (“VIEs”) in which we have a controlling financial interest in accordance with ASC 810, “Consolidation” (“ASC 810”). A controlling financial interest will have both of the following characteristics: (i) the power to direct the activities of a VIE that most significantly impact the VIE’s economic performance, and (ii) the obligation to absorb losses of the VIE that could potentially be significant to the VIE or the right to receive benefits from the VIE that could potentially be significant to the VIE.
Our variable interest in VIEs may be in the form of equity ownership, contracts to purchase assets, management services and development agreements between us and a VIE, loans provided by us to a VIE or other member, and/or guarantees provided by members to banks and other parties.
We have a significant number of land purchase contracts and investments in unconsolidated entities which we evaluate in accordance with ASC 810. We analyze our land purchase contracts and the unconsolidated entities in which we have an investment to determine whether the land sellers and unconsolidated entities are VIEs and, if so, whether we are the primary beneficiary. We examine specific criteria and use our judgment when determining if we are the primary beneficiary of a VIE. Factors considered in determining whether we are the primary beneficiary include risk and reward sharing, experience and financial condition of other member(s), voting rights, involvement in day-to-day capital and operating decisions, representation on a VIE’s executive committee, existence of

TOLL BROTHERS 201852
unilateral kick-out rights or voting rights, level of economic disproportionality between us and the other member(s), and contracts to purchase assets from VIEs. The determination whether an entity is a VIE and, if so, whether we are the primary beneficiary may require significant judgment.
Property, Construction, and Office Equipment Property, construction, and office equipment are recorded at cost and are stated net of accumulated depreciation of $145.0 million and $126.1 million at October 31, 2018 and 2017, respectively. Depreciation is recorded using the straight-line method over the estimated useful lives of the assets. In fiscal 2018, 2017, and 2016, we recognized $21.0 million, $18.7 million, and $15.5 million of depreciation expense, respectively.
Mortgage Loans Held for Sale Residential mortgage loans held for sale are measured at fair value in accordance with the provisions of ASC 825, “Financial Instruments” (“ASC 825”). We believe the use of ASC 825 improves consistency of mortgage loan valuations between the date the borrower locks in the interest rate on the pending mortgage loan and the date of the mortgage loan sale. At the end of the reporting period, we determine the fair value of our mortgage loans held for sale and the forward loan commitments we have entered into as a hedge against the interest rate risk of our mortgage loans using the market approach to determine fair value. The evaluation is based on the current market pricing of mortgage loans with similar terms and values as of the reporting date, and such pricing is applied to the mortgage loan portfolio. We recognize the difference between the fair value and the unpaid principal balance of mortgage loans held for sale as a gain or loss. In addition, we recognize the fair value of our forward loan commitments as a gain or loss. Interest income on mortgage loans held for sale is calculated based upon the stated interest rate of each loan. In addition, the recognition of net origination costs and fees associated with residential mortgage loans originated are expensed as incurred. These gains and losses, interest income, and origination costs and fees are recognized in “Other income - net” in the Consolidated Statements of Operations and Comprehensive Income.
Investments in Unconsolidated Entities In accordance with ASC 323, “Investments—Equity Method and Joint Ventures,” we review each of our investments on a quarterly basis for indicators of impairment. A series of operating losses of an investee, the inability to recover our invested capital, or other factors may indicate that a loss in value of our investment in the unconsolidated entity has occurred. If a loss exists, we further review the investment to determine if the loss is other than temporary, in which case we write down the investment to its fair value. The evaluation of our investment in unconsolidated entities entails a detailed cash flow analysis using many estimates, including, but not limited to, expected sales pace, expected sales prices, expected incentives, costs incurred and anticipated, sufficiency of financing and capital, competition, market conditions, and anticipated cash receipts, in order to determine projected future distributions from the unconsolidated entity. In addition, for rental properties, we review rental trends, expected future expenses, and expected cash flows to determine estimated fair values of the properties.
Our unconsolidated entities that develop land or develop for-sale homes and condominiums evaluate their inventory in a similar manner as we do. See “Inventory” above for more detailed disclosure on our evaluation of inventory. For our unconsolidated entities that own, develop, and manage for-rent residential apartments, we review rental trends, expected future expenses, and expected future cash flows to determine estimated fair values of the properties. If a valuation adjustment is recorded by an unconsolidated entity related to its assets, our proportionate share is reflected in income from unconsolidated entities with a corresponding decrease to our investment in unconsolidated entities.
We are a party to several joint ventures with unrelated parties to develop and sell land that is owned by the joint ventures. We recognize our proportionate share of the earnings from the sale of home sites to other builders, including our joint venture partners. We do not recognize earnings from the home sites we purchase from these ventures at the time of purchase; instead, our cost basis in those home sites is reduced by our share of the earnings realized by the joint venture from sales of those home sites to us.
We are also a party to several other joint ventures. We recognize our proportionate share of the earnings and losses of our unconsolidated entities.
Fair Value Disclosures We use ASC 820, “Fair Value Measurements and Disclosures” (“ASC 820”), to measure the fair value of certain assets and liabilities. ASC 820 provides a framework for measuring fair value in accordance with GAAP, establishes a fair value hierarchy that requires an entity to maximize the use of observable inputs and minimize the use of unobservable inputs when measuring fair value, and requires certain disclosures about fair value measurements.
The fair value hierarchy is summarized below:
LEVEL 1 :Fair value determined based on quoted prices in active markets for identical assets or liabilities.
LEVEL 2:Fair value determined using significant observable inputs, generally either quoted prices in active markets for similar assets or liabilities or quoted prices in markets that are not active.
LEVEL 3:Fair value determined using significant unobservable inputs, such as pricing models, discounted cash flows, or similar techniques.
Treasury Stock Treasury stock is recorded at cost. Issuance of treasury stock is accounted for on a first-in, first-out basis. Differences between the cost of treasury stock and the re-issuance proceeds are charged to additional paid-in capital.
Revenue and Cost Recognition Revenues and cost of revenues from home sales are recorded at the time each home is delivered and title and possession are transferred to the buyer.
For our standard attached and detached homes, land, land development, and related costs, both incurred and estimated to be incurred in the future, are amortized to the cost of homes closed based upon the total number of homes to be constructed in each community. Any changes resulting from a change in the estimated number of homes to be constructed or in the estimated land, land development, and related costs subsequent to the commencement of delivery of homes are allocated to the remaining undelivered homes in the community. Home construction and related costs are charged to the cost of homes closed under the specific identification method. The estimated land, common area development, and related costs of master planned communities, including the cost of golf courses, net of their estimated residual value, are allocated to individual communities within a master planned community on a relative sales value basis. Any changes resulting from a change in the estimated number of homes to be constructed or in the estimated costs are allocated to the remaining home sites in each of the communities of the master planned community.
For high-rise/mid-rise projects, land, land development, construction, and related costs, both incurred and estimated to be incurred in the future, are generally amortized to the cost of units closed based upon an estimated relative sales value of the units closed to the total estimated sales value. Any changes resulting from a change in the estimated total costs or revenues of the project are allocated to the remaining units to be delivered.
FORFEITED CUSTOMER DEPOSITS: Forfeited customer deposits are recognized in “Other income – net” in our Consolidated Statements of Operations and Comprehensive Income in the period in which we determine that the customer will not complete the purchase of the home and we have the right to retain the deposit.

TOLL BROTHERS 2018 53
SALES INCENTIVES: In order to promote sales of our homes, we grant our home buyers sales incentives from time to time. These incentives will vary by type of incentive and by amount on a community-by-community and home-by-home basis. Incentives that impact the value of the home or the sales price paid, such as special or additional options, are generally reflected as a reduction in sales revenues. Incentives that we pay to an outside party, such as paying some or all of a home buyer’s closing costs, are recorded as an additional cost of revenues. Incentives are recognized at the time the home is delivered to the home buyer and we receive the sales proceeds.
Advertising Costs We expense advertising costs as incurred. Advertising costs were $28.5 million, $26.1 million, and $23.1 million for the years ended October 31, 2018, 2017, and 2016, respectively.
Warranty and Self-Insurance WARRANTY: We provide all of our home buyers with a limited warranty as to workmanship and mechanical equipment. We also provide many of our home buyers with a limited 10-year warranty as to structural integrity. We accrue for expected warranty costs at the time each home is closed and title and possession are transferred to the home buyer. Warranty costs are accrued based upon historical experience. Adjustments to our warranty liabilities related to homes delivered in prior periods are recorded in the period in which a change in our estimate occurs. Over the past several years, we have had a significant number of warranty claims related primarily to homes built in Pennsylvania and Delaware. See Note 7 – “Accrued Expenses” for additional information regarding these warranty charges.
SELF-INSURANCE: We maintain, and require the majority of our subcontractors to maintain, general liability insurance (including construction defect and bodily injury coverage) and workers’ compensation insurance. These insurance policies protect us against a portion of our risk of loss from claims related to our home building activities, subject to certain self-insured retentions, deductibles and other coverage limits (“self-insured liability”). We also provide general liability insurance for our subcontractors in Arizona, California, Colorado, Nevada, Washington, and certain areas of Texas, where eligible subcontractors are enrolled as insureds under our general liability insurance policies in each community in which they perform work. For those enrolled subcontractors, we absorb their general liability associated with the work performed on our homes within the applicable community as part of our overall general liability insurance and our self-insured liability.
We record expenses and liabilities based on the estimated costs required to cover our self-insured liability and the estimated costs of potential claims and claim adjustment expenses that are above our coverage limits or that are not covered by our insurance policies. These estimated costs are based on an analysis of our historical claims and industry data, and include an estimate of claims incurred but not yet reported (“IBNR”).
We engage a third-party actuary that uses our historical claim and expense data, input from our internal legal and risk management groups, as well as industry data, to estimate our liabilities related to unpaid claims, IBNR associated with the risks that we are assuming for our self-insured liability, and other required costs to administer current and expected claims. These estimates are subject to uncertainty due to a variety of factors, the most significant being the long period of time between the delivery of a home to a home buyer and when a structural warranty or construction defect claim may be made, and the ultimate resolution of the claim. Though state regulations vary, construction defect claims may be reported and resolved over a prolonged period of time, which can extend for 10 years or longer. As a result, the majority of the estimated liability relates to IBNR. Adjustments to our liabilities related to homes delivered in prior years are recorded in the period in which a change in our estimate occurs.
The projection of losses related to these liabilities requires actuarial assumptions that are subject to variability due to uncertainties regarding construction defect claims relative to our markets and the types of product we build, insurance industry practices, and legal or regulatory actions and/or interpretations, among other factors. Key assumptions used in these estimates include claim
frequencies, severities, and settlement patterns, which can occur over an extended period of time. In addition, changes in the frequency and severity of reported claims and the estimates to settle claims can impact the trends and assumptions used in the actuarial analysis, which could be material to our consolidated financial statements. Due to the degree of judgment required, and the potential for variability in these underlying assumptions, our actual future costs could differ from those estimated, and the difference could be material to our consolidated financial statements.
Stock-Based Compensation We account for our stock-based compensation in accordance with ASC 718, “Compensation – Stock Compensation” (“ASC 718”). We use a lattice model for the valuation for our stock option grants. The option pricing models used are designed to estimate the value of options that, unlike employee stock options and restricted stock units, can be traded at any time and are transferable. In addition to restrictions on trading, employee stock options and restricted stock units may include other restrictions such as vesting periods. Further, such models require the input of highly subjective assumptions, including the expected volatility of the stock price. Stock-based compensation expense is generally included in “Selling, general and administrative” expense in our Consolidated Statements of Operations and Comprehensive Income.
Legal Expenses Transactional legal expenses for land acquisition and entitlement, and financing are capitalized and expensed over their appropriate life. We expense legal fees related to litigation, warranty and insurance claims when incurred.
Income Taxes We account for income taxes in accordance with ASC 740, “Income Taxes” (“ASC 740”). Deferred tax assets and liabilities are recorded based on temporary differences between the amounts reported for financial reporting purposes and the amounts reported for income tax purposes. In accordance with the provisions of ASC 740, we assess the realizability of our deferred tax assets. A valuation allowance must be established when, based upon available evidence, it is more likely than not that all or a portion of the deferred tax assets will not be realized. See “Income Taxes – Valuation Allowance” below.
Federal and state income taxes are calculated on reported pre-tax earnings based on current tax law and also include, in the applicable period, the cumulative effect of any changes in tax rates from those used previously in determining deferred tax assets and liabilities. Such provisions differ from the amounts currently receivable or payable because certain items of income and expense are recognized for financial reporting purposes in different periods than for income tax purposes. Significant judgment is required in determining income tax provisions and evaluating tax positions. We establish reserves for income taxes when, despite the belief that our tax positions are fully supportable, we believe that our positions may be challenged and disallowed by various tax authorities. The consolidated tax provisions and related accruals include the impact of such reasonably estimable disallowances as deemed appropriate. To the extent that the probable tax outcome of these matters changes, such changes in estimates will impact the income tax provision in the period in which such determination is made.
ASC 740 clarifies the accounting for uncertainty in income taxes recognized and prescribes a recognition threshold and measurement attributes for the financial statement recognition and measurement of a tax position taken or expected to be taken in a tax return. ASC 740 also provides guidance on de-recognition, classification, interest and penalties, accounting in interim periods, disclosure, and transition. ASC 740 requires a company to recognize the financial statement effect of a tax position when it is “more-likely-than-not” (defined as a substantiated likelihood of more than 50%), based on the technical merits of the position, that the position will be sustained upon examination. A tax position that meets the more-likely-than-not recognition threshold is measured to determine the amount of benefit to be recognized in the financial statements based upon the largest amount of benefit that is greater than 50% likely of being realized upon ultimate settlement

TOLL BROTHERS 201854
with a taxing authority that has full knowledge of all relevant information. Our inability to determine that a tax position meets the more-likely-than-not recognition threshold does not mean that the Internal Revenue Service (“IRS”) or any other taxing authority will disagree with the position that we have taken.
If a tax position does not meet the more-likely-than-not recognition threshold, despite our belief that our filing position is supportable, the benefit of that tax position is not recognized in the Consolidated Statements of Operations and Comprehensive Income and we are required to accrue potential interest and penalties until the uncertainty is resolved. Potential interest and penalties are recognized as a component of the provision for income taxes. Differences between amounts taken in a tax return and amounts recognized in the financial statements are considered unrecognized tax benefits. We believe that we have a reasonable basis for each of our filing positions and intend to defend those positions if challenged by the IRS or other taxing jurisdiction. If the IRS or other taxing authorities do not disagree with our position, and after the statute of limitations expires, we will recognize the unrecognized tax benefit in the period that the uncertainty of the tax position is eliminated.
Income Taxes – Valuation Allowance We assess the need for valuation allowances for deferred tax assets in each period based on whether it is more-likely-than-not that some portion of the deferred tax asset would not be realized. If, based on the available evidence, it is more-likely-than-not that such asset will not be realized, a valuation allowance is established against a deferred tax asset. The realization of a deferred tax asset ultimately depends on the existence of sufficient taxable income in either the carryback or carryforward periods under tax law. This assessment considers, among other matters, the nature, consistency, and magnitude of current and cumulative income and losses; forecasts of future profitability; the duration of statutory carryback or carryforward periods; our experience with operating loss and tax credit carryforwards being used before expiration; tax planning alternatives: and the outlooks for the U.S. housing industry and broader economy. Changes in existing tax laws or rates could also affect our actual tax results. Due to uncertainties in the estimation process, particularly with respect to changes in facts and circumstances in future reporting periods, actual results could differ from the estimates used in our assessment that could have a material impact on our consolidated results of operations or financial position.
Segment Reporting We operate in two segments: traditional home building and urban infill. We build and sell detached and attached homes in luxury residential communities located in affluent suburban markets and cater to move-up, empty-nester, active-adult, and second-home buyers in the United States (“Traditional Home Building”). We also build and sell homes in urban infill markets through Toll Brothers City Living® (“City Living”).
We have determined that our Traditional Home Building operations operate in five geographic segments: North, Mid-Atlantic, South, West, and California.
The states comprising each geographic segment are as follows:
NORTH: Connecticut, Illinois, Massachusetts, Michigan, New Jersey, and New York
MID-ATLANTIC: Delaware, Maryland, Pennsylvania, and Virginia
SOUTH: Florida, North Carolina, and Texas
WEST: Arizona, Colorado, Idaho, Nevada, and Washington
CALIFORNIA: California
In fiscal 2018, we acquired land and commenced development activities in the Salt Lake City, Utah and Portland, Oregon markets. We expect to open communities in these markets in fiscal 2019. In fiscal 2018, we discontinued the sale of homes in Minnesota. Our operations in Minnesota were immaterial to the North geographic segment.
Related Party Transactions See Note 4, “Investments in Unconsolidated Entities - Rental Property Joint Ventures” for information regarding Toll Brothers Realty Trust.
Recent Accounting Pronouncements In February 2018, the FASB issued Accounting Standards Update (“ASU”) No. 2018-02, “Income Statement - Reporting Comprehensive Income (Topic 220): Reclassification of Certain Tax Effects from Accumulated Other Comprehensive Income” (“ASU 2018-02”). ASU 2018-02 allows a reclassification from accumulated other comprehensive income to retained earnings for stranded tax effects resulting from the Tax Cuts and Jobs Act enacted on December 22, 2017 and also requires entities to disclose their accounting policy for releasing income tax effects from accumulated other comprehensive income. We elected to adopt ASU 2018-02 in the first quarter of fiscal 2018, and the adoption did not have a material effect on our consolidated financial statements and disclosures.
In March 2017, the FASB issued ASU No. 2017-07, “Compensation - Retirement Benefits (Topic 715): Improving the Presentation of Net Periodic Pension Cost and Net Periodic Postretirement Benefit Cost” (“ASU 2017-07”). ASU 2017-07 requires an employer to report the service cost component of pension and other post-retirement benefit costs in the same line item as other compensation costs arising from services rendered by the pertinent employees while the other components of net benefit cost are required to be presented in the income statement separately from the service cost component and outside a subtotal of income from operations; such other costs are included in other income-net in our Consolidated Statements of Operations and Comprehensive Income. We adopted ASU 2017-07 on November 1, 2017, and the adoption did not have a material effect on our consolidated financial statements and disclosures.
In March 2016, the FASB issued ASU No. 2016-09, “Compensation - Stock Compensation (Topic 718): Improvements to Employee Share-Based Payment Accounting” (“ASU 2016-09”). ASU 2016-09 simplifies several aspects related to the accounting for share-based payment transactions, including the accounting for income taxes and forfeitures, statutory tax withholding requirements and classification on the statement of cash flows. We adopted ASU 2016-09 on November 1, 2017. Excess tax benefits or deficiencies for stock-based compensation are now reflected in our Consolidated Statements of Operations and Comprehensive Income as a component of income tax expense, whereas previously they were recognized in equity. We have also elected to account for forfeitures as they occur, rather than estimate expected forfeitures. As a result of adopting ASU 2016-09, the impact of recognizing excess tax benefits and deficiencies in our Consolidated Statements of Operations and Comprehensive Income resulted in a $4.2 million reduction in our income tax expense in our fiscal year ending October 31, 2018. The remaining aspects of adopting ASU 2016-09 did not have a material impact on our financial statements and disclosures.
In February 2017, the FASB issued ASU No. 2017-05, “Other Income - Gains and Losses from the Derecognition of Nonfinancial Assets (Subtopic 610-20): Clarifying the Scope of Asset Derecognition Guidance and Accounting for Partial Sales of Nonfinancial Assets” (“ASU 2017-05”). ASU 2017-05 is meant to clarify the scope of the original guidance within Subtopic 610-20 that was issued in connection with ASU 2014-09, as defined below, which provides guidance for recognizing gains and losses from the transfer of nonfinancial assets in contracts with noncustomers. ASU 2017-05 also added guidance for partial sales of nonfinancial assets. ASU 2017-05 is effective for our fiscal year beginning November 1, 2018 and we are required to adopt ASU 2017-05 concurrent with the adoption of ASU 2014-09. We do not expect the adoption of ASU 2017-05 to have a material effect on our consolidated financial statements and disclosures.

TOLL BROTHERS 2018 55
In November 2016, the FASB issued ASU No. 2016-18, “Statement of Cash Flows (Topic 230): Restricted Cash” (“ASU 2016-18”), which provides guidance on the classification of restricted cash in the statement of cash flows. ASU 2016-18 is effective for our fiscal year beginning November 1, 2018. We do not expect the adoption of ASU 2016-18 to have a material effect on our consolidated financial statements and disclosures.
In August 2016, the FASB issued ASU No. 2016-15, “Statement of Cash Flows (Topic 230): Classification of Certain Cash Receipts and Cash Payments” (“ASU 2016-15”), which is intended to reduce diversity in practice in how certain transactions are classified and will make eight targeted changes to how cash receipts and cash payments are presented in the statement of cash flows. ASU 2016-15 is effective for our fiscal year beginning November 1, 2018. We do not expect the adoption of ASU 2016-15 to have a material effect on our consolidated financial statements and disclosures.
In June 2016, the FASB issued ASU No. 2016-13, “Financial Instruments - Credit Losses (Topic 326): Measurement of Credit Losses on Financial Instruments” (“ASU 2016-13”). ASU 2016-13 replaces the current incurred loss impairment methodology with a methodology that reflects expected credit losses and requires consideration of a broader range of reasonable and supportable information to estimate credit losses. ASU 2016-13 is effective for our fiscal year beginning November 1, 2020, with early adoption permitted as of November 1, 2019. We do not expect the adoption of ASU 2016-13 to have a material effect on our consolidated financial statements and disclosures.
In February 2016, the FASB issued ASU No. 2016-02, “Leases” (“ASU 2016-02”), which requires an entity to recognize assets and liabilities on the balance sheet for the rights and obligations created by leased assets and provide additional disclosures. ASU 2016-02 is effective for our fiscal year beginning November 1, 2019, and, at that time, we will adopt the new standard using a modified retrospective approach and expect to apply the basket of practical expedients. We are currently evaluating the impact that the adoption of ASU 2016-02 may have on our consolidated financial statements and disclosures.
In May 2014, the FASB issued ASU No. 2014-09, “Revenue from Contracts with Customers” (“ASU 2014-09”), which provides guidance for revenue recognition. ASU 2014-09 affects any entity that either enters into contracts with customers to transfer goods or services or enters into contracts for the transfer of nonfinancial assets. ASU 2014-09 supersedes the revenue recognition requirements in Accounting Standards Codification (“ASC”) Topic 605, “Revenue Recognition,” and most industry-specific guidance. ASU 2014-09 also supersedes some cost guidance included in Subtopic 605-35, “Revenue Recognition-Construction-Type and Production-Type Contracts.” The standard’s core principle is that a company will recognize revenue when it transfers promised goods or services to customers in an amount that reflects the consideration to which a company expects to be entitled in exchange for those goods or services. In doing so, companies will need to use more judgment and make more estimates than under the current guidance. These judgments and estimates include identifying performance obligations in the contract, estimating the amount of variable consideration to include in the transaction price, and allocating the transaction price to each separate performance obligation. In August 2015, the FASB issued ASU 2015-14 “Revenue from Contracts with Customers” (“ASU 2015-14”), which delays the effective date of ASU 2014-09 by one year. ASU 2014-09, as amended by ASU 2015-14, is effective for our fiscal year beginning November 1, 2018, and, at that time, we expect to adopt the new standard under the modified retrospective approach. We do not believe the adoption of ASU 2014-09 will have a material impact on the amount or timing of our home building revenues. However, we currently expect that the adoption of ASU 2014-09 will result in the following changes:
• We currently capitalize certain costs related to our marketing efforts, including sales offices and model home upgrades and furnishings within “Inventory” on our Consolidated Balance Sheets and amortize such costs through “Selling, general, and administrative” on our Consolidated Statements of Operations and Comprehensive Income. As of November 1, 2018, we expect to reclassify approximately $105.0 million to “Property, construction, and office equipment, net” on our Consolidated Balance Sheets, primarily related to sales offices and model home improvement costs. We plan to continue depreciating these assets through “Selling, general, and administrative” on our Consolidated Statements of Operations and Comprehensive Income. Additionally, we
expect to record a cumulative effect adjustment to retained earnings of approximately $18.0 million for certain other marketing costs that will no longer qualify for capitalization under the new guidance, and such costs will be expensed as incurred in the future.
• We currently record our land sale activities, net of their related expenses, within “Other income - net” on our Consolidated Statements of Operations and Comprehensive Income. Beginning November 1, 2018, we expect to include this activity in income from operations and breakout the components of land sale revenues and land sale cost of sales on our Consolidated Statements of Operations and Comprehensive Income. In addition, due to the existence of certain repurchase options within our existing agreements to sell lots to third party builders in our master planned communities, both for wholly-owned projects as well as projects in which we are party to a joint venture, we expect to record a cumulative effect adjustment to retained earnings of approximately $11.0 million to account for previously settled lots for which the related repurchase option has not yet expired. The revenue and related expenses for such lots will be recognized in future periods when such repurchase options expire.
• Retained customer deposits are currently classified in “Other income-net” on our Consolidated Statements of Operations and Comprehensive Income. As of November 1, 2018, we expect these retained customer deposits will be included in “Revenue” on our Consolidated Statements of Operations and Comprehensive Income. Prior period balances for retained customer deposits will not be reclassified and are not material to our consolidated financial statements.
We additionally expect our accounting for incomplete deliverables at the time a home closes will be impacted upon adoption of the new guidance and continue to refine our analysis which quantifies the impact of such change. However, we do not expect the impact of incomplete deliverables to have a material effect on our consolidated financial statements and disclosures.
Reclassification Certain prior period amounts have been reclassified to conform to the fiscal 2018 presentation. Such reclassifications primarily relate to the (i) reclassification of “Restricted cash” into “Receivables, prepaid expenses, and other assets” on the Consolidated Balance Sheets and Consolidated Statements of Cash Flows; (ii) reclassification of certain pension costs from “Selling, general and administrative” to “Other income – net” on the Consolidated Statements of Operations and Comprehensive Income as a result of the adoption of ASU 2017-07; and (iii) removal of the activity related to excess tax benefits from stock-based compensation on the Consolidated Statements of Cash Flows as a result of the adoption of ASU 2016-09.
2. ACQUISITIONIn November 2016, we acquired all of the assets and operations of Coleman Real Estate Holdings, LLC (“Coleman”) for approximately $83.1 million in cash. The assets acquired were primarily inventory, including approximately 1,750 home sites owned or controlled through land purchase agreements. As part of the acquisition, we assumed contracts to deliver 128 homes with an aggregate value of $38.8 million. The average price of the undelivered homes at the date of acquisition was approximately $303,000. As a result of this acquisition, our selling community count increased by 15 communities at the acquisition date.
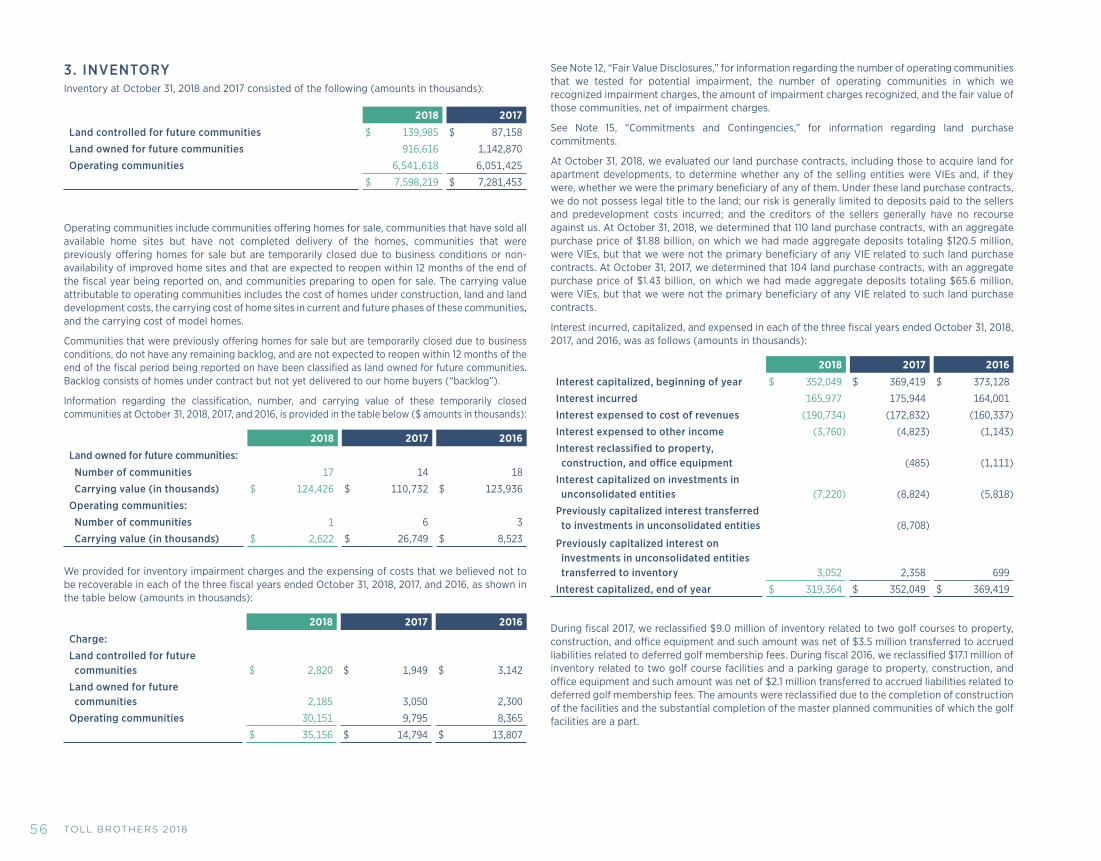
TOLL BROTHERS 201856
3. INVENTORY Inventory at October 31, 2018 and 2017 consisted of the following (amounts in thousands):
2018 2017
Land controlled for future communities $ 139,985 $ 87,158
Land owned for future communities 916,616 1,142,870
Operating communities 6,541,618 6,051,425
$ 7,598,219 $ 7,281,453
Operating communities include communities offering homes for sale, communities that have sold all available home sites but have not completed delivery of the homes, communities that were previously offering homes for sale but are temporarily closed due to business conditions or non-availability of improved home sites and that are expected to reopen within 12 months of the end of the fiscal year being reported on, and communities preparing to open for sale. The carrying value attributable to operating communities includes the cost of homes under construction, land and land development costs, the carrying cost of home sites in current and future phases of these communities, and the carrying cost of model homes.
Communities that were previously offering homes for sale but are temporarily closed due to business conditions, do not have any remaining backlog, and are not expected to reopen within 12 months of the end of the fiscal period being reported on have been classified as land owned for future communities. Backlog consists of homes under contract but not yet delivered to our home buyers (“backlog”).
Information regarding the classification, number, and carrying value of these temporarily closed communities at October 31, 2018, 2017, and 2016, is provided in the table below ($ amounts in thousands):
2018 2017 2016
Land owned for future communities:
Number of communities 17 14 18
Carrying value (in thousands) $ 124,426 $ 110,732 $ 123,936
Operating communities:
Number of communities 1 6 3
Carrying value (in thousands) $ 2,622 $ 26,749 $ 8,523
We provided for inventory impairment charges and the expensing of costs that we believed not to be recoverable in each of the three fiscal years ended October 31, 2018, 2017, and 2016, as shown in the table below (amounts in thousands):
2018 2017 2016
Charge:
Land controlled for future communities $ 2,820 $ 1,949 $ 3,142
Land owned for future communities 2,185 3,050 2,300
Operating communities 30,151 9,795 8,365
$ 35,156 $ 14,794 $ 13,807
See Note 12, “Fair Value Disclosures,” for information regarding the number of operating communities that we tested for potential impairment, the number of operating communities in which we recognized impairment charges, the amount of impairment charges recognized, and the fair value of those communities, net of impairment charges.
See Note 15, “Commitments and Contingencies,” for information regarding land purchase commitments.
At October 31, 2018, we evaluated our land purchase contracts, including those to acquire land for apartment developments, to determine whether any of the selling entities were VIEs and, if they were, whether we were the primary beneficiary of any of them. Under these land purchase contracts, we do not possess legal title to the land; our risk is generally limited to deposits paid to the sellers and predevelopment costs incurred; and the creditors of the sellers generally have no recourse against us. At October 31, 2018, we determined that 110 land purchase contracts, with an aggregate purchase price of $1.88 billion, on which we had made aggregate deposits totaling $120.5 million, were VIEs, but that we were not the primary beneficiary of any VIE related to such land purchase contracts. At October 31, 2017, we determined that 104 land purchase contracts, with an aggregate purchase price of $1.43 billion, on which we had made aggregate deposits totaling $65.6 million, were VIEs, but that we were not the primary beneficiary of any VIE related to such land purchase contracts.
Interest incurred, capitalized, and expensed in each of the three fiscal years ended October 31, 2018, 2017, and 2016, was as follows (amounts in thousands):
2018 2017 2016
Interest capitalized, beginning of year $ 352,049 $ 369,419 $ 373,128
Interest incurred 165,977 175,944 164,001
Interest expensed to cost of revenues (190,734) (172,832) (160,337)
Interest expensed to other income (3,760) (4,823) (1,143)
Interest reclassified to property, construction, and office equipment (485) (1,111)
Interest capitalized on investments in unconsolidated entities (7,220) (8,824) (5,818)
Previously capitalized interest transferred to investments in unconsolidated entities (8,708)
Previously capitalized interest on investments in unconsolidated entities transferred to inventory 3,052 2,358 699
Interest capitalized, end of year $ 319,364 $ 352,049 $ 369,419
During fiscal 2017, we reclassified $9.0 million of inventory related to two golf courses to property, construction, and office equipment and such amount was net of $3.5 million transferred to accrued liabilities related to deferred golf membership fees. During fiscal 2016, we reclassified $17.1 million of inventory related to two golf course facilities and a parking garage to property, construction, and office equipment and such amount was net of $2.1 million transferred to accrued liabilities related to deferred golf membership fees. The amounts were reclassified due to the completion of construction of the facilities and the substantial completion of the master planned communities of which the golf facilities are a part.

TOLL BROTHERS 2018 57
4. INVESTMENTS IN UNCONSOLIDATED ENTITIESWe have investments in various unconsolidated entities. These entities, which are structured as joint ventures (i) develop land for the joint venture participants and for sale to outside builders (“Land Development Joint Ventures”); (ii) develop for-sale homes (“Home Building Joint Ventures”); (iii) develop luxury for-rent residential apartments, commercial space, and a hotel (“Rental Property Joint Ventures”), which includes our investment in Toll Brothers Realty Trust (the “Trust”); and (iv) invest in distressed loans and real estate and provide financing and land banking to residential builders and developers for the acquisition and development of land and home sites (“Gibraltar Joint Ventures”). In fiscal 2018, 2017 and 2016, we recognized income from the unconsolidated entities in which we had an investment of $85.2 million, $116.1 million, and $40.7 million, respectively.
The table below provides information as of October 31, 2018, regarding active joint ventures that we are invested in, by joint venture category ($ amounts in thousands):
Land Development
Joint Ventures
Home Building
Joint Ventures
Rental Property
Joint Ventures
Gibraltar Joint
Ventures Total
Number of unconsolidated entities 7 4 15 7 33
Investment in unconsolidated entities $ 176,593 $ 65,936 $ 171,216 $ 18,068 $ 431,813
Number of unconsolidated entities with funding commitments by the Company 4 1 2 1 8
Company’s remaining funding commitment to unconsolidated entities $ 19,961 $ 8,300 $ 1,578 $ 9,621 $ 39,460
Certain joint ventures in which we have investments obtained debt financing to finance a portion of their activities. The table below provides information at October 31, 2018, regarding the debt financing obtained by category ($ amounts in thousands):
Land Development
Joint VenturesHome Building Joint Ventures
Rental Property Joint
Ventures Total
Number of joint ventures with debt financing 4 3 13 20
Aggregate loan commitments $ 138,808 $ 381,411 $ 972,903 $ 1,493,122
Amounts borrowed under commitments $ 126,790 $ 287,272 $ 740,203 $ 1,154,265
More specific and/or recent information regarding our investments in and future commitments to these entities is provided below.
Land Development Joint VenturesIn fiscal 2018, our Land Development Joint Ventures sold approximately 986 lots and recognized revenues of $351.4 million. We acquired 259 of these lots for $153.2 million. Our share of the joint venture income from the lots we acquired of $1.7 million was deferred by reducing our basis in those lots acquired. The Company recognized charges in connection with two Land Development Joint Ventures of $6.0 million in fiscal 2018.
In fiscal 2017, our Land Development Joint Ventures sold approximately 1,132 lots and recognized revenues of $288.4 million. We acquired 364 of these lots for $166.5 million. Our share of the income from the lots we acquired of $13.5 million was deferred by reducing our basis in those lots acquired. The Company recognized charges in connection with one Land Development Joint Venture of $2.0 million in fiscal 2017.
Home Building Joint VenturesOur Home Building Joint Ventures are delivering homes in New York City and Jupiter, Florida. In fiscal 2018 and 2017, our Home Building Joint Ventures delivered 100 homes with a sales value of $148.0 million, and 197 homes with a sales value of $475.3 million, respectively.
In fiscal 2017, we entered into two joint ventures with unrelated parties to complete the development of high-rise luxury condominium projects in New York City. Before the formation of these joint ventures, we acquired the properties and incurred approximately $319.8 million of land and land development costs. These joint ventures, in which we have interests ranging from 20% to 25%, purchased the properties from us at our cost, a portion of which was financed by $380.5 million in construction loans obtained by the joint ventures. From these sales and financings, we received proceeds of $263.9 million.
In the first quarter of fiscal 2015, we entered into a joint venture with an unrelated party to complete the development of a high-rise luxury condominium project in New York City on property that we owned. We contributed $15.9 million as our initial contribution for a 25% interest in this joint venture. We sold the property to the joint venture for $78.5 million, and we were reimbursed for development and construction costs incurred by us prior to the sale. The gain of $9.3 million that we realized on the sale in fiscal 2015 was deferred and was being recognized in our results of operations as units were delivered to the ultimate home buyer. The joint venture commenced settlement of units in fiscal 2016. We recognized $4.7 million and $1.5 million of previously deferred gains in fiscal 2017 and 2016, respectively. In the fourth quarter of fiscal 2017, we purchased our partner’s 75% interest in this joint venture for $36.8 million. Accordingly, the remaining unrecognized deferred gain of $3.0 million was used to adjust our basis in the inventory acquired from the purchase.
Rental Property Joint VenturesAs of October 31, 2018, our Rental Property Joint Ventures owned 15 for-rent apartment projects and a hotel, which are located in the metro Boston to metro Washington, D.C. corridor and in suburban Atlanta, Georgia. At October 31, 2018, these joint ventures had approximately 1,750 units that were occupied or ready for occupancy, 1,400 units in the lease-up stage, and 2,800 units under development. In addition, we either own or have under contract, approximately 9,450 units, of which 1,350 units are under active development; we intend to develop these units in joint ventures with unrelated parties in the future.
In fiscal 2018, we entered into four joint ventures with unrelated parties to develop luxury for-rent residential apartment projects located in suburban Atlanta, Georgia; Belmont, Massachusetts; and Washington, D.C. Prior to the formation of these joint ventures, we acquired the properties and incurred approximately $140.0 million of land and land development costs. Our partners acquired interests in these entities ranging from 50% to 75% for an aggregate amount of $80.3 million. In fiscal 2018, several of these joint ventures entered into construction loan agreements for an

TOLL BROTHERS 201858
aggregate amount of $166.1 million to finance the development of these projects. At October 31, 2018, the joint ventures had $21.8 million of outstanding borrowings under the construction loan facilities.
In addition, in fiscal 2018 we entered into a joint venture with an unrelated party to develop a luxury for-rent residential apartment project in a suburb of Boston, Massachusetts. We contributed cash of $15.9 million for our initial 85% ownership interest in this joint venture. Due to our controlling financial interest, our power to direct the activities that most significantly impact the joint venture’s performance, and our obligation to absorb expected losses or receive benefits from the joint venture, we consolidated this joint venture at October 31, 2018. The carrying value of the joint venture’s assets totaling $19.7 million are reflected in “Receivables, prepaid expenses, and other assets” in our Consolidated Balance Sheet at October 31, 2018. Our partner’s 15% interest of $2.8 million in the joint venture is reflected as a component of “Noncontrolling interest” in our Consolidated Balance Sheet as of October 31, 2018. The joint venture expects to admit an additional investor and secure third-party financing at a later date.
In fiscal 2018, three of our Rental Property Joint Ventures sold their assets to unrelated parties for $477.5 million. These joint ventures had owned, developed, and operated multifamily rental properties located in suburban Washington, D.C. and Westborough, Massachusetts, and a student housing community in College Park, Maryland. In connection with these sales, the joint ventures’ aggregate outstanding loan balance of $239.6 million was repaid. From our investment in these joint ventures, we received cash of $79.1 million and recognized gains from these sales of $67.2 million in fiscal 2018, which is included in “Income from unconsolidated entities” in our Consolidated Statement of Operations and Comprehensive Income.
In the fourth quarter of fiscal 2017, we entered into a joint venture with an unrelated party to develop a 232-unit luxury for-rent residential apartment project in Princeton Junction, New Jersey. Prior to the formation of this joint venture, we acquired the property and incurred $13.6 million of land and land development costs. Our partner acquired a 75% interest for $10.2 million. The gain of $3.0 million that we realized on the sale was deferred due to our continuing involvement in the joint venture through our retained ownership interest and guarantees we provided on the joint venture’s debt. In the fourth quarter of fiscal 2017, the joint venture entered into a $41.7 million construction loan agreement with a bank to finance the development of this project. At October 31, 2018, there were $22.1 million of outstanding borrowings under the construction loan.
In the third quarter of fiscal 2017, one of our Rental Property Joint Ventures amended its existing $70.0 million construction loan agreement to finance construction of multifamily residential apartments in northern New Jersey. The terms of the amendment extended the maturity date and revised certain guarantees provided for under the loan, including the repayment guaranty for which our obligation increased from 25% to 100%. At October 31, 2018, this joint venture had $70.0 million of borrowings outstanding under the facility.
In fiscal 2017, we sold one-half of our 50% interest in two of our Rental Property Joint Ventures to an unrelated party. In connection with these sales, we, along with our partners, recapitalized the joint ventures and refinanced the existing $166.3 million in construction loans with 10-year fixed rate loans totaling $189.0 million. As a result of these transactions, we received cash of $54.9 million and recognized gains of $26.7 million in fiscal 2017, which is included in “Income from unconsolidated entities” in our Consolidated Statements of Operations and Comprehensive Income. At October 31, 2018, we had a 25% interest in each of these joint ventures.
We have an investment in a joint venture in which we have a 50% interest that developed a luxury hotel in conjunction with a high-rise luxury condominium project in New York City being developed by a related Home Building Joint Venture. The hotel commenced operations in February 2017. At October 31, 2018, we had an investment of $35.0 million in this joint venture. In December 2016, this joint venture entered into an $80.0 million, three-year term loan agreement. The proceeds from the term loan, along with proceeds from the closing of condominium units at the Home Building Joint Venture, were used to repay an existing construction loan.
In 1998, we formed the Trust to invest in commercial real estate opportunities. The Trust is effectively owned one-third by us; one-third by current and former members of our senior management; and one-third by an unrelated party. As of October 31, 2018, our investment in the Trust was zero as cumulative distributions received from the Trust have been in excess of the carrying amount of our net investment. We provide development, finance, and management services to the Trust and recognized fees under the terms of various agreements in the amounts of $2.0 million, $2.0 million, and $1.6 million in fiscal 2018, 2017 and 2016, respectively. In fiscal 2018 and 2016, we received distributions of $27.7 million and $2.0 million, respectively, from the Trust, of which the full amount was recognized as income and included in “Income from unconsolidated entities” in our fiscal 2018 and 2016 Consolidated Statements of Operations and Comprehensive Income. No distributions were received from the Trust in fiscal 2017.
Subsequent eventsIn December 2018, we entered into a joint venture with an unrelated party to develop a 293-unit student housing community in Miami, Florida. We contributed cash of $13.2 million for our initial 71% ownership interest in this joint venture. Due to our controlling financial interest, our power to direct the activities that most significantly impact the joint venture’s performance, and our obligation to absorb expected losses or receive benefits from the joint venture, we expect to consolidate this joint venture. The joint venture expects to admit an additional investor and secure third-party financing at a later date.
In November 2018, we entered into a joint venture with an unrelated party to develop a 421-unit for-rent residential apartment project in Harrison, New York. Prior to the formation of this joint venture, we acquired the property and incurred approximately $36.1 million of land and land development costs. Our partner acquired a 75% interest in this entity for approximately $35.0 million, of which $34.6 million was distributed to us. We have a 25% interest in this venture and our initial investment is $12.7 million. As a result of the sale of 75% of our interest to our partner, we expect to recognize a gain of approximately $8.5 million in our first quarter of fiscal 2019. Concurrent with its formation, the joint venture entered into a $101.9 million construction loan agreement to finance the development of this project. We and an affiliate of our partner provided certain guarantees under the construction loan agreement. We estimate that the maximum exposure under these guarantees, if the full amount of the loan commitment was borrowed, would be $101.9 million without taking into account any recoveries from the underlying collateral or any reimbursement from our partner.
In November 2018, we entered into a joint venture with an unrelated party to develop a 426-unit for-rent residential apartment project in Boston, Massachusetts. We contributed cash of $26.5 million for our initial 50% ownership interest in this joint venture. The joint venture expects to admit an additional investor and secure third-party financing at a later date.
Gibraltar Joint VenturesWe, through our wholly owned subsidiary, Gibraltar Capital and Asset Management, LLC (“Gibraltar”), have entered into five ventures with an institutional investor to provide builders and developers with land banking and venture capital, two of which were formed in fiscal 2018. We have approximately a 25% interest in each of these ventures. These ventures will finance builders’ and developers’ acquisition and development of land and home sites and pursue other complementary investment strategies. We may invest up to $100.0 million in these ventures. As of October 31, 2018, we had an investment of $12.6 million in these ventures.
In addition, in the second quarter of fiscal 2016, we entered into a separate venture with the same institutional investor to purchase, from Gibraltar, certain foreclosed real estate owned and distressed loans for $24.1 million. We have a 24% interest in this venture. In fiscal 2016, we recognized a gain of $1.3 million from the sale of these assets to the venture. At October 31, 2018, we had a $3.7 million investment in this venture and are committed to invest an additional $9.6 million, if necessary.

TOLL BROTHERS 2018 59
GuaranteesThe unconsolidated entities in which we have investments generally finance their activities with a combination of partner equity and debt financing. In some instances, we and our partners have guaranteed debt of certain unconsolidated entities. These guarantees may include any or all of the following: (i) project completion guarantees, including any cost overruns; (ii) repayment guarantees, generally covering a percentage of the outstanding loan; (iii) carry cost guarantees, which cover costs such as interest, real estate taxes, and insurance; (iv) an environmental indemnity provided to the lender that holds the lender harmless from and against losses arising from the discharge of hazardous materials from the property and non-compliance with applicable environmental laws; and (v) indemnification of the lender from “bad boy acts” of the unconsolidated entity.
In some instances, the guarantees provided in connection with loans to an unconsolidated entity are joint and several. In these situations, we generally have a reimbursement agreement with our partner that provides that neither party is responsible for more than its proportionate share or agreed upon share of the guarantee; however, if the joint venture partner does not have adequate financial resources to meet its obligations under the reimbursement agreement, we may be liable for more than our proportionate share.
We believe that, as of October 31, 2018, in the event we become legally obligated to perform under a guarantee of an obligation of an unconsolidated entity due to a triggering event, the collateral in such entity should be sufficient to repay a significant portion of the obligation. If it is not, we and our partners would need to contribute additional capital to the venture. At October 31, 2018, certain unconsolidated entities have loan commitments aggregating $1.34 billion, of which, if the full amount of the debt obligations were borrowed, we estimate $294.7 million to be our maximum exposure related to repayment and carry cost guarantees. At October 31, 2018, the unconsolidated entities had borrowed an aggregate of $1.06 billion, of which we estimate $254.7 million to be our maximum exposure related to repayment and carry cost guarantees. The terms of these guarantees generally range from 8 months to 48 months. These maximum exposure estimates do not take into account any recoveries from the underlying collateral or any reimbursement from our partners.
As of October 31, 2018, the estimated aggregate fair value of the guarantees provided by us related to debt and other obligations of certain unconsolidated entities was approximately $5.6 million. We have not made payments under any of the guarantees, nor have we been called upon to do so.
Variable Interest EntitiesAt October 31, 2018 and 2017, we determined that eleven and eight, respectively, of our joint ventures were VIEs under the guidance within ASC 810. For ten and eight of these VIEs as of October 31, 2018 and 2017, respectively, we concluded that we were not the primary beneficiary of these VIEs because the power to direct the activities of such VIEs that most significantly impact their performance was either shared by us and such VIEs’ other partners or such activities were controlled by our partner. For VIEs where the power to direct significant activities is shared, business plans, budgets, and other major decisions are required to be unanimously approved by all members. Management and other fees earned by us are nominal and believed to be at market rates, and there is no significant economic disproportionality between us and other members. The information presented below regarding the investments, commitments, and guarantees in unconsolidated entities deemed to be VIEs is also included in the information provided above.
As discussed under “Rental Property Joint Ventures” above, we consolidated one joint venture as of October 31, 2018. The joint venture was determined to be a VIE due to its current inability to finance its activities without additional subordinated financial support as well as our partner’s inability to participate in the significant decisions of the joint venture in addition to its lack of substantive kick-out rights. We further concluded that we were the primary beneficiary of this VIE due to our controlling financial interest in such venture as we have the power to direct the activities that most significantly impact the joint venture’s performance and the obligation to absorb expected losses or receive benefits from the joint venture. The assets of this VIE can only be used to settle the obligations of the VIE. In addition, in the event additional contributions are required to be funded to
the joint venture prior to the admission of an additional investor at a future date, we expect that we would fund 100% of such contributions, including our partner’s pro rata share, which we expect would be funded through an interest-bearing loan.
At October 31, 2018 and 2017, our investments in our unconsolidated entities deemed to be VIEs, which are included in “Investments in unconsolidated entities” in our Consolidated Balance Sheets, totaled $33.8 million and $35.9 million, respectively. At October 31, 2018, the maximum exposure of loss to our investments in these entities was limited to our investments in the unconsolidated VIEs, except with regard to $70.0 million of loan guarantees and $10.8 million of additional commitments to fund the VIEs. Of our potential exposure for these loan guarantees, $70.0 million is related to repayment and carry cost guarantees, of which $70.0 million was borrowed at October 31, 2018. At October 31, 2017, the maximum exposure of loss to our investments in these entities was limited to our investments in the unconsolidated VIEs, except with regard to $70.0 million of loan guarantees and $10.5 million of additional commitments to fund the VIEs. Of our potential exposure for these loan guarantees, $70.0 million is related to repayment and carry cost guarantees, of which $61.3 million was borrowed at October 31, 2017.
Joint Venture Condensed Financial InformationThe Condensed Balance Sheets, as of the dates indicated, and the Condensed Statements of Operations and Comprehensive Income, for the periods indicated, for the unconsolidated entities in which we have an investment, aggregated by type of business, are included below (in thousands).

TOLL BROTHERS 201860
Land Development
Joint VenturesHome Building Joint Ventures
Rental Property Joint Ventures
Gibraltar Joint Ventures Total
CONDENSED BALANCE SHEETS: October 31, 2018
Cash and cash equivalents $ 47,409 $ 22,834 $ 23,750 $ 8,469 $ 102,462
Inventory 403,670 557,157 13,163 973,990
Loan receivables, net 40,065 40,065
Rental properties 808,785 808,785
Rental properties under development 437,586 437,586
Real estate owned 14,838 14,838
Other assets 93,322 49,723 21,917 1,067 166,029
Total assets $ 544,401 $ 629,714 $ 1,292,038 $ 77,602 $ 2,543,755
Debt, net of deferred financing costs $ 125,557 $ 284,959 $ 735,482 $ — $ 1,145,998
Other liabilities 29,096 72,897 51,992 4,585 158,570
Members’ equity 389,748 271,858 504,564 69,804 1,235,974
Noncontrolling interest 3,213 3,213
Total liabilities and equity $ 544,401 $ 629,714 $ 1,292,038 $ 77,602 $ 2,543,755
Company’s net investment in unconsolidated entities (1) $ 176,593 $ 65,936 $ 171,216 $ 18,068 $ 431,813
October 31, 2017
Cash and cash equivalents $ 77,667 $ 38,600 $ 24,367 $ 13,194 $ 153,828
Inventory 629,159 503,131 15,919 1,148,209
Loan receivables, net 22,495 22,495
Rental properties 970,497 970,497
Rental properties under development 190,541 190,541
Real estate owned 53,902 53,902
Other assets 96,725 31,794 26,637 1,462 156,618
Total assets $ 803,551 $ 573,525 $ 1,212,042 $ 106,972 $ 2,696,090
Debt $ 223,035 $ 173,285 $ 803,263 $ — $ 1,199,583
Other liabilities 37,832 51,017 40,610 5,833 135,292
Members’ equity 542,684 349,223 368,169 72,209 1,332,285
Noncontrolling interest 28,930 28,930
Total liabilities and equity $ 803,551 $ 573,525 $ 1,212,042 $ 106,972 $ 2,696,090
Company’s net investment in unconsolidated entities (1) $ 236,062 $ 102,191 $ 127,439 $ 16,066 $ 481,758
(1) Differences between our net investment in unconsolidated entities and our underlying equity in the net assets of the entities were primarily a result of the acquisition price of an investment in a Land Development Joint Venture in fiscal 2012 that was in excess of our pro rata share of the underlying equity; impairments related to our investments in unconsolidated entities; interest capitalized on our investments; the estimated fair value of the guarantees provided to the joint ventures; gains recognized from the sale of our ownership interests; and distributions from entities in excess of the carrying amount of our net investment.

TOLL BROTHERS 2018 61
Land Development
Joint VenturesHome Building Joint Ventures
Rental Property Joint Ventures
Gibraltar Joint Ventures Total
CONDENSED STATEMENTS OF OPERATIONS AND COMPREHENSIVE INCOME: For the year ended October 31, 2018
Revenues $ 351,397 $ 148,002 $ 121,276 $ 19,592 $ 640,267
Cost of revenues 317,363 112,469 74,946 17,817 522,595
Other expenses 9,125 8,630 61,502 3,201 82,458
Total expenses 326,488 121,099 136,448 21,018 605,053
Gain on disposition of loans and REO 53,192 53,192
Income (loss) from operations 24,909 26,903 (15,172) 51,766 88,406
Other income 5,939 2,134 222,744 1,937 232,754
Income before income taxes 30,848 29,037 207,572 53,703 321,160
Income tax provision 86 767 853
Net income including earnings from noncontrolling interest 30,762 28,270 207,572 53,703 320,307
Less: income attributable to noncontrolling interest (28,297) (28,297)
Net income attributable to controlling interest $ 30,762 $ 28,270 $ 207,572 $ 25,406 $ 292,010
Company’s equity in earnings of unconsolidated entities (2) $ 3,392 $ 14,069 $ 62,204 $ 5,575 $ 85,240
For the year ended October 31, 2017
Revenues $ 288,440 $ 475,260 $ 115,519 $ 10,090 $ 889,309
Cost of revenues 191,965 286,446 70,108 14,428 562,947
Other expenses 6,508 13,102 59,503 3,942 83,055
Total expenses 198,473 299,548 129,611 18,370 646,002
Gain on disposition of loans and REO 48,079 48,079
Income (loss) from operations 89,967 175,712 (14,092) 39,799 291,386
Other income 4,723 7,317 1,556 432 14,028
Income (loss) before income taxes 94,690 183,029 (12,536) 40,231 305,414
Income tax provision 94 7,473 95 7,662
Net income (loss) including earnings from noncontrolling interests 94,596 175,556 (12,631) 40,231 297,752
Less: income attributable to noncontrolling interest (20,439) (20,439)
Net income attributable to controlling interest $ 94,596 $ 175,556 $ (12,631) $ 19,792 277,313
Company’s equity in earnings of unconsolidated entities (2) $ 13,007 $ 77,339 $ 21,458 $ 4,262 $ 116,066
For the year ended October 31, 2016
Revenues $ 142,015 $ 168,164 $ 58,707 $ 5,929 $ 374,815
Cost of revenues 63,429 118,621 29,791 24,684 236,525
Other expenses 3,904 8,124 30,779 2,043 44,850
Total expenses 67,333 126,745 60,570 26,727 281,375
Gain on disposition of loans and REO 49,579 49,579
Income (loss) from operations 74,682 41,419 (1,863) 28,781 143,019
Other income (expense) 3,464 (486) 1,144 1,172 5,294
Net income (loss) 78,146 40,933 (719) 29,953 148,313
Less: income attributable to noncontrolling interest (18,218) (18,218)
Net income (loss) attributable to controlling interest 78,146 40,933 (719) 11,735 130,095
Other comprehensive income 100 100
Total comprehensive income (loss) $ 78,146 $ 40,933 $ (619) $ 11,735 $ 130,195
Company’s equity in earnings of unconsolidated entities (2) $ 15,772 $ 16,945 $ 5,721 $ 2,310 $ 40,748
(2) Differences between our equity in earnings of unconsolidated entities and the underlying net income (loss) of the entities were primarily a result of a basis difference of an acquired joint venture interest; distributions from entities in excess of the carrying amount of our net investment; recoveries of previously incurred charges; unrealized gains on our retained joint venture interests; and our share of the entities’ profits related to home sites purchased by us which reduces our cost basis of the home sites acquired.

TOLL BROTHERS 201862
5. RECEIVABLES, PREPAID EXPENSES, AND OTHER ASSETS
Receivables, prepaid expenses, and other assets at October 31, 2018 and 2017, consisted of the of the following (amounts in thousands):
2018 2017
Expected recoveries from insurance carriers and others $ 126,291 $ 153,774
Improvement cost receivable 96,937 99,311
Escrow cash held by our captive title company 33,471 45,923
Properties held for rental apartment and commercial development 193,015 146,288
Prepaid expenses 23,065 23,223
Other 77,999 76,180
$ 550,778 $ 544,699
See Note 7, “Accrued Expenses,” for additional information regarding the expected recoveries from insurance carriers and others.
6. LOANS PAYABLE, SENIOR NOTES, AND MORTGAGE COMPANY LOAN FACILITY
Loans Payable At October 31, 2018 and 2017, loans payable consisted of the following (amounts in thousands):
2018 2017
Senior unsecured term loan $ 500,000 $ 500,000
Loans payable – other 188,115 139,116
Deferred issuance costs (1,314) (1,700)
$ 686,801 $ 637,416
Senior Unsecured Term Loan At October 31, 2018, we have a $500.0 million, five-year senior unsecured term loan facility (the “Term Loan Facility”) with a syndicate of banks that was scheduled to mature in August 2021. Under the Term Loan Facility, as amended, we may select interest rates equal to (i) London Interbank Offered Rate (“LIBOR”) plus an applicable margin, (ii) the base rate (as defined in the agreement) plus an applicable margin, or (iii) the federal funds/Euro rate (as defined in the agreement) plus an applicable margin, in each case, based on our leverage ratio. At October 31, 2018, the interest rate on the Term Loan Facility was 3.70% per annum.
We and substantially all of our 100%-owned home building subsidiaries are guarantors under the Term Loan Facility. The Term Loan Facility contains substantially the same financial covenants as the Revolving Credit Facility, as described below.
Subsequent event On November 1, 2018, we entered into an amendment to the Term Loan Facility to, among other things, (i) increase the size of the outstanding term loan to $800.0 million; (ii) extend the maturity date to November 1, 2023, with no principal payments being required before the maturity date; (iii) provide an accordion feature under which we may, subject to certain conditions set forth in the
agreement, increase the Term Loan Facility up to a maximum aggregate amount of $1.0 billion; (iv) revise certain provisions to reduce the interest rate applicable on outstanding borrowings; and (v) modify certain provisions relating to existing financial maintenance and negative covenants.
Revolving Credit Facility We have a $1.295 billion senior unsecured, five-year revolving credit facility (the “Revolving Credit Facility”) with a syndicate of banks. The commitments under the Revolving Credit Facility are scheduled to expire on May 19, 2021. Up to 50% of the commitment is available for letters of credit. The Revolving Credit Facility has an accordion feature under which we may, subject to certain conditions set forth in the agreement, increase the Revolving Credit Facility up to a maximum aggregate amount of $2.0 billion. We may select interest rates for the Revolving Credit Facility equal to (i) LIBOR plus an applicable margin or (ii) the lenders’ base rate plus an applicable margin, which in each case is based on our credit rating and leverage ratio. At October 31, 2018, the interest rate on outstanding borrowings under the Revolving Credit Facility would have been 3.80% per annum. We are obligated to pay an undrawn commitment fee that is based on the average daily unused amount of the Aggregate Credit Commitment and our credit ratings and leverage ratio. Any proceeds from borrowings under the Revolving Credit Facility may be used for general corporate purposes. We and substantially all of our 100%-owned home building subsidiaries are guarantors under the Revolving Credit Facility.
Under the terms of the Revolving Credit Facility, at October 31, 2018, our maximum leverage ratio (as defined in the credit agreement) may not exceed 1.75 to 1.00, and we are required to maintain a minimum tangible net worth (as defined in the credit agreement) of no less than approximately $2.50 billion. Under the terms of the Revolving Credit Facility, at October 31, 2018, our leverage ratio was approximately 0.54 to 1.00 and our tangible net worth was approximately $4.72 billion. Based upon the the limitations related to our repurchase of common stock in the Revolving Credit Facility, our ability to repurchase our common stock was limited to approximately $2.41 billion as of October 31, 2018. In addition, under the provisions of the Revolving Credit Facility, our ability to pay cash dividends was limited to approximately $2.22 billion as of October 31, 2018.
At October 31, 2018, we had no outstanding borrowings under the Revolving Credit Facility and had outstanding letters of credit of approximately $165.4 million.
Loans Payable – Other “Loans payable – other” primarily represent purchase money mortgages on properties we acquired that the seller had financed and various revenue bonds that were issued by government entities on our behalf to finance community infrastructure and our manufacturing facilities. Information regarding our loans payable at October 31, 2018 and 2017, is included in the table below ($ amounts in thousands):
2018 2017
Aggregate loans payable at October 31 $ 188,115 $ 139,116
Weighted-average interest rate 4.68% 4.11%
Interest rate range 1.15% - 7.87% 1.11% – 7.87%
Loans secured by assets
Carrying value of loans secured by assets $ 152,281 $ 139,116
Carrying value of assets securing loans $ 467,164 $ 483,910
The contractual maturities of “Loans payable – other” as of October 31, 2018, ranged from two months to 28 years.

TOLL BROTHERS 2018 63
Senior NotesAt October 31, 2018 and 2017, senior notes consisted of the following (amounts in thousands):
2018 2017
4.00% Senior Notes due December 31, 2018 $ 350,000 $ 350,000
6.75% Senior Notes due November 1, 2019 250,000 250,000
5.875% Senior Notes due February 15, 2022 419,876 419,876
4.375% Senior Notes due April 15, 2023 400,000 400,000
5.625% Senior Notes due January 15, 2024 250,000 250,000
4.875% Senior Notes due November 15, 2025 350,000 350,000
4.875% Senior Notes due March 15, 2027 450,000 450,000
4.35% Senior Notes due February 15, 2028 400,000 —
Bond discounts, premiums, and deferred issuance costs, net (8,501) (7,413)
$ 2,861,375 $ 2,462,463
The senior notes are the unsecured obligations of Toll Brothers Finance Corp., our 100%-owned subsidiary. The payment of principal and interest is fully and unconditionally guaranteed, jointly and severally, by us and substantially all of our 100%-owned home building subsidiaries (together with Toll Brothers Finance Corp., the “Senior Note Parties”). The senior notes rank equally in right of payment with all the Senior Note Parties’ existing and future unsecured senior indebtedness, including the Revolving Credit Facility and the Term Loan Facility. The senior notes are structurally subordinated to the prior claims of creditors, including trade creditors, of our subsidiaries that are not guarantors of the senior notes. Each series of senior notes is redeemable in whole or in part at any time at our option, at prices that vary based upon the then-current rates of interest and the remaining original term of the senior notes to be redeemed.
In January 2018, we issued $400.0 million aggregate principal amount of 4.350% Senior Notes due 2028. The Company received $396.4 million of net proceeds from the issuance of these senior notes.
In October 2017, we repaid, at maturity, the $400.0 million of then-outstanding principal amount of 8.91% Senior Notes due October 15, 2017.
On September 15, 2017, we redeemed all $287.5 million aggregate principal amount of the 0.5% Exchangeable Senior Notes for cash at a redemption price of 100% of their principal amount, plus accrued and unpaid interest. The 0.5% Exchangeable Senior Notes were exchangeable into shares of our common stock at an exchange rate of 20.3749 shares per $1,000 principal amount of notes, corresponding to an initial exchange price of approximately $49.08 per share of common stock. If all of the 0.5% Exchangeable Senior Notes were exchanged, we would have issued approximately 5.9 million shares of our common stock. Shares issuable upon conversion of the 0.5% Exchangeable Senior Notes were included in the calculation of diluted earnings per share.
In March 2017, we issued $300.0 million aggregate principal amount of 4.875% Senior Notes due 2027 (“4.875% Senior Notes due 2027”). The Company received $297.2 million of net proceeds from the issuance of these senior notes. In June 2017, we issued an additional $150.0 million principal amount of the 4.875% Senior Notes due 2027. These additional notes were issued at a premium of 103.655% of principal plus accrued interest. We received $156.4 million of net proceeds from the issuance of these additional notes.
Subsequent event On November 30, 2018, we redeemed, prior to maturity, the $350.0 million of then-outstanding principal amount of 4.00% Senior Notes due December 31, 2018, at par, plus accrued interest.
Mortgage Company Loan Facility In October 2017, TBI Mortgage® Company (“TBI Mortgage”), our wholly owned mortgage subsidiary, entered into a mortgage warehousing agreement (“Warehousing Agreement”) with a bank to finance the origination of mortgage loans by TBI Mortgage. The Warehousing Agreement is accounted for as a secured borrowing under ASC 860, “Transfers and Servicing.” In December 2017, the Warehousing Agreement was amended to provide for loan purchases up to $75.0 million, subject to certain sublimits. Prior to this amendment, the Warehousing Agreement provided for loan purchases up to $100.0 million. In addition, the Warehousing Agreement, as amended, provides for an accordion feature under which TBI Mortgage may request that the aggregate commitments under the Warehousing Agreement be increased to an amount up to $150.0 million for a short period of time. The Warehousing Agreement, as amended, expires on December 6, 2018, and borrowings thereunder bear interest at LIBOR plus 1.90% per annum. At October 31, 2018, the interest rate on the Warehousing Agreement was 4.21% per annum. In addition, we are subject to an under usage fee based on outstanding balances, as defined in the Warehousing Agreement. Borrowings under this facility are included in the fiscal 2019 maturities.
At October 31, 2018 and 2017, there were $150.0 million and $120.1 million, respectively, outstanding under the Warehousing Agreement, which are included in liabilities in our Consolidated Balance Sheets. At October 31, 2018 and 2017, amounts outstanding under the agreement were collateralized by $163.2 and $125.7 million, respectively, of mortgage loans held for sale, which are included in assets in our Consolidated Balance Sheets. As of October 31, 2018, there were no aggregate outstanding purchase price limitations reducing the amount available to TBI Mortgage. There are several restrictions on purchased loans under the agreement, including that they cannot be sold to others, they cannot be pledged to anyone other than the agent, and they cannot support any other borrowing or repurchase agreements.
Subsequent event In December 2018, TBI Mortgage amended the Warehousing Agreement. As amended, the Warehousing Agreement provides for loan purchases up to $75.0 million, expires on December 6, 2019, and provides for an accordion feature under which TBI Mortgage may request that the aggregate commitments under the Warehousing Agreement be increased to an amount up to $150.0 million for a short period of time. Borrowings will bear interest at LIBOR plus 1.90% per annum.
General As of October 31, 2018, the annual aggregate maturities of our loans and notes during each of the next five fiscal years are as follows (amounts in thousands):
Amount
2019 $ 572,488
2020 $ 259,455
2021 $ 509,281
2022 $ 430,391
2023 $ 409,947

TOLL BROTHERS 201864
7. ACCRUED EXPENSESAccrued expenses at October 31, 2018 and 2017, consisted of the following (amounts in thousands):
2018 2017
Land, land development and construction $ 213,641 $ 146,168
Compensation and employee benefits 159,374 149,145
Escrow liability 32,543 45,209
Self-insurance 168,012 149,303
Warranty 258,831 329,278
Deferred income 42,179 42,798
Interest 40,325 36,035
Commitments to unconsolidated entities 10,553 8,870
Other 48,123 52,547
$ 973,581 $ 959,353
At the time each home is closed and title and possession are transferred to the home buyer, we record an initial accrual for expected warranty costs on that home. Our initial accrual for expected warranty costs is based upon historical warranty claim experience. Adjustments to our warranty liabilities related to homes delivered in prior periods are recorded in the period in which a change in our estimate occurs. The table below provides a reconciliation of the changes in our warranty accrual during fiscal 2018, 2017, and 2016 as follows (amounts in thousands):
2018 2017 2016
Balance, beginning of year $ 329,278 $ 370,992 $ 93,083
Additions - homes closed during the year 37,045 31,798 28,927
Addition - liabilities acquired 1,495
Increase in accruals for homes closed in prior years* 6,162 6,226 26,689
Reclassification from other accruals 1,082
Increase to water intrusion reserves** 267,258
Charges incurred (113,654) (82,315) (44,965)
Balance, end of year $ 258,831 $ 329,278 $ 370,992
*The fiscal 2016 amount included (i) a charge of $9.3 million, which is included in “Cost of revenues” in our 2016 Consolidated Statement of Operations and Comprehensive Income and (ii) $17.3 million of non-water intrusion warranty charges expected to be recovered from our insurance carriers and suppliers, which we recorded as a receivable at October 31, 2016 and is included in “Receivables, prepaid expenses, and other assets” on our 2016 Consolidated Balance Sheet.
**The fiscal 2016 amount included (i) a charge of $125.6 million, which is included in “Cost of revenues” in our 2016 Consolidated Statement of Operations and Comprehensive Income and (ii) $141.7 million of water intrusion warranty charges expected to be recovered from our insurance carriers and suppliers, which we recorded as a receivable at October 31, 2016 and is included in “Receivables, prepaid expenses, and other assets” on our 2016 Consolidated Balance Sheet.
Since fiscal 2014, we have received water intrusion claims from owners of homes built since 2002 in communities located in Pennsylvania and Delaware (which are in our Mid-Atlantic region). During fiscal 2018, we continued to receive water intrusion claims from homeowners in this region, mostly related to older homes, and we continue to perform review procedures to assess, among other things, the number of affected homes, whether repairs are likely to be required, and the extent of such repairs.
Our review process, conducted quarterly, includes an analysis of many factors applicable to these communities to determine whether a claim is likely to be received and the estimated costs to resolve any such claim, including: the closing dates of the homes; the number of claims received; our inspection of homes; an estimate of the number of homes we expect to repair; the type and cost of repairs that have been performed in each community; the estimated costs to remediate pending and future claims; the expected recovery from our insurance carriers and suppliers; and the previously recorded amounts related to these claims. We also monitor legal developments relating to these types of claims and review the volume, relative merits and adjudication of claims in litigation or arbitration.
As of October 31, 2018, our recorded aggregate estimated repair costs to be incurred for known and unknown water intrusion claims was $324.4 million, which was unchanged from October 31, 2016, and our recorded aggregate expected recoveries from insurance carriers and suppliers were approximately $152.6 million, which was also unchanged from October 31, 2016. Our recorded remaining estimated repair costs, which reflects a reduction for the aggregate amount expended to resolve claims, were approximately $177.6 million at October 31, 2018 and $251.8 million at October 31, 2017. Our recorded remaining expected recoveries from insurance carriers and suppliers, were approximately $109.3 million at October 31, 2018 and $127.6 million at October 31, 2017. As noted above, our review process includes a number of estimates that are based on assumptions with uncertain outcomes, including, but not limited to, the number of homes to be repaired, the extent of repairs needed, the repair procedures employed, the cost of those repairs, outcomes of litigation or arbitrations, and expected recoveries from insurance carriers and suppliers. Due to the degree of judgment required in making these estimates and the inherent uncertainty in potential outcomes, it is reasonably possible that our actual costs and recoveries could differ from those recorded and such differences could be material. In addition, due to such uncertainty we are unable to estimate the range of any such differences. We believe collection of our recorded insurance receivables is probable based on the legal merits that support our pending insurance claims and the high credit ratings of our insurance carriers; however, due to the complexity of the underlying claims and the variability of the other factors described above, it is reasonably possible that our actual insurance recoveries could materially differ from those recorded. Resolution of these known and unknown claims is expected to take several years.

TOLL BROTHERS 2018 65
8. INCOME TAXESThe following table provides a reconciliation of our effective tax rate from the federal statutory tax rate for the fiscal years ended October 31, 2018, 2017, and 2016 ($ amounts in thousands):
2018 2017 2016$ %* $ %* $ %*
Federal tax provision at statutory rate 217,914 23.3 285,009 35.0 206,159 35.0
State tax provision, net of federal benefit 47,073 5.0 34,656 4.3 26,970 4.6
Domestic production activities deduction (18,168) (2.0) (12,835) (1.6) (16,874) (2.9)
Other permanent differences (3,726) (0.4) (1,468) (0.2) (7,037) (1.2)
Reversal of accrual for uncertain tax positions (4,741) (0.5) (3,981) (0.5) (11,177) (1.9)
Accrued interest on anticipated tax assessments 737 0.1 984 0.1 1,964 0.3
Increase in unrecognized tax benefits 1,122 0.1 — — 2,052 0.3
Valuation allowance — recognized — — — — 1,018 0.2
Valuation allowance — reversed — — (32,154) (3.9) — —
Changes in tax law (38,740) (4.1) — — — —
Excess stock compensation benefit (4,236) (0.5) — — — —
Other (11,470) (1.2) 8,605 1.1 3,857 0.7
Income tax provision* 185,765 19.9 278,816 34.2 206,932 35.1
*Due to rounding, amounts may not add.On December 22, 2017, the Tax Cuts and Jobs Act (the “Tax Act”) was enacted into law, which changed many longstanding foreign and domestic corporate and individual tax rules, as well as rules pertaining to the deductibility of employee compensation and benefits. The Tax Act, among other changes, reduced the corporate income tax rate from 35% to 21% and repealed the domestic production activities deduction effective for tax years beginning after December 31, 2017. For companies with a fiscal year that does not end on December 31, the change in law requires the application of a blended tax rate for the year of the change. Our blended tax rate for our fiscal year ending October 31, 2018 was 23.3%. Thereafter, the applicable statutory rate will be 21%. ASC 740, “Income Taxes” (“ASC 740”), requires all companies to reflect the effects of the new law in the period in which the law was enacted. Accordingly, we reduced the statutory tax rate applied to earnings from 35% in fiscal 2017 to 23.3% in fiscal 2018. In addition, we remeasured our net deferred tax liability for the tax law change, which resulted in an income tax benefit of $35.5 million in fiscal 2018.
In December 2017, the SEC staff issued Staff Accounting Bulletin No. 118 (“SAB 118”), which provides guidance on accounting for the tax effects of the Tax Act. SAB 118 provides a measurement period that should not extend beyond one year from the enactment date for companies to complete the accounting relating to the Tax Act under ASC 740. In accordance with SAB 118, a company must reflect the income tax effects of those aspects of the Tax Act for which the accounting under ASC 740 is complete. To the extent that a company’s accounting for certain income tax effects of the Tax Act is incomplete, but it is able to determine a reasonable estimate, it must record a provisional estimate in its financial statements.
In connection with our analysis of the impact of the Tax Act through the nine months ended July 31, 2018, and in accordance with SAB 118, we recorded a provisional net tax benefit of $36.2 million related to the re-measurement of our net deferred tax liability based on the rates at which our deferred tax balances are expected to reverse in the future. As of October 31, 2018, we finalized our analysis of the impact and decreased the provisional net tax benefit by $0.7 million.
We are subject to state tax in the jurisdictions in which we operate. We estimate our state tax liability based upon the individual taxing authorities’ regulations, estimates of income by taxing jurisdiction, and our ability to utilize certain tax-saving strategies. Based on our estimate of the allocation of income or loss among the various taxing jurisdictions and changes in tax regulations and their impact on our tax strategies, we estimated that our rate for state income taxes will be 6.6% in fiscal 2018. Our state income tax rate was 6.5% and 7.1% in fiscal 2017 and 2016, respectively.
The following table provides information regarding the provision (benefit) for income taxes for each of the fiscal years ended October 31, 2018, 2017, and 2016 (amounts in thousands):
2018 2017 2016
Federal $ 157,836 $ 278,095 $ 189,170
State 27,929 721 17,762
$ 185,765 $ 278,816 $ 206,932
Current $ 207,695 $ 93,106 $ 186,662
Deferred (21,930) 185,710 20,270
$ 185,765 $ 278,816 $ 206,932
The components of income taxes payable at October 31, 2018 and 2017 are set forth below (amounts in thousands):
2018 2017
Current $ 28,804 $ 33,100
Deferred 2,155 24,409
$ 30,959 $ 57,509
The following table provides a reconciliation of the change in the unrecognized tax benefits for the years ended October 31, 2018, 2017, and 2016 (amounts in thousands):
2018 2017 2016
Balance, beginning of year $ 16,993 $ 30,272 $ 51,889
Increase in benefit as a result of tax positions taken in prior years 2,140 1,575 8,110
Increase in benefit as a result of tax positions taken in current year 949 431 694
Decrease in benefit as a result of settlements (4,707) (9,174) (28,976)
Decrease in benefit as a result of lapse of statute of limitations (3,153) (6,111) (1,445)
Balance, end of year $ 12,222 $ 16,993 $ 30,272

TOLL BROTHERS 201866
The statute of limitations has expired on our federal tax returns for fiscal years through 2014.
Our unrecognized tax benefits are included in the current portion of “Income taxes payable” on our Consolidated Balance Sheets. If these unrecognized tax benefits reverse in the future, they would have a beneficial impact on our effective tax rate at that time. During the next 12 months, it is reasonably possible that the amount of unrecognized tax benefits will change, but we are not able to provide a range of such change. The anticipated changes will be principally due to the expiration of tax statutes, settlements with taxing jurisdictions, increases due to new tax positions taken, and the accrual of estimated interest and penalties.
The amounts accrued for interest and penalties are included in the current portion of “Income taxes payable” on our Consolidated Balance Sheets. The following table provides information as to the amounts recognized in our tax provision, before reduction for applicable taxes and reversal of previously accrued interest and penalties, of potential interest and penalties in the fiscal years ended October 31, 2018, 2017, and 2016, and the amounts accrued for potential interest and penalties at October 31, 2018 and 2017 (amounts in thousands):
Expense recognized in the Consolidated Statements of Operations and Comprehensive Income
Fiscal year
2018 $ 1,152
2017 $ 1,513
2016 $ 3,426
Accrued at:
October 31, 2018 $ 2,115
October 31, 2017 $ 5,179
The components of net deferred tax assets and liabilities at October 31, 2018 and 2017 are set forth below (amounts in thousands):
2018 2017
Deferred tax assets:
Accrued expenses $ 54,531 $ 88,527
Impairment charges 51,124 84,534
Inventory valuation differences 42,765 80,224
Stock-based compensation expense 27,949 41,712
Amounts related to unrecognized tax benefits 1,197 3,800
State tax, net operating loss carryforwards 73,288 48,343
Other 125 1,303
Total assets 250,979 348,443
Deferred tax liabilities:
Capitalized interest 43,982 76,914
Deferred income 181,839 261,286
Expenses taken for tax purposes not for book 5,477 9,878
Depreciation 6,877 4,694
Deferred marketing 14,959 20,080
Total liabilities 253,134 372,852
Net deferred tax liabilities (2,155) (24,409)
In accordance with GAAP, we assess whether a valuation allowance should be established based on our determination of whether it is more-likely-than-not that some portion or all of the deferred tax assets would not be realized. At October 31, 2018 and 2017, we determined that it was more-likely-than-not that our deferred assets would be realized for federal purposes. Accordingly, at October 31, 2018 and 2017, we did not have valuation allowances recorded against our federal or state deferred tax assets.
We file tax returns in the various states in which we do business. Each state has its own statutes regarding the use of tax loss carryforwards. Some of the states in which we do business do not allow for the carryforward of losses, while others allow for carryforwards for 5 years to 20 years.
For state tax purposes, we establish valuation allowances for deferred tax assets in certain jurisdictions where it is more-likely-than-not that the deferred tax asset would not be realized. Due to past and projected losses in certain jurisdictions where we did not have carryback potential and/or could not sufficiently forecast future taxable income, we recognized a net cumulative valuation allowance against our state deferred tax assets at October 31, 2016. During fiscal 2016, we recognized new valuation allowances of $1.0 million. We did not recognize any new valuation allowances in fiscal 2018 and 2017. During fiscal 2017, due to improved operating results, we reversed $32.2 million of state deferred tax asset valuation allowances. No state deferred tax asset valuation allowances were reversed in fiscal 2018 and 2016.
9. STOCKHOLDERS’ EQUITY Our authorized capital stock consists of 400 million shares of common stock, $0.01 par value per share (“common stock”), and 15 million shares of preferred stock, $0.01 par value per share. At October 31, 2018, we had 146.2 million shares of common stock issued and outstanding, 7.3 million shares of common stock reserved for outstanding stock options and restricted stock units, 5.1 million shares of common stock reserved for future stock option and award issuances, and 0.4 million shares of common stock reserved for issuance under our employee stock purchase plan. As of October 31, 2018, no shares of preferred stock have been issued.
Cash Dividends On February 21, 2017, our Board of Directors approved the initiation of quarterly cash dividends to shareholders. During the fiscal years ended October 31, 2018 and October 31, 2017, we declared and paid aggregate cash dividends of $0.41 and $0.24 per share, respectively, to our shareholders. Subsequent to October 31, 2018, we declared a quarterly cash dividend of $0.11 which will be paid on January 25, 2019 to shareholders of record on the close of business on January 11, 2019.
Stock Repurchase Program On May 23, 2016, our Board of Directors authorized, under a new repurchase program that replaced an existing program, the repurchase of 20 million shares of our common stock in open market transactions or otherwise for general corporate purposes, including to obtain shares for the Company’s equity award and other employee benefit plans. On December 13, 2017, our Board of Directors terminated our May 2016 share repurchase program and authorized, under a new repurchase program, the repurchase of 20 million shares of our common stock in open market transactions or otherwise for general corporate purposes, including to obtain shares for the Company’s equity award and other employee benefit plans. Our Board of Directors terminated, effective December 12, 2018, our December 2017 share repurchase program and authorized a new repurchase program described below.
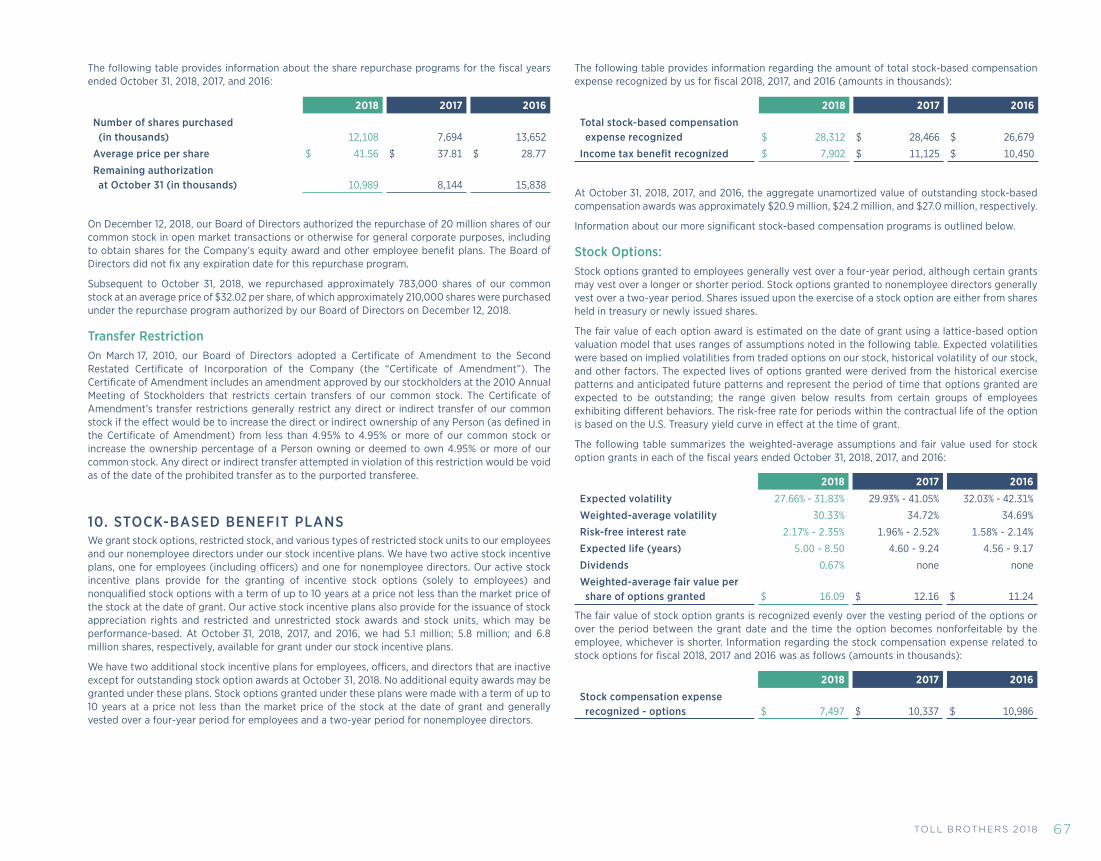
TOLL BROTHERS 2018 67
The following table provides information about the share repurchase programs for the fiscal years ended October 31, 2018, 2017, and 2016:
2018 2017 2016
Number of shares purchased (in thousands) 12,108 7,694 13,652
Average price per share $ 41.56 $ 37.81 $ 28.77
Remaining authorization at October 31 (in thousands) 10,989 8,144 15,838
On December 12, 2018, our Board of Directors authorized the repurchase of 20 million shares of our common stock in open market transactions or otherwise for general corporate purposes, including to obtain shares for the Company’s equity award and other employee benefit plans. The Board of Directors did not fix any expiration date for this repurchase program.
Subsequent to October 31, 2018, we repurchased approximately 783,000 shares of our common stock at an average price of $32.02 per share, of which approximately 210,000 shares were purchased under the repurchase program authorized by our Board of Directors on December 12, 2018.
Transfer Restriction On March 17, 2010, our Board of Directors adopted a Certificate of Amendment to the Second Restated Certificate of Incorporation of the Company (the “Certificate of Amendment”). The Certificate of Amendment includes an amendment approved by our stockholders at the 2010 Annual Meeting of Stockholders that restricts certain transfers of our common stock. The Certificate of Amendment’s transfer restrictions generally restrict any direct or indirect transfer of our common stock if the effect would be to increase the direct or indirect ownership of any Person (as defined in the Certificate of Amendment) from less than 4.95% to 4.95% or more of our common stock or increase the ownership percentage of a Person owning or deemed to own 4.95% or more of our common stock. Any direct or indirect transfer attempted in violation of this restriction would be void as of the date of the prohibited transfer as to the purported transferee.
10. STOCK-BASED BENEFIT PLANSWe grant stock options, restricted stock, and various types of restricted stock units to our employees and our nonemployee directors under our stock incentive plans. We have two active stock incentive plans, one for employees (including officers) and one for nonemployee directors. Our active stock incentive plans provide for the granting of incentive stock options (solely to employees) and nonqualified stock options with a term of up to 10 years at a price not less than the market price of the stock at the date of grant. Our active stock incentive plans also provide for the issuance of stock appreciation rights and restricted and unrestricted stock awards and stock units, which may be performance-based. At October 31, 2018, 2017, and 2016, we had 5.1 million; 5.8 million; and 6.8 million shares, respectively, available for grant under our stock incentive plans.
We have two additional stock incentive plans for employees, officers, and directors that are inactive except for outstanding stock option awards at October 31, 2018. No additional equity awards may be granted under these plans. Stock options granted under these plans were made with a term of up to 10 years at a price not less than the market price of the stock at the date of grant and generally vested over a four-year period for employees and a two-year period for nonemployee directors.
The following table provides information regarding the amount of total stock-based compensation expense recognized by us for fiscal 2018, 2017, and 2016 (amounts in thousands):
2018 2017 2016
Total stock-based compensation expense recognized $ 28,312 $ 28,466 $ 26,679
Income tax benefit recognized $ 7,902 $ 11,125 $ 10,450
At October 31, 2018, 2017, and 2016, the aggregate unamortized value of outstanding stock-based compensation awards was approximately $20.9 million, $24.2 million, and $27.0 million, respectively.
Information about our more significant stock-based compensation programs is outlined below.
Stock Options: Stock options granted to employees generally vest over a four-year period, although certain grants may vest over a longer or shorter period. Stock options granted to nonemployee directors generally vest over a two-year period. Shares issued upon the exercise of a stock option are either from shares held in treasury or newly issued shares.
The fair value of each option award is estimated on the date of grant using a lattice-based option valuation model that uses ranges of assumptions noted in the following table. Expected volatilities were based on implied volatilities from traded options on our stock, historical volatility of our stock, and other factors. The expected lives of options granted were derived from the historical exercise patterns and anticipated future patterns and represent the period of time that options granted are expected to be outstanding; the range given below results from certain groups of employees exhibiting different behaviors. The risk-free rate for periods within the contractual life of the option is based on the U.S. Treasury yield curve in effect at the time of grant.
The following table summarizes the weighted-average assumptions and fair value used for stock option grants in each of the fiscal years ended October 31, 2018, 2017, and 2016:
2018 2017 2016
Expected volatility 27.66% - 31.83% 29.93% - 41.05% 32.03% - 42.31%
Weighted-average volatility 30.33% 34.72% 34.69%
Risk-free interest rate 2.17% - 2.35% 1.96% - 2.52% 1.58% - 2.14%
Expected life (years) 5.00 - 8.50 4.60 - 9.24 4.56 - 9.17
Dividends 0.67% none none
Weighted-average fair value per share of options granted $ 16.09 $ 12.16 $ 11.24
The fair value of stock option grants is recognized evenly over the vesting period of the options or over the period between the grant date and the time the option becomes nonforfeitable by the employee, whichever is shorter. Information regarding the stock compensation expense related to stock options for fiscal 2018, 2017 and 2016 was as follows (amounts in thousands):
2018 2017 2016
Stock compensation expense recognized - options $ 7,497 $ 10,337 $ 10,986
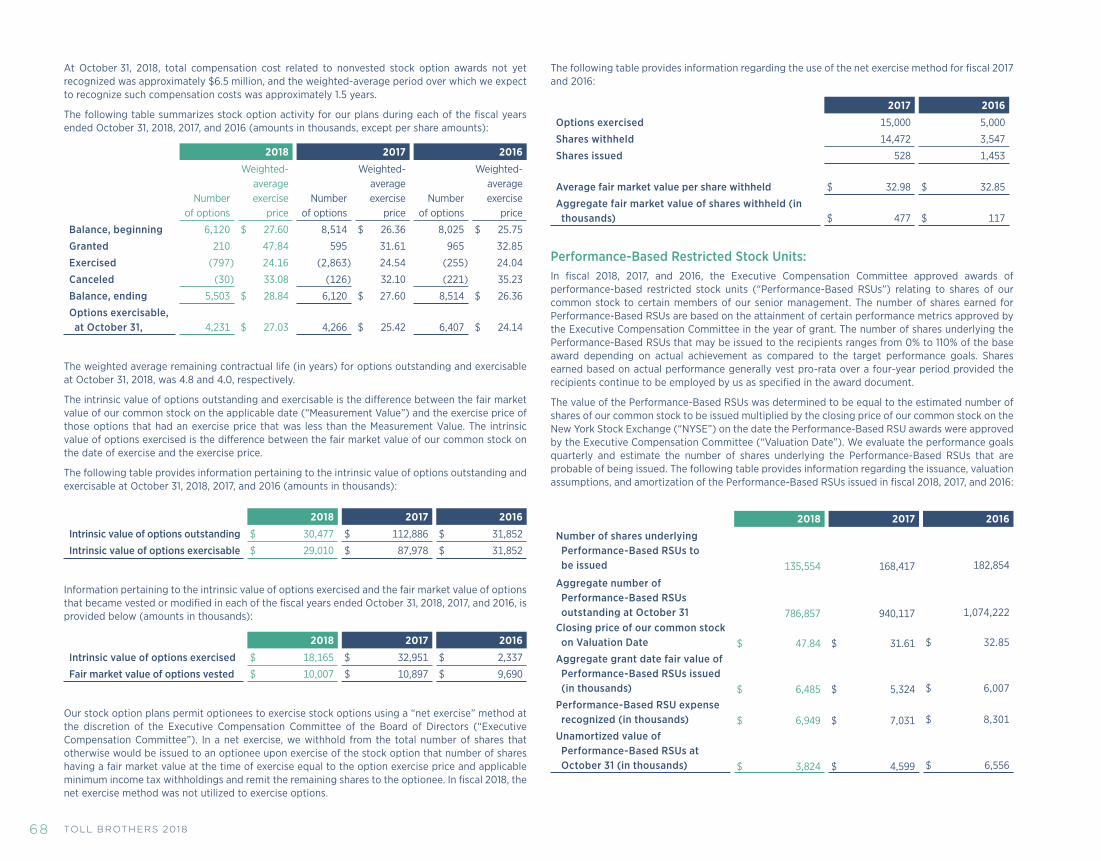
TOLL BROTHERS 201868
At October 31, 2018, total compensation cost related to nonvested stock option awards not yet recognized was approximately $6.5 million, and the weighted-average period over which we expect to recognize such compensation costs was approximately 1.5 years.
The following table summarizes stock option activity for our plans during each of the fiscal years ended October 31, 2018, 2017, and 2016 (amounts in thousands, except per share amounts):
2018 2017 2016
Number of options
Weighted-average exercise
priceNumber
of options
Weighted-average exercise
priceNumber
of options
Weighted-average exercise
price
Balance, beginning 6,120 $ 27.60 8,514 $ 26.36 8,025 $ 25.75
Granted 210 47.84 595 31.61 965 32.85
Exercised (797) 24.16 (2,863) 24.54 (255) 24.04
Canceled (30) 33.08 (126) 32.10 (221) 35.23
Balance, ending 5,503 $ 28.84 6,120 $ 27.60 8,514 $ 26.36
Options exercisable, at October 31, 4,231 $ 27.03 4,266 $ 25.42 6,407 $ 24.14
The weighted average remaining contractual life (in years) for options outstanding and exercisable at October 31, 2018, was 4.8 and 4.0, respectively.
The intrinsic value of options outstanding and exercisable is the difference between the fair market value of our common stock on the applicable date (“Measurement Value”) and the exercise price of those options that had an exercise price that was less than the Measurement Value. The intrinsic value of options exercised is the difference between the fair market value of our common stock on the date of exercise and the exercise price.
The following table provides information pertaining to the intrinsic value of options outstanding and exercisable at October 31, 2018, 2017, and 2016 (amounts in thousands):
2018 2017 2016
Intrinsic value of options outstanding $ 30,477 $ 112,886 $ 31,852
Intrinsic value of options exercisable $ 29,010 $ 87,978 $ 31,852
Information pertaining to the intrinsic value of options exercised and the fair market value of options that became vested or modified in each of the fiscal years ended October 31, 2018, 2017, and 2016, is provided below (amounts in thousands):
2018 2017 2016
Intrinsic value of options exercised $ 18,165 $ 32,951 $ 2,337
Fair market value of options vested $ 10,007 $ 10,897 $ 9,690
Our stock option plans permit optionees to exercise stock options using a “net exercise” method at the discretion of the Executive Compensation Committee of the Board of Directors (“Executive Compensation Committee”). In a net exercise, we withhold from the total number of shares that otherwise would be issued to an optionee upon exercise of the stock option that number of shares having a fair market value at the time of exercise equal to the option exercise price and applicable minimum income tax withholdings and remit the remaining shares to the optionee. In fiscal 2018, the net exercise method was not utilized to exercise options.
The following table provides information regarding the use of the net exercise method for fiscal 2017 and 2016:
2017 2016
Options exercised 15,000 5,000
Shares withheld 14,472 3,547
Shares issued 528 1,453
Average fair market value per share withheld $ 32.98 $ 32.85
Aggregate fair market value of shares withheld (in thousands) $ 477 $ 117
Performance-Based Restricted Stock Units: In fiscal 2018, 2017, and 2016, the Executive Compensation Committee approved awards of performance-based restricted stock units (“Performance-Based RSUs”) relating to shares of our common stock to certain members of our senior management. The number of shares earned for Performance-Based RSUs are based on the attainment of certain performance metrics approved by the Executive Compensation Committee in the year of grant. The number of shares underlying the Performance-Based RSUs that may be issued to the recipients ranges from 0% to 110% of the base award depending on actual achievement as compared to the target performance goals. Shares earned based on actual performance generally vest pro-rata over a four-year period provided the recipients continue to be employed by us as specified in the award document.
The value of the Performance-Based RSUs was determined to be equal to the estimated number of shares of our common stock to be issued multiplied by the closing price of our common stock on the New York Stock Exchange (“NYSE”) on the date the Performance-Based RSU awards were approved by the Executive Compensation Committee (“Valuation Date”). We evaluate the performance goals quarterly and estimate the number of shares underlying the Performance-Based RSUs that are probable of being issued. The following table provides information regarding the issuance, valuation assumptions, and amortization of the Performance-Based RSUs issued in fiscal 2018, 2017, and 2016:
2013 2018 2017 2016
Number of shares underlying Performance-Based RSUs to be issued 135,554 168,417 182,854
Aggregate number of Performance-Based RSUs outstanding at October 31 786,857 940,117 1,074,222
Closing price of our common stock on Valuation Date $ 47.84 $ 31.61 $ 32.85
Aggregate grant date fair value of Performance-Based RSUs issued (in thousands) $ 6,485 $ 5,324 $ 6,007
Performance-Based RSU expense recognized (in thousands) $ 6,949 $ 7,031 $ 8,301
Unamortized value of Performance-Based RSUs at October 31 (in thousands) $ 3,824 $ 4,599 $ 6,556

TOLL BROTHERS 2018 69
Shares earned with respect to Performance-Based RSUs issued in December 2011, 2012, and 2013 were delivered in fiscal 2016, 2017, and 2018, respectively. The recipients of these Performance-Based RSUs elected to use a portion of the shares underlying the Performance-Based RSUs to pay the required income withholding taxes on the payout. In fiscal 2018, the gross value of the payout was $13.7 million (288,814 shares), the minimum income tax withholding was $6.0 million (126,330 shares) and the net value of the shares delivered was $7.7 million (162,484 shares). In fiscal 2017, the gross value of the payout was $9.6 million (302,514 shares), the minimum income tax withholding was $4.2 million (133,098 shares) and the net value of the shares delivered was $5.4 million (169,416 shares). In fiscal 2016, the gross value of the payout was $12.2 million (370,171 shares), the minimum income tax withholding was $5.4 million (164,090 shares) and the net value of the shares delivered was $6.8 million (206,081 shares).
Total Shareholder Return Restricted Stock Units: In fiscal 2018, 2017, and 2016, the Executive Compensation Committee approved awards of relative total shareholder return performance-based restricted stock units (“TSR RSUs”) relating to 39,411, 46,361 and 171,705 target shares, respectively, of our common stock to certain members of our senior management. Shares underlying the TSR RSUs granted are earned by comparing our total shareholder return during specified performance periods to the total shareholder returns of companies in a performance peer group as defined in the award document. The specified performance periods are as follows:
Performance Period Target Number of TSR RSUs issued
Fiscal 2018 November 1, 2017 to October 31, 2020 39,411
Fiscal 2017 November 1, 2016 to October 31, 2019 46,361
Fiscal 2016
Tranche 1 (one-year) November 1, 2015 to October 31, 2016 61,796
Tranche 2 (two-year) November 1, 2015 to October 31, 2017 57,230
Tranche 3 (three-year) November 1, 2015 to October 31, 2018 52,679
The TSR RSUs generally vest at the end of a three-year period provided the recipients continue to be employed by us as specified in the award document. Based upon our ranking in the performance peer group, the recipient of the TSR RSUs may earn a total award ranging from 0% to 200% of the target number of TSR RSUs granted. In fiscal 2018, recipients of Tranche 3 TSR RSUs earned 76.81% of the target based upon our total shareholder return ranking in the performance peer group during the three-year period ended October 31, 2018. In fiscal 2017, recipients of Tranche 2 TSR RSUs earned 83.05% of the target based upon our total shareholder return ranking in the performance peer group during the two-year period ended October 31, 2017. In fiscal 2016, recipients of Tranche 1 TSR RSUs earned 0% of the target based upon our total shareholder return ranking in the performance peer group during the one-year period ended October 31, 2016.
We estimated the fair value of the TSR RSUs at the grant date using a Monte Carlo simulation. The following table summarizes the assumptions used in the Monte Carlo simulation and the fair value per share of the TSR RSUs granted in fiscal 2018, 2017, and 2016:
2018 2017 2016
Weighted-average volatility 26.58% 26.91% 28.66%
Risk-free interest rate 1.92% 1.52% 1.23%
Dividends none none none
Weighted-average fair value per share of TSR RSUs $ 52.62 $ 39.21 $ 41.16
The length of each performance period was used as the expected term in the simulation for each respective tranche.
The following table provides information on expense recognized and the unamortized value of our TSR RSUs for fiscal 2018, 2017, and 2016 (amounts in thousands):
2018 2017 2016
TSR RSUs expense recognized $ 2,502 $ 3,400 $ 3,300
Unamortized value of TSR RSUs at October 31 $ 1,773 $ 2,200 $ 3,800
Time-Based Restricted Stock Units: In fiscal 2018, 2017, and 2016, we issued time-based restricted stock units (“RSUs”) to various officers, employees, and nonemployee directors. These RSUs generally vest in annual installments over a two- to four-year period. The value of the RSUs was determined to be equal to the number of shares of our common stock underlying the RSUs multiplied by the closing price of our common stock on the NYSE on the date the RSUs were awarded. The following table provides information regarding these RSUs for fiscal 2018, 2017, and 2016:
2018 2017 2016
Time-Based RSUs issued:
Number of RSUs issued 296,790 377,564 139,684
Weighted average closing price per share of our common stock on date of issuance $ 47.84 $ 31.61 $ 32.85
Aggregate fair value of RSUs issued (in thousands) $ 14,198 $ 11,935 $ 4,589
Time-Based RSU expense recognized (in thousands) $ 11,193 $ 7,572 $ 3,958
2018 2017 2016
At October 31:
Aggregate number of Time-Based RSUs outstanding 850,853 673,224 396,716
Cumulative unamortized value of Time-Based RSUs (in thousands) $ 8,818 $ 6,783 $ 2,956

TOLL BROTHERS 201870
Our stock incentive plans permit us to withhold from the total number of shares that otherwise would be issued to a restricted stock unit recipient upon distribution that number of shares having a fair value at the time of distribution equal to the applicable income tax withholdings due and remit the remaining shares to the restricted stock unit recipient. The following table provides information regarding the number of shares withheld, the income tax withholding due, and the remaining shares issued to the recipients for fiscal 2018, 2017, and 2016:
2018 2017 2016
Number of shares withheld 23,289 20,400 25,340
Income tax withholdings due $ 1,145 $ 664,300 $ 827,800
Remaining shares issued to the recipients 58,552 52,757 70,627
Employee Stock Purchase Plan Our employee stock purchase plan enables substantially all employees to purchase our common stock at 95% of the market price of the stock on specified offering dates without restriction or at 85% of the market price of the stock on specified offering dates subject to restrictions. The plan, which terminates in December 2027, provides that 500,000 shares be reserved for purchase. At October 31, 2018, 448,000 shares were available for issuance.
The following table provides information regarding our employee stock purchase plan for fiscal 2018, 2017, and 2016:
2018 2017 2016
Shares issued 35,471 33,314 36,778
Average price per share $ 34.08 $ 32.25 $ 25.97
Compensation expense recognized (in thousands) $ 171 $ 147 $ 129
11. EARNINGS PER SHARE INFORMATIONInformation pertaining to the calculation of earnings per share for each of the fiscal years ended October 31, 2018, 2017, and 2016, is as follows (amounts in thousands):
2018 2017 2016
Numerator:Net income as reported $ 748,151 $ 535,495 $ 382,095
Plus: Interest and costs attributable to 0.5% Exchangeable Senior Notes, net of income tax benefit (a) 1,434 1,538
Numerator for diluted earnings per share $ 748,151 $ 536,929 $ 383,633
Denominator:Basic weighted-average shares 151,984 162,222 168,261
Common stock equivalents (b) 2,217 2,147 1,854
Shares attributable to 0.5% Exchangeable Senior Notes (a) 5,118 5,858
Diluted weighted-average shares 154,201 169,487 175,973
Other information:Weighted-average number of antidilutive options and restricted stock units (c) 813 1,966 3,932
Shares issued under stock incentive and employee stock purchase plans 1,066 3,116 587
(a) On September 15, 2017, we redeemed these notes.(b) Common stock equivalents represent the dilutive effect of outstanding in-the-money stock options using the
treasury stock method and shares expected to be issued under our restricted stock units programs.(c) Weighted-average number of antidilutive options and restricted stock units are based upon the average of
the average quarterly closing prices of our common stock on the NYSE for the year.
12. FAIR VALUE DISCLOSURES
Financial Instruments A summary of assets and (liabilities) at October 31, 2018 and 2017, related to our financial instruments, measured at fair value on a recurring basis, is set forth below (amounts in thousands):
Fair Value
Financial InstrumentFair value hierarchy October 31, 2018 October 31, 2017
Residential Mortgage Loans Held for Sale Level 2 $ 170,731 $ 132,922
Forward Loan Commitments – Residential Mortgage Loans Held for Sale Level 2 $ 1,750 $ 861
Interest Rate Lock Commitments (“IRLCs”) Level 2 $ (4,366) $ (1,293)
Forward Loan Commitments – IRLCs Level 2 $ 4,366 $ 1,293
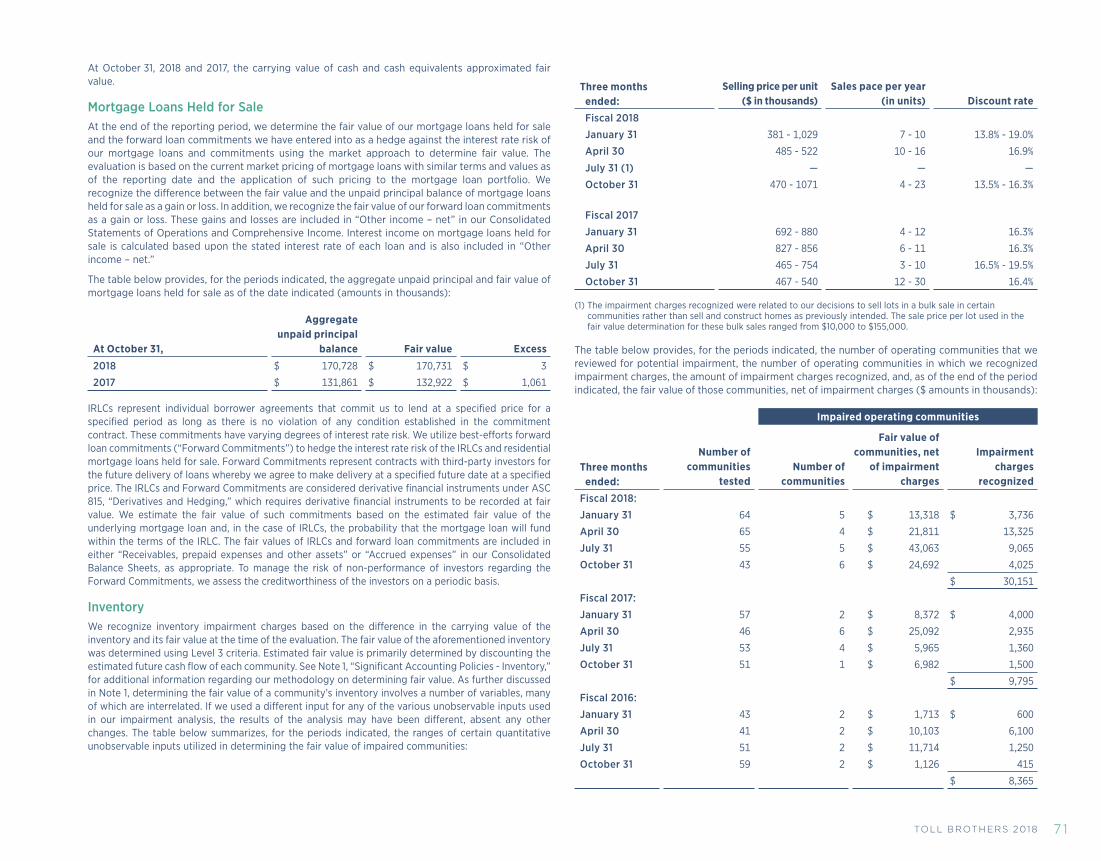
TOLL BROTHERS 2018 7 1
At October 31, 2018 and 2017, the carrying value of cash and cash equivalents approximated fair value.
Mortgage Loans Held for Sale At the end of the reporting period, we determine the fair value of our mortgage loans held for sale and the forward loan commitments we have entered into as a hedge against the interest rate risk of our mortgage loans and commitments using the market approach to determine fair value. The evaluation is based on the current market pricing of mortgage loans with similar terms and values as of the reporting date and the application of such pricing to the mortgage loan portfolio. We recognize the difference between the fair value and the unpaid principal balance of mortgage loans held for sale as a gain or loss. In addition, we recognize the fair value of our forward loan commitments as a gain or loss. These gains and losses are included in “Other income – net” in our Consolidated Statements of Operations and Comprehensive Income. Interest income on mortgage loans held for sale is calculated based upon the stated interest rate of each loan and is also included in “Other income – net.”
The table below provides, for the periods indicated, the aggregate unpaid principal and fair value of mortgage loans held for sale as of the date indicated (amounts in thousands):
At October 31,
Aggregate unpaid principal
balance Fair value Excess
2018 $ 170,728 $ 170,731 $ 3
2017 $ 131,861 $ 132,922 $ 1,061
IRLCs represent individual borrower agreements that commit us to lend at a specified price for a specified period as long as there is no violation of any condition established in the commitment contract. These commitments have varying degrees of interest rate risk. We utilize best-efforts forward loan commitments (“Forward Commitments”) to hedge the interest rate risk of the IRLCs and residential mortgage loans held for sale. Forward Commitments represent contracts with third-party investors for the future delivery of loans whereby we agree to make delivery at a specified future date at a specified price. The IRLCs and Forward Commitments are considered derivative financial instruments under ASC 815, “Derivatives and Hedging,” which requires derivative financial instruments to be recorded at fair value. We estimate the fair value of such commitments based on the estimated fair value of the underlying mortgage loan and, in the case of IRLCs, the probability that the mortgage loan will fund within the terms of the IRLC. The fair values of IRLCs and forward loan commitments are included in either “Receivables, prepaid expenses and other assets” or “Accrued expenses” in our Consolidated Balance Sheets, as appropriate. To manage the risk of non-performance of investors regarding the Forward Commitments, we assess the creditworthiness of the investors on a periodic basis.
Inventory We recognize inventory impairment charges based on the difference in the carrying value of the inventory and its fair value at the time of the evaluation. The fair value of the aforementioned inventory was determined using Level 3 criteria. Estimated fair value is primarily determined by discounting the estimated future cash flow of each community. See Note 1, “Significant Accounting Policies - Inventory,” for additional information regarding our methodology on determining fair value. As further discussed in Note 1, determining the fair value of a community’s inventory involves a number of variables, many of which are interrelated. If we used a different input for any of the various unobservable inputs used in our impairment analysis, the results of the analysis may have been different, absent any other changes. The table below summarizes, for the periods indicated, the ranges of certain quantitative unobservable inputs utilized in determining the fair value of impaired communities:
Three months ended:
Selling price per unit ($ in thousands)
Sales pace per year (in units) Discount rate
Fiscal 2018
January 31 381 - 1,029 7 - 10 13.8% - 19.0%
April 30 485 - 522 10 - 16 16.9%
July 31 (1) — — —
October 31 470 - 1071 4 - 23 13.5% - 16.3%
Fiscal 2017
January 31 692 - 880 4 - 12 16.3%
April 30 827 - 856 6 - 11 16.3%
July 31 465 - 754 3 - 10 16.5% - 19.5%
October 31 467 - 540 12 - 30 16.4%
(1) The impairment charges recognized were related to our decisions to sell lots in a bulk sale in certain communities rather than sell and construct homes as previously intended. The sale price per lot used in the fair value determination for these bulk sales ranged from $10,000 to $155,000.
The table below provides, for the periods indicated, the number of operating communities that we reviewed for potential impairment, the number of operating communities in which we recognized impairment charges, the amount of impairment charges recognized, and, as of the end of the period indicated, the fair value of those communities, net of impairment charges ($ amounts in thousands):
Impaired operating communities
Three months ended:
Number of communities
testedNumber of
communities
Fair value of communities, net
of impairment charges
Impairment charges
recognized
Fiscal 2018:
January 31 64 5 $ 13,318 $ 3,736
April 30 65 4 $ 21,811 13,325
July 31 55 5 $ 43,063 9,065
October 31 43 6 $ 24,692 4,025
$ 30,151
Fiscal 2017:
January 31 57 2 $ 8,372 $ 4,000
April 30 46 6 $ 25,092 2,935
July 31 53 4 $ 5,965 1,360
October 31 51 1 $ 6,982 1,500
$ 9,795
Fiscal 2016:
January 31 43 2 $ 1,713 $ 600
April 30 41 2 $ 10,103 6,100
July 31 51 2 $ 11,714 1,250
October 31 59 2 $ 1,126 415
$ 8,365

TOLL BROTHERS 201872
Debt The table below provides, as of the dates indicated, the book value and estimated fair value of our debt at October 31, 2018 and 2017 (amounts in thousands):
2018 2017 Fair value hierarchy
Book value
Estimated fair value
Book value
Estimated fair value
Loans payable (a) Level 2 $ 688,115 $ 687,974 $ 639,116 $ 639,088
Senior notes (b) Level 1 2,869,876 2,779,270 2,469,876 2,626,131
Mortgage company loan facility (c) Level 2 150,000 150,000 120,145 120,145
$3,707,991 $ 3,617,244 $ 3,229,137 $ 3,385,364
(a) The estimated fair value of loans payable was based upon contractual cash flows discounted at interest rates that we believed were available to us for loans with similar terms and remaining maturities as of the applicable valuation date.
(b) The estimated fair value of our senior notes is based upon their market prices as of the applicable valuation date.
(c) We believe that the carrying value of our mortgage company loan borrowings approximates their fair value.
13. EMPLOYEE RETIREMENT AND DEFERRED COMPENSATION PLANS
Salary Deferral Savings Plans We maintain salary deferral savings plans covering substantially all employees. We recognized an expense, net of plan forfeitures, with respect to the plans of $12.6 million, $12.3 million, and $10.3 million for the fiscal years ended October 31, 2018, 2017, and 2016, respectively.
Deferred Compensation Plan We have an unfunded, nonqualified deferred compensation plan that permits eligible employees to defer a portion of their compensation. The deferred compensation, together with certain of our contributions, earns various rates of return depending upon when the compensation was deferred. A portion of the deferred compensation and interest earned may be forfeited by a participant if he or she elects to withdraw the compensation prior to the end of the deferral period. We accrued $27.0 million and $23.2 million at October 31, 2018 and 2017, respectively, for our obligations under the plan.
Defined Benefit Retirement Plans We have two unfunded defined benefit retirement plans. Retirement benefits generally vest when the participant reaches normal retirement age (age 62). Unrecognized prior service costs are being amortized over the period from the date participants enter the plans until their interests are fully vested. We used a 4.06%, 3.19%, and 2.98% discount rate in our calculation of the present value of our projected benefit obligations at October 31, 2018, 2017, and 2016, respectively. The rates represent the approximate long-term investment rate at October 31 of the fiscal year for which the present value was calculated. Information related to the plans is based on actuarial information calculated as of October 31, 2018, 2017 and 2016.
Information related to our retirement plans for each of the fiscal years ended October 31, 2018, 2017, and 2016, is as follows (amounts in thousands):
2018 2017 2016
Plan costs:
Service cost $ 568 $ 619 $ 562Interest cost 1,198 1,142 1,276
Amortization of prior service cost 936 969 947
Amortization of unrecognized losses 17 137 42
$ 2,719 $ 2,867 $ 2,827
Projected benefit obligation:
Beginning of year $ 38,222 $ 38,980 $ 35,815
Plan amendments adopted during year 757
Service cost 568 619 562
Interest cost 1,198 1,142 1,276
Benefit payments (1,358) (1,318) (1,129)
Change in unrecognized gain/loss (3,115) (1,201) 1,699
Projected benefit obligation, end of year $ 35,515 $ 38,222 $ 38,980
Unamortized prior service cost:
Beginning of year $ 1,806 $ 2,775 $ 2,965
Plan amendments adopted during year 757
Amortization of prior service cost (936) (969) (947)
Unamortized prior service cost, end of year $ 870 $ 1,806 $ 2,775
Accumulated unrecognized gain (loss), October 31 $ 1,571 $ (1,560) $ (2,898)
Accumulated benefit obligation, October 31 $ 35,515 $ 38,222 $ 38,980
Accrued benefit obligation, October 31 $ 35,515 $ 38,222 $ 38,980
The accrued benefit obligation is included in accrued expenses on our Consolidated Balance Sheets.
The table below provides, based upon the estimated retirement dates of the participants in the retirement plans, the amounts of benefits we would be required to pay in each of the next five fiscal years and for the five fiscal years ended October 31, 2028 in the aggregate (in thousands):
Year ending October 31, Amount
2019 $ 1,363
2020 $ 2,386
2021 $ 2,702
2022 $ 2,893
2023 $ 2,993
November 1, 2023 – October 31, 2028 $ 15,981

TOLL BROTHERS 2018 73
14. ACCUMULATED OTHER COMPREHENSIVE INCOME (LOSS)
Accumulated other comprehensive income (loss) was primarily related to employee retirement plans. The tables below provide, for the fiscal years ended October 31, 2018, 2017 and 2016, the components of accumulated other comprehensive income (loss) (amounts in thousands):
2018 2017 2016
Balance, beginning of period $ (1,910) $ (3,336) $ (2,509)
Other comprehensive income (loss) before reclassifications 3,115 1,201 (2,406)
Gross amounts reclassified from accumulated other comprehensive income 953 1,105 989
Income tax (expense) benefit (1,142) (880) 590
Other comprehensive income (loss) , net of tax 2,926 1,426 (827)
Adoption of ASU 2018-02 (322)
Balance, end of period $ 694 $ (1,910) $ (3,336)
During the first quarter of fiscal 2018, we elected to reclassify the stranded tax effects resulting from the Tax Act related to employee retirement plans from accumulated other comprehensive income to retained earnings. See Note 1, “Significant Accounting Polices,” for additional information regarding the adoption of ASU 2018-02.
Reclassifications for the amortization of the employee retirement plans are included in “Other Income – Net” in the Consolidated Statements of Operations and Comprehensive Income.
15. COMMITMENTS AND CONTINGENCIES
Legal Proceedings We are involved in various claims and litigation arising principally in the ordinary course of business. We believe that adequate provision for resolution of all current claims and pending litigation has been made and that the disposition of these matters will not have a material adverse effect on our results of operations and liquidity or on our financial condition.
In April 2017, the SEC informed the Company that it was conducting an investigation and requested that we voluntarily produce documents and information relating to our estimated repair costs for stucco and other water intrusion claims in fiscal 2016. The Company produced detailed information and documents in response to this request and, in the fourth quarter of fiscal 2018, the SEC notified the Company that it had concluded its investigation without action. See Note 7 – “Accrued Expenses” for additional information regarding these warranty charges.
In March 2018, the Pennsylvania Attorney General informed the Company that it was conducting a review of our construction of stucco homes in Pennsylvania after January 1, 2005 and requested that we voluntarily produce documents and information. The Company is producing documents and information in response to this request. Management cannot at this time predict the eventual scope or outcome of this matter.
Land Purchase Commitments Generally, our purchase agreements to acquire land parcels do not require us to purchase those land parcels, although we, in some cases, forfeit any deposit balance outstanding if and when we terminate a purchase agreement. If market conditions are weak, approvals needed to develop the land are uncertain, or other factors exist that make the purchase undesirable, we may choose not to
acquire the land. Whether a purchase agreement is legally terminated or not, we review the amount recorded for the land parcel subject to the purchase agreement to determine whether the amount is recoverable. While we may not have formally terminated the purchase agreements for those land parcels that we do not expect to acquire, we write off any nonrefundable deposits and costs previously capitalized to such land parcels in the periods that we determine such costs are not recoverable.
Information regarding our land purchase commitments at October 31, 2018 and 2017, is provided in the table below (amounts in thousands):
2013 2018 2017Aggregate purchase commitments:
Unrelated parties $ 2,404,660 $ 1,986,276
Unconsolidated entities that the Company has investments in 128,235 248,801
Total $ 2,532,895 $ 2,235,077
Deposits against aggregate purchase commitments $ 168,421 $ 97,706
Credits to be received from unconsolidated entities $ 79,168 $ 134,630
Additional cash required to acquire land 2,285,306 2,002,741
Total $ 2,532,895 $ 2,235,077
Amount of additional cash required to acquire land included in accrued expenses $ 40,103 $ 4,329
In addition, we expect to purchase approximately 2,700 additional home sites over a number of years from several joint ventures in which we have investments; the purchase prices of these home sites will be determined at a future date.
At October 31, 2018, we also had purchase commitments to acquire land for apartment developments of approximately $272.6 million, of which we had outstanding deposits in the amount of $13.2 million.
We have additional land parcels under option that have been excluded from the aforementioned aggregate purchase amounts since we do not believe that we will complete the purchase of these land parcels and no additional funds will be required from us to terminate these contracts.
Investments in Unconsolidated Entities At October 31, 2018, we had investments in a number of unconsolidated entities, were committed to invest or advance additional funds, and had guaranteed a portion of the indebtedness and/or loan commitments of these entities. See Note 4, “Investments in Unconsolidated Entities,” for more information regarding our commitments to these entities.
Surety Bonds and Letters of Credit At October 31, 2018, we had outstanding surety bonds amounting to $692.9 million, primarily related to our obligations to governmental entities to construct improvements in our communities. We estimate that $342.2 million of work remains on these improvements. We have an additional $160.2 million of surety bonds outstanding that guarantee other obligations. We do not believe it is probable that any outstanding bonds will be drawn upon.
At October 31, 2018, we had outstanding letters of credit of $165.4 million under our Revolving Credit Facility. These letters of credit were issued to secure our various financial obligations, including insurance policy deductibles and other claims, land deposits, and security to complete improvements in communities in which we are operating. We do not believe that it is probable that any outstanding letters of credit will be drawn upon.

TOLL BROTHERS 201874
Backlog At October 31, 2018, we had agreements of sale outstanding to deliver 6,105 homes with an aggregate sales value of $5.52 billion.
Mortgage Commitments Our mortgage subsidiary provides mortgage financing for a portion of our home closings. For those home buyers to whom our mortgage subsidiary provides mortgages, we determine whether the home buyer qualifies for the mortgage based upon information provided by the home buyer and other sources. For those home buyers who qualify, our mortgage subsidiary provides the home buyer with a mortgage commitment that specifies the terms and conditions of a proposed mortgage loan based upon then-current market conditions. Prior to the actual closing of the home and funding of the mortgage, the home buyer will lock in an interest rate based upon the terms of the commitment. At the time of rate lock, our mortgage subsidiary agrees to sell the proposed mortgage loan to one of several outside recognized mortgage financing institutions (“investors”) that is willing to honor the terms and conditions, including interest rate, committed to the home buyer. We believe that these investors have adequate financial resources to honor their commitments to our mortgage subsidiary.
Information regarding our mortgage commitments at October 31, 2018 and 2017, is provided in the table below (amounts in thousands):
2018 2017
Aggregate mortgage loan commitments:
IRLCs $ 614,255 $ 350,740
Non-IRLCs 1,329,674 1,146,872
Total $ 1,943,929 $ 1,497,612
Investor commitments to purchase:
IRLCs $ 614,255 $ 350,740
Mortgage loans receivable 163,208 125,710
Total $ 777,463 $ 476,450
Lease CommitmentsWe lease certain facilities and equipment under non-cancelable operating leases. Rental expenses incurred by us under these operating leases were (amounts in thousands):
Year ending October 31, Amount
2018 $ 15,783
2017 $ 14,505
2016 $ 12,584
At October 31, 2018, future minimum rent payments under our operating leases were (amounts in thousands):
Year ending October 31, Amount
2019 $ 12,712
2020 7,727
2021 5,843
2022 3,883
2023 1,824
Thereafter 1,682
$ 33,671
Subsequent event In December 2018, we signed a 16-year lease agreement to lease approximately 163,000 square feet of office space in Fort Washington, Pennsylvania for our new corporate headquarters. The terms of the lease require annual minimum lease payments starting at $2.8 million which escalate throughout the lease term. The lease for our current headquarters expires in October 2019. The new headquarters is located approximately four miles from our current headquarters.
16. OTHER INCOME – NET The table below provides the components of “Other income – net” for the years ended October 31, 2018, 2017, and 2016 (amounts in thousands):
2018 2017 2016
Interest income $ 8,570 $ 5,988 $ 2,443
Income from ancillary businesses 25,692 18,934 24,119
Management fee income from home building unconsolidated entities, net 11,740 12,902 10,270
Retained customer deposits 8,937 5,801 5,866
Income from land and other sales 6,331 8,621 13,327
Other 1,190 (1,184) (71)
Total other income – net $ 62,460 $ 51,062 $ 55,954
Management fee income from home building unconsolidated entities presented above primarily represents fees earned by our City Living and Traditional Home Building operations. In addition, in fiscal 2018, 2017 and 2016, our apartment living operations earned fees from unconsolidated entities of $7.5 million, $6.2 million, and $6.1 million, respectively. Fees earned by our apartment living operations are included in income from ancillary businesses above.
In fiscal 2018, our security monitoring business recognized a $10.7 million gain from a bulk sale of security monitoring accounts by our home control solutions business, which is included in income from ancillary businesses above. In addition, in fiscal 2018, we recognized a $3.5 million write-down of a commercial property operated by Toll Brothers Apartment Living, which is included in income from ancillary businesses above. In fiscal 2016, our security monitoring business recognized a gain of $1.6 million from a bulk sale of security monitoring accounts in fiscal 2015, which is included in income from ancillary businesses above.
As discussed in Note 1, “Significant Accounting Policies,” as a result of our adoption of ASU 2017-07 on November 1, 2017, pension costs, other than service costs, are included in “Other” above. We reclassified costs totaling $2.2 million and $2.3 million in fiscal 2017 and 2016, respectively, due to this adoption.
Income from ancillary businesses is generated by our mortgage, title, landscaping, security monitoring, Gibraltar, apartment living, and golf course and country club operations. The table below provides revenues and expenses for these ancillary businesses for the years ended October 31, 2018, 2017, and 2016 (amounts in thousands):
2018 2017 2016
Revenue $ 158,051 $ 134,116 $ 126,741
Expense $ 132,359 $ 115,182 $ 102,622

TOLL BROTHERS 2018 75
The table below provides revenues and expenses recognized from land sales for the years ended October 31, 2018, 2017, and 2016 (amounts in thousands):
2018 2017 2016
Revenue $ 134,327 $ 284,928 $ 85,268
Expense (124,162) (278,034) (70,488)
Deferred gains on land sales to joint ventures (3,834) (2,996) (2,999)
Deferred gains recognized 4,723 1,546
$ 6,331 $ 8,621 $ 13,327
Land sale revenues for the year ended October 31, 2018 included $80.3 million related to sale transactions with four new Rental Property Joint Ventures in which we have interests ranging from 25% to 50%. On one of these transactions, we recognized a gain of $1.0 million in fiscal 2018. In addition, due to our continued involvement in the joint venture primarily through guarantees provided on the joint venture’s debt, we deferred $3.8 million of the gain realized on this sale. We will recognize the deferred gain into income as the guarantees provided expire.
Land sale revenues for the year ended October 31, 2017 included $257.8 million related to sale transactions with two new Home Building Joint Ventures and a Rental Property Joint Venture in which we have interests ranging from 20% to 25%. No gain or loss was realized on the sales related to the Home Building Joint Ventures. Due to our continued involvement in the new Rental Property Joint Venture through our retained ownership interest and guarantees provided on the joint venture’s debt, we deferred the $3.0 million gain realized on this sale. We will recognize the deferred gain into income as the guarantees provided expire and when we sell our ownership interest in the Rental Property Joint Venture.
Land sale revenues for the year ended October 31, 2016 included $38.1 million related to a sale transaction with a new Rental Property Joint Venture in which we have a 50% interest. Due to our continued involvement in the joint venture through our ownership interest, we deferred 50% of the gain realized on the sale of $3.0 million. We will recognize the deferred gain into income when we sell our ownership interest in the Rental Property Joint Venture.
The deferred gains recognized in the fiscal 2017 and 2016 periods relate to the sale of a property in fiscal 2015 to a Home Building Joint Venture in which we had a 25% interest. Due to our continued involvement in this unconsolidated entity through our ownership interest and guarantees provided on the entity’s debt, we deferred the $9.3 million gain realized on the sale. We recognized the gain as units were sold to the ultimate home buyers which is included in deferred gains recognized above. In the fourth quarter of fiscal 2017, we purchased the remaining inventory from this Home Building Joint Venture. The remaining unamortized deferred gain was used to reduce the basis of the inventory acquired.
See Note 4, “Investments in Unconsolidated Entities,” for more information on these transactions.
Subsequent event In December 2018, we sold one of our golf club properties to a third party for $18.5 million. We expect to recognize a gain of approximately $12.5 million in our first quarter of fiscal 2019 as a result of this sale.
17. INFORMATION ON SEGMENTSThe table below summarizes revenue and income (loss) before income taxes for our segments for each of the fiscal years ended October 31, 2018, 2017, and 2016 (amounts in thousands):
Revenue Income (loss) before income taxes2018 2017 2016 2018 2017 2016
Traditional Home Building:
North $ 975,648 $ 775,540 $ 814,519 $ 56,530 $ 50,393 $ 77,017
Mid-Atlantic 1,141,130 1,030,269 895,736 90,573 105,740 (29,361)
South 1,045,395 923,953 849,548 110,304 112,809 128,613
West 1,451,353 1,151,697 903,691 213,269 153,188 127,265
California 2,208,733 1,550,494 1,448,546 494,247 345,138 335,173
Traditional Home Building 6,822,259 5,431,953 4,912,040 964,923 767,268 638,707
City Living 320,999 383,105 257,468 78,149 193,852 91,109
Corporate and other (109,156) (146,809) (140,789)
$ 7,143,258 $ 5,815,058 $ 5,169,508 $ 933,916 $ 814,311 $ 589,027
“Corporate and other” is comprised principally of general corporate expenses such as the offices of our executive officers; the corporate finance, accounting, audit, tax, human resources, risk management, information technology, marketing, and legal groups; interest income; income from certain of our ancillary businesses, including Gibraltar; and income from our Rental Property Joint Ventures and Gibraltar Joint Ventures.
Total assets for each of our segments at October 31, 2018 and 2017, are shown in the table below (amounts in thousands):
2018 2017
Traditional Home Building:
North $ 970,854 $ 1,074,969
Mid-Atlantic 1,130,417 1,121,013
South 1,237,744 1,184,956
West 1,580,199 1,275,298
California 2,733,956 2,630,041
Traditional Home Building 7,653,170 7,286,277
City Living 516,238 647,174
Corporate and other 2,075,182 1,511,774
$ 10,244,590 $ 9,445,225 “Corporate and other” is comprised principally of cash and cash equivalents, restricted cash, deferred tax assets, investments in our Rental Property Joint Ventures, expected recoveries from insurance carriers and suppliers, our Gibraltar investments and operations, manufacturing facilities, and our mortgage and title subsidiaries.

TOLL BROTHERS 201876
Inventory for each of our segments, as of the dates indicated, is shown in the table below (amounts in thousands):
Land controlled for future
communities
Land owned for future
communitiesOperating
communities Total
Balances at October 31, 2018
Traditional Home Building:
North $ 17,414 $ 99,383 $ 803,692 $ 920,489
Mid-Atlantic 48,553 123,218 906,990 1,078,761
South 12,305 95,309 957,321 1,064,935
West 22,905 109,671 1,419,989 1,552,565
California 32,441 391,221 2,146,370 2,570,032
Traditional Home Building 133,618 818,802 6,234,362 7,186,782
City Living 6,367 97,814 307,256 411,437
$ 139,985 $ 916,616 $ 6,541,618 $ 7,598,219
Balances at October 31, 2017
Traditional Home Building:
North $ 23,944 $ 130,964 $ 869,764 $ 1,024,672
Mid-Atlantic 32,674 87,642 950,982 1,071,298
South 8,892 51,391 951,887 1,012,170
West 12,087 89,184 1,154,004 1,255,275
California 5,550 640,306 1,769,274 2,415,130
Traditional Home Building 83,147 999,487 5,695,911 6,778,545
City Living 4,011 143,383 355,514 502,908
$ 87,158 $ 1,142,870 $ 6,051,425 $ 7,281,453
The amounts we have provided for inventory impairment charges and the expensing of costs that we believed not to be recoverable for each of our segments, for the years ended October 31, 2018, 2017, and 2016, are shown in the table below (amounts in thousands):
2018 2017 2016
Traditional Home Building:
North $ 19,698 $ 6,528 $ 7,579
Mid-Atlantic 9,818 6,905 2,076
South 3,802 1,184 3,316
West 907 106 746
California 147 43
Traditional Home Building 34,372 14,766 13,717
City Living 15 28 90
Corporate and other 769
$ 35,156 $ 14,794 $ 13,807
The net carrying value of our investments in unconsolidated entities and our equity in earnings (losses) from such investments, for each of our segments, as of the dates indicated, are shown in the table below (amounts in thousands):
Investments in unconsolidated
entitiesEquity in earnings (losses)
from unconsolidated entitiesAt October 31, Year ended October 31,
2018 2017 2018 2017 2016
Traditional Home Building:
Mid-Atlantic $ 7,823 $ 11,093 $ (4,000) $ (2,000)
South 84,610 85,757 12,263 9,185 $ 11,013
West (63) 2,529 2,921
California 84,160 148,499 2,404 7,509 5,896
Traditional Home Building 176,593 245,349 10,604 17,223 19,830
City Living 65,936 92,904 6,857 73,123 13,184
Corporate and other 189,284 143,505 67,779 25,720 7,734
$ 431,813 $ 481,758 $ 85,240 $ 116,066 $ 40,748
“Corporate and other” is comprised of our investments in the Rental Property Joint Ventures and the Gibraltar Joint Ventures.

TOLL BROTHERS 2018 77
18. SUPPLEMENTAL DISCLOSURE TO CONSOLIDATED STATEMENTS OF CASH FLOWSThe following are supplemental disclosures to the Consolidated Statements of Cash Flows for each of the fiscal years ended October 31, 2018, 2017 and 2016 (amounts in thousands):
2018 2017 2016Cash flow information: Interest paid, net of amount capitalized $ 20,812 $ 21,578 $ 12,131 Income tax payments $ 215,092 $ 119,852 $ 185,084 Income tax refunds $ 3,101 $ 2,776 $ 4,451Noncash activity:Cost of inventory acquired through seller financing or municipal bonds, net $ 185,633 $ 61,877 $ 5,807
Financed portion of land sale $ 625 (Increase) decrease in inventory for capitalized interest, our share of earnings, and allocation of basis difference in land purchased from unconsolidated entities $ (1,320) $ 11,760 $ 9,012
Cost of inventory acquired through foreclosure $ 4,609 Reclassification of deferred income from inventory to accrued liabilities $ 3,520 $ 2,111 Non-controlling interest $ 2,801 Reclassification of inventory to property, construction, and office equipment $ 8,990 $ 17,064 (Increase) decrease in unrecognized gain in defined benefit plans $ (3,115) $ (1,201) $ 1,699 Defined benefit plan amendment $ 757 Deferred tax decrease related to stock-based compensation activity included in additional paid-in capital $ 5,232 $ 11,363 Increase in accrued expenses related to stock-based compensation 6,240 Income tax (expense) benefit recognized in total comprehensive income $ (1,141) $ (880) $ 590 Transfer of other assets to inventory, net $ 16,763 Transfer of inventory to investment in unconsolidated entities $ 72,757 Transfer of investment in unconsolidated entities to inventory $ 14,328 Transfer of other assets to investment in unconsolidated entities $ 60,971 $ 1,308 $ 24,967 Reclassification of deferred income from accrued expenses to investment in unconsolidated entities $ 5,995 Increase in investments in unconsolidated entities for change in the fair value of debt guarantees $ 623 $ 130 $ 29 Miscellaneous increases to investments in unconsolidated entities $ 1,776 $ 5,117 $ 1,510Business Acquisition: Fair value of assets purchased $ 88,465 Liabilities assumed $ 5,377 Cash paid $ 83,088

TOLL BROTHERS 201878
RECONCILIATION OF NON-GAAP MEASURESNet Debt-to-Capital Ratio Reconciliation (amount in thousands):
As of October 31,
2018
Loans payable $ 686,801
Senior notes 2,861,375
Mortgage company loan facility 150,000
Total debt 3,698,176
Total stockholders' equity 4,760,199
Total capital $ 8,458,375
Ratio of debt-to-capital 43.7%
Total debt $ 3,698,176
Less: Mortgage company loan facility (150,000)
Cash and cash equivalents (1,182,195)
Total net debt 2,365,981
Total stockholders' equity 4,760,199
Total net capital $ 7,126,180
Net debt-to-capital ratio 33.2%
STOCK RETURN PERFORMANCE GRAPHThe following graph and chart compares the five-year cumulative total return (assuming that an investment of $100 was made on October 31, 2013, and that dividends were reinvested) from October 31, 2013 to October 31, 2018, for (a) our common stock, (b) the S&P Homebuilding Index and (c) the S&P 500®:
Comparison of 5 Year Cumulative Total Return Among Toll Brothers, Inc., the S&P 500®, and the S&P Homebuilding Index
October 31: 2013 2014 2015 2016 2017 2018
Toll Brothers, Inc. 100.00 97.17 109.40 83.46 140.88 104.09
S&P 500® 100.00 117.27 123.37 128.93 159.40 171.11
S&P Homebuilding 100.00 117.41 135.92 128.23 192.02 154.30
19. SUMMARY CONSOLIDATED QUARTERLY FINANCIAL DATA (UNAUDITED)
The table below provides summary income statement data for each quarter of fiscal 2018 and 2017 (amounts in thousands, except per share data):
Three Months Ended,
October 31 July 31 April 30 January 31
Fiscal 2018:Revenue $ 2,455,238 $ 1,913,353 $ 1,599,199 $ 1,175,468
Gross profit $ 524,487 $ 403,734 $ 301,042 $ 240,988
Income before income taxes $ 396,473 $ 253,097 $ 152,748 $ 131,598
Net income $ 310,976 $ 193,258 $ 111,810 $ 132,107
Earnings per share (a)
Basic $ 2.10 $ 1.28 $ 0.73 $ 0.85
Diluted $ 2.08 $ 1.26 $ 0.72 $ 0.83
Weighted-average number of shares
Basic 148,066 151,257 152,731 155,882
Diluted 149,603 153,173 155,129 158,897
Fiscal 2017:Revenue $ 2,027,907 $ 1,502,909 $ 1,363,512 $ 920,730
Gross profit $ 452,075 $ 326,881 $ 286,071 $ 187,728
Income before income taxes $ 301,747 $ 203,574 $ 199,209 $ 109,781
Net income $ 191,878 $ 148,563 $ 124,638 $ 70,416
Earnings per share (a)
Basic $ 1.20 $ 0.91 $ 0.76 $ 0.43
Diluted $ 1.17 $ 0.87 $ 0.73 $ 0.42
Weighted-average number of shares
Basic 159,232 163,478 163,492 162,588
Diluted 164,565 171,562 171,403 170,417
(a) Due to rounding, the sum of the quarterly earnings per share amounts may not equal the reported earnings per share for the year.
DIVIDENDSIn February 2017, our Board of Directors approved the initiation of quarterly cash dividends to shareholders. During fiscal 2018, we paid aggregate cash dividends of $0.41 per share to our shareholders. The payment of dividends is within the discretion of our Board of Directors and any decision to pay dividends in the future will depend upon an evaluation of a number of factors, including our results of operations, our capital requirements, our operating and financial condition, and any contractual limitations then in effect. Our revolving credit agreement and term loan agreement each require us to maintain a minimum tangible net worth (as defined in the respective agreement), which restricts the amount of dividends we may pay. At October 31, 2018, under the most restrictive provisions of our revolving credit agreement and term loan agreement, we could have paid up to approximately $2.22 billion of cash dividends.
Toll Brothers, Inc. S&P 500® S&P Homebuilding
$0
$50
$100
$150
$200
$250
201820172016201520142013

TOLL BROTHERS 2018 79
President and Chief Operating OfficerRichard T. Hartman* (39)
Chief Financial OfficerMartin P. Connor* (10)
Senior LeadershipFrederick N. Cooper (25)Finance, International Development and Investor RelationsJohn Critikos (5)Chief Information OfficerJoseph R. DeSanto (15) TaxMichael J. Grubb (15)Chief Accounting Officer
John Jakominich (21)Land AcquisitionsBenjamin D. Jogodnik (23)Mergers & AcquisitionsDaniel J. Kennedy (24)Chief Audit OfficerJohn K. McDonald (16) General Counsel and Chief Compliance Officer
Kevin J. McMaster (35) ControllerJennifer Olsen (17)National SalesJoy N. Roman (2) Chief Human Resources OfficerMichael I. Snyder (38)Secretary and Chief Planning Officer
Kira Sterling (33)Chief Marketing OfficerGregg L. Ziegler (16)Treasurer
Home Building OperationsRegional PresidentsJames W. Boyd (25)Barry A. Depew (35)Kevin D. Duermit (31)John G. Mangano (31)Robert Parahus (32)
Toll Brothers City Living®Thomas R. Mulvey (14)President
Group PresidentsChristopher G. Gaffney (22)Gary M. Mayo (21)Karl Mistry (14)Robert D. Moore (5)Thomas J. Murray (24)Gregory S. Netro (18)Seth J. Ring (15)
Division PresidentsEric C. Anderson (22)David S. Assid (18)Mark G. Bailey (18)David Bauer (14)Craig Cherry (20)Thomas M. Coleman, Jr. (2)John Dean (7)James Fitzpatrick (17)Robert L. Flaherty (21)Scott James (1)David E. Kelly (14)
Division PresidentsJohn S. Lannamann (17)Steven R. Merten (14)Kelley Moldstad (7) Richard M. Nelson (20)Mark J. Nosal (17)Robert G. Paul (17)Jaime Pou (1)Andrew J. Semon (16)John R. Tolbert (19)David H. Von Spreckelsen (15)
Subsidiary and Affiliate Operations
Toll Brothers Apartment Living Toll Brothers Campus Living®Charles L. Elliott (7) President
Toll Brothers Hospitality GroupJohn J. DePaul (1) President
Golf and Country Club OperationsMaurice Darbyshire (13)President
Land Development OperationsRobert N. McCarron (26)Executive Vice President
ESE Consultants, Inc.Mark S. Mayhew (5)SR. VP/Managing Director
TBI Mortgage® CompanyDonald L. Salmon (19)CEOSteve Audet (2)President
TBI Smart Home SolutionsFelicia Ratka (18)President
Toll Architecture, Inc.Jed Gibson (25)President
Toll Integrated SystemsKeith Fell (10)Director of Manufacturing
Toll Landscape, LLCMark Culichia (21)President
Westminster Title Company, Inc.William T. Unkel (14)President
*Executive Officer of the Company. Director and employee listing as of 1/1/19. ( ) Years of service with Toll Brothers.
CORPORATE DIRECTORS AND OFFICERS
Board of DirectorsRobert I. Toll Chairman Emeritus of the Board
Douglas C. Yearley, Jr.* (28) Chairman of the Board and Chief Executive Officer
Edward G. Boehne Retired President — Federal Reserve Bank of Philadelphia
Richard J. Braemer Senior Counsel — Ballard Spahr LLP, Attorneys at Law
Christine N. Garvey Retired Global Head of Corporate Real Estate Services — Deutsche Bank AG
Carl B. Marbach President — Greater Marbach Airlines, Inc., an aviation services and consulting company
John A. McLean Senior Managing Director — New York Life Investment Management
Stephen A. Novick Senior Advisor — Chasbro Investments
Wendell E. Pritchett Provost, Presidential Professor of Law and Education — University of Pennsylvania
Paul E. Shapiro Chairman — Q Capital Holdings LLC, a life settlement company
Gibraltar Real Estate CapitalRoger A. Brush (25) PresidentMichael L. LaPat (19) Chief Financial Officer

TOLL BROTHERS 201880
CORPORATE INFORMATIONCorporate OfficeToll Brothers, Inc. 250 Gibraltar Road Horsham, Pennsylvania 19044 215-938-8000 | TollBrothers.com
Transfer Agent and RegistrarAmerican Stock Transfer & Trust Company, LLC 6201 15th Avenue Brooklyn, New York 11219 1-800-937-5449 | astfinancial.com
Independent AuditorsErnst & Young LLP — Philadelphia, Pennsylvania
EmployeesAs of October 31, 2018, we had approximately 4,900 full-time employees.
StockholdersAs of December 17, 2018, we had 567 stockholders of record.
Stock ListingOur common stock is traded on the New York Stock Exchange (symbol “TOL”).
CertificationsOur Chief Executive Officer and Chief Financial Officer have filed their certifications as required by the SEC regarding the quality of our public disclosures for each of the periods ended during our fiscal year ended October 31, 2018. Further, our Chief Executive Officer has certified to the New York Stock Exchange (“NYSE”) that he is not aware of any violation by our Company of NYSE corporate governance listing standards, as required by Section 303A.12(a) of the NYSE Listed Company Manual.
Demographic and Other Data Sources for the data included in this annual report include, Bloomberg Business Week, Bloomberg L.P., Citigroup, Claritas, The Conference Board, Fannie Mae, Federal Home Loan Mortgage Corporation, Federal Housing Finance Board, Federal Reserve Bank, Federal Reserve Board, Fitch Ratings, Forbes, Fortune, Harvard Institute of Economic Research, Institutional Investor Magazine, John Burns Real Estate Consulting, Joint Center for Housing Studies of Harvard University, J.P. Morgan Securities, Moody’s Economy.com, Moody’s Investor Service, Mortgage Bankers Association, National Association of Home Builders, National Association of Realtors,® Office of Federal Housing Enterprises Oversight, S&P Corelogic Case-Shiller U.S. National Home Price NSA Index, Standard & Poor’s, Thomson Reuters Corporation, Urban Land Institute Terwilliger Center for Housing, U.S. Bureau of Labor Statistics, U.S. Census Bureau, U.S. Department of Commerce, U.S. Department of Housing and Urban Development, U.S. Department of Labor, The Wall Street Journal, YAHOO! Finance.
Investor Relations Information RequestsOur Annual Report on Form 10-K, Quarterly Reports on Form 10-Q, and other Company information are available without charge either on or through our website, TollBrothers.com, or upon request from the following individuals at our Corporate Office:
Frederick N. Cooper, Senior Vice President — Finance, International Development and Investor Relations [email protected] | 215-938-8312
Our Board of Directors has an audit and risk committee, an executive compensation committee, a nominating and corporate governance committee, and a public debt and equity securities committee. Each of these committees has a formal charter. We also have Corporate Governance Guidelines, a Code of Ethics for Members of the Board of Directors, and a Code of Ethics and Business Conduct which applies to all officers and employees. Copies of these charters, guidelines, and codes can be obtained on our website and are also available upon request from the individuals listed above.
Production NotesFront Cover Photo: The Savenza | Palomar at Pacific Highlands Ranch | San Diego, CA
Photography by: Ron Blunt, Joshua Caldwell, Curt Clayton, Matthew Gallant, Roberto Gonzalez, Eric Lucero, Shawn May, Christopher Mayer, Rise Media, Todd A. Smith Photography, Bill Taylor, Stefano Ukmar, Jim Wilson
Renderings by: Evolution Ventures, Toll Architecture
Designed by: Samantha Nielsen
From Fortune magazine, March 1, 2017 ©2017 Time Inc. Fortune and The World’s Most Admired Companies are registered trademarks of Time Inc. and are used under license. Fortune and Time Inc. are not affiliated with, and do not endorse products or services of, Toll Brothers, Inc.
Copyright 2018 by Toll Brothers, Inc.

The Clubhouse | Regency at Upper Dublin | Dresher, PA The Geneva | Mehr Farm | McLean, VA
The Messina | Toll Brothers at Inspirada | Henderson, NV

250 Gibraltar Road | Horsham, Pennsylvania 19044 | 215-938-8000 | TollBrothers.com
The Clubhouse | North Oaks of Ann Arbor | Ann Arbor, MI


