2018 ANNUAL REPORT - fcagroup.com · At the New York International Auto Show, Maserati debuted the...
330
2018 ANNUAL REPORT
Transcript of 2018 ANNUAL REPORT - fcagroup.com · At the New York International Auto Show, Maserati debuted the...
2018 ANNUAL REPORT


2018 ANNUAL REPORTAND FORM 20-F
2 2018 | ANNUAL REPORT

2018 | ANNUAL REPORT 3
Indicate by check mark whether the registrant: (1) has filed all reports required to be filed by Section 13 or 15(d) of the Securities Exchange Act of 1934 during the preceding 12 months (or for such shorter period that the registrant was required to file such reports), and (2) has been subject to such filing requirements for the past 90 days. Yes No
Indicate by check mark whether the registrant has submitted electronically every Interactive Data File required to be submitted pursuant to Rule 405 of Regulation S-T (§232.405 of this chapter) during the preceding 12 months (or for such shorter period that the registrant was required to submit and post such files). Yes No
Indicate by check mark whether the registrant is a large accelerated filer, an accelerated filer, a non-accelerated filer, or an emerging growth company. See definition of “large accelerated filer,” “accelerated filer,” and emerging growth company” in Rule 12b-2 of the Exchange Act.
Large accelerated filer Accelerated filer Non-accelerated filer Emerging growth company
If an emerging growth company that prepares its financial statements in accordance with U.S. GAAP, indicate by check mark if the registrant has elected not to use the extended transition period for complying with any new or revised financial accounting standards provided pursuant to Section 13(a) of the Exchange Act.
Indicate by check mark which basis of accounting the registrant has used to prepare the financial statements included in this filing: U.S. GAAP International Financial Reporting Standards as issued by the International Accounting Standards Board Other
If “Other” has been checked in response to the previous question indicate by check mark which financial statement item the registrant has elected to follow: Item 17 or Item 18 .
If this is an annual report, indicate by check mark whether the registrant is a shell company (as defined in Rule 12b-2 of the Exchange Act). Yes No (APPLICABLE ONLY TO ISSUERS INVOLVED IN BANKRUPTCY PROCEEDINGS DURING THE PAST FIVE YEARS)Indicate by check mark whether the registrant has filed all documents and reports required to be filed by Sections 12, 13 or 15(d) of the Securities Exchange Act of 1934 subsequent to the distribution of securities under a plan confirmed by a court. Yes No


2018 | ANNUAL REPORT 5
Consolidated Financial Statements at December 31, 2018 .................................. 165
Consolidated Income Statement .......................... 167
Consolidated Statement of Comprehensive Income ................................... 168
Consolidated Statement of Financial Position ....... 169
Consolidated Statement of Cash Flows ............... 170
Consolidated Statement of Changes in Equity ..... 171
Notes to the Consolidated Financial Statements .. 172
Company Financial Statements at December 31, 2018 .................................. 273
Income Statement ............................................... 274
Statement of Financial Position ............................ 275
Notes to the Company Financial Statements ....... 276
Other Information ........................................ 289
Additional information for Netherlands
Corporate Governance ........................................ 290
Additional Information for U.S. Listing Purposes ... 293
Independent Auditor’s Report ..................... 307
Form 20-F Cross Reference ........................ 319
Signatures .................................................... 323
Board of Directors and Auditor ....................... 7
Message from the Chairman and the CEO ..... 9
Board Report ................................................. 13
Introduction ........................................................... 13
Management Report ............................................. 16
Selected Financial Data ...................................... 16
Group Overview ................................................. 18
Our Business Plan .............................................. 20
Overview of Our Business .................................. 21
Sales Overview .................................................. 29
Environmental and Other Regulatory Matters ...... 36
Financial Overview ............................................. 43
Results of Operations ......................................... 50
Liquidity and Capital Resources ......................... 67
Risk Management .............................................. 77
Risk Factors ....................................................... 81
Corporate Governance .......................................... 96
Remuneration Report ....................................... 132
Non-Financial Information .................................... 144
Controls and Procedures ..................................... 159
2019 Guidance ................................................... 163
Table of contents
Table of contents


2018 | ANNUAL REPORT 7
Board of Directors and Auditor
Board of Directors and Auditor
BOARD OF DIRECTORS
ChairmanJohn Elkann(3)
Chief Executive OfficerMichael Manley
DirectorsJohn AbbottAndrea AgnelliTiberto Brandolini d’AddaGlenn Earle(1)
Valerie A. Mars(1),(2)
Ruth J. Simmons(3)
Ronald L. Thompson(1)
Michelangelo A. Volpi(2)
Patience Wheatcroft(1),(3)
Ermenegildo Zegna(2)
INDEPENDENT AUDITOR
Ernst & Young Accountants LLP (EU Annual Report filing)Ernst & Young S.p.A (SEC 20-F filing)
(1) Member of the Audit Committee(2) Member of the Compensation Committee(3) Member of the Governance and Sustainability Committee

8 2018 | ANNUAL REPORT

2018 | ANNUAL REPORT 9
Message from the Chairman and the CEO
Message from the Chairman and the CEOWe want to thank everyone in the FCA organization for their professional and personal contributions, during what was an extraordinary year.
Thanks to them, we finished 2018 in the strongest financial position since FCA was created. We achieved record results and a number of significant milestones, which have paved the way for our next phase of growth and profits.
The year was also marked by a sudden and unexpected change in leadership following the untimely passing of Sergio Marchionne.
That was a tough moment for all of us, including on a personal level, but our organization was well prepared to manage this unexpected transition because, from the very beginning, Sergio had the humility and wisdom to see that the ultimate fulfillment of his role as a leader was to teach those around him also to be leaders.
Notwithstanding the difficult circumstances, we were able to move rapidly, ensuring stability in leadership and steadiness of vision.
Keeping in mind where we came from and the journey that has brought us thus far, we will carry this organization forward with a very clear vision of what it takes to achieve our ambitions.
We firmly believe that we have the depth and breadth of talent and skills we need to shape the future of this organization exactly as we envision it: a company with a global horizon and unlimited possibilities, working to become one of the most profitable automakers in the world.
This vision draws its strength from the collective spirit of our people - united by the same strong commitment to the values that drive our business and our lives: integrity and discipline, openness to feedback and constructive debate, and full acceptance that we are each accountable.
In 2018, we reached a net cash position for the very first time. Industrial free cash flows more than doubled to €4.3 billion(1), leading to a net industrial cash position of €1.9 billion(1) at year-end.
On that basis, the Board of Directors is recommending, for the first time in nearly ten years, to reward our shareholders with the reinstatement of ordinary dividends.
The agreement to sell Magneti Marelli, a transaction which is expected to close in the second quarter of 2019, will create one of the world’s leading independent automotive component suppliers, recognizing the full strategic value of our components business. Not only will it provide a secure and exciting future for Magneti Marelli and its employees but it will also allow us to further strengthen our balance sheet and reward our shareholders with an extraordinary dividend.
Our consistently strong performance has resulted in ratings upgrades from each of the three major credit rating agencies.
Adjusted EBIT for the year came in at a record €7.3 billion(1).
Adjusted net profit climbed 34 percent to a record level of €5.0 billion(1) and net profit was up 3 percent to €3.6 billion(1).
Worldwide combined shipments totaled 4.8 million units and net revenues were up 4 percent to €115.4 billion(1).
Looking at our mass-market operations by region, NAFTA posted a strong performance, attaining a record high in Adjusted EBIT, up 19 percent at €6.2 billion, with a margin of 8.6 percent. In the United States, we reported the highest retail sales in 17 years, with both Jeep and Ram brands hitting new records. We also completed the most complex and intensive phase of the realignment of our manufacturing footprint in the Region, in response to a continued shift in demand towards trucks and SUVs.
(1) Including Magneti Marelli, which is classified as a discontinued operation for the year ended December 31, 2018.

10 2018 | ANNUAL REPORT
Message from the Chairman and the CEO
LATAM posted robust growth with Adjusted EBIT more than doubling from the previous year to €359 million and margin increasing by 250 basis points to 4.4 percent. In Brazil, we finished the year in a leading position in three of the most important segments - pickups, light commercial vehicles and SUVs - while in Argentina we improved our market share despite the severe economic crisis in the second half of the year.
Results in APAC were disappointing, Adjusted EBIT showed a loss of €296 million, impacted by trade and regulatory challenges due to market weakness and increased competition and reflecting lower shipments from our Chinese joint venture.
In EMEA, performance was adversely affected by several factors, including the transition to new emissions regulations. Lower volumes and pricing actions in response to this transition, as well as higher advertising costs to support the growth of Jeep brand, led to a decrease in Adjusted EBIT to €406 million. Net revenues came in at €22.8 billion, in line with prior year.
There was also a positive contribution from Maserati, although the results were below the 2017 level, primarily due to market challenges in China, as well as inventory management actions and lower volumes in North America and Europe.
On the product side, we increased our offering with several key vehicle launches.
Jeep launched: the all-new Grand Commander in China, a premium seven-passenger SUV exclusive to the Chinese market; the all-new Wrangler in Europe and Japan; the new Cherokee in Europe, China and Japan; the new Renegade in LATAM. The all-new Gladiator, the most capable mid-size pickup truck, made its worldwide debut at the Los Angeles Auto Show.
Alfa Romeo revealed the new Stelvio and Giulia Quadrifoglio Nürburgring limited editions, with 108 models of each produced to commemorate the 108th anniversary of the brand.
At the New York International Auto Show, Maserati debuted the Levante Trofeo V8 which will be sold in markets around the world.
Ram launched the all-new 1500, which has already won two of the most prestigious awards in North America: 2018 North American Truck of the Year (NACTOY) and Motor Trend Truck of the Year.
And we began 2019 with the reveal of the all-new Ram Heavy Duty at the North American International Auto Show in Detroit.
As part of our commitment to stay at the forefront of the rapid technological changes that are transforming our industry, we are pursuing a multi-partner strategy for the development of advanced driver assistance and autonomous driving technologies, working with companies who are leaders in their respective sectors.
With Waymo, Google’s self-driving car project, we further strengthened our partnership in 2018, announcing an agreement to deliver up to an additional 62,000 Chrysler Pacifica Hybrid minivans to support the launch of the first autonomous-car taxi service. We also dedicated a new facility at our Chelsea Proving Grounds in the United States for further development and testing of autonomous vehicles and advanced safety technologies.
In addition, we are partnering with BMW for Level 3 autonomy and APTIV for advanced driver assistance retail solutions, as these initiatives provide the opportunity to fully leverage the capabilities of each partner.
We believe that choosing the right technology at the right moment is key to our ability to lead the way in the future of transportation, especially now as emerging technologies are revolutionizing the concept of personal mobility.
We are ready to tailor both the technologies and the platforms not only to meet but also to shape that new vision.
The other significant technological shift that we are likely to see in the near future is related to electrification, which we also addressed in our business plan. Our expectation is to continue reducing CO2 emissions through a combination of technologies aligned to the vehicle mix, consumer needs and regulatory framework in each market. By 2022, we intend to offer 12 electrified propulsion systems on global architectures spanning the full range of vehicle segments and over 30 vehicle nameplates with electrified solutions.

2018 | ANNUAL REPORT 11
The objectives we have set for the future, together with the significant steps already taken, are clear evidence of our business principles and determination to ensure that the achievement of financial targets goes hand-in-hand with respect for all stakeholders.
Among our sustainable initiatives in 2018, we implemented around 5,000 environmental projects at our plants around the world, reducing our carbon footprint per vehicle produced by 27 percent compared with 2010 and reducing waste generated per vehicle produced by 62 percent compared with 2010.
Our corporate citizenship efforts are rooted in the FCA Code of Conduct and are aligned with the United Nations Sustainable Development Goals.
We strive to enrich the vitality of the communities where we live and work by creating jobs, giving back through employee volunteering and providing financial support through our charitable initiatives.
During 2018, Group employees around the world volunteered thousands of hours in support of a wide range of social projects.
We also aim to offer our employees an inclusive work environment, where everyone feels respected and valued, and we are proud to have our efforts recognized by organizations such as the Thomson Reuters D&I Index, which included FCA among the top 100 most diverse and inclusive organizations in the world.
We decided to name our FCA Student Achievement Awards in honor of Sergio Marchionne, which is a way to reaffirm his principles and beliefs by supporting the most talented and deserving children of our employees.
The results we achieved, in terms of both growth and value, were possible because of what FCA is today.
We are a strong, competitive group that possesses some of the most innovative technologies and one of the most extensive product ranges and strongest brands in the world.
We are a flexible yet cohesive group, with a global footprint, and solid enough to cope with any unexpected changes in market conditions.
We wish to thank all of our shareholders and stakeholders for your support, whether you have been with us for many years or just a few months. Your trust is fundamental for FCA as we embark on the next phase of our development.
February 22, 2019
/s/ John Elkann /s/ Mike Manley
John Elkann Mike ManleyCHAIRMAN CHIEF EXECUTIVE OFFICER

12 2018 | ANNUAL REPORT

2018 | ANNUAL REPORT 13
Board ReportIntroduction
About this ReportThis document constitutes both the Statutory annual report in accordance with Dutch legal requirements and the Annual Report on Form 20-F in accordance with the United States Securities and Exchange Act of 1934 applicable to Foreign Private Issuers (“FPI”) for Fiat Chrysler Automobiles N.V. for the year ended December 31, 2018. A table that cross-references the content of this report to the Form 20-F requirements is set out in the FORM 20-F CROSS REFERENCE section included elsewhere in this report. The Annual Report and Form 20-F is filed with the Netherlands Authority for Financial Markets (Autoriteit Financiële Markten, the “AFM”). The Annual Report and Form 20-F and other related documents are filed with the United States Securities and Exchange Commission (“SEC”).
The following sections have been removed for our Form 20-F filing with the SEC:
MESSAGE FROM THE CHAIRMAN AND THE CEO
CORPORATE GOVERNANCE - Responsibilities in Respect to the Annual Report
NON-FINANCIAL INFORMATION
CONTROLS AND PROCEDURES - Statement by the Board of Directors
2019 GUIDANCE
FCA N.V. COMPANY FINANCIAL STATEMENTS
Independent auditor’s report (Ernst & Young Accountants LLP in respect of the AFM filing)
Without the sections referred to above, the Form 20-F filing with the SEC does not constitute a Statutory annual report in accordance with Dutch legal requirements.
Documents on DisplayYou may read and copy any document we file with or furnish to the SEC at the SEC’s public reference room at 100 F Street, N.E., Room 1580, Washington, D.C. 20549. You may also obtain documents we file with or furnish to the SEC on the SEC’s website at www.sec.gov. The address of the SEC’s website is provided solely for information purposes and is not intended to be an active link. You may visit the website or call the SEC at 1-800-732-0330 for further information about its public reference room. Reports and other information concerning the business of FCA may also be inspected at the offices of the New York Stock Exchange, 11 Wall Street, New York, New York 10005.
We also make our periodic reports, as well as other information filed with or furnished to the SEC, available free of charge through our website, at www.fcagroup.com, as soon as reasonably practicable after those reports and other information are electronically filed with or furnished to the SEC. The information on our website is not incorporated by reference in this report.
Certain Defined TermsIn this report, unless otherwise specified, the terms “we”, “our”, “us”, the “Group”, the “Company” and “FCA” refer to Fiat Chrysler Automobiles N.V., together with its subsidiaries and its predecessor prior to the completion of the merger of Fiat S.p.A. with and into Fiat Investments N.V. on October 12, 2014 (at which time Fiat Investments N.V. was renamed Fiat Chrysler Automobiles N.V., or “FCA NV”), the “Merger” or any one or more of them, as the context may require. References to “Fiat” refer solely to Fiat S.p.A., the predecessor of FCA NV prior to the Merger. References to “FCA US” refer to FCA US LLC, together with its direct and indirect subsidiaries.
Board Report
Introduction

14 2018 | ANNUAL REPORT
Presentation of Financial and Other DataThis report includes the consolidated financial statements of the Group as of December 31, 2018 and 2017 and for the years ended December 31, 2018, 2017 and 2016 prepared in accordance with International Financial Reporting Standards (“IFRS”) as issued by the International Accounting Standards Board (“IASB”), as well as IFRS as adopted by the European Union. There is no effect on these consolidated financial statements resulting from differences between IFRS as issued by the IASB and IFRS as adopted by the European Union. We refer to the consolidated financial statements and the notes to the consolidated financial statements collectively as the “Consolidated Financial Statements”.
All references in this report to “Euro” and “€” refer to the currency issued by the European Central Bank. The Group’s financial information is presented in Euro. All references to “U.S. Dollars”, “U.S. Dollar”, “U.S.$” and “$” refer to the currency of the United States of America (or “U.S.”).
The language of this report is English. Certain legislative references and technical terms have been cited in their original language in order that the correct technical meaning may be ascribed to them under applicable law.
Certain totals in the tables included in this report may not add due to rounding.
Except as otherwise disclosed within this report, no significant changes have occurred since the date of the audited Consolidated Financial Statements included elsewhere in this report.
Market and Industry InformationIn this report, we include and refer to industry and market data, including market share, ranking and other data, derived from or based upon a variety of official, non-official and internal sources, such as internal surveys and management estimates, market research, publicly available information and industry publications. Market share, ranking and other data contained in this report may also be based on our good faith estimates, our own knowledge and experience and such other sources as may be available. Market share data may change and cannot always be verified with complete certainty due to limits on the availability and reliability of raw data, the voluntary nature of the data-gathering process, different methods used by different sources to collect, assemble, analyze or compute market data, including different definitions of vehicle segments and descriptions and other limitations and uncertainties inherent in any statistical survey of market shares or size. Industry publications and surveys and forecasts generally state that the information contained therein has been obtained from sources believed to be reliable, but there can be no assurance as to the accuracy or completeness of included information. Although we believe that this information is reliable, we have not independently verified the data from third-party sources. In addition, we typically estimate our market share for automobiles and commercial vehicles based on registration data.
In markets where registration data are not available, we calculate our market share based on estimates relating to sales to final customers. Such data may differ from data relating to shipments to our dealers and distributors. While we believe our internal estimates with respect to our industry are reliable, our internal company surveys and management estimates have not been verified by an independent expert, and we cannot guarantee that a third party using different methods to assemble, analyze or compute market data would obtain or generate the same result. The market share data presented in this report represents the best estimates available from the sources indicated as of the date hereof but, in particular as they relate to market share and our future expectations, involve risks and uncertainties and are subject to change based on various factors, including those discussed in the section Risk Factors in this report.
Forward-Looking Statements Statements contained in this report, particularly those regarding possible or assumed future performance, competitive strengths, costs, dividends, reserves and growth of FCA, industry growth and other trends and projections and estimated company earnings are “forward-looking statements” that contain risks and uncertainties. In some cases, words such as “may”, “will”, “expect”, “could”, “should”, “intend”, “estimate”, “anticipate”, “believe”, “remain”, “on track”, “design”, “target”, “objective”, “goal”, “forecast”, “projection”, “outlook”, “prospects”, “plan”, or similar terms are used to identify forward-looking statements. These forward-looking statements reflect the respective current views of the Group with respect to future events and involve significant risks and uncertainties that could cause actual results to differ materially.
Board Report
Introduction

2018 | ANNUAL REPORT 15
These factors include, without limitation:
our ability to launch products successfully and to maintain vehicle shipment volumes;
changes in the global financial markets, general economic environment and changes in demand for automotive products, which is subject to cyclicality;
changes in local economic and political conditions, changes in trade policy and the imposition of global and regional tariffs or tariffs targeted to the automotive industry, the enactment of tax reforms or other changes in tax laws and regulations;
our ability to expand certain of our brands globally;
our ability to offer innovative, attractive products;
our ability to develop, manufacture and sell vehicles with advanced features, including enhanced electrification, connectivity and autonomous-driving characteristics;
various types of claims, lawsuits, governmental investigations and other contingencies affecting us, including product liability and warranty claims and environmental claims, investigations and lawsuits;
material operating expenditures in relation to compliance with environmental, health and safety regulations;
the intense level of competition in the automotive industry, which may increase due to consolidation;
exposure to shortfalls in the funding of our defined benefit pension plans;
our ability to provide or arrange for access to adequate financing for our dealers and retail customers, and associated risks related to the establishment and operations of financial services companies, including capital required to be deployed to financial services;
our ability to access funding to execute our business plan and improve our business, financial condition and results of operations;
a significant malfunction, disruption or security breach compromising our information technology systems or the electronic control systems contained in our vehicles;
our ability to realize anticipated benefits from joint venture arrangements;
our ability to successfully implement and execute strategic initiatives and transactions, including our plans to separate certain businesses;
disruptions arising from political, social and economic instability;
risks associated with our relationships with employees, dealers and suppliers;
increases in costs, disruptions of supply or shortages of raw materials;
developments in labor and industrial relations and developments in applicable labor laws;
exchange rate fluctuations, interest rate changes, credit risk and other market risks;
political and civil unrest;
earthquakes or other disasters; and
other factors discussed elsewhere in this report.
Furthermore, in light of the inherent difficulty in forecasting future results, any estimates or forecasts of particular periods that are provided in this report are uncertain. We expressly disclaim and do not assume any liability in connection with any inaccuracies in any of the forward-looking statements in this report or in connection with any use by any third party of such forward-looking statements. Actual results could differ materially from those anticipated in such forward-looking statements. We do not undertake an obligation to update or revise publicly any forward-looking statements.
Additional factors which could cause actual results and developments to differ from those expressed or implied by the forward-looking statements are included in the section Risk Factors in this report.
Board Report
Introduction

16 2018 | ANNUAL REPORT
Management Report
Selected Financial DataThe following tables set forth selected historical consolidated financial and other data of FCA and have been derived, in part, from:
the Consolidated Financial Statements of FCA as of December 31, 2018 and 2017 and for the years ended December 31, 2018, 2017 and 2016, included elsewhere in this report; and
the Consolidated Financial Statements of FCA as of December 31, 2016, 2015 and 2014, for the years ended December 31, 2015 and 2014, which are not included in this report.
This data should be read in conjunction with Presentation of Financial and Other Data, Risk Factors, the FINANCIAL OVERVIEW section and the Consolidated Financial Statements and related notes included elsewhere in this report.
CONSOLIDATED INCOME STATEMENT DATA
Years ended December 31,
2018(1) 2017(1) 2016(1) 2015(1,2) 2014(1,2)
(€ million, except per share amounts)
Net revenues € 110,412 € 105,730 € 105,798 € 105,859 € 89,350
Profit before taxes € 4,108 € 5,879 € 2,950 € 99 € 719
Net profit/(loss) from continuing operations € 3,330 € 3,291 € 1,713 € (15) € 269
Profit from discontinued operations, net of tax € 302 € 219 € 101 € 392 € 363
Net profit € 3,632 € 3,510 € 1,814 € 377 € 632
Net profit attributable to:
Owners of the parent € 3,608 € 3,491 € 1,803 € 334 € 568
Non-controlling interests € 24 € 19 € 11 € 43 € 64
Earnings/(Loss) per share from continuing operations
Basic earnings/(loss) per share € 2.15 € 2.14 € 1.13 € (0.01) € 0.20
Diluted earnings/(loss) per share € 2.12 € 2.11 € 1.12 € (0.01) € 0.20
Earnings per share from discontinued operations
Basic earnings per share € 0.18 € 0.14 € 0.06 € 0.23 € 0.27
Diluted earnings per share € 0.18 € 0.13 € 0.06 € 0.23 € 0.26
Earnings per share from continuing and discontinued operations
Basic earnings per share € 2.33 € 2.27 € 1.19 € 0.22 € 0.46
Diluted earnings per share € 2.30 € 2.24 € 1.18 € 0.22 € 0.46
Other Statistical Information (unaudited):
Combined shipments (in thousands of units)(3) 4,842 4,740 4,720 4,738 4.743
Consolidated shipments (in thousands of units)(4) 4,655 4,423 4,482 4,602 4.601(1) The operating results of FCA for the years ended December 31, 2018, 2017, 2016, 2015 and 2014 exclude Magneti Marelli following the
classification of Magneti Marelli as a discontinued operation for the year ended December 31, 2018; Magneti Marelli operating results were excluded from the Group’s continuing operations and are presented as a single line within the Consolidated Income Statement data for the years ended December 31, 2018, 2017, 2016, 2015 and 2014 presented above.
(2) The operating results of FCA for the years ended December 31, 2015 and 2014 exclude Ferrari following the classification of Ferrari as a discontinued operation for the year ended December 31, 2015; Ferrari operating results were excluded from the Group’s continuing operations and are presented as a single line item within the Consolidated Income Statements for each of the years ended December 31, 2015 and 2014.
(3) Combined shipments include shipments by the Group’s consolidated subsidiaries and unconsolidated joint ventures.(4) Consolidated shipments only include shipments by the Group’s consolidated subsidiaries.
Board Report
Management Report

2018 | ANNUAL REPORT 17
CONSOLIDATED STATEMENT OF FINANCIAL POSITION DATA
At December 31,
2018(1) 2017(1) 2016(1) 2015(1,2) 2014 (1,2)
(€ million, except shares issued data)
Cash and cash equivalents € 12,450 € 12,638 € 17,318 € 20,662 € 22,840
Total assets € 96,873 € 96,299 € 104,343 € 105,753 € 101,149
Debt € 14,528 € 17,971 € 24,048 € 27,786 € 33,724
Total equity € 24,903 € 20,987 € 19,353 € 16,968 € 14,377
Equity attributable to owners of the parent € 24,702 € 20,819 € 19,168 € 16,805 € 14,064
Non-controlling interests € 201 € 168 € 185 € 163 € 313
Share capital € 19 € 19 € 19 € 17 € 17
Shares issued (in thousands):
Common(3)(4) 1,550,618 1,540,090 1,527,966 1,288,956 1,284,919
Special Voting(4) 408,942 408,942 408,942 408,942 408,942(1) The assets and liabilities of Magneti Marelli were classified as Assets held for sale and Liabilities held for sale within the Consolidated Statement
of Financial Position at December 31, 2018, while the assets and liabilities of Magneti Marelli have not been classified as such within the comparative Consolidated Statements of Financial Position at December 31, 2017, 2016, 2015 and 2014.
(2) The assets and liabilities of Ferrari were classified as Assets held for distribution and Liabilities held for distribution within the Consolidated Statement of Financial Position at December 31, 2015, while the assets and liabilities of Ferrari have not been classified as such within the comparative Consolidated Statement of Financial Position at December 31, 2014.
(3) Book value per common share at December 31, 2018 was €15.93.(4) Refer to Note 26, Equity, within our Consolidated Financial Statements included elsewhere in this report.

18 2018 | ANNUAL REPORT
Group Overview
We are a global automotive group engaged in designing, engineering, manufacturing, distributing and selling vehicles, components and production systems worldwide through 102 manufacturing facilities and 46 research and development centers.(1) We have operations in more than 40 countries and sell our vehicles directly or through distributors and dealers in more than 135 countries. We design, engineer, manufacture, distribute and sell vehicles for the mass-market under the Abarth, Alfa Romeo, Chrysler, Dodge, Fiat, Fiat Professional, Jeep, Lancia and Ram brands and the SRT performance vehicle designation. For our mass-market vehicle brands, we have centralized design, engineering, development and manufacturing operations, which allow us to efficiently operate on a global scale. We support our vehicle shipments with the sale of related service parts and accessories, as well as service contracts, worldwide under the Mopar brand name for mass-market vehicles. In addition, we design, engineer, manufacture, distribute and sell luxury vehicles under the Maserati brand. We make available retail and dealer financing, leasing and rental services through our subsidiaries, joint ventures and commercial arrangements with third party financial institutions. In addition, we operate in the components and production systems sectors under the Teksid and Comau brands.
In 2018, we shipped 4.8 million vehicles (including the group’s unconsolidated joint ventures), resulting in Net revenues of €110.4 billion and Net profit of €3.6 billion, of which €3.3 billion was attributable to continuing operations. At December 31, 2018, including Magneti Marelli, our available liquidity was €21.1 billion (including €7.7 billion available under undrawn committed credit lines) and our Net industrial cash was €1.9 billion (See Non-GAAP Financial Measures).
History of FCAFiat Chrysler Automobiles N.V. was incorporated as a public limited liability company (naamloze vennootschap) under the laws of the Netherlands on April 1, 2014 and became the parent company of the Group on October 12, 2014. Its principal office is located at 25 St. James’s Street, London SW1A 1HA, United Kingdom (telephone number: +44 (0) 20 7766 0311). Its agent for U.S. federal securities law purposes is Christopher J. Pardi, c/o FCA US LLC, 1000 Chrysler Drive, Auburn Hills, Michigan 48326.
Fiat, the predecessor to FCA, was founded as Fabbrica Italiana Automobili Torino on July 11, 1899 in Turin, Italy as an automobile manufacturer. In 1902, Giovanni Agnelli, Fiat’s founder, became the Managing Director of the company.
In April 2009, Fiat and Old Carco LLC, formerly known as Chrysler LLC (“Old Carco”) entered into an agreement, pursuant to which FCA US LLC, then known as Chrysler Group LLC, (“FCA US”) agreed to purchase the principal operating assets of Old Carco and to assume certain Old Carco liabilities. Following the closing of that transaction, Fiat held an initial 20 percent ownership interest in FCA US. Old Carco traced its roots to the company originally founded by Walter P. Chrysler in 1925.
Over the following years, Fiat acquired additional ownership interests in FCA US and in January 2014, Fiat purchased all of the equity interests in FCA US that it did not then hold, resulting in FCA US becoming a 100 percent owned subsidiary.
In January 2011, the separation of Fiat’s non-automotive capital goods businesses was completed with the creation of Fiat Industrial, now known as CNH Industrial N.V. (“CNHI”).
Corporate ReorganizationOn October 12, 2014, Fiat completed a corporate reorganization resulting in the establishment in the Netherlands of FCA NV as the parent company of the Group, with its principal executive offices in the United Kingdom.
On October 13, 2014, FCA common shares commenced trading on the Milan Mercato Telematico Azionario (“MTA”) and the New York Stock Exchange (“NYSE”). As a result, FCA NV, as successor of Fiat S.p.A., is the parent company of the Group.
(1) Excluding facilities relating to Magneti Marelli.
Board Report
Group Overview

2018 | ANNUAL REPORT 19
Ferrari Spin-offThe spin-off of Ferrari N.V. was approved on December 3, 2015 at the extraordinary general meeting of FCA shareholders. The Group classified the Ferrari segment as a discontinued operation for the year ended December 31, 2015 and, consequently, the results of Ferrari were excluded from the Group’s continuing operations, with the after-tax result of Ferrari’s operations shown as a single line item within the Consolidated Income Statement for the year ended December 31, 2015.
The spin-off of Ferrari N.V. from the Group was completed on January 3, 2016. The assets and liabilities of the Ferrari segment were distributed to holders of FCA shares and mandatory convertible securities. Since Exor N.V., which controls and consolidates FCA, continued to control and consolidate Ferrari N.V., the spin-off of Ferrari N.V. was accounted for at book value without any gain or loss on the distribution.
Magneti Marelli SaleOn April 5, 2018, the FCA Board of Directors announced that it had authorized FCA management to develop and implement a plan to separate the Magneti Marelli business from the Group.
At September 30, 2018, the separation within the next twelve months became highly probable and Magneti Marelli operations met the criteria to be classified as a disposal group held for sale. It also met the criteria to be classified as a discontinued operation pursuant to IFRS 5 - Non-current Assets Held for Sale and Discontinued Operations.
On October, 22, 2018, FCA announced that it has entered into a definitive agreement to sell its Magneti Marelli business to CK Holdings, Ltd. The agreement represents a transaction value of €6.2 billion, subject to certain adjustments. The transaction is expected to close in the second quarter of 2019, subject to regulatory approvals and other customary closing conditions.
Major ShareholdersExor N.V. is the largest shareholder of FCA through its 28.98 percent shareholding interest in our issued common shares (as of February 20, 2019). As a result of the loyalty voting mechanism, Exor N.V.’s voting power is 42.11 percent.
Consequently, Exor N.V. could strongly influence all matters submitted to a vote of FCA shareholders, including approval of annual dividends, election and removal of directors and approval of extraordinary business combinations.
Exor N.V. is controlled by Giovanni Agnelli B.V. (“GA”), which holds 52.99 percent of its share capital. GA is a private limited liability company under Dutch law with its capital divided in shares and currently held by members of the Agnelli and Nasi families, descendants of Giovanni Agnelli, founder of Fiat. Its present principal business activity is to purchase, administer and dispose of equity interests in public and private entities and, in particular, to ensure the cohesion and continuity of the administration of its controlling equity interests. The directors of GA are John Elkann, Tiberto Brandolini d’Adda, Alessandro Nasi, Andrea Agnelli, Eduardo Teodorani-Fabbri, Luca Ferrero de’ Gubernatis Ventimiglia, Jeroen Preller and Florence Hinnen.
Based on the information in FCA’s shareholder register, regulatory filings with the AFM and the SEC and other sources available to FCA, the following persons owned, directly or indirectly, in excess of three percent of FCA’s capital and/or voting interest as of February 20, 2019:
FCA ShareholdersNumber of Issued Common Shares Percentage Owned
Exor N.V.(1) 449,410,092 28.98
Tiger Global Management LLC(2) 81,375,000 5.25
Harris Associates L.P.(3) 59,119,458 3.81(1) In addition, Exor N.V. holds 375,803,870 special voting shares; Exor N.V.’s beneficial ownership in FCA is 42.11 percent, calculated as the ratio
of (i) the aggregate number of common and special voting shares owned by Exor N.V. and (ii) the aggregate number of outstanding common shares and issued special voting shares.
(2) Tiger Global Management LLC,Charles P. Coleman III and Scott Shleifer beneficially own the aggregate amount of 81,375,000 common shares (4.15 percent of the issued shares).
(3) Harris Associates L.P. beneficially owns 59,119,458 common shares (3.02 percent of the issued shares).

20 2018 | ANNUAL REPORT
Based on the information in FCA’s shareholder register and other sources available to us, as of January 31, 2019, approximately 443.6 million FCA common shares, or 29 percent of the FCA common shares, were held in the United States. As of the same date, approximately 1,100 record holders had registered addresses in the United States.
OUR BUSINESS PLANOn June 1, 2018, FCA’s former Chief Executive Officer Sergio Marchionne, together with members of the Group’s executive management, presented the Group’s 2018-2022 business plan (the “business plan”). On February 7, 2019, CEO Mike Manley highlighted additional measures to improve operating results in EMEA, APAC with specific focus on China, and in Maserati.
The business plan and the measures mentioned above build upon the strategic actions taken in the prior plan to generate volume growth and margin expansion through the following:
Continued emphasis on building strong brands by leveraging renewals of key products and portfolio expansion;
Through new white space products with particular focus on the Jeep, Ram, Maserati and Alfa Romeo brands;
Improve positioning of Maserati as a luxury brand, bridging product gap with specialty models and redirection of marketing to focus on Levante;
Refocus marketing in China to recently launched products, offer more efficient powertrain combinations and product quality improvements;
Continue to focus on industrial rationalization to deliver cost savings through manufacturing and purchasing efficiencies and implement actions to increase capacity utilization in EMEA;
Implementation of various electrified powertrain applications throughout the portfolio as part of our regulatory compliance strategy;
Continue to explore opportunities to develop partnerships to share technologies and platforms, enhance skill set related to autonomous driving technologies, preserve full optionality and ensure speed to market; and
Maintain a disciplined approach to the deployment of capital and re-establish consistent shareholder remuneration actions.
We continue to assess the potential impacts of operationalizing and implementing the strategic targets set out in the business plan, including re-allocation of our resources. The recoverability of certain of our assets or Cash-Generating Units (“CGUs”) may be impacted in future periods. For example, our product development strategies may be affected by regulatory changes as well as changes in the expected costs of implementing electrification, including the cost of batteries. As relevant circumstances change, we expect to adjust our product plans which may result in changes to the expected use of certain of the Group’s vehicle platforms. In addition, recoverability of certain vehicle platforms, particularly in EMEA, depends on the development and launch of additional vehicles with forecasted volumes and margins largely in line with our business plan. These uncertainties could result in either impairments of, or reductions to the expected useful lives of, these platforms, or both.
Refer to Note 26, Equity within the Consolidated Financial Statements included elsewhere in this report for additional detail on the proposed annual ordinary dividend distribution to holders of FCA common shares.
Board Report
Group Overview

2018 | ANNUAL REPORT 21
OVERVIEW OF OUR BUSINESSOur activities are carried out through the following five reportable segments:
(i) NAFTA: our operations to support distribution and sale of mass-market vehicles in the United States, Canada, Mexico and Caribbean islands, primarily under the Jeep, Ram, Dodge, Chrysler, Fiat, Alfa Romeo and Abarth brands.
(ii) LATAM: our operations to support the distribution and sale of mass-market vehicles in South and Central America, primarily under the Fiat, Jeep, Dodge and Ram brands, with the largest focus of our business in Brazil and Argentina.
(iii) APAC: our operations to support the distribution and sale of mass-market vehicles in the Asia Pacific region (mostly in China, Japan, India, Australia and South Korea) carried out in the region through both subsidiaries and joint ventures, primarily under the Jeep, Fiat, Alfa Romeo, Abarth, Fiat Professional, Ram and Chrysler brands.
(iv) EMEA: our operations to support the distribution and sale of mass-market vehicles in Europe (which includes the 28 members of the European Union and the members of the European Free Trade Association), the Middle East and Africa, primarily under the Fiat, Fiat Professional, Jeep, Alfa Romeo, Lancia, Abarth, Ram and Dodge brands.
(v) Maserati: the design, engineering, development, manufacturing, worldwide distribution and sale of luxury vehicles under the Maserati brand.
The results of our Magneti Marelli business were previously reported within the Components segment along with our industrial automation systems design and production business and our cast iron and aluminum components business. Following the classification of Magneti Marelli as a discontinued operation for the years ended December 31, 2018, 2017 and 2016, (refer to Note 3, Scope of consolidation), the remaining activities within the Components segment are no longer considered a separate reportable segment as defined by IFRS 8 - Operating Segments and are reported within “Other activities” described below.
We also own or hold interests in companies operating in other activities and businesses. These activities are grouped under “Other Activities”, which primarily consists of our industrial automation systems design and production business, under the Comau brand name, and our cast iron and aluminum business, which produces cast iron components for engines, gearboxes, transmissions and suspension systems, and aluminum cylinder heads and engine blocks, under the Teksid brand name, as well as companies that provide services, including accounting, payroll, tax, insurance, purchasing, information technology, facility management and security for the Group, and manage central treasury activities.
Definitions and abbreviations Utility vehicles (“UVs”) include sport utility vehicles (“SUVs”), which are available with four-wheel drive systems that provide true off-road capabilities, and crossover utility vehicles, (“CUVs”), which are not designed for heavy off-road use. UVs can be divided among six main groups, ranging from “micro” or “A segment”, defined as UVs that are less than 3.9 meters in length, to “large” or “F segment”, defined as UVs that are greater than 5.2 meters in length. Light trucks may be divided between vans (also known as light commercial vehicles, or “LCVs”), which typically are used for the transportation of goods or groups of people, and pickup trucks, which are light motor vehicles with an open-top rear cargo area.
Minivans, also known as multi-purpose vehicles (“MPVs”) typically have seating for up to eight passengers. Passenger cars include sedans, station wagons and three- and five-door hatchbacks, that may range in size from “micro” or “A segment” vehicles of less than 3.7 meters in length to “large” or “F segment” cars that are greater than 5.1 meters in length.
A vehicle is characterized as “all-new” if its vehicle platform is significantly different from the platform used in the prior model year and/or it has had a full exterior renewal.
A vehicle is characterized as “significantly refreshed” if it continues its previous vehicle platform but has extensive changes or upgrades from the prior model year.

22 2018 | ANNUAL REPORT
Design and ManufacturingWe sell mass-market vehicles in the SUV, passenger car, truck and light commercial vehicle markets. Our SUV and CUV portfolio includes the Jeep Grand Cherokee, Jeep Cherokee, Jeep Wrangler, Jeep Renegade, Jeep Compass, all-new Jeep Grand Commander, Dodge Durango, Dodge Journey and Alfa Romeo Stelvio. Our passenger car product portfolio includes vehicles such as the Fiat 500, Alfa Romeo Giulia, Dodge Challenger and Charger and minivans such as the Chrysler Pacifica. We sell light and heavy-duty pickup trucks such as the Ram 1500 and 2500/3500, the Fiat Toro and Fiat Fullback, chassis cabs such as the Ram 3500/4500/5500 and our light commercial vehicles include vans such as the Fiat Professional Doblò, Fiat Professional Ducato and Ram ProMaster.
Our efforts to respond to customer demand have led to a number of important initiatives, including localized production of Jeep vehicles in Italy, China, India and Brazil.
We have deployed World Class Manufacturing (“WCM”) principles throughout our manufacturing operations. WCM principles were developed by the WCM Association, a non-profit organization dedicated to developing superior manufacturing standards. We are the only Original Equipment Manufacturer (“OEM”) that is a member of the WCM Association. WCM fosters a manufacturing culture that targets improved safety, quality and efficiency, as well as the elimination of all types of waste. Unlike some other advanced manufacturing programs, WCM is designed to prioritize issues, focus on those initiatives believed likely to yield the most significant savings and improvements, and direct resources to those initiatives. We also offer several types of WCM programs to our suppliers whereby they can learn and incorporate WCM principles into their own operations.
Research and DevelopmentWe engage in research and development activities aimed at improving the design, performance, safety, fuel efficiency, reliability, consumer perception and sustainability of our products and services. As of December 31, 2018, we operated 46 research and development centers worldwide with a combined headcount of approximately 18 thousand employees supporting our research and development efforts.(1)
Historically, we have concentrated the majority of our efficiency research efforts in two areas: reducing vehicle energy demand and reducing fuel consumption and emissions. Fuel consumption and emissions reduction activities have been primarily focused on powertrain technologies including: engines, transmissions and drivelines, hybrid and electric propulsion and alternative fuels. In recent years, we have increased our research efforts on autonomous driving and connectivity technologies.
Vehicle Energy DemandOur research focuses on reducing weight, aerodynamic drag, tire rolling resistance, brake drag torque, driveline parasitic losses, heating and air conditioning, and electrical loads. We also continue to develop both conventional and hybrid vehicle technologies aimed at improving kinetic energy recovery and re-use of thermal energy to reduce total energy consumption and CO2 emissions.
We have introduced active aerodynamic devices, which activate automatically under certain operating conditions. These active aerodynamic devices include active grille shutters, active front air dams and adjustable height suspension. Further, we have introduced smart actuators, such as variable speed fuel pumps, variable displacement air conditioning compressors and high efficiency brushless electric motors for cooling fans, to reduce fuel consumption. Such smart actuators only require the energy needed for each specific working condition, avoiding electric energy waste.
Board Report
Group Overview
(1) Excluding facilities relating to Magneti Marelli.

2018 | ANNUAL REPORT 23
Powertrain Technologies
EnginesWe have developed global small and global medium displacement gasoline engine families to improve fuel economy and emissions. These engine families include three and four cylinder turbocharged versions (the global small engine family also has three and four cylinder naturally aspirated variants). Each engine family features a modular approach using a shared cylinder design (allowing for different engine configuration, displacements, efficiency and power outputs). Each is based on a specific cylinder configuration which provides important synergies for the engine development (common combustion development and common design layout) and for manufacturing (common machining, assembly features and components and subsystems). When fully deployed these engine families will cover a large range of vehicle applications and introduce features and technologies such as direct fuel injection, downsizing, integrated exhaust manifold, Multiair variable valve lift, turbocharging, and cooled exhaust gas recirculation. All of these features enable the engine families to be competitive among small and medium displacement engines with respect to fuel consumption, performance, weight and noise, vibration and harshness (“NVH”) behavior.
Both a 1.0L three cylinder and a 1.3L four cylinder naturally aspirated Firefly global small engine were launched in the LATAM region in the third quarter of 2016 and in the second quarter of 2018 turbocharged variants of the global small engine launched in the EMEA region (in the Jeep Renegade and Fiat 500X). Additionally, the first global medium engine application (a 2.0L turbo four cylinder engine) launched in the Alfa Romeo Giulia in the fourth quarter of 2016 and in 2018 a dual overhead camshaft version of the global medium engine (with cooled exhaust gas recirculation) became available in the Jeep Cherokee and Jeep Wrangler. To meet increasingly more stringent air quality standards, we have employed the use of gasoline particulate filters with both global engine families in some EMEA and APAC markets.
Looking to the future, FCA is participating in the development of new and improved aluminum alloys for engine use. This work has demonstrated an aluminum alloy capable of a 50 percent increase in strength at 300° Celsius when compared to other currently used aluminum alloys. While still in very early development, this type of alloy strength behavior has the potential to provide increased design flexibility for cylinder heads and cylinder blocks and help to enable increased engine efficiency.
Transmissions and DrivelineOur transmission portfolio includes manual transmissions, dual dry clutch transmissions and automatic transmissions.
Our automatic transmission portfolio includes 8- and 9-speed units developed in an effort to provide our customers with improved efficiency, performance and drive comfort. Long travel damper and pendulum damper technologies are used to allow the engine to operate at a lower speed and higher torque - where the engine is more efficient at converting the fuel energy to mechanical energy.
Other improvements are used to reduce the power consumption of the transmission. The second generation TorqueFlite 8-speed improves transmission efficiency via improved line pressure control and reduced clutch drag. The addition of transmission oil heaters allows the transmission to quickly warm up to operating temperatures and improve transmission efficiency. We are investigating many other technologies to increase transmission system efficiency such as selectable one-way clutches and reduced oil viscosity.
In support of global fuel consumption and CO2 requirements, we have developed our first dedicated hybrid transmission (the eFlite), used in the Chrysler Pacifica Hybrid. The new eFlite hybrid transmission architecture is an electrically variable front wheel drive transaxle with a split input configuration and incorporates two electric motors, both capable of driving in full electric mode. The lubrication and cooling system makes use of two pumps, one electrically operated and one mechanically driven. We expect future hybrid vehicle portfolio growth with the eFlite transmission and similar electrified propulsion systems.

24 2018 | ANNUAL REPORT
Electric and Hybrid TechnologiesFCA has developed a suite of electrification technologies, including: 12 volt engine stop/start, 48 volt mild hybrid, plug-in hybrid, and full battery electric vehicles. These developments have occurred at FCA technical centers primarily in Auburn Hills (Michigan, USA), Modena and Turin (Italy). However, substantial work has also been performed with suppliers and universities located around the globe.
The 12 volt stop/start system turns off the engine and fuel flow automatically when the vehicle comes to a halt and re-starts the engine upon the driver disengaging the brake. Phase-in of this technology began in 2013 model year and in 2018 was used in approximately 42 percent of FCA’s global production volume.
In 2018 FCA launched three applications of mild hybrids using belt starter generator (“BSG”) technology. BSG technology offers improvements in fuel economy and a reduction in CO2 emissions. This new 48 volt mild hybrid technology is marketed as “eTorque” in the all-new 2018 Jeep Wrangler equipped with the 2.0L turbo engine and the all-new 2019 Ram 1500 5.7L and 3.6L applications. The system offers faster and smoother stop/start functionality, a real-time powertrain efficiency optimization manager which balances motor and engine torque, enhanced and extended fuel shut-off during certain maneuvers, and regenerative braking to recharge the 48 volt battery. The system also delivers significant gains in fuel economy. For example, the 2019 Ram 1500 5.7L HEMI V8 equipped with eTorque has a 13 percent improvement in city fuel economy and 10 percent reduction in combined CO2 over the base HEMI in a 4x2 Crew Cab model.
The Chrysler Pacifica Hybrid achieves an efficiency rating of 82 miles per gallon equivalent (“MPGe”), based on U.S. Environmental Protection Agency testing standards and has an approximately 72% reduction in CO2 compared to the non-hybrid Chrysler Pacifica. Power to the wheels is supplied via a 16 kWh battery through the hybrid electric drive system which is comprised of a specially adapted new version of the award winning Pentastar 3.6-liter V-6 engine and the new eFlite hybrid transmission.
The Fiat 500e is FCA’s full electric vehicle offering and is available only in the NAFTA market. It has an all-electric range of 84 miles and achieves 121 MPGe City, 103 MPGe Highway and 112 MPGe Combined. Since its introduction in the 2013 model year approximately 25,000 units have been sold.
We also supplement our internal research and development activities via collaboration with academic partners. One such example is a project in partnership with McMaster University (Canada), which focuses on developing next-generation, energy efficient, high performance, cost effective electrified powertrain components and control systems suitable for a range of vehicle applications.
Alternative FuelsFCA is among the EU-market leaders in compressed natural gas (“CNG”) propulsion. From 1997 to 2018, the Company’s output of CNG-powered vehicles in Europe exceeded 750,000 vehicles. In an experimental project, Company researchers in Europe built a Fiat Panda that runs on biomethane derived from sewage sludge and waste water.
Autonomous Driving TechnologyIn 2016, we announced a collaboration with Waymo (formerly the Google self-driving car project) to integrate its self-driving technology into the Chrysler Pacifica Hybrid. Production of the first 100 Chrysler Pacifica Hybrid minivans built to enable fully self-driving operations was completed in late 2016. In 2018, we announced that we would expand our partnership with an agreement to add up to 62,000 Chrysler Pacifica Hybrid minivans to Waymo’s self-driving fleet.
We have launched Highway Assist autonomous vehicle technology on several Maserati models. This system includes Mobileye vision technology to enable autonomous driving on designated highways. We are also partnering with BMW in the development of a Level 3 autonomous driving platform.
In 2017, we also revealed the Chrysler Portal concept, a semi-autonomous electric-powered vehicle that is designed with a suite of sensing technologies that enable Level 3 autonomous driving, with the potential to be upgraded as advances in technology enable higher levels of autonomy.
Board Report
Group Overview

2018 | ANNUAL REPORT 25
ConnectivityFCA is working with its suppliers to develop a cloud-based global connectivity solution that will connect to the Internet and an FCA-specific service delivery platform and allow the driver and passengers to interact with the car and the outside world. The solution is intended to be scalable, increase safety and security and provide real time availability of services and information.
Compliance-focused Initiatives by RegionThe regulatory environment outlook across our four major regions shows continued consistent CO2 reductions, ranging from 25-30 percent between 2018 and 2024. This anticipated regulatory stringency balanced with customer preferences guides research and development for future products and will be highlighted below by region and key product segment.
NAFTAThe U.S. policy is complex with three separate CO2 regulations, but it also contains a flexible array of new technology incentives to encourage industry movement toward an electrified future. For instance, U.S. regulation includes a tax credit to consumers of up to $7,500 to jump start demand, which is required given relatively low fuel prices and increasing consumer preference for SUV and trucks in the market.
American consumers tend to have long commutes and ready access to charging capability at home. FCA plans, by 2022, for 20 percent of its overall fleet (including commercial vehicles) to be high voltage, with a focus on plug-in systems. 15 percent of the fleet to be equipped with mild hybrid systems and 65 percent to retain conventional internal combustion engines.
LATAMWith its ability to grow sugar cane in high volume, Brazil is able to address CO2 reduction with a different approach. Today about 30 percent of vehicle fuel usage in Brazil consists of sugar cane produced ethanol. Sugar cane ethanol is 80 percent renewable from “well” (or field) to wheels and provides approximately 12.5 percent CO2 reduction on an equivalent 30/70 fuel mix E100/E22 basis. The Brazilian government recently launched a plan (RenovaBio) to improve quality and productiveness of ethanol, targeting an increase of share on Ethanol E100 in the fuel matrix from the current 30 percent to 40 percent in 2022 and to 55 percent in 2030. In addition, the Brazilian government and FCA are working very closely on research and development opportunities to further reduce CO2 emissions through improvements to ethanol-fueled engines.
Brazilian consumers already widely use ethanol fuel, readily available in the current retail fuel market. FCA believes that Brazilian CO2 fleet reduction targets will be met through 2025 with increased usage and efficiency of its ethanol based engines and without any high voltage electrification.
APACChina is leading the rapid change in this region. The Chinese government has stated intentions to become the global leader in electrification in the next decade. The regulatory policies include credit multipliers and incentives for new energy vehicles which are defined as battery electric, plug-in hybrid, or fuel cell vehicles.
Some large cities provide consumers with license plate incentives for new energy vehicles. Given these incentives can be as high as €11,000 per vehicle, we believe they will be successful in driving the market toward electrification.
From a consumer perspective, China has the highest number of first time car buyers in the world. Since much of the vehicle consumer demographic resides in urban areas, access to public charging is expected to be a critical element to achieving China’s electrified objectives.
FCA’s plan is, by 2022, for 15 percent of the overall fleet (including commercial vehicles) to use high voltage electrification, with the highest penetration of full battery electric of any region, 20 percent of the fleet to be equipped with a hybrid system and 65 percent of the fleet to retain conventional internal combustion engines.

26 2018 | ANNUAL REPORT
In contrast to China, India continues to be a very cost sensitive market with a developing infrastructure. As a result, increased regulatory requirements are expected to be met through application of shared conventional technologies with limited dependence on electrification.
EMEAEurope represents the most challenging combination of regulatory stringency and consumer price sensitivity. The EU is driving a step function reduction in CO2 in 2020, and metropolitan areas are implementing low emission zones in an attempt to improve air quality in city centers. Conventional internal combustion engine applications will likely be restricted, especially with aging vehicles. The CO2 financial penalty structure is very significant.
Many consumers in Europe need reduced cost of vehicle ownership given high fuel prices and pressure on disposable income. As the demand for diesels continues to decrease, FCA intends to use mild hybrids as a replacement. The region will need to address the development of charging infrastructure so that zero emission vehicles are more convenient for consumers.
FCA’s plan is, by 2022, for 20 percent of the overall fleet (including commercial vehicles) to use high voltage electrification, 40 percent of the fleet to be equipped with a mild hybrid system and 40 percent to retain conventional internal combustion engines.
Intellectual PropertyWe own a significant number of patents, trade secrets, licenses, trademarks and service marks, including, in particular, the marks of our vehicle and component and production systems brands, which relate to our products and services. We expect the number to grow as we continue to pursue technological innovations. We file patent applications in Europe, the U.S. and around the world to protect technology and improvements considered important to our business. No single patent is material to our business as a whole.
Property, Plant and EquipmentAs of December 31, 2018, we operated 102 manufacturing facilities (including vehicle and light commercial vehicle assembly, powertrain and components plants, excluding joint ventures and Magneti Marelli facilities), of which 27 were located in Italy, 13 in the rest of Europe, 26 in the U.S., 12 in Brazil, 9 in Mexico, 6 in Canada, 3 in Argentina and the remaining plants in other countries. We also own other significant properties including parts distribution centers, research laboratories, test tracks, warehouses and office buildings. The total carrying value of our property, plant and equipment as of December 31, 2018 was €26.3 billion.
A number of our manufacturing facilities and equipment, including land and industrial buildings, plant and machinery and other assets, are subject to mortgages and other security interests granted to secure indebtedness to certain financial institutions. As of December 31, 2018, our property, plant and equipment reported as pledged as collateral for loans amounted to approximately €2.2 billion (refer to Note 11, Property, plant and equipment).
We believe that planned production capacity is adequate to satisfy anticipated retail demand and our operations are designed to be flexible enough to accommodate the planned product design changes required to meet global market conditions and new product programs (such as through leveraging existing production capacity in each region for export needs).
We are not aware of any environmental issues that would materially affect the utilization of our fixed assets. See Industrial Environmental Control.
Board Report
Group Overview
2018 | ANNUAL REPORT 27
Supply of Raw Materials, Parts and ComponentsWe purchase a variety of components (including mechanical, steel, electrical and electronic, plastic components as well as castings and tires), raw materials, supplies, utilities, logistics and other services from numerous suppliers. Historically the purchase of raw materials, parts and components have accounted for 70-80 percent of total Cost of revenues. Of these purchases, 10-15 percent relate to the cost of raw materials, including steel, rubber, aluminum, resin, copper, lead, and precious metals (including platinum, palladium and rhodium).
Our focus on quality improvement, cost reduction, product innovation and production flexibility requires us to rely upon suppliers with a focus on quality and the ability to provide cost reductions. We value our relationships with suppliers, and in recent years, we have worked to establish closer ties with a significantly reduced number of suppliers by selecting those that enjoy a leading position in the relevant markets. In addition, we source some of the parts and components for our vehicles internally from Teksid. We have also agreed to a multi-year supply agreement with Magneti Marelli in connection with our expected sale of that business. Although we have not experienced any major loss of production as a result of material or parts shortages in recent years, because we, like most of our competitors, regularly source some of our systems, components, parts, equipment and tooling from a single provider or limited number of providers, we are at risk of production delays and lost production should any supplier fail to deliver goods and services on time.
Supply of raw materials, parts and components may also be disrupted or interrupted by natural disasters. In such circumstances, we work proactively with our suppliers to identify material and part shortages and take steps to mitigate their impact by deploying additional personnel, accessing alternative sources of supply and managing our production schedules. We also continue to refine our processes to identify emerging capacity constraints in the supplier tiers given the ramp up in manufacturing volumes to meet our volume targets. Furthermore, we continuously monitor supplier performance according to key metrics such as part quality, delivery, performance, financial solvency and sustainability.
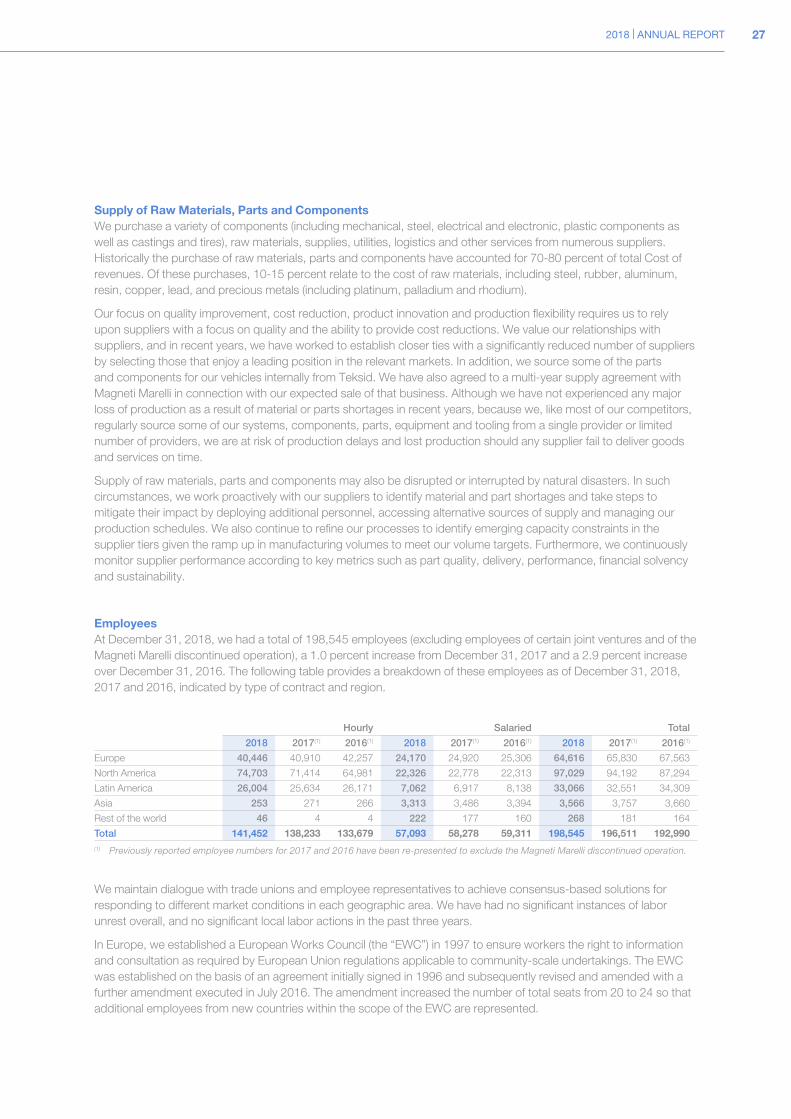
EmployeesAt December 31, 2018, we had a total of 198,545 employees (excluding employees of certain joint ventures and of the Magneti Marelli discontinued operation), a 1.0 percent increase from December 31, 2017 and a 2.9 percent increase over December 31, 2016. The following table provides a breakdown of these employees as of December 31, 2018, 2017 and 2016, indicated by type of contract and region.
Hourly Salaried Total
2018 2017(1) 2016(1) 2018 2017(1) 2016(1) 2018 2017(1) 2016(1)
Europe 40,446 40,910 42,257 24,170 24,920 25,306 64,616 65,830 67,563
North America 74,703 71,414 64,981 22,326 22,778 22,313 97,029 94,192 87,294
Latin America 26,004 25,634 26,171 7,062 6,917 8,138 33,066 32,551 34,309
Asia 253 271 266 3,313 3,486 3,394 3,566 3,757 3,660
Rest of the world 46 4 4 222 177 160 268 181 164
Total 141,452 138,233 133,679 57,093 58,278 59,311 198,545 196,511 192,990(1) Previously reported employee numbers for 2017 and 2016 have been re-presented to exclude the Magneti Marelli discontinued operation.
We maintain dialogue with trade unions and employee representatives to achieve consensus-based solutions for responding to different market conditions in each geographic area. We have had no significant instances of labor unrest overall, and no significant local labor actions in the past three years.
In Europe, we established a European Works Council (the “EWC”) in 1997 to ensure workers the right to information and consultation as required by European Union regulations applicable to community-scale undertakings. The EWC was established on the basis of an agreement initially signed in 1996 and subsequently revised and amended with a further amendment executed in July 2016. The amendment increased the number of total seats from 20 to 24 so that additional employees from new countries within the scope of the EWC are represented.

28 2018 | ANNUAL REPORT
Trade Unions and Collective BargainingFCA employees are free to join any trade union provided they do so in accordance with local law and the rules of the related trade union. The Group recognizes and respects the right of its employees to be represented by trade unions or other representatives in accordance with local applicable legislation and practice.
A large portion of our workers in Italy, the U.S., Canada and Mexico are represented by trade unions. In addition to the rights granted to all Italian trade unions and workers concerning freedom of association, we provide an additional service to our Italian employees by paying the trade union dues on their behalf.
Collective bargaining at various levels resulted in major agreements being reached with trade unions on both wage and employment conditions in several countries. Based on an average figure that includes the Sevel plant (Italy), 88.8 percent of our employees worldwide are covered by collective bargaining agreements.
In Italy, all of our employees are covered by collective bargaining agreements. In April 2015, a four-year compensation agreement was signed by FCA companies within the automobiles business in Italy. The new compensation agreement was subsequently included into the labor agreement and was extended to all FCA companies in Italy on July 7, 2015. The compensation arrangement was effective retrospectively from January 1, 2015 through December 31, 2018 and incentivized all employees towards achievement of the productivity, quality and profitability targets established in the 2015-2018 period of the Group’s business plan by including a continuous shift cycle (with a total of 20 shifts per week) and adding two variable additional elements to base pay:
an annual bonus, calculated on the basis of production efficiencies achieved and the plant’s WCM audit status; and
a component linked to achievement of the financial targets established in the 2015-2018 period of the business plan for the EMEA region, including the activities of the premium brands Alfa Romeo and Maserati.
Negotiations for the renewal of this labor contract commenced on November 29, 2018. As of February 22, 2019, negotiations are ongoing.
In October 2015, FCA US and the UAW agreed to a four-year national collective bargaining agreement, which will expire in September 2019. The provisions of the agreement continue certain opportunities for success-based compensation upon meeting certain quality and financial performance metrics. The agreement closes the pay gap between “Traditional” and “In-progression” employees over an eight-year period and will continue to provide UAW-represented employees with a simplified adjusted profit sharing plan. The adjusted profit sharing plan was effective for 2016 and was directly aligned with NAFTA profitability. The agreement included lump-sum payments in lieu of further wage increases of primarily U.S.$4,000 for “Traditional” employees and U.S.$3,000 for “In-progression” employees totaling approximately $141 million (€126 million) that was paid to UAW members on November 6, 2015.
In September 2016, the four-year collective bargaining agreement that was entered into in September 2012 with Unifor in Canada expired. FCA entered into a four year labor agreement with Unifor in Canada that was ratified on October 16, 2016. The terms of this agreement provide a two percent wage increase in the first and fourth years of the agreement for employees hired prior to September 24, 2012 and will continue to close the pay gap for employees hired on or after September 24, 2012 by revising a ten-year progressive pay scale plan. The agreement includes a lump sum payment in lieu of further wage increases of $6,000 Canadian dollars (“CAD$”) per employee totaling approximately CAD$55 million (approximately €38 million) that was paid to Unifor members on November 4, 2016. The agreement expires September 2020.
Both the Unifor and UAW lump-sum payments are being amortized ratably over the respective four-year labor agreement periods.
Board Report
Group Overview

2018 | ANNUAL REPORT 29
SALES OVERVIEWNew vehicle sales represent sales of FCA vehicles primarily by dealers and distributors, or, directly by us in some cases, to retail customers and fleet customers. Sales include mass-market and luxury vehicles manufactured at our plants, as well as vehicles manufactured by our joint ventures and third party contract manufacturers and distributed under our brands. Sales figures exclude sales of vehicles that we contract manufacture for other OEMs. While vehicle sales are illustrative of our competitive position and the demand for our vehicles, sales are not directly correlated to our Net revenues, Cost of revenues or other measures of financial performance in any given period, as such results are primarily driven by our vehicle shipments to dealers and distributors. For a discussion of our shipments, see FINANCIAL OVERVIEW—Shipment Information. The following table shows new vehicle sales by geographic market for the periods presented.
Years ended December 31,
2018 2017 2016(millions of units)
NAFTA 2.5 2.4 2.6
LATAM 0.6 0.5 0.5
APAC 0.2 0.3 0.2
EMEA 1.4 1.5 1.4
Total Mass-Market Vehicle Brands 4.7 4.7 4.7
Maserati 0.04 0.05 0.04
Total Worldwide 4.8 4.8 4.7
NAFTA
NAFTA Sales and CompetitionThe following table presents mass-market vehicle sales and estimated market share in the NAFTA segment for the periods presented:
Years ended December 31,
2018(1),(2) 2017(1),(2) 2016(1),(2)
NAFTA Sales Market Share Sales Market Share Sales Market ShareThousands of units (except percentages)
U.S. 2,235 12.6% 2,059 11.7% 2,244 12.6%
Canada 225 11.3% 267 13.0% 279 14.2%
Mexico and Other 74 5.1% 86 5.5% 88 5.3%
Total 2,534 12.0% 2,412 11.4% 2,611 12.2%(1) Certain fleet sales that are accounted for as operating leases are included in vehicle sales.(2) Estimated market share data presented are based on management’s estimates of industry sales data, which use certain data provided by
third-party sources, including IHS Markit and Ward’s Automotive.
The following table presents estimated new vehicle market share information for us and our principal competitors in the U.S., our largest market in the NAFTA segment:
Years ended December 31
U.S. 2018 2017 2016
Automaker Percentage of industry
GM 16.7% 17.1% 17.0%
Ford 14.1% 14.7% 14.6%
Toyota 13.7% 13.9% 13.7%
FCA 12.6% 11.7% 12.6%
Honda 9.1% 9.3% 9.2%
Nissan 8.4% 9.1% 8.8%
Hyundai/Kia 7.2% 7.3% 8.0%
Other 18.2% 16.9% 16.1%
Total 100.0% 100.0% 100.0%

30 2018 | ANNUAL REPORT
U.S. industry sales, including medium and heavy-duty vehicles, increased from 10.6 million units in 2009 to 17.7 million units in 2018. The strong recovery in the automotive sector, from 2009 through 2018, was supported by robust macroeconomic and automotive specific factors, such as growth in per capita disposable income, improved consumer confidence, the increasing age of vehicles in operation, improved consumer access to affordably priced financing and higher prices of used vehicles.
Our vehicle line-up in the NAFTA segment leverages the brand recognition of the Jeep, Ram, Dodge and Chrysler brands to offer utility vehicles, pickup trucks, cars and minivans under those brands, as well as vehicles in smaller segments, such as the Fiat 500 in the micro/small-segment and the Fiat 500X and Jeep Renegade in the small SUV/crossover segment. Our vehicle sales and profitability in the NAFTA segment are generally weighted towards larger vehicles such as utility vehicles, trucks and vans, consistent with overall industry sales trends in the NAFTA segment, which have become increasingly weighted towards utility vehicles and trucks in recent years. In 2017 we began to distribute the Alfa Romeo Giulia and Stelvio in the NAFTA region. Our improvement in 2018 sales was mainly attributable to the strong performance of the Jeep and Ram brands, for which growth was underpinned by the launch of new models.
NAFTA DistributionIn the NAFTA segment, our vehicles are sold primarily to dealers in our dealer network for sale to retail consumers and fleet customers. Fleet sales in the commercial channel are typically more profitable than sales in the government and daily rental channels since they more often involve customized vehicles with more optional features and accessories; however, vehicle orders in the commercial channel are usually smaller in size than the orders made in the daily rental channel. Fleet sales in the government channel are generally more profitable than fleet sales in the daily rental channel primarily due to the mix of products included in each respective channel.
NAFTA Dealer and Customer FinancingIn the NAFTA segment, we do not have a captive finance company or joint venture and instead rely upon independent financial service providers, including Santander Consumer USA Inc. (“SCUSA”) to provide financing for dealers and retail customers in the U.S. In February 2013, we entered into a private label financing agreement with SCUSA (the “SCUSA Agreement”), under which SCUSA provides a wide range of wholesale and retail financial services to our dealers and retail customers in the U.S., under the Chrysler Capital brand name and covering the Chrysler, Jeep, Dodge, Ram and Fiat brands.
The SCUSA Agreement has a ten year term from February 2013, subject to early termination in certain circumstances, including the failure by a party to comply with certain of its ongoing obligations under the agreement. Under the SCUSA Agreement, SCUSA has certain rights, including limited exclusivity to participate in specified minimum percentages of certain retail financing rate subvention programs. SCUSA’s exclusivity rights are subject to SCUSA maintaining certain performance standards and price competitiveness based on minimum approval rates and market benchmark rates to be determined through a steering committee process as set out in the SCUSA Agreement. SCUSA and FCA US have been in continual discussion regarding performance under the SCUSA Agreement. The parties entered into a Tolling Agreement in July 2018 with respect to the SCUSA Agreement, pursuant to which, among other things, the parties agreed each party shall fully preserve and retain its respective rights, claims and defenses as they existed on April 30, 2018.
As of December 31, 2018, SCUSA was providing wholesale lines of credit to approximately 10 percent of our dealers in the U.S., while Ally Financial Inc. (“Ally”) was at 34 percent. For the year ended December 31, 2018, we estimate that approximately 85 percent of the vehicles purchased by our U.S. retail customers were financed or leased of which approximately 52 percent financed or leased through SCUSA (37 percent) and Ally (15 percent). Alfa Romeo brand development within the U.S. is also supported by dealer and retail customer financing with primary financial institutions. Additionally, we have arrangements with a number of financial institutions to provide a variety of dealer and retail customer financing programs in Canada and a private label agreement with Inbursa Group in Mexico.
Board Report
Group Overview

2018 | ANNUAL REPORT 31
LATAM
LATAM Sales and CompetitionThe following table presents mass-market vehicle sales and market share in the LATAM segment for the periods presented:
Years ended December 31,
2018(1) 2017(1) 2016(1)
LATAM Sales Market Share Sales Market Share Sales Market ShareThousands of units (except percentages)
Brazil 434 17.5% 380 17.5% 365 18.4%
Argentina 99 12.8% 105 12.2% 79 11.6%
Other LATAM 33 2.9% 28 2.5% 29 2.9%
Total 566 12.8% 513 12.4% 473 12.9%(1) Estimated market share data presented are based on management’s estimates of industry sales data, which use certain data provided by
third-party sources, including IHS Markit, National Organization of Automotive Vehicles Distribution and Association of Automotive Producers.
The following table presents our mass-market vehicle market share information and our principal competitors in Brazil, our largest market in the LATAM segment:
Years ended December 31,
Brazil 2018(1) 2017(1) 2016(1)
Automaker Percentage of industry
GM 17.6% 18.1% 17.4%
FCA 17.5% 17.5% 18.4%
Volkswagen 14.8% 12.5% 12.1%
Ford 9.2% 9.5% 9.1%
Other 40.9% 42.4% 43.0%
Total 100.0% 100.0% 100.0%(1) Our estimated market share data presented are based on management’s estimates of industry sales data, which use certain data provided by
third-party sources, including IHS Markit, National Organization of Automotive Vehicles Distribution and Association of Automotive Producers.
The automotive industry within which the LATAM segment operates increased 7 percent from 2017 to 4.4 million vehicles (cars and light commercial vehicles) in 2018, which was primarily driven by a 14 percent increase in Brazil’s industry vehicle sales reflecting improving market conditions partially offset by a 10 percent decline in Argentina’s industry vehicle sales, reflecting the impact of the Argentina economic downturn.
Although Group revenues in LATAM increased 2 percent from 2017, the Group’s market share increased 40 basis points from 12.4 percent to 12.8 percent, reflecting market share growth in Argentina and other LATAM markets. In Brazil, overall market share remained flat at 17.5 percent while, in Argentina, overall market share increased to 12.8 percent from 12.2 percent in 2017.
Our vehicle line-up in LATAM leverages the brand recognition of Fiat, as well as the relatively urban population of countries like Brazil, to offer vehicles in smaller segments, such as the Fiat Mobi, Argo and Cronos. Fiat also leads the pickup truck market, in Brazil, with the Fiat Strada (20.6 percent market share) and the Fiat Toro (17.9 percent market share). Jeep is also continuing its momentum in the small and medium SUV segments with the Jeep Compass (11.9 percent market share) and the Jeep Renegade (9.2 percent market share).
LATAM DistributionIn the LATAM segment, we generally enter into multiple dealer agreements with a single dealer. Outside our major markets of Brazil and Argentina, we mainly distribute our vehicles through general distributors.

32 2018 | ANNUAL REPORT
LATAM Dealer and Customer FinancingIn the LATAM segment, we provide access to dealer and retail customer financing through both 100 percent owned captive finance companies and through strategic relationships with financial institutions.
We have two 100 percent owned captive finance companies in the LATAM segment: Banco Fidis S.A. (“Banco Fidis”) in Brazil and FCA Compañia Financiera S.A. in Argentina. These captive finance companies offer dealer and retail customer financing. In addition, in Brazil we have two significant commercial partnerships with Banco Itaù and Bradesco to provide financing to retail customers purchasing FCA branded vehicles. Banco Itaù is a leading vehicle retail financing company in Brazil. This partnership was renewed in August 2013 for a ten-year term ending in 2023. Under this agreement, Banco Itaù has exclusivity on our promotional campaigns and preferential rights on non-promotional financing. We receive commissions in connection with each vehicle financing above a certain threshold. This agreement applies only to our retail customers purchasing Fiat branded vehicles. In July 2015, FCA Fiat Chrysler Automoveis Brasil (“FCA Brasil”) and Banco Fidis signed a ten-year partnership contract with Bradesco, one of the leading Brazilian banks, through its affiliate Bradesco Financiamentos, whereby Bradesco Financiamentos finances retail sales of Jeep, Chrysler, Dodge and Ram vehicles in Brazil. Under this agreement, Bradesco has exclusivity on promotional campaigns and FCA Brasil promotes Bradesco as its official financial partner. Banco Fidis is in charge of the commercial management of this partnership and receives commissions for this partnership agreement and for acting as banking agent, based on profitability and penetration.
APAC
APAC Sales and CompetitionThe following table presents vehicle sales in the APAC segment for the periods presented:
Years ended December 31,
2018(1),(4) 2017(1),(4) 2016(1),(4)
APAC Sales Market Share Sales Market Share Sales Market ShareThousands of units (except percentages)
China(2) 163 0.8% 215 0.9% 176 0.8%
Japan 22 0.5% 21 0.5% 20 0.5%
India(3) 19 0.6% 15 0.5% 7 0.2%
Australia 11 1.0% 13 1.1% 18 1.6%
South Korea 8 0.5% 8 0.5% 7 0.4%
APAC 5 major Markets 223 0.7% 272 0.8% 228 0.7%
Other APAC 5 — 5 — 5 —
Total 228 — 277 — 233 —(1) Estimated market share data presented are based on management’s estimates of industry sales data, which use certain data provided by
third-party sources, including IHS Markit and National Automobile Manufacturing Associations.(2) Sales data include vehicles shipped by our joint venture in China.(3) India market share is based on wholesale volumes.(4) Sales reflect retail deliveries. APAC industry reflects aggregate for major markets where the Group competes (China, Australia, Japan, South Korea,
and India). Market share is based on retail registrations except, as noted above, in India where market share is based on wholesale volumes.
The automotive industry in the APAC segment has shown a slight year-over-year decline, with industry sales in the five key markets (China, India, Japan, Australia and South Korea) decreasing by 4 percent to 32.2 million. Overall for the 10 year period in the five key markets in which we compete, industry sales have increased from 16.1 million in 2009 to 32.2 million in 2018, a compound annual growth rate (“CAGR”) of approximately 8 percent. Industry demand decreased from 2017 to 2018 with decreases in China (-7 percent) and Australia (-3 percent), with Japan remaining flat, offsetting growth in India (+5 percent) and South Korea (+2 percent).
We sell a range of vehicles in the APAC segment, including small and compact cars and utility vehicles. Although our smallest mass-market segment by vehicle sales, we believe the APAC segment represents a significant growth opportunity and we have invested in building relationships with key joint venture partners in China and India in order to increase our presence in the region. In 2010, GAC Fiat Chrysler Automobiles Co. (“GAC FCA JV”), our joint venture with Guangzhou Automobiles Group Co., Ltd., was formed. In 2015, we expanded local production through the GAC FCA JV with the production of the Jeep Cherokee and in 2016 the Jeep Renegade and the Jeep Compass. In 2016, the Jeep brand also made its return to India, with
Board Report
Group Overview

2018 | ANNUAL REPORT 33
the launches of the imported Jeep Wrangler and Jeep Grand Cherokee. In 2017, we launched the imported Alfa Romeo Giulia and Alfa Romeo Stelvio in China and local production of the Jeep Compass was launched in the Ranjangaon, India plant for sale in India and other right-hand drive countries. In 2018, we launched the Grand Commander in China, a premium seven-seater SUV produced at the GAC FCA JV plant in Changsha, China. In other parts of the APAC segment, we distribute vehicles that we manufacture in the U.S., Europe and India through our dealers and distributors.
APAC DistributionIn the key markets in the APAC segment (China, Australia, India, Japan and South Korea), we sell our vehicles through 100 percent owned subsidiaries or through our joint venture to local independent dealers. In other markets where we do not have a substantial presence, we have agreements with general distributors.
APAC Dealer and Customer FinancingIn the APAC segment, we operate a 100 percent owned captive finance company, FCA Automotive Finance Co., Ltd, which supports, on a non-exclusive basis, our sales activities in China through dealer and retail customer financing. Cooperation agreements are also in place with third party financial institutions to provide dealer network and retail customer financing in India, South Korea, Australia and Japan.
EMEA
EMEA Sales and CompetitionThe following table presents passenger car and light commercial vehicle sales in the EMEA segment for the periods presented:
Years ended December 31
2018(1),(2),(3) 2017(1),(2),(3) 2016(1),(2),(3)
EMEA Passenger Cars
Sales Market Share Sales Market Share Sales Market ShareThousands of units (except percentages)
Italy 500 26.2% 558 28.3% 528 28.9%
Germany 105 3.1% 104 3.0% 97 2.9%
France 100 4.6% 88 4.2% 80 4.0%
Spain 81 6.1% 67 5.4% 60 5.2%
UK 52 2.2% 60 2.4% 84 3.1%
Other Europe 175 4.0% 158 3.6% 136 3.3%
Europe* 1,013 6.5% 1,035 6.6% 985 6.5%
Other EMEA** 102 — 116 — 113 —
Total 1,115 — 1,151 — 1,098 —
* 28 members of the European Union and members of the European Free Trade Association (other than Italy, Germany, UK, France, and Spain).** Market share not included in Other EMEA because our presence is less than one percent.(1) Certain fleet sales accounted for as operating leases are included in vehicle sales.(2) Estimated market share data is presented based on the European Automobile Manufacturers Association (ACEA) Registration Databases and
national Registration Offices databases.(3) Sale data includes vehicle sales by our joint venture in Turkey.
Years ended December 31
2018(1),(2),(3) 2017(1),(2),(3) 2016(1),(2),(3)
EMEA Light Commercial Vehicles
Group Sales Market Share Group Sales Market Share Group Sales Market ShareThousands of units (except percentages)
Europe* 263 11.1% 260 11.4% 250 11.6%
Other EMEA** 50 — 75 — 69 —
Total 313 — 335 — 319 —
* 28 members of the European Union and members of the European Free Trade Association.** Market share not included in Other EMEA because our presence is less than one percent.(1) Certain fleet sales accounted for as operating leases are included in vehicle sales.(2) Estimated market share data is presented based on the national Registration Offices databases on products categorized under light commercial
vehicles.(3) Sale data includes vehicle sales by our joint venture in Turkey.

34 2018 | ANNUAL REPORT
The following table summarizes new vehicle market share information and our principal competitors in Europe, our largest market in the EMEA segment:
Years ended December 31
Europe-Passenger Cars 2018(*) 2017(*) 2016(*)
Automaker Percentage of industry
Volkswagen 23.9% 23.8% 24.1%
PSA 16.0% 12.1% 9.7%
Renault 10.5% 10.4% 10.1%
BMW 6.6% 6.7% 6.8%
FCA(1) 6.5% 6.7% 6.6%
Ford 6.4% 6.6% 6.9%
Daimler 6.2% 6.3% 6.2%
Toyota 4.9% 4.6% 4.3%
GM —% 3.8% 6.6%
Other 19.0% 19.0% 18.7%
Total 100.0% 100.0% 100.0%
* Including all 28 European Union (EU) Member States and the 4 European Free Trade Association member states, or EFTA member states.(1) Market share data is presented based on the European Automobile Manufacturers Association, or ACEA Registration Databases, which also
includes Maserati within our Group for all periods presented; includes Ferrari within our Group for 2015.
In 2018, the Fiat brand continued its leadership in the European A minicar segment in EU 28+EFTA, with Fiat 500 and Fiat Panda accounting for 28.0 percent of market share in the segment and Fiat 500 remaining segment leader, with sales up 1.3 percent. The Fiat brand increased its presence also in other segments, with the Fiat 500L and Fiat 500X continuing to be among the leaders in their respective segments.
In EU 28+EFTA sales of the Jeep Brand approximately doubled from 2015, which were driven mainly by the Jeep Compass. Sales of the Alfa Romeo Stelvio also increased 73.5 percent from 2017 and the model was the segment leader in Italy.
Volumes were higher in the light commercial vehicle segment, with industry sales up 3.6 percent over the prior year to about 2.4 million units.
In Europe, FCA’s sales are largely weighted to passenger cars, with 35.5 percent of our total vehicle sales in the small car segment for 2018, reflecting demand for smaller vehicles due to driving conditions prevalent in many European cities and stringent environmental regulations.
EMEA DistributionIn Europe, our relationship with individual dealer entities can be represented by a number of contracts (typically, we enter into one agreement per brand of vehicles to be sold), and the dealer can sell those vehicles through one or more points of sale.
In Europe, we sell our vehicles directly to independent and our own dealer entities located in most European markets, as well as to fleet customers (including government and rental). In other markets in the EMEA segment in which we do not have a substantial presence, we have agreements with general distributors.
EMEA Dealer and Customer FinancingIn the EMEA segment, dealer and retail customer financing is primarily managed by FCA Bank, our joint venture with Crédit Agricole Consumer Finance S.A. (“CACF”). FCA Bank operates in Europe, including the five major markets of Italy, France, Germany, Spain and the UK. We began this joint venture in 2007 and have agreed with Credit Agricole to extend its term through December 31, 2022, which may be automatically renewed up to December 31, 2024 unless a termination notice is served in the period from January 1, 2019 to June 30, 2019. Under the agreement, FCA Bank will continue to benefit from the financial support of Crédit Agricole while continuing to strengthen its position as an active player in the securitization and debt markets. FCA Bank provides dealer and retail financing and, within selected countries, also rental, to support our mass-market vehicle brands. FCA Bank provides its services to Maserati and Ferrari luxury brands, as well as certain other OEMs.
Board Report
Group Overview
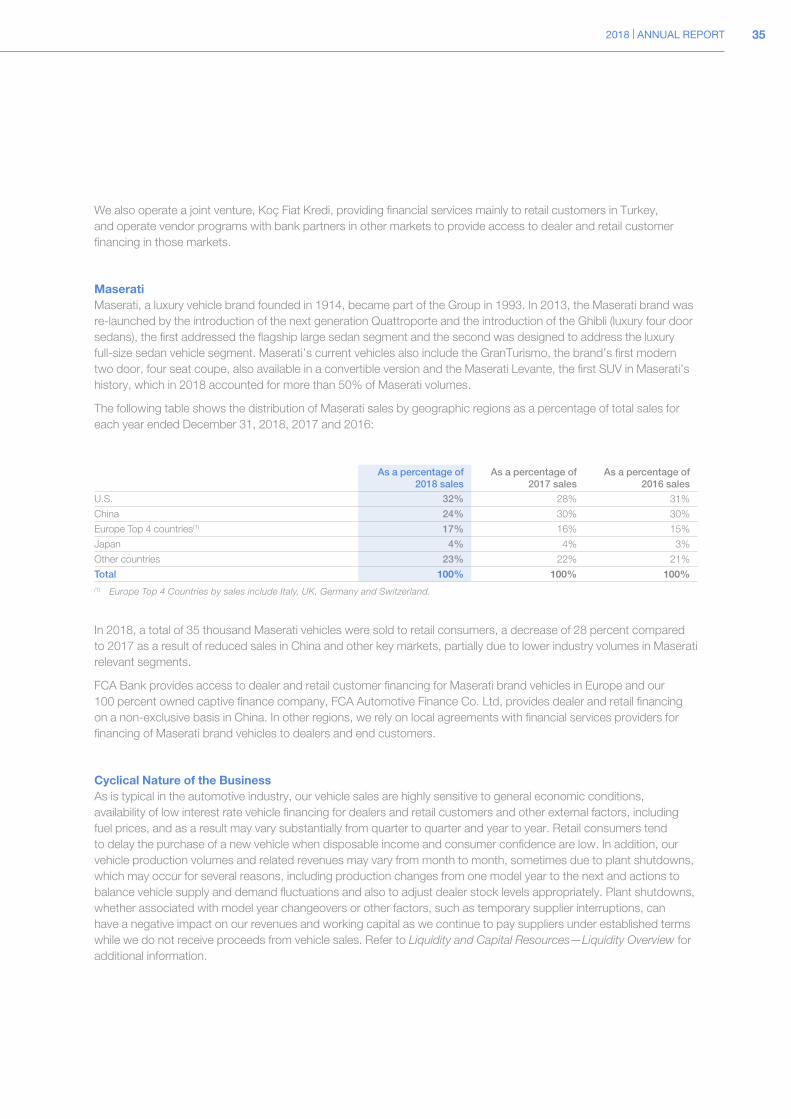
2018 | ANNUAL REPORT 35
We also operate a joint venture, Koç Fiat Kredi, providing financial services mainly to retail customers in Turkey, and operate vendor programs with bank partners in other markets to provide access to dealer and retail customer financing in those markets.
MaseratiMaserati, a luxury vehicle brand founded in 1914, became part of the Group in 1993. In 2013, the Maserati brand was re-launched by the introduction of the next generation Quattroporte and the introduction of the Ghibli (luxury four door sedans), the first addressed the flagship large sedan segment and the second was designed to address the luxury full-size sedan vehicle segment. Maserati’s current vehicles also include the GranTurismo, the brand’s first modern two door, four seat coupe, also available in a convertible version and the Maserati Levante, the first SUV in Maserati’s history, which in 2018 accounted for more than 50% of Maserati volumes.
The following table shows the distribution of Maserati sales by geographic regions as a percentage of total sales for each year ended December 31, 2018, 2017 and 2016:
As a percentage of 2018 sales
As a percentage of 2017 sales
As a percentage of 2016 sales
U.S. 32% 28% 31%
China 24% 30% 30%
Europe Top 4 countries(1) 17% 16% 15%
Japan 4% 4% 3%
Other countries 23% 22% 21%
Total 100% 100% 100%(1) Europe Top 4 Countries by sales include Italy, UK, Germany and Switzerland.
In 2018, a total of 35 thousand Maserati vehicles were sold to retail consumers, a decrease of 28 percent compared to 2017 as a result of reduced sales in China and other key markets, partially due to lower industry volumes in Maserati relevant segments.
FCA Bank provides access to dealer and retail customer financing for Maserati brand vehicles in Europe and our 100 percent owned captive finance company, FCA Automotive Finance Co. Ltd, provides dealer and retail financing on a non-exclusive basis in China. In other regions, we rely on local agreements with financial services providers for financing of Maserati brand vehicles to dealers and end customers.
Cyclical Nature of the BusinessAs is typical in the automotive industry, our vehicle sales are highly sensitive to general economic conditions, availability of low interest rate vehicle financing for dealers and retail customers and other external factors, including fuel prices, and as a result may vary substantially from quarter to quarter and year to year. Retail consumers tend to delay the purchase of a new vehicle when disposable income and consumer confidence are low. In addition, our vehicle production volumes and related revenues may vary from month to month, sometimes due to plant shutdowns, which may occur for several reasons, including production changes from one model year to the next and actions to balance vehicle supply and demand fluctuations and also to adjust dealer stock levels appropriately. Plant shutdowns, whether associated with model year changeovers or other factors, such as temporary supplier interruptions, can have a negative impact on our revenues and working capital as we continue to pay suppliers under established terms while we do not receive proceeds from vehicle sales. Refer to Liquidity and Capital Resources—Liquidity Overview for additional information.

36 2018 | ANNUAL REPORT
ENVIRONMENTAL AND OTHER REGULATORY MATTERSWe engineer, manufacture and sell our products and offer our services around the world, subject to requirements applicable to our products that relate to vehicle emissions, fuel economy, emission control software calibration and on-board diagnostics, as well as those applicable to our manufacturing facilities that relate to stack emissions, the treatment of waste, water and hazardous materials, prohibitions on soil contamination, and worker health and safety. Our vehicles and the engines that power them must also comply with extensive regional, national and local laws and regulations and industry self-regulations (including those that regulate end-of-life vehicles and the chemical content of our parts). In addition, vehicle safety regulations are becoming increasingly strict.
We believe we are substantially in compliance with the relevant global regulatory requirements affecting our facilities and products taken as a whole, although we may from time to time fail to meet a particular regulatory requirement. We consistently monitor the relevant global regulatory requirements affecting our facilities and products and adjust our operations and processes as we seek to remain in compliance. Compliance with these requirements involves significant costs and risks. See “Risk Factors-Laws, regulations and governmental policies, including those regarding increased fuel efficiency requirements and reduced greenhouse gas and tailpipe emissions, have a significant effect on how we do business.” and Risk Factors-“We are subject to diesel emissions investigations by several governmental agencies and to a number of related private lawsuits.”
Automotive Tailpipe EmissionsNumerous laws and regulations limit automotive emissions, including vehicle exhaust emission standards, vehicle evaporative emission standards, emission control software calibration and onboard diagnostic system requirements. Advanced onboard diagnostic systems are used to identify and diagnose problems with emission control systems. These requirements become more challenging each year, especially in light of increased global scrutiny of diesel emission control software calibration and we expect these emissions and certification requirements will continue to become even more rigorous worldwide.
NAFTA RegionUnder the U.S. Clean Air Act, the U.S. Environmental Protection Agency (“EPA”) and the California Air Resource Board (“CARB”) require emission compliance certification before a vehicle can be sold in the U.S. or in California (and many other states that have adopted the California emissions requirements). Both agencies impose limits on tailpipe and evaporative emissions of certain non-greenhouse gas pollutants from new motor vehicles and engines, and in some cases dictate the pollution control methods our engines must employ.
Our vehicles are subject to EPA’s Tier 3 Vehicle Emission and Fuel Standards Program, which regulates vehicle tailpipe and evaporative emission standards and fuels. These Tier 3 standards are generally more stringent than the prior standards and are also generally aligned with California’s Low Emission Vehicle (“LEV”) III tailpipe and evaporative standards, discussed below. The Tier 3 standards also require automakers to conduct post-production vehicle testing to demonstrate compliance with these emissions limits for the useful life of a vehicle, and require that FCA Italy-produced and Maserati-branded vehicles sold in the U.S. be included in the Group’s U.S. fleet as reported to EPA and CARB.
In addition, we have implemented hardware and software systems in all our vehicles in connection with onboard diagnostic monitoring requirements. Conditions identified through these systems could lead to vehicle recalls (or other remedial actions such as extended warranties) with significant costs for related inspections, repairs or per-vehicle penalties.
In addition to its LEV III emissions standards, CARB regulations also require that a specified percentage of cars and certain light-duty trucks sold in California be zero emission vehicles, such as electric vehicles, hybrid electric vehicles or hydrogen fuel cell vehicles. Our strategy for compliance with the zero emission vehicle requirements involves the sale of a variety of vehicles, including battery electric vehicles and hybrid electric vehicles. Our compliance strategy is also supported by the purchase of credits from other OEMs. The Group’s compliance with zero emission vehicles regulations includes Maserati vehicles sold in the U.S.
In addition to California, twelve states, as well as the Province of Quebec, Canada, currently use California’s LEV III standards in lieu of the federal EPA standards, and 10 states have also adopted California’s zero emission vehicle requirements.
Board Report
Group Overview

2018 | ANNUAL REPORT 37
For a discussion of inquiries into our compliance with certain regulations in the U.S., see Note 25, Guarantees granted, commitments and contingent liabilities within the Consolidated Financial Statements included elsewhere in this report. See also “Risk Factors-Laws, regulations and governmental policies, including those regarding increased fuel efficiency requirements and reduced greenhouse gas and tailpipe emissions, have a significant effect on how we do business.”
LATAM RegionCertain countries in South America follow U.S. procedures, standards and onboard diagnostic requirements, while others follow the European procedures, standards and onboard diagnostic requirements described below under —EMEA Region. In Brazil, vehicle emission standards are regulated by the Ministry of the Environment and have been in place since 1988 for passenger cars and light commercial vehicles. The first step in the next phase of regulations are currently under discussion and are expected to be aligned with fuel efficiency and safety standards in January 2022 and a second step is also under discussion with implementation dates still to be defined. Argentina has implemented regulations that mirror the European Commission Euro 5 standards for all new vehicles.
APAC RegionChina 5 standards, which mirror Euro 5 standards, are currently in place in China nationwide. China 6 standards were released in 2016 and will be required nationwide beginning in July 2020 with China 6a thresholds and in July 2023 with China 6b thresholds. China 6a and 6b have more stringent tailpipe emissions thresholds than Euro 6 and also add European Union (“EU”) real driving emissions and U.S. onboard diagnostics, onboard refueling vapor recovery and evaporative emission control system requirements. Some regions within China will implement China 6b prior to July 2023, such as Beijing (beginning in early 2020) and Tianjin, Shanghai, Guangzhou and Shenzhen (beginning in July 2019) with more regions expected to follow. FCA’s entire China fleet has been developed with the intent to meet China 6 standards.
South Korea implemented regulations that are similar to California’s LEV III regulations beginning in 2016. and will be fully required by the end of 2019 for all gasoline vehicles. Diesel vehicles are required to meet Euro 6 EU emissions requirements. Japan adopted the Worldwide Harmonized Light Vehicle Testing Procedures (“WLTP”) in 2018 for new models and will be required by September 2020 for all models. WLTP is a global harmonized standard for regulating greenhouse gas (“GHG”) emissions, non-GHG pollutants, and fuel or energy consumption for light-duty vehicles and electric range for battery electric vehicles or hybrids. India currently follows Bharat Stage IV (“BSIV”) emission norms, which are equivalent to Euro 4 standards. BSIV emission norms were enforced nationwide starting in 2017. The government will mandate the new Bharat Stage VI emission norms beginning in April 2020, skipping Euro 5 equivalent norms.
EMEA RegionIn Europe, emissions are regulated by the European Commission (“EC”) and the United Nations Economic Commission for Europe (“UNECE”). The EC imposes standardized emission control requirements on vehicles sold in all 28 EU member states, while non-EU countries apply regulations under the UNECE framework. EU Member States can provide tax incentives for the purchase of vehicles that meet emission standards earlier than the compliance date. As a result, vehicles must meet emission requirements and receive approval from an appropriate Member State authority before they can be sold in any EU Member State. These regulatory requirements include random testing of newly assembled vehicles and a manufacturer in-use surveillance program. EU and UNECE requirements are equivalent in terms of stringency and implementation.
Euro 6 emission levels are in effect for all passenger cars and light commercial vehicles and require additional technologies and further increase the cost of diesel engines compared to prior Euro 5 standards. These new technologies have put additional cost pressures on the already challenging European market for small and mid-size diesel-powered vehicles. Further requirements of Euro 6 have been developed by the EC and became effective for all new passenger cars registered after September 1, 2018. In addition, a new test procedure to directly assess the regulated emissions of light duty vehicles under real driving conditions became effective for newly homologated passenger cars in 2017 and will become effective for all new passenger cars registered in 2019 and for new light commercial vehicles registered in 2020. For a discussion of inquiries into our compliance with certain regulations in the European Union, see Note 25, Guarantees granted, commitments and contingent liabilities within the Consolidated Financial Statements included elsewhere in this report. See also “Risk Factors-We are subject to diesel emissions investigations by several governmental agencies and to a number of related private lawsuits.”

38 2018 | ANNUAL REPORT
Automotive Fuel Economy and Greenhouse Gas EmissionsWe pursue compliance with fuel economy and greenhouse gas regulations in the markets where we operate through the most cost effective combination of developing, manufacturing and selling vehicles with better fuel economy and lower emissions, purchasing compliance credits and paying regulatory penalties. The cost of each of these components of our strategy has increased and is expected to continue to increase in the future. As the costs of each of these components, particularly the relative costs of each component, changes, we intend to adjust our strategies in an effort to maintain the most cost effective means of complying with the regulations.
NAFTA RegionSince the enactment of the 1975 Energy Policy and Conservation Act, the National Highway Traffic Safety Administration (“NHTSA”) has enforced minimum Corporate Average Fuel Economy (“CAFE”) for fleets of new passenger cars and light-duty trucks sold in the U.S. These CAFE standards apply to all domestic and imported passenger car and light-duty truck fleets and currently require year-over-year increases in fuel economy through 2025. The requirement is scaled based on vehicle footprint size. The CAFE standards require that passenger cars imported into the U.S. from outside of NAFTA are averaged separately from those manufactured within NAFTA, and domestic cars and light duty trucks are also considered separately. A civil fine can be paid under the CAFE standards which can vary to the extent fuel economy targets are not met, and the policy also allows for the trading of CAFE credits as a means to achieve compliance.
In addition, the EPA enforces a GHG standard that is also footprint based and increasing in stringency year over year through 2025. This requirement corresponds to an equivalent fuel economy target of 54.5 miles per gallon in the 2025 model year. Various flexibilities exist to reach this target, including utilizing more environmentally friendly refrigerants. A civil fine cannot be paid to achieve compliance with GHG standards. This standard is currently undergoing a “mid term” review and may be modified for the 2021 through 2025 model years.
Finally, for light duty vehicles, ten states including California have enacted a zero emission vehicle mandate requiring a certain percentage of each OEM’s fleet in each state to be zero emission - either battery electric vehicles or fuel cell vehicles. This standard also increases in stringency through 2025. The policy does allow for a limited number of sales of partial zero emission vehicles and plug-in electric hybrids as a flexibility for manufacturers.
For heavy duty vehicles (>8,500 pound gross vehicle weight rating), the GHG standard is utility based (payload and towing) and is increasing in stringency through 2027. Similar to passenger cars, flexibilities exist to meet GHG regulation. A civil fine cannot be paid to achieve compliance with heavy duty vehicle GHG standards.
The approach and technologies being developed to meet U.S. requirements are intended to also enable compliance in the Canadian and Mexican markets.
LATAM RegionIn 2012, the Brazilian government issued a CO2 reduction decree which provided indirect tax incentives to manufacturers who met certain requirements. Participating companies had to meet vehicle energy efficiency targets on vehicles sold from October 1, 2016 to September 30, 2017 and must maintain the required level until September 30, 2020. The program has additional targets that result in additional tax incentives based on the magnitude and timing of target accomplishment.
In July 2018, the first regulations related to Rota 2030 were enacted. Rota 2030 is a long-term program (three cycles of five years each) which includes key principles related to energy efficiency for all vehicles sold in Brazil. Key Rota 2030 regulations were approved by the Brazilian Congress and sanctioned by the Brazilian President in December 2018 as well as ordinary regulations to address certain minimum requirements and other metrics. The regulation for the next phase of Energy Efficiency (CO2/fuel efficiency) beginning in 2022 incorporates three fleets split into passenger, large SUV and light commercial vehicle categories. Among other things, the rule rewards the improvement of sugar cane ethanol combustion efficiency and also recognizes and provides credit flexibilities for technologies that provide benefits in conditions that are not seen on the standardized government test cycles.
Board Report
Group Overview
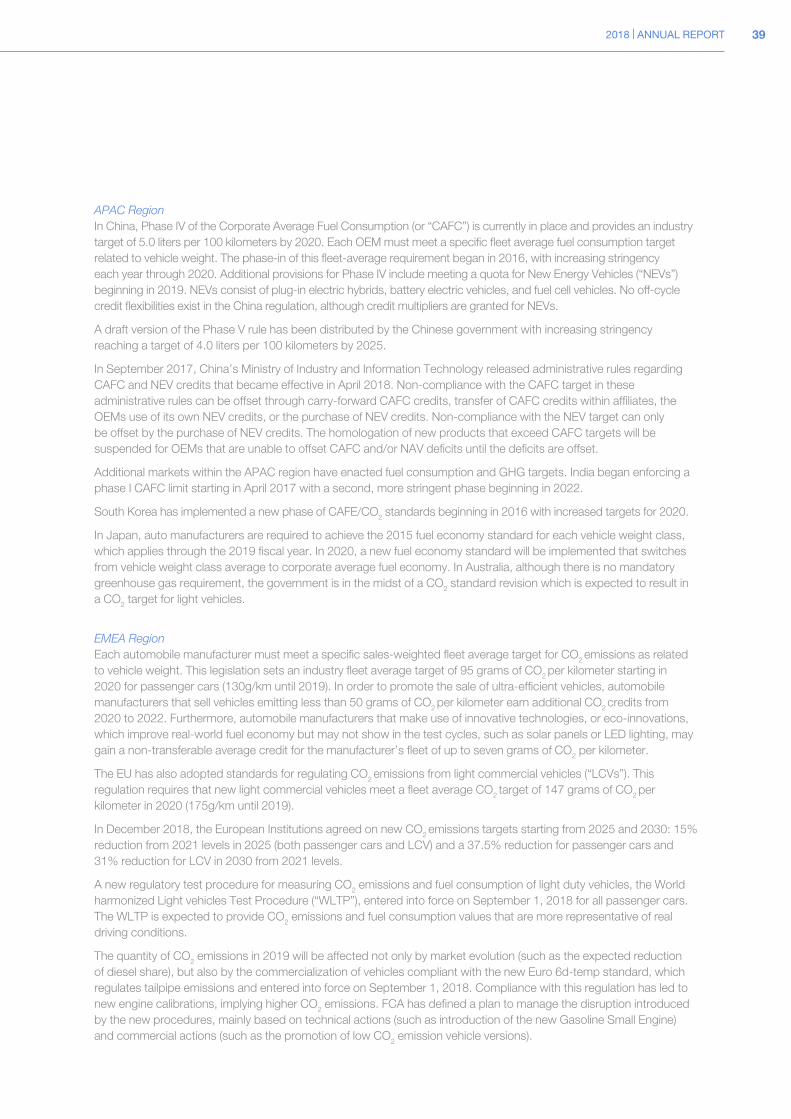
2018 | ANNUAL REPORT 39
APAC RegionIn China, Phase IV of the Corporate Average Fuel Consumption (or “CAFC”) is currently in place and provides an industry target of 5.0 liters per 100 kilometers by 2020. Each OEM must meet a specific fleet average fuel consumption target related to vehicle weight. The phase-in of this fleet-average requirement began in 2016, with increasing stringency each year through 2020. Additional provisions for Phase IV include meeting a quota for New Energy Vehicles (“NEVs”) beginning in 2019. NEVs consist of plug-in electric hybrids, battery electric vehicles, and fuel cell vehicles. No off-cycle credit flexibilities exist in the China regulation, although credit multipliers are granted for NEVs.
A draft version of the Phase V rule has been distributed by the Chinese government with increasing stringency reaching a target of 4.0 liters per 100 kilometers by 2025.
In September 2017, China’s Ministry of Industry and Information Technology released administrative rules regarding CAFC and NEV credits that became effective in April 2018. Non-compliance with the CAFC target in these administrative rules can be offset through carry-forward CAFC credits, transfer of CAFC credits within affiliates, the OEMs use of its own NEV credits, or the purchase of NEV credits. Non-compliance with the NEV target can only be offset by the purchase of NEV credits. The homologation of new products that exceed CAFC targets will be suspended for OEMs that are unable to offset CAFC and/or NAV deficits until the deficits are offset.
Additional markets within the APAC region have enacted fuel consumption and GHG targets. India began enforcing a phase I CAFC limit starting in April 2017 with a second, more stringent phase beginning in 2022.
South Korea has implemented a new phase of CAFE/CO2 standards beginning in 2016 with increased targets for 2020.
In Japan, auto manufacturers are required to achieve the 2015 fuel economy standard for each vehicle weight class, which applies through the 2019 fiscal year. In 2020, a new fuel economy standard will be implemented that switches from vehicle weight class average to corporate average fuel economy. In Australia, although there is no mandatory greenhouse gas requirement, the government is in the midst of a CO2 standard revision which is expected to result in a CO2 target for light vehicles.
EMEA RegionEach automobile manufacturer must meet a specific sales-weighted fleet average target for CO2 emissions as related to vehicle weight. This legislation sets an industry fleet average target of 95 grams of CO2 per kilometer starting in 2020 for passenger cars (130g/km until 2019). In order to promote the sale of ultra-efficient vehicles, automobile manufacturers that sell vehicles emitting less than 50 grams of CO2 per kilometer earn additional CO2 credits from 2020 to 2022. Furthermore, automobile manufacturers that make use of innovative technologies, or eco-innovations, which improve real-world fuel economy but may not show in the test cycles, such as solar panels or LED lighting, may gain a non-transferable average credit for the manufacturer’s fleet of up to seven grams of CO2 per kilometer.
The EU has also adopted standards for regulating CO2 emissions from light commercial vehicles (“LCVs”). This regulation requires that new light commercial vehicles meet a fleet average CO2 target of 147 grams of CO2 per kilometer in 2020 (175g/km until 2019).
In December 2018, the European Institutions agreed on new CO2 emissions targets starting from 2025 and 2030: 15% reduction from 2021 levels in 2025 (both passenger cars and LCV) and a 37.5% reduction for passenger cars and 31% reduction for LCV in 2030 from 2021 levels.
A new regulatory test procedure for measuring CO2 emissions and fuel consumption of light duty vehicles, the World harmonized Light vehicles Test Procedure (“WLTP”), entered into force on September 1, 2018 for all passenger cars. The WLTP is expected to provide CO2 emissions and fuel consumption values that are more representative of real driving conditions.
The quantity of CO2 emissions in 2019 will be affected not only by market evolution (such as the expected reduction of diesel share), but also by the commercialization of vehicles compliant with the new Euro 6d-temp standard, which regulates tailpipe emissions and entered into force on September 1, 2018. Compliance with this regulation has led to new engine calibrations, implying higher CO2 emissions. FCA has defined a plan to manage the disruption introduced by the new procedures, mainly based on technical actions (such as introduction of the new Gasoline Small Engine) and commercial actions (such as the promotion of low CO2 emission vehicle versions).

40 2018 | ANNUAL REPORT
Other countries in the EMEA region, such as Switzerland and Saudi Arabia, have introduced specific regulations to reduce vehicle CO2 emissions or fuel consumption. FCA assumes for the time being that the United Kingdom will continue to follow the EU GHG policy post-Brexit.
Vehicle Safety
NAFTA RegionUnder U.S. federal law, all vehicles sold in the U.S. must comply with Federal Motor Vehicle Safety Standards (“FMVSS”) promulgated by NHTSA, and must be certified by their manufacturer as being in compliance with all such standards at the time of the first purchase of the vehicle. In addition, if a vehicle contains a defect that is related to motor vehicle safety or does not comply with an applicable FMVSS, the manufacturer must notify NHTSA and vehicle owners and provide a remedy at no cost. Moreover, the TREAD Act authorized NHTSA to promulgate regulations requiring Early Warning Reporting (“EWR”). EWR requires manufacturers to provide NHTSA several categories of information, including all claims which involve one or more fatalities or injuries; all incidents of which the manufacturer receives actual notice which involve fatalities or injuries which are alleged or proven to have been caused by a possible defect in such manufacturer’s motor vehicle or motor vehicle equipment in the U.S.; and all claims involving one or more fatalities in a foreign country when the possible defect is in a motor vehicle or motor vehicle equipment that is identical or substantially similar to a motor vehicle or motor vehicle equipment offered for sale in the U.S., as well as aggregate data on property damage claims from alleged defects in a motor vehicle or in motor vehicle equipment; warranty claims; consumer complaints and field reports about alleged or possible defects. The rules also require reporting of customer satisfaction campaigns, consumer advisories, recalls, or other activity involving the repair or replacement of motor vehicles or items of motor vehicle equipment, even if not safety related.
NHTSA has secured a voluntary commitment from manufacturers, including FCA, to equip future vehicles with automatic electronic braking systems. The commitment will make these braking systems standard on virtually all light-duty cars and trucks with a gross vehicle weight of 8,500 pounds or less beginning no later than September 1, 2022 and on virtually all trucks with a gross vehicle weight between 8,501 pounds and 10,000 pounds beginning no later than September 1, 2025. Compliance with these requirements and commitments, as well as other possible prospective NHTSA requirements, is likely to be costly.
In 2018, NHTSA updated guidelines for the testing and deployment of automated driving systems (“ADS”), providing additional clarity and alignment with OEM requests, including the announcement of a possible pilot program to encourage public road testing of vehicles equipped with ADS. Additionally, as of October 2018, legislation has passed in the U.S. House of Representatives to encourage safe testing and commercial deployment of “highly automated vehicles” (“HAVs”) and ADS-equipped vehicles. A similar bill is pending in the U.S. Senate. Both bills would direct a series of rulemakings eventually affecting manufacturers. The final bill could require that manufacturers introducing a HAV or ADS-equipped vehicle into interstate commerce must provide the U.S. Department of Transportation with a Safety Evaluation Report that describes how the manufacturer is addressing nine areas regarding vehicle safety, with civil penalties for false or misleading reports.
At times, organizations like NHTSA or the U.S. Insurance Institute of Highway Safety (“IIHS”) issue or reissue safety ratings applicable to vehicles. In October 2018, NHTSA held a public meeting to hear from stakeholders about possible changes to the safety ratings issued by the agency. The timeframe for any such changes is not known at this time. In 2017, the IIHS continued to introduce new tests and modified its “Top Safety Pick” protocol. Pursuant to the new protocol, several of our vehicles’ top ratings have been downgraded until new technologies are introduced such as new forward lighting systems. This could impact the market competitiveness of the affected vehicles.
In 2016, NHTSA issued a Notice of Proposed Rulemaking (“NPRM”) designed to enable vehicle-to-vehicle (“V2V”) communication technology. Rulemaking in this area has been inactive since then, and any additional costs that would have been associated with the NPRM are deferred for the foreseeable future. However, NHTSA has engaged with industry to confirm continued interest in facilitating the growth of this technology.
Furthermore, NHTSA has issued non-binding guidelines for addressing cybersecurity issues in the design and manufacture of new motor vehicles, as well as guidance for the investigation and validation of cybersecurity measures.
Board Report
Group Overview

2018 | ANNUAL REPORT 41
In Mexico, a new safety regulation based on U.S. standards is expected to take effect which will, among other things, include a deadline for vehicle manufacturers to provide to the Federal Consumer Protection Agency (i) the launch date and a detailed description of every safety campaign applicable to vehicles sold in Mexico, (ii) mandatory recall campaigns, based on international agencies’ investigations and guidelines and (iii) mandatory repurchase of defective products.
LATAM RegionVehicles sold in the LATAM region are subject to different vehicle safety regulations according to each country, generally based on European and United Nations standards. Brazil published a draft of its 10 year safety regulatory roadmap in 2017. This roadmap provides a staged approach to implementation of new testing requirements and active safety technology. The more costly active safety technologies would be scheduled for implementation after 2024. In July 2018, the first regulation related to Rota 2030 was enacted. Rota 2030 is a long-term program (three cycles of five years each) which includes principles related to mandatory safety for all vehicles sold in Brazil. These regulations were approved by the Brazilian Congress and sanctioned by the Brazilian President in December 2018 as well as ordinary regulations to address certain minimum requirements and other metrics.
APAC RegionMany countries in the Asia Pacific region, including China, South Korea, Japan and India, have adopted or are adopting measures for pedestrian protection and vehicle safety regulations. For example, China published the Regulation for Administration of Recall of Defective Vehicles effective in 2013 and the Implementation Provisions on the Regulation for Administration of Recall of Defective Vehicles effective in 2016. In addition, India has implemented vehicle crash regulations effective in 2017 for new models and 2019 for all models, and has introduced for implementation in 2019 new standards relating to pedestrian safety, compulsory installation of airbags, speed limit reminders, anti-lock braking systems and reverse parking sensors. In South Korea, amendments to major provisions relating to vehicle accidents, fire incidents, defect reporting and recall procedures have been proposed that may considerably increase the liabilities and penalties of vehicle manufacturers.
EMEA RegionVehicles sold in Europe are subject to vehicle safety regulations established by the EU or, in very limited cases and aspects, by individual Member States. In 2009, the EU established a uniform legal framework for vehicle safety, repealing more than 50 then-existing directives and replacing them with a single regulation known as the “General Safety Regulation” (“GSR”) aimed at incorporating relevant United Nations standards. The incorporation of United Nations standards commenced in 2012. In 2014, discussions began in Europe for a comprehensive upgrade to the GSR, which is expected to lead to the implementation of a variable suite of passive and active safety technologies, depending on vehicle type and classification. The significant items under discussion for mainstream vehicles includes automatic emergency braking, intelligent speed assistance, lane keeping, drowsiness and attention detection, advanced distraction recognition and an expanded scope for front and side crash testing. The timeline for implementation of this GSR for new vehicle types is estimated to be 2022. In addition, in-vehicle emergency call systems became mandatory for new vehicle types in the EU, Israel and Turkey markets in 2018. In Russia, a similar in-vehicle emergency call system became mandatory in 2015 and there are now draft regulations for these systems in many countries in the Middle East region.
Industrial Environmental ControlOur operations are subject to a wide range of environmental protection laws including those laws regulating air emissions, water discharges, waste management and environmental clean-up. Certain environmental statutes require that responsible parties fund remediation actions regardless of fault, legality of original disposal, or ownership of a disposal site. Under certain circumstances, these laws impose joint and several liability as well as liability for related damages to natural resources. Our Environmental Management System (“EMS”) formalizes our commitment to responsible management of the environment. Applied at all plants operating worldwide, the EMS consists of methodologies and processes designed to prevent or reduce the environmental impact of our manufacturing activities. ISO 14001 is an internationally agreed standard that sets out the requirements for an EMS. At December 31, 2018, the majority of the Group’s facilities have an ISO 14001 certified EMS in place.

42 2018 | ANNUAL REPORT
Our commitment to environmental and sustainability issues is also reflected through our internal World Class Manufacturing (“WCM”) system.
Workplace Health and SafetyFCA aims to provide all employees with a safe, healthy and productive work environment at every facility worldwide and in every area of activity. Accordingly, the Group focuses on identifying and evaluating workplace safety risks, implementing safety and ergonomic standards, promoting employee awareness and safe behavior and encouraging a healthy lifestyle.
The goal of achieving zero accidents is formalized in the targets set by FCA, as well as through global adoption of an Occupational Health and Safety Management System (“OHSMS”) certified to the OHSAS 18001 standard. At December 31, 2018, the vast majority of our plants had an OHSMS in place that was OHSAS 18001 certified.
Effective safety management is also supported by the application of WCM tools and methodologies, active involvement of employees and targeted investment.
Applicability of Banking Law and Regulation to Financial ServicesSeveral of our captive finance companies, each of which provides financial services to our customers, are regulated as financial institutions in the jurisdictions in which they operate. FCA Bank S.p.A., incorporated in Italy, is subject to European Central Bank and Bank of Italy supervision. Within FCA Bank Group, two subsidiaries (the Austrian FCA Bank G.m.b.H. and the Portuguese FCA Capital Portugal I.F.I.C., S.A.), are subject to the supervision of the European Central Bank and of the local central banks, whereas certain other subsidiaries are subject to the supervision of the local Supervisory Financial or Banking Authority. Banco Fidis S.A., incorporated in Brazil, is subject to Brazilian Central Bank supervision. FCA Compañia Financiera S.A., incorporated in Argentina, is subject to Argentinian Central Bank supervision. FCA Automotive Finance Co., Ltd, incorporated in China, is subject to the supervision of the Chinese Banking Insurance Regulatory Commission and People’s Bank of China. As a result, those companies are subject to regulation in a wide range of areas including solvency, capital requirements, reporting, customer protection and account administration, among other matters.
Board Report
Group Overview

2018 | ANNUAL REPORT 43
Financial Overview
Management’s Discussion and Analysis of the Financial Condition and Results of Operations of the GroupThe following discussion of our financial condition and results of operations should be read together with the information included under “GROUP OVERVIEW”, “SELECTED FINANCIAL DATA” and the Consolidated Financial Statements included elsewhere in this report. This discussion includes forward-looking statements and involves numerous risks and uncertainties, including, but not limited to, those described under “Forward-Looking Statements ” and “Risk Factors”. Actual results may differ materially from those contained in any forward looking statements.
Trends, Uncertainties and OpportunitiesOur results of operations and financial condition are affected by a number of factors, including those that are outside our control.
Shipments. Vehicle shipments are generally driven by our plans to meet consumer demand. Consumer demand for vehicles is affected by economic conditions, availability and cost of dealer and customer financing and incentives offered to retail customers, as discussed further below. Transfer of control, and therefore revenue recognition, generally corresponds to vehicle shipment. This generally occurs upon the release of the vehicle to the carrier responsible for transporting the vehicle to the dealer or distributor, or when the vehicle is made available to the dealer or distributor. Shipments and revenue recognition are generally not directly correlated with retail sales by dealers, which may be affected by other factors including dealer decisions as to their appropriate inventory levels.
Product Development and Technology. A key driver of consumer demand and therefore our shipments, has been the continued refresh, renewal and evolution of our vehicle portfolio, and we have committed significant capital and resources toward the introduction of new vehicles on new platforms, with additions of new powertrains and other new technologies. In order to realize a return on the significant investments we have made to sustain market share and to achieve competitive operating margins, we will have to continue significant investment in new vehicle launches. We believe efforts in developing common vehicle platforms and powertrains have accelerated the time-to-market for many of our new vehicle launches and resulted in cost savings.
The costs associated with product development, vehicle improvements and launches can impact our Net profit. In addition, our ability to continue to make the necessary investments in product development, and recover the related costs, depends in large part on the market acceptance and success of the new or significantly refreshed vehicles we introduce. During a new vehicle launch and introduction to the market, we typically incur increased selling, general and advertising expenses associated with the advertising campaigns and related promotional activity.
Costs we incur in the initial research phase for new projects (which may relate to vehicle models, vehicle platforms, powertrains or technology) are expensed as incurred and reported as Research and development costs. Costs we incur for product development are capitalized and recognized as intangible assets if and when the following two conditions are both satisfied: (i) development expenditures can be measured reliably and (ii) the technical feasibility of the project, and the anticipated volumes and pricing indicate it is probable that the development expenditures will generate future economic benefits. Capitalized development expenditures include all costs that may be directly attributed to the development process. Such capitalized development expenditures are amortized on a straight-line basis commencing from start of production over the expected economic useful life of the product developed, and such amortization is recognized and reported as Research and development costs in our Consolidated Income Statement. If vehicle production is planned to be terminated prior to the expected end date, amortization of capitalized development expenditures is accelerated over the remaining useful economic life of that vehicle model or platform. If vehicle production is terminated in the current period, all unamortized capitalized development expenditures are expensed during that period.
Board Report
Financial Overview

44 2018 | ANNUAL REPORT
Future developments in our product portfolio to support our growth strategies and their related development expenditures could lead to significant capitalization of development assets. Our time to market is at least 24 months, but varies depending on our product, from the date the design is signed-off for tooling and production, after which the project goes into production, resulting in an increase in amortization. Therefore, our operating results are impacted by the cyclicality of our research and development expenditures based on our product portfolio strategies and our product plans.
In order to meet expected changes in consumer demand and regulatory requirements, we intend to invest significant resources in product development and research and development. New markets for alternative fuel source vehicles and autonomous vehicles are also beginning to emerge and we expect to invest resources in these areas in order to meet future demand and to support compliance with emissions and fuel efficiency requirements. In addition, global demand continues to shift from passenger cars to utility vehicles and away from diesel-powered vehicles.
Cost of revenues. Cost of revenues includes purchases (including costs related to the purchase of components and raw materials), labor costs, depreciation, amortization, logistic and product warranty and recall campaign costs. We purchase a variety of components, raw materials, supplies, utilities, logistics and other services from numerous suppliers. These purchases have historically accounted for 70-80 percent of total Cost of revenues. Fluctuations in Cost of revenues are primarily related to the number of vehicles we produce and sell along with shifts in vehicle mix, as newer models of vehicles generally have more technologically advanced components and enhancements and therefore higher costs per unit. Cost of revenues may also be affected by fluctuations in raw material prices. The cost of raw materials has historically comprised 10-15 percent of the total purchases described above, while the remaining portion of purchases is made of components, conversion of raw materials and overhead costs. We typically seek to manage these costs and minimize their volatility by using fixed price purchase contracts, commercial negotiations and technical efficiencies. Nevertheless, our Cost of revenues related to materials and components has increased as a result of recent tariff activity and also as we have significantly enhanced the content of our vehicles as we renew and refresh our product offerings. Over time, technological advancements and improved material sourcing may reduce the cost to us of the additional enhancements. In addition, we seek to recover higher costs through pricing actions, but even when competitive conditions permit this, there may be a time lag between the increase in our costs and our ability to realize improved pricing. Accordingly, our results are typically adversely affected, at least in the short term, until price increases are accepted in the market.
Further, in many markets where our vehicles are sold, we are required to pay import duties on those vehicles, which are included in Cost of revenues. We reflect these costs in the price charged to our customers to the extent market conditions permit. However, for many of our vehicles, particularly in the mass-market vehicle segments, we cannot always pass along increases in those duties to our dealers and distributors and remain competitive. Our ability to price our vehicles to recover those increased costs has affected, and will continue to affect, our profitability.
Pricing. Our profitability depends in part on our ability to maintain or improve pricing on the sale of our vehicles to dealers and fleet customers and will also be significantly impacted by our ability to pass along the increased costs of the technology needed to meet increased regulatory compliance requirements.
In addition, the automotive industry continues to experience intense price competition resulting from the variety of available competitive vehicles and excess global manufacturing capacity. Historically, manufacturers have promoted products by offering dealer, retail and fleet incentives, including cash rebates, option package discounts, and subsidized financing or leasing programs. The amount and types of incentives are dependent on numerous factors, including market competition level, vehicle demand, economic conditions, model age and time of year, due to industry seasonality. We plan to continue to use such incentives to price vehicles competitively and to manage demand and support inventory management profitability.
Vehicle Profitability. Our results of operations reflect the profitability of the vehicles we sell, which tends to vary based upon a number of factors, including vehicle size, content of those vehicles and brand positioning. Vehicle profitability also depends on sales prices to dealers and fleet customers, net of sales incentives, costs of materials and components, as well as transportation and warranty costs. In the NAFTA segment, our larger vehicles such as our larger SUVs and pickup trucks have historically been more profitable than other vehicles and accounted for approximately 68 percent of our total U.S. retail vehicle shipments in 2018. In recent years, consumer preferences for certain larger vehicles, such as SUVs, have increased; however, there is no guarantee this will continue.
Board Report
Financial Overview

2018 | ANNUAL REPORT 45
In all mass-market vehicle segments throughout the world, vehicles equipped with additional options are generally more profitable for us. As a result, our ability to offer attractive vehicle options and upgrades is critical to our ability to increase our profitability on these vehicles. In addition, in the U.S. and Europe, our vehicle sales to dealers for sale to their retail consumers are normally more profitable than our fleet sales, as the retail consumers typically prefer additional optional features while fleet customers increasingly tend to concentrate purchases on smaller, more fuel-efficient vehicles with fewer optional features, which have historically had a lower profitability per unit.
Vehicles sold under certain brand and model names are generally more profitable when there is strong brand recognition of those vehicles. In some cases this is tied to a long history for those brands and models, and in other cases to customers identifying these vehicles as being more modern and responsive to customer needs.
Economic Conditions. Demand for new vehicles tends to reflect economic conditions in the various markets in which we operate because retail sales depend on individual purchasing decisions, which in turn are affected by many factors including levels of disposable income. For example, the recent economic deterioration and hyperinflationary conditions in Argentina have significantly impacted our shipments in the LATAM segment. Fleet sales and sales of light commercial vehicles are also influenced by economic conditions, which drive vehicle utilization and investment activity. Further, demand for light commercial vehicles and pickup trucks is driven, in part, by construction and infrastructure projects. Therefore, our performance is affected by the macroeconomic trends in the markets in which we operate.
Regulation. We are subject to a complex set of regulatory regimes throughout the world in which vehicle safety, emissions and fuel economy regulations have become increasingly stringent and the related enforcement regimes increasingly active. These developments may affect our vehicle sales as well as our profitability and reputation. For example, the recent transition to World harmonized Light vehicles Test Procedure (“WLTP”) significantly impacted our shipments in the EMEA segment. We are subject to applicable national and local regulations and must achieve an appropriate level of compliance in order to continue operations in every market, including a number of markets in which we derive substantial revenue. Developing, engineering and manufacturing vehicles that meet these requirements and therefore may be sold in those markets requires a significant expenditure of management time and financial resources.
We pursue compliance with fuel economy and greenhouse gas regulations in the markets where we operate through the most cost effective combination of developing, manufacturing and selling vehicles with better fuel economy and lower emissions, purchasing compliance credits and paying regulatory penalties. The cost of each of these components of our strategy has increased and is expected to continue to increase in the future. As the costs of each of these components, particularly the relative costs of each component, changes, we intend to adjust our strategies in an effort to maintain the most cost effective means of complying with the regulations. In addition, these costs and the costs incurred to meet other regulatory requirements may be difficult to pass through to customers, so the increased costs may affect our results of operations and profitability.
Further, developments in regulatory requirements in China, the largest single market in the world in 2018, limit in some respects, the product offerings we can pursue as we expand the scope of our operations in that country. Refer to “Risk Factors - Laws, regulations and governmental policies, including those regarding increased fuel efficiency requirements and reduced greenhouse gas and tailpipe emissions, have a significant effect on how we do business.” for more information.
Tariffs and Trade Policy. There has been a recent and significant increase in activity and speculation regarding tariffs and duties between the U.S. and its trading partners, including China and the EU. Tariffs or duties implemented between the U.S. and its trading partners, and the implementation of the United States-Mexico-Canada Agreement or the U.S.’s withdrawal from the North American Free Trade Agreement, may reduce consumer demand and/or make our products less profitable. In addition, the availability and price at which we are able to source components and raw materials globally may be adversely affected.
Magneti Marelli. On October 22, 2018, we announced that we have entered into a definitive agreement with CK Holdings, Ltd., a holding company of Calsonic Kansei Corporation, pursuant to which CK Holdings, Ltd. will acquire our automotive components business, Magneti Marelli. The agreement represents a transaction value of €6.2 billion, subject to certain adjustments. The transaction is expected to close in the second quarter of 2019, subject to regulatory approvals and other customary closing conditions.

46 2018 | ANNUAL REPORT
Consolidation. The automotive industry is exceptionally capital intensive and capital expenditures and research and development requirements in our industry have continued to grow significantly in recent years as we pursue technological innovations and respond to a number of challenges. Compliance with enhanced emissions and safety regulations continue to impose new and increasing capital requirements as does the development of proprietary components. While we continue to implement our business plan, and we believe that our business will continue to grow and our operating margins will continue to improve, if we are unable to reduce our capital requirements either through cooperation or consolidation with other manufacturers, we may not be able to reduce component development costs, optimize manufacturing investments or product allocation and improve utilization of tooling, machinery and equipment, as a result of which our product development and manufacturing costs will continue to restrict our profitability and return on capital. Although there can be no assurance that these challenges can be overcome through large scale integration or product development and manufacturing collaboration, if we are unable to pursue such benefits our returns on capital employed may be impaired which could adversely affect our results of operations and financial condition.
Dealer and Customer Financing. Because dealers and retail customers finance their purchases of a large percentage of the vehicles we sell worldwide, the availability and cost of financing is a significant factor affecting our vehicle shipment volumes and Net revenues. Availability of customer financing could affect the vehicle mix, as customers who have access to greater financing are able to purchase higher priced vehicles, whereas when customer financing is constrained, vehicle mix could shift towards less expensive vehicles. The low interest rate environment in recent years has had the positive effect of reducing the effective cost of vehicle ownership. While interest rates in the U.S. and Europe have been at historically low levels, the U.S. Federal Reserve has recently raised interest rates, which may impact consumer financing rates, and the availability and terms of financing will continue to change over time, impacting our results. We currently operate in many regions (including the U.S.) without a captive finance company, and we continue to provide access to financing through joint ventures and third party arrangements in several of our key markets (including the U.S.). Therefore, we may be less able to ensure availability of financing for our dealers and retail customers in those markets than our competitors that own and operate affiliated finance companies.
Effects of Foreign Exchange Rates. Foreign exchange rates, including the U.S. Dollar/Euro exchange rate, have fluctuated significantly in 2018, and may continue to do so in the future. We are affected by fluctuations in foreign exchange rates (i) through translation of foreign currency financial statements into Euro for consolidation, which we refer to as the translation impact, and (ii) through transactions by entities in the Group in currencies other than their own functional currencies, which we refer to as the transaction impact. Given the size of our U.S. operations, a strengthening of the U.S. dollar against the Euro generally would have a positive effect on our financial results, which are reported in Euro, and on our operations in relation to sales in the U.S. of vehicles and components produced in Europe. We are primarily financed by a mix of Euro, U.S. dollar and Brazilian Real denominated debt. Given the mix of our debt and liquidity, strengthening of the U.S. dollar against the Euro generally would have a positive impact on our net debt position.
In order to reduce the impacts of foreign exchange rates, we hedge a percentage of certain exposures. Refer to Note 30, Qualitative and quantitative information on financial risks within our Consolidated Financial Statements included elsewhere in this report for additional information.
Board Report
Financial Overview

2018 | ANNUAL REPORT 47
Shipment InformationAs discussed in GROUP OVERVIEW—Overview of Our Business, our activities are carried out through five reportable segments: four regional mass-market vehicle segments (NAFTA, LATAM, APAC and EMEA) and the Maserati global luxury brand segment. The following table sets forth our vehicle shipment information by segment. Vehicle shipments are generally aligned with current period production which is driven by our plans to meet consumer demand. Revenue is recognized when control of our vehicles, services or parts has been transferred and the Group’s performance obligations to our customers have been satisfied. The Group has determined that our customers from the sale of vehicles and service parts are generally dealers, distributors or fleet customers. Transfer of control, and therefore revenue recognition, generally corresponds to the date when the vehicles or service parts are made available to the customer, or when the vehicles or service parts are released to the carrier responsible for transporting them to the customer. New vehicle sales through the Guaranteed Depreciation Program (“GDP”) are recognized as revenue when control of the vehicle transfers to the fleet customer, except in situations where the Group issues a put for which there is a significant economic incentive to exercise. Refer to Note 2, Basis of preparation, within our Consolidated Financial Statements included elsewhere in this report for further details on our revenue recognition policy.
For a description of our dealers and distributors see GROUP OVERVIEW—Sales Overview. Accordingly, the number of vehicles sold does not necessarily correspond to the number of vehicles shipped for which revenues are recorded in any given period.
Years ended December 31(thousands of units) 2018 2017 2016
NAFTA 2,633 2,401 2,587
LATAM 585 521 456
APAC 84 85 91
EMEA 1,318 1,365 1,306
Maserati 35 51 42
Total Consolidated shipments 4,655 4,423 4,482
Joint venture shipments 187 317 238
Total Combined shipments 4,842 4,740 4,720
For discussion of shipments for NAFTA, LATAM, APAC, EMEA and Maserati for 2018 as compared to 2017 and for 2017 as compared to 2016, refer to —Results by Segment below.
Non-GAAP Financial MeasuresWe monitor our operations through the use of several non-generally accepted accounting principles (“non-GAAP”) financial measures: Net cash/(debt), Net industrial cash/(debt), Adjusted Earnings Before Interest and Taxes (“Adjusted EBIT”), Adjusted net profit and certain information provided on a constant exchange rate (“CER”) basis. We believe that these non-GAAP financial measures provide useful and relevant information regarding our operating results and enhance the overall ability to assess our financial performance and financial position. They provide us with comparable measures which facilitate management’s ability to identify operational trends, as well as make decisions regarding future spending, resource allocations and other operational decisions. These and similar measures are widely used in the industry in which we operate, however, these financial measures may not be comparable to other similarly titled measures of other companies and are not intended to be substitutes for measures of financial performance and financial position as prepared in accordance with IFRS as issued by the IASB as well as IFRS adopted by the European Union.
Adjusted EBIT: excludes certain adjustments from Net profit/(loss) from continuing operations including gains/(losses) on the disposal of investments, restructuring, impairments, asset write-offs and unusual income/(expenses) that are considered rare or discrete events that are infrequent in nature, and also excludes Net financial expenses and Tax expense/(benefit).

48 2018 | ANNUAL REPORT
Adjusted EBIT is used for internal reporting to assess performance and as part of the Group’s forecasting, budgeting and decision making processes as it provides additional transparency to the Group’s core operations. We believe this non-GAAP measure is useful because it excludes items that we do not believe are indicative of the Group’s ongoing operating performance and allows management to view operating trends, perform analytical comparisons and benchmark performance between periods and among our segments. We also believe that Adjusted EBIT is useful for analysts and investors to understand how management assesses the Group’s ongoing operating performance on a consistent basis. In addition, Adjusted EBIT is one of the metrics used in the determination of the annual performance bonus for the Chief Executive Officer of the Group and other eligible employees, including members of the Group Executive Council.
Refer to the sections Group Results and Results by Segment below for further discussion and for a reconciliation of this non-GAAP measure to Net profit from continuing operations, which is the most directly comparable measure included in our Consolidated Income Statement. Adjusted EBIT should not be considered as a substitute for Net profit from continuing operations, cash flow or other methods of analyzing our results as reported under IFRS.
Adjusted Net Profit: is calculated as Net profit/(loss) from continuing operations excluding post-tax impacts of the same items excluded from Adjusted EBIT, as well as financial income/(expenses) and tax income/(expenses) considered rare or discrete events that are infrequent in nature.
We believe this non-GAAP measure is useful because it also excludes items that we do not believe are indicative of the Group’s ongoing operating performance and provides investors with a more meaningful comparison of the Group’s ongoing operating performance. In addition, Adjusted net profit is one of the metrics used in the determination of the annual performance bonus and the achievement of certain performance objectives established under the terms of the equity incentive plan for the Chief Executive Officer of the Group and other eligible employees, including members of the Group Executive Council.
Refer to the section Group Results below for further discussion and for a reconciliation of this non-GAAP measure to Net profit from continuing operations, which is the most directly comparable measure included in our Consolidated Income Statement. Adjusted net profit should not be considered as a substitute for Net profit from continuing operations, cash flow or other methods of analyzing our results as reported under IFRS.
Net Cash/(Debt) and Net Industrial Cash/(Debt): We believe Net cash/(debt) is useful in providing a measure of the Group’s net indebtedness after consideration of cash and cash equivalents and current securities.
Due to different sources of cash flows used for the repayment of the financial debt between industrial activities and financial services (by cash from operations for industrial activities and by collection of financial receivables for financial services) and the different business structure and leverage implications, we provide a separate analysis of Net cash/(debt) between industrial activities and financial services.
The division between industrial activities and financial services represents a sub-consolidation based on the core business activities (industrial or financial services) of each Group company. The sub-consolidation for industrial activities also includes companies that perform centralized treasury activities, such as raising funding in the market and financing Group companies, but do not, however, provide financing to third parties. Financial services includes companies that provide retail and dealer financing as well as leasing and rental services in support of the mass-market vehicle brands in certain geographical segments and for the Maserati luxury brand. In addition, activities of financial services include providing factoring services to industrial activities, as an alternative to factoring from third parties. Operating results of such financial services activities are included within the respective region or sector in which they operate.
Board Report
Financial Overview

2018 | ANNUAL REPORT 49
Net industrial cash/(debt) (i.e., Net cash/(debt) of industrial activities) was management’s primary measure for analyzing our financial leverage and capital structure until the substantial completion of our balance sheet de-leveraging this year and remains one of the key targets used to measure our performance. Net industrial cash/(debt) is computed as: debt plus derivative financial liabilities related to industrial activities less (i) cash and cash equivalents, (ii) certain current debt securities, (iii) current financial receivables from Group or jointly controlled financial services entities and (iv) derivative financial assets and collateral deposits; therefore, debt, cash and cash equivalents and other financial assets/liabilities pertaining to financial services entities are excluded from the computation of Net industrial cash/(debt). Net industrial cash/(debt) should not be considered as a substitute for cash flows or other financial measures under IFRS; in addition, Net industrial cash/(debt) depends on the amount of cash and cash equivalents at each balance sheet date, which may be affected by the timing of monetization of receivables and the payment of accounts payable, as well as changes in other components of working capital, which can vary from period to period due to, among other things, cash management initiatives and other factors, some of which may be outside of the Group’s control. Net industrial cash/(debt) should therefore be evaluated alongside these other measures as reported under IFRS for a more complete view of the Company’s capital structure and liquidity. In addition, Net industrial cash/(debt) is one of the metrics used in the determination of the annual performance bonus for the Chief Executive Officer of the Group and other eligible employees, including members of the Group Executive Council.
Refer to Liquidity and Capital Resources—Net Cash/(Debt) below for further information and the reconciliation of these non-GAAP measures to Debt, which is the most directly comparable measure included in our Consolidated Statement of Financial Position.
Industrial free cash flows: historically, due to our leveraged position, we used Net industrial cash/(debt) as a key metric to focus our team on the fundamental task of de-leveraging the balance sheet. As our balance sheet de-leveraging was substantially completed this year, we have substituted this key metric with a cash flow metric going forward, specifically Industrial free cash flows, which we define as Cash flows from operating activities less: cash flows from operating activities related to financial services, net of eliminations; investment in property, plant and equipment and intangible assets for industrial activities; and adjusted for discretionary pension contributions in excess of those required by the pension plans, net of tax. The timing of Industrial free cash flows may be affected by the timing of monetization of receivables and the payment of accounts payable, as well as changes in other components of working capital, which can vary from period to period due to, among other things, cash management initiatives and other factors, some of which may be outside of the Group’s control.
Refer to Liquidity and Capital Resources—Industrial free cash flows for further information and the reconciliation of this non-GAAP measure to Cash flows from operating activities, which is the most directly comparable measure included in our Consolidated Statement of Cash Flows. Industrial free cash flows should not be considered as a substitute for Net profit from continuing operations, cash flow or other methods of analyzing our results as reported under IFRS.
Constant Currency Information: The discussion within section Group Results includes information about our results at constant exchange rates (“CER”), which is calculated by applying the prior year average exchange rates to translate current financial data expressed in local currency in which the relevant financial statements are denominated (see Note 2, Basis of preparation, within the Consolidated Financial Statements included elsewhere in this report for the exchange rates applied). Although we do not believe that this non-GAAP measure is a substitute for GAAP measures, we believe that results excluding the effect of currency fluctuations provide additional useful information to investors regarding the operating performance and trends in our business on a local currency basis.

50 2018 | ANNUAL REPORT
Board Report
RESULTS OF OPERATIONS
Group Results – 2018 compared to 2017 and 2017 compared to 2016The following is a discussion of the Group’s results of operations for the year ended December 31, 2018 as compared to the year ended December 31, 2017 and for the year ended December 31, 2017 as compared to the year ended December 31, 2016.
Years ended December 31,(€ million) 2018 2017 2016
Net revenues € 110,412 € 105,730 € 105,798
Cost of revenues 95,011 89,710 90,927
Selling, general and other costs 7,318 7,177 7,388
Research and development costs 3,051 2,903 2,930
Result from investments 235 399 310
Reversal of a Brazilian indirect tax liability — 895 —
Gains on disposal of investments — 76 13
Restructuring costs 103 86 68
Net financial expenses 1,056 1,345 1,858
Profit before taxes 4,108 5,879 2,950
Tax expense 778 2,588 1,237
Net profit from continuing operations 3,330 3,291 1,713
Profit from discontinued operations, net of tax 302 219 101
Net profit € 3,632 € 3,510 € 1,814
Net profit attributable to:
Owners of the parent € 3,608 € 3,491 € 1,803
Non-controlling interests € 24 € 19 € 11
Net profit from continuing operations attributable to:
Owners of the parent € 3,323 € 3,281 € 1,708
Non-controlling interests € 7 € 10 € 5
Net profit from discontinued operations attributable to:
Owners of the parent € 285 € 210 € 95
Non-controlling interests € 17 € 9 € 6
As of January 1, 2018 the Group adopted IFRS 15 - Revenue from Contracts with Customers and IFRS 9 - Financial Instruments. The impact of the adoption of these new standards was not material, and the Group does not expect a material impact from the adoption of these new standards on an ongoing basis. Refer to Note 2, Basis of preparation, within our Consolidated Financial Statements included elsewhere in this report, for further information.
As a result of the presentation of Magneti Marelli as a discontinued operation, the remaining Components activities are no longer considered a separate reportable segment and are included within “Other activities”. Refer to Note 3, Scope of consolidation, within our Consolidated Financial Statements included elsewhere in this report, for further information.
Net revenues Increase/(Decrease)
Years ended December 31, 2018 vs. 2017 2017 vs. 2016(€ million) 2018 2017 2016 % Actual % CER % Actual % CER
Net revenues € 110,412 € 105,730 € 105,798 4.4% 9.3% (0.1)% 0.1%
For a discussion of Net revenues for each of our five reportable segments (NAFTA, LATAM, APAC, EMEA and Maserati) for 2018 as compared to 2017 and for 2017 as compared to 2016, see Results by Segment below.
Financial Overview

2018 | ANNUAL REPORT 51
Cost of revenues Increase/(Decrease)
Years ended December 31, 2018 vs. 2017 2017 vs. 2016(€ million) 2018 2017 2016 % Actual % CER % Actual % CER
Cost of revenues € 95,011 € 89,710 € 90,927 5.9% 10.8% (1.3)% (0.3)%
Cost of revenues as % of Net revenues 86.1% 84.8% 85.9%
Cost of revenues includes purchases (including commodity costs), labor costs, depreciation, amortization, logistic, product warranty and recall campaign costs.
The increase in Cost of revenues in 2018 compared to 2017 was primarily related to (i) an increase in NAFTA, with higher volumes and product costs for content and technology enhancements attributable to new models; (ii) an increase in LATAM due to higher volumes and (iii) vehicle mix in EMEA, which were partially offset by decreases resulting from (iv) foreign currency translation effects, primarily in NAFTA and LATAM and (v) lower volumes for Maserati.
The decrease in Cost of revenues in 2017 compared to 2016 was primarily related to (i) lower volumes, (ii) foreign exchange translation effects, (iii) purchasing efficiencies, and (iv) the charges recognized in 2016, which were higher than the charges recognized in 2017, for the estimated costs of recall campaigns related to an industry-wide recall for airbag inflators manufactured by Takata Corporation. These were partially offset by (v) vehicle mix and (vi) higher product costs for content and technology enhancements. The decrease in Cost of revenues was primarily attributable to decreases in NAFTA and APAC, which were partially offset by increases in LATAM, EMEA, and Maserati.
Selling, general and other costsIncrease/(Decrease)
Years ended December 31, 2018 vs. 2017 2017 vs. 2016(€ million) 2018 2017 2016 % Actual % CER % Actual % CER
Selling, general and other costs € 7,318 € 7,177 € 7,388 2.0% 6.1% (2.9)% (2.1)%Selling, general and other costs as % of Net revenues 6.6% 6.8% 7.0%
Selling, general and other costs includes advertising, personnel and administrative costs. Advertising costs amounted to approximately 42 percent, 47 percent and 48 percent of total Selling, general and other costs for the years ended December 31, 2018, 2017 and 2016, respectively.
The increase in Selling, general and other costs in 2018 as compared with 2017 primarily relates to a provision for €748 million recognized for costs related to final settlements reached on civil, environmental and consumer claims related to U.S. diesel emissions matters (refer to Note 25, Guarantees granted, commitments and contingent liabilities within the Consolidated Financial Statements included elsewhere in this report), partially offset by lower advertising costs in NAFTA and positive foreign currency translation effects.
The decrease in Selling, general and other costs in 2017 as compared with 2016 primarily relates to (i) lower advertising and marketing costs, primarily in NAFTA, (ii) foreign exchange translation effects and (iii) cost efficiencies, mainly in NAFTA and EMEA, which were partially offset by increased advertising costs in EMEA.

52 2018 | ANNUAL REPORT
Research and development costsIncrease/(Decrease)
Years ended December 31, 2018 vs. 2017 2017 vs. 2016(€ million) 2018 2017 2016 % Actual % CER % Actual % CER
Research and development expenditures expensed € 1,448 € 1,506 € 1,467 (3.9)% 0.2% 2.7% 4.0%Amortization of capitalized development expenditures 1,456 1,294 1,357 12.5% 16.8% (4.6)% (4.6)%Impairment and write-off of capitalized development expenditures 147 103 106 42.7% 43.7% (2.8)% (2.8)%Total Research and development costs € 3,051 € 2,903 € 2,930 5.1% 9.1% (0.9)% (0.2)%
Years ended December 31,
2018 2017 2016
Research and development expenditures expensed as % of Net revenues 1.3% 1.4% 1.4%
Amortization of capitalized development expenditures as % of Net revenues 1.3% 1.2% 1.3%
Impairment and write-off of capitalized development expenditures as % of Net revenues 0.1% 0.1% 0.1%
Total Research and development costs as % of Net revenues 2.8% 2.7% 2.8%
The following table summarizes our research and development expenditures for the years ended December 31, 2018, 2017 and 2016:
Years ended December 31, Increase/(Decrease)(€ million) 2018 2017 2016 2018 vs. 2017 2017 vs. 2016
Capitalized development expenditures € 2,079 € 2,431 € 2,395 (14.5)% 1.5%
Research and development expenditures expensed 1,448 1,506 1,467 (3.9)% 2.7%
Total Research and development expenditures € 3,527 € 3,937 € 3,862 (10.4)% 1.9%Capitalized development expenditures as % of Total Research and development expenditures 58.9% 61.7% 62.0%Total Research and development expenditures as % of Net revenues 3.2% 3.7% 3.7%
We conduct research and development for new vehicles and technology to improve the performance, safety, fuel efficiency, reliability, consumer perception and environmental impact of our vehicles. Research and development costs consist primarily of material costs, services and personnel related expenses that support the development of new and existing vehicles with powertrain technologies. For further details of research and development costs, see Trends, Uncertainties and Opportunities—Product Development and Technology and Overview of Our Business - Research and Development.
The increase in amortization of capitalized development expenditure in 2018 compared to 2017 was mainly due to higher amortization in NAFTA, primarily attributable to the all-new Ram 1500, all-new Jeep Wrangler and the new Jeep Cherokee.
The impairment and write-off of capitalized development expenditures during 2018, primarily in EMEA, was due to changes in product plans in connection with the 2018-2022 business plan.
The decrease in amortization of capitalized development expenditures in 2017 compared to 2016 was mainly attributable to changes in the expected lifecycle of certain models and foreign exchange translation effects, which was partially offset by the increase attributable to all-new Maserati Levante, all-new Alfa Romeo Giulia, and Stelvio, all-new Jeep Compass, and all-new Fiat Argo in LATAM.
The impairment and write-off of capitalized development expenditures during the year ended December 31, 2017 mainly related to global product portfolio changes in EMEA and changes in the LATAM product portfolio.
Board Report
Financial Overview

2018 | ANNUAL REPORT 53
Result from investments Years ended December 31, Increase/(Decrease)
(€ million) 2018 2017 2016 2018 vs. 2017 2017 vs. 2016
Result from investments € 235 € 399 € 310 (41.1)% 28.7%
The decrease in Result from investments in 2018 compared to 2017 was primarily attributable to lower results from the GAC FCA JV in APAC and Tofas JV in EMEA, partially offset by improved results from FCA Bank in EMEA.
The increase in Results from investments in 2017 compared to 2016 was primarily attributable to improved results from the GAC FCA JV in APAC, due to the increased localized production in China, as well as improved results from the FCA Bank.
Reversal of a Brazilian indirect tax liabilityIn June 2017, the Group reversed a Brazilian indirect tax liability of €895 million, reflecting certain court decisions. As this liability related to the Group’s Brazilian operations in multiple segments and given the significant and unusual nature of the item, it was not attributed to the results of the related segments and was excluded from Group Adjusted EBIT (refer to Note 22, Other liabilities and Tax payables) for the year ended December 31, 2017.
Net financial expenses
Years ended December 31, Increase/(Decrease)(€ million) 2018 2017 2016 2018 vs. 2017 2017 vs. 2016
Net financial expenses € 1,056 € 1,345 € 1,858 (21.5)% (27.6)%
The decrease in Net financial expenses in 2018 compared to 2017, and in 2017 compared to 2016 was primarily due to the continuation of the planned reduction in gross debt.
Tax expense
Years ended December 31, Increase/(Decrease)(€ million) 2018 2017 2016 2018 vs. 2017 2017 vs. 2016
Tax expense € 778 € 2,588 € 1,237 (69.9)% 109.2%
Effective tax rate 18.5% 44.2% 40.5% -2570 bps +370 bps
The decrease in Tax expense in 2018 compared to 2017 was primarily attributable to: (i) €734 million tax expense recorded in 2017 as a result of the decrease in recognized deferred tax assets in Brazil; (ii) net €88 million for the estimated tax expense recorded in 2017 for the December 2017 U.S. Tax Cuts and Jobs Act (the “Tax Act”); (iii) €673 million decrease recognized in 2018 as a result of the Tax Act, and (iv) net €334 million tax benefits for prior years’ tax positions finalized in 2018, including a reduction to the estimated 2017 U.S. one-time deemed repatriation tax expense by €70 million and tax benefit of €94 million from an accelerated discretionary pension contribution (refer to Note 19, Employee benefits liabilities within our Consolidated Financial Statements for additional detail); partially offset by (v) tax impacts from the recognition of a provision for costs related to final settlements reached on civil, environmental and consumer claims related to U.S. diesel emissions matters; and (vi) lower operating results in APAC. Refer to Note 7, Tax expense within our Consolidated Financial Statement for additional details.
The net tax benefits of €334 million for prior years’ tax positions finalized in 2018 is composed of: (i) tax benefit of €447 million for U.S. provision to return adjustments (including a reduction to the estimated 2017 U.S. one-time deemed repatriation tax expense of €70 million, and tax benefit of €94 million from an accelerated discretionary pension contribution, refer to Note 19, Employee benefits liabilities within our Consolidated Financial Statements for additional detail); partially offset by (ii) net tax expense of €113 million primarily for the impact of uncertain tax positions and other prior years’ tax positions.

54 2018 | ANNUAL REPORT
The decrease in the deferred tax assets in Brazil in 2017 was composed of:
€281 million related to the reversal of the Brazilian indirect tax liability mentioned above; and
€453 million that was written off as the Group revised its outlook on Brazil to reflect the slower pace of recovery and outlook for the subsequent years, largely resulting from increased political uncertainty, and concluded that a portion of the deferred tax assets in Brazil was no longer recoverable.
The above items were excluded from Adjusted net profit.
The decrease in the effective tax rate to 19 percent in 2018 from 44 percent in 2017 was mainly due to: (i) tax expense recorded in 2017 as a result of the decrease in recognized deferred tax assets in Brazil; (ii) net tax benefits recognized for impacts of the Tax Act; and (iii) net tax benefits recognized for prior years’ tax positions finalized in 2018; partially offset by (iv) tax impacts from the recognition of a provision for costs related to final settlements reached on civil, environmental and consumer claims related to U.S. diesel emissions matters.
The increase in Tax expense in 2017 compared to 2016 was primarily attributable; to (i) higher profit before taxes, particularly in NAFTA, (ii) net decreases in generation and usage of tax credits; (iii) the impact of the December 2017 U.S. tax reform of €88 million, as noted above; and (iv) a decrease in Brazilian deferred tax assets of €734 million, as noted above.
The increase in the effective tax rate to 44.2 percent in 2017 from 40.5 percent in 2016 was mainly due to the expense recorded in 2017 as a result of the decrease in recognized deferred tax assets in Brazil.
Profit from discontinued operations, net of tax
Years ended December 31, Increase/(Decrease)(€ million) 2018 2017 2016 2018 vs. 2017 2017 vs. 2016
Profit from discontinued operations, net of tax € 302 € 219 € 101 n.m. n.m.
n.m. = Number is not meaningful
Magneti Marelli is presented as a discontinued operation in the Consolidated Financial Statements for the years ended December 31, 2018, 2017 and 2016. For more information, refer to Note 3, Scope of consolidation, within our Consolidated Financial Statements included elsewhere in this report.
The impact of ceasing depreciation of the property, plant and equipment and amortization of the intangible assets of Magneti Marelli on its classification as held for sale as required by IFRS 5 was €96 million, net of tax of €20 million.
Net profit from continuing operations
Years ended December 31, Increase/(Decrease)(€ million) 2018 2017 2016 2018 vs. 2017 2017 vs. 2016
Net profit from continuing operations € 3,330 € 3,291 € 1,713 1.2% 92.1%
The increase in Net profit from continuing operations in 2018 compared to 2017 was mainly driven by (i) lower Tax and Net financial expenses, and (ii) improved NAFTA and LATAM operating performance net of lower results in APAC, Maserati and EMEA. These were partially offset by (iii) a provision for €748 million recognized for costs related to final settlements reached on civil, environmental and consumer claims related to U.S. diesel emissions matters and (iv) the €895 million reversal in 2017 of a liability related to Brazilian indirect taxes previously accrued by the Group’s Brazilian subsidiaries.
The increase in Net profit from continuing operations in 2017 compared to 2016 was mainly driven by improved operating performance in 2017, lower financial expenses, as well as the €895 million gain from the reversal of a Brazilian indirect tax liability, which were partially offset by higher income taxes for the year, including the decrease in deferred tax assets in Brazil discussed above.
Board Report
Financial Overview

2018 | ANNUAL REPORT 55
Adjusted EBITIncrease/(Decrease)
Years ended December 31, 2018 vs. 2017 2017 vs. 2016(€ million) 2018 2017 2016 % Actual % CER % Actual % CER
Adjusted EBIT € 6,738 € 6,609 € 5,680 2.0% 7.9% 16.4% 25.5%
Adjusted EBIT margin (%) 6.1% 6.3% 5.4% -20 bps — +90 bps —
The following charts present our Adjusted EBIT walk by segment for 2018 as compared to 2017 and for 2017 as compared to 2016:
Adjusted EBIT by segment2018 compared to 2017 (€ million)
For the year ended December 31, 2018, the Adjusted EBIT related to Magneti Marelli that was excluded from the Group’s Adjusted EBIT result was €546 million, net of intercompany eliminations. For more information, refer to Note 3, Scope of consolidation, within our Consolidated Financial Statements included elsewhere in this report.
Adjusted EBIT by segment2017 compared to 2016 (€ million)
For the year ended December 31, 2017, the Adjusted EBIT related to Magneti Marelli that was excluded from the Group’s Adjusted EBIT result was €445 million, net of intercompany eliminations. For the year ended December 31, 2016, the Adjusted EBIT related to Magneti Marelli that was excluded from the Group’s Adjusted EBIT result was €376 million, net of intercompany eliminations. For more information, refer to Note 3, Scope of consolidation, within our Consolidated Financial Statements included elsewhere in this report.
NAFTA LATAM APAC EMEA 20182017
6,609
Maserati Other &Eliminations
1,003 208
(468)(329)
(409)
124 6,738
NAFTA LATAM APAC EMEA 20172016
5,680
Maserati Other &Eliminations
94 146 67195 221 206 6,609

56 2018 | ANNUAL REPORT
For a discussion of Adjusted EBIT for each of our five reportable segments (NAFTA, LATAM, APAC, EMEA and Maserati) in 2018 as compared to 2017 and for 2017 as compared to 2016, see Results by Segment below.
The following table summarizes the reconciliation of Net profit from continuing operations to Adjusted EBIT:
Years ended December 31,(€ million) 2018 2017 2016
Net profit from continuing operations € 3,330 € 3,291 € 1,713
Tax expense 778 2,588 1,237
Net financial expenses 1,056 1,345 1,858
Adjustments:
Charge for U.S. diesel emissions matters 748 — —
Impairment expense and supplier obligations 353 219 177
China inventory impairment 129 — —
Costs for recall, net of recovery - airbag inflators 114 102 414
U.S. special bonus payment 111 — —
Restructuring costs, net of reversals 103 86 68
Employee benefits settlement losses 92 — —
Port of Savona (Italy) flood and fire 43 — —
Deconsolidation of Venezuela — 42 —
Currency devaluations — — 19
Tianjin (China) port explosions insurance recoveries — (68) (55)
Gains on disposal of investments — (76) (13)
(Recovery of)/costs for recall - contested with supplier (50) — 132
NAFTA capacity realignment (60) (38) 156
Brazilian indirect tax - reversal of liability/recognition of credits (72) (895) —
Other 63 13 (26)
Total Adjustments 1,574 (615) 872
Adjusted EBIT € 6,738 € 6,609 € 5,680
During the year ended December 31, 2018 Adjusted EBIT excluded adjustments primarily related to:
€748 million provision recognized for costs related to final settlements reached on civil, environmental and consumer claims related to U.S. diesel emissions matters (refer to Note 25 - Guarantees granted, commitments and contingent liabilities to the Consolidated Financial Statements included elsewhere in this report);
€353 million relating to impairment expense of €297 million and supplier obligations of €56 million, primarily in EMEA, resulting from changes in product plans in connection with the 2018-2022 business plan;
€129 million relating to impairment of inventory in connection with the accelerated adoption of new emission standards in China and slower than expected sales;
€114 million costs for recall, net of recovery in relation to Takata airbag inflators. During 2017, €102 million costs were recorded in Cost of revenues, relating to an expansion of the scope of the Takata airbag inflator recalls, of which €29 million related to the previously announced recall in NAFTA and €73 million related to the preventative safety campaigns in LATAM. During 2016, estimated costs of recall campaigns related to Takata airbag inflators of €414 million were recorded within Cost of revenues in the Consolidated Income Statement for the year ended December 31, 2016, to adjust the warranty provision for an expansion in May 2016 of the population recalled. As the charges for the warranty adjustment were due to an industry-wide recall resulting from parts manufactured by Takata, and, due to the financial uncertainty of Takata, we determined these charges were unusual in nature, and as such, the charges for 2016, 2017 and 2018 were excluded from Adjusted EBIT (refer to Note 25, Guarantees granted, commitments and contingent liabilities, within our Consolidated Financial Statements included elsewhere in this report for additional information);
Board Report
Financial Overview

2018 | ANNUAL REPORT 57
€111 million charge in relation to a special bonus payment, announced January 11, 2018, of $2,000 to approximately 60,000 hourly and salaried employees in the United States, excluding senior management, as a result of the Tax Cuts and Jobs Act;
€103 million relating to restructuring costs, which included €123 million of costs in EMEA offset by a €28 million reversal of previously recorded restructuring costs in LATAM;
€92 million charge arising on settlement of a portion of a supplemental retirement plan and an annuity buyout in NAFTA;
€43 million charge in relation to costs incurred in relation to the flood and fire in the Port of Savona (Italy);
€50 million gain from the partial recovery of amounts accrued in 2016 in relation to costs for a recall which were contested with a supplier;
€60 million reduction of costs previously provided in relation to the NAFTA capacity realignment plan. During the year ended December 31, 2015, as part of the plan to improve margins in NAFTA, the Group realigned a portion of its manufacturing capacity in the region to better meet market demand for Ram pickup trucks and Jeep vehicles within the Group’s existing plant infrastructure. During the year ended December 31, 2016, net incremental costs of €156 million from the implementation of the plan were recognized and also excluded from Adjusted EBIT. During the year ended December 31, 2017, €38 million income related to adjustments to reserves were recognized and excluded from Adjusted EBIT; and
€72 million of gains in relation to the recognition of credits for amounts paid in prior years in relation to indirect taxes in Brazil.
During the year ended December 31, 2017 Adjusted EBIT excluded adjustments primarily related to:
€219 million charge relating to asset impairments, primarily in LATAM and EMEA, resulting from changes in the product portfolio, as well as, impairments of certain real estate assets in Venezuela;
€102 million charge for the estimated costs of recall campaigns related to Takata airbag inflators, referred to above;
€86 million restructuring costs, primarily of which €75 million related to workforce restructuring costs in LATAM;
€42 million net loss resulting from deconsolidation of our operations in Venezuela. Refer to Note 3 - Scope of consolidation;
€68 million income reflecting final insurance recoveries related to the explosions at the Port of Tianjin, China. On August 12, 2015, a series of explosions which occurred at a container storage station at the Port of Tianjin impacted several storage areas containing approximately 25,000 FCA branded vehicles, of which approximately 13,300 were owned by FCA and approximately 11,400 vehicles were previously sold to our distributor. As a result of the explosions, nearly all of the vehicles at the Port of Tianjin were affected and some were destroyed. During the year ended December 31, 2016, €55 million of insurance recoveries relating to Tianjin were excluded from Adjusted EBIT. Insurance recoveries related to losses incurred in connection with the explosions at the Port of Tianjin are excluded from Adjusted EBIT to the extent the insured loss to which the recovery relates was excluded from Adjusted EBIT. Insurance recoveries are included in Adjusted EBIT to the extent they relate to costs, increased incentives or business interruption losses that were included in Adjusted EBIT;
€76 million gain on disposal of investments, primarily related to a €49 million gain on the disposal of the Group’s publishing business;
€38 million income related to adjustments to reserves for the NAFTA capacity realignment plan referred to above; and
€895 million gain on the reversal of a liability for Brazilian indirect taxes, as reported above.
During the year ended December 31, 2016 Adjusted EBIT excluded adjustments primarily related to:
€177 million charges relating to asset impairments, primarily resulting from the Group’s capacity realignment to SUV production in China, which resulted in an impairment charge of €90 million for locally-produced Fiat Viaggio and Ottimo vehicles, and €73 million of impairment losses and asset write-offs, of which €43 million related to certain of FCA Venezuela’s assets due to the continued deterioration of the economic conditions in Venezuela;

58 2018 | ANNUAL REPORT
€414 million charge for the estimated costs of recall campaigns related to Takata airbag inflators, referred to above;
€68 million restructuring costs, primarily relating to LATAM and Components;
€55 million insurance recoveries relating to the Tianjin port explosions referred to above;
€156 million relating to the NAFTA capacity alignment referred to above; and
€132 million which was recorded within Cost of revenues in the Consolidated Income Statement, related to estimated costs associated with a recall for which costs were contested with a supplier. Although FCA believed the supplier has responsibility for the recall, only a partial recovery of the estimated costs was recognized pursuant to a cost sharing agreement.
Adjusted net profit
Years ended December 31, Increase/(Decrease)(€ million) 2018 2017 2016 2018 vs. 2017 2017 vs. 2016
Adjusted net profit € 4,707 € 3,512 € 2,353 34.0% 49.3%
The increase in Adjusted net profit in 2018 compared to 2017 was driven by improved operating performance and the reduction in Net financial expenses and Tax expense.
The increase in Adjusted net profit in 2017 compared to 2016, was driven by improved operating performance and the reduction in Net financial expenses, which were partially offset by the increase in Tax expense.
The following table summarizes the reconciliation of Net profit from continuing operations to Adjusted net profit:
Years ended December 31,(€ million) 2018 2017 2016
Net profit from continuing operations € 3,330 € 3,291 € 1,713
Adjustments (as above) 1,574 (615) 872
Tax impact on adjustments (125) 14 (232)
Brazil deferred tax assets write-off — 453 —Reduction of deferred tax assets related to reversal of a Brazilian indirect tax liability — 281 —
Impact of U.S. tax reform (72) 88 —
Total adjustments, net of taxes 1,377 221 640
Adjusted net profit € 4,707 € 3,512 € 2,353
During the year ended December 31, 2018, Adjusted net profit excluded adjustments related to:
€125 million gain reflecting the tax impact on the items excluded from Adjusted EBIT above; and
€72 million gain relating to the impact of December 2017 U.S. tax reform.
During the year ended December 31, 2017 Adjusted net profit excluded adjustments related to:
€14 million expense reflecting the tax impact on the items excluded from Adjusted EBIT above;
€453 million expense relating to the write-off of deferred tax assets in Brazil as reported above;
€281 million expense arising on decrease in deferred tax assets related to the release of the Brazilian indirect tax liability noted above; and
€88 million expense relating to the impact of December 2017 U.S. tax reform.
During the year ended December 31, 2016 Adjusted net profit excluded adjustments related to:
€232 million gain, reflecting the tax impact on the items excluded from Adjusted EBIT above.
Board Report
Financial Overview

2018 | ANNUAL REPORT 59
Results by Segment – 2018 compared to 2017 and 2017 compared to 2016
(€ million, except shipments which are in thousands of units)
Net revenues Adjusted EBIT Shipments
Years ended December 31
2018 2017 2016 2018 2017 2016 2018 2017 2016
NAFTA € 72,384 € 66,094 € 69,094 € 6,230 € 5,227 € 5,133 2,633 2,401 2,587
LATAM 8,152 8,004 6,197 359 151 5 585 521 456
APAC 2,703 3,250 3,662 (296) 172 105 84 85 91
EMEA 22,815 22,700 21,860 406 735 540 1,318 1,365 1,306
Maserati 2,663 4,058 3,479 151 560 339 35 51 42
Other activities 2,888 3,248 3,116 (40) (98) (175) — — —Unallocated items & eliminations(1) (1,193) (1,624) (1,610) (72) (138) (267) — — —
Total € 110,412 € 105,730 € 105,798 € 6,738 € 6,609 € 5,680 4,655 4,423 4,482(1) Primarily includes intercompany transactions which are eliminated in consolidation; also includes, primarily in 2017, costs related to the launch
of the Alfa Romeo Giulia platform, which were not allocated to the mass-market vehicle segments due to the limited number of shipments.
The following is a discussion of Net revenues, Adjusted EBIT and shipments for each segment for the year ended December 31, 2018 as compared to the year ended December 31, 2017, and for the year ended December 31, 2017 as compared to the year ended December 31, 2016. We review changes in our results of operations with the following operational drivers:
Volume: reflects changes in products sold to our customers, primarily dealers and fleet customers. Change in volumes is driven by industry volume, market share and changes in dealer stock levels. Vehicles manufactured and distributed by our unconsolidated subsidiaries are not included within volume;
Mix: generally reflects the changes in product mix, including mix among vehicle brands and models, as well as changes in regional market and distribution channel mix, including mix between retail and fleet customers;
Net price: primarily reflects changes in prices to our customers including higher pricing related to content enhancement, net of discounts, price rebates and other sales incentive programs, as well as related foreign currency transaction effects;
Industrial costs: primarily include cost changes to manufacturing and purchasing of materials that are associated with content, technology and enhancement of vehicle features, as well as industrial efficiencies and inefficiencies, recall campaign and warranty costs, research and development costs and related foreign currency transaction effects;
Selling, general and administrative costs (“SG&A”): primarily include costs for advertising and promotional activities, purchased services, information technology costs and other costs not directly related to the development and manufacturing of our products; and
Other: includes other items not mentioned above, such as foreign currency exchange translation and results from joint ventures and associates.
NAFTAIncrease/(Decrease)
Years ended December 31 2018 vs. 2017 2017 vs. 2016
2018 2017 2016 % Actual % CER % Actual % CER
Shipments (thousands of units) 2,633 2,401 2,587 9.7% — (7.2)% —
Net revenues (€ million) € 72,384 € 66,094 € 69,094 9.5% 14.5% (4.3)% (2.6)%
Adjusted EBIT (€ million) € 6,230 € 5,227 € 5,133 19.2% 24.9% 1.8% 4.0%
Adjusted EBIT margin (%) 8.6% 7.9% 7.4% +70 bps — +50 bps —

60 2018 | ANNUAL REPORT
ShipmentsThe increase in vehicle shipments in 2018 compared to 2017 was primarily driven by the all-new Jeep Wrangler and the all-new Ram 1500, as well as increased shipments of new Jeep Cherokee and Jeep Compass. Shipments reflected increases in (i) the U.S. of 311 thousand units (+15 percent), which were partially offset by decreases in (ii) Canada of 60 thousand units (-22 percent) and (iii) Mexico of 22 thousand units (-25 percent).
The decrease in vehicle shipments in 2017 compared to 2016 was primarily driven by lower fleet volumes as a result of planned fleet sales reductions, primarily for Jeep, and the discontinuance of the Jeep Patriot, Dodge Dart and Chrysler 200, which was partially offset by increased shipments for the Ram and Alfa Romeo brands, Jeep Grand Cherokee and the all-new Jeep Compass. Shipments reflected decreases in (i) the U.S. of 189 thousand units (-9 percent), which were partially offset by increases in (ii) Mexico of 4 thousand units (+4 percent), with shipments in (iii) Canada remaining flat during the period.
Net revenuesThe increase in NAFTA Net revenues in 2018 compared to 2017 was primarily due to €6.6 billion from an increase in volumes and positive mix and €2.9 billion from positive net pricing, partially offset by €3.3 billion due to negative foreign exchange translation effects.
The decrease in NAFTA Net revenues in 2017 compared to 2016 was primarily attributable to a €1.7 billion net decrease resulting from lower shipments (as described above), net of favorable vehicle and channel mix and €1.2 billion from negative foreign currency translation effects.
Adjusted EBITThe following charts reflect the change in NAFTA Adjusted EBIT by operational driver for 2018 as compared to 2017 and for 2017 as compared to 2016:
Adjusted EBIT by operational driver2018 compared to 2017 (€ million)
The increase in NAFTA Adjusted EBIT in 2018 compared to 2017 was primarily attributable to:
higher shipments and favorable vehicle and market mix;
positive net pricing, primarily for new vehicles and pricing actions on existing vehicles, net of higher incentives; and
lower selling, general and administrative expenses primarily due to lower advertising expense.
These were partially offset by:
higher industrial costs, which mainly related to product content for approximately €3 billion, launch costs, logistic costs for approximately €1 billion and depreciation and amortization related to new vehicles, partially offset by purchasing efficiencies and lower warranties; and
negative foreign currency translation effects.
Board Report
Financial Overview
Volume & Mix Net price Industrial costs SG&A Other 20182017
6,230
(401)
3142,445
2,928
(4,283)5,227

2018 | ANNUAL REPORT 61
Adjusted EBIT by operational driver2017 compared to 2016 (€ million)
The increase in NAFTA Adjusted EBIT in 2017 compared to 2016 was primarily attributable to:
favorable mix, net of lower shipments, as described above;
positive pricing, partially offset by higher incentives and foreign exchange impacts due to the Canadian Dollar; and
lower SG&A expenditures, primarily due to lower advertising costs.
These were partially offset by:
higher industrial costs due to higher product costs for content enhancements and increased costs for the capacity realignment plan, partially offset by purchasing efficiencies and lower warranty costs;
negative foreign exchange translation effects; and
a prior year one-off residual values adjustment, included within Other above.
LATAMIncrease/(Decrease)
Years ended December 31 2018 vs. 2017 2017 vs. 2016
2018 2017 2016 % Actual % CER % Actual % CER
Shipments (thousands of units) 585 521 456 12.3% — 14.3% —
Net revenues (€ million) € 8,152 € 8,004 € 6,197 1.8% 21.0% 29.2% 23.6%
Adjusted EBIT (€ million) € 359 € 151 € 5 137.7% 197.5% n.m. n.m.
Adjusted EBIT margin (%) 4.4% 1.9% 0.1% +250 bps — +180 bps —
n.m. = Number is not meaningful.
ShipmentsThe increase in vehicle shipments in 2018 compared to 2017 was primarily attributable to higher demand in Brazil partially offset by the impact of Argentina economic downturn, with the all-new Fiat Argo and Cronos and Fiat Strada, as well as Pernambuco-built vehicles, partially offset by discontinued vehicles. Shipments reflected (i) an increase of 72 thousand units (+19 percent) in Brazil, (ii) a decrease of 20 thousand units (-18 percent) in Argentina and (iii) other LATAM markets increasing by 12 thousand units (+41 percent).
The increase in vehicle shipments in 2017 compared to 2016 was primarily attributable to improving market conditions and the success of the Fiat Mobi, the all-new Fiat Argo and Jeep Compass, partially offset by the discontinued Fiat Palio Family. Shipments reflected (i) an increase of 31 thousand units (+9 percent) in Brazil and (ii) an increase of 30 thousand units (+37 percent) in Argentina.
Net revenuesLATAM Net revenues slightly increased in 2018 compared to 2017 with €1.6 billion benefit from higher volumes, favorable vehicle mix and positive net pricing, which were partially offset by €1.5 billion from negative foreign exchange translation effects and the weakening Argentine Peso.
Volume & Mix Net price Industrial costs SG&A Other 20172016
5,227
(209)
92324 106
(219)
5,133

62 2018 | ANNUAL REPORT
The increase in LATAM Net revenues in 2017 compared to 2016 was primarily attributable to €1.4 billion from higher shipments (as described above) and favorable vehicle mix, €0.2 billion from positive net pricing, partially offset by increased incentives, and €0.3 billion from favorable foreign currency translation effects.
Adjusted EBITThe following charts reflect the change in LATAM Adjusted EBIT by operational driver for 2018 as compared to 2017 and for 2017 as compared to 2016:
Adjusted EBIT by operational driver2018 compared to 2017 (€ million)
The increase in LATAM Adjusted EBIT in 2018 compared to 2017 was primarily attributable to:
higher volumes and favorable mix; and
positive net pricing in Brazil.
These were partially offset by:
higher industrial costs, primarily from higher depreciation and amortization and research and development costs on new vehicles;
higher advertising costs related to new vehicles; and
negative foreign currency effects.
Adjusted EBIT by operational driver2017 compared to 2016 (€ million)
The increase in LATAM Adjusted EBIT in 2017 compared to 2016 was primarily attributable to:
increased volumes and favorable vehicle mix;
favorable net pricing, partially offset by increased incentives; and
lower indirect taxes in Brazil.
Board Report
Financial Overview
Volume & Mix Net price Industrial costs SG&A Other 20182017
359
(85)
(71)
317
125
(78)
151
Volume & Mix Net price Industrial costs SG&A Other 20172016
151
(12)(3)
249
180
(268)
5

2018 | ANNUAL REPORT 63
These were partially offset by:
higher industrial costs due to input cost inflation; and
higher depreciation and amortization related to new vehicles.
APAC Increase/(Decrease)
Years ended December 31 2018 vs. 2017 2017 vs. 2016
2018 2017 2016 % Actual % CER % Actual % CER
Combined shipments (thousands of units) 209 290 233 (27.9)% — 24.5% —
Consolidated shipments (thousands of units) 84 85 91 (1.2)% — (6.6)% —
Net revenues (€ million) € 2,703 € 3,250 € 3,662 (16.8)% (12.8)% (11.3)% (9.2)%
Adjusted EBIT (€ million) € (296) € 172 € 105 (272.1)% (274.1)% 63.8% 71.8%
Adjusted EBIT margin (%) (11.0)% 5.3% 2.9% -1630 bps — +240 bps —
We locally produce and distribute the Jeep Cherokee, Jeep Renegade, Jeep Compass and all-new Jeep Grand Commander through the 50 percent owned GAC Fiat Chrysler Automobiles Co. (“GAC FCA JV”). The results of the GAC FCA JV are accounted for using the equity method, with recognition of our share of the net income of the joint venture in the line item “Result from investment” within the Consolidated Income Statement. We also produce the all-new Jeep Compass through our joint operation with Fiat India Automobiles Private Limited (“FIAPL”) and we recognize our related interest in the joint operation on a line by line basis.
Shipments of our consolidated subsidiaries, which includes vehicles produced by FIAPL, are reported in both consolidated and combined shipments. Shipments of the GAC FCA JV joint venture are not included in consolidated shipments and are only in combined shipments.
The GAC FCA JV was fully operational by 2017, producing four Jeep sport utility vehicle (“SUV”) models (all-new Grand Commander, Cherokee, Renegade and Compass) by 2018 as compared to the production of only one Jeep SUV model (Cherokee) in 2016.
ShipmentsThe slight decrease in consolidated shipments in 2018 compared to 2017 was primarily attributable to lower import volumes, partially offset by increased shipments of the all-new Jeep Compass in India. These factors including the weakness of the Chinese market, with increased competition, particularly in the SUV segments, drove the decrease in combined shipments in 2018 compared to 2017.
The slight decrease in consolidated shipments in 2017 compared to 2016 was primarily attributable to planned reductions of Jeep imports in China, partially offset by the launch of Alfa Romeo in the region and Jeep Compass production in India. The increase in combined shipments in 2017 as compared to 2016 was due to the ramp up in localized Jeep production through the GAC FCA JV.
Net revenuesThe decrease in APAC Net revenues in 2018 compared to 2017 was primarily due to unfavorable mix and pricing actions, lower import volumes in China and in addition to negative foreign exchange translation effects. These were partially offset by increased shipments in India.
The decrease in APAC Net revenues in 2017 compared to 2016 was primarily due to lower consolidated shipments, as described above, lower parts and components sales, and negative foreign exchange effects.

64 2018 | ANNUAL REPORT
Adjusted EBITThe following charts reflect the change in APAC Adjusted EBIT by operational driver for 2018 as compared to 2017 and for 2017 as compared to 2016:
Adjusted EBIT by operational driver2018 compared to 2017 (€ million)
The decrease in APAC Adjusted EBIT in 2018 compared to 2017 was primarily attributable to:
lower Net revenues, as described above;
lower results from the GAC FCA JV (included in Other above); and
the benefit of the Tianjin port explosions final insurance recovery of €93 million included in the prior year results (included in Other above).
These were partially offset by:
lower advertising and selling, general and administrative expenses mainly related to China Jeep imports.
Adjusted EBIT by operational driver2017 compared to 2016 (€ million)
The increase in APAC Adjusted EBIT in 2017 compared to 2016 was primarily attributable to:
insurance recoveries included within Adjusted EBIT of €93 million relating to the Tianjin (China) port explosions;
favorable vehicle mix and lower incentives; and
improved results from the GAC FCA JV (included in Other above).
These were partially offset by:
launch costs related to the Alfa Romeo brand; and
higher industrial costs from negative foreign exchange transaction effects.
Board Report
Financial Overview
Volume & Mix Net price Industrial costs SG&A Other 20172016
172117
(18)
3725
(94)
105
337
Volume & Mix Net price Industrial costs SG&A Other 20182017
(296)(231)
(142)
(135)
172

2018 | ANNUAL REPORT 65
EMEAIncrease/(Decrease)
Years ended December 31 2018 vs. 2017 2017 vs. 2016
2018 2017 2016 % Actual % CER % Actual % CER
Shipments (thousands of units) 1,318 1,365 1,306 (3.4)% — 4.5% —
Net revenues (€ million) € 22,815 € 22,700 € 21,860 0.5% 1.0% 3.8% 4.4%
Adjusted EBIT (€ million) € 406 € 735 € 540 (44.8)% (46.2)% 36.1% 35.6%
Adjusted EBIT margin (%) 1.8% 3.2% 2.5% -140 bps — +70 bps —
ShipmentsThe decrease in vehicle shipments in 2018 compared to 2017 was primarily attributable to lower Fiat shipments, partially offset by increased shipments of the Jeep Compass and the all-new Jeep Wrangler. Shipments reflected (i) a decrease in passenger car shipments to 1,031 thousand units (-4%) and (ii) a decrease in shipments of light commercial vehicles (“LCVs”) to 287 thousand units (-3%).
The increase in vehicle shipments in 2017 compared to 2016 was primarily attributable to the all-new Alfa Romeo Stelvio and Jeep Compass, as well as the Fiat Tipo family. Shipments reflected (i) an increase in passenger car shipments to 1,068 thousand units (+6 percent) and (ii) an increase in shipments of LCVs to 297 thousand units (+1 percent).
Net revenuesEMEA Net revenues in 2018 were in line with 2017, with favorable vehicle mix being offset by lower volumes, negative net pricing and foreign exchange effects.
The increase in EMEA Net revenues in 2017 compared to 2016 was primarily attributable to a positive effect of €1.6 billion related to increases in volumes (as described above) and favorable mix. This was partially offset by negative net pricing and by negative foreign currency exchange impacts including depreciation of the British Pound sterling.
Adjusted EBITThe following charts reflect the change in EMEA Adjusted EBIT by operational driver for 2018 as compared to 2017 and for 2017 as compared to 2016:
Adjusted EBIT by operational driver2018 compared to 2017 (€ million)
The decrease in EMEA Adjusted EBIT in 2018 compared to 2017 was primarily attributable to:
negative net pricing, also impacted by the transition to WLTP, higher incentives and foreign exchange transaction impacts;
lower volumes and unfavorable trim and channel mix, and
higher advertising costs.
These were partially offset by:
lower industrial costs, primarily due to purchasing and manufacturing efficiencies; and
continued cost containment actions.
168 16
Volume & Mix Net price Industrial costs SG&A Other 20182017
406
(19)(176)
(318)
735

66 2018 | ANNUAL REPORT
Adjusted EBIT by operational driver2017 compared to 2016 (€ million)
The increase in EMEA Adjusted EBIT in 2017 compared to 2016 was primarily attributable to:
higher volumes and favorable vehicle mix, as described above;
lower industrial costs mainly due to purchasing and manufacturing cost efficiencies, partially offset by higher amortization and depreciation costs related to new vehicles; and
improved results from the FCA Bank joint venture (included in Other above).
These were partially offset by:
unfavorable net pricing, primarily due to higher incentives and negative foreign exchange effects, including depreciation of the British Pound sterling.
Maserati Increase/(Decrease)
Years ended December 31 2018 vs. 2017 2017 vs. 2016
2018 2017 2016 % Actual % CER % Actual % CER
Shipments (thousands of units) 35 51 42 (31.4)% — 21.4% —
Net revenues (€ million) € 2,663 € 4,058 € 3,479 (34.4)% (33.0)% 16.6% 19.3%
Adjusted EBIT (€ million) € 151 € 560 € 339 (73.0)% (72.6)% 65.2% 67.7%
Adjusted EBIT margin (%) 5.7% 13.8% 9.7% -810 bps — +410 bps —
ShipmentsThe decrease in Maserati shipments in 2018 compared to 2017 was mainly due to China (-52 percent), as well as lower volumes in North America (-26 percent) and Europe (-21 percent).
The increase in Maserati shipments in 2017 compared to 2016 was primarily attributable to increase in shipments for the Maserati Levante, partially offset by lower Maserati Ghibli and Quattroporte volumes, which drove higher shipments in China (+31 percent), Europe (+25 percent) and North America (+11 percent).
Net revenuesThe decrease in Maserati Net revenues in 2018 compared to 2017 was primarily due to lower volumes and unfavorable mix.
The increase in Maserati Net revenues in 2017 compared to 2016 was primarily driven by higher shipments, partially offset by negative foreign exchange effects.
Adjusted EBITThe decrease in Maserati Adjusted EBIT in 2018 compared to 2017 was primarily due to lower shipments and unfavorable market mix, increased depreciation and amortization expense and foreign exchange. These were partially offset by lower advertising and marketing spend.
The increase in Maserati Adjusted EBIT in 2017 compared to 2016 was primarily due to higher shipments (as described above) and lower industrial costs primarily due to manufacturing and purchasing efficiencies. These were partially offset by negative foreign currency exchange effects.
Board Report
Financial Overview
Volume & Mix Net price Industrial costs SG&A Other 20172016
7353428226
(242)
149540
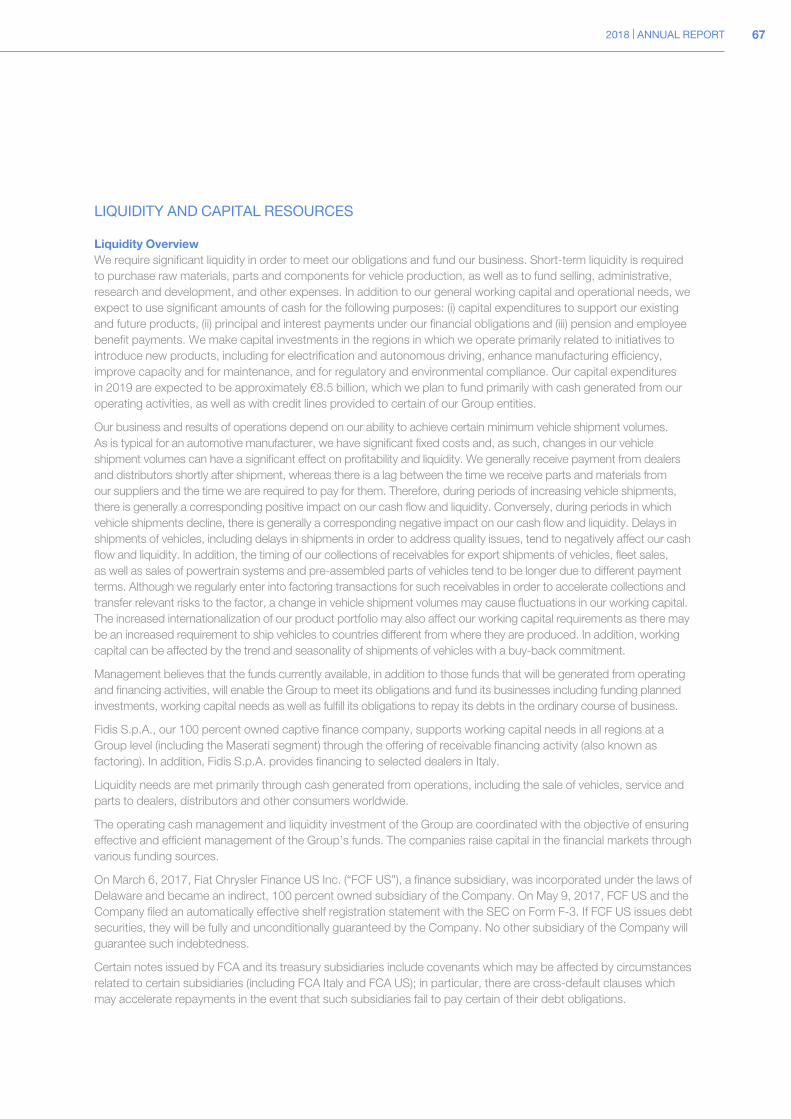
2018 | ANNUAL REPORT 67
LIQUIDITY AND CAPITAL RESOURCES
Liquidity OverviewWe require significant liquidity in order to meet our obligations and fund our business. Short-term liquidity is required to purchase raw materials, parts and components for vehicle production, as well as to fund selling, administrative, research and development, and other expenses. In addition to our general working capital and operational needs, we expect to use significant amounts of cash for the following purposes: (i) capital expenditures to support our existing and future products, (ii) principal and interest payments under our financial obligations and (iii) pension and employee benefit payments. We make capital investments in the regions in which we operate primarily related to initiatives to introduce new products, including for electrification and autonomous driving, enhance manufacturing efficiency, improve capacity and for maintenance, and for regulatory and environmental compliance. Our capital expenditures in 2019 are expected to be approximately €8.5 billion, which we plan to fund primarily with cash generated from our operating activities, as well as with credit lines provided to certain of our Group entities.
Our business and results of operations depend on our ability to achieve certain minimum vehicle shipment volumes. As is typical for an automotive manufacturer, we have significant fixed costs and, as such, changes in our vehicle shipment volumes can have a significant effect on profitability and liquidity. We generally receive payment from dealers and distributors shortly after shipment, whereas there is a lag between the time we receive parts and materials from our suppliers and the time we are required to pay for them. Therefore, during periods of increasing vehicle shipments, there is generally a corresponding positive impact on our cash flow and liquidity. Conversely, during periods in which vehicle shipments decline, there is generally a corresponding negative impact on our cash flow and liquidity. Delays in shipments of vehicles, including delays in shipments in order to address quality issues, tend to negatively affect our cash flow and liquidity. In addition, the timing of our collections of receivables for export shipments of vehicles, fleet sales, as well as sales of powertrain systems and pre-assembled parts of vehicles tend to be longer due to different payment terms. Although we regularly enter into factoring transactions for such receivables in order to accelerate collections and transfer relevant risks to the factor, a change in vehicle shipment volumes may cause fluctuations in our working capital. The increased internationalization of our product portfolio may also affect our working capital requirements as there may be an increased requirement to ship vehicles to countries different from where they are produced. In addition, working capital can be affected by the trend and seasonality of shipments of vehicles with a buy-back commitment.
Management believes that the funds currently available, in addition to those funds that will be generated from operating and financing activities, will enable the Group to meet its obligations and fund its businesses including funding planned investments, working capital needs as well as fulfill its obligations to repay its debts in the ordinary course of business.
Fidis S.p.A., our 100 percent owned captive finance company, supports working capital needs in all regions at a Group level (including the Maserati segment) through the offering of receivable financing activity (also known as factoring). In addition, Fidis S.p.A. provides financing to selected dealers in Italy.
Liquidity needs are met primarily through cash generated from operations, including the sale of vehicles, service and parts to dealers, distributors and other consumers worldwide.
The operating cash management and liquidity investment of the Group are coordinated with the objective of ensuring effective and efficient management of the Group’s funds. The companies raise capital in the financial markets through various funding sources.
On March 6, 2017, Fiat Chrysler Finance US Inc. (“FCF US”), a finance subsidiary, was incorporated under the laws of Delaware and became an indirect, 100 percent owned subsidiary of the Company. On May 9, 2017, FCF US and the Company filed an automatically effective shelf registration statement with the SEC on Form F-3. If FCF US issues debt securities, they will be fully and unconditionally guaranteed by the Company. No other subsidiary of the Company will guarantee such indebtedness.
Certain notes issued by FCA and its treasury subsidiaries include covenants which may be affected by circumstances related to certain subsidiaries (including FCA Italy and FCA US); in particular, there are cross-default clauses which may accelerate repayments in the event that such subsidiaries fail to pay certain of their debt obligations.

68 2018 | ANNUAL REPORT
Long-term liquidity requirements may involve some level of debt refinancing as outstanding debt becomes due or we are required to make principal payments. Although we believe that our current level of total available liquidity is sufficient to meet our short-term and long-term liquidity requirements, we regularly evaluate opportunities to improve our liquidity position in order to enhance financial flexibility and to achieve and maintain a liquidity and capital position consistent with that of other companies in our industry.
However, any actual or perceived limitations of our liquidity may limit the ability or willingness of counterparties, including dealers, consumers, suppliers, lenders and financial service providers, to do business with us, or require us to restrict additional amounts of cash to provide collateral security for our obligations. Our liquidity levels are subject to a number of risks and uncertainties, including those described in Risk Factors.
Available LiquidityThe following table summarizes our available liquidity, and includes Magneti Marelli for comparability with prior periods:
At December 31(€ million) 2018 2017 2016
Cash, cash equivalents and current securities(1) € 13,397 € 12,814 € 17,559
Undrawn committed credit lines(2) 7,728 7,563 6,242
Total Available liquidity(3) € 21,125 € 20,377 € 23,801(1) Current securities are comprised of short-term or marketable securities which represent temporary investments but do not satisfy all the
requirements to be classified as cash equivalents as they may not be able to be readily converted into cash, or they are subject to significant risk of change in value (even if they are short-term in nature or marketable).
(2) Excludes the undrawn €0.1 billion long-term dedicated credit lines available to fund scheduled investments at December 31, 2018 (€0.1 billion was undrawn at December 31, 2017 and €0.3 billion was undrawn at December 31, 2016).
(3) The majority of our liquidity is available to our treasury operations in Europe and U.S.; however, liquidity is also available to certain subsidiaries which operate in other countries. Cash held in such countries may be subject to restrictions on transfer depending on the foreign jurisdictions in which these subsidiaries operate. Based on our review of such transfer restrictions in the countries in which we operate and maintain material cash balances, we do not believe such transfer restrictions had an adverse impact on the Group’s ability to meet its liquidity requirements at the dates presented above.
Our liquidity is principally denominated in U.S. Dollar and Euro. Out of the total €13.4 billion of cash, cash equivalents and current securities available at December 31, 2018 (€12.8 billion at December 31, 2017, €17.6 billion at December 31, 2016), €7.8 billion or 58.2 percent were denominated in U.S. Dollar (€7 billion, or 54.7 percent, at December 31, 2017 and €9.8 billion, or 55.7 percent, at December 31, 2016) and €1.9 billion, or 14.2 percent, were denominated in Euro (€2.3 billion, or 18.0 percent, at December 31, 2017 and €3.3 billion, or 18.8 percent, at December 31, 2016).
In March 2018, the Group amended its syndicated revolving credit facility originally signed in June 2015 and previously amended in March 2017 (as amended, the “RCF”). The amendment extended the RCF’s final maturity to March 2023. The RCF, which is available for general corporate purposes and for the working capital needs of the Group, is structured in two tranches: €3.125 billion, with a 37-month tenor and two extension options of 1-year and of 11-months exercisable on the first and second anniversary of the amendment signing date, respectively, and €3.125 billion, with a 60-month tenor. The amendment was accounted for as a debt modification and, as a result, the new costs associated with the March 2018 amendment as well as the remaining unamortized debt issuance costs related to the original €5.0 billion RCF and the previous March 2017 amendment will be amortized over the life of the amended RCF. At December 31, 2018, the €6.25 billion RCF was undrawn.
In the March 2017 amendment, the original RCF was increased from €5.0 billion to €6.25 billion and the final maturity extended to March 2022. The amendment was accounted for as a debt modification and, as a result, the remaining unamortized debt issuance costs related to the original €5.0 billion RCF and the new costs associated with the amendment were amortized over the life of the RCF.
At December 31, 2018, undrawn committed credit lines totaling €7.7 billion included the €6.25 billion RCF and approximately €1.5 billion of other revolving credit facilities. At December 31, 2017, undrawn committed credit lines totaling €7.6 billion included the €6.25 billion RCF and approximately €1.3 billion of other revolving credit facilities.
Board Report
Financial Overview

2018 | ANNUAL REPORT 69
The €0.7 billion increase in total available liquidity from December 31, 2017 to December 31, 2018 primarily reflects positive net cash flow for the year, which is cash flow from operating activities, net of cash used in investing activities and cash used in financing activities, for the year. Refer to the section Cash Flows below for additional information.
Cash Flows
Year Ended December 31, 2018 compared to the Years Ended December 31, 2017 and 2016The following table summarizes the cash flows from operating, investing and financing activities for each of the years ended December 31, 2018, 2017 and 2016. Also, refer to our Consolidated Statement of Cash Flows and Note 29, Explanatory notes to the Consolidated Statement of Cash Flows, within our Consolidated Financial Statements included elsewhere in this report for additional information.
Years ended December 31,(€ million) 2018(1) 2017(1) 2016(1)
Cash flows from operating activities - continuing operations € 9,464 € 9,680 € 9,912
Cash flows from operating activities - discontinued operations 484 705 682
Cash flows used in investing activities - continuing operations (6,106) (8,726) (8,490)
Cash flows used in investing activities - discontinued operations (632) (570) (549)
Cash flows used in financing activities - continuing operations (2,695) (4,287) (5,126)
Cash flows used in financing activities - discontinued operations (90) (186) (1)
Translation exchange differences 106 (1,296) 228
Total change in cash and cash equivalents 531 (4,680) (3,344)
Cash and cash equivalents at beginning of the period 12,638 17,318 20,662
Total change in cash and cash equivalents 531 (4,680) (3,344)Less: Cash and cash equivalents at end of the period included within Assets held for sale 719 — —
Cash and cash equivalents at end of the period € 12,450 € 12,638 € 17,318(1) The cash flows of the Group for the years ended December 31, 2018, 2017 and 2016 have been re-presented following the classification of
Magneti Marelli as a discontinued operation for the year ended December 31, 2018; Magneti Marelli operating results were excluded from the Group’s continuing operations and are presented as a single line item within the Consolidated Income Statement for the each of the periods presented. The assets and liabilities of Magneti Marelli have been classified as Assets held for sale and Liabilities held for sale within the Consolidated Statement of Financial Position at December 31, 2018, while the assets and liabilities of Magneti Marelli have not been classified as such within the comparative Consolidated Statement of Financial Position for any of the periods presented. Amounts exclude transactions and balances between Magneti Marelli and other companies of the Group, refer to Note 3, Scope of consolidation within our Consolidated Financial Statements included elsewhere within the report for additional information.
Operating Activities — Year Ended December 31, 2018For the year ended December 31, 2018, net cash from operating activities of €9,948 million was primarily the result of: (i) net profit from continuing operations of €3,330 million adjusted to add back €5,507 million for depreciation and amortization expense; in addition to (ii) a net increase of €913 million in provisions primarily due to a provision of €748 million recognized for costs related to final settlements reached on civil,environmental and consumer claims related to U.S. diesel emissions matters; (iii) €457 million in relation to the decrease in net deferred tax assets, mainly due to increased deferred tax liabilities in NAFTA and (iii) cash flow from operating activities of discontinued operations of €484 million. These positive impacts were partially offset by the negative effect of the change in working capital of €1,106 million primarily driven by (a) a decrease in trade payables of €1,240 million related to lower production volumes in EMEA during the three months ended December 31, 2018 compared to the same period in 2017, (b) decrease in other payables, net of receivables of €1,284 million mainly as a result of higher indirect tax receivables in LATAM, decreased income tax payables in NAFTA and lower advance from customers in LATAM and EMEA, and partially offset by (c) a decrease in inventories of €1,399 million due to inventory management actions across all the regions.

70 2018 | ANNUAL REPORT
Operating Activities — Year Ended December 31, 2017For the year ended December 31, 2017, net cash from operating activities of €10,385 million was primarily the result of: (i) net profit from continuing operations of €3,291 million adjusted to add back €5,474 million for depreciation and amortization expense, in addition to a net decrease of €1,075 million in deferred tax assets mainly related to LATAM, and other non-cash items of €197 million; (ii) €102 million dividends received mainly from our equity method investments; and (iii) the negative effect of the change in working capital of €539 million primarily driven by (a) €1,596 million increase in inventories related to ramp-up of new models at year end, including the all-new Alfa Romeo Stelvio and the new Jeep Wrangler, as well as volume increases in LATAM and Maserati, and (b) increase in trade receivables of €157 million, which were partially offset by (c) increase in trade payables of €937 million primarily related to increased production volumes in NAFTA and LATAM in the fourth quarter of 2017 as compared to the same period in 2016, and (d) a €277 million positive impact from increases in other payables and receivables, primarily related to tax payables and higher deferred revenue.
Operating Activities — Year Ended December 31, 2016For the year ended December 31, 2016, net cash from operating activities of €10,594 million was primarily the result of (i) net profit from continuing operations of €1,713 million adjusted to add back €5,549 million for depreciation and amortization expense and other non-cash items of €87 million, (ii) a net increase of €1,453 million in provisions mainly due to the increase in the warranty provision of €414 million in NAFTA for recall campaigns related to an industry wide recall for airbag inflators resulting from parts manufactured by Takata, estimated net costs of €132 million associated with a recall for which costs are being contested with a supplier, and an increase in accrued sales incentives primarily related to NAFTA and EMEA; (iii) €123 million dividends received mainly from our equity method investments and (iv) the positive effect of the change in working capital of €646 million that was primarily driven by (a) decrease in trade receivables of €131 million, (b) increase in trade payables of €729 million mainly related to increased production levels in EMEA, that was partially offset by reduced activity in LATAM and the effect of localized Jeep production in China, (c) €280 million increase in other payables and receivables primarily related to the net payment of taxes and deferred expenses, which were partially offset by (d) €494 million increase in inventories mainly related to the increased production of new vehicle models in EMEA.
Investing Activities — Year Ended December 31, 2018For the year ended December 31, 2018, net cash used in investing activities of €6,738 million was primarily the result of (i) €5,392 million of capital expenditures, including €2,079 million of capitalized development expenditures primarily related to NAFTA and EMEA, that supported investments in existing and future products, including investments in electrification and autonomous driving, and (ii) a €676 million net increase in receivables from financing activities primarily related to the increase in the lending portfolio of the financial services activities in LATAM, EMEA and in APAC.
Investing Activities — Year Ended December 31, 2017For the year ended December 31, 2017, net cash used in investing activities of €9,296 million was primarily the result of (i) €8,105 million of capital expenditures, including €2,431 million of capitalized development expenditures primarily related to NAFTA and EMEA, that supported investments in existing and future products, including investments in electrification and autonomous driving, and (ii) an €836 million net increase in receivables from financing activities primarily related to the increase in the lending portfolio of the financial services activities of the Group in China and Europe, which were partially offset by (iii) proceeds received of €144 million from the sale of FCA’s investment in CNH Industrial N.V. (“CNHI”), which were recognized in the line Change in securities within the Statement of Cash Flows (refer to Note 13, Other Financial assets in the Consolidated Financial Statements included elsewhere in this report).
Board Report
Financial Overview

2018 | ANNUAL REPORT 71
Investing Activities — Year Ended December 31, 2016For the year ended December 31, 2016, net cash used in investing activities of €9,039 million was primarily the result of (i) €8,241 million of capital expenditures, including €2,395 million of capitalized development expenditures that supported investments in existing and future products, which primarily related to the mass-market vehicle operations in NAFTA and EMEA as well as the investment in the Alfa Romeo brand, (ii) a total of €113 million for investments in joint ventures, associates and unconsolidated subsidiaries that primarily related to an additional investment in the GAC FCA JV and (iii) €488 million of a net increase in receivables from financing activities that primarily related to the increase in lending portfolio of the financial services activities of the Group in China and Europe.
Financing Activities —Year Ended December 31, 2018For the year ended December 31, 2018, net cash used in financing activities of €2,785 million was primarily the result of (i) the payment in November 2018 of the outstanding principal and accrued interest of U.S. $1,009 million (€893 million) FCA US’s tranche B term loan maturing December 31, 2018 (the “Tranche B Term Loan due 2018”), (ii) the repayment at maturity of two notes under the Medium Term Note Programme (“MTN Programme”, previously referred to as the Global Medium Term Note Programme, or “GMTN” Programme), one with a principal amount of €1,250 million and one with a principal amount of €600 million.
Financing Activities —Year Ended December 31, 2017For the year ended December 31, 2017, net cash used in financing activities of €4,473 million was primarily the result of (i) the voluntary prepayment in February 2017 of the outstanding principal and accrued interest of U.S.$1,826 million (€1,721 million) FCA US’s tranche B term loan maturing May 24, 2017 (the “Tranche B Term Loan due 2017”), (ii) the repayment at maturity of three notes under the MTN Programme, one with a principal amount of €850 million, one with a principal amount of €1,000 million and one with a principal amount of CHF 450 million (€385 million), and (iii) the repayment of other long-term debt, net of proceeds, of a principal amount of €889 million.
Financing Activities —Year Ended December 31, 2016For the year ended December 31, 2016, net cash used in financing activities of €5,127 million was primarily the result of (i) the repayment at maturity of three notes issued under the MTN Programme, two of which were for an aggregate principal amount of €2,000 million and one for a principal amount of CHF 400 million (€373 million) and (ii) the repayment of other long-term debt for a total of €4,605 million, which included the (a) €1,800 million (U.S.$2.0 billion) of cash used for the voluntary prepayments of principal of FCA US’s Tranche B Term Loans (refer to the section Capital Market and Other Financing Transactions below), (b) the payment of the financial liability related to the mandatory convertible securities of €213 million upon their conversion to FCA shares and (c) repayments at maturity of other long-term debt of €2,605 million primarily in Brazil, which were partially offset by (iii) the issuance of a new note under the MTN Programme for a principal amount of €1,250 million (refer to the section Capital Market and Other Financing Transactions below) and (iv) proceeds from other long-term debt for a total of €1,309 million, which included the proceeds from the €250 million loan entered into with the European Investment Bank (“EIB”) in December 2016 (refer to the section Capital Market and Other Financing Transactions below).

72 2018 | ANNUAL REPORT
Net Cash/(Debt)The following table details our Net cash/(debt) at December 31, 2018 and 2017 and provides a reconciliation of this non-GAAP measure to Debt, which is the most directly comparable measure included in our Consolidated Statement of Financial Position.
At December 31
2018(1) 2017(1)
(€ million)Industrial Activities
Financial Services Consolidated
Industrial Activities
Financial Services Consolidated
Third parties debt (principal) € (12,174) € (2,406) € (14,580) € (16,375) € (1,647) € (18,022)
Capital market(2) (7,699) (413) (8,112) (9,443) (308) (9,751)
Bank debt (3,850) (1,548) (5,398) (6,219) (986) (7,205)
Other debt(3) (625) (445) (1,070) (713) (353) (1,066)
Accrued interest and other adjustments(4) 52 — 52 53 (2) 51Debt with third parties, from continuing operations (12,122) (2,406) (14,528) (16,322) (1,649) (17,971)Debt classified as held for sale (177) — (177) — — —Debt with third parties including discontinued operations (12,299) (2,406) (14,705) (16,322) (1,649) (17,971)Intercompany, net(5) 560 (560) — 844 (844) —Current financial receivables from jointly-controlled financial services companies(6) 242 — 242 285 — 285Debt, net of intercompany and current financial receivables from jointly-controlled financial services companies including discontinued operations (11,497) (2,966) (14,463) (15,193) (2,493) (17,686)Derivative financial assets/(liabilities), net and collateral deposits(7) 150 1 151 204 2 206
Current debt securities(8) 219 — 219 176 — 176
Cash and cash equivalents 12,275 175 12,450 12,423 215 12,638Cash and cash equivalents, current debt securities and derivative financial assets/(liabilities), net classified as held for sale(9) 725 — 725 — — —
Total Net cash/(debt) € 1,872 € (2,790) € (918) € (2,390) € (2,276) € (4,666)(1) The assets and liabilities of Magneti Marelli have been classified as Assets held for sale and Liabilities held for sale within the Consolidated
Statement of Financial Position at December 31, 2018, while the assets and liabilities of Magneti Marelli have not been classified as such within the comparative Consolidated Statement of Financial Position for any of the periods presented. Amounts above at December 31, 2018, exclude balances between Magneti Marelli and other companies of the Group (net financial payables due from Magneti Marelli to other group companies of €444 million as at December 31, 2018). Refer to Note 3, Scope of consolidation within our Consolidated Financial Statements included elsewhere within the report for additional information.
(2) Includes notes issued under the Medium Term Programme, or MTN Programme, and other notes (€7,699 million at December 31, 2018 and €9,422 million at December 31, 2017) and other debt instruments (€413 million at December 31, 2018 and €329 million at December 31, 2017) issued in financial markets, mainly from LATAM financial services companies.
(3) Includes asset-backed financing, i.e. sales of receivables for which de- recognition is not allowed under IFRS (€464 million December 31, 2018 and €360 million at December 31, 2017) and arrangements accounted for as a lease under IFRIC 4 - Determining whether an arrangement contains a lease, and other debt.
(4) Includes adjustments for fair value accounting on debt and net (accrued)/deferred interest and other amortizing cost adjustments.(5) Net amount between industrial activities entities’ financial receivables due from financial services entities (€958 million at December 31, 2018
and €983 million at December 31, 2017) and industrial activities entities’ financial payables due to financial services entities (€398 million at December 31, 2018 and €139 million at December 31, 2017).
(6) Financial receivables due from FCA Bank.(7) Fair value of derivative financial instruments (net positive €90 million at December 31, 2018 and net positive €145 million at December 31,
2017) and collateral deposits (€61 million at December 31, 2018 and €61 million at December 31, 2017).(8) Excludes certain debt securities held pursuant to applicable regulations (€72 million at December 31, 2018 and €59 million December 31,
2017).(9) Includes €9 million of current debt securities. There were no collateral deposits classified as held for sale.
As of December 31, 2018, Net debt was €0.9 billion, €3.7 billion lower as compared to €4.7 billion as at December 31, 2017. Net debt from industrial activities improved by €4.3 billion (refer to Change in Net Industrial Cash/(Debt), below), which was partially offset by an increase of €0.5 billion in net debt from financial services that was used to support the increase in financing activities in LATAM, EMEA and, to a lesser extent, APAC.
Board Report
Financial Overview

2018 | ANNUAL REPORT 73
Change in Net Industrial Cash/(Debt) As described in Non-GAAP Financial Measures, Net industrial cash/(debt) is a measure for analyzing our financial leverage and capital structure. The following section sets forth an explanation of the changes in our Net industrial cash/(debt) during 2018 and 2017, including discontinued operations.
At December 31, 2018, Net industrial cash of €1,872 million improved by €4,262 million from a Net industrial debt position of €(2,390) million at December 31, 2017 primarily as a result of (i) cash flow from industrial operating activities of €9,889 million, which represents the majority of the consolidated cash flow from operating activities of €9,948 million (refer to the section Cash Flows above), (ii) investments in property, plant and equipment and intangible assets of industrial activities of €6,025 million and (iii) positive foreign exchange translation effects of €351 million.
At December 31, 2017, Net industrial debt of €2,390 million decreased by €2,195 million from €4,585 million at December 31, 2017 primarily as a result of (i) cash flow from industrial operating activities of €10,239 million, which represents the majority of the consolidated cash flow from operating activities of €10,385 million (refer to the section Cash Flows above), (ii) proceeds received of €144 million from the sale of FCA’s investment in CNHI as noted above, (iii) €165 million positive change in hedging derivatives positions, and (iv) a €276 million change in the scope of activities, which were partially offset by (v) investments in industrial activities of €8,663 representing investments in property, plant and equipment and intangible assets.
Capital Market and Other Financing Transactions
Notes Issued Through The MTN ProgrammeCertain notes issued by the Group are governed by the terms and conditions of the MTN Programme (previously known as the Global Medium Term Note Programme, or “GMTN” Programme). A maximum of €20 billion may be used under this programme, of which notes of €5.1 billion were outstanding at December 31, 2018 (€6.9 billion at December 31, 2017). Notes under the MTN Programme are issued, or otherwise guaranteed, by FCA NV. We may from time to time buy back notes in the market that have been issued. Such buybacks, if made, depend upon market conditions, the Group’s financial situation and other factors which could affect such decisions.
Changes in notes issued under the MTN Programme during 2018 were due to the:
repayment at maturity of a note in March 2018 with a principal amount of €1,250 million; and
repayment at maturity of a note in July 2018 with a principal amount of €600 million.
Changes in notes issued under the MTN Programme during 2017 were due to the:
repayment at maturity of a note in March 2017 with a principal amount of €850 million;
repayment at maturity of a note in June 2017 with a principal amount of €1,000 million; and
repayment at maturity of a note in November 2017 with a principal amount of CHF 450 million (€385 million).
As of December 31, 2018, FCA was in compliance with the covenants of the notes issued under the MTN Programme (refer to Note 21, Debt, within our Consolidated Financial Statements included elsewhere in this report, for information related to the outstanding notes at December 31, 2018 and 2017 under the MTN Programme and the related covenants).
Other NotesIn 2015, FCA NV issued U.S.$1.5 billion (€1.4 billion) principal amount of 4.5 percent unsecured senior debt securities due April 15, 2020 (the “2020 Notes”) and U.S.$1.5 billion (€1.4 billion) principal amount of 5.25 percent unsecured senior debt securities due April 15, 2023 (the “2023 Notes”) at an issue price of 100 percent of their principal amount. The 2020 Notes and the 2023 Notes, collectively referred to as the “Notes”, rank pari passu in right of payment with respect to all of FCA’s existing and future senior unsecured indebtedness and senior in right of payment to any of FCA’s future subordinated indebtedness and existing indebtedness, which is by its terms subordinated in right of payment to the Notes. Interest on the 2020 Notes and the 2023 Notes is payable semi-annually in April and October.

74 2018 | ANNUAL REPORT
Bank Debt
FCA US Tranche B Term LoansOn November 13, 2018, FCA US prepaid the U.S.$1,009 million (€893 million) outstanding principal and accrued interest on its Tranche B term loan maturing December 31, 2018 (the “Tranche B Term Loan due 2018”). The prepayment was made with cash on hand and resulted in a €1 million loss on extinguishment.
At December 31, 2017, €836 million, including accrued interest, was outstanding under FCA US’s Tranche B Term Loan maturing December 31, 2018. On February 24, 2017, FCA US prepaid the U.S.$1,826 million (€1,721 million) outstanding principal and accrued interest on its tranche B term loan maturing May 24, 2017 (the “Tranche B Term Loan due 2017”). The prepayment was made with cash on hand and resulted in a €3 million loss on extinguishment. On April 12, 2017, FCA US amended the credit agreement that governs the Tranche B Term Loan due 2018, reducing the applicable interest rate spreads by 0.50 percent per annum and reduced the LIBOR floor by 0.75 percent per annum, to 0.00 percent. For the years ended December 31, 2018, 2017 and 2016, interest was accrued based on LIBOR.
On March 15, 2016, FCA US entered into amendments to the credit agreements that govern the Tranche B Term Loans, to, among other items, eliminate covenants restricting the provision of guarantees and payment of dividends by FCA US for the benefit of the rest of the Group, to enable a unified financing platform and to provide free flow of capital within the Group. In conjunction with these amendments, FCA US made a U.S.$2.0 billion (€1.8 billion) voluntary prepayment of principal at par with cash on hand, of which U.S.$1,288 million (€1,159 million) was applied to the Tranche B Term Loan due 2017 and U.S.$712 million (€641 million) was applied to the Tranche B Term Loan due 2018. Accrued interest related to the portion of principal prepaid of the Tranche B Term Loans and related transaction fees were also paid.
The prepayments of principal were accounted for as debt extinguishments, and as a result, a non-cash charge of €10 million was recorded within Net financial expenses in the Consolidated Income Statement for the year ended December 31, 2016, which consisted of the write-off of the remaining unamortized debt issuance costs. The amendments to the remaining principal balance were analyzed on a lender-by-lender basis and accounted for as debt modifications in accordance with IAS 39 - Financial Instruments: Recognition and Measurement. As such, the debt issuance costs for each of the amendments were capitalized and amortized over the respective remaining terms of the Tranche B Term Loans.
European Investment Bank BorrowingsFCA has financing agreements with the European Investment Bank (“EIB”) for a total of €0.7 billion outstanding at December 31, 2018 (€1.1 billion outstanding at December 31, 2017), which included the residual debt due under the following facilities:
the facility for €250 million (maturing in December 2019) entered into in December 2016 to support the Group’s investment plan (2017-2019) in research and development centers in Italy, which includes a number of key objectives such as greater fuel efficiency, a reduction in CO2 emissions by petrol and alternative fuel engines and the study of new hybrid architectures, as well as certain capital expenditures for facilities located in southern Italy;
the facility for €500 million (maturing in June 2021), entered into in May 2011 (guaranteed by SACE and the Serbian Authorities) for an investment program relating to the modernization and expansion of production capacity of an automotive plant in Serbia; and
the facility for €420 million (maturing in June 2022), entered into in June 2018 to support research and development projects to be implemented by FCA during the period 2018-2020.
Board Report
Financial Overview

2018 | ANNUAL REPORT 75
BrazilOur Brazilian subsidiaries have access to various local bank facilities in order to fund investments and operations. Total debt outstanding under those facilities amounted to a principal amount of €2.3 billion at December 31, 2018 (€3.2 billion at December 31, 2017). The loans primarily include subsidized loans granted by public financing institutions such as Banco Nacional do Desenvolvimento (“BNDES”), with the aim to support industrial projects in certain areas. This provided the Group the opportunity to fund large investments in Brazil with loans of sizeable amounts at attractive rates. At December 31, 2018, outstanding subsidized loans amounted to €1.4 billion (€2.1 billion at December 31, 2017), of which approximately €1.0 billion (€1.3 billion at December 31, 2017), related to the construction of the plant in Pernambuco (Brazil), which has been supported by subsidized credit lines totaling Brazilian Real (“BRL”) 6.5 billion (€1.5 billion). Approximately €0.1 billion (€0.1 billion at December 31, 2017), of committed credit lines contracted to fund scheduled investments in the area were undrawn at December 31, 2018.
Mexico Bank LoanFCA Mexico, S.A. de C.V., (“FCA Mexico”), our principal operating subsidiary in Mexico, has a USD-denominated non-revolving loan agreement (“Mexico Bank Loan”) maturing on March 20, 2022 and bears interest at one-month LIBOR plus 3.35 percent per annum. At December 31, 2018, the Mexico Bank Loan had an outstanding balance of €0.3 billion (€0.4 billion at December 31, 2017). As of December 31, 2018, we may prepay all or any portion of the loan without premium or penalty. The Mexico Bank Loan requires FCA Mexico to maintain certain fixed assets as collateral, and comply with certain covenants, including, but not limited to, financial maintenance covenants, limitations on liens, incurrence of debt and asset sales. As of December 31, 2018, FCA Mexico was in compliance with all covenants under the Mexico Bank Loan (refer to Note 21, Debt, within our Consolidated Financial Statements included elsewhere in this report, for information related to the covenants).
Other DebtDuring the year ended December 31, 2018, Other debt remained in line with the year ended December 31, 2017.
During the year ended December 31, 2017, FCA US’s Canadian subsidiary made payments on the Canada Health Care Trust (“HCT”) Tranche B Note totaling €272 million, which included a scheduled payment of principal and accrued interest, and the prepayment of the remaining scheduled payments due on the Canada HCT Tranche B Note. The prepayment, of €226 million, was accounted for as a debt extinguishment, and as a result, a gain on extinguishment of €9 million was recorded within Net financial expenses in the Consolidated Income Statement for the year ended December 31, 2017. This Canada HCT Note represented FCA US’s principal Canadian subsidiary’s remaining financial liability to the Canadian Health Care Trust arising from the settlement of its obligations for postretirement health care benefits for National Automobile, Aerospace, Transportation and General Workers Union of Canada “CAW” (now part of Unifor), which represented employees, retirees and dependents.
Debt secured by assetsAt December 31, 2018, debt secured by assets of the Group amounted to €1,095 million (€1,348 million at December 31, 2017), of which €261 million (€281 million at December 31, 2017) was due to creditors for assets acquired under finance leases and the remaining amount mainly related to subsidized financing in Latin America.
The total carrying amount of assets acting as security for loans for the Group (excluding the amounts secured in relation to the Tranche B Term Loan) amounted to €2,214 million at December 31, 2018 (€2,372 million at December 31, 2017) (Note 11, Property, plant and equipment). At December 31, 2017, debt secured by assets of FCA US, in relation the Tranche B Term Loan amounted to €836 million.

76 2018 | ANNUAL REPORT
Industrial free cash flows As described in Non-GAAP Financial Measures, Industrial free cash flows is management’s key cash flow metric. The following table provides a reconciliation of Cash flows from operating activities, the most directly comparable measure included in our Consolidated Statement of Cash Flows, to Industrial free cash flows for the years ended December 31, 2018, 2017 and 2016. The amounts below include Magneti Marelli for comparability with prior periods and previously provided guidance:
Years ended December 31,(€ million) 2018 2017 2016
Cash flows from operating activities € 9,464 € 9,680 € 9,912
Less: Operating activities not attributable to industrial activities (59) (159) (67)
Less: Capital expenditures for industrial activities (6,025) (8,663) (8,812)
Add back: Discretionary pension contribution, net of tax 478 — —
Industrial free cash flows € 4,342 € 1,563 € 1,715
Excluding impacts from discretionary pensions contributions, net of tax, cash flows from operating activities were €9,942 million in 2018, €268 million higher than in 2017. Capital expenditures for industrial activities decreased €2,638 million as compared to 2017.
The decrease in Industrial free cash flows of €152 million in 2017 as compared to 2016 primarily related to lower cash flows from continuing operations.
Board Report
Financial Overview
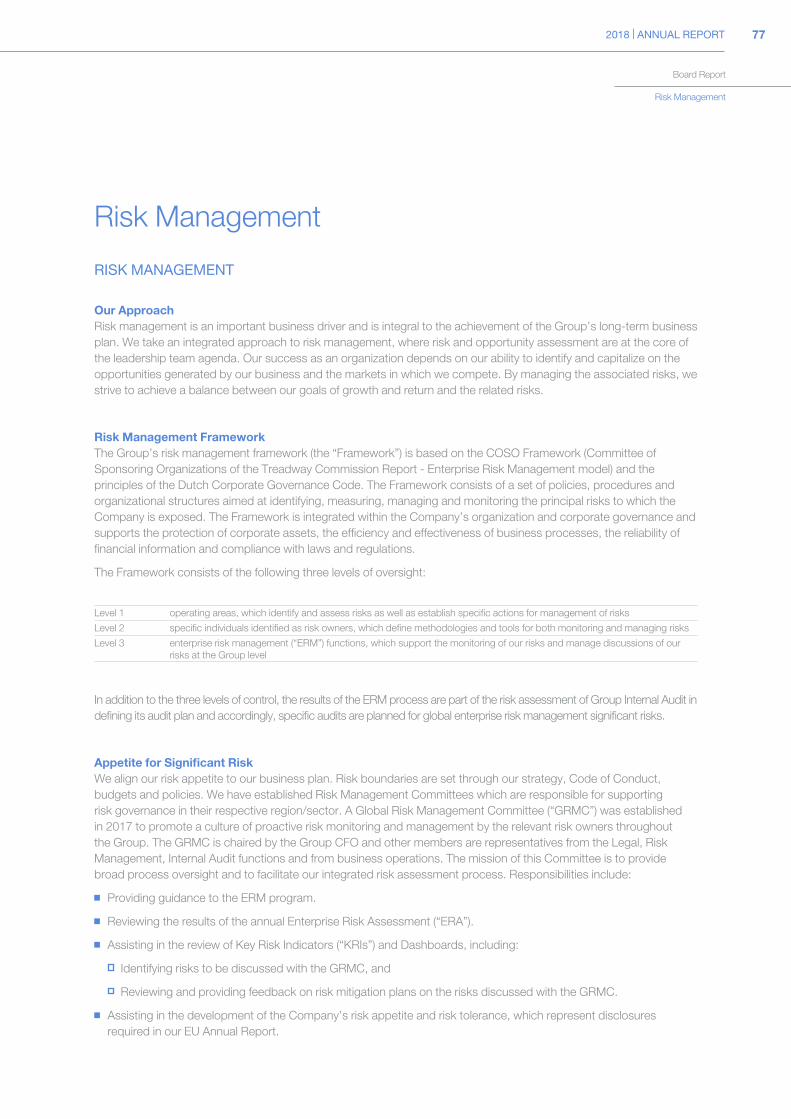
2018 | ANNUAL REPORT 77
Risk Management
RISK MANAGEMENT
Our ApproachRisk management is an important business driver and is integral to the achievement of the Group’s long-term business plan. We take an integrated approach to risk management, where risk and opportunity assessment are at the core of the leadership team agenda. Our success as an organization depends on our ability to identify and capitalize on the opportunities generated by our business and the markets in which we compete. By managing the associated risks, we strive to achieve a balance between our goals of growth and return and the related risks.
Risk Management FrameworkThe Group’s risk management framework (the “Framework”) is based on the COSO Framework (Committee of Sponsoring Organizations of the Treadway Commission Report - Enterprise Risk Management model) and the principles of the Dutch Corporate Governance Code. The Framework consists of a set of policies, procedures and organizational structures aimed at identifying, measuring, managing and monitoring the principal risks to which the Company is exposed. The Framework is integrated within the Company’s organization and corporate governance and supports the protection of corporate assets, the efficiency and effectiveness of business processes, the reliability of financial information and compliance with laws and regulations.
The Framework consists of the following three levels of oversight:
Level 1 operating areas, which identify and assess risks as well as establish specific actions for management of risks
Level 2 specific individuals identified as risk owners, which define methodologies and tools for both monitoring and managing risks
Level 3 enterprise risk management (“ERM”) functions, which support the monitoring of our risks and manage discussions of our risks at the Group level
In addition to the three levels of control, the results of the ERM process are part of the risk assessment of Group Internal Audit in defining its audit plan and accordingly, specific audits are planned for global enterprise risk management significant risks.
Appetite for Significant RiskWe align our risk appetite to our business plan. Risk boundaries are set through our strategy, Code of Conduct, budgets and policies. We have established Risk Management Committees which are responsible for supporting risk governance in their respective region/sector. A Global Risk Management Committee (“GRMC”) was established in 2017 to promote a culture of proactive risk monitoring and management by the relevant risk owners throughout the Group. The GRMC is chaired by the Group CFO and other members are representatives from the Legal, Risk Management, Internal Audit functions and from business operations. The mission of this Committee is to provide broad process oversight and to facilitate our integrated risk assessment process. Responsibilities include:
Providing guidance to the ERM program.
Reviewing the results of the annual Enterprise Risk Assessment (“ERA”).
Assisting in the review of Key Risk Indicators (“KRIs”) and Dashboards, including:
Identifying risks to be discussed with the GRMC, and
Reviewing and providing feedback on risk mitigation plans on the risks discussed with the GRMC.
Assisting in the development of the Company’s risk appetite and risk tolerance, which represent disclosures required in our EU Annual Report.
Board Report
Risk Management

78 2018 | ANNUAL REPORT
Board Report
Risk Management
Reviewing risk management disclosure in the EU Annual Report.
Reviewing the design of the Group’s risk management functions, including reporting lines of authority, communications and control functions to ensure they are appropriate.
In addition, we utilize the operational focus of our existing Product (Group and Regional) and Commercial Committees to support risk governance. The Product Committee oversees capital investment, engineering and product development, while the Commercial Committee oversees matters related to sales and marketing. Both committees include executive managers from each of the Companies’ brands, all of whom also have separate functional responsibilities across all the brands. Through our integrated approach our various committees support our Group Executive Council (“GEC”), CFO, CEO and Board of Directors (through the Audit Committee) with risk oversight. Our risk appetite differs by risk category as shown below.
Risk category Category description Risk appetite
Strategic Risk that may arise from the pursuit of FCA’s business plan, from strategic changes in the business environment, and/or from adverse strategic business decisions.
We are prepared to take risks in a responsible way that takes our stakeholders’ interests into account and are consistent with our business plan.
Operational Risk relating to internal processes, people and systems or external events (including legal and reputational risks).
We look to mitigate operational risks to the maximum extent based on cost/benefit considerations.
Financial Risk relating to uncertainty of return and the potential for financial loss due to financial performance.
We seek capital market and other transactions to strengthen our financial position while allowing us to finance our operations on a consolidated global basis.
Compliance Risk of non-compliance with relevant regulations and laws, internal policies and procedures.
We hold ourselves, as well as our employees, responsible for acting with honesty, integrity and respect, including complying with our Code of Conduct, applicable laws and regulations everywhere we do business.
Significant risks identified and control measures takenOn an annual basis, an enterprise risk assessment is performed, beginning with our operating segments. Risks identified to have high or medium-high levels of potential impact on our organization and to which we have a high or medium-high level of vulnerability based on the mitigating factors within our Group are considered significant risks. Results of the assessment are consolidated into a Group report for review and validation with the Global Risk Management Committee and Group CEO. In addition, risk dashboards are maintained for the most significant risks to the Group to support the monitoring of risk indicators along with the current and go-forward mitigation efforts. Once validated, results are discussed with the Audit Committee, assisting the Board of Directors in their responsibility for strategic oversight of risk management activities.
Each key global focus risk has been classified by risk categories and control measures and mitigating actions are subsequently defined for each identified risk. The risks, control measures and mitigating actions presented below are not all-inclusive. The sequence in which these risks and mitigating actions are presented does not reflect any order or importance, likelihood or materiality.
Risk Category Key Global Risk Description Control / Mitigating Actions
Compliance Regulatory Compliance
Our ability to manage the impact of regulatory compliance with vehicle fuel economy (“FE”), greenhouse gas (“GHG”) and zero emission vehicle (“ZEV”) requirements.
Group Product Committee (“GPC”) manages approval for investments in FE/ GHG/ZEV related compliance.
Central coordination and oversight of internal checks and conformity activities under senior management to promote consistency in approach and process across our operations.
CO2 compliance strategy communicated at the June 2018 Capital Markets Day outlined technologies and applications being pursued to improve fuel consumption and emissions.
The “Leave No Doubt” program encourages employees, contractors, suppliers and dealers to report any issue which may concern vehicle safety, emissions or regulatory compliance.

2018 | ANNUAL REPORT 79
Risk Category Key Global Risk Description Control / Mitigating Actions
Operational Product Quality and Customer Satisfaction
Our ability to produce vehicles to meet product quality standards, gain market acceptance and satisfy customer expectations.
Quality and customer satisfaction performance improvement metrics monitored at GEC and Product Committees meetings.
World Class Manufacturing (“WCM”) principles deployed throughout our manufacturing operations, foster a manufacturing culture that targets improved safety, quality and efficiency.
Operational Vehicle Cybersecurity
Our ability to protect our complex electronic control systems contained in our vehicles against a significant malfunction, disruption or security breach.
Cross-functional team of professionals focus on the cybersecurity of our vehicles through activities such as threat monitoring, design enhancements, and third-party penetration testing. Cybersecurity is considered throughout a vehicle’s life cycle including development, manufacturing and service.
Financial rewards offered for discovery and reporting of potential cybersecurity vulnerabilities through a crowdsourced bounty program.
Active engagement in the Automotive - Information Sharing and Analysis Center (“Auto-ISAC”). The Auto-ISAC enhances the industry’s ability to quickly learn of new threats and vulnerabilities and to work in a collaborative manner on threat triage.
Operational Interruption of Critical Supplies and Supplier Quality
Our ability to manage our critical supplies to ensure alignment with required expectations, needs and quality standards and prevent interruption resulting in production blockages.
Active monitoring of the financial health of suppliers to mitigate disruption due to financial distress of companies in our supply chain.
Monitoring political, environmental and economic events, globally, for to anticipate or identify events that could lead to supply chain disruption so that mitigating action can be taken.
Operational / Strategic
Talent Management - Attraction, Development & Retention of Critical Resources
Our ability to manage globally all aspects of Talent Management - including attraction, development and retention to facilitate internal benchmarking and improvement in order to meet current and future needs.
Convergence of key HR talent management processes, metrics, and reporting, along with adding global HR process oversight and governance, are planned in the 2019 - 2021 business cycle, including:• Implementation of a single, worldwide Learning Management System• Agreeing the plan to merge current regional HRIS systems into one
common Group level system• Further enhancement to standardization of retention/attrition metrics
and reporting, including global views by function with inclusion of internal and external benchmarks (initially introduced in mid-2018)
• Development of a consistent employer value proposition for use by each region in attracting talent
• Deployment of Regional best practice sharing and integration methodology
Strategic Technology Development and Product Launch
Our ability to develop and launch products with new technologies (e.g., electrification and propulsion, autonomous driving and connected vehicles) to meet regulatory requirements and customer expectations.
GEC and Product Committees’ reviews of product plans and commercialization strategies in order to define investment needs in the near and long-term.
Increased research focus on autonomous driving technology; collaborative efforts (e.g., Waymo) allow leveraging of capabilities and resources to achieve synergies and economies of scale needed to advance autonomous driving technologies.
Strategic Product Portfolio & Technology Strategies
Our ability to create a product portfolio that supports achievement of strategic objectives, including completeness of product range and technological content.
GEC and Product Committees’ reviews of product plans and commercialization strategies in order to define investment needs in the near and long-term.
Strategic Commercial Policies (Pricing)
Our ability to manage volume, price and market mix to ensure competitive pricing consistent with competitors’ achievements and internal targets.
Sales and marketing (including pricing) is monitored by the Commercial Committees.

80 2018 | ANNUAL REPORT
Board Report
Risk Management
Control measures and comprehensive mitigation actions listed above for key global risks were monitored throughout the year by the Risk Management Committees in our regions and business sectors to ensure that these are relevant and sufficient. As needed, control measures and mitigation actions are enhanced to ensure risks are appropriately addressed. We believe this approach allows us to address risk on a timely basis and ensure effectiveness of the control measures taken.
Current or planned improvements in the overall risk management systemWe continue to engage the business in key risk areas to benchmark our processes with peer companies and explore opportunities for improvement. Our goal in implementing these changes is to strengthen the identification of key risk indicators in order to monitor risks in a more predictive way and evaluate remediation plans and to promote efficient monitoring of risks throughout the Group. We will continue engaging the business in reviewing our management and monitoring activities for key risks throughout the Group in the upcoming year. As we continue to evolve our Group ERM program, we will strive to identify best practices, refine key risk indicators identified for the significant risks facing our organization and refine our processes to identify and escalate risk developments. In 2019, we plan to upgrade our current Governance, Risk management and Compliance tool, which includes implementing the ERM module for improved efficiency and risk monitoring and reporting.
Further information regarding the risks we face, the significant impact during the past financial year (if any), the consequences thereof and the expected impact on results or financial position, are described in Risk Factors below.

2018 | ANNUAL REPORT 81
RISK FACTORSWe face a variety of risks in our business. The risks and uncertainties described below are not the only ones facing us. Additional risks and uncertainties that we are unaware of or that we currently believe to be immaterial, may also become important factors that affect us.
Risks Related to Our Business, Strategy and Operations
If our vehicle shipment volumes deteriorate, particularly shipments of our pickup trucks and larger sport utility vehicles in the U.S. retail market, our results of operations and financial condition will suffer.As is typical for an automotive manufacturer, we have significant fixed costs and, therefore, changes in vehicle shipment volumes can have a disproportionately large effect on our profitability.
Further, our profitability in the U.S., Canada, Mexico and Caribbean islands (“NAFTA”), a region which contributed a majority of our profit in each of the last three years, is particularly dependent on demand for our pickup trucks and larger SUVs. For example, our pickup trucks and larger SUVs have historically been more profitable than other vehicles and accounted for approximately 68 percent of our total U.S. retail vehicle shipments in 2018. A shift in consumer demand away from these vehicles within the NAFTA region, and towards compact and mid-size passenger cars, whether in response to higher fuel prices or other factors, could adversely affect our profitability.
Our dependence within the NAFTA region on pickup trucks and larger SUVs remained high in 2018 as we continued implementation of our plan to reallocate more production capacity to these vehicle types after we ceased production in the region of compact and mid-size passenger cars in 2016. Our dependence on these vehicles is expected to continue given our 2018-2022 business plan’s focus on pickup trucks and SUVs in the NAFTA region. For additional information on factors affecting vehicle profitability, see GROUP OVERVIEW-Overview of Our Business and Trends, Uncertainties and Opportunities.
Moreover, we tend to operate with negative working capital as we generally receive payment for vehicles within a few days of shipment, whereas there is a lag between the time when parts and materials are received from suppliers and when we pay for such parts and materials; therefore, if our vehicle shipments decline materially we may suffer a significant negative impact on cash flow and liquidity as we continue to pay suppliers during a period in which we receive reduced proceeds from vehicle shipments. If vehicle shipments decline, or if they were to fall short of our assumptions, due to recessionary conditions, changes in consumer confidence, geopolitical events, inability to produce sufficient quantities of certain vehicles, limited access to financing or other factors, such decline or shortfall could have a material adverse effect on our business, financial condition and results of operations.
Our businesses are affected by global financial markets and general economic and other conditions over which we have little or no control.Our results of operations and financial position may be influenced by various macroeconomic factors within the various countries in which we operate including changes in gross domestic product, the level of consumer and business confidence, changes in interest rates for or availability of consumer and business credit, the rate of unemployment and foreign currency exchange rates.
In general, the automotive sector has historically been subject to highly cyclical demand and tends to reflect the overall performance of the economy, often amplifying the effects of economic trends. Given the difficulty in predicting the magnitude and duration of economic cycles, there can be no assurances as to future trends in the demand for our products in any of the markets in which we operate.
In addition to slow economic growth or recession, other economic circumstances, such as increases in energy prices, fuel prices and fluctuations in prices of raw materials or contractions in infrastructure spending, could have negative consequences for the industry in which we operate and, together with the other factors referred to previously, could have a material adverse effect on our business, financial condition and results of operations.
82 2018 | ANNUAL REPORT
Board Report
Risk Management
We are also subject to risks inherent to operating globally, including those related to:
exposure to local political conditions;
import and/or export restrictions;
multiple tax regimes, including regulations relating to transfer pricing and withholding and other taxes on remittances and other payments to or from subsidiaries;
compliance with applicable anti-corruption laws;
foreign investment and/or trade restrictions or requirements (including tariffs), foreign exchange controls and restrictions on the repatriation of funds; and
the introduction of more stringent laws and regulations.
We are particularly susceptible to these risks in the emerging markets where we operate, including Turkey, China, Brazil, Argentina, India and Russia. Unfavorable developments in any one or a combination of these risk areas (which may vary from country to country) could have a material adverse effect on our business, financial condition and results of operations.
For instance, on June 23, 2016, a majority of voters in a national referendum in the United Kingdom (“UK”) voted in favor of the UK leaving (“Brexit”) the European Union (the “EU”). On March 29, 2017, the UK government submitted an Article 50 notification pursuant to the Treaty of the European Union, triggering a two year negotiation period to determine the terms of the UK’s withdrawal from the EU and the UK’s future relationship with the EU. During this time, the government of the UK may revoke its notification to leave the EU or extend the Article 50 negotiation period. The referendum has created significant uncertainty about the future relationship between the UK and the EU. On November 14, 2018, the EU and UK government agreed the terms of a withdrawal agreement that must be ratified by the UK and the European Parliament ahead of the UK’s withdrawal on March 29, 2019. It remains unclear whether the withdrawal agreement, or any alternative agreement, will be finalized and ratified ahead of this deadline. In this case, and if the Article 50 negotiation period is not extended or the Article 50 notification revoked, there will be no transitional period and a “no-deal” Brexit will occur on March 29, 2019. The UK will then revert to trading on World Trade Organization rules.
Although we do not believe Brexit, including a no-deal Brexit, would have a direct material impact on our operations or materially impact our tax expense, a no-deal Brexit or the terms of the final withdrawal agreement may result in greater restrictions on imports and exports between the UK and EU countries, a fluctuation in currency exchange rates and additional regulatory complexity, which could have a material adverse effect on our business, financial condition and results of operations. Further, the UK referendum has given new impetus to independence movements in Scotland and Northern Ireland (and to a lesser extent, Wales) to remain in the EU by separating from the UK. It has also inspired certain political parties within other EU member states to consider withdrawal and raised the possibility of referendums on continued EU membership in other EU member states. Any of these events, along with any political, economic and regulatory changes that may occur, could have a material adverse effect on the Company’s business and results of operations in Europe.
Additionally, in recent years, certain member countries of the European Union have implemented austerity measures to avoid defaulting on debt repayments. If a country within the euro area was to default on its debt or withdraw from the euro currency, or, in a more extreme circumstance, the euro currency was to be dissolved entirely, the impact on markets around the world, and on the Company’s global business, could be immediate and significant.
New or revised agreements between the U.S. and its trading partners may also impact our business, in particular with respect to our production of vehicles outside the U.S. for import into the U.S., particularly from Canada, Mexico and Italy. Any new policies and any steps we may take to address such agreements could have a material adverse effect on our business, financial condition and results of operations.
There has been a recent and significant increase in activity and speculation regarding tariffs and duties between the U.S. and its trading partners. Tariffs or duties implemented between the U.S. and its trading partners could have a material adverse effect on our business, financial condition and results of operations. Tariffs or duties that directly impact our products could reduce consumer demand and/or make our products less profitable. In addition, a continued escalation in tariff or duty activity between the U.S. and its major trading partners could negatively impact global economic activity, which could in turn reduce demand for our products.

2018 | ANNUAL REPORT 83
In addition, we and other Brazilian taxpayers have recently had significant disputes with the Brazilian tax authorities regarding the application of Brazilian tax law. While we believe that it is more likely than not that there will be no significant impact from these disputes, given the current economic conditions and political uncertainty in Brazil, new tax laws may be introduced, changes to the application of existing tax laws may occur or the realization of accumulated tax benefits may be limited, delayed or denied, which could have a material adverse effect on our business, financial condition and results of operations.
We may be unsuccessful in efforts to increase the growth of some of our brands that we believe have global appeal and reach.The volume growth and margin expansion strategies reflected in our business plan include the renewal of key products, the launch of white space products, the implementation of various electrified powertrain applications and partnerships relating to the development of autonomous driving technologies.
These strategies have required and will continue to require significant investments in products, powertrains, production facilities and distribution networks. If we are unable to achieve our volume growth and margin expansion goals, we may be unable to earn a sufficient return on these investments which could have a material adverse effect on our business, financial condition and results of operations.
Our future performance depends on our ability to offer innovative, attractive products.Our success depends on, among other things, our ability to develop innovative, high-quality products that are attractive to consumers and provide adequate profitability.
We may not be able to effectively compete with other automakers with regard to electrification, autonomous driving, mobility and other emerging trends in the industry. In certain cases, the technologies that we plan to employ are not yet commercially practical and depend on significant future technological advances by us, our partners and by suppliers. There can be no assurance that these advances will occur in a timely or feasible manner, that the funds we have budgeted or expended for these purposes will be adequate, or that we will be able to obtain rights to use these technologies. Further, our competitors and others are pursuing similar technologies and other competing technologies, and there can be no assurance that they will not acquire and implement similar or superior technologies sooner than we will or on an exclusive basis or at a significant cost advantage.
In addition, as a result of the extended product development cycle and inherent difficulty in predicting consumer acceptance, a vehicle that we believe will be attractive may not generate sales in sufficient quantities and at high enough prices to be profitable. It generally takes two years or more to design and develop a new vehicle, and a number of factors may lengthen that schedule. For example, if we determine that a safety or emissions defect, a mechanical defect or a non-compliance with regulation exists with respect to a vehicle model prior to retail launch, the launch of such vehicle could be delayed until we remedy the defect or non-compliance. Various elements may also contribute to consumers’ acceptance of new vehicle designs, including competitors’ product introductions, fuel prices, general economic conditions and changes in styling preferences.
If we fail to develop products that contain desirable technologies and are attractive to and accepted by consumers, the residual value of our vehicles could be negatively impacted. In addition, the increasing pace of inclusion of new innovations and technologies in our and our competitors’ vehicles could also negatively impact the residual value of our vehicles. While we may not be impacted as significantly by declines in the residual value of our vehicles as compared to our competitors that own and operate U.S. captive finance companies, a deterioration in residual value could increase the cost that consumers pay to lease our vehicles or increase the amount of subvention payments that we make to support our leasing programs.
The failure to develop and offer innovative, attractive and relevant products on a timely basis that compare favorably to those of our principal competitors could have a material adverse effect on our business, financial condition and results of operations. Our high proportion of fixed costs, both due to our significant investment in property, plant and equipment as well as the requirements of our collective bargaining agreements and other applicable labor relations regulations, which limit our flexibility to adjust personnel costs to changes in demand for our products, may further exacerbate this risk.

84 2018 | ANNUAL REPORT
Board Report
Risk Management
Laws, regulations and governmental policies, including those regarding increased fuel efficiency requirements and reduced greenhouse gas and tailpipe emissions, have a significant effect on how we do business.As we seek to comply with government regulations, particularly those related to fuel efficiency, vehicle safety and greenhouse gas and tailpipe emissions standards, we must devote significant financial and management resources, as well as vehicle engineering and design attention, to these legal requirements. We expect the number and scope of these regulatory requirements, along with the costs associated with compliance, to increase significantly in the future, and these costs could be difficult to pass through to consumers. For a further discussion of the regulations we are subject to, see Environmental and Other Regulatory Matters.
In addition, fuel efficiency regulations have increased in several markets. For example, in September 2017, China’s Ministry of Industry and Information Technology released administrative rules regarding corporate average fuel consumption (“CAFC”) and new energy vehicle (“NEV”) credits that became effective in April 2018. Non-compliance with the CAFC target in these administrative rules can be offset through carry-forward CAFC credits, transfer of CAFC credits within affiliates, the OEMs use of its own NEV credits, or the purchase of NEV credits. Non-compliance with the NEV target can only be offset by the purchase of NEV credits. If we are unable to comply with the applicable targets and fail to offset a negative balance of credits, our sales or production of new passenger vehicles that fail to meet CAFC targets could be suspended. Although we continue to evaluate their specific impact, these regulations could materially adversely affect our business, financial condition and results of operations.
We are subject to diesel emissions investigations by several governmental agencies and to a number of related private lawsuits.On January 10, 2019, we announced that FCA US reached final settlements on civil, environmental and consumer claims with the U.S. Environmental Protection Agency (“EPA”), U.S. Department of Justice, the California Air Resources Board, the State of California, 49 other States and U.S. Customs and Border Protection, for which we have accrued €748 million, of which approximately €350 million will be paid in civil penalties to resolve differences over diesel emissions requirements. We also announced that FCA US had reached settlements in connection with a putative class action on behalf of consumers in connection with which FCA US agreed to pay an average of $2,800 per vehicle for each eligible customer affected by the recall.
We remain subject to diesel emissions-related investigations by the U.S. Securities and Exchange Commission and the U.S. Department of Justice, Criminal Division. In addition, we remain subject to a number of related private lawsuits and the potential for additional claims by consumers who choose not to participate in the class action settlement.
We have also received inquiries from other regulatory authorities in a number of jurisdictions as they examine the on-road tailpipe emissions of several automakers’ vehicles and, when jurisdictionally appropriate, we continue to cooperate with these governmental agencies and authorities.
In Europe, we have been working with the Italian Ministry of Transport (“MIT”) and the Dutch Vehicle Regulator (“RDW”), the authorities that certified FCA diesel vehicles for sale in the European Union, and the UK Driver and Vehicle Standards Agency (“DVSA”). We also initially responded to inquiries from the German authority, the Kraftfahrt-Bundesamt (“KBA”), regarding emissions test results for our vehicles, and we discussed the KBA reported test results, our emission control calibrations and the features of the vehicles in question. After these initial discussions, the MIT, which has sole authority for regulatory compliance of the vehicles it has certified, asserted its exclusive jurisdiction over the matters raised by the KBA, tested the vehicles, determined that the vehicles complied with applicable European regulations and informed the KBA of its determination. Thereafter, mediations have been held under European Commission (“EC”) rules, between the MIT and the German Ministry of Transport and Digital Infrastructure, which oversees the KBA, in an effort to resolve their differences. The mediation was concluded with no action being taken with respect to FCA. In May 2017, the EC announced its intention to open an infringement procedure against Italy regarding Italy’s alleged failure to respond to EC’s concerns regarding certain FCA emission control calibrations. The MIT has responded to the EC’s allegations by confirming that the vehicles’ approval process was correctly performed.

2018 | ANNUAL REPORT 85
In addition, at the request of the French Consumer Protection Agency, the Juge d’Instruction du Tribunal de Grande Instance of Paris is investigating diesel vehicles of a number of automakers including FCA, regarding whether the sale of those vehicles violated French consumer protection laws. In December 2018, the Korean Ministry of Environment announced its determination that 2,428 FCA vehicles imported in Korea during 2015, 2016 and 2017 were not emissions compliant and that the vehicles with a subsequent update of the emission control calibrations voluntarily performed by FCA, although compliant, would have required re-homologation of the vehicles concerned.
While we believe that we have made meaningful progress in resolving a significant portion of the emissions related investigations and litigation, the results of the unresolved inquiries and private litigation cannot be predicted at this time. Those inquiries and litigation may lead to further enforcement actions, penalties or damage awards, any of which may have a material adverse effect on our business, results of operations and reputation.
Our success largely depends on the ability of our management team to operate and manage effectively.Our success largely depends on the ability of our senior executives and other members of management to effectively manage the Group and individual areas of the business. Our management team is critical to the execution of our strategic direction and implementation of our business plan.
We have developed succession plans that we believe are appropriate, although it is difficult to predict with any certainty that we will be able to replace these individuals with persons of equivalent experience and capabilities. If we are unable to find adequate replacements or to attract, retain and incentivize senior executives, other key employees or new qualified personnel, such inability could have a material adverse effect on our business, financial condition and results of operations.
We may be subject to more intensive competition if other manufacturers pursue consolidations.We have for some time advocated for consolidation in the automotive industry due to our view that our industry is characterized by significant duplication in product development costs, much of which does not drive consumer-perceived value. We believe that sharing product development costs among manufacturers, preferably through consolidation, would enable automakers to improve their return on capital employed for product development and manufacturing and enhance utilization of tooling, machinery and equipment. While we continue to implement our business plan, and we believe that our business will continue to grow and our operating margins will continue to improve, if our competitors are able to successfully integrate with one another and we were not to enhance our own collaborations or adapt effectively to increased competition, our competitors’ integration could have a material adverse effect on our business, financial condition and results of operations.
Product recalls and warranty obligations may result in direct costs, and any resulting loss of vehicle sales could have material adverse effects on our business.We, and the U.S. automotive industry in general, have experienced a sustained increase in recall activity to address performance, compliance or safety-related issues. Our costs to recall vehicles have been significant and typically include the cost of replacement parts and labor to remove and replace parts. These costs substantially depend on the nature of the remedy and the number of vehicles affected, and may arise many years after a vehicle’s sale. Product recalls may also harm our reputation, force us to halt the sale of certain vehicles and cause consumers to question the safety or reliability of our products. Given the intense regulatory activity across the automotive industry, ongoing compliance costs are expected to remain high.
Any costs incurred, or lost vehicle sales, resulting from product recalls could materially adversely affect our financial condition and results of operations. Moreover, if we face consumer complaints, or we receive information from vehicle rating services that calls into question the safety or reliability of one of our vehicles and we do not issue a recall, or if we do not do so on a timely basis, our reputation may also be harmed and we may lose future vehicle sales. We are also obligated under the terms of our warranty agreements to make repairs or replace parts in our vehicles at our expense for a specified period of time. Therefore, any failure rate that exceeds our assumptions could have a material adverse effect on our business, financial condition and results of operations.

86 2018 | ANNUAL REPORT
Board Report
Risk Management
The automotive industry is highly competitive and cyclical and we may suffer from those factors more than some of our competitors.Substantially all of our revenues are generated in the automotive industry, which is highly competitive, encompassing the production and distribution of passenger cars, light commercial vehicles and components and production systems. We face competition from other international passenger car and light commercial vehicle manufacturers and distributors and components suppliers in Europe, North America, Latin America and the Asia Pacific region. These markets are all highly competitive in terms of product quality, innovation, the introduction of new technologies, pricing, fuel economy, reliability, safety, consumer service and financial services offered, and many of our competitors are better capitalized with larger market shares.
In the automotive business, sales to consumers are cyclical and subject to changes in the general condition of the economy, the readiness of consumers to buy and their ability to obtain financing, as well as the possible introduction of measures by governments to stimulate demand. The automotive industry is also subject to the constant renewal of product offerings through frequent launches of new models and the incorporation of new technologies in those models. A negative trend in the automotive industry or our inability to adapt effectively to external market conditions coupled with more limited capital than many of our principal competitors could have a material adverse effect on our business, financial condition and results of operations.
Additionally, global vehicle production capacity exceeds current demand. In the event that industry shipments decrease and overcapacity intensifies, our competitors may attempt to make their vehicles more attractive or less expensive to consumers by adding vehicle enhancements, providing subsidized financing or leasing programs, or by reducing vehicle prices whether directly or by offering option package discounts, price rebates or other sales incentives in certain markets. Manufacturers in countries that have lower production costs may also choose to export lower-cost automobiles to more established markets. An increase in these actions could have a material adverse effect on our business, financial condition and results of operations.
Our lack of a captive finance company in certain key markets could place us at a competitive disadvantage to other automakers that may be able to offer consumers and dealers financing and leasing on better terms than our consumers and dealers are able to obtain.Our dealers enter into wholesale financing arrangements to purchase vehicles from us to hold in inventory and facilitate retail sales, and retail consumers use a variety of finance and lease programs to acquire vehicles.
Unlike many of our competitors, we do not currently own and operate a controlled finance company dedicated solely to our mass-market vehicle operations in the U.S. and certain key markets in Europe, Asia and South America. Instead we have elected to partner with specialized financial services providers through joint ventures and commercial agreements. Our lack of a controlled finance company in these key markets may increase the risk that our dealers and retail consumers will not have access to sufficient financing on acceptable terms which may adversely affect our vehicle sales in the future. Furthermore, many of our competitors are better able to implement financing programs designed to maximize vehicle sales in a manner that optimizes profitability for them and their finance companies on an aggregate basis. Since our ability to compete depends on access to appropriate sources of financing for dealers and retail consumers, our lack of a controlled finance company in those markets could have a material adverse effect on our business, financial condition and results of operations.
In the event that we establish a captive financial services company in the U.S., we will be subject to the risks inherent in such businesses, including reliance on public debt markets to provide the capital necessary to support our financing programs, underwriting risk, default risk, compliance with laws and regulations related to consumer lending and competition with other consumer finance companies and third-party financial institutions.

2018 | ANNUAL REPORT 87
In other markets, we rely on controlled finance companies, joint ventures and commercial relationships with third parties, including third party financial institutions, to provide financing to our dealers and retail consumers. The ability of a finance company to provide financing services at competitive rates is subject to various factors, including:
the performance of loans and leases in their portfolio, which could be materially affected by delinquencies, defaults or prepayments;
wholesale auction values of used vehicles;
higher than expected vehicle return rates and the residual value performance of vehicles they lease; and
fluctuations in interest rates and currency exchange rates.
Any financial services provider, including our joint ventures and controlled finance companies, will also face other demands on its capital, including the need or desire to satisfy funding requirements for dealers or consumers of our competitors as well as liquidity issues relating to other investments. Furthermore, they may be subject to regulatory changes that may increase their costs, which may impair their ability to provide competitive financing products to our dealers and retail consumers.
To the extent that a financial services provider is unable or unwilling to provide sufficient financing at competitive rates to our dealers and retail consumers, such dealers and retail consumers may not have sufficient access to financing to purchase or lease our vehicles. As a result, our vehicle sales and market share may suffer, which could have a material adverse effect on our business, financial condition and results of operations.
Vehicle retail sales depend heavily on affordable interest rates for vehicle financing.In certain regions, including NAFTA, financing for new vehicle sales has been available at relatively low interest rates for several years due to, among other things, expansive government monetary policies. As interest rates rise, generally market rates for new vehicle financing are expected to rise as well, which may make our vehicles less affordable to retail consumers or steer consumers to less expensive vehicles that tend to be less profitable for us, adversely affecting our financial condition and results of operations. Additionally, if consumer interest rates increase substantially or if financial service providers tighten lending standards or restrict their lending to certain classes of credit, consumers may not desire to or be able to obtain financing to purchase or lease our vehicles. Furthermore, because purchasers of our vehicles may be relatively more sensitive to changes in the availability and adequacy of financing and macroeconomic conditions, our vehicle sales may be disproportionately affected by changes in financing conditions relative to the vehicle sales of our competitors. As a result, a substantial increase in consumer interest rates or tightening of lending standards could have a material adverse effect on our business, financial condition and results of operations.
Our business operations and reputation may be impacted by various types of claims, lawsuits, and other contingencies.We are involved in various disputes, claims, lawsuits, investigations and other legal proceedings relating to several matters, including product liability, warranty, vehicle safety, emissions and fuel economy, product performance, asbestos, personal injury, dealers, suppliers and other contractual relationships, environment, securities law, labor, antitrust, intellectual property, tax and other matters. We estimate such potential claims and contingent liabilities and, where appropriate, record provisions to address these contingent liabilities. The ultimate outcome of the legal proceedings pending against us is uncertain, and such proceedings could have a material adverse effect on our financial condition or results of operations. Furthermore, additional facts may come to light or we could, in the future, be subject to judgments or enter into settlements of lawsuits and claims that could have a material adverse effect on our business, financial condition and results of operations. While we maintain insurance coverage with respect to certain claims, not all claims or potential losses can be covered by insurance, and even if claims could be covered by insurance, we may not be able to obtain such insurance on acceptable terms in the future, if at all, and any such insurance may not provide adequate coverage against any such claims. See also Note 20, Provisions, and Note 25, Guarantees granted, commitments and contingent liabilities, within the Consolidated Financial Statements included elsewhere in this report for additional information. Further, publicity regarding such investigations and lawsuits, whether or not they have merit, may adversely affect our reputation and the perception of our vehicles with retail customers, which may adversely affect demand for our vehicles, and have a material adverse effect on our business, financial condition and results of operations. For additional risks regarding certain proceedings, see “We are subject to diesel emissions investigations by several governmental agencies and to a number of related private lawsuits.”

88 2018 | ANNUAL REPORT
Board Report
Risk Management
A significant security breach compromising the electronic control systems contained in our vehicles could damage our reputation, disrupt our business and adversely impact our ability to compete.Our vehicles, as well as vehicles manufactured by other original equipment manufacturers (or “OEMs”), contain complex systems that control various vehicle processes including engine, transmission, safety, steering, brakes, window and door lock functions. These electronic control systems, which are increasingly connected to external cloud-based systems, are susceptible to cybercrime, including threats of intentional disruption and theft of personal information. These threats are also likely to increase in terms of sophistication and frequency as the level of connectivity and autonomy in our vehicles increases. A significant malfunction, disruption or security breach compromising the electronic control systems contained in our vehicles could damage our reputation, expose us to significant liability and could have a material adverse effect on our business, financial condition and results of operations.
A significant malfunction, disruption or security breach compromising the operation of our information technology systems could damage our reputation, disrupt our business and adversely impact our ability to compete.Our ability to keep our business operating effectively depends on the functional and efficient operation of our information, data processing and telecommunications systems, including our vehicle design, manufacturing, inventory tracking and billing and payment systems. In addition, our vehicles are increasingly connected to external cloud-based systems. These systems are regularly the target of threats from third parties. A significant or large-scale malfunction or interruption of any one of our computer or data processing systems, including through the exploitation of a weakness in our systems or the systems of our vendors, could have a material adverse effect on our ability to manage and keep our manufacturing and other operations running effectively, and damage our reputation. A malfunction or security breach that results in a wide or sustained disruption to our business could have a material adverse effect on our business, financial condition and results of operations.
In addition to supporting our operations, we use our systems to collect and store confidential and sensitive data, including information about our business, our consumers and our employees. As our technology continues to evolve, we anticipate that we will collect and store even more data in the future and that our systems will increasingly use remote communication features that are sensitive to both willful and unintentional security breaches. Much of our value is derived from our confidential business information, including vehicle design, proprietary technology and trade secrets, and to the extent the confidentiality of such information is compromised, we may lose our competitive advantage and our vehicle shipments may suffer. We also collect, retain and use personal information, including data we gather from consumers for product development and marketing purposes, and data we obtain from employees. In the event of a breach in security that allows third parties access to this personal information, we are subject to a variety of ever-changing laws on a global basis that require us to provide notification to the data owners, and that subject us to lawsuits, fines and other means of regulatory enforcement. For example, the General Data Protection Regulation (Regulation (EU) 2016/679) (the “GDPR”), which took full effect in May 2018, has increased the stringency of European Union data protection requirements and related penalties. Non-compliance with the GDPR can result in fines of the higher of €20 million or 4% of annual worldwide revenue. The requirements of the GDPR have necessitated changes to our existing business practices and systems in order to comply with the GDPR or to address the concerns of our customers or business partners. Complying with any new data protection-related regulatory requirements could force us to incur substantial expenses or require us to change our business practices in a manner that has a material adverse effect on our business, financial condition and results of operations.
Our reputation could also suffer in the event of a data breach, which could cause consumers to purchase their vehicles from our competitors. Ultimately, any significant compromise in the integrity of our data security could have a material adverse effect on our business, financial condition and results of operations.
There can be no assurance that we will be able to offset the earnings power lost from the expected sale of Magneti Marelli.On October 22, 2018, we announced that we have entered into a definitive agreement with CK Holdings, Ltd., a holding company of Calsonic Kansei Corporation, pursuant to which CK Holdings, Ltd. will acquire our automotive components business, Magneti Marelli. The agreement represents a transaction value of €6.2 billion, subject to certain adjustments. This transaction is expected to close in the second quarter of 2019, subject to regulatory approvals and other customary closing conditions and, subject to Board of Directors approval, will enable the payment of an extraordinary dividend of €2 billion at closing.

2018 | ANNUAL REPORT 89
If the improvement in our capital position resulting from the sale of Magneti Marelli is not sufficient to offset the related loss of revenue and earnings, we could experience a material adverse effect on our business, financial condition and results of operations.
We may not be able to adequately protect our intellectual property rights, which may harm our business.Our success depends, in part, on our ability to protect our intellectual property rights. If we fail to protect our intellectual property rights, others may be able to compete against us using intellectual property that is the same as or similar to our own. In addition, there can be no guarantee that our intellectual property rights are sufficient to provide us with a competitive advantage against others who offer products similar to ours. Despite our efforts, we may be unable to prevent third parties from infringing our intellectual property and using our technology for their competitive advantage. Any such infringement could have a material adverse effect on our business, financial condition and results of operations.
The laws of some countries in which we operate do not offer the same protection of our intellectual property rights as do the laws of the U.S. or Europe. In addition, effective intellectual property enforcement may be unavailable or limited in certain countries, making it difficult for us to protect our intellectual property from misuse or infringement there. Our inability to protect our intellectual property rights in some countries could have a material adverse effect on our business, financial condition and results of operations.
Our reliance on joint arrangements in certain emerging markets may adversely affect the development of our business in those regions.We intend to expand our presence in emerging markets, including China and India, through partnerships and joint ventures. For instance the GAC FCA JV locally produces the Jeep Cherokee, Jeep Renegade, Jeep Compass and all-new Jeep Grand Commander for the Chinese market, expanding the portfolio of Jeep SUVs currently available to Chinese consumers. We also have a joint operation with TATA Motors Limited for the production of certain of our vehicles, engines and transmissions in India.
Our reliance on joint arrangements to enter or expand our presence in these markets may expose us to risk of conflict with our joint arrangement partners and the need to divert management resources to oversee these arrangements. Further, as these arrangements require cooperation with third party partners, these joint arrangements may not be able to make decisions as quickly as we would if we were operating on our own or may take actions that are different from what we would do on a standalone basis in light of the need to consider our partners’ interests. As a result, we may be less able to respond timely to changes in market dynamics, which could have a material adverse effect on our business, financial condition and results of operations.
We face risks associated with increases in costs, disruptions of supply or shortages of raw materials, parts, components and systems used in our vehicles.We use a variety of raw materials in our business including steel, aluminum, lead, resin and copper, and precious metals such as platinum, palladium and rhodium, as well as energy. As we begin to implement various electrified powertrain applications throughout our portfolio in accordance with our business plan, we will also depend on a significant supply of lithium, nickel and cobalt. The prices for these raw materials fluctuate, and market conditions can affect our ability to manage our Cost of revenues over the short term. We may not be successful in managing our exposure to these risks. Substantial increases in the prices for raw materials would increase our operating costs and could reduce profitability if the increased costs cannot be offset by changes in vehicle prices or countered by productivity gains. In particular, certain raw materials are sourced from a limited number of suppliers and from a limited number of countries. We cannot guarantee that we will be able to maintain arrangements with these suppliers that assure access to these raw materials, and in some cases this access may be affected by factors, including government policy, that are outside of our control and the control of our suppliers. For instance, natural or man-made disasters or civil unrest may have severe and unpredictable effects on the price and availability of certain raw materials in the future.

90 2018 | ANNUAL REPORT
Board Report
Risk Management
As with raw materials, we are also at risk for supply disruption and shortages in parts and components for use in our vehicles for many reasons including, but not limited to, supplier disputes, particularly with regard to warranty recovery claims, supplier financial distress, tight credit markets, trade restrictions, tariffs, natural or man-made disasters, or production difficulties. We will continue to work with suppliers to monitor potential disruptions and shortages and to mitigate the effects of any emerging shortages on our production volumes and revenues. However, there can be no assurances that these events will not have an adverse effect on our production in the future, and any such effect may be material. Further, there can be no assurance that trade restrictions and tariffs will not be imposed, and if imposed, tariffs and other trade restrictions may make the cost of required raw materials more expensive or delay or limit our access to these raw materials, each of which could have a material adverse effect on our business, financial condition and results of operations.
Any interruption in the supply or any increase in the cost of raw materials, parts, components and systems could negatively impact our ability to achieve our vehicle shipment objectives and profitability. The potential impact of an interruption is particularly high in instances where a part or component is sourced exclusively from a single supplier. Long-term interruptions in supply of raw materials, parts, components and systems may result in a material impact on vehicle production, vehicle shipment objectives, and profitability. Cost increases which cannot be recouped through increases in vehicle prices, or countered by productivity gains, could have a material adverse effect on our business, financial condition and results of operations.
Labor laws and collective bargaining agreements with our labor unions could impact our ability to increase the efficiency of our operations.Substantially all of our production employees are represented by trade unions, are covered by collective bargaining agreements and/or are protected by applicable labor relations regulations that may restrict our ability to modify operations and reduce costs quickly in response to changes in market conditions. See Overview of Our Business - Employees for a description of these arrangements, including the four-year national collective bargaining agreement between FCA US and the UAW which will expire in September 2019. These and other provisions in our collective bargaining agreements may impede our ability to restructure our business successfully to compete more effectively, especially with those automakers whose employees are not represented by trade unions or are subject to less stringent regulations, which could have a material adverse effect on our business, financial condition and results of operations.
We are subject to risks associated with exchange rate fluctuations, interest rate changes, credit risk and other market risks.We operate in numerous markets worldwide and are exposed to market risks stemming from fluctuations in currency and interest rates. The exposure to currency risk is mainly linked to the differences in geographic distribution of our manufacturing activities and commercial activities, resulting in cash flows from sales being denominated in currencies different from those connected to purchases or production activities. Additionally, a significant portion of our operating cash flow is generated in U.S. Dollars and, although we have significant U.S. Dollar-denominated debt, the majority of our indebtedness is denominated in Euro and Brazilian Real.
We use various forms of financing to cover funding requirements for our industrial activities and for providing financing to our dealers and consumers. Moreover, liquidity for industrial activities is also principally invested in variable-rate or short-term financial instruments. Our financial services businesses normally operate a matching policy to offset the impact of differences in rates of interest on the financed portfolio and related liabilities. Nevertheless, changes in interest rates can affect our Net revenues, finance costs and margins.
In addition, although we manage risks associated with fluctuations in currency and interest rates through financial hedging instruments, fluctuations in currency or interest rates could have a material adverse effect on our business, financial condition and results of operations.
Our financial services activities are also subject to the risk of insolvency of dealers and retail consumers, as well as unfavorable economic conditions in markets where these activities are carried out. Despite our efforts to mitigate such risks through the credit approval policies applied to dealers and retail consumers, there can be no assurances that we will be able to successfully mitigate such risks, particularly with respect to a general change in economic conditions.

2018 | ANNUAL REPORT 91
We are a Dutch public company with limited liability, and our shareholders may have rights different from those of shareholders of companies organized in the U.S.The rights of our shareholders may be different from the rights of shareholders governed by the laws of U.S. jurisdictions. We are a Dutch public company with limited liability (naamloze vennootschap). Our corporate affairs are governed by our articles of association and by the laws governing companies incorporated in the Netherlands. The rights of shareholders and the responsibilities of members of our board of directors may be different from the rights of shareholders and the responsibilities of members of our board of directors in companies governed by the laws of other jurisdictions including the U.S. In the performance of its duties, our board of directors is required by Dutch law to consider our interests and the interests of our shareholders, our employees and other stakeholders, in all cases with due observation of the principles of reasonableness and fairness. It is possible that some of these parties will have interests that are different from, or in addition to, your interests as a shareholder.
It may be difficult to enforce U.S. judgments against us.We are incorporated under the laws of the Netherlands, and a substantial portion of our assets are outside of the U.S. Most of our directors and senior management and our independent auditors are resident outside the U.S., and all or a substantial portion of their respective assets may be located outside the U.S. As a result, it may be difficult for U.S. investors to effect service of process within the U.S. upon these persons. It may also be difficult for U.S. investors to enforce within the U.S. judgments predicated upon the civil liability provisions of the securities laws of the U.S. or any state thereof. In addition, there is uncertainty as to whether the courts outside the U.S. would recognize or enforce judgments of U.S. courts obtained against us or our directors and officers predicated upon the civil liability provisions of the securities laws of the U.S. or any state thereof. Therefore, it may be difficult to enforce U.S. judgments against us, our directors and officers and our independent auditors.
We operate so as to be treated as exclusively resident in the UK for tax purposes, but the relevant tax authorities may treat us as also being tax resident elsewhere.We are not a company incorporated in the UK. Therefore, whether we are resident in the UK for tax purposes depends on whether our “central management and control” is located (in whole or in part) in the UK. The test of “central management and control” is largely a question of fact and degree based on all the circumstances, rather than a question of law. Nevertheless, the decisions of the UK courts and the published practice of Her Majesty’s Revenue & Customs (“HMRC”), suggest that we, a group holding company, are likely to be regarded as having become UK-resident on this basis from incorporation and remaining so if, as we intend, (i) at least half of the meetings of our Board of Directors are held in the UK with a majority of directors present in the UK for those meetings; (ii) at those meetings there are full discussions of, and decisions are made regarding, the key strategic issues affecting us and our subsidiaries; (iii) those meetings are properly minuted; (iv) at least some of our directors, together with supporting staff, are based in the UK; and (v) we have permanent staffed office premises in the UK.
Although it has been accepted by HMRC that our “central management and control” is in the UK, we would nevertheless not be treated as UK-resident if (a) we were concurrently resident in another jurisdiction (applying the tax residence rules of that jurisdiction) that has a double tax treaty with the UK and (b) there were a tie-breaker provision in that tax treaty which allocated exclusive residence to that other jurisdiction.
Our residence for Italian tax purposes is largely a question of fact based on all circumstances. We set up and we have thus far maintained, and intend to continue to maintain, our management and organizational structure in such a manner that we should not be regarded as an Italian tax resident either for Italian domestic law purposes or for the purposes of the Italy-UK tax treaty and should be deemed resident in the UK from our incorporation for the purposes of the Italy-UK tax treaty. Because this analysis is highly factual and may depend on future changes in our management and organizational structure, there can be no assurance regarding the final determination of our tax residence. Should we be treated as an Italian tax resident, we would be subject to taxation in Italy on our worldwide income and may be required to comply with withholding tax and/or reporting obligations provided under Italian tax law, which could result in additional costs and expenses.

92 2018 | ANNUAL REPORT
Board Report
Risk Management
Although it has been accepted that our “central management and control” is in the UK, we are considered to be resident in the Netherlands for Dutch corporate income tax and Dutch dividend withholding tax purposes on the basis that we are incorporated there. Nonetheless, we can be regarded as solely resident in either the UK or the Netherlands under the Netherlands-UK tax treaty if the UK and Dutch competent authorities agree that this is the case. We have received a ruling from the UK and Dutch competent authorities that we should be treated as resident solely in the UK for the purposes of the treaty. If there is a change over time to the facts upon which this ruling issued by the competent authorities is based, the ruling may be withdrawn or cease to apply.
We do not expect a UK exit from the European Union resulting from the referendum held in June 2016 to affect our tax residency in the UK; however, we are unable to predict with certainty whether the discussions to implement the UK’s exit from the European Union will ultimately have any impact on this matter.
If we are deemed to not maintain a permanent establishment in Italy, we could experience a material increase in our tax liability.Whether we have maintained a permanent establishment in Italy following the Merger (an “Italian P.E.”) is largely a question of fact based on all the circumstances. We believe that, on the understanding that we should be a UK-resident company under the Italy-UK tax treaty, we are likely to be treated as maintaining an Italian P.E. because we have maintained and intend to continue to maintain sufficient employees, facilities and activities in Italy to qualify as maintaining an Italian P.E. Should this be the case (i) the embedded gains on our assets connected with the Italian P.E. cannot be taxed as a result of the Merger; (ii) our tax-deferred equity reserves cannot be taxed, inasmuch as they have been recorded in the Italian P.E.’s financial accounts; and (iii) the Italian fiscal unit that was headed by Fiat before the Merger (the “Fiscal Unit”), continues with respect to our Italian subsidiaries whose shareholdings are part of the Italian P.E.’s net worth.
FCA filed a ruling request with the Italian tax authorities in respect of the continuation of the Fiscal Unit via the Italian P.E. on April 16, 2014. The Italian tax authorities issued the ruling on December 10, 2014 (the “2014 Ruling”), confirming that the Fiscal Unit may continue via the Italian P.E. Moreover, in another ruling issued on October 9, 2015 (the “2015 Ruling”), the Italian tax authorities confirmed that the separation of Ferrari from the Group (including the first demerger of certain assets held through the Italian P.E.) would qualify as a tax-free, neutral transaction from an Italian income tax perspective. Lastly, in a ruling released on October 28, 2016, the Italian tax authorities confirmed that the Italian P.E. could determine its computation base for the purposes of the Italian regime on notional interest deduction (Aiuto alla Crescita Economica) without taking into account certain anti-avoidance provisions (the “2016 Ruling”, and together with the 2014 Ruling and the 2015 Ruling, the “Rulings”). However, the Rulings are not assessments of certain sets of facts and circumstances. Therefore, even though the 2014 Ruling confirms that the Fiscal Unit may continue via the Italian P.E. and the 2015 Ruling and the 2016 Ruling assume such a P.E. to exist, this does not rule out that the Italian tax authorities may in the future verify whether FCA actually has a P.E. in Italy and potentially challenge the existence of such a P.E. Because the analysis is highly factual, there can be no assurance regarding our maintenance of an Italian P.E. following the Merger.
Risks Related to Our Liquidity and Existing Indebtedness
Limitations on our liquidity and access to funding may limit our ability to execute our business strategies and improve our financial condition and results of operations.Our performance depends on, among other things, our ability to finance debt repayment obligations and planned investments from operating cash flow, available liquidity, the renewal or refinancing of existing bank loans and/or facilities and possible access to capital markets or other sources of financing. Although we have measures in place that are designed to ensure adequate liquidity levels, our liquidity is subject to significant potential absorption if our vehicle shipments decline materially as we operate with negative working capital. For a discussion of these factors, see FINANCIAL OVERVIEW-Liquidity and Capital Resources. In addition, the majority of our credit ratings are below investment grade and any deterioration may significantly affect our funding and prospects.

2018 | ANNUAL REPORT 93
We could, therefore, find ourselves in the position of having to seek additional financing and/or having to refinance existing debt, including in unfavorable market conditions, with limited availability of funding and a general increase in funding costs. Any limitations on our liquidity, due to a decrease in vehicle shipments, the amount of or restrictions in our existing indebtedness, conditions in the credit markets, general economic conditions or otherwise, may adversely impact our ability to execute our business strategies and impair our financial condition and results of operations. In addition, any actual or perceived limitations of our liquidity may limit the ability or willingness of counterparties, including dealers, consumers, suppliers, lenders and financial service providers, to do business with us, which could have a material adverse effect on our business, financial condition and results of operations.
We have significant outstanding indebtedness, which may limit our ability to obtain additional funding on competitive terms and limit our financial and operating flexibility.Although we have substantially completed the de-leveraging of our balance sheet this year, the extent of our indebtedness may still have important consequences on our operations and financial results, including:
we may not be able to secure additional funds for working capital, capital expenditures, debt service requirements or general corporate purposes;
we may need to use a portion of our projected future cash flow from operations to pay principal and interest on our indebtedness, which may reduce the amount of funds available to us for other purposes, including product development;
we are more financially leveraged than our competitors, which may put us at a competitive disadvantage; and
we may not be able to adjust rapidly to changing market conditions, which may make us more vulnerable to a downturn in general economic conditions or our business.
These risks may be exacerbated by volatility in the financial markets, particularly those resulting from perceived strains on the finances and creditworthiness of several governments and financial institutions.
Restrictive covenants in our debt agreements could limit our financial and operating flexibility.The indentures governing certain of our outstanding public indebtedness, and other credit agreements to which companies in the Group are a party, contain covenants that restrict the ability of certain companies in the Group to, among other things:
incur additional debt;
make certain investments;
sell certain assets or merge with or into other companies;
use assets as security in other transactions; and
enter into sale and leaseback transactions.
For more information regarding our credit facilities and debt, see FINANCIAL OVERVIEW-Liquidity and Capital Resources.
We may be exposed to shortfalls in our pension plans.Certain of our defined benefit pension plans are currently underfunded. As of December 31, 2018, our defined benefit pension plans were underfunded by approximately €4.0 billion and may be subject to significant minimum contributions in future years. Our pension funding obligations may increase significantly if the investment performance of plan assets does not keep pace with benefit payment obligations. Mandatory funding obligations may increase because of lower than anticipated returns on plan assets, whether as a result of overall weak market performance or particular investment decisions, changes in the level of interest rates used to determine required funding levels, changes in the level of benefits provided for by the plans, or any changes in applicable law related to funding requirements. Our defined benefit plans currently hold significant investments in equity and fixed income securities, as well as investments in less liquid instruments such as private equity, real estate and certain hedge funds. Due to the complexity and magnitude of certain investments, additional risks may exist, including the effects of significant changes in investment policy, insufficient market capacity to complete a particular investment strategy and an inherent divergence in objectives between the ability to manage risk in the short term and the ability to quickly re-balance illiquid and long-term investments.

94 2018 | ANNUAL REPORT
Board Report
Risk Management
To determine the appropriate level of funding and contributions to our defined benefit plans, as well as the investment strategy for the plans, we are required to make various assumptions, including an expected rate of return on plan assets and a discount rate used to measure the obligations under defined benefit pension plans. Interest rate increases generally will result in a decline in the value of investments in fixed income securities and the present value of the obligations. Conversely, interest rate decreases will generally increase the value of investments in fixed income securities and the present value of the obligations. See Note 2, Basis of preparation-Significant accounting policies —Employee benefits within the Consolidated Financial Statements included elsewhere in this report.
Any reduction in the discount rate or the value of plan assets, or any increase in the present value of obligations, may increase our pension expenses and required contributions and, as a result, could constrain liquidity and materially adversely affect our financial condition and results of operations. If we fail to make required minimum funding contributions, we could be subject to reportable event disclosure to the U.S. Pension Benefit Guaranty Corporation, as well as interest and excise taxes calculated based upon the amount of any funding deficiency.
Risks Related to our Common Shares
Our maintenance of two exchange listings may adversely affect liquidity in the market for our common shares and could result in pricing differentials of our common shares between the two exchanges.Our common shares are listed and traded on both the New York Stock Exchange and the Mercato Telematico Azionario operated by Borsa Italiana. The dual listing of our common shares may split trading between the two markets and may result in limited trading liquidity of the shares in one or both markets, which may adversely affect the development of an active trading market for our common shares on either or both exchanges and may result in price differentials between the exchanges. Differences in the trading schedules, as well as volatility in the exchange rate of the two trading currencies, among other factors, may result in different trading prices for our common shares on the two exchanges, which may contribute to volatility in the trading of our shares.
The loyalty voting structure may affect the liquidity of our common shares and reduce our common share price.Our loyalty voting structure may limit the liquidity of our common shares and adversely affect the trading prices of our common shares. The loyalty voting structure is intended to reward shareholders for maintaining long-term share ownership by granting initial shareholders and persons holding our common shares continuously for at least three years at any time following the effectiveness of the Merger the option to elect to receive our special voting shares. Our special voting shares cannot be traded and, immediately prior to the deregistration of common shares from the FCA Loyalty Register, any corresponding special voting shares shall be transferred to us for no consideration (om niet). This loyalty voting structure is designed to encourage a stable shareholder base and, conversely, it may deter trading by those shareholders who are interested in gaining or retaining our special voting shares. Therefore, the loyalty voting structure may reduce liquidity in our common shares and adversely affect their trading price.
The loyalty voting structure may make it more difficult for shareholders to acquire a controlling interest, change our management or strategy or otherwise exercise influence over us, and the market price of our common shares may be lower as a result.The provisions of our articles of association which establish the loyalty voting structure may make it more difficult for a third party to acquire, or attempt to acquire, control of our company, even if a change of control were considered favorably by shareholders holding a majority of our common shares. As a result of the loyalty voting structure, a relatively large proportion of our voting power could be concentrated in a relatively small number of shareholders who would have significant influence over us. As of February 20, 2019, Exor N.V., which controls FCA, owns 28.98 percent of the FCA common shares, had a voting interest in FCA of 42.11 percent due to its participation in the loyalty voting structure and as a result will have the ability to exercise significant influence on matters involving our shareholders. Such shareholders participating in the loyalty voting structure could effectively prevent change of control transactions that may otherwise benefit our shareholders. The loyalty voting structure may also prevent or discourage shareholders’ initiatives aimed at changing our management or strategy or otherwise exerting influence over us.

2018 | ANNUAL REPORT 95
There may be potential Passive Foreign Investment Company tax considerations for U.S. Shareholders.Shares of our stock held by a U.S. holder would be stock of a passive foreign investment company (“PFIC”) for U.S. federal income tax purposes with respect to a U.S. shareholder if for any taxable year in which such U.S. shareholder held our common shares, after the application of applicable look-through rules (i) 75 percent or more of our gross income for the taxable year consists of passive income (including dividends, interest, gains from the sale or exchange of investment property and rents and royalties other than rents and royalties which are received from unrelated parties in connection with the active conduct of a trade or business, as defined in applicable Treasury Regulations), or (ii) at least 50 percent of its assets for the taxable year (averaged over the year and determined based upon value) produce or are held for the production of passive income. U.S. persons who own shares of a PFIC are subject to a disadvantageous U.S. federal income tax regime with respect to the income derived by the PFIC, the dividends they receive from the PFIC, and the gain, if any, they derive from the sale or other disposition of their shares in the PFIC.
While we believe that shares of our stock are not stock of a PFIC for U.S. federal income tax purposes, this conclusion is based on a factual determination made annually and thus is subject to change. Moreover, shares of our stock may become stock of a PFIC in future taxable years if there were to be changes in our assets, income or operations.
Tax consequences of our loyalty voting structure are uncertain.No statutory, judicial or administrative authority directly discusses how the receipt, ownership, or disposition of special voting shares should be treated for Italian, UK or U.S. tax purposes and as a result, the tax consequences in those jurisdictions are uncertain.
The fair market value of our special voting shares, which may be relevant to the tax consequences, is a factual determination and is not governed by any guidance that directly addresses such a situation. Because, among other things, the special voting shares are not transferable (other than, in very limited circumstances, together with our associated common shares) and a shareholder will receive amounts in respect of the special voting shares only if we are liquidated, we believe and intend to take the position that the fair market value of each special voting share is minimal. However, the relevant tax authorities could assert that the value of the special voting shares as determined by us is incorrect.
The tax treatment of the loyalty voting structure is unclear and shareholders are urged to consult their tax advisors in respect of the consequences of acquiring, owning and disposing of special voting shares.
Tax may be required to be withheld from dividend payments.Although the UK and Dutch competent authorities have ruled that we should be treated as solely resident in the UK for the purposes of the Netherlands-UK double tax treaty, under Dutch domestic law dividend payments made by us to Dutch residents are still subject to Dutch dividend withholding tax and we would have no obligation to pay additional amounts in respect of such payments.
Should Dutch or Italian withholding taxes be imposed on future dividends or distributions with respect to our common shares, whether such withholding taxes are creditable against a tax liability to which a shareholder is otherwise subject depends on the laws of such shareholder’s jurisdiction and such shareholder’s particular circumstances. Shareholders are urged to consult their tax advisors in respect of the consequences of the potential imposition of Dutch and/or Italian withholding taxes. See “We operate so as to be treated as exclusively resident in the UK for tax purposes, but the relevant tax authorities may treat us as also being tax resident elsewhere.” in the section Risks Related to Our Business, Strategy and Operations above.

96 2018 | ANNUAL REPORT
Board Report
Corporate Governance
Corporate Governance
CORPORATE GOVERNANCE
IntroductionFiat Chrysler Automobiles N.V. is a public company with limited liability, incorporated and organized under the laws of the Netherlands, which resulted from the cross-border merger of Fiat S.p.A. with and into Fiat Investments N.V. (“Fiat Investments”), renamed Fiat Chrysler Automobiles N.V. upon effectiveness of the merger on October 12, 2014 (the “Merger”). The Company qualifies as a foreign private issuer under the New York Stock Exchange (“NYSE”) listing standards and its common shares are listed on the NYSE and on the Mercato Telematico Azionario managed by Borsa Italiana S.p.A. (“MTA”).
In accordance with the NYSE Listed Company Manual, the Company is permitted to follow home country practice with regard to certain corporate governance standards. The Company has adopted, except as discussed below, the best practice provisions of the revised Dutch corporate governance code issued by the Dutch Corporate Governance Code Committee, which entered into force on January 1, 2018 (the “Dutch Corporate Governance Code”) and was applicable as from the financial year starting January, 1 2017. The Dutch Corporate Governance Code contains principles and best practice provisions that regulate relations inter alia between the board of directors of a company and its committees and its relationship with the general meeting of shareholders.
In this report, the Company addresses its overall corporate governance structure. The Company discloses, and intends to disclose, any material departure from the best practice provisions of the Dutch Corporate Governance Code in its current and future annual reports.
Corporate Offices and Home Member StateThe Company is incorporated under the laws of the Netherlands. It has its corporate seat (statutaire zetel) in Amsterdam, the Netherlands, and the place of effective management of the Company is in the United Kingdom.
The business address of the Board of Directors and the senior managers is 25 St. James’s Street, SW1A1HA London, United Kingdom.
The Company is registered at the Dutch trade register under number 60372958 and at the Companies House in the United Kingdom under file number FC031853.
The Netherlands is FCA’s home member state for the purposes of the EU Transparency Directive (Directive 2004/109/EC, as amended).
Board of DirectorsPursuant to the Company’s articles of association (the “Articles of Association”), its board of directors (the “Board of Directors”) may have three or more directors (the “Directors”). At the annual general meeting of shareholders held on April 13, 2018, the number of the Directors was set at twelve to accommodate the appointment of Mr. Abbott as an additional non-executive director. The current slate of Directors was elected on April 13, 2018, with the exception of Mr. Manley, who was appointed as a new executive director at the extraordinary general meeting of shareholders held on September 7, 2018, to replace Mr. Marchionne, who passed away on July 25, 2018. The term of office of the current Directors will expire following the Company’s 2019 annual general meeting of shareholders at which time the Company’s shareholders are expected to re-elect the Directors for a term of approximately one year expiring at the time of the Company’s 2020 annual general meeting of shareholders. Each Director may be re-appointed at any subsequent general meeting of shareholders.
The Board of Directors as a whole is responsible for the strategy of the Company. The Board of Directors is composed of two executive Directors (i.e., the Chairman and the Chief Executive Officer), having responsibility for the day-to-day management of the Company and ten non-executive Directors, who do not have such day-to-day responsibility within the Company or the Group. Pursuant to Article 17 of the Articles of Association, the general authority to represent the Company shall be vested in the Board of Directors and the Chief Executive Officer (“CEO”).
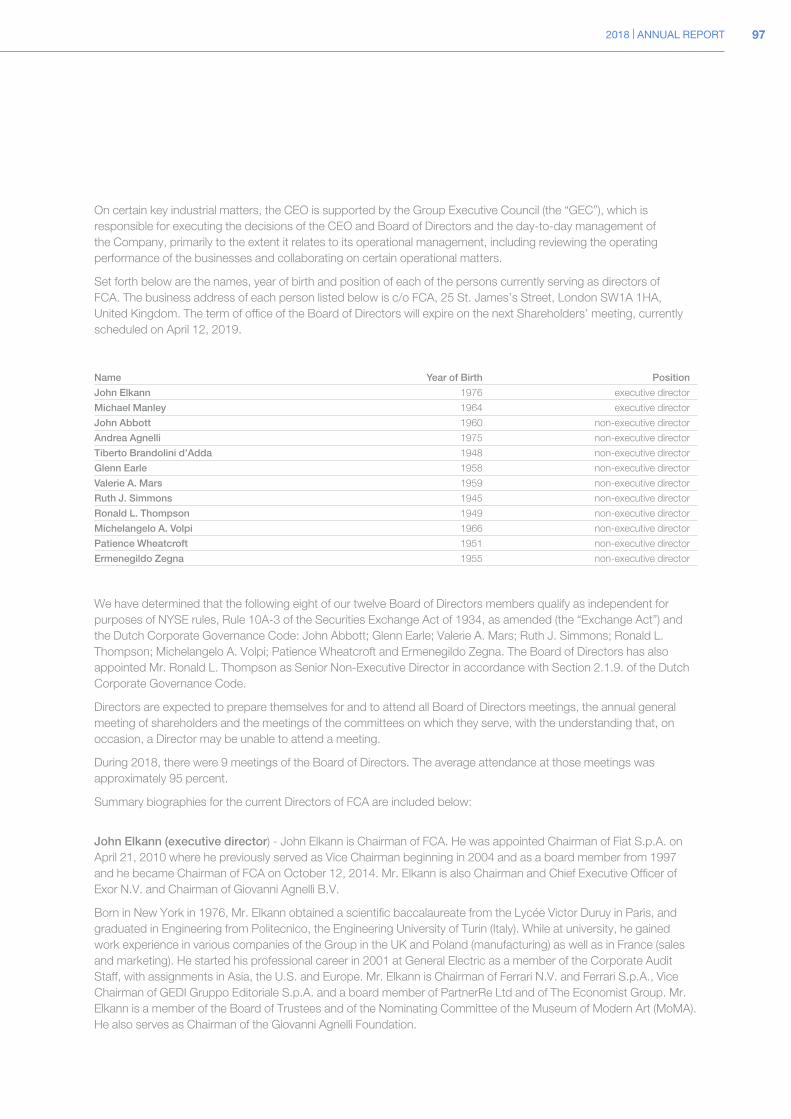
2018 | ANNUAL REPORT 97
On certain key industrial matters, the CEO is supported by the Group Executive Council (the “GEC”), which is responsible for executing the decisions of the CEO and Board of Directors and the day-to-day management of the Company, primarily to the extent it relates to its operational management, including reviewing the operating performance of the businesses and collaborating on certain operational matters.
Set forth below are the names, year of birth and position of each of the persons currently serving as directors of FCA. The business address of each person listed below is c/o FCA, 25 St. James’s Street, London SW1A 1HA, United Kingdom. The term of office of the Board of Directors will expire on the next Shareholders’ meeting, currently scheduled on April 12, 2019.
Name Year of Birth Position
John Elkann 1976 executive director
Michael Manley 1964 executive director
John Abbott 1960 non-executive director
Andrea Agnelli 1975 non-executive director
Tiberto Brandolini d’Adda 1948 non-executive director
Glenn Earle 1958 non-executive director
Valerie A. Mars 1959 non-executive director
Ruth J. Simmons 1945 non-executive director
Ronald L. Thompson 1949 non-executive director
Michelangelo A. Volpi 1966 non-executive director
Patience Wheatcroft 1951 non-executive director
Ermenegildo Zegna 1955 non-executive director
We have determined that the following eight of our twelve Board of Directors members qualify as independent for purposes of NYSE rules, Rule 10A-3 of the Securities Exchange Act of 1934, as amended (the “Exchange Act”) and the Dutch Corporate Governance Code: John Abbott; Glenn Earle; Valerie A. Mars; Ruth J. Simmons; Ronald L. Thompson; Michelangelo A. Volpi; Patience Wheatcroft and Ermenegildo Zegna. The Board of Directors has also appointed Mr. Ronald L. Thompson as Senior Non-Executive Director in accordance with Section 2.1.9. of the Dutch Corporate Governance Code.
Directors are expected to prepare themselves for and to attend all Board of Directors meetings, the annual general meeting of shareholders and the meetings of the committees on which they serve, with the understanding that, on occasion, a Director may be unable to attend a meeting.
During 2018, there were 9 meetings of the Board of Directors. The average attendance at those meetings was approximately 95 percent.
Summary biographies for the current Directors of FCA are included below:
John Elkann (executive director) - John Elkann is Chairman of FCA. He was appointed Chairman of Fiat S.p.A. on April 21, 2010 where he previously served as Vice Chairman beginning in 2004 and as a board member from 1997 and he became Chairman of FCA on October 12, 2014. Mr. Elkann is also Chairman and Chief Executive Officer of Exor N.V. and Chairman of Giovanni Agnelli B.V.
Born in New York in 1976, Mr. Elkann obtained a scientific baccalaureate from the Lycée Victor Duruy in Paris, and graduated in Engineering from Politecnico, the Engineering University of Turin (Italy). While at university, he gained work experience in various companies of the Group in the UK and Poland (manufacturing) as well as in France (sales and marketing). He started his professional career in 2001 at General Electric as a member of the Corporate Audit Staff, with assignments in Asia, the U.S. and Europe. Mr. Elkann is Chairman of Ferrari N.V. and Ferrari S.p.A., Vice Chairman of GEDI Gruppo Editoriale S.p.A. and a board member of PartnerRe Ltd and of The Economist Group. Mr. Elkann is a member of the Board of Trustees and of the Nominating Committee of the Museum of Modern Art (MoMA). He also serves as Chairman of the Giovanni Agnelli Foundation.

98 2018 | ANNUAL REPORT
Michael Manley (executive director) - Born in Edenbridge (UK) in 1964, Michael Manley was appointed Chief Executive Officer of Fiat Chrysler Automobiles N.V. on July 21, 2018. In addition, he also served as ad interim Chief Operating Officer for the EMEA region from July to September 2018 and Chief Operating Officer for the NAFTA region from October 2018 to December 2018. Mr. Manley’s appointment as Executive Director of FCA was formalized in the extraordinary meeting of shareholders held on September 7, 2018.
Previously, Mr. Manley has served as Head of Jeep brand, Head of Ram brand and Chief Operating Officer for the APAC region. He was also the lead Chrysler Group executive for the international activities of Chrysler outside of NAFTA, where he was responsible for implementing the co-operation agreements for distribution of Chrysler Group products through Fiat’s international distribution network.
Prior to those roles, Mr. Manley was Executive Vice President - International Sales and Global Product Planning Operations. Appointed to this position in December 2008, he was responsible for product planning and all sales activities outside North America.
Mr. Manley joined DaimlerChrysler in 2000 as Director - Network Development, DaimlerChrysler United Kingdom, Ltd., bringing with him extensive experience in the international automobile business at the distributor level.
He holds a Master of Business Administration from Ashridge Management College in Ashridge, England, and a Bachelor of Science in engineering from Southbank University in London, England.
John Abbott (non-executive director) - Born in Nottingham (UK) in 1960, John Abbott has been Downstream Director and a member of the Executive Committee of Royal Dutch Shell plc since October 2013. Based in London, he has Global accountability for, inter alia, manufacturing, chemicals, trading & supply, and marketing.
Mr. Abbott is also a Supervisory Board Member of Raizen, a Shell-Cosan joint venture which owns and operates sugar, ethanol and fuels sales and marketing operations in Brazil.
Since joining Shell in 1981, he has worked in the UK, Singapore, Thailand, the Netherlands, Canada, and the USA, predominantly in the areas of Global Manufacturing and Supply, Trading and Distribution. In 1994, he was seconded to the British Government on a brief assignment to work in the Central Policy and Planning Unit of what was then the Department of the Environment.
In 2006, Mr. Abbott became Vice President Manufacturing Excellence and Support, based in Houston, Texas (USA). Two years later, he became Executive Vice President of Shell’s Upstream Americas Heavy Oil business, based in Calgary, Canada.
In 2012, he was appointed Executive Vice President of Global Manufacturing and led a team of 30,000 employees and contractors based at around 30 refineries and chemical sites worldwide.
Mr. Abbott is a mentor in the FTSE 100 cross-company mentoring foundation and Executive Director for Shell’s Asian talent council.
He graduated from Birmingham University, UK, with a first-class honors degree in Chemical Engineering. He is a Fellow of the Institution of Chemical Engineers, as well as a chartered engineer and chartered scientist.
Mr. Abbott was appointed to the Board of Directors on April 13, 2018
Board Report
Corporate Governance

2018 | ANNUAL REPORT 99
Andrea Agnelli (non-executive director) - Andrea Agnelli has been Chairman of Juventus Football Club S.p.A. since May 2010 and is also Chairman of Lamse S.p.A., a holding company of which he is a founding shareholder, since 2007. Born in Turin in 1975, he studied at Oxford (St. Clare’s International College) and Milan (Università Commerciale Luigi Bocconi). While at university, he gained professional experience both in Italy and abroad, including positions at: Iveco-Ford in London; Piaggio in Milan; Auchan Hypermarché in Lille; Schroder Salomon Smith Barney in London; and, finally, Juventus Football Club S.p.A. in Turin.
Mr. Agnelli began his professional career in 1999 at Ferrari Idea in Lugano, where he was responsible for promoting and developing the Ferrari brand in non-automotive areas. In November 2000, he moved to Paris and assumed responsibility for marketing at Uni Invest SA, a Banque San Paolo company specialized in managed investment products. Mr. Agnelli worked at Philip Morris International in Lausanne from 2001 to 2004, where he initially had responsibility for marketing and sponsorships and, subsequently, corporate communication. In 2005, Mr. Agnelli returned to Turin to work in strategic development for IFIL Investments S.p.A. (now Exor N.V.) and he joined the Board of Directors of IFI S.p.A. (now Exor N.V.) in May 2006. Mr. Agnelli is a non-executive director of Exor N.V.
Mr. Agnelli is a general partner of Giovanni Agnelli B.V. and a member of the advisory board of BlueGem Capital Partners LLP. Since March 2017 he is the President of “Fondazione del Piemonte per l’Oncologia”. He has also been a member of the European Club Association’s executive board since 2012 and Chairman since 2017. From 2014 to 2017, he has served as a board member of the Serie A National League of Professionals and as board member of the Foundation for the General Mutuality in Professional Team Sports. In September 2015, he was appointed to the UEFA Executive Committee as an ECA representative.
Mr. Agnelli was appointed to the Board of Directors of Fiat S.p.A. on May 30, 2004 and became a member of the Board of Directors on October 12, 2014.
Tiberto Brandolini d’Adda (non-executive director) - Born in Lausanne (Switzerland) in 1948, Tiberto Brandolini d’Adda is a graduate in commercial law from the University of Parma. From 1972 to 1974, Mr. Brandolini d’Adda gained his initial work experience in the international department of Fiat S.p.A. and then at Lazard Bank in London. In 1975, he was appointed assistant to the Director General for Enterprise Policy at the European Economic Commission in Brussels. He joined Ifint in 1976 as General Manager for France. In 1985, he was appointed General Manager for Europe and then, in 1993, Managing Director of Exor Group (formerly Ifint) where he also served as Vice Chairman from 2003 until 2007. He has extensive international experience as a main Board Director of several companies, including: Le Continent, Bolloré Investissement, Société Foncière Lyonnaise, Safic-Alcan and Chateau Margaux.
Mr. Brandolini d’Adda served as Director and then, from 1997 to 2003, as Chairman of the conseil de surveillance of Club Mediterranée. He served as Vice Chairman of Exor S.p.A. (now Exor N.V.), formed through the merger between IFI and IFIL Investments, from 2009 to May 2015. He was Chairman of Exor S.A. (Luxembourg) from 2007 until September 2017. In May 2004, he was appointed Chairman of the conseil de surveillance of Worms & Cie, where he had served as Deputy Chairman since 2000. In May 2005, he became Chairman and Chief Executive Officer of Sequana Capital (formerly Worms & Cie), then Chairman of the Board of Sequana from 2007 until 2013. He has been a member of the Board of Vittoria Assicurazioni S.p.A. from 2004 until 2010. He has also been a member of the Board of Société Générale de Surveillance S.A. (SGS) from 2005 to 2013. Mr. Brandolini d’Adda currently serves as an independent member of the Board of Directors of YAFA S.p.A. In addition, since 2015, he has been an independent Board member of LumX Asset Management (Suisse) S.A. (formerly Gottex Fund Management Holdings Limited). He is a Director of Giovanni Agnelli B.V. Mr. Brandolini d’Adda is Officier de la Légion d’Honneur.
Mr. Brandolini d’Adda was appointed to the Board of Directors of Fiat S.p.A. on May 30, 2004 and became a member of the Board of Directors on October 12, 2014.

100 2018 | ANNUAL REPORT
Glenn Earle (non-executive director) - Born in Douglas, Isle of Man in 1958, Glenn Earle is the Head of EMEA for Ardea Partners UK LLP, a private investment banking advisory firm. He is also a member of the Board of Directors of Affiliated Managers Group, Inc., Deputy Chairman of educational charity Teach First and a Trustee of The Young Vic. Mr. Earle retired in December 2011 from Goldman Sachs International, where he was most recently a Managing Director and the Chief Operating Officer. Mr. Earle was also Chief Executive of Goldman Sachs International Bank and his other responsibilities included co-Chairmanship of the firm’s Global Commitments and Capital Committees and membership of the Goldman Sachs International Executive Committee. He previously worked at Goldman Sachs in various roles in New York, Frankfurt and London from 1987, becoming a Partner in 1996. From 1979 to 1985, he worked in the Latin America department at Grindlays Bank/ANZ in London and New York, leaving as a Vice President.
Mr. Earle is a graduate of Emmanuel College, Cambridge and of Harvard Business School, where he earned a Master of Business Administration with High Distinction and was a Baker Scholar and Loeb, Rhoades Fellow. His other activities include membership of The Higher Education Commission and the Advisory Board of the Sutton Trust. His previous responsibilities include membership of the Board of Trustees of the Goldman Sachs Foundation and of the Ministerial Task Force for Gifted and Talented Youth, Chairmanship of the Advisory Board of Cambridge University Judge Business School, Vice Chairman of Rothesay Life Group, Trustee and Director of The Royal National Theatre and member of the Advisory Committee of Hayfin Capital Management LLP.
Mr. Earle was appointed to the Board of Directors of Fiat S.p.A. in June 2014 and became a member of the Board of Directors on October 12, 2014.
Valerie A. Mars (non-executive director) - Born in New York in 1959. Valerie Mars serves as Senior Vice President & Head of Corporate Development for Mars, Incorporated, a diversified food business, operating in over 120 countries and one of the largest privately held companies in the world. In this position, she focuses on acquisitions, joint ventures and divestitures for the company. She served on the Mars, Incorporated Audit Committee and Remuneration Committee and is a member of the board of Royal Canin. In March 2018, Ms. Mars was elected to the board of Ahlstrom-Munksjo, a Finnish/Swedish listed specialty paper business.
Additionally, Ms. Mars is a member of the Rabobank North America Advisory Board. She served on the board of Celebrity Inc., a NASDAQ listed company, from 1994 to September 2000. Previously, Ms. Mars was the Director of Corporate Development for Masterfoods Europe. Her European work experience began in 1996 when she became General Manager of Masterfoods Czech and Slovak Republics. Prior to joining Mars, Incorporated, Ms. Mars was a controller with Whitman Heffernan Rhein, a boutique investment company. She began her career with Manufacturers Hanover Trust Company as a training program participant and rose to Assistant Secretary. Ms. Mars is involved in a number of community and educational organizations and currently serves on the Board of Conservation International, where she chairs the Audit Committee. She is also Director Emeritus of The Open Space Institute.
Ms. Mars holds a Bachelor of Arts degree from Yale University and a Master of Business Administration from the Columbia Business School.
Ms. Mars was appointed to the Board of Directors on October 12, 2014.
Ruth J. Simmons (non-executive director) - Born in Grapeland (Texas, USA) in 1945, Ruth J. Simmons served on the Board of Directors of FCA US from 2012 to 2014. She was also President of Brown University from 2001 to 2012, Professor in the Department of Comparative Literature and the Department of African Studies of Brown University from 2001 to 2014, and currently serves as President of Prairie View A&M University.
Prior to joining Brown University, Ms. Simmons was President of Smith College, where she started the first engineering program at a U.S. women’s college. She also was Vice Provost at Princeton University and Provost at Spelman College and held various positions of increasing responsibility until becoming Associate Dean of the faculty at Princeton University. Ms. Simmons was previously Assistant Dean and then Associate Dean at the University of Southern California. She also held various positions including Acting Director of international programs at the California State University (Northridge), Assistant Dean at the College of Liberal Arts, Assistant Professor of French at the University of New Orleans, Admissions Officer at Radcliffe College, instructor in French at the George Washington University and an interpreter-Language Services Division at the U.S. Department of State.
Board Report
Corporate Governance

2018 | ANNUAL REPORT 101
Ms. Simmons also serves on the board of Square Inc.
Ms. Simmons is a graduate of Dillard University in New Orleans, and received her Ph.D. in Romance languages and literatures from Harvard University. She is a Fellow of the American Academy of Arts and Sciences and a member of the Council on Foreign Relations.
Ms. Simmons was appointed to the Board of Directors on October 12, 2014.
Ronald L. Thompson (non-executive director) - Born in Detroit (Michigan, USA) in 1949, Ronald L. Thompson served on the Board of Directors of FCA US from 2009 to 2014. Mr. Thompson is currently chairman of the board of trustees for Teachers Insurance and Annuity Association (TIAA), a for-profit life insurance company that serves the retirement and financial needs of faculty and employees of colleges and universities, hospitals, cultural institutions and other nonprofit organizations. He also serves on the Board of Trustees for Washington University in St. Louis, Missouri, on the Board of Trustees of the Medical University of South Carolina Foundation, and as a member of the Advisory Board of Plymouth Venture Partners Fund.
Mr. Thompson was previously the Chief Executive Officer and Chairman of Midwest Stamping Company of Maumee, Ohio, a manufacturer of medium and heavy gauge metal components for the automotive market. He sold the company in late 2005. Mr. Thompson has served on the boards of many different companies including Commerce Bank of St. Louis, GR Group (U.S.), Illinova Corporation, Interstate Bakeries Corporation, McDonnell Douglas Corporation, Midwest Stamping Company, Ralston Purina Company and Ryerson Tull, Inc. He was also a member of the Board of Directors of the National Association of Manufacturers. He was Chairman and Chief Executive Officer at GR Group, General Manager at Puget Sound Pet Supply Company and Chairman and Chief Executive Officer at Evaluation Technologies. Mr. Thompson has served on the faculties of Old Dominion University, Virginia State University and the University of Michigan.
Mr. Thompson holds a Ph.D. and a Master of Science in Agricultural Economics from Michigan State University and a Bachelor of Business Administration from the University of Michigan.
Mr. Thompson was appointed Senior Non-Executive Director on October 12, 2014.
Michelangelo A. Volpi (non-executive director) - Born in Milan (Italy) in 1966, Michelangelo Volpi has been a partner at Index Ventures since 2009. He is focused on investments in the enterprise software infrastructure and consumer Internet sectors. Mr. Volpi led the investment by Index Ventures in Pure Storage (PSTG), Cloud.com (CTRX) and StorSimple (MSFT) and is currently a director of Sonos, Wealthfront, Lookout, Elastic, Confluent, Blue Bottle Coffee, Slack, and Zuora. Mr. Volpi also served as an independent member of the board of Exor N.V. until May 29, 2018.
Mr. Volpi performed in various executive roles for 13 years at Cisco Systems from 1994. He served as the company’s Chief Strategy Officer, where he was responsible for Cisco’s corporate strategy as well as business development, strategic alliances, advanced Internet projects, legal services, and government affairs. During this tenure, Mr. Volpi was instrumental in the creation of the company’s acquisition and investment strategies, as Cisco acquired more than 70 companies during his tenure. He then became Senior Vice President & General Manager of the Routing and Service Provider Technology Group, where he led Cisco’s business for the Service Provider market, and was also responsible for all of Cisco’s routing products. Mr. Volpi began his career as a product development engineer at Hewlett Packard’s Optoelectronics Division. Prior to Index, he was the CEO of Joost - an innovator in the field of premium video services delivered over the Internet.
Mr. Volpi has a B.S. in Mechanical Engineering and an M.S. in Manufacturing Systems Engineering from Stanford University, and an M.B.A. from the Stanford Graduate School of Business. He is a trustee of The Castilleja School in Palo Alto, CA and was a trustee of the Stanford Business School Trust until 2017.
Mr. Volpi was appointed to the Board of Directors on April 14, 2017.

102 2018 | ANNUAL REPORT
Patience Wheatcroft (non-executive director) - Born in Chesterfield (United Kingdom) in 1951, Patience Wheatcroft is a British national and graduate in law from the University of Birmingham. She is also a member of the House of Lords since 2011 and a financial commentator and journalist. Ms. Wheatcroft currently serves as Non-executive Director of the wealth management company St. James’s Place PLC. Ms. Wheatcroft has a broad range of experience in the media and corporate world with past positions at the Wall Street Journal Europe, where she was Editor-in-Chief, The Sunday Telegraph, The Times, Mail on Sunday, as well as serving as Non-executive Director of Barclays Group PLC and Shaftesbury PLC.
Ms. Wheatcroft served on the Board of Trustees of the British Museum, until 2018.
Ms. Wheatcroft was appointed to the Board of Directors of Fiat S.p.A. in April 2012 and became a member of the Board of Directors on October 12, 2014.
Ermenegildo Zegna (non-executive director) - Born in Turin (Italy) in 1955, Ermenegildo Zegna has been Chief Executive Officer of the Ermenegildo Zegna Group since 1997, having served on the board since 1989. Previously, he held senior executive positions within the Zegna Group including in the U.S., after a retail experience at Bloomingdale’s, New York. He is also a member of the boards of Tom Ford International, Camera Nazionale della Moda Italiana, the Council for the United States and Italy, and from 2018 of the newly acquired American luxury brand Thom Browne. In 2011, he was nominated Cavaliere del Lavoro by the President of the Italian Republic.
A graduate in economics from the University of London, Mr. Zegna also studied at the Harvard Business School.
Mr. Zegna was appointed to the Board of Directors on October 12, 2014.
Composition of the Board of DirectorsPursuant to Dutch law, as from the financial year starting January 1, 2017, FCA should strive to achieve a minimum of 30% male and 30% female representation on its Board of Directors and should explain in its annual report if these criteria are not met. Three of our current twelve Directors are female and therefore female board members represent less than 30% of the total board as is required by Dutch law. The Company appreciates that a diversity of views and expertise is needed for a good understanding of current affairs and longer-term risks and opportunities related to the Company’s business and therefore adopted a Diversity Policy on December 20, 2017, as well as a Profile for Non-Executive Directors. The Diversity Policy stipulates, among other things, a target that “at least 30% of the seats of the Board of Directors are occupied by women and at least 30% by men and that as soon as reasonably possible the composition of the Board of Directors shall meet this target”. The Company will continue to take this target into account in the appointment and nomination of executive and non-executive Directors. Nevertheless, the Company believes that the current Board of Directors has the diversity of experience, expertise and backgrounds, and the appropriate independence and judgment to fulfill its responsibilities and execute its duties appropriately.
Amount and Composition of the Remuneration of the Board of DirectorsDetails of the remuneration of the Board of Directors and its committees are set forth within the section “REMUNERATION REPORT” included elsewhere within this report.
Board Report
Corporate Governance

2018 | ANNUAL REPORT 103
Directors’ Share OwnershipThe table below shows the number of FCA common shares owned by members of the Board of Directors as at February 22, 2019:
Directors Owning FCA Common Shares Shares Percent of Class
John Elkann 133,000 —%
Michael Manley 345,362 —%
John Abbott — —%
Andrea Agnelli 36,102 —%
Tiberto Brandolini d’Adda 25,973 —%
Glenn Earle 34,136 —%
Valerie Mars 25,973 —%
Ruth J. Simmons 50,881 —%
Ronald L. Thompson 25,973 —%
Michelangelo Volpi — —%
Patience Wheatcroft 25,973 —%
Ermenegildo Zegna 29,008 —%
No members of senior management beneficially own 1% or more of the Company’s common shares.
Board Practices and Committees
Board RegulationsOn December 20, 2017, the Board of Directors adopted its current regulations, that deal with matters that concern the Board of Directors and its committees internally.
The regulations contain provisions concerning the manner in which meetings of the Board of Directors are called and held, including the decision-making process. The regulations provide that meetings may be held by telephone conference or video-conference, provided that all participating Directors can follow the proceedings and participate in real-time discussion of the items on the agenda.
The Board of Directors can only adopt valid resolutions when the majority of the Directors in office are present at the meeting or be represented thereat.
A Director may only be represented by another Director authorized in writing.
A Director may not act as a proxy for more than one other Director.
All resolutions shall be adopted by the favorable vote of the majority of the Directors present or represented at the meeting, provided that the regulations contain specific provisions in this respect. Each Director shall have one vote.
The Board of Directors shall be authorized to adopt resolutions without convening a meeting if all Directors shall have expressed their opinions in writing, unless one or more Directors shall object in writing against the resolution being adopted in this way prior to the adoption of the resolution.
The regulations are available on the Company’s website.
CommitteesOn October 13, 2014, the Board of Directors appointed the following internal committees: (i) an Audit Committee; (ii) a Governance and Sustainability Committee; and (iii) a Compensation Committee, with such appointments becoming effective as of the Merger effective date.

104 2018 | ANNUAL REPORT
The Audit CommitteeOn December 20, 2017, the Board of Directors adopted the current charter of the Audit Committee. The Audit Committee is responsible for assisting and advising the Board of Directors’ oversight of, inter alia: (i) the integrity of the Company’s financial statements, including any published interim reports; (ii) the Company’s policy on tax planning; (iii) the Company’s financing; (iv) the Company’s applications of information and communication technology; (v) the systems of internal controls that management and the Board of Directors have established; (vi) the Company’s compliance with legal and regulatory requirements; (vii) the Company’s compliance with recommendations and observations of internal and independent auditors; (viii) the Company’s policies and procedures for addressing certain actual or perceived conflicts of interest; (ix) the independent auditors’ qualifications, independence, remuneration and any non-audit services for the Company; (x) the performance of the Company’s internal auditors and of the independent auditors; (xi) risk management guidelines and policies; and (xii) the implementation and effectiveness of the Company’s ethics and compliance program.
The Audit Committee currently consists of Mr. Glenn Earle (Chairman), Mr. Thompson, Ms. Wheatcroft and Ms. Mars. The Audit Committee is elected by the Board of Directors and is comprised of at least three non-executive Directors. Audit Committee members are also required (i) not to have any material relationship with the Company or to serve as auditors or accountants for the Company; (ii) to be “independent”, for purposes of NYSE rules, Rule 10A-3 of the Exchange Act and the Dutch Corporate Governance Code; and (iii) to be “financially literate” and have “accounting or selected financial management expertise” (as determined by the Board of Directors). At least one member of the Audit Committee shall be a “financial expert” as defined by the Sarbanes-Oxley Act and the rules of the U.S. Securities and Exchange Commission and section 2(3) of the Decree on the Establishment of an audit committee. No Audit Committee member may serve on more than four audit committees for other public companies, absent a waiver from the Board of Directors which must be disclosed in the Company’s annual report. Unless decided otherwise by the Audit Committee, the independent auditors of the Company, the Chief Financial Officer and the Head of Internal Audit attend its meetings while the Chief Executive Officer is entitled to attend meetings of the Audit Committee unless the Audit Committee determines otherwise and shall attend the meetings of the Audit Committee if the Audit Committee so requires. The Audit Committee shall meet with the independent auditor at least once per year outside the presence of the executive directors and management.
Our board of directors has determined that Glenn Earle and Ronald Thompson are “audit committee financial experts”. Mr. Earle and Mr. Thompson are independent directors under NYSE standards.
During 2018, 8 meetings of the Audit Committee were held. The average attendance of its members at those meetings was 100 percent. The Committee reviewed the Group financial results on a quarterly basis with the assistance of the Group Chief Financial Officer and other Company’s officers mainly from finance and legal departments, focusing on main business drivers in addition to key accounting and reporting matters. Independent Auditors attended all the meetings providing regular information to the Committee on their activity with specific focus on the areas of major audit risks such as the evaluation of assets and liabilities requiring management judgment. The Committee received updates on legal and compliance matters, with the General Counsel attending the Committee meetings. Internal Audit activity was reviewed on a regular basis with the Head of the Internal Audit attending all the meetings and discussing with the Committee the main findings and remediating actions. Internal control over financial reporting was part of these reviews as well. In line with the policy adopted by the Group, the Committee was regularly involved in the review and approval of transactions entered into with related parties.
The Compensation CommitteeOn December 20, 2017, the Board of Directors adopted the current charter of the Compensation Committee. The Compensation Committee is responsible for, inter alia, assisting and advising the Board of Directors in: (i) determining executive compensation consistent with the Company’s remuneration policy; (ii) reviewing and approving the remuneration structure for the executive Directors; (iii) administering equity incentive plans and deferred compensation benefit plans; (iv) discussing with management the Company’s policies and practices related to compensation and issuing recommendations thereon; and (v) to prepare the remuneration report.
Board Report
Corporate Governance

2018 | ANNUAL REPORT 105
The Compensation Committee currently consists of Mr. Zegna (Chairman), Ms. Mars and Mr. Volpi. The Compensation Committee is elected by the Board of Directors and is comprised of at least three non-executive Directors, of which at most one of them may not be independent under Dutch Corporate Governance Code. Unless decided otherwise by the Compensation Committee, the Head of Human Resources of the Company attends its meetings.
During 2018, the Compensation Committee met 4 times with 100 percent attendance of its members at those meetings. The Compensation Committee reviewed the implementation of the Remuneration Policy and the Remuneration Report. Further details of the activities of the Compensation Committee are included in the REMUNERATION REPORT section included elsewhere in this report.
The Governance and Sustainability CommitteeOn December 20, 2017, the Board of Directors adopted the current charter of the Governance and Sustainability Committee. The Governance and Sustainability Committee is responsible for, inter alia, assisting and advising the Board of Directors with: (i) the identification of the criteria, professional and personal qualifications for candidates to serve as Directors; (ii) periodic assessment of the size and composition of the Board of Directors; (iii) periodic assessment of the performance of individual Directors and reporting on this to the Board of Directors; (iv) proposals for appointment of executive and non-executive Directors; (v) supervision of the selection criteria and appointment procedure for senior management; (vi) monitoring and evaluating reports on the Group’s sustainable development policies and practices, management standards, strategy, performance and governance globally; and (vii) reviewing, assessing and making recommendations as to strategic guidelines for sustainability-related issues, and reviewing the annual Sustainability Report.
The Governance and Sustainability Committee currently consists of Mr. Elkann (Chairman), Ms. Wheatcroft and Ms. Simmons. The Governance and Sustainability Committee is elected by the Board of Directors and is comprised of at least three Directors. More than half of its members shall be independent under the Dutch Corporate Governance Code and at most one of the members may be an executive Director.
During 2018, the Governance and Sustainability Committee met once with 100 percent attendance of its members at that meeting. The Committee reviewed the Board of Director’s and Committee’s assessments, the sustainability achievements and objectives and the recommendations for Directors’ election.
Indemnification of DirectorsUnder Dutch law, indemnification provisions may be included in a company’s articles of association. Under its Articles of Association, FCA is required to indemnify any and all of its Directors, officers, former Directors, former officers and any person who may have served at its request as a Director or officer of another company in which it owns shares or of which it is a creditor, against any and all expenses actually and necessarily incurred by any of them in connection with the defense of any action, suit or proceeding in which they, or any of them, are made parties, or a party, by reason of being or having been a Director or officer of the Company, or of such other company, except in relation to matters as to which any such person shall be adjudged in such action, suit or proceeding to be liable for gross negligence or willful misconduct in the performance of duty. Such indemnification shall not be deemed exclusive of any other rights to which those indemnified may be entitled otherwise.
Conflict of InterestA Director shall not participate in discussions and the decision-making of the Board of Directors with respect to a matter in relation to which he or she has a direct or indirect personal interest that is in conflict with the interests of the Company and the business associated with the Company (“Conflict of Interest”), which shall be determined outside the presence of the Director concerned. All transactions where there is a Conflict of Interest must be concluded on terms that are customary in the branch concerned and approved by the Board of Directors. In addition, the Board of Directors as a whole may, on an ad hoc basis, resolve that there is such a strong appearance of a Conflict of Interest of an individual Director in relation to a specific matter that it is deemed in the best interest of a proper decision making process that such individual Director be excused from participation in the decision making process with respect to such matter even though such Director may not have an actual Conflict of Interest.

106 2018 | ANNUAL REPORT
At least annually, each Director shall assess in good faith whether (i) he or she is independent under (a) best practice provision 2.1.8. of the Dutch Corporate Governance Code, (b) the requirements of Rule 10A-3 under the Exchange Act, and (c) Section 303A of the NYSE Listed Company Manual; and (ii) he or she has a Conflict of Interest in connection with any transactions between the Company and a significant shareholder or related party of the Company, including affiliates of a significant shareholder (such conflict, a “Related-Party Conflict”), it being understood that currently Exor N.V. would be considered a significant shareholder.
The Directors shall inform the Board of Directors through the Senior Non-executive Director or the Secretary of the Board of Directors as to all material information regarding any circumstances or relationships that may impact their characterization as “independent” or impact the assessment of their interests, including by responding promptly to the annual Directors and Officers (“D&O”) questionnaires circulated by or on behalf of the Secretary that are designed to elicit relevant information regarding business and other relationships.
Based on each Director’s assessment described above, the Board of Directors shall make a determination at least annually regarding such Director’s independence and such Director’s Related-Party Conflict. These annual determinations shall be conclusive, absent a change in circumstances from those disclosed to the Board of Directors that necessitates a change in such determination.
Senior ManagementThe Group’s management is led by FCA’s Chief Executive Officer who is supported by a Group Executive Council (“GEC”). From an operational perspective, each of our reportable segments are led by Chief Operating Officers (“COO”), who are accountable for the profit or loss of the segment and management of segment resources, including industrial and commercial activities. These are supported centrally by corporate functions, including a Chief Financial Officer and General Counsel. With the exception of the General Counsel, each of these members of senior management are members of the GEC.
The regional COOs and leaders of the key corporate functions are:
Michael Manley as Chief Executive Officer;
Pietro Gorlier as Chief Operating Officer EMEA and Global Head of Parts & Service (MOPAR);
Antonio Filosa as Chief Operating Officer LATAM;
Mark Stewart as Chief Operating Officer NAFTA;
Daphne Zheng as Chief Operating Officer of China;
Paul Alcala as Chief Operating Officer APAC (excluding China);
Harald Wester as Chief Operating Officer Maserati;
Richard K. Palmer as Chief Financial Officer; and
Giorgio Fossati as Corporate General Counsel.
Summary biographies for these individuals are included below. For the biography of Mr. Manley, see above.
Pietro Gorlier - Pietro Gorlier was named Chief Operating Officer (COO) of the EMEA region in October 2018. He has been a member of the GEC and Global Head of Parts & Service (MOPAR) since September 2011. Mr. Gorlier has held other key roles for the Group including being appointed COO of Components in June 2015 and President and Chief Executive Officer - MOPAR Brand Service, Parts and Customer Care, Chrysler Group LLC, in June 2009.
He joined the Chrysler Group from Fiat Group Automobiles S.p.A. and CNH Global N.V., where he previously served as Head of the Network and Owned Dealerships organization. Mr. Gorlier joined the Fiat Group in 1989 as a Market Analyst in Iveco and held various positions in Logistics, After Sales, and Customer Care before joining Fiat Group Automobiles in 2006 in Network Development. He is a graduate from the University of Turin where he studied economics and business. Mr. Gorlier was born in Turin, Italy in 1962.
Board Report
Corporate Governance

2018 | ANNUAL REPORT 107
Antonio Filosa - Antonio Filosa was named Chief Operating Officer of the LATAM region and a member of the GEC in March 2018. Previously, Mr. Filosa served as the Head of Argentina as well as the Head of Alfa Romeo and Maserati brands for the Latin America region, positions he held since 2016 and 2018, respectively.
Prior to those roles, he was responsible for all Purchasing activities in the LATAM region. Mr. Filosa has held a series of positions with increasing responsibility within the Group including serving as plant manager of the Betim facility. He joined the Group in 1999. Mr. Filosa holds a master’s degree in engineering from Politecnico di Milano (Italy). Mr. Filosa was born in Castellammare di Stabia, Italy in 1973.
Mark Stewart - Mark Stewart was appointed Chief Operating Officer for the NAFTA region and named a member of the Group Executive Council (GEC) on December 6, 2018. Previously, Mr. Stewart was Vice President of Operations for Amazon since 2017. He was the lead executive for customer fulfillment across 200 operations facilities in North America. In this position, he was also responsible for overseeing operations, procurement, construction, and engineering with teams dedicated to pursuing automation, artificial intelligence and advanced robotics and conveyance. Prior to that, Mr. Stewart was Executive Vice President and Chief Operating Officer for ZF TRW Automotive from 2015. He also held a number of positions with increasing responsibility at TRW Automotive, Inc., from 2006. He spent the first years of his career in manufacturing with TRW Inc., and later Tower Automotive, Inc. where he served as Director of Operations and Executive Vice President. Mr. Stewart has been based in the U.S., Belgium, Germany, and China with a variety of experiences in production, quality, and engineering. He holds a Bachelor of Engineering from Vanderbilt University and a Master of Business Administration from the University of Tennessee. Mr. Stewart was born in Madison (Alabama, USA), in 1967.
Daphne Zheng - Daphne Zheng was appointed Chief Operating Officer China and member of the GEC in January 2017. Ms. Zheng most recently served as the Managing Director of the Sales Joint Venture in China with Guangzhou Automotive Group Co., Ltd., and previously has held senior positions in Sales and Marketing with FCA in China since 2008.
Prior to that appointment, she served as Vice President at Honeywell China in 2007 and Global Vice President at Onstar in the United States in 2005. Ms. Zheng began her career in 1993 as a journalist at China Daily and later joined GM China serving as the Director of Public Relations. She holds a Master of Business Administration degree from Rutgers University and a bachelor’s degree in journalism from Shanghai International Studies University. Ms. Zheng was born in Shanghai, China in 1970.
Paul Alcala - Paul Alcala was appointed Chief Operating Officer APAC (excluding China) and member of the GEC in January 2017. He most recently served as the Head of China Developments and the Vice Chairman for the Manufacturing and Sales Joint Ventures in China with Guangzhou Automotive Group Co., Ltd. Prior to this, he was Head of Aftersales for Maserati, Director of Customer Care and Call Centers for FCA US as well as Director of International Service and Parts at FCA US. Mr. Alcala also served as General Manager of Beijing Jeep Corp. and Chief Executive of Chrysler de Venezuela. He was also Director of Manufacturing and Chief Financial Officer of Chrysler de Venezuela. Mr. Alcala joined the former Chrysler Corporation in 1987 and held a series of positions of increasing responsibility in the U.S., Europe, Latin America and Asia Pacific.
Mr. Alcala holds a Master of Business Administration from Duke University and a Bachelor of Business from the University of Michigan. Mr. Alcala was born in Royal Oak, Michigan, USA in 1961.
Harald Wester - Harald Wester was appointed Chief Operating Officer Maserati in October 2018. He has also been a member of the Group Executive Council (GEC) and Chief Technical Officer since September 2011. Previously, he was Head of Alfa Romeo and Maserati (until May 2016) and Abarth (until 2013). Mr. Wester was appointed Chief Technical Officer for Fiat Group in September 2007. In addition to this role, in August 2008 he was appointed Chief Executive Officer of Maserati S.p.A., in January 2009 Chief Executive Officer of Abarth & C. S.p.A., and in January 2010 Chief Executive Officer of Alfa Romeo Automobiles.

108 2018 | ANNUAL REPORT
Mr. Wester started his professional career at Volkswagen AG in Wolfsburg, where he was General Manager of the Vehicle Research and New Concepts department from 1991 to 1995. Later that year, he joined Audi AG in Ingolstadt where he became Program Manager for the A2 models and Special Vehicles, a position that he held until January 1999. Subsequently, he joined Ferrari S.p.A. at Maranello as Director of Product Development, where he remained until January 2002. Mr. Wester was then hired by Magna Steyr AG, Magna AG (Graz, Vienna) as Group President Engineering and Chief Technical Officer (Research, Development and Technologies). In 2004, he joined the Fiat Group where he took on the role of Chief Technical Officer of Fiat Group Automobiles.
He obtained a Masters in Mechanical Engineering from Technical University of Braunschweig in Braunschweig, Germany. Mr. Wester was born in Linz am Rhein, Germany in 1958.
Richard K. Palmer - Richard K. Palmer was appointed Chief Financial Officer and a member of the GEC in September 2011. He was also named Head of Business Development in July 2018. Previously he served as Chief Operating Officer Systems and Castings. In his current role, Mr. Palmer is responsible for all financial activities of the Group including control, treasury and tax. Mr. Palmer was Chief Financial Officer of FCA US from June 2009 until 2017. Mr. Palmer joined FCA US from the former Fiat Group Automobiles, where he held the position of Chief Financial Officer beginning in December 2006. In 2003, he joined the Group as Chief Financial Officer of Comau, and in 2005, moved to Iveco in the same role.
Prior to that appointment, he was Finance Manager for several business units at General Electric Oil and Gas. Mr. Palmer spent the first years of his career in audit with Pricewaterhouse and later with United Technologies Corporation. Mr. Palmer served as a member of the Board of Directors of R.R. Donnelley & Sons Company from 2013 to September 2016. Since October 1, 2016, Mr. Palmer has served as member of the Board of Directors of LSC Communications, Inc., which was spun off from R.R. Donnelly and Sons Company, on that date.
Mr. Palmer is a Chartered Accountant and member of ICAEW (UK) and holds a Bachelor of Science degree in Microbiology from the University of Warwick (UK). Mr. Palmer was born in Keynsham, England in 1966.
Giorgio Fossati - Giorgio Fossati was appointed Corporate General Counsel in November 2014. He is also General Counsel - EMEA. Previously Mr. Fossati was General Counsel of Fiat, a position to which he was appointed in 2011. Previously he had been General Counsel of Fiat Auto since 2002, following other positions of increasing responsibility within the Fiat Legal department. Prior to that, Mr. Fossati worked in positions of increasing responsibility in the legal department at Iveco S.p.A.
Mr. Fossati earned his master’s degree in law from the University of Turin School of Law. Mr. Fossati was born in Orbassano, Italy in 1961.
Articles of Association and Information on FCA SharesThe following is a summary of material information relating to FCA common shares, including summaries of certain provisions of the Articles of Association, the terms and conditions in respect of FCA special voting shares (the “Terms and Conditions of Special Voting Shares”) and the applicable Dutch law provisions in effect at the date of this report. The summaries of the Articles of Association and the Terms and Conditions of Special Voting Shares as set forth in this report are qualified in their entirety by reference to the full text of the Articles of Association and the Terms and Conditions of Special Voting Shares.
Share CapitalThe authorized share capital of FCA is forty million Euro (€40,000,000), divided into two billion (2,000,000,000) common shares, nominal value of one Euro cent (€0.01) per share and two billion (2,000,000,000) special voting shares, nominal value of one Euro cent (€0.01) per share.
Board Report
Corporate Governance

2018 | ANNUAL REPORT 109
On October 29, 2014, the Board of Directors of FCA resolved to authorize the issuance of up to a maximum of 90,000,000 FCA common shares under the framework equity incentive plan which had been adopted before the closing of the Merger. Any issuance of shares thereunder in the period from 2014 to 2018 was subject to the satisfaction of certain performance and retention requirements. Any issuances to directors was subject to shareholder approval. During 2018 a total of 10,527,873 FCA common shares were issued under the framework equity incentive plan.
At December 31, 2014, there were 1,250,000 FCA common shares reserved for issuance under the FCA Non-Executive Directors’ Compensation Plan in the following 5 years. During 2015, a total of 83,172 FCA common shares were issued at fair market value, being equal to the average of the highest and lowest sale price of an FCA common share during normal trading hours on the NYSE on the last trading day of the applicable plan year quarter. During 2016, a total of 163,333 FCA common shares were issued at fair market value. During 2017, a total of 54,855 common shares were issued at fair market value. No FCA common shares were issued during 2018 following the amendment of the remuneration policy for the Board of Directors, as adopted by the General Meeting of Shareholders held on April, 14, 2017, which introduced cash payments for Non-Executive Directors.
FCA common shares are registered shares represented by an entry in the share register of FCA. The Board of Directors may determine that, for the purpose of trading and transfer of shares on a foreign stock exchange, share certificates shall be issued in such a form as shall comply with the requirements of such a foreign stock exchange. A register of shareholders is maintained by FCA in the Netherlands and a branch register is maintained in the U.S. on FCA’s behalf by the Transfer Agent, which serves as branch registrar and transfer agent.
Beneficial interests in FCA common shares that are traded on the NYSE are held through the book-entry system provided by The Depository Trust Company (“DTC”) and are registered in FCA’s register of shareholders in the name of Cede & Co., as DTC’s nominee. Beneficial interests in FCA common shares traded on the MTA are held through Monte Titoli S.p.A., the Italian central clearing and settlement system, as a participant in DTC.
Additional information on FCA’s equity is contained in Note 26, Equity, to the Consolidated Financial Statements included elsewhere in this report.
DirectorsSet forth below is a summary of the material provisions of the Articles of Association relating to our Directors. This summary does not restate the Articles of Association in their entirety.
FCA’s Directors serve on the Board of Directors for a term of approximately one year, with that term ending on the day that the first annual general meeting of shareholders is held in the following calendar year. FCA’s shareholders appoint the directors of the Board of Directors at a general meeting. Each Director may be reappointed for an unlimited number of terms. The general meeting of shareholders determines whether a Director is an executive director or a non-executive director.
FCA has a policy in respect of the remuneration of the members of the Board of Directors. With due observation of the remuneration policy, the Board of Directors may determine the remuneration for directors in respect of the performance of their duties. The Board of Directors must submit plans to award shares or the right to subscribe for shares to the general meeting of shareholders for its approval.
FCA shall not grant the Directors any personal loans or guarantees.
Additional information on the Board of Directors is contained in the Report of the Non-Executive Directors included elsewhere in this report.
No Liability to Further Capital CallsAll of the outstanding FCA common shares and special voting shares are fully paid and non-assessable.

110 2018 | ANNUAL REPORT
Discriminating ProvisionsThere are no provisions of the Articles of Association that discriminate against a shareholder because of its ownership of a substantial number of shares.
Rights of Pre-EmptionUnder Dutch law and the Articles of Association, each FCA shareholder has a right of pre-emption in proportion to the aggregate nominal value of its shareholding upon the issuance of new FCA common shares, or the granting of rights to subscribe for FCA common shares. Exceptions to this right of pre-emption include the issuance of new FCA common shares, or the granting of rights to subscribe for common shares: (i) to employees of FCA or another member of its Group pursuant to an equity incentive plan of FCA; (ii) against payment in kind (contribution other than in cash) and (iii) to persons exercising a previously granted right to subscribe for FCA common shares.
In the event of an issuance of special voting shares, shareholders shall not have any right of pre-emption.
The general meeting of shareholders may resolve to limit or exclude the rights of pre-emption upon an issuance of FCA common shares, which resolution requires approval of at least two-thirds of the votes cast, if less than half of the issued share capital is represented at the general meeting of shareholders. The Articles of Association, or the general meeting of shareholders, may also designate the Board of Directors to resolve to limit or exclude the rights of pre-emption in relation to the issuance of FCA common shares. Pursuant to Dutch law, the designation by the general meeting of shareholders may be granted to the Board of Directors for a specified period of time of not more than five years and only if the Board of Directors has also been designated or is simultaneously designated the authority to resolve to issue FCA common shares. The Board of Directors is designated in the Articles of Association as the competent body to exclude or limit rights of pre-emption for an initial period of five years from October 12, 2014 which may be extended by the general meeting of shareholders with additional periods up to a maximum of five years per period.
Repurchase of SharesUpon agreement with the relevant FCA shareholder, FCA may acquire its own shares at any time for no consideration (om niet), or, subject to certain provisions of Dutch law and the Articles of Association, for consideration if: (i) FCA’s shareholders’ equity less the payment required to make the acquisition does not fall below the sum of called-up and paid-in share capital and any statutory reserves; (ii) FCA would thereafter not hold a pledge over FCA common shares, or together with its subsidiaries, hold FCA common shares with an aggregate nominal value exceeding 50 percent of the FCA’s issued share capital; and (iii) the Board of Directors has been authorized to do so by the general meeting of shareholders.
The acquisition of fully paid-up shares by FCA other than for no consideration (om niet) requires authorization by the general meeting of shareholders. Such authorization may be granted for a period not exceeding 18 months and shall specify the number of shares, the manner in which the shares may be acquired and the price range within which shares may be acquired. The authorization is not required for the acquisition of shares for employees of FCA, or another member of its Group, under a scheme applicable to such employees and no authorization is required for repurchase of shares acquired in certain other limited circumstances in which the acquisition takes place by operation of law, such as pursuant to mergers or demergers. Such shares must be officially listed on the price list of an exchange.
At a general meeting of shareholders, the shareholders may resolve to designate the Board of Directors as the competent body to resolve on FCA acquiring any fully paid up FCA common shares other than for no consideration (om niet) for a period of up to 18 months.
FCA may, jointly with its subsidiaries, hold FCA shares in its own capital exceeding one-tenth of its issued capital for no more than three years after acquisition of such FCA shares for no consideration (om niet) or in certain other limited circumstances in which the acquisition takes place by operation of law, such as pursuant to mergers or demergers. Any FCA shares held by FCA in excess of the amount permitted shall transfer to all members of the Board of Directors jointly at the end of the last day of such a three-year period. Each member of the Board of Directors shall be jointly and severally liable to compensate FCA for the value of the FCA shares at such a time, with interest payable at the statutory rate thereon. The term FCA shares as used in this paragraph shall include depositary receipts for shares and shares in respect of which FCA holds a right of pledge.
Board Report
Corporate Governance

2018 | ANNUAL REPORT 111
No votes may be cast at a general meeting of shareholders on the FCA shares held by FCA or its subsidiaries. In addition, no voting rights may be cast at a general meeting of shareholders in respect of FCA shares for which depositary receipts have been issued that are owned by FCA. Nonetheless, the holders of a right of usufruct or pledge in respect of shares held by FCA and its subsidiaries in FCA’s share capital are not excluded from the right to vote on such shares if the right of usufruct or pledge was granted prior to the time such shares were acquired by FCA or its subsidiaries. Neither FCA nor any of its subsidiaries may cast votes in respect of a share on which it or its subsidiaries holds a right of usufruct or pledge. No right of pledge may be established on special voting shares and the voting rights attributable to special voting shares may not be assigned to a usufructuary.
Reduction of Share CapitalShareholders at a general meeting have the power to cancel shares acquired by FCA or to reduce the nominal value of shares. A resolution to reduce the share capital requires a majority of at least two-thirds of the votes cast at the general meeting of shareholders if less than one-half of the issued capital is present or represented at the meeting. If more than one-half of the issued share capital is present or represented at the general meeting of shareholders, a simple majority of the votes cast is required. Any proposal for a cancellation or reduction of nominal value is subject to general requirements of Dutch law with respect to reductions of share capital.
Transfer of SharesIn accordance with the provisions of Dutch law, pursuant to Article 12 of the Articles of Association, the transfer of FCA shares or the creation of a right in rem thereon requires a deed intended for that purpose and, save when the company is a party, written acknowledgment by the Company of the transfer.
The transfer of FCA common shares that have not been entered into a book-entry system will be effected in accordance with Article 12 of the Articles of Association.
Common shares that have been entered into the DTC book-entry system will be registered in the name of Cede & Co. as nominee for DTC and transfers of beneficial ownership of shares held through DTC will be effected by electronic transfer made by DTC participants. Article 12 of the Articles of Association does not apply to the trading of such FCA common shares on a regulated market or the equivalent thereof.
Transfers of shares held outside of DTC (including Monte Titoli S.p.A. as a participant in DTC) or another direct registration system maintained by Computershare US, FCA’s transfer agent in New York, or the Transfer Agent, and not represented by certificates are effected by a stock transfer instrument and require the written acknowledgment by FCA. Transfer of registered certificates is effected by presenting and surrendering the certificates to the Transfer Agent. A valid transfer requires the registered certificates to be properly endorsed for transfer as provided for in the certificates and accompanied by proper instruments of transfer and stock transfer tax stamps for, or funds to pay, any applicable stock transfer taxes.
FCA common shares are freely transferable. As described below, special voting shares are generally not transferable.
At any time, a holder of FCA common shares that are registered in the Loyalty Register (i.e. Electing Common Shares or Qualifying Common Shares) wishing to transfer such FCA common shares other than in limited specified circumstances (i.e., transfers to affiliates or to relatives through succession, donation or other transfers) must first request a de-registration of such shares from the Loyalty Register and, if held outside the Regular Trading System, transfer such common shares back into the Regular Trading System. After de-registration from the Loyalty Register, such FCA common shares no longer qualify as Electing Common Shares or Qualifying Common Shares and, as a result, the holder of such FCA common shares is required to offer and transfer the special voting shares associated with such FCA common shares that were previously Qualifying Common Shares to FCA for no consideration (om niet) as described in detail in “Loyalty Voting Structure-Terms and Conditions of the Special Voting Shares-Withdrawal of Special Voting Shares”.
Exchange ControlsUnder Dutch law, there are no foreign exchange control restrictions on investments in, or payments on, FCA common shares. There are no special restrictions in the Articles of Association or Dutch law that limit the right of shareholders who are not citizens or residents of the Netherlands to hold FCA common shares or vote.

112 2018 | ANNUAL REPORT
Annual Accounts and Independent AuditorFCA’s financial year is the calendar year. Pursuant to FCA’s deed of incorporation, the first financial year of FCA ended on December 31, 2014. Within four months after the end of each financial year, the Board of Directors will prepare and publish the annual accounts, which must be accompanied by an annual report and an auditor’s report, and make those available for inspection at FCA’s registered office. All members of the Board of Directors are required to sign the annual accounts and in case the signature of any member is missing, the reason for this must be stated. The annual accounts are to be adopted by the general meeting of shareholders at the annual general meeting, at which meeting the members of the Board of Directors will be discharged from liability for performance of their duties with respect to any matter disclosed in the annual accounts for the relevant financial year insofar this appears from the annual accounts. The annual accounts, the annual report and independent auditor’s report are made available through FCA’s website to the shareholders for review as from the day of the notice convening the annual general meeting of shareholders.
Payment of DividendsInformation on the payment of dividends is contained in the section “OTHER INFORMATION” elsewhere in this report.
Amendments to the Articles of Association, including Variation of RightsA resolution of the general meeting of shareholders to amend the Articles of Association or to wind up FCA may be approved only if proposed by the Board of Directors and approved by a vote of a majority of at least two-thirds of the votes cast if less than one-half of the issued share capital is present or represented at such a general meeting of shareholders.
The rights of shareholders may be changed only by amending the Articles of Association in compliance with Dutch law.
Dissolution and LiquidationThe general meeting of shareholders may resolve to dissolve FCA upon a proposal of the Board of Directors thereto. A majority of at least two-thirds of the votes cast shall be required if less than one-half of the issued capital is present or represented at the meeting. In the event of dissolution, FCA will be liquidated in accordance with Dutch law and the Articles of Association and the liquidation shall be arranged by the members of the Board of Directors, unless the general meeting of shareholders appoints other liquidators. During liquidation, the provisions of the Articles of Association will remain in force as long as possible.
If FCA is dissolved and liquidated, whatever remains of FCA’s equity after all its debts have been discharged shall first be applied to distribute the aggregate balance of share premium reserves and other reserves (other than the special dividend reserve), to holders of FCA common shares in proportion to the aggregate nominal value of FCA common shares held by each holder; secondly, from any balance remaining, an amount equal to the aggregate amount of the nominal value of FCA common shares will be distributed to the holders of FCA common shares in proportion to the aggregate nominal value of FCA common shares held by each of them; thirdly, from any balance remaining, an amount equal to the aggregate amount of the special voting shares dividend reserve will be distributed to the holders of special voting shares in proportion to the aggregate nominal value of the special voting shares held by each of them; fourthly, from any balance remaining, the aggregate amount of the nominal value of the special voting shares will be distributed to the holders of special voting shares in proportion to the aggregate nominal value of the special voting shares held by each of them; and, lastly, any balance remaining will be distributed to the holders of FCA common shares in proportion to the aggregate nominal value of FCA common shares held by each of them.
Liability of DirectorsUnder Dutch law, the management of a company with a one-tier board structure like FCA is a joint undertaking and each member of the Board of Directors can be held jointly and severally liable to FCA for damages in the event of improper or negligent performance of their duties. Furthermore, members of the Board of Directors can be held liable to third parties based on tort, pursuant to certain provisions of the Dutch Civil Code. All Directors are jointly and severally liable for failure of one or more co-Directors. An individual Director is only exempted from liability if he or she proves that he or she cannot be held seriously culpable for the mismanagement and that he or she has not been negligent in seeking to prevent the consequences of the mismanagement. In this regard a Director may, however, refer to the allocation of tasks between the Directors. In certain circumstances, Directors may incur additional specific civil and criminal liabilities.
Board Report
Corporate Governance

2018 | ANNUAL REPORT 113
Election and Removal of DirectorsFCA’s Articles of Association provide that FCA’s Board of Directors shall be composed of three or more members.
Directors are appointed by a simple majority of the votes validly cast at a general meeting of shareholders. The general meeting of shareholders may at any time suspend or dismiss any Director.
Loyalty Voting StructureThe Company implemented a loyalty voting structure, pursuant to which the former shareholders of Fiat S.p.A. were able to elect to receive one special voting share with a nominal value of €0.01 per share for each common share they were entitled to receive in the Merger, provided that they fulfilled the requirements described in the terms and conditions of the special voting shares. Such shareholders had their common shares registered in a separate register (the “Loyalty Register”) of the Company’s shareholders register. Following this registration, a corresponding number of special voting shares were allocated to the above-mentioned Shareholders. By signing an election form, the execution of which was necessary to elect to receive special voting shares, shareholders also agreed to be bound by the terms and conditions thereof, including the transfer restrictions described below.
Following the completion of the Merger, shareholders may at any time elect to participate in the loyalty voting structure by requesting that the Company registers all or some of their common shares in the Loyalty Register. If these common shares have been registered in the Loyalty Register (and thus blocked from trading in the regular trading system) for an uninterrupted period of three years in the name of the same shareholder, such shares become eligible to receive special voting shares (the “Qualifying Common Shares”) and the relevant shareholder will be entitled to receive one special voting share for each such Qualifying Common Share. If, at any time, such common shares are de-registered from the Loyalty Register for whatever reason, the relevant shareholder shall lose its entitlement to hold a corresponding number of special voting shares.
A holder of Qualifying Common Shares may at any time request the de-registration of some or all such shares from the Loyalty Register, which will allow such shareholder to freely trade its common shares. From the moment of such a request, the holder of Qualifying Common Shares shall be considered to have waived his or her rights to cast any votes associated with such Qualifying Common Shares. Upon the de-registration from the Loyalty Register, the relevant shares will therefore cease to be Qualifying Common Shares. Any de-registration request would automatically trigger a mandatory transfer requirement pursuant to which the special voting shares will be acquired by the Company for no consideration (om niet) in accordance with the terms and conditions of the special voting shares.
The Company’s common shares are freely transferable. However, any transfer or disposal of the Company’s common shares with which special voting shares are associated would trigger the de-registration of such common shares from the Loyalty Register and the transfer of all relevant special voting shares to the Company. Special voting shares are not admitted to listing and are transferable only in very limited circumstances. In particular, no shareholder shall, directly or indirectly: (a) sell, dispose of or transfer any special voting share or otherwise grant any right or interest therein; or (b) create or permit to exist any pledge, lien, fixed or floating charge or other encumbrance over any special voting share or any interest in any special voting share.
The purpose of the loyalty voting structure is to grant long-term shareholders an extra voting right by means of granting a special voting share (shareholders holding special voting shares are entitled to exercise one vote for each special voting share held and one vote for each common share held), without entitling such shareholders to any economic rights, other than those pertaining to the common shares. However, under Dutch law, the special voting shares cannot be totally excluded from economic entitlements. As a result, pursuant to the Articles of Association, holders of special voting shares are entitled to a minimum dividend, which is allocated to a separate special dividend reserve (the “Special Dividend Reserve”). A distribution from the Special Dividend Reserve or the (partial) release of the Special Dividend Reserve, will require a prior proposal from the Board of Directors and a subsequent resolution of the meeting of holders of special voting shares. The power to vote upon the distribution from the Special Dividend Reserve is the only power that is granted to that meeting, which can only be convened by the Board of Directors as it deems necessary. The special voting shares do not have any other economic entitlement.

114 2018 | ANNUAL REPORT
Section 10 of the terms and conditions of the special voting shares includes liquidated damages provisions intended to discourage any attempt by holders to violate the terms thereof. These liquidated damages provisions may be enforced by the Company by means of a legal action brought by the Company in the courts of the Netherlands. In particular, a violation of the provisions of the above-mentioned terms and conditions concerning the transfer of special voting shares may lead to the imposition of liquidated damages.
Pursuant to Section 12 of the terms and conditions of the special voting shares, any amendment to the terms and conditions (other than merely technical, non-material amendments) may only be made with the approval of the shareholders at a general meeting of FCA shareholders.
Terms and Conditions of the Special Voting SharesThe terms and conditions of the special voting shares apply to the issuance, allocation, acquisition, holding, repurchase and transfer of special voting shares in the share capital of FCA and to certain aspects of Electing Common Shares, Qualifying Common Shares and FCA common shares which are, or will be, registered in the Loyalty Register.
Application for Special Voting SharesAn FCA shareholder may at any time elect to participate in the loyalty voting structure by requesting that FCA register all or some of the number of FCA common shares held by such an FCA shareholder in the Loyalty Register. Such an election shall be effective and registration in the Loyalty Register shall occur as of the end of the calendar month during which the election is made. If such FCA common shares (i.e. Electing Common Shares) have been registered in the Loyalty Register (and are thus blocked from trading in the Regular Trading System) for an uninterrupted period of three years in the name of the same shareholder, the holder of such FCA common shares will be entitled to receive one FCA special voting share for each such FCA common share that has been registered. If at any moment in time such FCA common shares are de-registered from the Loyalty Register for whatever reason, the relevant shareholder loses its entitlement to hold a corresponding number of FCA special voting shares.
Withdrawal of Special Voting SharesAs described above, a holder of Qualifying Common Shares or Electing Common Shares may request that some or all of its Qualifying Common Shares or Electing Common Shares be de-registered from the Loyalty Register and, if held outside the Regular Trading System, transfer such shares back to the Regular Trading System, which will allow such a shareholder to freely trade its FCA common shares, as described below. From the moment of such a request, the holder of Qualifying Common Shares shall be considered to have waived his rights to cast any votes associated with the FCA special voting shares which were issued and allocated in respect of such Qualifying Common Shares. Any such request would automatically trigger a mandatory transfer requirement pursuant to which the FCA special voting shares will be offered and transferred to FCA for no consideration (om niet) in accordance with the Articles of Association and the terms and conditions of the special voting shares. FCA may continue to hold the special voting shares as treasury stock, but will not be entitled to vote through any such treasury stock. Alternatively, FCA may withdraw and cancel the special voting shares, as a result of which the nominal value of such shares will be allocated to the special capital reserves of FCA. Consequently, the loyalty voting feature relating to the relevant Qualifying Common Shares being deregistered from the Loyalty Register will terminate. No shareholder required to transfer special voting shares, pursuant to the terms and conditions, shall be entitled to any consideration for such special voting shares and each shareholder expressly waives any rights in that respect as a condition to participation in the loyalty voting structure.
Board Report
Corporate Governance

2018 | ANNUAL REPORT 115
Change of ControlA Qualifying Shareholder or a shareholder with common shares registered in the Loyalty Register must promptly notify the Company in the event of a change of control and must make a de-registration request with respect to his or her common shares registered in the Loyalty Register. The de-registration request leads to a withdrawal of the special voting shares as described above. A change of control is defined in Article 1.1. of the Articles of Association as including any direct or indirect transfer carried out by a shareholder that is not an individual (natuurlijk persoon) through one or a series of related transactions as a result of which (i) a majority of the voting rights of such a shareholder; (ii) the de facto ability to direct the casting of a majority of the votes exercisable at general meetings of FCA shareholders of such a shareholder; and/or (iii) the ability to appoint or remove a majority of the directors, executive directors or board members or executive officers of such a shareholder or to direct the casting of a majority or more of the voting rights at meetings of the board of directors, governing body or executive committee of such a shareholder has been transferred to a new owner. No change of control shall be deemed to have occurred if (a) the transfer of ownership and/or control is an intragroup transfer under the same parent company; (b) the transfer of ownership and/or control is the result of the succession or the liquidation of assets between spouses or the inheritance, inter vivo donation or other transfer to a spouse or a relative up to and including the fourth degree; or (c) the fair market value of the Qualifying Common Shares held by such a shareholder represents less than twenty percent (20%) of the total assets of the Transferred Group at the time of the transfer and the Qualifying Common Shares held by such a shareholder, in the sole judgment of the Company, are not otherwise material to the Transferred Group or the change of control transaction.
Article 1.1 of the Articles of Association defines “Transferred Group” as comprising the relevant shareholder together with its affiliates, if any, over which control was transferred as part of the same change of control transaction, as defined in the above-mentioned Article of the Articles of Association.
General Meeting of Shareholders and Voting Rights
General MeetingsAt least one general meeting of FCA shareholders shall be held every year, which shall be held within six months after the close of the financial year. The purpose of the annual general meeting of shareholders is to discuss, inter alia, the annual report, the adoption of the annual accounts, allocation of profits (including the proposal to distribute dividends), release of members of the Board of Directors from liability for their management and supervision, and other proposals brought up for discussion by the Board of Directors.
Furthermore, general meetings of FCA shareholders shall be held in the case referred to in Section 2:108a of the Dutch Civil Code as often as the Board of Directors, the Chairman or the Chief Executive Officer deem it necessary to hold them or as otherwise required by Dutch law, without prejudice to what has been provided in the next paragraph hereof.
Shareholders solely or jointly representing at least ten percent (10%) of the issued share capital may request in writing, stating the matters to be dealt with, that the Board of Directors call a general meeting of FCA shareholders.
If the Board of Directors fails to call a meeting, then such shareholders may, on their application, be authorized by the interim provisions judge of the court (voorzieningenrechter van de rechtbank) to convene a general meeting of FCA shareholders. The interim provisions judge (voorzieningenrechter van de rechtbank) shall reject the application if he or she is not satisfied that the applicants have previously requested in writing, stating the exact subjects to be discussed, that the Board of Directors convene a general meeting of FCA shareholders.
General meetings of FCA shareholders shall be held in Amsterdam or Haarlemmermeer (Schiphol Airport), the Netherlands, and shall be called by the Board of Directors, the Chairman or the Chief Executive Officer, in such manner as is required to comply with the law and the applicable stock exchange regulations, not later than on the forty-second day prior to the day of the meeting. All convocations of general meetings of FCA shareholders and all announcements, notifications and communications to shareholders shall be made by means of an announcement on the Company’s corporate website and such an announcement shall remain accessible until the relevant general meeting of FCA shareholders.

116 2018 | ANNUAL REPORT
Any communication to be addressed to the general meeting of FCA shareholders by virtue of Dutch law or the Articles of Association may be either included in the notice referred to in the preceding sentence or, to the extent provided for in such notice, on the Company’s corporate website and/or in a document made available for inspection at the office of the Company and such other place(s) as the Board of Directors shall determine. Convocations of general meetings of FCA shareholders may be sent to shareholders through the use of an electronic means of communication to the address provided by such shareholders to the Company for this purpose. The notice shall state the place, date and hour of the meeting and the agenda of the meeting as well as the other data required by law. An item proposed in writing by such a number of shareholders who, under Dutch law, are entitled to make such proposal, shall be included in the notice or shall be announced in a manner similar to the announcement of the notice, provided that the Company has received the relevant request, including the reasons for putting the relevant item on the agenda, no later than the sixtieth day before the day of the meeting.
Convocation, Agenda, Minutes and AttendanceThe agenda of the annual general meeting of FCA shareholders shall contain, inter alia, the following items:
a) adoption of the annual accounts;
b) the implementation of the remuneration policy;
c) the policy of the Company on additions to reserves and on dividends, if any;
d) granting of discharge to the Directors in respect of the performance of their duties in the relevant financial year;
e) the appointment of Directors;
f) if applicable, the proposal to pay a dividend;
g) if applicable, discussion of any substantial change in the corporate governance structure of the Company; and
h) any matters decided upon by the person(s) convening the meeting and any matters placed on the agenda with due observance of applicable Dutch law.
The Board of Directors shall provide the general meeting of FCA shareholders with all requested information, unless this would be contrary to an overriding interest of the Company. If the Board of Directors invokes an overriding interest, it must give reasons.
When convening a general meeting of FCA shareholders, the Board of Directors shall determine that, for the purpose of Article 19 and Article 20 of the Articles of Association, persons with the right to vote or attend meetings shall be considered those persons who have these rights at the twenty-eighth day prior to the day of the meeting (the “Record Date”) and are registered as such in a register to be designated by the Board of Directors for such purpose, irrespective of whether they will have these rights at the date of the meeting. In addition to the Record Date, the notice of the meeting shall further state the manner in which shareholders and other parties with meeting rights may have themselves registered and the manner in which those rights can be exercised.
The general meeting of FCA shareholders shall be presided over by the Chairman or, in his absence, by the person chosen by the Board of Directors to act as chairman for such a meeting. One of the persons present designated for that purpose by the chairman of the meeting shall act as secretary and take minutes of the business transacted.
The minutes shall be confirmed by the chairman and secretary of the meeting and signed by them in witness thereof. The minutes of the general meeting of FCA shareholders shall be made available, on request, to shareholders no later than three months after the end of the meeting, after which shareholders shall have the opportunity to react to the minutes in the following three months. The minutes shall then be adopted in the manner as described in the preceding paragraph. If an official notarial record is made of the business transacted at the meeting then minutes need not be drawn up and it shall suffice that the official notarial record be signed by the notary.
Board Report
Corporate Governance

2018 | ANNUAL REPORT 117
As a prerequisite to attending the meeting and, to the extent applicable, exercising voting rights, the shareholders entitled to attend the meeting shall be obliged to inform the Board of Directors in writing within the time frame mentioned in the convening notice. At the latest, this notice must be received by the Board of Directors on the day mentioned in the convening notice. Shareholders and those permitted by Dutch law to attend the general meetings of FCA shareholders may cause themselves to be represented at any meeting by a proxy duly authorized in writing, provided they notify the Company in writing of their wish to be represented at such time and place as shall be stated in the notice of the meetings. For the avoidance of doubt, such attorney is also authorized in writing if the proxy is documented electronically. The Board of Directors may determine further rules concerning the deposit of the powers of attorney; these shall be mentioned in the notice of the meeting. The chairman of the meeting shall decide on the admittance to the meeting of persons other than those who are entitled to attend.
For each general meeting of FCA shareholders, the Board of Directors may decide that shareholders shall be entitled to attend, address and exercise voting rights at such a meeting through the use of electronic means of communication, provided that shareholders who participate in the meeting are capable of being identified through the electronic means of communication and have direct cognizance of the discussions at the meeting and the exercising of voting rights (if applicable). The Board of Directors may set requirements for the use of electronic means of communication and state these in the convening notice. Furthermore, the Board of Directors may, for each general meeting of FCA shareholders, decide that votes cast by the use of electronic means of communication prior to the meeting and received by the Board of Directors shall be considered to be votes cast at the meeting. Such votes may not be cast prior to the Record Date. Whether the provision of the foregoing sentence applies and the procedure for exercising the rights referred to in that sentence shall be stated in the notice.
Prior to being allowed admittance to a meeting, a shareholder and each person entitled to attend the meeting, or its attorney, shall sign an attendance list, while stating his or her name and, to the extent applicable, the number of votes to which he or she is entitled. Each shareholder and other person attending a meeting by the use of electronic means of communication and identified in accordance with the above shall be registered on the attendance list by the Board of Directors. In the event that it concerns an attorney of a shareholder or another person entitled to attend the meeting, the name(s) of the person(s) on whose behalf the attorney is acting, shall also be stated. The chairman of the meeting may decide that the attendance list must also be signed by other persons present at the meeting.
The chairman of the meeting may determine the time during which shareholders and others entitled to attend the general meeting of FCA shareholders may speak, if he considers this desirable, with a view to the orderly conduct of the meeting as well as other procedures that the chairman considers desirable for the efficient and orderly conduct of the business of the meeting.
FCA is exempt from the proxy rules under the U.S. Securities Exchange Act of 1934, as amended. The chairman of the meeting shall decide on the admittance to the meeting of persons other than those who are entitled to attend.
Voting Rights at General MeetingsEvery share (whether common or special voting) shall confer the right to cast one vote at a general meeting of shareholders. Shares in respect of which Dutch law determines that no votes may be cast shall be disregarded for the purposes of determining the proportion of shareholders voting, present or represented or the proportion of the share capital present or represented. All resolutions shall be passed with an absolute majority of the votes validly cast unless otherwise specified in the Articles of Association. Blank votes shall not be counted as votes cast.
All votes shall be cast in writing or electronically. The chairman of the meeting may, however, determine that voting by raising hands or in another manner shall be permitted. Voting by acclamation shall be permitted if none of the shareholders present or represented objects. No voting rights shall be exercised in the general meeting of FCA shareholders for shares owned by the Company or by a subsidiary of the Company. However, pledgees and usufructuaries of shares owned by the Company and its subsidiaries shall not be excluded from exercising their voting rights if the right of pledge or usufruct was created before the shares were owned by the Company or a subsidiary. Neither the Company nor any of its subsidiaries may exercise voting rights for shares in respect of which it holds a right of pledge or usufruct.

118 2018 | ANNUAL REPORT
Without prejudice to the Articles of Association, the Company shall determine for each resolution passed:
a) the number of shares on which valid votes have been cast;
b) the percentage that the number of shares as referred to under (a) represents in the issued share capital;
c) the aggregate number of votes validly cast; and
d) the aggregate number of votes cast in favor of and against a resolution, as well as the number of abstentions.
Shareholders’ Votes on Certain TransactionsAny important change in the identity or character of FCA must be approved by the general meeting of shareholders, including (i) the transfer to a third party of the business of FCA or practically the entire business of FCA; (ii) the entry into or breaking off of any long-term cooperation of FCA or a subsidiary with another legal entity or company or as a fully liable partner of a general partnership or limited partnership, where such entry into or breaking off is of far-reaching importance to FCA; and (iii) the acquisition or disposal by FCA or a subsidiary of an interest in the capital of a company with a value of at least one-third of FCA’s assets according to the Consolidated Statement of Financial Position with explanatory notes included in the last adopted annual accounts of FCA.
Issuance of sharesThe general meeting of FCA shareholders, or alternatively the Board of Directors if it has been designated to do so at the general meeting of FCA shareholders, shall have authority to resolve on any issuance of shares and rights to subscribe for shares. The general meeting of FCA shareholders shall, for as long as any such designation of the Board of Directors for this purpose is in force, no longer have authority to decide on the issuance of shares and rights to subscribe for shares.
For a period of five years from October 12, 2014, the Board of Directors has been irrevocably authorized to issue shares and rights to subscribe for shares up to the maximum aggregate amount of shares as provided for in the Company’s authorized share capital as set out in Article 4.1 of the Articles of Association, as amended from time to time.
The general meeting of FCA shareholders, or the Board of Directors if so designated in accordance with the Articles of Association, shall decide on the price and the further terms and conditions of issuance, with due observance of what has been provided in relation thereto in Dutch law and the Articles of Association.
If the Board of Directors is designated to have authority to decide on the issuance of shares or rights to subscribe for shares, such a designation shall specify the class of shares and the maximum number of shares or rights to subscribe for shares that can be issued under such a designation. When making such designation the duration thereof, which shall not be for more than five years, shall be resolved upon at the same time. The designation may be extended from time to time for periods not exceeding five years. The designation may not be withdrawn unless otherwise provided in the resolution in which the designation is made.
Payment for shares shall be made in cash unless another form of consideration has been agreed. Payment in a currency other than euro may only be made with the consent of the Company.
The Board of Directors has also been designated as the authorized body to limit or exclude the rights of pre-emption of shareholders in connection with the authority of the Board of Directors to issue common shares and grant rights to subscribe for common shares as referred to above. Refer to the Rights of Pre-Emption section elsewhere in this report.
In the event of an issuance of common shares every holder of common shares shall have a right of pre-emption with regard to the common shares or rights to subscribe for common shares to be issued in proportion to the aggregate nominal value of his common shares, provided however that no such right of pre-emption shall exist in respect of shares or rights to subscribe for common shares to be issued to employees of the Company or of a group company pursuant to any option plan of the Company.
A shareholder shall have no right of pre-emption for shares that are issued against a non-cash contribution.
In the event of an issuance of special voting shares to qualifying shareholders, shareholders shall not have any right of pre-emption.
Board Report
Corporate Governance

2018 | ANNUAL REPORT 119
The general meeting of FCA shareholders or the Board of Directors, as the case may be, shall decide when passing the resolution to issue shares or rights to subscribe for shares in which manner the shares shall be issued and, to the extent that rights of pre-emption apply, within what period those rights may be exercised.
Disclosure of Holdings under Dutch LawAs a result of the listing of the FCA common shares on the MTA, chapter 5.3 of the Dutch Financial Supervision Act (“AFS”) applies, pursuant to which any person who, directly or indirectly, acquires or disposes of an actual or potential capital interest and/or actual or potential voting rights in FCA must promptly give written notice to the AFM of such acquisition or disposal by means of a standard form if, as a result of such acquisition or disposal, the percentage of capital interest and/or voting rights held by such person reaches, exceeds or falls below the following thresholds: 3 percent, 5 percent, 10 percent, 15 percent, 20 percent, 25 percent, 30 percent, 40 percent, 50 percent, 60 percent, 75 percent and 95 percent.
For the purpose of calculating the percentage of capital interest or voting rights, the following interests must, inter alia, be taken into account: (i) shares and/or voting rights directly held (or acquired or disposed of) by any person; (ii) shares and/or voting rights held (or, acquired or disposed of) by such person’s controlled entities or by a third party for such person’s account; (iii) voting rights held (or acquired or disposed of) by a third party with whom such person has concluded an oral or written voting agreement; (iv) voting rights acquired pursuant to an agreement providing for a temporary transfer of voting rights in consideration for a payment; and (v) shares which such person, or any controlled entity or third party referred to above, may acquire pursuant to any option or other right to acquire shares.
As a consequence of the above, special voting shares must be added to FCA common shares for the purposes of the above thresholds.
Controlled entities (within the meaning of the AFS) do not themselves have notification obligations under the AFS as their direct and indirect interests are attributed to their (ultimate) parent. If a person who has a three percent or larger interest in FCA’s share capital or voting rights ceases to be a controlled entity it must immediately notify the AFM and all notification obligations under the AFS will become applicable to such former controlled entity.
Special rules apply to the attribution of shares and/or voting rights which are part of the property of a partnership or other form of joint ownership. A holder of a pledge or right of usufruct in respect of shares can also be subject to notification obligations if such person has, or can acquire, the right to vote on the shares. The acquisition of (conditional) voting rights by a pledgee or beneficial owner may also trigger notification obligations as if the pledgee or beneficial owner were the legal holder of the shares and/or voting rights.
Furthermore, when calculating the percentage of capital interest, a person is also considered to be in possession of shares if (i) such person holds a financial instrument the value of which is (in part) determined by the value of the shares or any distributions associated therewith and which does not entitle such person to acquire any shares; (ii) such person may be obliged to purchase shares on the basis of an option; or (iii) such person has concluded another contract whereby such person acquires an economic interest comparable to that of holding a share.
If a person’s capital interest and/or voting rights reaches, exceeds or falls below the above-mentioned thresholds as a result of a change in FCA’s issued and outstanding share capital or voting rights, such person is required to make a notification not later than on the fourth trading day after the AFM has published FCA’s notification as described below.
Following the implementation of Directive 2013/50/EU into the AFS, every holder of three percent or more of the issued and outstanding share capital or voting rights whose interest has changed compared to his most recent notification and which holder knows, or should know, that pursuant to this change his interest reaches or crosses a threshold as a result of certain acts (as described above and including the exchange of a financial instrument or a contract pursuant to which the holder is deemed to have issued and outstanding shares or voting rights at his disposal), must notify the AFM of this change.
FCA is required to notify the AFM promptly of any change of one percent or more in its issued and outstanding share capital or voting rights since a previous notification. Other changes in FCA’s issued and outstanding share capital or voting rights must be notified to the AFM within eight days after the end of the quarter in which the change occurred.

120 2018 | ANNUAL REPORT
In addition to the above described notification obligations pertaining to capital interest or voting rights, pursuant to Regulation (EU) No 236/2012, as amended, notification must be made of any net short position of 0.2 percent in the issued share capital of FCA, and of every subsequent 0.1 percent above this threshold. Notifications starting at 0.5 percent and every subsequent 0.1 percent above this threshold will be made public via the short selling register of the AFM. Furthermore, gross short positions shall be notified in the event that a threshold is reached, exceeded or fallen below. With regard to gross short positions, the same disclosure thresholds as for holders of capital interests and/or voting rights apply.
Furthermore, each member of the Board of Directors must notify the AFM:
within two weeks after his/her appointment of the number of shares he/she holds and the number of votes he/she is entitled to cast in respect of FCA’s issued and outstanding share capital; and
subsequently of each change in the number of shares he/she holds and of each change in the number of votes he/she is entitled to cast in respect of FCA’s issued and outstanding share capital, immediately after the relevant change.
The AFM keeps a public register of all notifications made pursuant to these disclosure obligations and publishes any notification received which can be accessed via www.afm.nl. The notifications referred to in this paragraph should be made in writing by means of a standard form or electronically through the notification system of the AFM.
Non-compliance with these disclosure obligations is an economic offense and may lead to criminal prosecution. The AFM may impose administrative penalties for non-compliance and the publication thereof. In addition, a civil court can impose measures against any person who fails to notify or incorrectly notifies the AFM of matters required to be notified. A claim requiring that such measures be imposed may be instituted by FCA and/or by one or more shareholders who alone or together with others represent at least three percent of the issued and outstanding share capital of FCA or are able to exercise at least three percent of the voting rights. The measures that the civil court may impose include:
an order requiring appropriate disclosure;
suspension of the right to exercise the voting rights for a period of up to three years as determined by the court;
voiding a resolution adopted by the general meeting of shareholders, if the court determines that the resolution would not have been adopted but for the exercise of the voting rights of the person with a duty to disclose, or suspension of a resolution adopted by the general meeting of shareholders until the court makes a decision about such voiding; and
an order to refrain, during a period of up to five years as determined by the court, from acquiring shares and/or voting rights in FCA.
Shareholders are advised to consult with their own legal advisers to determine whether the disclosure obligations apply to them.
Mandatory Bid RequirementUnder Dutch law, any person who, acting alone or in concert with others, directly or indirectly acquires 30 percent or more of FCA’s voting rights will be obliged to launch a public offer for all outstanding shares in FCA’s share capital. An exception is made for shareholders who, whether alone or acting in concert with others, had an interest of at least 30 percent of FCA’s voting rights before the shares were first listed on the MTA and who still maintained such an interest after such first listing. Immediately after the first listing of FCA common shares on the MTA, Exor N.V. held more than 30 percent of FCA’s voting rights. Therefore, Exor N.V.’s interest in FCA was grandfathered and the exception that applies to it will continue to apply to it for as long as its holding of shares represents over 30 percent of FCA’s voting rights.
Board Report
Corporate Governance

2018 | ANNUAL REPORT 121
Dutch Financial Reporting Supervision ActOn the basis of the Dutch Financial Reporting Supervision Act (Wet toezicht financiële verslaggeving, or the “FRSA”), the AFM supervises the application of financial reporting standards by, amongst others, companies whose corporate seat is in the Netherlands and whose securities are listed on a regulated Dutch or foreign stock exchange.
Pursuant to the FRSA, the AFM has an independent right to (i) request an explanation from FCA regarding its application of the applicable financial reporting standards and (ii) recommend to us the making available of further explanations. If we do not comply with such a request or recommendation, the AFM may request that the Enterprise Chamber order us to (i) make available further explanations as recommended by the AFM; (ii) provide an explanation of the way we have applied the applicable financial reporting standards to our financial reports; or (iii) prepare our financial reports in accordance with the Enterprise Chamber’s instructions.
Compulsory AcquisitionPursuant to article 2:92a of the Dutch Civil Code, a shareholder who, for its own account, holds at least 95 percent of the issued share capital of FCA may institute proceedings against the other shareholders jointly for the transfer of their shares to it. The proceedings are held before the Dutch Enterprise Chamber and can be instituted by means of a writ of summons served upon each of the minority shareholders in accordance with the provisions of the Dutch Code of Civil Procedure. The Enterprise Chamber may grant the claim for the squeeze-out in relation to all minority shareholders and will determine the price to be paid for the shares, if necessary after appointment of one to three expert(s) who will offer an opinion to the Enterprise Chamber on the value to be paid for the shares of the minority shareholders. Once the order to transfer becomes final before the Enterprise Chamber, the person acquiring the shares must give written notice of the date and place of payment and the price to the holders of the shares to be acquired whose addresses are known to it. Unless the addresses of all of them are known to it, it must also publish the same in a Dutch daily newspaper with a national circulation. A shareholder can only appeal against the judgment of the Enterprise Chamber before the Dutch Supreme Court.
In addition, pursuant to article 2:359c of the Dutch Civil Code, following a public offer, a holder of at least 95 percent of the issued share capital and of voting rights of FCA has the right to require the minority shareholders to sell their shares to it. Any such request must be filed with the Enterprise Chamber within three months after the end of the acceptance period of the public offer. Conversely, pursuant to article 2:359d of the Dutch Civil Code each minority shareholder has the right to require the holder of at least 95 percent of the issued share capital and the voting rights of FCA to purchase its shares in such a case. The minority shareholder must file such a claim with the Enterprise Chamber within three months after the end of the acceptance period of the public offer.
Disclosure of Trades in Listed SecuritiesPursuant to the AFS and the Market Abuse Regulation (EU) No 596/2014, each of the members of the Board of Directors and any other person discharging managerial responsibilities within FCA and who in that capacity is authorized to make decisions affecting the future developments and business prospects of FCA and has regular access to inside information relating, directly or indirectly, to FCA (each, an “Insider”) must notify the AFM of all transactions, conducted or carried out for his/her own account, relating to FCA common shares, special voting shares or financial instruments, the value of which is (in part) determined by the value of FCA common shares or special voting shares.
In addition, persons who are closely associated with members of the Board of Directors or any of the other Insiders must notify the AFM of all transactions conducted for their own account relating to FCA’s shares or financial instruments, the value of which is (in part) determined by the value of FCA’s shares. The Market Abuse Regulation designates the following categories of persons: (i) the spouse or any partner considered by applicable law as equivalent to the spouse; (ii) dependent children; (iii) other relatives who have shared the same household for at least one year at the relevant transaction date; and (iv) any legal person, trust or partnership, among other things, whose managerial responsibilities are discharged by a member of the Board of Directors or any other Insider or by a person referred to under (i), (ii) or (iii) above.

122 2018 | ANNUAL REPORT
Board Report
Corporate Governance
The AFM must be notified forthwith of transactions, effected in either FCA’s shares or financial instruments, the value of which is (in part) determined by the value of FCA’s shares following the transaction date by means of a standard form. Notifications under the Market Abuse Regulation may however be postponed until the date that the value of the transactions carried out on a person’s own account, together with the transactions carried out by the persons associated with that person, reaches or exceeds the amount of €5,000 in the calendar year in question. The AFM keeps a public register of all notifications made pursuant to the AFS and the Market Abuse Regulation.
Non-compliance with these reporting obligations could lead to criminal penalties, administrative fines and cease-and-desist orders (and the publication thereof), imprisonment or other sanctions.
Shareholder Disclosure and Reporting Obligations under U.S. LawHolders of FCA shares are subject to certain U.S. reporting requirements under the Exchange Act for shareholders owning more than 5 percent of any class of equity securities registered pursuant to Section 12 of the Exchange Act. Among the reporting requirements are disclosure obligations intended to keep investors aware of significant accumulations of shares that may lead to a change of control of an issuer.
If FCA were to fail to qualify as a foreign private issuer in the future, Section 16(a) of the Exchange Act would require FCA’s directors and executive officers, and persons who own more than ten percent of a registered class of FCA’s equity securities, to file reports of ownership of, and transactions in, FCA’s equity securities with the SEC. Such directors, executive officers and ten percent stockholders would also be required to furnish FCA with copies of all Section 16 reports they file.
Disclosure Requirements under Italian law and European Union lawFurther disclosure requirements shall apply to FCA under Italian law by virtue of the listing of FCA’s shares on the MTA. Summarized below are the most significant requirements to be complied with by FCA in connection with the admission to listing of FCA common shares on the MTA. The breach of the obligations described below may result in the application of fines and criminal penalties (including, for instance, those provided for insider trading and market manipulation).
In particular, the following main disclosure obligations shall apply to FCA:
the Legislative Decree no. 58/1998, or the Italian Financial Act effective as of the date of this report: article 92 (equal treatment principle), article 114-bis (to the extent applicable to Dutch companies, information concerning the allocation of financial instruments to corporate officers, employees and collaborators), article 115 (information to be disclosed to CONSOB) and article 180 and the following (relating to insider trading and market manipulation);
the applicable law concerning market abuse and, in particular, Regulation (UE) 596/2014 (the “MAR Regulation”) and its implementing measures: article 7 (Inside information), article 17 (Public disclosure of inside information) and article 18 (Insider lists) as well as the implementing regulations.
In addition to the above, the applicable provisions set forth under the market rules (including those relating to the timing for the payment of dividends) shall apply to FCA.
It remains understood that the foregoing is based on the current legal framework and, therefore, it may vary following any potential regulatory intervention by the concerned Member States and competent authorities.

2018 | ANNUAL REPORT 123
Disclosure of Inside Information - Article 17 of the MAR RegulationPursuant to the MAR Regulation, FCA shall disclose to the public, without delay, any inside information which: (i) is of a precise nature; (ii) has not been made public; (iii) relates directly to FCA or FCA’s common shares; and (iv) if it were made public, would be likely to have a significant effect on the prices of FCA’s common shares or on the price of related derivative financial instruments (the “Inside Information”). In this regard:
“information shall be deemed to be of a precise nature” if: (a) it indicates a set of circumstances which exists or which may reasonably be expected to come into existence, or an event which has occurred, or which may reasonably be expected to occur and (b) it is specific enough to enable a conclusion to be drawn as to the possible effect of that set of circumstances or event on the prices of the financial instruments (i.e., FCA’s common shares) or the related derivative financial instrument. In this respect in the case of a protracted process that is intended to bring about, or that results in, particular circumstances or a particular event, those future circumstances or that future event, and also the intermediate steps of that process which are connected with bringing about or resulting in those future circumstances or that future event, may be deemed to be precise information;
“information which, if it were made public, would be likely to have a significant effect on the prices of financial instruments, derivative financial instruments” shall mean information a reasonable investor would be likely to use as part of the basis of his or her investment decisions.
An intermediate step in a protracted process shall be deemed to be Inside Information if, by itself, it satisfies the criteria of Inside Information as referred to above.
The above disclosure requirement shall be complied with through the publication of a press release by FCA, in accordance with the modalities set forth under the MAR Regulation and Dutch and Italian law, disclosing to the public the relevant Inside Information.
Under specific circumstances, CONSOB may at any time request: (a) FCA to disclose to the public specific information or documentation where deemed appropriate or necessary or alternatively (b) to be provided with specific information or documentation. For this purpose, CONSOB has wide powers to, among other things, carry out inspections or request information to the members of the managing board, the members of the supervisory board or to the external auditor.
FCA shall publish and transmit to CONSOB any information disseminated in any non EU-countries where FCA’s common shares are listed (i.e., the U.S.), if this information is significant for the purposes of the evaluation of FCA’s common shares listed on the MTA.
FCA may, on its own responsibility, delay disclosure to the public of Inside Information provided that all of the following conditions are met: (a) immediate disclosure is likely to prejudice the legitimate interests of FCA; (b) delay of disclosure is not likely to mislead the public; (c) FCA is able to ensure the confidentiality of that information.
In the case of a protracted process that occurs in stages and that is intended to bring about, or that results in, a particular circumstance or a particular event, FCA may on its own responsibility delay the public disclosure of Inside Information relating to this process, subject to points (a), (b) and (c) above.
Insiders’ Register - Article 18 of the MAR RegulationFCA, as well as persons acting on its behalf or on its account, shall draw up and keep regularly updated, a list of all persons who have access to Inside Information and who are working for them under a contract of employment, or otherwise performing tasks through which they have access to Inside Information, such as advisers, accountants or credit rating agencies (the “insider list”).
FCA or any person acting on its behalf or on its account, shall take all reasonable steps to ensure that any person on the insider list acknowledges in writing the legal and regulatory duties entailed and is aware of the sanctions applicable to insider dealing and unlawful disclosure of inside information.

124 2018 | ANNUAL REPORT
Public Tender OffersCertain rules provided for under Italian law with respect to both voluntary and mandatory public tender offers shall apply to any offer launched for FCA’s common shares. In particular, among other things, the provisions concerning the tender offer price, the content of the offer document and the disclosure of the tender offer will be subject to the supervision by CONSOB and Italian law.
FCA Policies
Code of ConductThe Company and all its subsidiaries refer to the principles contained in the FCA code of conduct (the “Code of Conduct”) approved by the Board of Directors on April 29, 2015 and updated in January 2017.
The Code applies to all board members and officers of FCA and its subsidiaries, as well as full-time and part-time employees of FCA and any of its subsidiaries. The Code of Conduct also applies to all temporary, contract and all other individuals and companies that act on behalf of FCA, wherever they are located in the world.
The Code of Conduct represents a set of values recognized, adhered to and promoted by the Group which understands that conduct based on the principles of diligence, integrity and fairness is an important driver of social and economic development.
The Code of Conduct is a pillar of the integrity system which regulates the decision-making processes and operating approach of the Group and its employees in the interests of stakeholders. The Code of Conduct amplifies aspects of conduct related to the economic, social and environmental dimensions, underscoring the importance of dialog with stakeholders. Explicit reference is made to the UN’s Universal Declaration on Human Rights, the principal Conventions of the International Labor Organisation (“ILO”), the OECD Guidelines for Multinational Enterprises, the U.S. Foreign Corrupt Practices Act (“FCPA”) and United Kingdom Bribery Act (“UKBA”). The Code of Conduct is supplemented by Practices aimed to provide specific guidance to all workforce members on how to effectively apply the Principles under the Code of Conduct in relation to various topics such as: the Environment, Health and Safety, Anti-corruption, Suppliers, Respect of Human Rights, Conflicts of Interest, Data Privacy, Information Assets Protection, Antitrust and Export controls. Moreover FCA has recently published on the FCA Website an updated version of the Company Sustainability Guidelines to cover specific business matters detailing FCA’s accountability and commitment to a culture of responsibility and integrity.
FCA endeavors to ensure that the Code of Conduct is regarded as a best practice of business conduct and observed by those third parties with whom it maintains business relationships of a lasting nature such as suppliers, dealers, advisors and agents. In fact, Group contracts worldwide include specific clauses relating to recognition and adherence to the principles underlying the Code of Conduct, as well as compliance with local regulations, particularly those related to corruption, money-laundering, terrorism and other crimes constituting liability for legal persons.
The Company closely monitors the effectiveness of and compliance with the Code of Conduct. Violations of the Code of Conduct are essentially determined through, among others: periodic activities carried out by Internal Audit of the Group according to the annual Audit Plan, approved by the FCA Audit Committee and the CEO, that is based on a group risk assessment process; allegations received in accordance with the “Ethics Helpline process”; and checks forming part of the standard operating procedures. Internal Audit investigates violations of the Code of Conduct also through specific Business Ethics Audits (“BEA”). On a regular basis the Chief Audit Executive (CAE) informs the Chief Executive Officer and the Audit Committee on the major findings. For all Code of Conduct violations, the disciplinary measures taken are commensurate with the seriousness of the case and comply with local legislation.
The Code of Conduct, including further information on its effectiveness and compliance, is available on the Governance section of the Group’s website at https://www.fcagroup.com/en-US/group/governance/code_of_conduct/.
Board Report
Corporate Governance

2018 | ANNUAL REPORT 125
Insider Trading PolicyOn October 10, 2014, Fiat Investments’ board of directors adopted an insider trading policy, setting forth guidelines and recommendations to all Directors, officers and employees of the Group with respect to transactions in the Company’s securities. This policy, which also applies to immediate family members and members of the households of persons covered by the policy, is designed to prevent insider trading or allegations of insider trading, and to protect the Company’s integrity and ethical conduct. This policy was amended by the Board of Directors of FCA on July 28, 2016 following the new applicable law concerning market abuse and, in particular, the MAR Regulation and its implementing regulations.
Sustainability PracticesThe Group is committed to operating in an environmentally and socially-responsible manner. For a full description of sustainability governance, guidelines, targets and results, refer to the section NON-FINANCIAL INFORMATION elsewhere in this report.
Diversity PolicyOn December 20, 2017, the Board of Directors adopted a diversity policy for the Board of Directors (the “Diversity Policy”), as the Company believes that diversity in the composition of the Board of Directors in terms of age, gender, expertise, work background and nationality is an important means of promoting debate, balanced decision-making and independent actions of the Board of Directors. For further information, refer to the section Composition of the Board of Directors included elsewhere in this report.
The Company applies the following aspects of diversity to the Board of Directors: age, gender, expertise, work and personal background and nationality. The Company considers each of these aspects key drivers to support the above-mentioned goals and to achieve sufficient diversity of views and the expertise needed for a proper understanding of current affairs and longer-term risks and opportunities related to the Company’s business. The Board of Directors and its Governance and Sustainability Committee consider such factors when evaluating nominees for election to the Board of Directors and during the annual performance assessment process.
Concrete targets that the Company aims to achieve, with an overriding emphasis based on merit, within the next several years, are that (a) at least 30% of the seats of the Board of Directors are occupied by women and at least 30% by men; (b) the nationality of the members of the Board of Directors shall be reasonably consistent with the geographic spread of FCA’s business in such manner that no nationality shall count for more than 60% of the members of the Board of Directors; and (c) the age of the members of the Board of Directors should be more diverse by having one or more members of the Board of Directors aged under 50 at the day of their nomination; provided that in the selection of a candidate on the basis of the defined diversity criteria, rules and generally accepted principles of non-discrimination (on grounds such as ethnic origin, race, disability or sexual orientation) will be taken into account.
To ensure its correct implementation, the Diversity Policy has been considered in the adoption of a profile for non-executive Directors and will be taken into account in the nomination of executive Directors, as well as in nominating and recommending non-executive Directors. In the 2018 financial year, the targets relating to nationality and age have been realized.
Compliance with Dutch Corporate Governance CodeThe Dutch Corporate Governance Code contains principles and best practice provisions that regulate relations between the board and the shareholders (including the general meeting of shareholders). The Dutch Corporate Governance Code is divided into five chapters which address the following topics: (i) long-term value creation; (ii) effective management and supervision; (iii) remuneration; (iv) the general meeting; and (v) one-tier governance structure.
Dutch companies whose shares are listed on a regulated stock exchange or comparable system, such as the NYSE or the MTA, are required under Dutch law to disclose in their annual reports whether or not they apply the provisions of the Dutch Corporate Governance Code and, in the event that they do not apply a certain provision, to explain the reasons why they have chosen to deviate.
FCA acknowledges the importance of good corporate governance and supports the best practice provisions of the Dutch Corporate Governance Code.

126 2018 | ANNUAL REPORT
The Dutch Corporate Governance Code was revised in December 2016 and the revised Dutch Corporate Governance Code became effective on January 1, 2018, being applicable retrospectively from the 2017 financial year. Consequently, FCA has reported in 2018 regarding its application of the revised Dutch Corporate Governance Code over the 2017 financial year.
While the Company endorses the principles and best practice provisions of the Dutch Corporate Governance Code, its current corporate governance structure applies the following best practice provisions as follows:
We deviate from the Dutch Corporate Governance Code’s general best practice provision regarding the maximum of one non-executive director affiliated with a shareholder holding ten percent or more of the shares in the company. We believe this is appropriate in light of the position of Exor N.V. as our reference shareholder.
The Company does not have a retirement schedule as referred to in best practice provision 2.2.4. of the Dutch Corporate Governance Code, because, pursuant to the Articles of Association, the term of office of Directors is approximately one year, with such a period expiring on the day the first annual general meeting of FCA shareholders is held in the following calendar year. This approach is in line with the general practice for companies listed in the U.S. As the Company is listed at NYSE, the Company also relies on certain US governance policies, one of which is the reappointment of our Directors at each annual general meeting of FCA shareholders.
The Board has not appointed a Vice-chairman in the sense of best practice provision 2.3.7 of the Dutch Corporate Governance Code. The Board has however appointed a Chairman of the Company and one of the non-executive directors as “voorzitter” of the Board of Directors (referred to as the “Senior Non-executive Director”). The Board Regulations provide that in the absence of the Senior Non-executive Director, any other non-executive director chosen by a majority of the directors present at a meeting shall preside at meetings of the Board of Directors. In addition, the Chairman of the Company acts as contact for individual directors regarding the functioning of the Senior Non-executive Director and any conflict of interest, or potential conflict of interest, of the Senior Non-executive Director can be reported to the Chairman. We believe that this is sufficient to ensure that the functions assigned to the vice-chairman by the Dutch Corporate Governance Code are properly discharged.
Pursuant to best practice provision 4.1.8 of the Dutch Corporate Governance Code, every executive and non-executive Director nominated for appointment should attend the general meeting at which votes will be cast on his or her nomination. Since, pursuant to the Articles of Association, the term of office of Directors is approximately one year, with such a period expiring on the day the first annual general meeting of FCA shareholders is held in the following calendar year, all members of the Board of Directors are nominated for (re)appointment each year. By publishing the relevant biographical details and curriculum vitae of each nominee for (re)appointment, the Company ensures that the Company’s general meeting of shareholders is well informed in respect of the nominees for (re)appointment and, in practice, only the executive Directors will therefore be present at the general meeting.
Mr. John Elkann, being an executive Director, has a position on the Governance and Sustainability Committee to which best practice provision 5.1.4 of the Dutch Corporate Governance Code applies. The position of Mr. Elkann as executive Director in this committee inter alia follows from the duties of the governance and sustainability committee, which are more extensive than the duties of a selection and appointment committee and include duties that warrant participation of an executive Director in the view of the Company.
Differences between Dutch Corporate Governance Practices and NYSE Listing StandardsThe discussion below summarizes the significant differences between our corporate governance practices and the NYSE standards applicable to U.S. companies, as well as certain ways in which our governance practices (see above section Compliance with Dutch Corporate Governance Code) deviate from those suggested in the Dutch Corporate Governance Code.
The NYSE requires that when an audit committee member of a U.S. domestic listed company serves on four or more audit committees of public companies, the listed company should disclose (either on its website or in its annual proxy statement or annual report filed with the SEC) that the board of directors has determined that this simultaneous service would not impair the director’s service to the listed company. Dutch law does not require the Company to make such a determination.
Board Report
Corporate Governance

2018 | ANNUAL REPORT 127
The Audit Committee is elected by the Board of Directors and is comprised of at least three non-executive Directors. Audit Committee members are also required (i) not to have any material relationship with the Company or to serve as auditors or accountants for the Company; (ii) to be “independent” for the purposes of NYSE rules, Rule 10A-3 of the Exchange Act and the Dutch Corporate Governance Code; and (iii) to be “financially literate” and have “accounting or selected financial management expertise” (as determined by the Board of Directors). Furthermore, the Audit Committee may not be chaired by the Chairperson of the Board or by a former executive of the Company. Currently, the Audit Committee consists of Mr. Earle (Chairman), Mr. Thompson, Ms. Wheatcroft and Ms. Mars.
In contrast to NYSE rules applicable to U.S. companies which require that external auditors be appointed by the Audit Committee, the general rule under Dutch law is that external auditors are appointed at a general meeting of shareholders. In accordance with the requirements of Dutch law, the appointment and removal of our independent registered public accounting firm must be resolved upon at a general meeting of shareholders. Our Audit Committee is responsible for the recommendation to the shareholders of the appointment and compensation of the independent registered public accounting firm and oversees and evaluates the work of our independent registered public accounting firm.
NYSE rules require a U.S. listed company to have a compensation committee and a nominating/corporate governance committee composed entirely of independent directors. As a foreign private issuer, we do not have to comply with this requirement, however the Dutch Corporate Governance Code also requires us to have a Compensation Committee and a selection and appointment committee (which we call our Governance and Sustainability Committee). Our Compensation Committee Charter states that a maximum of one member of the Compensation Committee may be non-independent according to the Dutch Corporate Governance Code. All the current members of the Compensation Committee are independent under both the NYSE rules and the Dutch Corporate Governance Code.
Under NYSE listing standards, shareholders of U.S. companies must be given the opportunity to vote on all equity compensation plans and to approve material revisions to those plans, with the limited exceptions set forth in the NYSE rules. As a foreign private issuer, we are permitted to follow our home country laws regarding shareholder approval of compensation plans, and under Dutch law such approval from shareholders is not required for equity compensation plans for employees other than the members of the Board of Directors, and to the extent the authority to grant equity rights has been delegated at a general meeting of shareholders to the Board of Directors. For equity compensation plans for members of the Board of Directors and/or in the event that the authority to issue shares and/or rights to subscribe for shares has not been delegated to the Board of Directors, approval at a general meeting of shareholders is required.
While NYSE rules do not require listed companies to have shareholders approve or declare dividends, the Dutch Corporate Governance Code requires that a dividend distribution be a separate agenda item at a general meeting of shareholders in which the annual accounts are adopted. In our case, Article 23 of our Articles of Association provides that annual dividends must be resolved upon at a general meeting of shareholders. However, interim dividend distributions can be resolved upon by the Board of Directors, subject to meeting certain criteria listed in Article 23 of our Articles of Association.

128 2018 | ANNUAL REPORT
Report of the Non-Executive Directors
IntroductionThis is the report of the non-executive Directors of the Company over the 2018 financial year as referred to in best practice provision 5.1.5 of the Dutch Corporate Governance Code.
It is the responsibility of the non-executive Directors to supervise the policies carried out by the executive Directors and the general affairs of the Company and its affiliated enterprise, including the implementation of the strategy of the Company regarding long-term value creation. In so doing, the non-executive Directors act solely in the interest of the Company. With a view to maintaining supervision on the Company, the non-executive Directors regularly discuss FCA’s long-term business plans, the implementation of such plans and the risks associated with such plans with the executive Directors.
According to the Articles of Association, the Board of Directors is a single board and consists of three or more members, comprising both members having responsibility for the day-to-day management of FCA (executive Directors) and members not having such day-to-day responsibility (non-executive Directors). The tasks of the executive and non-executive Directors in a one-tier board such as the Company’s Board of Directors may be allocated under or pursuant to the Articles of Association, provided that the general meeting of shareholders has stipulated whether such Director is appointed as executive or as non-executive Director and furthermore provided that the task to supervise the performance by the Directors of their duties can only be performed by the non-executive Directors. Regardless of an allocation of tasks, all Directors remain collectively responsible for the proper management and strategy of the Company (including supervision thereof in case of non-executive Directors).
Details of the current composition of the Board of Directors (including the non-executive Directors) and its committees are set forth in the section “Board of Directors” above.
Supervision by the non-executive DirectorsThe non-executive Directors supervise the policies carried out by the executive Directors and the general affairs of the Company and its affiliated enterprises. In so doing, the non-executive Directors have also focused on the effectiveness of the Company’s internal risk management and control systems, the integrity and quality of the financial reporting and FCA’s long-term business plans, the implementation of such plans and the associated risks.
The non-executive Directors also determine the remuneration of the executive directors and nominate candidates for the Director appointments. Furthermore, the Board of Directors may allocate certain specific responsibilities to one or more individual directors or to a committee comprised of eligible Directors of the Company and subsidiaries of the Company. In this respect, the Board of Directors has allocated certain specific responsibilities to the Audit Committee, the Compensation Committee and the Governance and Sustainability Committee. Further details on the manner in which these committees have carried out their duties, are set forth in the sections “The Audit Committee”, “The Compensation Committee” and “The Governance and Sustainability Committee”, within “Board Practices and Committees” above.
The non-executive Directors supervised the adoption and implementation of the strategies and policies by the Group, reviewed this annual report, including the Remuneration Report and the Group’s financial results, received updates on legal and compliance matters and they have been regularly involved in the review and approval of transactions entered into with related parties. The non-executive Directors have also reviewed the reports of the Board of Directors and its committees, the sustainability achievement and objectives and the recommendations for the appointment of Directors.
Board Report
Corporate Governance
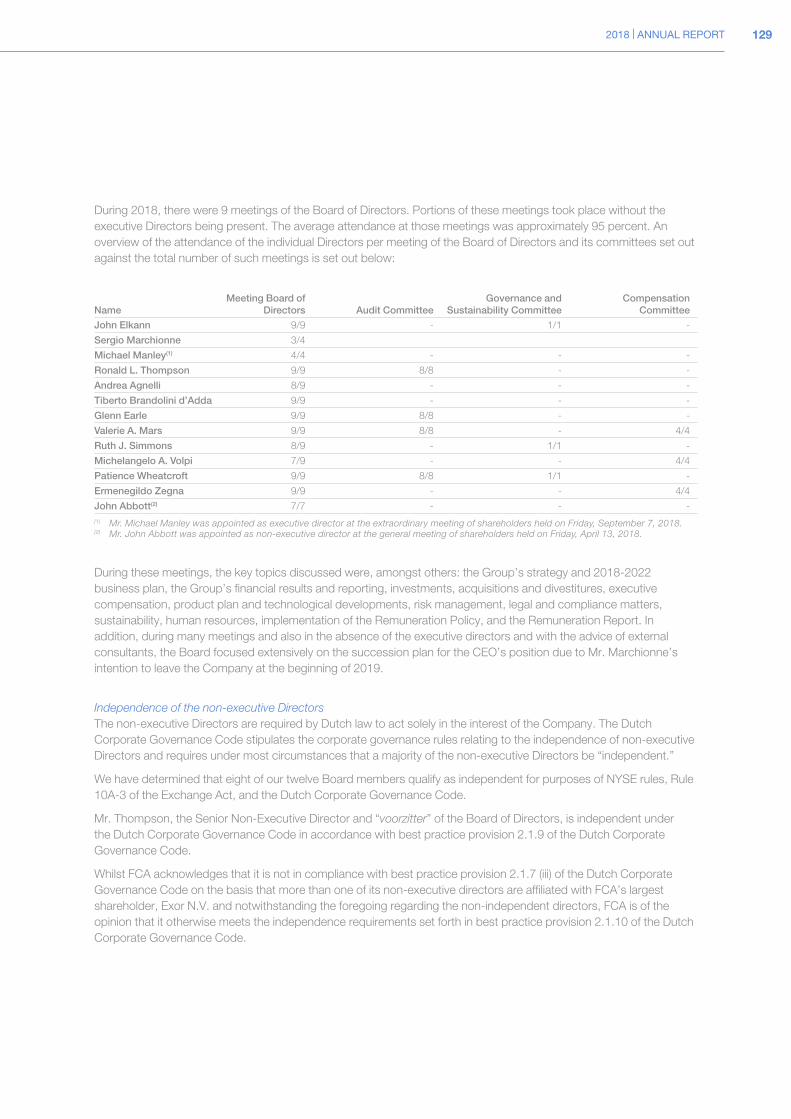
2018 | ANNUAL REPORT 129
During 2018, there were 9 meetings of the Board of Directors. Portions of these meetings took place without the executive Directors being present. The average attendance at those meetings was approximately 95 percent. An overview of the attendance of the individual Directors per meeting of the Board of Directors and its committees set out against the total number of such meetings is set out below:
NameMeeting Board of
Directors Audit CommitteeGovernance and
Sustainability CommitteeCompensation
Committee
John Elkann 9/9 - 1/1 -
Sergio Marchionne 3/4
Michael Manley(1) 4/4 - - -
Ronald L. Thompson 9/9 8/8 - -
Andrea Agnelli 8/9 - - -
Tiberto Brandolini d’Adda 9/9 - - -
Glenn Earle 9/9 8/8 - -
Valerie A. Mars 9/9 8/8 - 4/4
Ruth J. Simmons 8/9 - 1/1 -
Michelangelo A. Volpi 7/9 - - 4/4
Patience Wheatcroft 9/9 8/8 1/1 -
Ermenegildo Zegna 9/9 - - 4/4
John Abbott(2) 7/7 - - -(1) Mr. Michael Manley was appointed as executive director at the extraordinary meeting of shareholders held on Friday, September 7, 2018.(2) Mr. John Abbott was appointed as non-executive director at the general meeting of shareholders held on Friday, April 13, 2018.
During these meetings, the key topics discussed were, amongst others: the Group’s strategy and 2018-2022 business plan, the Group’s financial results and reporting, investments, acquisitions and divestitures, executive compensation, product plan and technological developments, risk management, legal and compliance matters, sustainability, human resources, implementation of the Remuneration Policy, and the Remuneration Report. In addition, during many meetings and also in the absence of the executive directors and with the advice of external consultants, the Board focused extensively on the succession plan for the CEO’s position due to Mr. Marchionne’s intention to leave the Company at the beginning of 2019.
Independence of the non-executive DirectorsThe non-executive Directors are required by Dutch law to act solely in the interest of the Company. The Dutch Corporate Governance Code stipulates the corporate governance rules relating to the independence of non-executive Directors and requires under most circumstances that a majority of the non-executive Directors be “independent.”
We have determined that eight of our twelve Board members qualify as independent for purposes of NYSE rules, Rule 10A-3 of the Exchange Act, and the Dutch Corporate Governance Code.
Mr. Thompson, the Senior Non-Executive Director and “voorzitter” of the Board of Directors, is independent under the Dutch Corporate Governance Code in accordance with best practice provision 2.1.9 of the Dutch Corporate Governance Code.
Whilst FCA acknowledges that it is not in compliance with best practice provision 2.1.7 (iii) of the Dutch Corporate Governance Code on the basis that more than one of its non-executive directors are affiliated with FCA’s largest shareholder, Exor N.V. and notwithstanding the foregoing regarding the non-independent directors, FCA is of the opinion that it otherwise meets the independence requirements set forth in best practice provision 2.1.10 of the Dutch Corporate Governance Code.

130 2018 | ANNUAL REPORT
Evaluation by the non-executive DirectorsThe non-executive Directors are responsible for supervising the Board of Directors and its committees, as well as the individual executive and non-executive Directors, and are assisted by the Governance and Sustainability Committee in this respect.
In accordance with the Governance and Sustainability Committee Charter, the Governance and Sustainability Committee assists and advises the Board of Directors with respect to periodic assessment of the performance of individual Directors. In this respect, the Governance and Sustainability Committee has, amongst others, the duties and responsibilities to review annually the Board of Directors’ performance and the performance of its committees and to review each Director’s continuation on the Board of Directors at appropriate regular intervals as determined by the Governance and Sustainability Committee.
In 2018, the Governance and Sustainability Committee focused on the periodic assessment of the performance of the Board of Directors, its committees and the individual Directors during the meeting held on February 19. During that meeting, the Governance and Sustainability Committee dealt also with the directors’ nomination process and focused on the assessment of Directors’ qualifications, the size and composition of the Board of Directors and the committees, and the recommendations for Directors’ election.
The non-executive Directors have been regularly informed by each committee as referred to in best practice provision 2.3.5 of the Dutch Corporate Governance Code and the conclusions of those committees were taken into account when drafting this report of the non-executive Directors.
The non-executive Directors were able to review and evaluate the performance of the Audit Committee, the Governance and Sustainability Committee and the Compensation Committee. No need to amend the size or composition of the Audit Committee, the Governance and Sustainability Committee and the Compensation Committee, nor any reason to amend their charters was identified. Further details on the manner in which these committees have carried out their duties, are set forth in the sections “The Audit Committee”, “The Compensation Committee” and “The Governance and Sustainability Committee”, within “Board Practices and Committees” above.
On the basis of the preparations by the Governance and Sustainability Committee, the non-executive Directors were able to review the Board of Director’s assessments, the individual Directors’ assessments and the recommendation for Directors’ election. The Board of Directors concluded that each of the Directors continues to demonstrate commitment to its respective role in the Company.
Also, pursuant to the Compensation Committee Charter, the Compensation Committee implements and oversees the Remuneration Policy as it applies to non-executive Directors, executive Directors and senior officers reporting directly to the executive Directors. The Compensation Committee administers all the equity incentive plans and the deferred compensation benefits plans. On the basis of the assessments performed, the non-executive Directors determine the remuneration of the executive directors and nominate candidates for the Director appointments.
The non-executive Directors have supervised the performance of the Audit Committee, the Compensation Committee and the Governance and Sustainability Committee.
Board Report
Corporate Governance

2018 | ANNUAL REPORT 131
Responsibilities in Respect to the Annual ReportThe Board of Directors is responsible for preparing the Annual Report, inclusive of the Consolidated and Company Financial Statements and Report on Operations, in accordance with Dutch law and International Financial Reporting Standards as issued by the International Accounting Standards Board and as adopted by the European Union (EU-IFRS).
In accordance with Section 5:25c, paragraph 2 of the Dutch Financial Supervision Act, the Board of Directors states that, to the best of its knowledge, the Financial Statements prepared in accordance with applicable accounting standards provide a true and fair view of the assets, liabilities, financial position and profit or loss for the year of the Company and its subsidiaries and that the Report on Operations provides a true and a fair view of the performance of the business during the financial year and the position at balance sheet date of the Company and its subsidiaries, developments during the year, together with a description of the principal risks and uncertainties that the Company and the Group face.
February 22, 2019
The Board of Directors
John ElkannMichael ManleyJohn AbbottAndrea AgnelliTiberto Brandolini d’AddaGlenn EarleValerie A. MarsRuth J. SimmonsRonald L. ThompsonMichelangelo A. VolpiPatience WheatcroftErmenegildo Zegna

132 2018 | ANNUAL REPORT
Remuneration Report
Remuneration of the Members of the Board of Directors and the Group Executive Council of FCAThe quality of our leadership and their commitment to the Company are fundamental to our success. FCA’s remuneration principles support our business strategy and growth objectives in a diverse and evolving global market. Our remuneration policies are designed to competitively reward the achievement of long-term sustainable performance and to attract, motivate and retain highly qualified executives who are committed to performing their roles in the long-term interest of our shareholders. Given the changing international standards regarding responsible and sound remuneration, a variety of factors are taken into consideration when evaluating compensation, such as the complexity of functions, the scope of responsibilities, the alignment of risks and rewards, national and international legislation and the long-term objectives of the Company and its shareholders.
Remuneration Policy for Executive DirectorsThe compensation for our executive directors is determined by the Board of Directors based on recommendations from the Compensation Committee of the Board of Directors (the “Compensation Committee”) and in accordance with the Company’s Remuneration Policy for Executive Directors (the “Remuneration Policy”). The current Remuneration Policy was approved by the shareholders of Fiat Chrysler Automobiles N.V. at the 2017 annual general meeting of FCA shareholders and is reviewed annually by the Compensation Committee. Our Remuneration Policy is available in full on the Company’s website at www.fcagroup.com.
The Compensation Committee reviews the Remuneration Policy and its implementation. The Compensation Committee concluded that there were no reasons to recommend adjustments to the Remuneration Policy at the 2019 annual general meeting of FCA shareholders with regard to its executive directors. This report describes the Company’s compensation principles and structure for the executive directors and summarizes the significant compensation decisions made by the Compensation Committee in 2018.
Change in Executive Directors in 2018On July 21, 2018, Michael Manley assumed the role of CEO, due to the unfortunate passing of our former CEO Sergio Marchionne. Mr. Manley’s appointment to the Board was approved by shareholders at the September 7, 2018 Extraordinary General Meeting. Pursuant to Mr. Marchionne’s employment agreement no bonus will be paid for performance year 2018 and one remaining pro-rated long-term incentive award of 1,561,165 units will vest in 2019 if performance vesting conditions are confirmed as satisfied by the Compensation Committee. (At the average January 2019 stock price of $16.10 per unit, the estimated value of these units would be $25,134,756). Other payments will be made consistent with obligations set forth in Mr. Marchionne’s employment agreement, including his post mandate benefit of 5 x base compensation.
Financial Year 2018 - Select Business HighlightsA key tenet of FCA’s Remuneration Policy is pay for performance. The Group had a record year despite unexpected challenges in 2018. The following table highlights some of the key achievements during the year:
Record results of Adjusted EBIT at €7.3 billion and Adjusted net profit at €5.0 billion (including Magneti Marelli);
Net industrial cash of €1.9 billion at December 2018, up €4.3 billion over prior year reflecting improved Industrial free cash flows; and
Record global sales for Jeep and Ram brands, up 14% and 5% year over year, respectively.
Notwithstanding the record results, the Group did not achieve all of its performance goals set out in the Group’s guidance, which is reflected in the remuneration discussed below.
Board Report
Corporate Governance

2018 | ANNUAL REPORT 133
Remuneration PrinciplesThe guiding principle of our Remuneration Policy is to provide a compensation structure that allows FCA to attract and retain the most highly qualified executive talent and to motivate such executives to achieve business and financial goals that create value for shareholders in a manner consistent with our core business and leadership values. FCA’s compensation philosophy, as set forth in the Remuneration Policy, aims to provide compensation to its executive directors as outlined below.
Alignment with FCA’s strategy Compensation is strongly linked to the achievement of the Group’s publicly disclosed performance targets.
Pay for performance Compensation must reinforce our performance-driven culture and principles of meritocracy. As such, the majority of pay is linked directly to the Group’s performance through both short and long-term variable pay instruments.
Competitiveness Compensation should be competitive against the comparable market and set in a manner to attract, retain and motivate expert leaders and highly qualified executives.
Long-term shareholder value creation Targets triggering any variable compensation payment should align with the interest of shareholders.
Compliance Our compensation policies and plans are designed to comply with applicable laws and corporate governance requirements.
Risk prudence The compensation structure should avoid incentives that encourage unnecessary or excessive risks that could threaten the Company’s value.
Compensation Peer GroupIn 2016, our Compensation Committee assessed the suitability of our potential peer companies, which are companies operating in similar industries with whom we are most likely to compete for executive level talent, and restructured the composition of our peer group to the 26 companies listed below. For 2018, this same compensation peer group was utilized to evaluate relative pay level alignment with Company performance.
The Compensation Committee strives to identify a peer group that best reflects all aspects of FCA’s business and considers public listing, industry practices, geographic reach, and revenue proximity, with market capitalization considered as a secondary characteristic. Our peer group represents a blend of both U.S. and European companies in recognition of the relevant talent market for our executives. In addition to including U.S. and European automobile manufacturers, our peer group includes U.S. and European companies that have significant manufacturing and/or engineering operations and a global market presence. The list is divided between 14 U.S. and 12 European companies, similar to the composition of our senior executive team.
Peer Group Companies
Airbus Group Daimler AG Johnsons Controls Inc. The 3M Company
ArcelorMittal SA Deere & Company Lockheed Martin Corporation ThyssenKrupp AG
Bayer AG Ford Motor Company Northrop Grumman Corporation United Technologies Corporation
BMW Group AG General Dynamics Corporation PSA Peugeot Citroen Volkswagen AG
The Boeing Company General Electric Company Raytheon Company The Volvo Group
Caterpillar Inc. General Motors Company Renault SA
Continental AG Honeywell International Inc. Siemens AG

134 2018 | ANNUAL REPORT
Board Report
Corporate Governance
Summary Overview of Remuneration ElementsThe executive directors’ remuneration is simple and transparent in design, and consists of the following key elements:
Element Description 2018 Application
Annual base salary
• Market competitive fixed cash compensation• Reviewed annually, considering market environment and peer
group
Annual base salary as follows:• Chairman: U.S. $2.0 million• CEO: U.S. $1.6 million
Short-term incentive (“STI” or “Bonus”)(1)
• Performance metrics determined annually• CEO target STI payout: 150 percent of base salary• CEO maximum STI payout: 300 percent of base salary• STI payout in cash based on annual targets and achievement of
metrics• Chairman: not eligible for STI
Three equally weighted metrics:• Adjusted EBIT• Adjusted net profit• Net industrial cash
Actual payout• CEO: 34.0% of target STI• Payout incentive zone: linear between minimum
and target and linear between target and maximum
Long-term incentive (“LTI”)(1)
• One plan: 2014-2018 Long Term Incentive program• Two components for our CEO
- 75% performance share units- 25% restricted share units
• Performance criteria comprised of two equally weighted metrics, relative Total Shareholder Return (“TSR”) and Adjusted net profit
• Maximum payout: 125 percent of the target number of performance share units granted
• Chairman: not eligible for LTI
• CEO: LTI award of 180,364 units granted for CEO service during the period July 21, 2018 - December 31, 2018
Pension and retirement savings
• CEO participates in a defined contribution plan for U.S. based salaried employees and has a supplemental retirement benefit
• Chairman participates in a post mandate benefit of 5 times base salary
• CEO: Supplemental retirement benefit: three times annual base salary
• Chairman: Effective January 1, 2019 waived post mandate benefit
Other benefits • Executive directors may receive typical benefits such as severance, company cars, medical insurance, accident and disability insurance, tax preparation, financial counseling and tax equalization
• CEO severance: 1 times base linked to non-compete restriction
• Chairman severance: currently 2 times base salary based on legacy agreements, however based on his views of his current compensation, the Chairman has expressed his desire to reduce his severance benefit to one times base salary. In 2019, the Company will update written agreements with the Chairman for Board approval to formally incorporate this change
(1) For 2018, the Chairman received fixed compensation only and was not eligible for any variable compensation.
2018 Remuneration of Executive DirectorsOur executive compensation program is designed to align the interests of our executive directors with those of our shareholders. It is designed to reward our executive directors based on the achievement of sustained financial and operating performance as well as demonstrated leadership. We aim to attract, engage, and retain high-performing executives who help us achieve immediate and future success and maintain our position as an industry leader. We support a shared, one-company mindset of performance and accountability to deliver on business objectives.
Executive Directors’ Target Direct Compensation MixThe Group has a written agreement with the Chairman, memorializing agreed terms and conditions of his service with the Company. In 2018, no changes were made to any of the compensation elements set forth above for the Chairman. The Chairman was not eligible for any form of variable compensation.
Effective January 1, 2019, and based on the Chairman’s views of his current compensation, the Board approved a new prospective compensation program for the Chairman. This compensation framework consists of both base compensation and long-term variable pay. For 2019, 75 percent of our Chairman’s compensation is at-risk performance based compensation.

2018 | ANNUAL REPORT 135
In September 2018, the Group approved an amended employment agreement for the newly appointed CEO, which sets forth base salary, short-term variable pay and long-term variable pay. The compensation terms were established after reviewing external benchmarks and evaluating internal equity, and were supported by our external compensation consultant. For the performance based pay elements, the combination of the annual incentive and the long term incentive imposes 89% of targeted pay at risk. The CEO’s targeted annual compensation of $14.0 million consists of:
Base salary: $1.6 million
Target bonus: $2.4 million
Target equity fair market value at grant: $10.0 million of which 75% is performance based and 25% is retention based
This is illustrated in the weighting of the CEO Target Pay Mix table below:
Elements of Compensation Salary 11% Annual Incentive 17% Long-Term Incentives 72%
Fixed vs. Variable Fixed 11% Variable 89%
The material terms of the Chairman’s and the current CEO’s respective agreements in effect for 2018 are described below in greater detail.
Executive Directors Realized CompensationRealized compensation is the amount that our executive directors actually received in 2018. Realized compensation includes actual base salary earned, actual annual bonus, and the value of any equity awards that vested during the year. In 2018, our Chairman’s realized cash compensation was €1,693,545, consisting of only base salary (consistent with prior years, our Chairman did not receive any variable compensation in 2018). Our current CEO’s realized cash compensation was €600,442 consisting of base salary only as our current CEO did not receive any variable compensation in 2018 attributable to his role as CEO.
Realized compensation differs from the total compensation set forth in the Directors’ Compensation table later in this report.
Internal Pay RatiosDuring 2018, the Company externally benchmarked the executive directors’ pay and continued to monitor Dutch Corporate Governance Code with the support of Netherlands outside counsel and noted there were no updates to Dutch pay ratio guidance.
U.S. peers began disclosing pay ratios in 2018 per SEC guidelines, providing limited comparative context as none of our 12 European peer group companies disclosed a CEO pay ratio.
In light of the above, FCA reviewed our CEO pay ratio relative to 17 Fortune 200 companies who have a similar employee geographic profile (with more than approximately 75% of their employees outside of the United States). FCA ranked below the median of 403:1 according to our external compensation consultant. The ratio of our CEO’s total annual target compensation of €12,642,204 (base salary, bonus, long term equity award and change in pension balance) to that of our median employee’s annual total compensation of €33,353 (base salary, variable compensation, overtime and change in pension balance) is estimated to be 379:1.
In light of the partial year earnings realized by the CEO we deemed annual target compensation, including base salary and short and long term incentive, to be the most appropriate comparison for 2018 pay.

136 2018 | ANNUAL REPORT
Board Report
Corporate Governance
Base SalaryThe base salary for our Chairman has remained unchanged for five consecutive years (2014, 2015, 2016, 2017 and 2018). Effective January 1, 2019, the annual base salary for our Chairman will be reduced from U.S. $2.0 million to U.S. $1.0 million. Effective July 21, 2018, the date of our new CEO’s appointment, his annual base salary is U.S.$1.6 million. The Company does not guarantee annual base pay increases for executive directors and their agreements do not contemplate automatic base salary increases. Base salary is the only fixed component of our executive directors’ total cash compensation and is intended to provide market-competitive pay to attract and retain well-qualified senior executives and expert leaders. Base salary is based on the individual’s skills, scope of job responsibilities, experience and competitive market data. The base salaries of our executive directors are evaluated together with other components of compensation to ensure that they are in line with our overall compensation philosophy and are aligned with performance.
Variable ComponentsFCA’s CEO is eligible to receive short-term variable compensation, subject to the achievement of pre-established, operating and financial performance targets. The variable components of the CEO’s remuneration, both short and long-term, are linked to predetermined, measurable objectives which serve to motivate strong performance and shareholder returns and are approved by the non-executive directors. The non-executive directors believe that placing significantly more weight on the long-term component is appropriate for the CEO position because it focuses efforts on the Company’s long-term objectives.
As specified by Dutch Corporate Governance Code, scenario analyses are carried out annually to examine the relationship between the performance criteria chosen and the possible outcomes for the variable remuneration of our CEO. When such analyses were completed for the 2018 financial year, the Company found a strong link between remuneration and performance and concluded that the chosen performance criteria are appropriate under both the short-term and long-term incentive components of total remuneration in support of the Company’s strategic objectives.
Short-Term Variable IncentiveThe primary objective of the short-term variable incentive is to motivate achievement of the business priorities for the current year. The CEO’s short-term variable incentive is based solely on annual financial objectives proposed by the Compensation Committee and approved by the non-executive directors each year. The short-term variable incentive program applies rigorous performance measures to ensure a link between annual payout and Company performance.
Our Methodology for Determining Annual Bonus Awards
Base Salary Target Bonus %Company
PerformanceFactor
BONUSEARNED
Reflects market
Reflects performancevs. objectives based
on actual results achieved
x x =
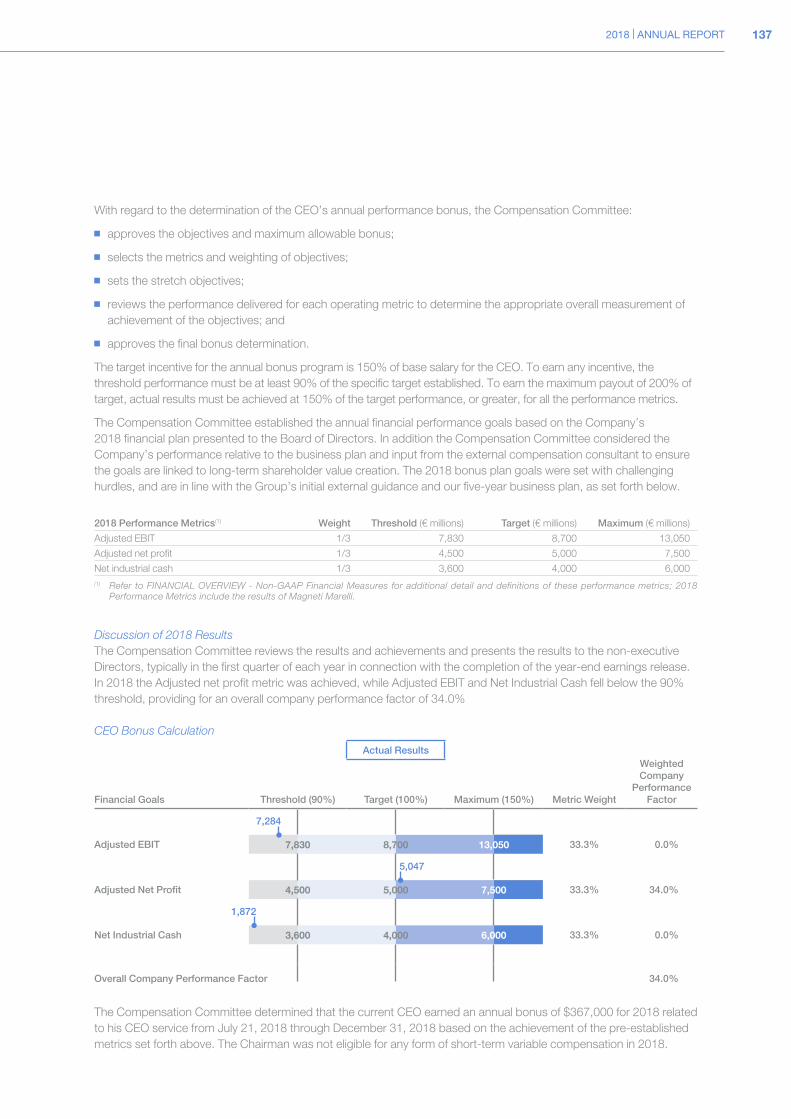
2018 | ANNUAL REPORT 137
With regard to the determination of the CEO’s annual performance bonus, the Compensation Committee:
approves the objectives and maximum allowable bonus;
selects the metrics and weighting of objectives;
sets the stretch objectives;
reviews the performance delivered for each operating metric to determine the appropriate overall measurement of achievement of the objectives; and
approves the final bonus determination.
The target incentive for the annual bonus program is 150% of base salary for the CEO. To earn any incentive, the threshold performance must be at least 90% of the specific target established. To earn the maximum payout of 200% of target, actual results must be achieved at 150% of the target performance, or greater, for all the performance metrics.
The Compensation Committee established the annual financial performance goals based on the Company’s 2018 financial plan presented to the Board of Directors. In addition the Compensation Committee considered the Company’s performance relative to the business plan and input from the external compensation consultant to ensure the goals are linked to long-term shareholder value creation. The 2018 bonus plan goals were set with challenging hurdles, and are in line with the Group’s initial external guidance and our five-year business plan, as set forth below.
2018 Performance Metrics(1) Weight Threshold (€ millions) Target (€ millions) Maximum (€ millions)
Adjusted EBIT 1/3 7,830 8,700 13,050
Adjusted net profit 1/3 4,500 5,000 7,500
Net industrial cash 1/3 3,600 4,000 6,000(1) Refer to FINANCIAL OVERVIEW - Non-GAAP Financial Measures for additional detail and definitions of these performance metrics; 2018
Performance Metrics include the results of Magneti Marelli.
Discussion of 2018 ResultsThe Compensation Committee reviews the results and achievements and presents the results to the non-executive Directors, typically in the first quarter of each year in connection with the completion of the year-end earnings release. In 2018 the Adjusted net profit metric was achieved, while Adjusted EBIT and Net Industrial Cash fell below the 90% threshold, providing for an overall company performance factor of 34.0%
CEO Bonus Calculation
Actual Results
Financial Goals Threshold (90%) Target (100%) Maximum (150%) Metric Weight
Weighted Company
Performance Factor
Adjusted EBIT 33.3% 0.0%
Adjusted Net Profit 33.3% 34.0%
Net Industrial Cash 33.3% 0.0%
Overall Company Performance Factor 34.0%
The Compensation Committee determined that the current CEO earned an annual bonus of $367,000 for 2018 related to his CEO service from July 21, 2018 through December 31, 2018 based on the achievement of the pre-established metrics set forth above. The Chairman was not eligible for any form of short-term variable compensation in 2018.
7,830 8,700 13,050
4,500 5,000 7,500
3,600 4,000 6,000
7,284
5,047
1,872

138 2018 | ANNUAL REPORT
Board Report
Long-Term IncentivesLong-term incentive compensation is a critical component of our Executive Directors’ compensation structure. This compensation component is designed to:
align the interests of our Executive Directors and other key contributors with the interests of our shareholders;
motivate the attainment of Company performance goals and reward sustained shareholder value creation; and
serve as an important attraction and long-term retention tool that management and the Compensation Committee use to strengthen loyalty to the Company.
Cyclical, Long-Term Nature of Our Business. Market demand for automobiles and light commercial vehicles is cyclical and product life cycles are long, and thus so is the nature of FCA’s business. As long-term incentive compensation is one of the key mechanisms to motivate and reward managers, the Company has structured this component to consider the long-term, cyclical nature of the business.
2014-2018 Long-Term Equity Incentive PlanWith the aim to attract, motivate and retain Executive Directors for the long-term, to reward Executive Directors based on our future performance as reflected by the market price of FCA shares, and to foster a long-term link between Executive Directors’ interests and the interests of the Company and its shareholders, the Compensation Committee established the 2014-2018 long-term incentive program (“2014-2018 LTIP”). This plan is consistent with the Company’s business plan presented to Capital Markets in May 2014, which was subsequently updated to reflect changes in the Company’s capital structure. In this way, Executive Directors’ payouts are tied and aligned with the interests of shareholders.
The performance based awards vesting under the LTI program are conditional on meeting two independent metrics, Adjusted net profit and Relative TSR, which are weighted equally at target. Each metric has threshold and target performance levels such that performance below threshold results in no awards being earned. The payout opportunity is based on the Company’s relative TSR ranking against the companies in the peer group as shown in the table below. Accordingly, the CEO may earn between 0 percent and 125 percent of the target number of awards granted. The Adjusted net profit component payout begins at 80 percent of target achievement and has a maximum payout at 100 percent of target. The Relative TSR component has partial vesting if the Company is ranked seventh or better among an industry specific peer group of eleven, including the Company, and a maximum payout of 150 percent, if the Company is ranked first among the eleven companies. The awards have three vesting opportunities, the first after 2014-2016 results, the second after 2014-2017 results, and the third after the full 2014-2018 results. FCA achieved 100 percent Adjusted net profit payout and had a ranking of number one for each of the three vesting opportunities.
Adjusted Net Profit Payout Scale TSR Payout Scale
% Achieved Payout % of Target FCA Rank Payout % of Target
80.0% 50.0% 1 150.0%
85.0% 62.5% 2 133.3%
90.0% 75.0% 3 125.0%
95.0% 87.5% 4 100.0%
100.0% 100.0% 5 83.3%
6 66.7%
7 50.0%
8-11 0.0%
Listed below is the Relative TSR peer group:
2014-2018 Performance Cycle Relative TSR Metric Peers
Volkswagen AG Toyota Motor Corporation Daimler AG General Motors Company
Ford Motor Company Honda Motor Co. Ltd. BMW Group The Hyundai Motor Company
PSA Peugeot Citroen Renault SA
Corporate Governance

2018 | ANNUAL REPORT 139
2019-2021 Long-Term Equity Incentive PlanIn December 2018, the Compensation Committee approved a new 2019-2021 Long-Term Equity Incentive Plan structure that better aligns with market practice. This new plan is consistent with the Company’s business plan presented to Capital Markets in June 2018. Issuance of shares under the new plan is subject to shareholder approval at the 2019 Annual General Meeting (AGM).
CEO’s Long-Term Incentive Equity AwardsOur CEO received a new one-time grant consisting of 135,273 performance share units and 45,091 restricted share units under the 2014-2018 LTI program for his CEO service during the period July 21, 2018 - December 31, 2018. The design and award level for the one-time grant covering the remainder of the five-year performance period was based on market competitive analysis provided by the Compensation Committee’s external compensation consultant. The performance share units and the restricted share units can convert into shares of the Company in 2019, subject to specific vesting conditions. The actual payout that the CEO may realize on the performance share units depends on the achievement of critical operation and relative stock performance targets established by the Compensation Committee for the 2014-2018 performance period. The Compensation Committee will assess the satisfaction of these performance targets in 2019. The maximum opportunity for the final vesting of this new equity award linked to his CEO service is 214,182 units.
Pension and Retirement SavingsBased on legacy arrangements which were developed to assist in incentivizing the Chairman during an extremely challenging period, certain retirement benefits were provided. FCA’s Chairman had retirement savings benefits in an aggregate amount equal to five times his last annual base compensation. In 2018 based on the Chairman’s views of his pension and retirement savings benefit, he offered to remove this benefit from his current compensation framework effective January 1, 2019. The Board approved the removal of this benefit for the Chairman.
The CEO participates in a defined contribution plan similar to other U.S. based salaried employees and a supplemental retirement benefit plan. In consideration of his CEO service, the supplemental retirement benefit plan provides a retirement savings benefit in an aggregate amount equal to 3 times his annual base salary. This benefit requires five years of CEO service for 100% vesting and 3 years of service for 50% vesting (with straight-line interpolation in between 0 and 3 years of service and for greater than 3 years of service and less than 5 years of service). In 2018, a cost of €0.3 million was recognized in connection with these retirement savings benefit plans.
Non-compete Restrictions and SeveranceIn connection with our CEO’s written agreement approved in 2018, he agreed to a non-compete restriction under which he committed not to directly or indirectly work for or associate with any business that competes with the Company for one year after termination of his services. In addition, under the agreement, if the Company terminates his services for reasons other than for cause (as defined) or if he terminates his services for good reason (as defined), the Company will pay the CEO an amount equal to the sum of one times the sum of his annual base salary, for the last fiscal year prior to termination of his services, if within twenty-four months following a change of control (as defined), the CEO’s services are involuntarily terminated by the Company (other than for cause), or are terminated by the CEO for good reason, the CEO is entitled to receive the severance and accelerated vesting of awards under the EIP. If the CEO leaves the Company then pursuant to his agreement, he may not work for a competitor for one year after the termination date. The CEO will not be entitled to the severance if he is terminated for cause.
Currently, in connection with our Chairman’s legacy written employment agreement, if the Company terminates his services for reasons other than for cause (as defined) or if he terminates his services for good reason (as defined), the Company will pay the Chairman an amount equal to two times his annual base salary, using the base salary as in effect for the last fiscal year prior to termination of services. Based on his views of his current compensation, the Chairman has expressed his desire to reduce his severance benefit to one times base salary. In 2019, the Company will update written agreements with the Chairman for Board approval to formally incorporate this change.

140 2018 | ANNUAL REPORT
Board Report
Other BenefitsWe offer customary perquisites to our CEO and Chairman. The executive directors may also be entitled to usual and customary fringe benefits such as personal use of aircraft, company car and driver, personal/home security, medical insurance, accident and disability insurance, tax preparation, financial counseling and tax equalization. The Remuneration Policy also enables the Compensation Committee to grant other benefits to the executive directors in particular circumstances.
Tax Equalization
Action Taken Rationale
Tax equalization for executive directors Maintain respective home country taxation on all income for services, in the event of incremental taxes
The executive directors, by nature of their role in our geographically diverse company, may be subject to tax on their income for services in multiple countries. Given the executive directors are subject to tax on their worldwide income in their respective home countries, the Company studied the prevalent practice for handling incremental tax costs incurred by globally mobile executives. Based on that analysis, the Board decided to tax equalize all of the employment earnings, including equity income, to the executive directors’ respective home country effective tax rate, if incremental taxes over their home country tax rate would arise.
Stock OwnershipOur Board recognizes the critical role that executive stock ownership has in aligning the interests of management with those of shareholders. While the Company did not maintain a formal stock ownership policy, the current CEO’s stock holdings, when viewed as a multiple of his 2018 base salary, was significantly greater than common market practice of six times base salary. The company has taken under advisement a stock ownership and retention policy which is planned for implementation in 2019.
Recoupment of Incentive Compensation (Claw back Policy)The Company is dedicated to maintaining and enhancing a culture focused on integrity and accountability. Employment agreements with members of management, including its executive officers, and also the EIP, allow the Company to recover, or “claw back”, incentive compensation, including the ability to retroactively adjust if any cash or equity incentive award is predicated upon achieving financial results and the financial results were subject to an accounting restatement. In addition, the CEO and each of the Company’s executive officers will repay net amounts received for their 2016, 2017 and 2018 annual bonuses, restricted share units and performance share units if, during the two years after payment, (i) FCA restates its financial statements for any vesting or performance period covered by the compensation (a “covered period”), (ii) “cause”, as defined in executive’s employment agreement, existed during a covered period, or (iii) the executive engaged in certain conduct that has been materially injurious to the Company.
Corporate Governance

2018 | ANNUAL REPORT 141
Equity Incentive Plan - Long Term Incentive Program
2014 - 2016 2014 - 2017 2014 - 2018 2017, 2018 and 2019 Vesting
Performance PeriodsAwards subject to reduction/cancellation/recovery
based on claw back policy
1st, 2nd and 3rd tranche equity awards based on 2014 – 2016, 2014 – 2017 and 2014 - 2018 performance achieved, respectively
Award in share of common stock
Annual Bonus Plan
2016, 2017 and 2018 2016, 2017 and 2018 Claw back
Annual Performance Periods Awards subject to reduction/cancellation/recovery
Results based on performance in 2016, 2017 and 2018 Awards in cash in first quarter of 2017, 2018 and 2019
Insider Trading PolicyThe Company maintains an insider trading policy applicable to all directors, employees, members of the households and immediate family members (including spouse and children) of persons listed and other unrelated persons, if they are supported by the persons listed. The insider trading policy provides that the aforementioned individuals may not buy, sell or engage in other transactions in the Company’s stock while in possession of material non-public information; buy or sell securities of other companies while in possession of material non-public information about those companies they become aware of as a result of business dealings between the Company and those companies; disclose material non-public information to any unauthorized persons outside of the Company; or engage in hedging transactions through the use of certain derivatives, such as put and call options involving the Company’s securities. The insider trading policy also restricts trading to defined window periods which follow the Company’s quarterly earnings releases.
Prohibition on Short Sales (Anti-hedging)To ensure alignment with shareholders’ interest and to further strengthen our compensation risk management policies and practice, the Company’s insider trading policy prohibits all individuals to whom the policy applies from engaging in a short sale of the Company’s or its subsidiaries’ securities and derivatives (such as options, puts, calls, or warrants).
Remuneration for Non-Executive DirectorsRemuneration of non-executive directors is set forth in the Remuneration Policy. The current remuneration for the non-executive directors is shown in the table below.
Non-Executive Director Compensation U.S.$
Annual cash retainer 200,000
Additional retainer for Audit Committee member 10,000
Additional retainer for Audit Committee Chair 20,000
Additional retainer for Compensation/Governance Committee member 5,000
Additional retainer for Compensation/Governance Committee Chair 15,000
Additional retainer for Lead Independent Director 25,000

142 2018 | ANNUAL REPORT
At the 2017 annual general meeting of FCA shareholders, the Company’s shareholders approved amendments to the Remuneration Policy to introduce the principle that non-executive directors are paid in cash. Pursuant to the amendment, implemented shortly after the 2017 annual general meeting of shareholders, non-executive directors are to be paid in cash, and no longer have the option to elect to receive their annual retainer fee, committee membership, and committee chair fee payments in the form of common shares. Remuneration of non-executive directors is fixed and not dependent on the Group’s financial results. Non-executive directors are not eligible for variable compensation and do not participate in any incentive plans. Non-executive directors are also entitled to certain automobile perquisites, which are subject to taxes for the imputed income on the purchase or lease of Company vehicles.
Directors’ CompensationThe following table summarizes the remuneration paid or awarded to the members of the Board of Directors for the year ended December 31, 2018.
Directors of FCAOffice held
In office from/to
Annual fee(cash)
(€)
Annual incentive (equity)(1)
(€)
Annual incentive (bonus)(2)
(€)
Other compensation
(€)
Pension & similar
benefits(7)
(€) Total (€)
ELKANN John Philipp Chairman01/01/2018 -
12/31/2018 1,693,545 — — 875,944(3) 549,000 3,118,489
MARCHIONNE SergioFormerCEO
01/01/2018 - 07/20/2018 1,975,803 284,671 — 4,369,176(4) 4,336,905 10,966,555
MANLEY Michael CEO07/21/2018 -
12/31/2018 600,442 1,687,075 310,766 89,817(5) 292,329 2,980,429
ABBOTT John Director04/13/2018 -
12/31/2018 84,677 — — — — 84,677
AGNELLI Andrea Director01/01/2018 -
12/31/2018 169,355 — — — — 169,355
BRANDOLINI D’ADDA Tiberto Director01/01/2018 -
12/31/2018 169,355 — — 1,074 — 170,429
EARLE Glenn Director01/01/2018 -
12/31/2018 186,290 — — 18,392(6) — 204,682
MARS Valerie Director01/01/2018 -
12/31/2018 182,056 — — 8,044(6) — 190,100
SIMMONS Ruth J. Director01/01/2018 -
12/31/2018 173,588 — — 6,917(6) — 180,505
THOMPSON Ronald L. Director01/01/2018 -
12/31/2018 198,992 — — 6,917(6) — 205,909
VOLPI Michelangelo A. Director01/01/2018 -
12/31/2018 173,588 — — — 173,588
WHEATCROFT Patience Director01/01/2018 -
12/31/2018 182,056 — — 11,819(6) — 193,875
ZEGNA Ermenegildo Director01/01/2018 -
12/31/2018 182,056 — — 9,186(6) — 191,242
Total 5,971,803 1,971,746 310,766 5,397,286 5,178,234 18,829,835(1) For the former CEO, for the year ended December 31, 2018 the Company recognized a net share-based compensation expense of €284,671.
This expense includes €4.3 million of prior period expense that has been reversed in 2018 as a result of the forfeiture of 683,583 units in accordance with the Special Equity Vesting Terms included in the formers CEO’s employment agreement. The CEO received a one-time grant for his CEO service during the period July 21, 2018 - December 31, 2018, the Company recognized a share-based compensation expense of €1,687,075 relating to this grant.
(2) The annual incentive represents the bonus earned for performance year 2018 which will be paid in 2019.(3) The stated amount includes the use of transport and insurance premiums.(4) The stated amount includes insurance premiums, tax preparation and tax equalization.(5) The stated amount includes the use of transport and financial counseling.(6) The stated amount refers to certain automobile perquisites, which are subject to taxes for the imputed income on the purchase or lease of
Company vehicles(7) The amounts reflect pension, retirement and similar benefits set aside or accrued for Directors for the year ended December 31, 2018.
Board Report
Corporate Governance
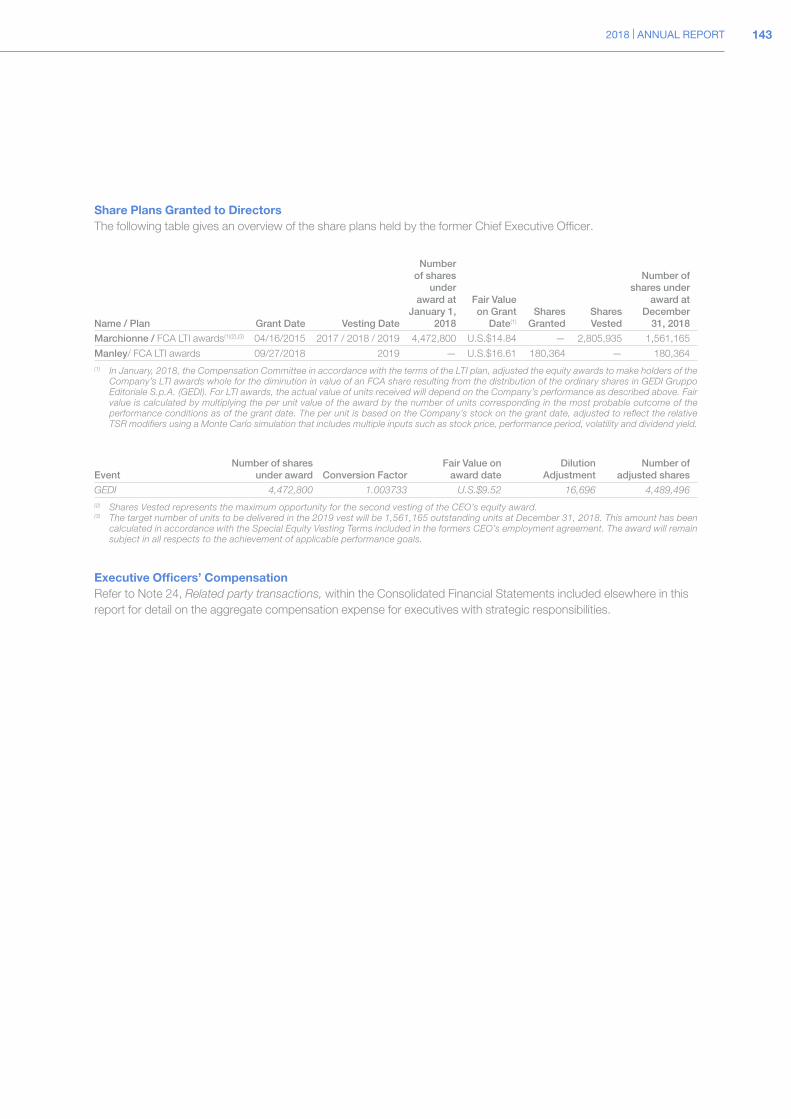
2018 | ANNUAL REPORT 143
Share Plans Granted to DirectorsThe following table gives an overview of the share plans held by the former Chief Executive Officer.
Name / Plan Grant Date Vesting Date
Number of shares
under award at
January 1, 2018
Fair Value on Grant
Date(1)
Shares Granted
Shares Vested
Number of shares under
award at December
31, 2018
Marchionne / FCA LTI awards(1)(2),(3) 04/16/2015 2017 / 2018 / 2019 4,472,800 U.S.$14.84 — 2,805,935 1,561,165
Manley/ FCA LTI awards 09/27/2018 2019 — U.S.$16.61 180,364 — 180,364(1) In January, 2018, the Compensation Committee in accordance with the terms of the LTI plan, adjusted the equity awards to make holders of the
Company’s LTI awards whole for the diminution in value of an FCA share resulting from the distribution of the ordinary shares in GEDI Gruppo Editoriale S.p.A. (GEDI). For LTI awards, the actual value of units received will depend on the Company’s performance as described above. Fair value is calculated by multiplying the per unit value of the award by the number of units corresponding in the most probable outcome of the performance conditions as of the grant date. The per unit is based on the Company’s stock on the grant date, adjusted to reflect the relative TSR modifiers using a Monte Carlo simulation that includes multiple inputs such as stock price, performance period, volatility and dividend yield.
EventNumber of shares
under award Conversion FactorFair Value on
award dateDilution
AdjustmentNumber of
adjusted shares
GEDI 4,472,800 1.003733 U.S.$9.52 16,696 4,489,496(2) Shares Vested represents the maximum opportunity for the second vesting of the CEO’s equity award.(3) The target number of units to be delivered in the 2019 vest will be 1,561,165 outstanding units at December 31, 2018. This amount has been
calculated in accordance with the Special Equity Vesting Terms included in the formers CEO’s employment agreement. The award will remain subject in all respects to the achievement of applicable performance goals.
Executive Officers’ CompensationRefer to Note 24, Related party transactions, within the Consolidated Financial Statements included elsewhere in this report for detail on the aggregate compensation expense for executives with strategic responsibilities.

144 2018 | ANNUAL REPORT
Board Report
Non-Financial Information
Non-Financial Information
IntroductionFCA recognizes that our environmental and social activities affect not only our aspiration to grow the business but also our commitment to positively affect our world. Due to the complexity of the automotive industry’s value chain and product offering, FCA impacts a large number and wide variety of stakeholders. We aim to create value through our relationships and connections with customers, employees, dealers, suppliers and communities, among others.
Emerging trends, evolving consumer attitudes and regulatory requirements influence not only which products and services we develop, but also how we develop them. FCA incorporates the concept of a circular economy into its business approach, focusing on reducing waste in every link in the value chain from vehicle design through production, distribution, use and eventual reuse of materials.
Our efforts to achieve progress toward the business plan objectives reflect our commitment to create long-term value responsibly, with full recognition of the broader role the Company plays.
To achieve our objectives, the Group targets:
a governance model based on transparency and integrity;
safe and sustainable products;
a competitive product offering and innovative mobility solutions;
effective communication with consumers;
constructive management and professional development of employees;
safe working conditions and respect for human rights;
mutually beneficial relationships with business partners and local communities; and
responsible management of manufacturing and non-manufacturing processes to reduce impacts on the environment.
Sustainability GovernanceSeveral entities within the Group, primarily those referred to below, help direct a disciplined approach to sustainability management.
The Board of Directors, composed of both executive and non-executive members, is responsible for the management and strategic direction of the Group in view of long-term value creation. The Board’s Governance and Sustainability Committee evaluates proposals related to strategic sustainability initiatives, advises the full Board as necessary, and reviews the annual Sustainability Report. For a full description of the Committee’s responsibilities, refer to the section CORPORATE GOVERNANCE elsewhere in this report.
The Chief Executive Officer (“CEO”) is supported by the Group Executive Council (“GEC”), a group led by the CEO and composed of senior leadership from regional operations, brands, industrial processes, and support/corporate functions. The GEC approves operating guidelines and plays a vital role in ensuring that sustainability efforts are aligned with economic and business objectives.
The Chief Audit, Sustainability and Compliance Officer is also a member of the GEC and coordinates the activities of the Sustainability Team. The Sustainability Team, with members located in Italy, Brazil, China and the U.S., facilitates the process of continuous improvement, contributing indirectly to risk management, cost optimization, stakeholder engagement and effective communication to stakeholders of its commitments and results.

2018 | ANNUAL REPORT 145
Integrity of Business ConductThe foundation of FCA’s governance model is the Code of Conduct and a collection of supporting statements that reflect our commitment to a culture dedicated to integrity, responsibility and ethical behavior.
For further information about our Code of Conduct, refer to the CORPORATE GOVERNANCE section elsewhere in this report.
The FCA integrity system is comprised of these primary elements:
Principles that capture the Company commitment to important values in business and personal conduct;
Practices that are the basic rules that must guide our daily behaviors required to achieve our overarching Principles;
Procedures that further articulate the Company’s specific operational approach to achieving compliance and that may have specific application limited to certain geographical regions and/or businesses as appropriate; and
Statements, including Guidelines, that cover specific issues to emphasize the Company’s accountability and commitment to a culture of responsibility, integrity and ethical behavior. These cover, among others, matters related to human rights, competition, sustainability for suppliers, environmental management and Conflict Minerals.
FCA disseminates the Principles established in the Code of Conduct to employees. Employees are provided training about ethics and compliance, with particular focus on the Code of Conduct, anti-corruption, corporate governance and human rights, including non-discrimination. Further, FCA employees may also seek advice concerning the application and interpretation of the FCA Code of Conduct by contacting their immediate supervisor, Human Resources representatives, the Legal Department and the Ethics Helpline.
Unless local law provides otherwise, employees must report violations of law, regulation or Company policy of which they become aware, including but not limited to, issues involving vehicle safety, vehicle emissions, financial reporting, or reports to governmental authorities. Any failure in reporting such violations could place the Company at risk, and may be the subject of disciplinary action.
To allow the reporting of concerns and ensure the protection of individuals raising a concern, the previous channels of the whistleblowing management system were consolidated in 2015 into the FCA Ethics Helpline. The Ethics Helpline offers a worldwide, common and independent intake channel via telephone (38 dedicated numbers in 22 languages) and web to report any concerns of alleged situations, events, or actions that may be inconsistent with the Code of Conduct. It is managed by an independent provider, available 24 hours a day, seven days a week. FCA has chosen this reporting channel to meet compliance needs and maintain a continuous reporting environment.
In 2018, a new module was created within the FCA Ethics Helpline to assist the workforce in the management of conflicts of interest or other potential conflicts.
In addition, the FCA Ethics Helpline also allows employees, suppliers, dealers, consumers and other stakeholders to request advice about the application of the Code of Conduct (for example, to verify definitions of terms or restrictions under the Code).
Anti-Corruption and BriberyIncluded in FCA’s Code of Conduct are, among others, rules related to anti-bribery, anti-corruption, anti-competitive behavior and conflicts of interest.
FCA is committed to the highest standards of integrity, honesty and fairness in all internal and external affairs and will not tolerate any kind of bribery.
The Group’s policy is that no one - director, officer, or other employee, agent or representative - shall, directly or indirectly, give, offer, request, promise, authorize, solicit or accept bribes or any other perquisite in connection with their work for the Company. A violation of anti-bribery and anti-corruption laws is a serious offense for both companies and individuals, which can result in significant fines, reputational damage and imprisonment of individuals.
The policy requires that each FCA company that contracts with third parties shall adopt all appropriate measures to ensure that sufficient background checks and other appropriate due diligence procedures have been performed with respect to third parties under consideration, prior to finalizing any agreement among parties.

146 2018 | ANNUAL REPORT
Board Report
Non-Financial Information
Alleged violations are reported through the same channels as other types of potential violations, including the FCA Ethics Helpline website and telephone contact list available on our corporate website.
Human RightsFCA’s commitments include efforts directed to the prevention of adverse human rights conditions.
The Group requires the adoption of internationally recognized principles for the respect and support of fundamental human rights in every geographic area where FCA companies operate. FCA promotes these principles within its sphere of influence, expecting its suppliers, contractors and other business partners, with whom it does business, to adhere to these principles.
The Company is committed to adopting, maintaining and improving systems and processes designed to eliminate slavery and human trafficking from our supply chains or in any part of our business. In 2018, Practices were added under the Code of Conduct and communicated to further address these concerns, including “Protecting Our Workforce” and “Child and Forced Labor Prohibited”.
The FCA Human Rights Guidelines, publicly available, are consistent with the spirit and intent of the United Nations Universal Declaration of Human Rights, the United Nations Guiding Principles on Business and Human Rights (“Ruggie Framework”), the United Nations Sustainable Development Goals, the OECD Guidelines for Multinational Companies, the Declaration on Fundamental Principles and Rights at Work of the International Labour Organization (“ILO”), and the Modern Slavery Act 2015.
The Human Rights Guidelines cover the rights we seek to ensure for, and with, our major stakeholders:
Employees: FCA prohibits the use of child and forced labor. We seek to provide a diverse and inclusive workplace, free from discrimination and harassment. We recognize and respect workforce members’ freedom of association and are committed to providing employment conditions that are competitive and compliant with all applicable employment, wage and working hour laws. FCA conducts all of its worldwide operations with the highest regard for the health and safety of its workforce in accordance with applicable laws and is dedicated to continuously improving health and safety measures to help ensure that the potential for injury in the workplace is minimized.
Customers: FCA is committed to offering safe, reliable, high-quality vehicles to our customers.
Communities: FCA is committed to socially responsible engagement with the communities where we have operations.
Business partners and suppliers: FCA expects our suppliers, contractors and other business partners with whom we do business, to adhere to our human rights standards. They are also required to comply with all occupational health and safety related rules and regulations, and to adopt measures and standards that contribute to an overall improvement in occupational health and safety performance throughout the value chain. For more information, refer to the Supply Chain section included elsewhere in this report.
Our due diligence processes include actions intended to safeguard against human rights abuses in any part of our business and in our supply chain.
As part of our initiative to internally identify and mitigate any related risks, the following tools have been developed:
an annual survey aimed at detecting any case of child and forced labor at worldwide FCA companies, including those located in countries that have not ratified International Labour Organization Conventions on these issues. In 2018, no incidents of child labor or forced and compulsory labor were reported in any of the companies mapped; and
a Human Rights survey performed by the Internal Audit department as part of the standard internal audit process, in order to cover due diligence requirements of the Ruggie Framework. Checks are also performed in those countries with a high risk based on the yearly Audit Plan. FCA strengthened the checklist risk items related to child labor and young workers, forced labor, non-discrimination, conditions of employment, security and supply chain management. The human rights self-assessment compliance checklist was performed by individual legal entities and reviewed by FCA’s Internal Audit and Compliance organization, with a coverage of 74% of the FCA workforce worldwide.

2018 | ANNUAL REPORT 147
We regularly monitor risks related to human rights in our supply chain through two main monitoring tools:
the FCA Supplier Sustainability Self-Assessment (“SSSA”) covering labor practice, human rights, ethics, diversity, and health and safety aspects, among others; and
on-site audits conducted at high-risk supplier plants by either internal Supplier Quality Engineers or third-party auditors.
Alleged human rights violations are reported through the same channels as other types of potential violations, including the FCA Ethics Helpline website and telephone contact list available on our corporate website.
Materiality Analysis and RisksEach year, FCA conducts an analysis of sustainability-related topics which may be considered material to the Company. “Material” in this sense differs from the financial definition, and represents information determined to be of interest to internal and external stakeholders due to its economic, environmental or social impact. Material aspects include the most important factors that relate to, and have an impact on, FCA’s ability to create long-term value for its stakeholders.
The evaluation of material aspects involves consideration of factors such as stakeholder input, business plan targets, corporate values, industry trends, information of interest for investors, societal standards and expectations.
In addition, key global risks that have been identified through FCA’s risk management framework are also examined for their relevance to the Company’s sustainability profile and impact. These risks encompass a broad array of topics, including regulatory compliance, product portfolio, product quality and customer satisfaction, supply chain, talent management, and technology development.
For more information regarding the key global focus risks identified by FCA and control measures taken, refer to the section RISK MANAGEMENT elsewhere in this report.
Gathering stakeholder input to determine materiality is an ongoing process. As a global enterprise with a complex, intricately connected value chain, FCA engages with a wide range of stakeholders, including employees, customers, suppliers, dealers, institutions, investors, trade unions, associations and local communities.
The Group annually conducts surveys and stakeholder engagement activities focused on sustainability topics. FCA has a target to expand and innovate the sustainability dialogue with stakeholders, in the belief that these activities are an essential part of a robust sustainability program. They help us to better identify risks and opportunities, as well as to align our objectives to social, technological and regulatory changes around the globe. In each of the regions where FCA operates, these stakeholder initiatives are adapted to locally relevant topics and needs.
The conclusions from our analysis of the various factors, together with the results from our stakeholder engagement activities and survey, are presented on the Materiality Diagram, which charts the relative importance of issues for both internal and external stakeholders.
This materiality assessment is used to help prioritize issues in our sustainability-focused reporting as well as to set targets to address the material aspects that have been identified.
As a result, FCA has long-term sustainability-focused targets covering priority areas such as quality and safety of vehicles; environmentally responsible products, plants and processes; corporate governance; a healthy, safe and inclusive work environment; and constructive relationships with local communities and business partners. These areas were confirmed during the 2018 assessment as relevant for internal and external stakeholders in the sustainability materiality diagram and are also connected to the key risk factors identified by the risk management framework.

148 2018 | ANNUAL REPORT
Board Report
Non-Financial Information
Environmental Impacts from OperationsFCA’s environmental stewardship endeavors to achieve objectives on two fronts: to reduce its environmental footprint while also contributing to the Company’s financial success through reduced production costs.
FCA’s Environmental Guidelines specify our commitment to address environmental and climate change issues by aiming to:
reduce energy consumption through more efficient production processes;
limit emissions of greenhouse gases and other pollutants from manufacturing operations, by reducing the amount of energy we use, implementing innovative technical solutions, and promotion of renewable energy sources;
reduce consumption of fresh water in all areas, especially where its availability is critical to the surrounding environment and population, increase its reuse and recycling, and minimize emissions of hazardous substances to water from manufacturing;
foster responsible water consumption as part of the commitment we share with our suppliers;
minimize the use of raw materials by promoting renewable and recycled materials in our production processes;
2018 FCA Materiality Diagram
Product Environment Social
Incr
easi
ng r
elev
ance
for
exte
rnal
sta
keh
old
ers
Increasing relevance for internal stakeholders
Engagement with business partners
Raw materials sourcing
Community engagement
Emissions from logistics
Biodiversity conservation
Recycled and recyclable materials
Waste management
Emissions from operations
Business integrity
Vehicle safety
Vehicle quality
Customer satisfaction
Research and innovation
Vehicle fuel economy
Vehicle CO2 emissions
Hybrid, electric systems
Employee health and safety
Employee well-being and work-life balance
Renewable energy
Water consumption
Energy consumption
Risk management
Human rights
Alternative fuels
Alternative mobility solutions
Employee diversity and equal opportunity
Employee development

2018 | ANNUAL REPORT 149
encourage the use of reusable and environmentally friendly packaging and containers in order to increase material savings and reduce waste;
minimize the generation of waste:
by implementing procedures designed to manage waste throughout our processes; and
by limiting the use of potentially hazardous substances and promoting their substitution wherever possible;
preserve natural habitats and their biodiversity in areas surrounding our sites.
FCA has also adopted Logistics Guidelines that detail the methods we strive to employ in moving millions of parts and vehicles worldwide each year.
The Group has implemented an Environmental Management System (“EMS”) worldwide, aligned with ISO 14001 standards. The EMS consists of a system of methodologies and processes designed to prevent or reduce the environmental impact of the Group’s manufacturing activities through, for example, reductions in emissions, water consumption and waste generation, and conservation of energy and raw materials.
A key contributor to our environmental stewardship is the adoption of the World Class Manufacturing (“WCM”) program. WCM was first adopted more than 10 years ago and has been implemented in nearly all FCA plants worldwide. WCM is a structured production system that promotes sustainable, systematic improvements aimed to evaluate and address all types of wastes and losses (including injuries) at our manufacturing operations by applying methods and standards with rigor, and with the involvement of the entire workforce.
The projects developed within WCM are designed to reduce losses and waste; increase productivity; and improve quality and safety in a systematic manner, aiming to ultimately reach zero accidents, zero waste, zero breakdowns and zero inventories. In 2018, about 70,000 WCM-related projects were implemented, including approximately 5,000 specifically targeted at reducing environmental impacts and natural resource consumption.
Energy Consumption and EmissionsThe Group seeks solutions that enable further reductions in greenhouse gas emissions and the use of fossil fuels. Over time, these solutions have generated significant savings in energy-related costs.
Energy consumption in 2018 was about 45 million gigajoules (“GJ”). At mass-market vehicle assembly and stamping plants, energy consumption per vehicle produced recorded a decrease of about 17 percent compared with 2010 (from 7.4 to 6.1 GJ).
Manufacturing energy consumption
FCA worldwide (million gigajoules) 2018 2017 2016
Total energy consumption 45.3 44.5 43.9
Total CO2 emissions from manufacturing processes was 3.6 million tons, which was well below the 2010 level on both a total and per vehicle produced basis. Emissions of CO2 per vehicle produced at mass-market vehicle assembly and stamping plants decreased about 27 percent in the last eight years, falling from 0.62 tons per vehicle produced in 2010 to 0.45 tons per vehicle produced in 2018. FCA is targeting for 2020 a 32 percent reduction in CO2 emissions per vehicle produced compared with the 2010 baseline.
Manufacturing CO2 emissions
FCA worldwide (million tons of CO2) 2018 2017 2016
Total CO2 emissions 3.6 3.5 3.6
In 2018, FCA continued to make extensive use of energy from renewable sources. In Brazil, where the majority of our South American plants are located, electricity originates almost entirely from renewable sources. Energy from renewable sources used in Group production processes represented about 15 percent of total electricity consumption in 2018.

150 2018 | ANNUAL REPORT
Board Report
Non-Financial Information
Other Manufacturing Emissions(1)
Estimated emissions of other substances based on direct fuel consumption for energy production slightly increased in 2018 as a result of higher natural gas consumption and the increased production at our foundries. Dust also increased slightly.(2)
Direct emissions of NOx, SOx and dust
FCA worldwide (thousands of tons) 2018 2017 2016
NOx 1.3 1.3 1.2
SOx 0.1 0.1 0.1
Dust 0.1 0.1 0.1(1) Only emissions related to energy generation which are material and/or applicable for our production processes are reported.(2) Also referred to as Particulate Matter.
Water ManagementFCA aims to responsibly manage the entire water cycle, starting from water withdrawal from municipal water suppliers or natural sources; through use and reuse of recycled water for cooling, cleaning and sanitation; and including discharge, which occurs after passing through a treatment method to eliminate pollutants. FCA has focused particularly on the adoption of technologies and procedures to increase recycling and reuse of water, and to decrease the level of pollutants in discharged water. The Group adopted a new risk assessment method in 2016 to evaluate water stressed areas and conduct scenario analyses to mitigate future climate change impacts in order to identify those plants located in areas where water is considered a limited resource. In 2018, no plant was located in an area identified as at high overall water risk (according to WRI Aqueduct).
Total water withdrawal in 2018 decreased compared with 2017 at 21.7 million cubic meters and was below the 2010 level on both a total and per vehicle produced basis. In 2018, mass-market vehicle assembly and stamping plants reduced water consumption per vehicle produced by about 38 percent compared with 2010.
Manufacturing water withdrawal
FCA worldwide (million m3) 2018 2017 2016
Total water withdrawal 21.7 21.9 22.3
For 2020, FCA is targeting a 40 percent reduction in water withdrawn per vehicle produced compared with 2010.
Waste ManagementTo reduce the consumption of raw materials and related environmental impacts, FCA has implemented procedures to pursue optimal recovery and reuse with minimal waste. We strive to recycle what cannot be reused. If neither reuse nor recovery is possible, waste is disposed of using the method available that has the least environmental impact, with landfills only used as a last resort.
As a result of continued improvements in waste management, FCA achieved a 4 percent year-over-year reduction in total waste generated.
Mass-market vehicle plants, which account for the majority of total waste generated, reduced waste to landfill either to zero or very close to zero.
In mass-market vehicle assembly and stamping plants, the quantity of waste generated per vehicle produced in 2018 decreased by about 62 percent compared with 2010 (from 217 to 83 kg/vehicle produced). The significant decrease from 2016 to 2017 was the result of waste reduction initiatives and the alignment in NAFTA to country-specific waste exemptions.
Manufacturing waste generated
FCA worldwide (million tons) 2018 2017 2016
Total waste generated 0.9 0.9 1.3

2018 | ANNUAL REPORT 151
Responsible ProductsFCA’s approach to responsible vehicle development includes dedication to efficient powertrains, improved aerodynamics, weight reduction, safety, quality, increased use of renewable materials, and innovative mobility options that include autonomous technology and connectivity solutions. Economically viable results can best be achieved by combining, where technologically possible, conventional and alternative technologies, while recognizing and accommodating the different regulatory requirements of each market. FCA acknowledges the challenges posed by climate change and has established targets to contribute to the goal of transitioning to a low-carbon future.
For more information regarding the areas of focus of our research efforts, refer to the section Overview of Our Business-Research and Development elsewhere in this report.
FCA designs, manufactures and sells our vehicles with a focus on compliance with a variety of comprehensive local, regional and national statutes and regulations, with respect to vehicle emissions, fuel economy, end-of-life vehicle management and the chemical composition of our parts. The Company strives to reduce CO2 emissions and improve fuel economy in response to the unique regulatory requirements of FCA’s major markets. For more information regarding regulatory requirements in the various markets, refer to the section - Environmental and Other Regulatory Matters elsewhere in this report. For a discussion of emissions-related regulatory matters in certain markets, see Note 25, Guarantees granted, commitments and contingent liabilities included within the Consolidated Financial Statements elsewhere in this report.
In the European Union (“EU”), FCA has set a target to achieve a 40 percent reduction in CO2 emissions by 2020 compared with the baseline of 2006 for mass-market cars sold in Europe.
The average CO2 emissions of FCA’s mass-market cars was 119.2 g/km in 2017. This represents a 21 percent decrease compared with 2006 (the benchmark year used in EU regulations to set the 2012-2015 and 2020 targets), and a 26 percent reduction compared with 2000, which was the first year the EU Commission monitored average emissions. FCA’s CO2 emissions data for 2018 is not yet available under the process required by Regulation (EC) No. 443/2009. The NEDC procedure will be maintained as reference for monitoring EU target on average CO2 emissions until 2020.
For the U.S. market, FCA has a target to actively pursue actions in support of the U.S. EPA/NHTSA industry goal and described the plan for achievement of this objective in the business plan.
FCA has also set a target to achieve at least a five to 15 percent improvement in fuel economy for major renewals of FCA US vehicles compared with replaced vehicles/models. This target has been achieved, and in some cases surpassed, in the years since it was established.
The all-new 2018 Jeep Wrangler achieved an improvement in fuel economy of over 30 percent versus the preceding model by reducing vehicle energy demand, implementing a 2.0-liter turbocharged variant of the global medium engine family, and deploying eTorque assist mild hybrid technology. The eTorque system captures braking energy and uses it to assist the vehicle during launch and in other transient situations to reduce fuel consumption in everyday driving.
At FCA’s Capital Markets Day held on June 1, 2018, FCA revealed the new 2018-2022 business plan, which presented our expectation to continue reducing CO2 emissions through a collection of technologies that will vary by market, aligning with the vehicle mix, consumer needs and the regulatory framework. The plan anticipates that we will offer 12 electrified propulsion systems (battery electric, plug-in hybrid electric, full-hybrid and mild-hybrid) in global architectures spanning the full range of vehicle segments. The plan also anticipates that by 2022, 30 nameplates will feature one or more of these systems. Specific applications will align with the attributes of each FCA brand’s attributes. These vehicles will join the Chrysler Pacifica Hybrid, which started production in late 2016.
Autonomous Driving, Connectivity and MobilityAs part of our commitment to offer new services that improve the mobility experience and provide greater access to affordable solutions, FCA has set a 2020 target to pursue research, advance development and delivery of new sustainable connectivity and mobility solutions that are economically viable for both FCA and our customers.

152 2018 | ANNUAL REPORT
Board Report
Non-Financial Information
To support this commitment, FCA is pursuing a multi-partner strategy for developing advanced driver assistance and autonomous driving technologies, working with leaders in their respective industries. We are collaborating with Waymo, Google’s self-driving technology company, to integrate its self-driving technology into the Chrysler Pacifica Hybrid. We are partnering with BMW for Level 3 autonomy and Aptiv for Level 2+ advanced driver assistance retail solutions. FCA is also developing a new global standardized connectivity solution to connect the car to the Internet and a cloud-based FCA-specific service delivery platform.
We aim to provide our customers with new mobility solutions that fit their changing needs such as the subscription-based car ownership program announced in 2018. This monthly subscription service is expected to give customers access to FCA portfolio vehicles and the ability to exchange the vehicle for another FCA brand and model.
This type of solution is in addition to our existing mobility options such as Enjoy. Enjoy is a car-sharing service that offers a fleet of Fiat 500 and Doblò vehicles to urban drivers in Italy. It was launched in Milan by Eni, an energy company, at the end of 2013 in partnership with FCA which provided approximately 2,500 vehicles. Since the service was launched, approximately 830,000 individuals in six metropolitan areas have signed up to use it and approximately 18 million rentals have been logged.
FCA also supports individuals with special mobility needs. For an individual with a disability, accessible vehicle mobility can offer an increased level of independence. At FCA, the Autonomy and DriveAbility programs are designed to help customers with permanent disabilities by providing financial assistance toward the purchase of appropriate customizable adaptive equipment.
Materials and Life Cycle AssessmentThe materials used in our products impact the environmental footprint of our vehicles at all stages of their life cycle.
FCA performs Life Cycle Assessments of selected vehicles and components which enable the Company to evaluate their environmental impacts and to implement a circular economy approach. FCA has a target to offer new products with environmental performance certification through the integration of ISO 14040/44, compliant to Life Cycle Assessment methodologies.
EU Directive 2000/53 addresses the principle of extended producer responsibility, which stipulates that automakers must manage the end of life of the products they place on the market. FCA addresses this EU Directive through the design of recyclable and recoverable vehicles, the management of the end of life vehicles free take-back networks, the sharing of dismantling information and the continuous efforts to achieve the reuse/recycling/recovery targets in EU countries.
FCA focuses on Substances of Concern (“SoC”) identified in globally regulated substance restrictions like the REACH (Registration, Evaluation, Authorization and Restriction of Chemicals) regulation and heavy metals ban. The same level of awareness and commitment to compliance is also adopted by FCA suppliers with whom we collaborate closely in identifying technically equivalent and environmentally sustainable substitutes for substances that are expected to be restricted in the near future.
Customer ExperienceFCA aims to reinforce customer relationships by creating positive experiences throughout the ownership process. We focus our efforts on the entire customer experience through both traditional products and services and more customized solutions.
Vehicle Safety and QualityVehicle safety and quality are key elements of the overall customer experience. Delivering safe products to our customers is a fundamental and unwavering objective of FCA, and is among the essential responsibilities described in our Code of Conduct. In 2018, FCA expanded our communication and enhanced the existing FCA Ethics Helpline system worldwide to encourage suppliers, dealers and other stakeholders to report concerns related to vehicle safety, emissions or regulatory compliance. FCA employees are required under our Code of Conduct to report such issues.

2018 | ANNUAL REPORT 153
Vehicle SafetyFCA has adopted an approach that promotes a proactive vehicle safety culture within the industry and the Company. FCA offers active and passive features for diverse drivers and vehicle segments. The intent of active safety systems is to help drivers avoid crashes by assisting them to control their vehicles or alert them to potentially hazardous situations. These systems monitor surroundings, the status of the vehicle and driver behavior. Passive safety systems are designed to help mitigate the effects of a crash. These include occupant restraint technology and the use of more advanced materials that enable improved crash energy management.
In addition to our focus on safety systems, when potential vehicle safety issues arise, we promptly investigate and take corrective action, including initiating recall campaigns when appropriate.
As we continue efforts to deliver advancements in safety technologies, ratings from independent agencies help validate our progress. Independent agencies rate the comparative safety of vehicles across the industry in different regions. While the specific criteria vary, these ratings generally evaluate the level of safety provided for occupants during a crash as well as a vehicle’s ability to avoid a crash through the use of technology. Over the years, FCA vehicles have earned top ratings based on performance during assessments. For example, the 2019 Chrysler Pacifica was named a Top Safety Pick by the Insurance Institute for Highway Safety (“IIHS”) and the Fiat 500X was awarded the Latin NCAP 5-Star rating.
Vehicle QualityIn addition to safety, our ability to produce vehicles that meet product quality standards and gain market acceptance is central to FCA’s approach in earning and maintaining the trust and loyalty of customers. During vehicle development, our customer-focused approach to quality keeps the customers’ needs and expectations in mind, which may vary from market to market due to differences in driving experiences and local preferences such as vehicle size, fuel type and acceptance of new technology.
As part of our commitment to vehicle quality, FCA has set a target of achieving top quartile placement for the vehicle portfolio by 2020, based on the relevant competitive benchmark for each geographic region. This includes vehicle reliability as measured by rate of repair and survey results related to vehicle functionality and design. In 2018, the rate of repair in the first 90 days of ownership improved on average by approximately one percent globally. Things Gone Wrong (“TGW”) is an internal and external survey process which evaluates customer needs and behaviors related to vehicle functionality and design issues. In 2018, TGW improved on average by approximately two percent in three regions (NAFTA, EMEA and APAC). The LATAM region launched a new external survey methodology and is not included in the scope.
Product Quality and Customer Satisfaction, including product recalls, warranty obligations and other performance indicators related to our product portfolio, have been identified as key global focus risks through FCA’s risk management framework. For more information on this topic, refer to the section RISK MANAGEMENT elsewhere in this report.
Customer CommunicationCustomers have a variety of channels to communicate with FCA throughout their purchase and ownership experience. At FCA, we provide dedicated customer contact organizations that have been established worldwide. Customer Contact Centers (“CCC”), together with dealers, are the primary channels of communication between customers and the Company. There are 26 CCCs worldwide, with around 1,500 agents and supervisors who handled approximately 28 million customer contacts in 2018, offering a variety of services including information, complaint management and, in some locations, roadside assistance. They provide multilingual support with a strong focus on employing native speakers of 28 different languages.
WorkforceFCA endeavors to create a work environment that enables employees to collaborate in ways that transform differences into strengths, breaking down geographic and cultural barriers, and developing each person’s potential. The Company regards the diversity of its workforce as a key asset and does not tolerate any form of discrimination, as stated in the Human Rights Guidelines.
154 2018 | ANNUAL REPORT
Board Report
Non-Financial Information
FCA’s efforts to value every employee’s contribution are supported by long-term sustainability targets, specific initiatives addressed to inclusion and monitoring of related performance. Human Resource processes aim to monitor equal opportunity implementation worldwide and build a complete skill set within the Company.
The following examples from 2018 demonstrate FCA’s commitment:
20 percent of 198,545 employees were women;
88.8 percent of our employees worldwide were covered by collective bargaining, based on an average figure that includes the Sevel plant (Italy) and that covers a variety of situations in accordance with regulations and practices in the various countries;
in the non-unionized companies, 97.7 percent of employees not covered by collective bargaining benefited from conditions that are supplemental to, or better than, the minimum required by law;
approximately 8,900 fixed term employment contracts were converted to permanent during the year; an indication of the Group’s commitment to the long-term stability of the workforce; and
suitable opportunities for employees with disabilities were offered. In certain countries where FCA operates, legislation requires that companies employ a minimum percentage of disabled workers. Even where no specific regulations exist, Group companies are proactive in ensuring adequate accessibility to facilities and adaptation of workstations for the disabled.
Management and DevelopmentThe Group’s approach to employee management and development is embodied in the commitment to our leadership principles: we define leadership as leading change and leading people; we embrace and cherish competition; we aim to achieve best in class performance; we collaborate and simplify decision making, striving for speed, rigor and discipline in all we do; and we value diversity and inclusion.
These foundational elements are expected to influence every decision, including the appointment of leaders, as we continue to strive to be an organization of best-in-class talent in today’s automotive industry.
Performance and Leadership Management (“PLM”) is the appraisal system adopted worldwide to assess FCA employees’ performance (manager, professional and salaried). Through the PLM process, specific targets that contribute to the Company’s success are established to guide and assess employees on their results and leadership behaviors.
Performance and Leadership assessment involved approximately 53,000 Group employees worldwide in 2018.
Talent management and succession planning are also integral to employee management and development. In 2018, Talent Reviews identified individuals with leadership potential who merit additional attention and investment from the Company in their professional development.
Learning and development opportunities are provided through a number of activities, such as job rotations, coaching, mentoring and training. Recently, the Group launched an innovative learning platform that enables employees to grow and share their individual professional skills with colleagues in a learning community, working in teams and solving business challenges. In 2018, the Company deployed a second wave of our widespread training campaign focused on sustainability that was made accessible to about 40,000 employees worldwide to strengthen the awareness and engagement of the workforce on FCA commitments and achievements.
Health and Safety in the WorkplaceFCA aims to provide all employees with a safe, healthy and productive work environment at every site worldwide and in every area of activity. The Company focuses on identifying and evaluating safety risks; implementing safety and ergonomics standards; increasing the use of collaborative robots; promoting employee awareness and safe behavior; and encouraging a healthy lifestyle.

2018 | ANNUAL REPORT 155
FCA is further committed to establishing a strong culture of safety by applying an approach in which employee health and safety are considered more broadly in terms of worker well-being. Employees are involved in this process through training and initiatives designed to increase safety awareness, and by participating in a comprehensive system for gathering feedback and suggestions.
The goal of achieving zero accidents is formalized in the targets set by the Company, as well as through the global adoption of an Occupational Health and Safety Management System (“OHSMS”) certified to the OHSAS 18001 standard.
At year-end 2018, the vast majority of our plants had an OHSMS in place that was OHSAS 18001 certified.
Measures implemented over the years have contributed to significant improvements in all injury indicators. In 2018, the injury Frequency Rate was down more than 80 percent compared to 2010 (with 0.07 injuries per 100,000 hours worked) and the Severity Rate was down more than 70 percent compared to 2010 (with 0.03 days of absence due to injuries per 1,000 hours worked).
Effective safety management is also supported through the application of World Class Manufacturing tools and methodologies, active involvement of employees, development of specific competencies and targeted investment. Combined with these measures, FCA’s investment in health and safety has resulted in a progressive reduction in the level of risk attributed to Group plants in Italy by INAIL, the Italian accident and disability insurance agency. As a result, the Group was eligible for “good performer” premium discounts, which led to savings of more than €120 million from 2012 through 2018.
In addition to safety in the workplace, FCA offers numerous programs and services for employees and their families to promote and support individual safety, well-being and a healthy lifestyle. These include, but are not limited to, screening and vaccination, nutrition education initiatives, smoking cessation programs, HIV/AIDS prevention programs, and promotion of physical exercise through sports teams or clubs including Company areas dedicated to sports activities and/ or entering into agreements with local sports centers for use by employees and their families. Employees are encouraged to take advantage of these initiatives, which form an important part of the Group’s culture.
Supply ChainStrong supplier relationships built on cooperation and mutual understanding are vital to the effective sourcing of goods and services. Working as an integrated team with our supply chain helps develop responsible and sustainable practices that limit exposure to unexpected events and supply disruption.
Suppliers are selected based on the quality and competitiveness of their products and services, as well as on their respect of social, ethical and environmental principles. This commitment is a prerequisite to becoming an FCA supplier and developing a lasting business relationship with us.
The Company’s General Terms and Conditions require any new purchase order with suppliers to align with the principles set forth by FCA’s policies, including the FCA Code of Conduct and the FCA Sustainability Guidelines for Suppliers. If a supplier fails to meet these standards, a corrective action plan, jointly developed with FCA, is required. Additional actions may be adopted by FCA in case of non-compliance, including and up to termination of the business relationship.
In addition, potential suppliers, to be eligible, must demonstrate that they have adopted a code of conduct, a certified system for managing employee health and safety, and a program that promotes sustainability, both internally and along the supply chain. These conditions help ensure that they monitor and manage environmental aspects, labor practices, human rights, and their impact on society.
Supplier Sustainability Guidelines available on the FCA corporate website and on the FCA Supplier Portal require that Group suppliers adhere, at a minimum, to the following principles:
Human rights and working conditions;
rejection of the use of forced or child labor in any form;
recognition of the right to freedom of association in accordance with applicable laws;
freedom from harassment and discrimination;
156 2018 | ANNUAL REPORT
Board Report
Non-Financial Information
safeguarding of employee health and safety; and
guarantee of equal opportunities, fair working conditions, appropriate working time, equal compensation, and the right to training for employees.
Respect for the environment
optimized use of resources;
responsible waste management;
management of Substances of Concern in the manufacturing process;
development of low environmental impact products; and
use of an environmentally sustainable logistics system.
Business ethics
high standards of integrity, honesty and fairness; and
prohibition of corruption and money laundering.
We purchase a variety of components, raw materials, supplies, utilities, logistics and other services from numerous suppliers. These purchases have historically accounted for 70 - 80 percent of total cost of revenues. The cost of raw materials has historically comprised 10 - 15 percent of the previously described total purchases.
Our operations impact local economies and whenever possible, we utilize local suppliers near major locations of operation. This generates direct and indirect income and employment opportunities in the communities where the business is located while minimizing transport-related environmental impacts. Local suppliers are those with manufacturing operations that supply an FCA plant located in the same country. For example, in recent years more than 75 percent of our spending at our plants in Brazil has originated from in-country suppliers.
Environmental and Social Impacts of the Supply ChainFCA works to prevent or mitigate adverse environmental or social impacts that may be directly linked to our own business activities or to products and services from our suppliers. The auto industry’s supply chain is highly complex, and involves suppliers and sub-tier suppliers of commodities ranging from raw materials through finished components. Suppliers play a key role in the continuity of our activities and can have a significant impact on the external perception of our social and environmental responsibility.
FCA evaluates the sustainability profile of suppliers through the FCA Supplier Sustainability Self-Assessment (“SSSA”). This survey covers environmental, labor practice, human rights, compliance, ethics, diversity, and health and safety aspects. The results of the SSSA and other criteria are used to create a risk map to identify suppliers that may be at risk, and that require further investigation through focused audits.
Because our environmental footprint extends beyond the boundaries of our own manufacturing locations, FCA supports our suppliers in addressing climate change issues, which includes reducing greenhouse gas emissions. In 2018, the Group once again invited selected suppliers to participate in the CDP Supply Chain program. In 2018, 185 suppliers disclosed (71 percent response rate). The goal is to engage 90-100 percent of our top strategic suppliers in the program by 2020.
Sustainability standards and performance along the value chain also include aspects related to international human rights standards and labor laws.
FCA collaborates with peers, suppliers and other stakeholders on issues related to human rights and working conditions throughout the supply chain. In addition to Conflict Minerals, this focus includes the mica and cobalt supply chains, which also have risks associated with child and forced labor. To help combat these and other relevant supply chain issues, including slavery and human trafficking, we engage with automotive industry groups such as the Automotive Industry Action Group (“AIAG”) and cross-sector groups like the Responsible Minerals Initiative (formerly “CFSI”).

2018 | ANNUAL REPORT 157
While suppliers carry much of the management responsibility, FCA recognizes the role the Company can play in protecting human rights and promoting working conditions aligned to global standards and responsible sourcing.
The 5-Step Framework for Upstream and Downstream Supply Chains, created by the Organisation for Economic Co-operation and Development (“OECD”), provides a common and foundational tool that helps solidify responsible sourcing practices and decisions made throughout our supply chain. This framework is an important part of our training for suppliers and FCA buyers.
In-depth training on responsible working conditions continues to be offered to suppliers in partnership with AIAG. Developed in collaboration with other automakers, this training is designed to help protect the rights and dignity of workers as well as reinforce environmental and ethical issues impacting the supply chain. FCA uses the training, available in nine languages, to engage employees worldwide in the Purchasing and Supplier Quality departments on these important concepts and to establish a consistent message with our supply base.
Conflict MineralsWe are committed to responsible sourcing and avoid knowingly using minerals that may be linked to human rights abuses, including human trafficking, slavery, forced labor, child labor, torture and war crimes. Due to the complexity of our supply chain, we are dependent upon our suppliers to provide the information necessary to correctly identify the smelters and refiners that furnish the tin, tantalum, tungsten, and gold (referred to as Conflict Minerals or “3TG”) in our products and take appropriate action to determine that these smelters and refiners source responsibly. We do not typically have a direct relationship with 3TG smelters or refiners and do not perform or direct audits of these entities within our supply chain.
In accordance with OECD Guidance, we have implemented an internal management system by establishing an internal oversight committee, joining industry associations, and working to increase supplier engagement.
FCA’s Conflict Minerals Policy affirms that we make reasonable efforts: a) to know, and to require FCA suppliers to disclose to the Company, the sources of Conflict Minerals used in our products; and b) to eliminate procurement, as soon as commercially practicable, of products containing Conflict Minerals obtained from sources that fund or support inhumane treatment that originate in conflict-affected and high risk areas. This policy is not intended to ban procurement of Conflict Minerals or other products that originate in conflict-affected and high risk areas, but to promote sourcing from responsible sources within those regions.
In addition to a Conflict Minerals compliance program led by our Purchasing department, we formed a cross-functional Conflict Minerals Oversight Committee to provide expertise and feedback. A Conflict Minerals champion leads the Conflict Minerals Oversight Committee and each region and affiliate of FCA has designated a Conflict Minerals Team Lead to ensure engagement. This committee includes representatives from the FCA Supplier Relations, Engineering, Legal, Sustainability, Communications, and Purchasing departments.
We use the iPoint Conflict Minerals Platform (“iPCMP”) and Conflict Minerals Reporting Template (“CMRT”) as the means for our direct material suppliers to report their use of 3TG, the processing smelter or refiner, and the country and mine of origin. If a supplier’s response indicates that its products do not include 3TG, we ask the supplier to certify this information.
As a means of additional due diligence, we use our internal systems to cross-check supplier responses to determine what materials are contained in a supplier’s products and identify response discrepancies that may require additional follow-up with the supplier. As outlined in the OECD Guidance, the internationally recognized standard upon which our system is based, we support the Conflict-Free Sourcing Initiative, an industry initiative that audits smelters’ and refiners’ due diligence activities.
Community EngagementFCA strives to enrich the vitality of the communities where we live and work by creating jobs through our operations, giving back through employee volunteering and providing financial support through our charitable initiatives. “Supporting our Communities” is one of the key Principles of the FCA Code of Conduct, which captures the Company’s commitment to important values in business and personal conduct.

158 2018 | ANNUAL REPORT
Board Report
Non-Financial Information
Our corporate citizenship efforts primarily target areas where we have operations. Working with key community stakeholders and leaders in the nonprofit, academic and government sectors, we can evaluate and, where possible, address local social and economic development needs.
FCA’s community-related targets are aligned with the United Nations Sustainable Development Goals, and address employee volunteering, enhancing the socio-economic development of local communities, and advancing youth education and training, with particular emphasis on science, technology, engineering and math programs.
Our workforce donates their time and skills to help build strong, self-reliant communities and create a vital connection with the communities where they live and work. During 2018, Group employees around the world volunteered thousands of hours in support of a wide range of social projects.
Scope of Non-Financial Information and ExceptionsThis Non-Financial Information addresses the requirement of the Dutch Decree on Non-Financial Information, that incorporated the Directive 2014/95/EU into Dutch law and this Non-Financial Information is based on the GRI Standards reporting guidelines.
The data reported in this section will also be included in the FCA 2018 Sustainability Report, that is submitted for assurance to Deloitte & Touche S.p.A. The scope, methodology, limitations and conclusions of the assurance engagement are provided in the Independent Auditors’ Report that will be published in the FCA 2018 Sustainability Report.
More detailed information and results are provided in the FCA Sustainability Report presented together with the Annual Report at the Annual General Meeting of FCA NV on April 12, 2019 and made available online at www.fcagroup.com.
The reporting scope of this non-financial disclosure differs from the financial disclosures in the FCA Annual Report. The exclusion of any geographical area, Group company, or specific site from the scope of reporting on selected Key Performance Indicators is attributable to the inability to obtain data of satisfactory quality, or to its immateriality in relation to the Group as a whole, as may be the case for newly-acquired entities or production activities that are not yet fully operational. In some cases, entities that are not fully consolidated in the financial statements were included in the scope of reporting because of their significant environmental and social impacts.
In particular:
data on Human Rights survey relates also to entities that are not fully consolidated;
data on occupational health and safety relates to 96 of the 102 plants, covering the vast majority of plant workers, including agency workers; to office facilities; and to four plants of companies that are not fully consolidated, including one joint venture in Turkey and three in China; and
the Group’s environmental and energy performance refers to 96 of the 102 plants, covering nearly 100 percent of the Group’s industrial revenues and to four plants of companies that are not fully consolidated, including one joint venture in Turkey and three in China.
Data for this section was collected and reported using the same methodology the Company has used for many years in its annual reporting of sustainability-related results. The data is collected and reported with the aid of existing management control and information systems, where available, in order to ensure reliability of information flows and the correct monitoring of sustainability performance. A dedicated reporting process is in place for certain indicators, using electronic databases or files populated directly by the individuals or entities responsible for each aspect worldwide.
This report excludes information relating to our Magneti Marelli business to allow comparability with the Group’s Consolidated Financial Statements, where Magneti Marelli’s operations met the criteria to be classified as a disposal group held for sale and a discontinued operation pursuant to IFRS 5 - Non-current Assets Held for Sale and Discontinued Operations. Information relating to 2017 and 2016 has been re-presented to exclude Magneti Marelli.
Unless otherwise indicated, all data presented in this section refers to the International System of Units and may be subject to rounding.

2018 | ANNUAL REPORT 159
Controls and ProceduresDisclosure Controls and ProceduresUnder the supervision, and with the participation, of our management, including our Chief Executive Officer and Chief Financial Officer, we conducted an evaluation of the effectiveness of our disclosure controls and procedures as of December 31, 2018 pursuant to Exchange Act Rule 13a-15(b). Based on that evaluation, our Chief Executive Officer and Chief Financial Officer concluded that our disclosure controls and procedures are effective to provide reasonable assurance that information required to be disclosed in our Exchange Act filings is recorded, processed, summarized and reported within the time periods specified in the SEC’s rules and forms and that such information is accumulated and communicated to our management, including our Chief Executive Officer and Chief Financial Officer, as appropriate, to allow timely decisions regarding required disclosure.
Management’s Report on Internal Control over Financial ReportingThe Company’s management is responsible for establishing and maintaining adequate internal control over financial reporting. The Company’s internal control system was designed to provide reasonable assurance regarding the preparation and fair presentation of published financial statements in accordance with IFRS.
All internal control systems, no matter how well designed, have inherent limitations. Therefore, even those systems determined to be effective can provide only reasonable assurance with respect to financial statement preparation and presentation in accordance with IFRS.
Management assessed the effectiveness of the Company’s internal control over financial reporting as of December 31, 2018, using the criteria set forth in the “Internal Control - Integrated Framework (2013)” issued by the Committee of Sponsoring Organizations of the Treadway Commission. Based on that assessment, management believes that, as of December 31, 2018, the Company’s internal control over financial reporting was effective.
The Company’s independent registered public accounting firm has issued an audit report on the effectiveness of the Company’s internal control over financial reporting. That report is included herein.
Changes in Internal ControlNo change to our internal control over financial reporting occurred during the year ended December 31, 2018 that has materially affected, or is reasonably likely to materially affect, our internal control over financial reporting.
Principal Characteristics of the Internal Control System and Internal Control over Financial ReportingThe Company has designed a system of internal control over financial reporting based on the model provided in the COSO Framework for Internal Controls, according to which the internal control system is defined as a set of rules, procedures and tools designed to provide reasonable assurance of the achievement of corporate objectives. In relation to the financial reporting process, reliability, accuracy, completeness and timeliness of the information contribute to the achievement of such corporate objectives. A periodic evaluation of the system of internal control over financial reporting is designed to provide reasonable assurance regarding the overall effectiveness of the components of the COSO Framework (control environment, risk assessment, control activities, information and communication, and monitoring) in achieving those objectives.
Board Report
Controls and Procedures

160 2018 | ANNUAL REPORT
The approach adopted by the Company for the evaluation, monitoring and continuous updating of the system of internal control over financial reporting, is based on a ‘top-down, risk-based’ process consistent with the COSO Framework. This enables focus on areas of higher risk and/or materiality, where there is risk of significant errors, including those attributable to fraud, in the elements of the financial statements and related documents. The key components of the process are:
identification and evaluation of the source and probability of material errors in elements of financial reporting;
assessment of the adequacy of key controls in preventing or detecting potential misstatements in elements of financial reporting; and
verification of the operating effectiveness of controls based on the assessment of the risk of misstatement in financial reporting, with testing focused on areas of higher risk.
Board Report
Controls and Procedures

2018 | ANNUAL REPORT 161
REPORT OF INDEPENDENT REGISTERED PUBLIC ACCOUNTING FIRM
To the Board of Directors and Shareholders ofFiat Chrysler Automobiles N.V.
Opinion on Internal Control over Financial ReportingWe have audited Fiat Chrysler Automobiles N.V.’s internal control over financial reporting as of December 31, 2018, based on criteria established in Internal Control-Integrated Framework issued by the Committee of Sponsoring Organizations of the Treadway Commission (2013 framework) (the COSO criteria). In our opinion, Fiat Chrysler Automobiles N.V. (the Company) maintained, in all material respects, effective internal control over financial reporting as of December 31, 2018 based on the COSO criteria.
We also have audited, in accordance with the standards of the Public Company Accounting Oversight Board (United States) (PCAOB), the consolidated statements of financial position of Fiat Chrysler Automobiles N.V. as of December 31, 2018 and 2017, and the related consolidated statements of income, comprehensive income, cash flows and changes in equity for each of the three years in the period ended December 31, 2018, and the related notes, and our report dated February 22, 2019 expressed an unqualified opinion thereon.
Basis for OpinionThe Company’s management is responsible for maintaining effective internal control over financial reporting and for its assessment of the effectiveness of internal control over financial reporting included in the accompanying Management’s Report on Internal Control over Financial Reporting. Our responsibility is to express an opinion on the Company’s internal control over financial reporting based on our audit. We are a public accounting firm registered with the PCAOB and are required to be independent with respect to the Company in accordance with the U.S. federal securities laws and the applicable rules and regulations of the Securities and Exchange Commission and the PCAOB.
We conducted our audit in accordance with the standards of the PCAOB. Those standards require that we plan and perform the audit to obtain reasonable assurance about whether effective internal control over financial reporting was maintained in all material respects.
Our audit included obtaining an understanding of internal control over financial reporting, assessing the risk that a material weakness exists, testing and evaluating the design and operating effectiveness of internal control based on the assessed risk, and performing such other procedures as we considered necessary in the circumstances. We believe that our audit provides a reasonable basis for our opinion.
Definition and Limitations of Internal Control Over Financial ReportingA company’s internal control over financial reporting is a process designed to provide reasonable assurance regarding the reliability of financial reporting and the preparation of financial statements for external purposes in accordance with generally accepted accounting principles. A company’s internal control over financial reporting includes those policies and procedures that (1) pertain to the maintenance of records that, in reasonable detail, accurately and fairly reflect the transactions and dispositions of the assets of the company; (2) provide reasonable assurance that transactions are recorded as necessary to permit preparation of financial statements in accordance with generally accepted accounting principles, and that receipts and expenditures of the company are being made only in accordance with authorizations of management and directors of the company; and (3) provide reasonable assurance regarding prevention or timely detection of unauthorized acquisition, use, or disposition of the company’s assets that could have a material effect on the financial statements.
Because of its inherent limitations, internal control over financial reporting may not prevent or detect misstatements. Also, projections of any evaluation of effectiveness to future periods are subject to the risk that controls may become inadequate because of changes in conditions, or that the degree of compliance with the policies or procedures may deteriorate.
/s/ EY S.p.A.Turin, ItalyFebruary 22, 2019

162 2018 | ANNUAL REPORT
Statement by the Board of DirectorsBased on the assessment performed, the Board of Directors believes that, as of December 31, 2018, the Group’s and the Company’s Internal Control over Financial Reporting is considered effective and that (i) the Board Report provides sufficient insights into any material weakness in the effectiveness of the internal risk management and control systems (please refer to the section CONTROLS AND PROCEDURES - Management’s Report on Internal Control over Financial Reporting in this Annual Report), (ii) the internal risk management and control systems are designed to provide reasonable assurance that the financial reporting does not contain any material inaccuracies (please refer to the section CONTROLS AND PROCEDURES - Management’s Report on Internal Control over Financial Reporting on this Annual Report), (iii) based on the current state of affairs, it is justified that the Group’s and the Company’s financial reporting is prepared on a going concern basis (please refer to Note 2, Basis of preparation in the Consolidated Financial Statements for additional information on the basis of preparation), and (iv) the Board Report states those material risks and uncertainties that are, in the Board of Director’s judgment, relevant to the expectation of the Company’s continuity for the period of twelve months after the preparation of the Board Report (please refer to the section Risk Factors in this Annual Report).
February 22, 2019
/s/ John Elkann
John Elkann
Chairman
/s/ Michael Manley
Michael Manley
Chief Executive Officer
Board Report
Controls and Procedures
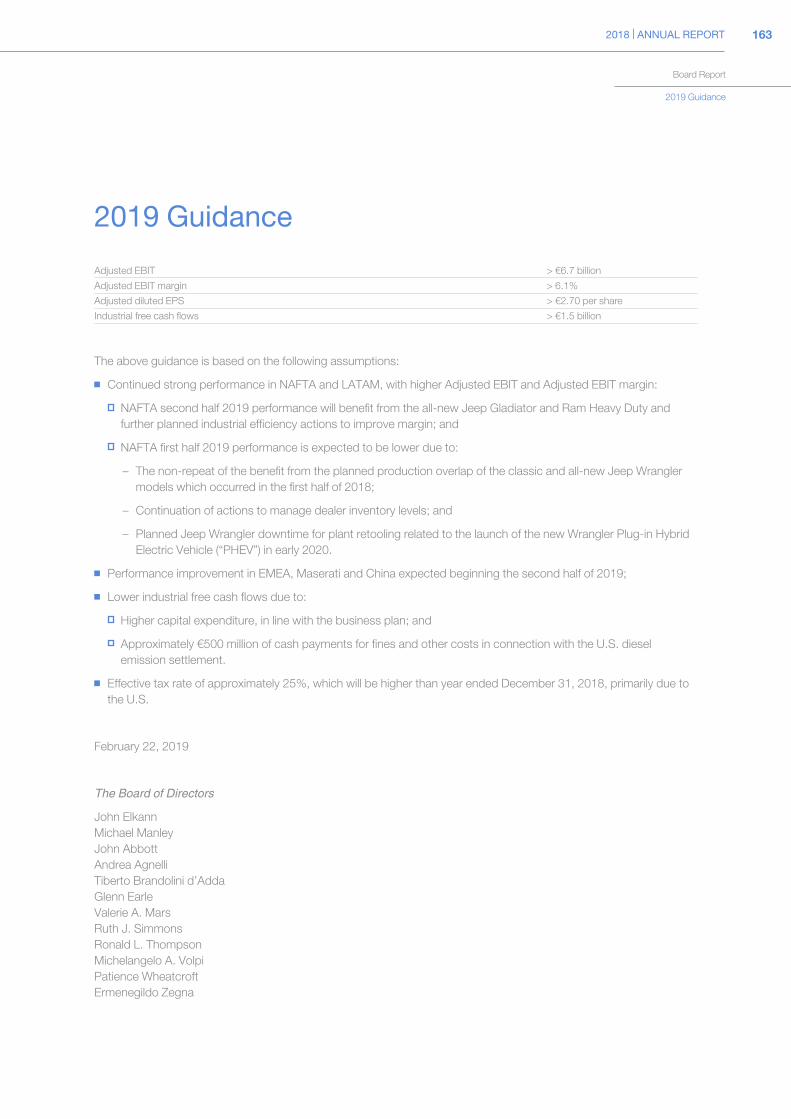
2018 | ANNUAL REPORT
Board Report
163
2019 Guidance
2019 Guidance
Adjusted EBIT > €6.7 billion
Adjusted EBIT margin > 6.1%
Adjusted diluted EPS > €2.70 per share
Industrial free cash flows > €1.5 billion
The above guidance is based on the following assumptions:
Continued strong performance in NAFTA and LATAM, with higher Adjusted EBIT and Adjusted EBIT margin:
NAFTA second half 2019 performance will benefit from the all-new Jeep Gladiator and Ram Heavy Duty and further planned industrial efficiency actions to improve margin; and
NAFTA first half 2019 performance is expected to be lower due to:
– The non-repeat of the benefit from the planned production overlap of the classic and all-new Jeep Wrangler models which occurred in the first half of 2018;
– Continuation of actions to manage dealer inventory levels; and
– Planned Jeep Wrangler downtime for plant retooling related to the launch of the new Wrangler Plug-in Hybrid Electric Vehicle (“PHEV”) in early 2020.
Performance improvement in EMEA, Maserati and China expected beginning the second half of 2019;
Lower industrial free cash flows due to:
Higher capital expenditure, in line with the business plan; and
Approximately €500 million of cash payments for fines and other costs in connection with the U.S. diesel emission settlement.
Effective tax rate of approximately 25%, which will be higher than year ended December 31, 2018, primarily due to the U.S.
February 22, 2019
The Board of Directors
John ElkannMichael ManleyJohn AbbottAndrea AgnelliTiberto Brandolini d’AddaGlenn EarleValerie A. MarsRuth J. SimmonsRonald L. ThompsonMichelangelo A. VolpiPatience WheatcroftErmenegildo Zegna

164 2018 | ANNUAL REPORT

Consolidated Financial StatementsAT DECEMBER 31, 2018
Index to the Consolidated Financial Statements
Report of Independent Registered Public Accounting Firm _________________________________________ 166 Consolidated Income Statement _________________________________________________________________ 167 Consolidated Statement of Comprehensive Income ________________________________________________ 168 Consolidated Statement of Financial Position _____________________________________________________ 169 Consolidated Statement of Cash Flows ___________________________________________________________ 170 Consolidated Statement of Changes in Equity _____________________________________________________ 171 Notes to the Consolidated Financial Statements ___________________________________________________ 172
(1) Principal Activities _________________________________________________________________________ 172(2) Basis of preparation _______________________________________________________________________ 172(3) Scope of consolidation _____________________________________________________________________ 198(4) Net revenues _____________________________________________________________________________ 202(5) Research and development costs ___________________________________________________________ 203(6) Net financial expenses _____________________________________________________________________ 203(7) Tax expense ______________________________________________________________________________ 204(8) Other information by nature _________________________________________________________________ 207(9) Goodwill and intangible assets with indefinite useful lives ________________________________________ 208(10) Other intangible assets _____________________________________________________________________ 209(11) Property, plant and equipment ______________________________________________________________ 210(12) Investments accounted for using the equity method ____________________________________________ 212(13) Other financial assets ______________________________________________________________________ 215(14) Inventories _______________________________________________________________________________ 216(15) Trade, other receivables and tax receivables __________________________________________________ 217(16) Derivative financial assets and liabilities _______________________________________________________ 220(17) Cash and cash equivalents _________________________________________________________________ 223(18) Share-based compensation ________________________________________________________________ 223(19) Employee benefits liabilities _________________________________________________________________ 227(20) Provisions ________________________________________________________________________________ 234(21) Debt ____________________________________________________________________________________ 236(22) Other liabilities and Tax payables ____________________________________________________________ 241(23) Fair value measurement ____________________________________________________________________ 243(24) Related party transactions __________________________________________________________________ 246(25) Guarantees granted, commitments and contingent liabilities _____________________________________ 250(26) Equity ___________________________________________________________________________________ 255(27) Earnings per share ________________________________________________________________________ 258(28) Segment reporting ________________________________________________________________________ 260(29) Explanatory notes to the Consolidated Statement of Cash Flows _________________________________ 264(30) Qualitative and quantitative information on financial risks ________________________________________ 266(31) Subsequent events ________________________________________________________________________ 271

166 2018 | ANNUAL REPORT
Consolidated Financial Statements
Report of Independent Registered Public Accounting Firm
REPORT OF INDEPENDENT REGISTERED PUBLIC ACCOUNTING FIRM
To the Board of Directors and Shareholders ofFiat Chrysler Automobiles N.V.
Opinion on the Financial StatementsWe have audited the accompanying consolidated statement of financial position of Fiat Chrysler Automobiles N.V. (the Company) as of December 31, 2018 and 2017, and the related consolidated statements of income, comprehensive income, cash flows and changes in equity for each of the three years in the period ended December 31, 2018, and the related notes (collectively referred to as the “financial statements”). In our opinion, the financial statements present fairly, in all material respects, the consolidated financial position of the Company at December 31, 2018 and 2017, and the consolidated results of its operations and its cash flows for each of the three years in the period ended December 31, 2018, in conformity with International Financial Reporting Standards as issued by the International Accounting Standards Board, as well as International Financial Reporting Standards as adopted by the European Union.
We also have audited, in accordance with the standards of the Public Company Accounting Oversight Board (United States) (PCAOB), the Company’s internal control over financial reporting as of December 31, 2018, based on criteria established in Internal Control-Integrated Framework issued by the Committee of Sponsoring Organizations of the Treadway Commission (2013 framework) and our report dated February 22, 2019 expressed an unqualified opinion thereon.
Basis for OpinionThese financial statements are the responsibility of the Company’s management. Our responsibility is to express an opinion on the Company’s financial statements based on our audits. We are a public accounting firm registered with the PCAOB and are required to be independent with respect to the Company in accordance with the U.S. federal securities laws and the applicable rules and regulations of the Securities and Exchange Commission and the PCAOB.
We conducted our audits in accordance with the standards of the PCAOB. Those standards require that we plan and perform the audit to obtain reasonable assurance about whether the financial statements are free of material misstatement, whether due to error or fraud. Our audits included performing procedures to assess the risks of material misstatement of the financial statements, whether due to error or fraud, and performing procedures that respond to those risks. Such procedures included examining, on a test basis, evidence regarding the amounts and disclosures in the financial statements. Our audits also included evaluating the accounting principles used and significant estimates made by management, as well as evaluating the overall presentation of the financial statements. We believe that our audits provide a reasonable basis for our opinion.
/s/ EY S.p.A.
We have served as the Company’s auditor since 2012.
Turin, Italy
February 22, 2019

2018 | ANNUAL REPORT
Consolidated Financial Statements
167
Consolidated Income Statement
Consolidated Income Statement(in € million, except per share amounts)
Years ended December 31,Note 2018 2017 2016
Net revenues 4 € 110,412 € 105,730 € 105,798
Cost of revenues 95,011 89,710 90,927
Selling, general and other costs 7,318 7,177 7,388
Research and development costs 5 3,051 2,903 2,930
Result from investments: 235 399 310
Share of the profit of equity method investees 12 240 400 308
Other income from investments (5) (1) 2
Reversal of a Brazilian indirect tax liability 22 — 895 —
Gains on disposal of investments — 76 13
Restructuring costs 103 86 68
Net financial expenses 6 1,056 1,345 1,858
Profit before taxes 4,108 5,879 2,950
Tax expense 7 778 2,588 1,237
Net profit from continuing operations 3,330 3,291 1,713
Profit from discontinued operations, net of tax 3 302 219 101
Net profit € 3,632 € 3,510 € 1,814
Net profit attributable to:
Owners of the parent € 3,608 € 3,491 € 1,803
Non-controlling interests 24 19 11
€ 3,632 € 3,510 € 1,814
Net profit from continuing operations attributable to:
Owners of the parent € 3,323 € 3,281 € 1,708
Non-controlling interests 7 10 5
€ 3,330 € 3,291 € 1,713
Earnings per share: 27
Basic earnings per share € 2.33 € 2.27 € 1.19
Diluted earnings per share € 2.30 € 2.24 € 1.18
Earnings per share for Net profit from continuing operations: 27
Basic earnings per share € 2.15 € 2.14 € 1.13
Diluted earnings per share € 2.12 € 2.11 € 1.12
The accompanying notes are an integral part of the Consolidated Financial Statements.

168 2018 | ANNUAL REPORT
Consolidated Financial Statements
Consolidated Statement of Comprehensive Income
Consolidated Statement of Comprehensive Income(in € million)
Years ended December 31,Note 2018 2017 2016
Net profit (A) € 3,632 € 3,510 € 1,814
Items that will not be reclassified to the Consolidated Income Statement in subsequent periods: 26
Gains/(losses) on remeasurement of defined benefit plans 317 (72) 616Share of gains/(losses) on remeasurement of defined benefit plans for equity method investees — 2 (5)Gains/(losses) on equity instruments measured at fair value through other comprehensive income (4) 14 15
Related tax impact (76) (18) (265)
Items relating to discontinued operations, net of tax 2 5 (28)Total items that will not be reclassified to the Consolidated Income Statement in subsequent periods (B1) 239 (69) 333
Items that may be reclassified to the Consolidated Income Statements in subsequent periods: 26
Gains/(losses) on cash flow hedging instruments (9) 129 (240)
Exchange (losses)/gains on translating foreign operations 126 (1,982) 509
Share of Other comprehensive (loss) for equity method investees (103) (121) (122)
Related tax impact (6) (12) 69
Items relating to discontinued operations, net of tax (91) 60 (60)Total items that may be reclassified to the Consolidated Income Statement in subsequent periods (B2) (83) (1,926) 156
Total Other comprehensive income/(loss), net of tax (B1)+(B2)=(B) 156 (1,995) 489
Total Comprehensive income (A)+(B) € 3,788 € 1,515 € 2,303
Total Comprehensive income attributable to:
Owners of the parent € 3,763 € 1,491 € 2,288
Non-controlling interests 25 24 15
€ 3,788 € 1,515 € 2,303Total Comprehensive income attributable to owners of the parent:
Continuing operations € 3,558 € 1,212 € 2,281
Discontinued operations 205 279 7
€ 3,763 € 1,491 € 2,288
The accompanying notes are an integral part of the Consolidated Financial Statements.

2018 | ANNUAL REPORT
Consolidated Financial Statements
169
Consolidated Statement of Financial Position
Consolidated Statement of Financial Position(in € million)
At December 31
Note 2018 2017
Assets
Goodwill and intangible assets with indefinite useful lives 9 € 13,970 € 13,390
Other intangible assets 10 11,749 11,542
Property, plant and equipment 11 26,307 29,014
Investments accounted for using the equity method 12 2,002 2,008
Other financial assets 13 362 482
Deferred tax assets 7 1,814 2,004
Other receivables 15 1,484 666
Tax receivables 15 71 83
Prepaid expenses and other assets 266 328
Other non-current assets 556 508
Total Non-current assets 58,581 60,025
Inventories 14 10,694 12,922
Assets sold with a buy-back commitment 1,707 1,748
Trade and other receivables 15 7,188 7,887
Tax receivables 15 419 215
Prepaid expenses and other assets 418 377
Other financial assets 13 615 487
Cash and cash equivalents 17 12,450 12,638
Assets held for sale 3 4,801 —
Total Current assets 38,292 36,274
Total Assets € 96,873 € 96,299
Equity and liabilities
Equity 26
Equity attributable to owners of the parent € 24,702 € 20,819
Non-controlling interests 201 168
Total Equity 24,903 20,987
Liabilities
Long-term debt 21 8,667 10,726
Employee benefits liabilities 19 7,875 8,584
Provisions 20 5,561 5,770
Other financial liabilities 16 3 1
Deferred tax liabilities 7 937 388
Tax payables 22 1 74
Other liabilities 22 2,452 2,500
Total Non-current liabilities 25,496 28,043
Trade payables 19,229 21,939
Short-term debt and current portion of long-term debt 21 5,861 7,245
Employee benefit liabilities 19 595 694
Provisions 20 10,483 9,009
Other financial liabilities 16 204 138
Tax payables 22 114 309
Other liabilities 22 7,057 7,935
Liabilities held for sale 3 2,931 —
Total Current liabilities 46,474 47,269
Total Equity and liabilities € 96,873 € 96,299
The accompanying notes are an integral part of the Consolidated Financial Statements.

170 2018 | ANNUAL REPORT
Consolidated Financial Statements
Consolidated Statement of Cash Flows
Consolidated Statement of Cash Flows(in € million)
Years ended December 31,
Note 2018 2017 2016
Cash flows from operating activities:
Net profit from continuing operations € 3,330 € 3,291 € 1,713
Amortization and depreciation 5,507 5,474 5,549
Net losses on disposal of tangible and intangible assets 1 16 14
Net gains on disposal of investments — (76) (13)
Other non-cash items 29 129 (197) 87
Dividends received 75 102 123
Change in provisions 913 545 1,453
Change in deferred taxes 457 1,075 435Change due to assets sold with buy-back commitments and GDP vehicles 158 (11) (95)
Change in inventories 1,399 (1,596) (494)
Change in trade receivables 19 (157) 131
Change in trade payables (1,240) 937 729
Change in other payables and receivables (1,284) 277 280
Cash flows from operating activities - discontinued operations 484 705 682
Total 9,948 10,385 10,594
Cash flows used in investing activities:
Investments in property, plant and equipment and intangible assets (5,392) (8,105) (8,241)Investments in joint ventures, associates and unconsolidated subsidiaries (3) (9) (113)
Proceeds from the sale of tangible and intangible assets 47 54 25
Proceeds from disposal of other investments — 4 55
Net change in receivables from financing activities (676) (836) (488)
Change in securities (75) 174 301
Other changes (7) (8) (29)
Cash flows used in investing activities - discontinued operations (632) (570) (549)
Total (6,738) (9,296) (9,039)
Cash flows used in financing activities: 29
Issuance of notes — — 1,250
Repayment of notes (1,850) (2,235) (2,373)
Proceeds of other long-term debt 935 811 1,309
Repayment of other long-term debt (2,852) (3,421) (4,605)
Net change in short-term debt and other financial assets/liabilities 1,062 561 (570)
Distributions paid (1) (1) (18)
Other changes 11 (2) (119)
Cash flows used in financing activities - discontinued operations (90) (186) (1)
Total (2,785) (4,473) (5,127)
Translation exchange differences 106 (1,296) 228
Total change in Cash and cash equivalents 531 (4,680) (3,344)
Cash and cash equivalents at beginning of the period 12,638 17,318 20,662
Total change in Cash and cash equivalents 531 (4,680) (3,344)Less: Cash and cash equivalents at end of the period - included within Assets held for sale 719 — —
Cash and cash equivalents at end of the period 17 € 12,450 € 12,638 € 17,318
The accompanying notes are an integral part of the Consolidated Financial Statements.

2018 | ANNUAL REPORT
Consolidated Financial Statements
171
Consolidated Statement of Changes in Equity
Consolidated Statement of Changes in Equity(in € million)
Attributable to owners of the parent
Share capital
Other reserves
Cash flow
hedge reserve
Currency translation differences
Financial Assets
measured at FVOCI
Remeasure-ment of defined benefit
plans
Cumulative share of OCI
of equity method
investees
Non-controlling
interests Total
At December 31, 2015 € 17 € 15,455 € 70 € 2,492 € (26) € (1,098) € (105) € 163 € 16,968
Capital Increase — — — — — — — 18 18Mandatory Convertible Securities (Note 26) 2 (2) — — — — — — —
Share-based compensation — 98 — — — — — — 98
Net profit — 1,803 — — — — — 11 1,814Other comprehensive income/(loss) — — (182) 456 15 324 (128) 4 489
Other changes — (42) 49 (36) — 6 — (11) (34)
At December 31, 2016 19 17,312 (63) 2,912 (11) (768) (233) 185 19,353
Capital increase — — — — — — — 3 3
Demerger of Itedi S.p.A — (64) — — — 5 — (28) (87)
Distributions — — — — — — — (1) (1)
Share-based compensation — 115 — — — — — — 115
Net profit — 3,491 — — — — — 19 3,510Other comprehensive income/(loss) — — 131 (1,942) 14 (84) (119) 5 (1,995)
Other changes — 67 — — — 37 — (15) 89
At December 31, 2017 19 20,921 68 970 3 (810) (352) 168 20,987Impact from the adoption of IFRS 15 and IFRS 9 — 21 — — — — — — 21
At January 1, 2018 19 20,942 68 970 3 (810) (352) 168 21,008
Capital increase — — — — — — — 11 11
Distributions — — — — — — — (1) (1)
Share-based compensation — 82 — — — — — — 82
Net profit — 3,608 — — — — — 24 3,632Other comprehensive income/(loss) — — (22) 41 (4) 243 (103) 1 156
Other changes(1) 18 (1) — — — — (2) 15
At December 31, 2018 € 19 € 24,650 € 45 € 1,011 € (1) € (567) € (455) € 201 € 24,903(1) Includes €1 million of deferred hedging gains transferred to inventory, net of taxThe accompanying notes are an integral part of the Consolidated Financial Statements.

172 2018 | ANNUAL REPORT
Consolidated Financial Statements
Notes to the Consolidated Financial Statements
Notes to the Consolidated Financial Statements
1. PRINCIPAL ACTIVITIESOn January 29, 2014, the Board of Directors of Fiat S.p.A. (“Fiat”) approved a proposed corporate reorganization resulting in the formation of Fiat Chrysler Automobiles N.V. and establishing Fiat Chrysler Automobiles N.V., organized in the Netherlands, as the parent of the Group with its principal executive offices located at 25 St. James’s Street, London SW1A 1HA, United Kingdom. Fiat Chrysler Automobiles N.V. was incorporated as a public limited liability company (naamloze vennootschap) under the laws of the Netherlands on April 1, 2014 under the name Fiat Investments N.V.
On October 12, 2014, the cross-border legal merger of Fiat into its 100 percent owned direct subsidiary Fiat Investments N.V. (the “Merger”) became effective. The Merger, which took the form of a reverse merger, resulted in Fiat Investments N.V. being the surviving entity and it was renamed Fiat Chrysler Automobiles N.V. (“FCA NV”).
Unless otherwise specified, the terms “Group”, “FCA Group”, “Company” and “FCA”, refer to FCA NV, together with its subsidiaries and its predecessor prior to the completion of the Merger, or any one or more of them, as the context may require. Any references to “Fiat” refer solely to Fiat S.p.A., the predecessor of FCA NV prior to the Merger.
The Group and its subsidiaries, of which the most significant is FCA US LLC (“FCA US”), together with its subsidiaries, are engaged in the design, engineering, manufacturing, distribution and sale of automobiles and light commercial vehicles, engines, transmission systems, metallurgical products and production systems. In addition, the Group is also involved in certain other activities, including (mainly captive) services, which represent an insignificant portion of the Group’s business. Refer to Note 3, Scope of consolidation for information on the presentation of Magneti Marelli as a discontinued operation.
FCA has filed a list of subsidiaries and associated companies, prepared in accordance with Sections 379 and 414, Book 2, Dutch Civil Code, at the Dutch trade register of Amsterdam.
All references in this report to “Euro” and “€” refer to the currency introduced at the start of the third stage of European Economic and Monetary Union pursuant to the Treaty on the Functioning of the European Union, as amended. The Group’s financial information is presented in Euro. All references to “U.S. Dollars”, “U.S. Dollar”, “U.S.$” and “$” refer to the currency of the United States of America (“U.S.”).
2. BASIS OF PREPARATION
Authorization of Consolidated Financial Statements and compliance with International Financial Reporting StandardsThe Consolidated Financial Statements, together with the notes thereto, of FCA as of and for the year ended December 31, 2018 were authorized for issuance by the Board of Directors on February 22, 2019 and have been prepared in accordance with the International Financial Reporting Standards (“IFRS”) as issued by the International Accounting Standards Board (“IASB”), as well as IFRS as adopted by the European Union. There is no effect on these consolidated financial statements resulting from differences between IFRS as issued by the IASB and IFRS as adopted by the European Union. The designation “IFRS” includes International Accounting Standards (“IAS”) as well as all interpretations of the IFRS Interpretations Committee (“IFRIC”).
Basis of preparationThe Consolidated Financial Statements are prepared under the historical cost method, modified for the measurement of certain financial instruments as required, as well as on a going concern basis. In this respect, the Group’s assessment is that no material uncertainties (as defined in IAS 1 - Presentation of Financial Statements) exist about its ability to continue as a going concern.
For presentation of the Consolidated Income Statement, the Group uses a classification based on the function of expenses rather than based on their nature as it is more representative of the format used for internal reporting and management purposes and is consistent with international practice in the automotive sector.

2018 | ANNUAL REPORT 173
SIGNIFICANT ACCOUNTING POLICIES
Basis of consolidation
SubsidiariesSubsidiaries are entities over which the Group has control. Control is achieved when the Group has power over the investee, when it is exposed to, or has rights to, variable returns from its involvement with the investee and has the ability to use its power over the investee to affect the amount of the investor’s returns. Subsidiaries are consolidated on a line by line basis from the date which control is achieved by the Group. The Group reassesses whether or not it controls an investee if facts and circumstances indicate that there are changes to one or more of the three elements of control listed above.
The Group recognizes a non-controlling interest in the acquiree on a transaction-by-transaction basis, either at fair value or at the non-controlling interest’s share of the recognized amounts of the acquiree’s identifiable net assets. Net profit or loss and each component of Other comprehensive income/(loss) are attributed to Equity attributable to owners of the parent and to Non-controlling interests. Total comprehensive income/(loss) of subsidiaries is attributed to Equity attributable to the owners of the parent and to the non-controlling interest even if this results in a deficit balance in Non-controlling interests.
Changes in the Group’s ownership interests in a subsidiary that do not result in the Group losing control over the subsidiary are accounted for as equity transactions. The carrying amounts of Equity attributable to owners of the parent and Non-controlling interests are adjusted to reflect the changes in their relative interests in the subsidiary. Any difference between the carrying amount of the non-controlling interests and the fair value of the consideration paid or received in the transaction is recognized directly in Equity attributable to the owners of the parent.
Subsidiaries are deconsolidated from the date on which control ceases. When the Group ceases to have control over a subsidiary, it derecognizes the assets (including any goodwill) and liabilities of the subsidiary at their carrying amounts, derecognizes the carrying amount of non-controlling interests in the former subsidiary and recognizes the fair value of any consideration received from the transaction. Any retained interest in the former subsidiary is then remeasured to its fair value.
All intra-group balances and transactions, and any unrealized gains and losses arising from intra-group transactions, are eliminated in preparing the Consolidated Financial Statements.
Interests in Joint Ventures and AssociatesA joint venture is a joint arrangement whereby the parties that have joint control of the arrangement have rights to the net assets of the arrangement.
An associate is an entity over which the Group has significant influence. Significant influence is the power to participate in the financial and operating policy decisions of the investee but does not have control or joint control over those policies.
Joint ventures and associates are accounted for using the equity method of accounting from the date joint control or significant influence is obtained. On acquisition, any excess of the investment over the share of the net fair value of the investee’s identifiable assets and liabilities is recognized as goodwill and is included in the carrying amount of the investment. Any excess of the Group’s share of the net fair value of the investee’s identifiable assets and liabilities over the cost of the investment is included as income in the determination of the Group’s share of the investee’s profit/(loss) in the acquisition period.
Under the equity method, investments are initially recognized at cost and adjusted thereafter to recognize the Group’s share of the profit/(loss) and other comprehensive income/(loss) of the investee. The Group’s share of the investee’s profit/(loss) is recognized in the Consolidated Income Statement. Distributions received from an investee reduce the carrying amount of the investment. Post-acquisition movements in Other comprehensive income/(loss) are recognized in Other comprehensive income/(loss) with a corresponding adjustment to the carrying amount of the investment.
Unrealized gains arising on transactions between the Group and its joint ventures and associates are eliminated to the extent of the Group’s interest in the joint venture or associate. Unrealized losses are also eliminated unless the transaction provides evidence of an impairment of the asset transferred.

174 2018 | ANNUAL REPORT
Consolidated Financial Statements
Notes to the Consolidated Financial Statements
When the Group’s share of the losses of a joint venture or associate exceeds the Group’s interest in that joint venture or associate, the Group discontinues recognizing its share of further losses. Additional losses are provided for and a liability is recognized only to the extent that the Group has incurred legal or constructive obligations or made payments on behalf of the joint venture or associate.
The Group discontinues the use of the equity method from the date the investment ceases to be an associate or a joint venture, or when it is classified as available-for-sale.
Interests in Joint OperationsA joint operation is a type of joint arrangement whereby the parties that have joint control have rights to the assets and obligations for the liabilities relating to the arrangement. Joint control is the contractually agreed sharing of control of an arrangement, which exists only when decisions about the relevant activities require the unanimous consent of the parties sharing control.
When the Group undertakes its activities under joint operations, it recognizes its related interest in the joint operation including: (i) its assets, including its share of any assets held jointly, (ii) its liabilities, including its share of any liabilities incurred jointly, (iii) its revenue from the sale of its share of the output arising from the joint operation, (iv) its share of the revenue from the sale of the output by the joint operation and (v) its expenses, including its share of any expenses incurred jointly.
Assets held for sale, Assets held for distribution and Discontinued OperationsPursuant to IFRS 5 - Non-current Assets Held for Sale and Discontinued Operations, non-current assets and disposal groups are classified as held for sale if their carrying amount will be recovered principally through a sale transaction rather than through continuing use. This condition is regarded as met only when the asset or disposal group is available for immediate sale in its present condition, subject only to terms that are usual and customary for sales of such an asset or disposal group, and the sale is highly probable, with the sale expected to be completed within one year from the date of classification.
Non-current assets and disposal groups classified as held for sale are measured at the lower of their carrying amount and fair value less costs to sell and are presented separately in the Consolidated Statement of Financial Position. Non-current assets and disposal groups are not classified as held for sale within the comparative period presented for the Consolidated Statement of Financial Position.
A discontinued operation is a component of the Group that either has been disposed of or is classified as held for sale and (i) represents either a separate major line of business or a geographical area of operations, (ii) is part of a single coordinated plan to dispose of a separate major line of business or geographical area of operations, or (iii) is a subsidiary acquired exclusively with a view to resell and the disposal involves loss of control.
Classification as a discontinued operation occurs upon disposal or, if earlier, when the asset or disposal group meets the criteria to be classified as held for sale. When the asset or disposal group is classified as a discontinued operation, the comparative information is reclassified within the Consolidated Income Statement and the Consolidated Statement of Cash Flows as if the asset or disposal group had been discontinued from the start of the earliest comparative period presented. In addition, when an asset or disposal group is classified as held for sale, depreciation and amortization cease.
The classification, presentation and measurement requirements of IFRS 5 - Non-current Assets Held for Sale and Discontinued Operations outlined above also apply to an asset or disposal group that is classified as held for distribution to owners, whereby there must be commitment to the distribution, the asset or disposal group must be available for immediate distribution and the distribution must be highly probable.

2018 | ANNUAL REPORT 175
Foreign currencyThe functional currency of the Group’s entities is the currency used in their respective primary economic environments. In individual companies, transactions in foreign currencies are recorded at the exchange rate prevailing at the date of the transaction. Monetary assets and liabilities denominated in foreign currencies are translated at the exchange rate prevailing at the date of the Consolidated Statement of Financial Position. Exchange differences arising on the settlement of monetary items or on reporting monetary items at rates different from those initially recorded, are recognized in the Consolidated Income Statement.
All assets and liabilities of foreign consolidated companies with a functional currency other than the Euro are translated using the closing rates as at the date of the Consolidated Statement of Financial Position. Income and expenses are translated into Euro at the average exchange rate for the period. Translation differences arising from the application of this method are classified within Other comprehensive income/(loss) until the disposal of the subsidiary. Average exchange rates for the period are used in preparing the Consolidated Statement of Cash Flows to translate the cash flows of foreign subsidiaries.
The principal exchange rates used to translate other currencies into Euro were as follows:
2018 2017 2016
Average At December 31 Average At December 31 Average At December 31
U.S. Dollar (U.S.$) 1.181 1.145 1.130 1.199 1.107 1.054
Brazilian Real (BRL) 4.308 4.444 3.605 3.973 3.857 3.431
Chinese Renminbi (CNY) 7.808 7.875 7.629 7.804 7.352 7.320
Canadian Dollar (CAD) 1.529 1.561 1.465 1.504 1.466 1.419
Mexican Peso (MXN) 22.705 22.492 21.329 23.661 20.664 21.772
Polish Zloty (PLN) 4.261 4.301 4.257 4.177 4.363 4.410
Argentine Peso (ARS)(1) 43.074 43.074 18.683 22.595 16.327 16.707
Pound Sterling (GBP) 0.885 0.895 0.877 0.887 0.819 0.856
Swiss Franc (CHF) 1.155 1.127 1.112 1.170 1.090 1.074(1) From July 1, 2018, Argentina’s economy was considered to be hyperinflationary. Transactions after July 1, 2018 for entities with the Argentinian
Peso as the functional currency were translated using the December 31, 2018 closing spot rate.
Intangible assets
GoodwillGoodwill represents the excess of the fair value of consideration paid in a business combination over the fair value of net tangible and identifiable intangible assets acquired. Goodwill is not amortized but is tested for impairment annually or more frequently if events or changes in circumstances indicate that it might be impaired. After initial recognition, goodwill is measured at cost less any accumulated impairment losses.
Intangible assets with indefinite useful livesIntangible assets with indefinite useful lives consist principally of brands which have no legal, contractual, competitive, economic or other factors that limit their useful lives. Intangible assets with indefinite useful lives are not amortized but are tested for impairment annually, or more frequently if events or changes in circumstances indicate that the asset may be impaired.
Development expendituresDevelopment expenditures for vehicle production and related components, engines and production systems are recognized as an asset if both of the following conditions within IAS 38 – Intangible assets are met: (i) that development expenditure can be measured reliably and (ii) that the technical feasibility of the product, projected volumes and pricing support the view that the development expenditure will generate future economic benefits. Capitalized development expenditures include all direct and indirect costs that may be directly attributed to the development process. All other development expenditures are expensed as incurred.
Capitalized development expenditures are amortized on a straight-line basis from the beginning of production over the expected life cycle of the models (generally 5-6 years) or powertrains (generally 10-12 years) developed.

176 2018 | ANNUAL REPORT
Consolidated Financial Statements
Notes to the Consolidated Financial Statements
Property, plant and equipment
CostProperty, plant and equipment is initially recognized at cost and includes the purchase price, any costs directly attributable to bringing the assets to the location and condition necessary to be capable of operating in the manner intended by management and any initial estimate of the costs of dismantling and removing the asset and restoring the site on which it is located. Self-constructed assets are initially recognized at production cost. Subsequent expenditures and the cost of replacing parts of an asset are capitalized only if they increase the future economic benefits embodied in that asset. All other expenditures are expensed as incurred. When such replacement costs are capitalized, the carrying amount of the parts that are replaced is expensed to the Consolidated Income Statement.
Assets held under finance leases, which provide the Group with substantially all the risks and rewards of ownership, are recognized as assets of the Group at their fair value or, if lower, at the present value of the minimum lease payments. The corresponding liability to the lessor is included in the Consolidated Statement of Financial Position within Debt.
DepreciationDuring the years ended December 31, 2018, 2017 and 2016, assets depreciated on a straight-line basis over their estimated useful lives used the following depreciation rates:
Depreciation rates
Buildings 3% - 8%
Plant, machinery and equipment 3% - 33%
Other assets 5% - 33%
Leases under which the lessor retains substantially all the risks and rewards of ownership of the leased assets are classified as operating leases. Operating lease expenditures are expensed on a straight-line basis over the respective lease term.
Borrowing CostsBorrowing costs that are directly attributable to the acquisition, construction or production of property, plant or equipment or an intangible asset that is deemed to be a qualifying asset as defined in IAS 23 - Borrowing Costs are capitalized. The amount of borrowing costs eligible for capitalization corresponds to the actual borrowing costs incurred during the period, less any investment income on the temporary investment of any borrowed funds not yet used. The amount of borrowing costs capitalized in the year ended December 31, 2018 and 2017 was €155 million and €225 million, respectively.
Impairment of long-lived assetsAnnually, or more frequently if facts or circumstances indicate otherwise, the Group assesses whether there is any indication that its finite-lived intangible assets (including capitalized development expenditures) and its property, plant and equipment may be impaired.
If indications of impairment are present, the carrying amount of the asset is reduced to its recoverable amount which is the higher of fair value less costs of disposal and its value in use. The recoverable amount is determined for the individual asset, unless the asset does not generate cash inflows that are largely independent of those from other assets or groups of assets, in which case the asset is tested as part of the cash-generating unit (“CGU”) to which the asset belongs. A CGU is the smallest identifiable group of assets that generates cash inflows that are largely independent of the cash inflows from other assets or groups of assets. In assessing the value in use of an asset or CGU, the estimated future cash flows are discounted to their present value using a discount rate that reflects current market assessments of the time value of money and the risks specific to the asset or CGU. An impairment loss is recognized if the recoverable amount is lower than the carrying amount.

2018 | ANNUAL REPORT 177
When an impairment loss for assets no longer exists or has decreased, the carrying amount of the asset or CGU is increased to the revised estimate of its recoverable amount but not in excess of the carrying amount that would have been recorded had no impairment loss been recognized. The reversal of an impairment loss is recognized in the Consolidated Income Statement. Refer to the section Use of estimates below for additional information.
Financial assets and liabilitiesRefer to New standards and amendments effective January 1, 2018 below for information on the Group’s adoption of IFRS 9 - Financial Instruments.
Transfers of financial assetsRefer to New standards and amendments effective January 1, 2018 below for information on the Group’s adoption of IFRS 9 - Financial Instruments.
InventoriesRaw materials, semi-finished products and finished goods inventories are stated at the lower of cost and net realizable value, with cost being determined on a first-in, first-out (“FIFO”) basis. The measurement of Inventories includes the direct cost of materials and labor as well as indirect costs (variable and fixed). A provision is made for obsolete and slow-moving raw materials, finished goods, spare parts and other supplies based on their expected future use and realizable value. Net realizable value is the estimated selling price in the ordinary course of business, less the estimated costs of completion and the estimated costs for sale and distribution.
The measurement of production systems construction contracts is based on the stage of completion, which is determined as the proportion of cost incurred at the balance sheet date over the estimated total contract cost. These items are presented net of progress billings received from customers. Any losses on such contracts are recorded in the Consolidated Income Statement in the period in which they are identified.
Employee benefits
Defined contribution plansCosts arising from defined contribution plans are expensed as incurred.
Defined benefit plansThe Group’s net obligations are determined separately for each defined benefit plan by estimating the present value of future benefits that employees have earned and deducting the fair value of any plan assets. The present value of defined benefit obligations is measured using actuarial techniques and actuarial assumptions that are unbiased, mutually compatible and attribute benefits to periods in which the obligation to provide post-employment benefits arise by using the Projected Unit Credit Method. Plan assets are recognized and measured at fair value.
When the net obligation is a potential asset, the recognized amount is limited to the present value of any economic benefits available in the form of future refunds or reductions in future contributions to the plan (asset ceiling).
The components of defined benefit cost are recognized as follows:
Service cost is recognized in the Consolidated Income Statement by function and is presented within the relevant line items (Cost of revenues, Selling, general and other costs, and Research and development costs);
Net interest expense on the defined benefit liability/(asset) is recognized in the Consolidated Income Statement within Net financial expenses and is determined by multiplying the net liability/(asset) by the discount rate used to discount obligations taking into account the effect of contributions and benefit payments made during the year; and

178 2018 | ANNUAL REPORT
Consolidated Financial Statements
Notes to the Consolidated Financial Statements
Remeasurement components of the net obligation, which comprise actuarial gains and losses, the return on plan assets (excluding interest income recognized in the Consolidated Income Statement) and any change in the effect of the asset ceiling are recognized immediately in Other comprehensive income/(loss). These remeasurement components are not reclassified to the Consolidated Income Statement in a subsequent period.
Past service costs arising from plan amendments and curtailments and gains and losses on the settlement of a plan are recognized immediately in the Consolidated Income Statement.
Other long term employee benefitsThe Group’s obligations represent the present value of future benefits that employees have earned in return for their service. Remeasurement components on other long term employee benefits are recognized in the Consolidated Income Statement in the period in which they arise.
Share-based compensationThe Group has several compensation plans that provide for the granting of share-based compensation to certain employees and directors. Share-based compensation plans are accounted for in accordance with IFRS 2 - Share-based Payment, which requires the recognition of share-based compensation expense based on fair value. Compensation expense for equity-classified awards is measured at the grant date based on the fair value of the award using the Monte Carlo simulation model, which requires the input of subjective assumptions, including the expected volatility of our common shares, interest rates and a correlation coefficient between our common shares and the relevant market index. For those awards with post-vesting contingencies, we apply an adjustment to account for the probability of meeting the contingencies.
Management uses its best estimates incorporating both publicly observable data and discounted cash flow methodologies in the measurement of fair value for liability-classified awards, which are remeasured to fair value at each balance sheet date until the award is settled.
Compensation expense is recognized over the vesting period with an offsetting increase to equity or other liabilities depending on the nature of the award. Share-based compensation expense related to plans with graded vesting is recognized using the graded vesting method. Share-based compensation expense is recognized within Selling, general and other costs within the Consolidated Income Statement.
Revenue recognitionRefer to New standards and amendments effective January 1, 2018 below for information on the Group’s adoption of IFRS 15 - Revenue from contracts with customers.
Cost of revenuesCost of revenues comprises expenses incurred in the manufacturing and distribution of vehicles and parts. The most significant element is the cost of materials and components and the remaining costs include labor (consisting of direct and indirect wages), transportation costs, depreciation of property, plant and equipment and amortization of other intangible assets relating to production. In addition, expenses which are directly attributable to the financial services companies, including interest expense related to their financing as a whole and provisions for risks and write-downs of assets, are recorded within Cost of revenues (€75 million, €68 million and €91 million for the years ended December 31, 2018, 2017 and 2016, respectively). Cost of revenues also included €293 million, €397 million and €384 million related to the decrease in value for assets sold with buy-back commitments for the years ended December 31, 2018, 2017 and 2016, respectively. In addition, estimated costs related to product warranty and recall campaigns are recorded within Cost of revenues (refer to the section Use of estimates below for further information).

2018 | ANNUAL REPORT 179
Government GrantsGovernment grants are recognized in the Consolidated Financial Statements when there is reasonable assurance of the Group’s compliance with the conditions for receiving such grants and that the grants will be received. Government grants are recognized as income over the same periods as the related costs which they are intended to offset.
The benefit of a government loan at a below-market rate of interest is treated as a government grant. The benefit of the below-market rate of interest is measured as the difference between the initial carrying amount of the loan (fair value plus transaction costs) and the proceeds received, and it is accounted for in accordance with the policies used for the recognition of government grants.
TaxesIncome taxes include all taxes which are based on the taxable profits of the Group. Current and deferred taxes are recognized as a benefit or expense and are included in the Consolidated Income Statement for the period, except for tax arising from (i) a transaction or event which is recognized, in the same or a different period, either in Other comprehensive income/(loss) or directly in Equity, or (ii) a business combination.
Deferred taxes are accounted for under the full liability method. Deferred tax liabilities are recognized for all taxable temporary differences between the carrying amounts of assets or liabilities and their tax base, except to the extent that the deferred tax liabilities arise from the initial recognition of goodwill or the initial recognition of an asset or liability in a transaction which is not a business combination and at the time of the transaction, affects neither accounting profit nor taxable profit. Deferred tax assets are recognized for all deductible temporary differences to the extent that it is probable that taxable profit will be available against which the deductible temporary differences can be utilized, unless the deferred tax assets arise from the initial recognition of an asset or liability in a transaction that is not a business combination and at the time of the transaction, affects neither accounting profit nor taxable profit.
Deferred tax assets and liabilities are measured at the substantively enacted tax rates in the respective jurisdictions in which the Group operates that are expected to apply to the period when the asset is realized or liability is settled.
The Group recognizes deferred tax liabilities associated with the existence of a subsidiary’s undistributed profits when it is probable that this temporary difference will not reverse in the foreseeable future, except when it is able to control the timing of the reversal of the temporary difference. The Group recognizes deferred tax assets associated with the deductible temporary differences on investments in subsidiaries only to the extent that it is probable that the temporary differences will reverse in the foreseeable future and taxable profit will be available against which the temporary difference can be utilized.
Deferred tax assets relating to the carry-forward of unused tax losses and tax credits, as well as those arising from deductible temporary differences, are recognized to the extent that it is probable that future profits will be available against which they can be utilized. The Group monitors unrecognized deferred tax assets at each reporting date and recognizes a previously unrecognized deferred tax asset to the extent that it has become probable that future taxable profit will allow the deferred tax asset to be recovered.
Current income taxes and deferred taxes are offset when they relate to the same taxation jurisdiction and there is a legally enforceable right of offset. Other taxes not based on income, such as property taxes and capital taxes, are included within Selling, general and other costs.
Refer to Note 7, Tax expense, for additional information on tax expense and deferred tax assets.

180 2018 | ANNUAL REPORT
Consolidated Financial Statements
Notes to the Consolidated Financial Statements
Fair Value MeasurementFair value for measurement and disclosure purposes is determined as the consideration that would be received to sell an asset or paid to transfer a liability in an orderly transaction between market participants at the measurement date, regardless of whether that price is directly observable or estimated using a valuation technique. Fair value measurement is based on the presumption that the transaction to sell the asset or transfer the liability takes place either:
in the principal market for the asset or liability; or
in the absence of a principal market, in the most advantageous market for the asset or liability.
The fair value of an asset or a liability is measured using the assumptions that market participants would use when pricing the asset or liability, assuming that market participants act in their own economic best interest. A fair value measurement of a non-financial asset takes into account a market participant’s ability to generate economic benefits by using the asset in its highest and best use or by selling it to another market participant that would use the asset in its highest and best use. In estimating fair value, we use market-observable data to the extent it is available. When market-observable data is not available, we use valuation techniques that maximize the use of relevant observable inputs and minimize the use of unobservable inputs.
IFRS 13 - Fair Value Measurement establishes a hierarchy which prioritizes the inputs used in measuring fair value. The hierarchy gives the highest priority to quoted prices (unadjusted) in active markets for identical assets and liabilities (Level 1 inputs) and the lowest priority to unobservable inputs (level 3 inputs). In some cases, the inputs used to measure the fair value of an asset or a liability might be categorized within different levels of the fair value hierarchy. In those cases, the fair value measurement is categorized in its entirety in the same level of the fair value hierarchy at the lowest level input that is significant to the entire measurement.
Levels used in the hierarchy are as follows:
Level 1 inputs include quoted prices (unadjusted) in active markets for identical assets and liabilities that the Group can access at the measurement date. Level 1 primarily consists of financial instruments such as cash and cash equivalents and certain available-for-sale and held-for-trading securities.
Level 2 inputs include those which are directly or indirectly observable as of the measurement date. Level 2 instruments include commercial paper and non-exchange-traded derivatives such as over-the-counter currency and commodity forwards, swaps and option contracts, which are valued using models or other valuation methodologies. These models are primarily industry-standard models that consider various assumptions, including quoted forward prices for similar instruments in active markets, quoted prices for identical or similar inputs not in active markets, and observable inputs.
Level 3 inputs are unobservable from objective sources in the market and reflect management judgment about the assumptions market participants would use in pricing the instruments. Instruments in this category include non-exchange-traded derivatives such as certain over-the-counter commodity option and swap contracts.
Refer to Note 23, Fair value measurement, for additional information on fair value measurements.
Use of estimatesThe Consolidated Financial Statements are prepared in accordance with IFRS which requires the use of estimates, judgments and assumptions that affect the carrying amount of assets and liabilities, the disclosure of contingent assets and liabilities and the amounts of income and expenses recognized. The estimates and associated assumptions are based on management’s best judgment of elements that are known when the financial statements are prepared, on historical experience and on any other factors that are considered to be relevant.
Estimates and underlying assumptions are reviewed by the Group periodically and when circumstances require. Actual results could differ from the estimates, which would require adjustment accordingly. The effects of any changes in estimates are recognized in the Consolidated Income Statement in the period in which the adjustment is made, or in future periods.
Items requiring estimates for which there is a risk that a material difference may arise in the future in respect of the carrying amounts of assets and liabilities are discussed below.

2018 | ANNUAL REPORT 181
Employee Benefits The Group provides post-employment benefits for certain of its active employees and retirees, which vary according to the legal, fiscal and economic conditions of each country in which the Group operates and may change periodically. The plans are classified by the Group on the basis of the type of benefit provided as follows: pension benefits, health care and life insurance plans and other post-employment benefits.
Group companies provide certain post-employment benefits, such as pension or health care benefits, to their employees under defined contribution plans whereby the Group pays contributions to public or private plans on a legally mandatory, contractual, or voluntary basis. The Group recognizes the cost for defined contribution plans as incurred and classifies this by function within Cost of revenues, Selling, general and other costs, and Research and development costs in the Consolidated Income Statement.
Pension plansThe Group sponsors both non-contributory and contributory defined benefit pension plans primarily in the U.S. and Canada, the majority of which are funded. Non-contributory pension plans cover certain hourly and salaried employees and the benefits are based on a fixed rate for each year of service. Additionally, contributory benefits are provided to certain salaried employees under the salaried employees’ retirement plans.
The Group’s defined benefit pension plans are accounted for on an actuarial basis, which requires the use of estimates and assumptions to determine the net liability or net asset. The Group estimates the present value of the projected future payments to all participants by taking into consideration parameters of a financial nature such as discount rates, the rate of salary increases and the likelihood of potential future events estimated by using demographic assumptions, which may have an effect on the amount and timing of future payments, such as mortality, dismissal and retirement rates, which are developed to reflect actual and projected plan experience. Mortality rates are developed using our plan-specific populations, recent mortality information published by recognized experts in this field, primarily the U.S. Society of Actuaries and the Canadian Institute of Actuaries, and other data where appropriate to reflect actual and projected plan experience. The expected amount and timing of contributions is based on an assessment of minimum funding requirements. From time to time, contributions are made beyond those that are legally required.
Plan obligations and costs are based on existing retirement plan provisions. Assumptions regarding any potential future changes to benefit provisions beyond those to which the Group is presently committed are not made. Significant differences in actual experience or significant changes in the following key assumption may affect the pension obligations and pension expense:
Discount rates. Our discount rates are based on yields of high-quality (AA-rated) fixed income investments for which the timing and amounts of maturities match the timing and amounts of the projected benefit payments.
The effects of actual results differing from assumptions and of amended assumptions are included in Other comprehensive income/(loss). The weighted average discount rates used to determine the defined benefit obligation for the defined benefit plans were 4.3 percent and 3.7 percent at December 31, 2018 and 2017, respectively.
At December 31, 2018, the effect on the defined benefit obligation of a decrease or increase in the discount rate, holding all other assumptions constant, is as follows:
Effect on pension benefit obligation increase/
(decrease) in Net liability( € million)
10 basis point decrease in discount rate 257
10 basis point increase in discount rate (252)
Refer to Note 19, Employee benefits liabilities, for additional information on the Group’s pension plans.

182 2018 | ANNUAL REPORT
Consolidated Financial Statements
Notes to the Consolidated Financial Statements
Other post-employment benefitsThe Group provides health care, legal, severance, indemnity life insurance benefits and other post-retirement benefits to certain hourly and salaried employees. Upon retirement, these employees may become eligible for a continuation of certain benefits. Benefits and eligibility rules may be modified periodically.
These other post-employment benefits (“OPEB”) are accounted for on an actuarial basis, which requires the selection of various assumptions. The estimation of the Group’s obligations, costs and liabilities associated with OPEB requires the use of estimates of the present value of the projected future payments to all participants, taking into consideration the likelihood of potential future events estimated by using demographic assumptions, which may have an effect on the amount and timing of future payments, such as mortality, dismissal and retirement rates, which are developed to reflect actual and projected plan experience, as well as legal requirements for retirement in respective countries. Mortality rates are developed using our plan-specific populations, recent mortality information published by recognized experts in this field and other data where appropriate to reflect actual and projected plan experience.
Plan obligations and costs are based on existing plan provisions. Assumptions regarding any potential future changes to benefit provisions beyond those to which the Group is presently committed are not made.
Significant differences in actual experience or significant changes in the following key assumptions may affect the OPEB obligation and expense:
Discount rates. Our discount rates are based on yields of high-quality (AA-rated) fixed income investments for which the timing and amounts of maturities match the timing and amounts of the projected benefit payments.
Health care cost trends. The Group’s health care cost trend assumptions are developed based on historical cost data, the near-term outlook and an assessment of likely long-term trends.
At December 31, 2018, the effect of a decrease or increase in the key assumptions affecting the health care, life insurance plans and Italian severance indemnity (trattamento di fine rapporto or “TFR”), holding all other assumptions constant, is shown below:
Effect on health care and life insurance
benefit obligationEffect on the TFR benefit obligation
(€ million)
10 basis point / (100 basis point for TFR) decrease in discount rate 27 46
10 basis point / (100 basis point for TFR) increase in discount rate (27) (41)
100 basis point decrease in health care cost trend rate (38) —
100 basis point increase in health care cost trend rate 45 —
Refer to Note 19, Employee benefits liabilities, for additional information on the Group’s OPEB liabilities.
Recoverability of non-current assets with definite useful livesNon-current assets with definite useful lives include property, plant and equipment, intangible assets and assets held for sale. Intangible assets with definite useful lives mainly consist of capitalized development expenditures primarily related to the NAFTA and EMEA segments. The Group periodically reviews the carrying amount of non-current assets with definite useful lives when events or circumstances indicate that an asset may be impaired. The recoverability of non-current assets with definite useful lives is based on the estimated future cash flows, using the Group’s current business plan, of the CGUs to which the assets relate.
The global automotive industry is experiencing significant change as a result of evolving regulatory requirements for fuel efficiency, greenhouse gas emissions and other tailpipe emissions and emerging technology changes, such as electrification and autonomous driving. Our business plan could change in response to these evolving requirements and emerging technologies. As we continue to assess the potential impacts of these evolving requirements, emerging technologies and of operationalizing and implementing the strategic targets set out in the business plan, including re-allocation of our resources, the recoverability of certain of our assets or CGUs may be impacted in future periods.

2018 | ANNUAL REPORT 183
For example, our product development strategies may be affected by regulatory changes as well as changes in the expected costs of implementing electrification, including the cost of batteries. As relevant circumstances change, we expect to adjust our product plans which may result in changes to the expected use of certain of the Group’s vehicle platforms. In addition, recoverability of certain vehicle platforms, particularly in EMEA, depends on the development and launch of additional vehicles with forecasted volumes and margins largely in line with our business plan. These uncertainties could result in either impairments of, or reductions to the expected useful lives of, these platforms, or both. Any change in recoverability would be accounted for at the time such change to the business plan occurs.
For the years ended December 31, 2018, 2017 and 2016, the impairment tests performed compared the carrying amount of the assets included in the respective CGUs to their value in use. The value in use of the CGUs was determined using a discounted cash flow methodology based primarily on unobservable inputs, including estimated pre-tax future cash flows attributable to the CGUs and a pre-tax discount rate reflecting a current market assessment of the time value of money and the risks specific to the CGUs.
During the year ended December 31, 2018, impairment losses totaling €297 million were recognized. The most significant component of this impairment loss was in EMEA, primarily resulting from changes in product plans in connection with the 2018-2022 business plan. It was determined that the carrying amount of the CGUs exceeded their value in use and accordingly, an impairment charge of €262 million was recognized in EMEA, €16 million in NAFTA, €11 million in APAC and €8 million in LATAM.
During the year ended December 31, 2017, impairment losses totaling €219 million were recognized. The most significant components of this impairment loss were in EMEA, related to changes in the global product portfolio, and in LATAM, related to product portfolio changes. It was determined that the carrying amount of the CGUs exceeded their value in use and accordingly, an impairment charge of €142 million was recognized in EMEA and €56 million in LATAM. In addition, during the second quarter of 2017, due to the continued deterioration of the economic conditions in Venezuela, certain of FCA Venezuela’s assets were impaired to their fair value using a market approach, resulting in an impairment loss of €21 million.
During the year ended December 31, 2016, impairment losses totaling €177 million were recognized. The most significant component of this impairment loss related to the impairment of capitalized development expenditures for the locally produced Fiat Viaggio and Ottimo vehicles as a result of the Group’s capacity realignment to SUV production in China. It was determined that the carrying amount of the CGUs exceeded their fair value in use resulting in an impairment charge of €90 million. In addition, due to the continued deterioration of the economic conditions in Venezuela, certain of FCA Venezuela’s assets were impaired to their fair value using a market approach, resulting in an impairment charge of €43 million.
Recoverability of Goodwill and Intangible assets with indefinite useful livesIn accordance with IAS 36 - Impairment of Assets, goodwill and intangible assets with indefinite useful lives are not amortized and are tested for impairment annually or more frequently if facts or circumstances indicate that the asset may be impaired.
Goodwill and intangible assets with indefinite useful lives are allocated to operating segments or to CGUs within the operating segments. The impairment test is performed by comparing the carrying amount (which mainly comprises property, plant and equipment, goodwill, brands and capitalized development expenditures) and the recoverable amount of each CGU or group of CGUs to which Goodwill has been allocated. The recoverable amount of a CGU is the higher of its fair value less costs of disposal and its value in use. The balance of Goodwill and intangible assets with indefinite useful lives recognized by the Group primarily relates to the acquisition of FCA US. Goodwill from the acquisition of FCA US has been allocated to the NAFTA, EMEA, APAC and LATAM operating segments.

184 2018 | ANNUAL REPORT
Consolidated Financial Statements
Notes to the Consolidated Financial Statements
The assumptions used in the impairment test represent management’s best estimate for the period under consideration.
The estimate of the recoverable amount for purposes of performing the annual impairment test for each of the operating segments was determined using fair value less costs of disposal for the year ended December 31, 2018 and was based on the following assumptions:
The expected future cash flows covering the period from 2019 through 2022. These expected cash flows reflect the current expectations regarding economic conditions and market trends as well as the Group’s initiatives for the period 2019 to 2022. These cash flows relate to the respective CGUs in their current condition when preparing the financial statements and exclude the estimated cash flows that might arise from restructuring plans or other structural changes. Volumes and sales mix used for estimating the future cash flow are based on assumptions that are considered reasonable and sustainable and represent the best estimate of expected conditions regarding market trends and segment, brand and model share for the respective operating segment over the period considered. With regards to:
– The APAC operating segment, expected future cash flows are sensitive to certain assumptions, primarily the expected margins for the terminal period, such that a reduction of 0.7 percent in the margin for the terminal period would reduce the fair value down to its carrying value. While the assumptions used are considered reasonable and achievable and represent the best estimate of expected conditions in the operating segment, management is actively implementing measures to improve operating results by addressing commercial performance and cost structure to allow the achievement of the expected margins and cash flow in APAC.
– The LATAM operating segment, expected future cash flows also include the extension of tax benefits though 2025 and other government grants, which were signed into law in Brazil during the fourth quarter of 2018.
The expected future cash flows include a normalized terminal period to estimate the future result beyond the time period explicitly considered which incorporates a long-term growth rate assumption of 2 percent. The long-term EBIT margins have been set considering the margins incorporated into the five-years plan, as adjusted for the stage in the economic cycle of the regions and any specific circumstances (for example, in LATAM, the long-term EBIT margin has been adjusted to assume no extension of the Brazilian tax benefits beyond 2025).
Post-tax cash flows have been discounted using a post-tax discount rate which reflects the current market assessment of the time value of money for the period being considered and the risks specific to the operating segment and cash flows under consideration. The Weighted Average Cost of Capital (“WACC”) ranged from approximately 13.7 percent to approximately 21.7 percent. The WACC was calculated using the Capital Asset Pricing Model technique.
The values estimated as described above were determined to be in excess of the book value of the net capital employed for each operating segment to which Goodwill has been allocated. As such, no impairment charges were recognized for Goodwill and Intangible assets with indefinite useful lives for the year ended December 31, 2018.
There were no impairment charges resulting from the impairment tests performed for the years ended December 31, 2017 and 2016.
Recoverability of deferred tax assetsDeferred tax assets are recognized to the extent that it is probable that sufficient taxable profit will be available to allow the benefit of part or all of the deferred tax assets to be utilized. The recoverability of deferred tax assets is dependent on the Group’s ability to generate sufficient future taxable income in the period in which it is assumed that the deductible temporary differences reverse and tax losses carried forward can be utilized. In making this assessment, the Group considers future taxable income arising based on the most recent business plan. Moreover, the Group estimates the impact of the reversal of taxable temporary differences on earnings and it also considers the period over which these deferred tax assets could be recovered.
The estimates and assumptions used in the assessment are subject to uncertainty especially as it relates to the Group’s future performance as compared to the business plan, particularly in LATAM and EMEA. Therefore, changes in current estimates due to unanticipated events could have a significant impact on our Consolidated Financial Statements.
Refer to Note 7, Tax expense for additional detail.

2018 | ANNUAL REPORT 185
Sales incentivesThe Group records the estimated cost of sales incentive programs offered to dealers and consumers as a reduction to revenue at the time of sale to the dealer. This estimated cost represents the incentive programs offered to dealers and consumers, as well as the expected modifications to these programs in order to facilitate sales of the dealer inventory. Subsequent adjustments to sales incentive programs related to vehicles previously sold to dealers are recognized as an adjustment to Net revenues in the period the adjustment is determinable.
The Group uses price discounts to adjust vehicle pricing in response to a number of market and product factors, including pricing actions and incentives offered by competitors, economic conditions, the amount of excess industry production capacity, the intensity of market competition, consumer demand for the product and the desire to support promotional campaigns. The Group may offer a variety of sales incentive programs at any given point in time, including cash offers to dealers and consumers and subvention programs offered to customers, or lease subsidies, which reduce the retail customer’s monthly lease payment or cash due at the inception of the financing arrangement, or both. Sales incentive programs are generally brand, model and region specific for a defined period of time.
Multiple factors are used in estimating the future incentive expense by vehicle line, including the current incentive programs in the market, planned promotional programs and the normal incentive escalation incurred as the model year ages. The estimated incentive rates are reviewed monthly and changes to planned rates are adjusted accordingly, thereby impacting revenues. As there are a multitude of inputs affecting the calculation of the estimate for sales incentives, an increase or decrease of any of these variables could have a significant effect on Net revenues.
Product warranties, recall campaigns and product liabilitiesThe Group establishes reserves for product warranties at the time the related sale is recognized. The Group issues various types of product warranties under which the performance of products delivered is generally guaranteed for a certain period or term. The accrual for product warranties includes the expected costs of warranty obligations imposed by law or contract, as well as the expected costs for policy coverage, recall actions and buyback commitments. The estimated future costs of these actions are principally based on assumptions regarding the lifetime warranty costs of each vehicle line and each model year of that vehicle line, as well as historical claims experience for the Group’s vehicles. In addition, the number and magnitude of additional service actions expected to be approved and policies related to additional service actions are taken into consideration. Due to the uncertainty and potential volatility of these estimated factors, changes in the assumptions used could materially affect the results of operations.
The Group periodically initiates voluntary service and recall actions to address various customer satisfaction as well as safety and emissions issues related to vehicles sold. Included in the reserve is the estimated cost of these service and recall actions. In NAFTA, we accrue estimated costs for recalls at the time of sale, which are based on historical claims experience as well as an additional actuarial analysis that gives greater weight to the more recent calendar year trends in recall campaign activity. In other regions and sectors, however, there generally is not sufficient historical data to support the application of an actuarial-based estimation technique. As a result, estimated recall costs for the other regions and sectors are accrued at the time when they are probable and reasonably estimable, which typically occurs once a specific recall campaign is approved and is announced.
Estimates of the future costs of these actions are subject to numerous uncertainties, including the enactment of new laws and regulations, the number of vehicles affected by a service or recall action and the nature of the corrective action. It is reasonably possible that the ultimate cost of these service and recall actions may require the Group to make expenditures in excess of (or less than) established reserves over an extended period of time and in a range of amounts that cannot be reasonably estimated. The estimate of warranty and additional service and recall action obligations is periodically reviewed during the year. Experience has shown that initial data for any given model year can be volatile; therefore, our process relies upon long-term historical averages until sufficient data is available. As actual experience becomes available, it is used to modify the historical averages to ensure that the forecast is within the range of likely outcomes. Resulting accruals are then compared with current spending rates to ensure that the balances are adequate to meet expected future obligations.

186 2018 | ANNUAL REPORT
Consolidated Financial Statements
Notes to the Consolidated Financial Statements
In addition, the Group makes provisions for estimated product liability costs arising from property damage and personal injuries including wrongful death, and potential exemplary or punitive damages alleged to be the result of product defects. By nature, these costs can be infrequent, difficult to predict and have the potential to vary significantly in amount. The valuation of the reserve is actuarially determined on an annual basis based on, among other factors, the number of vehicles sold and product liability claims incurred. Costs associated with these provisions are recorded in the Consolidated Income Statement and any subsequent adjustments are recorded in the period in which the adjustment is determined.
LitigationVarious legal proceedings, claims and governmental investigations are pending against the Group on a wide range of topics, including vehicle safety, emissions and fuel economy, competition, tax and securities laws, labor, dealer, supplier and other contractual relationships, intellectual property rights, product warranties and environmental matters. Some of these proceedings allege defects in specific component parts or systems (including airbags, seats, seat belts, brakes, ball joints, transmissions, engines and fuel systems), in various vehicle models or allege general design defects relating to vehicle handling and stability, sudden unintended movement or crashworthiness. These proceedings seek recovery for damage to property, personal injuries or wrongful death and in some cases include a claim for exemplary or punitive damages. Adverse decisions in one or more of these proceedings could require the Group to pay substantial damages, or undertake service actions, recall campaigns or other costly actions.
Litigation is subject to many uncertainties, and the outcome of individual matters is not predictable with assurance. Moreover, the cases and claims against the Group are often derived from complex legal issues that are subject to differing degrees of uncertainty, including the facts and circumstances of each particular case, the manner in which the applicable law is likely to be interpreted and applied and the jurisdiction and the different laws involved. A provision is established in connection with pending or threatened litigation if it is probable there will be an outflow of funds and when the amount can be reasonably estimated. If an outflow of funds becomes probable, but the amount cannot be estimated, the matter is disclosed in the notes to the Consolidated Financial Statements. Since these provisions represent estimates, the resolution of some of these matters could require the Group to make payments in excess of the amounts accrued or may require the Group to make payments in an amount or range of amounts that could not be reasonably estimated.
The Group monitors the status of pending legal proceedings and consults with experts on legal and tax matters on a regular basis. As such, the provisions for the Group’s legal proceedings and litigation may vary as a result of future developments in pending matters.

2018 | ANNUAL REPORT 187
New standards and amendments effective January 1, 2018 The cumulative effect of the changes made to our Consolidated Statement of Financial Position as of January 1, 2018 for the adoption of IFRS 15 - Revenue from Contracts with Customers and IFRS 9 - Financial Instruments is as follows:
(€ million)
At December 31, 2017 (as
previously reported)
IFRS 15 Adoption
Effect
IFRS 9 Adoption
Effect
At January 1, 2018 (as
adjusted)
Assets
Goodwill and intangible assets with indefinite useful lives € 13,390 € — € — € 13,390
Other intangible assets 11,542 — — 11,542
Property, plant and equipment 29,014 — — 29,014
Investments accounted for using the equity method 2,008 — (9) 1,999
Other financial assets 482 — (59) 423
Deferred tax assets 2,004 (5) — 1,999
Trade and other receivables 666 — — 666
Tax receivables 83 — — 83
Prepaid expenses and other assets(1) 328 — — 328
Other non-current assets 508 — — 508
Total Non-current assets 60,025 (5) (68) 59,952
Inventories 12,922 — — 12,922
Assets sold with a buy-back commitment 1,748 (288) — 1,460
Trade and other receivables 7,887 — — 7,887
Tax receivables 215 — — 215
Prepaid expenses and other assets(1) 377 — — 377
Other financial assets 487 — 59 546
Cash and cash equivalents 12,638 — — 12,638
Total Current assets 36,274 (288) 59 36,045
Total Assets € 96,299 € (293) € (9) € 95,997
Equity and liabilities
Equity
Equity attributable to owners of the parent € 20,819 € 30 € (9) € 20,840
Non-controlling interests 168 — — 168
Total Equity 20,987 30 (9) 21,008
Liabilities
Long-term debt 10,726 — — 10,726
Employee benefits liabilities 8,584 — — 8,584
Provisions 5,770 — — 5,770
Other financial liabilities 1 — — 1
Deferred tax liabilities 388 2 — 390
Tax payables 74 — — 74
Other liabilities 2,500 (17) — 2,483
Total Non-current liabilities 28,043 (15) — 28,028
Trade payables 21,939 (73) — 21,866
Short-term debt and current portion of long-term debt 7,245 — — 7,245
Employee benefits liabilities 694 — — 694
Provisions 9,009 1 — 9,010
Other financial liabilities 138 — — 138
Tax payables 309 — — 309
Other liabilities 7,935 (236) — 7,699
Total Current liabilities 47,269 (308) — 46,961
Total Equity and liabilities € 96,299 € (293) € (9) € 95,997(1) Caption previously reported as “Accrued income and prepaid expenses”

188 2018 | ANNUAL REPORT
Consolidated Financial Statements
Notes to the Consolidated Financial Statements
IFRS 15 - Revenue from contracts with customersIFRS 15 - Revenue from contracts with customers (“IFRS 15”) requires companies to recognize revenue upon transfer of control of goods or services to a customer at an amount that reflects the consideration it expects to receive for those goods or services. The Group adopted IFRS 15 and all the related amendments using the modified retrospective method, with the cumulative effect of initially applying the standard recognized as an adjustment to the Group’s opening equity balance on January 1, 2018. The comparative period has not been restated and continues to be reported under the accounting standards in effect for periods prior to January 1, 2018. There was no material impact on our Consolidated Financial Statements from the adoption of this standard in 2018 and we do not expect a material impact on an ongoing basis.
The majority of our revenue continues to be recognized in a manner consistent with prior years. Revenue from the sale of vehicles and service parts is recognized upon transfer of control to our customers, which generally corresponds to the date when the vehicles and service parts are made available to dealers or distributors, or when the vehicles and service parts are released to the carrier responsible for transporting them to dealers or distributors. Under IFRS 15, however, new vehicle sales through our Guarantee Depreciation Program (“GDP”), under which the Group guarantees the residual value or otherwise assumes responsibility for the minimum resale value of the vehicle, as well as those vehicles which include a put option for which the customer does not have a significant economic incentive to exercise, will be recognized as revenue when the vehicles are shipped, rather than being accounted for as an operating lease.
The impact of adoption on our Consolidated Income Statement for the year ended December 31, 2018 and Consolidated Statement of Financial Position at December 31, 2018 was as follows:
Year ended December 31, 2018
As reportedAmounts without
adoption of IFRS 15Effect of change
higher/(lower)(€ million)
Consolidated Income Statement
Net revenues 110,412 110,533 (121)
Cost of revenues 95,011 95,127 (116)
Tax expense 778 779 (1)
Profit from discontinued operations, net of tax 302 303 (1)
Net profit 3,632 3,637 (5)
At December 31, 2018
As reportedBalances without
adoption of IFRS 15Effect of change
higher/(lower)(€ million)
Consolidated Statement of Financial Position
Assets
Deferred tax assets 1,814 1,814 —
Inventories 10,694 10,694 —
Assets sold with a buy-back commitment 1,707 1,890 (183)
Assets held for sale 4,801 4,805 (4)
Equity
Equity attributable to owners of the parent 24,702 24,679 23
Liabilities
Deferred tax liabilities 937 937 —
Other liabilities (non-current) 2,452 2,453 (1)
Trade payables 19,229 19,280 (51)
Provisions (current) 10,483 10,483 —
Tax payables (current) 114 114 —
Other liabilities (current) 7,057 7,186 (129)
Liabilities held for sale 2,931 2,960 (29)

2018 | ANNUAL REPORT 189
Revenue recognitionRevenue is recognized when control of our vehicles, services or parts has been transferred and the Group’s performance obligations to our customers have been satisfied. Revenue is measured as the amount of consideration the Group expects to receive in exchange for transferring goods or providing services. The timing of when the Group transfers the goods or services to the customer may differ from the timing of the customer’s payment. The Group recognizes a contract liability when it invoices an amount to a customer prior to the transfer of the goods or services provided. When the Group gives our customers the right to return eligible goods, the Group estimates the expected returns based on an analysis of historical experiences. Sales, value added and other taxes that the Group collects on behalf of others concurrently with revenue generating activities are excluded from revenue and are recognized within the Other liabilities and the Tax payables line items in the Consolidated Statement of Financial Position. Incidental items that are immaterial in the context of the contract are recognized as expense.
The Group also enters into contracts with multiple performance obligations. For these contracts, the Group allocates revenue from the transaction price to the distinct goods and services in the contract on a relative standalone selling price basis. To the extent that the Group sells the good or service separately in the same market, the standalone selling price is the observable price at which the Group sells the good or service separately. For all other goods or services, the Group estimates the standalone selling price using a cost-plus-margin approach.
Sales of goodsThe Group has determined that our customers from the sale of vehicles and service parts are generally dealers, distributors or fleet customers. Transfer of control, and therefore revenue recognition, generally corresponds to the date when the vehicles or service parts are made available to the customer, or when the vehicles or service parts are released to the carrier responsible for transporting them to the customer. This is also the point at which invoices are issued, with payment for vehicles typically due immediately and payment for service parts typically due in the following month. For component part sales, revenue recognition is consistent with that of service parts. The Group also sells tooling, with control transferring at the point in time when the customer accepts the tooling.
The cost of incentives, if any, is estimated at the inception of a contract at the expected amount that will ultimately be paid and is recognized as a reduction to revenue at the time of the sale. If a vehicle contract transaction has multiple performance obligations, the cost of incentives is allocated entirely to the vehicle as the intent of the incentives is to encourage sales of vehicles. If the estimate of the incentive changes following the sale to the customer, the change in estimate is recognized as an adjustment to revenue in the period of the change. Refer to the Use of estimates - Sales incentives for more information on these programs.
New vehicle sales through GDP are recognized as revenue when control of the vehicle transfers to the fleet customer, except in situations where the Group issues a put option for which there is a significant economic incentive to exercise, as discussed below. Upon recognition of the vehicle revenue, the Group establishes a liability equal to the estimated amount of any residual value guarantee.
The Group also sells vehicles where, in addition to guaranteeing the residual value, the contract includes a put option whereby the fleet customer can require the Group to repurchase the vehicles. For these types of arrangements, the Group assesses whether a significant economic incentive exists for the customer to exercise its put option. If the Group determines that a significant economic incentive does not exist for the customer to exercise its put option, then revenue is recognized when control of the vehicle transfers to the fleet customer and a liability is recognized equal to the estimated amount of the residual value guarantee. If the Group determines that a significant economic incentive exists, then the arrangement is accounted for similarly to a repurchase obligation, as described in Lease installments from assets sold with buy-back commitments.

190 2018 | ANNUAL REPORT
Consolidated Financial Statements
Notes to the Consolidated Financial Statements
Services providedWhen control of a good transfers to the customer prior to the completion of shipping activities for which the Group is responsible, this represents a separate performance obligation for which the shipping revenue is recognized when the shipping service is complete. Other revenues from services provided are primarily comprised of maintenance plans and extended warranties, and are recognized over the contract period in proportion to the costs expected to be incurred based on our historical experience. These services are either included in the selling price of the vehicle or separately priced. Revenue for services is allocated based on the estimated stand-alone selling price. Costs associated with the sale of contracts are deferred and are subsequently amortized to expense consistent with how the related revenue is recognized. The Group had €200 million of deferred service contract costs at December 31, 2018 and recognized €88 million of amortization expense during the year ended December 31, 2018.
Contract revenuesRevenue from construction contracts, which is comprised of industrial automation systems, included within “Other activities”, is recognized as revenue over the contract period in proportion to the costs expected to be incurred based on our historical experience. A loss is recognized if the sum of the expected costs for services under the contract exceeds the transaction price.
Lease installments from assets sold with buy-back commitmentsVehicle sales to fleet customers can include a repurchase obligation, whereby the Group is required to repurchase the vehicles at a given point in time. The Group accounts for such sales as an operating lease. Upon the transfer of vehicles to the fleet customer, the Group records a liability equal to the proceeds received within Other liabilities in the Consolidated Statement of Financial Position. The difference between the proceeds received and the guaranteed repurchase amount is recognized as revenue over the contractual term on a straight-line basis. The cost of the vehicle is recorded within Assets sold with a buy-back commitment in the Consolidated Statement of Financial Position and the difference between the cost of the vehicle and the estimated residual value is recognized within Cost of revenues in the Consolidated Income Statement over the contractual term.
Interest income of financial services activitiesInterest income, which is primarily generated from the Group by providing dealer and retail financing, is recognized using the effective interest method.
IFRS 9 - Financial InstrumentsIFRS 9 - Financial Instruments (“IFRS 9”) replaces IAS 39 - Financial Instruments (“IAS 39”). In particular, it amends the previous guidance in three main areas:
The classification and measurement of financial assets, which is driven by cash flow characteristics and the business model in which an asset is held;
The accounting for impairment of financial assets through the introduction of an “expected credit loss” impairment model, replacing the incurred loss method under IAS 39; and
Hedge accounting, in particular removing some of the restrictions in applying hedge accounting under IAS 39 and to more closely align the accounting for hedge instruments with risk management policies.
In accordance with the transitional provisions in IFRS 9, the Group did not restate prior periods. For hedge accounting, the Group applied the standard prospectively. Comparative figures have not been restated for the classification and measurement provisions of the standard, including impairment, and continue to be reported under the accounting standards in effect for periods prior to January 1, 2018. The impact of adoption on our Consolidated Financial Statements was not material.

2018 | ANNUAL REPORT 191
Financial assets and liabilitiesFinancial assets primarily include trade receivables, receivables from financing activities, investments in other companies, derivative financial instruments, cash and cash equivalents, and debt securities that represent temporary investments of available funds and do not satisfy the requirements for being classified as cash equivalents.
Financial liabilities primarily consist of debt, derivative financial instruments, trade payables and other liabilities. The classification of financial liabilities under IFRS 9 is unchanged compared with the previous accounting requirements under IAS 39.
Receivables from dealer financing activities are typically generated by sales of vehicles and are generally managed under dealer network financing programs as a component of the portfolio of the Group’s financial services companies. These receivables are interest bearing with the exception of an initial, limited, non-interest bearing period. The contractual terms governing the relationships with the dealer networks vary according to market and payment terms, which range from two to twelve months.
Classification and measurement (policy applicable from January 1, 2018)The classification of a financial asset is dependent on the Group’s business model for managing such financial assets and their contractual cash flows. The Group considers whether the contractual cash flows represent solely payments of principal and interest that are consistent with a basic lending arrangement. Where the contractual terms introduce exposure to risk or volatility that are inconsistent with a basic lending arrangement, the related financial assets are classified and measured at fair value through profit or loss (“FVPL”).
Financial asset cash flow business model Initial measurement(1) Measurement category(3)
Solely to collect the contractual cash flows (Held to Collect) Fair Value including transaction costs Amortized Cost(2)
Collect both the contractual cash flows and generate cash flows arising from the sale of assets (Held to Collect and Sell)
Fair Value including transaction costs Fair value through other comprehensive income (“FVOCI”)
Generate cash flows primarily from the sale of assets (Held to Sell) Fair Value FVPL(1) A trade receivable without a significant financing component, as defined by IFRS 15, is initially measured at the transaction price.(2) Receivables with maturities of over one year, which bear no interest or have an interest rate significantly lower than market rates are discounted
using market rates.(3) On initial recognition, the Group may irrevocably designate a financial asset at FVPL that otherwise meets the requirements to be measured at
amortized cost or at FVOCI if doing so eliminates or significantly reduces an accounting mismatch that would otherwise arise.
Factors considered by the Group in determining the business model for a group of financial assets include:
past experience on how the cash flows for these assets were collected;
the frequency, volume and timing of sales of financial assets in prior periods, the reasons for such sales and future sales activity expectations;
how the asset’s performance is evaluated and reported to key management personnel; and
how risks are assessed and managed and how management is compensated.
Financial assets are not reclassified subsequent to their initial recognition unless the Group changes its business model for managing financial assets, in which case all affected financial assets are reclassified on the first day of the first reporting period following the change in the business model.
Cash and cash equivalents include cash at banks, units in money market funds and other money market securities, commercial paper and certificate of deposits that are readily convertible into cash, with original maturities of three months or less at the date of purchase. Cash and cash equivalents are subject to an insignificant risk of changes in value and consist of balances across various primary national and international money market instruments. Money market funds consist of investments in high quality, short-term, diversified financial instruments that can generally be liquidated on demand and are measured at FVPL. Cash at banks and Other cash equivalents are measured at amortized cost.

192 2018 | ANNUAL REPORT
Consolidated Financial Statements
Notes to the Consolidated Financial Statements
Investments in other companies are measured at fair value. Equity investments for which there is no quoted market price in an active market and there is insufficient financial information in order to determine fair value may be measured at cost as an estimate of fair value, as permitted by IFRS 9. The Group may irrevocably elect to present subsequent changes in the investment’s fair value in Other comprehensive income (“OCI”) upon the initial recognition of an equity investment that is not held to sell. This election is made on an investment-by-investment basis. Generally, any dividends from these investments are recognized in Other income from investments within Result from investments when the Group’s right to receive payment is established. Other net gains and losses are recognized in OCI and will not be reclassified to the Consolidated Income Statement in subsequent periods. Impairment losses (and the reversal of impairment losses) on equity investments measured at FVOCI are not reported separately from other changes in fair value in OCI.
Impairment of financial assets (policy applicable from January 1, 2018)The Group’s credit risk differs in relation to the type of activity. In particular, receivables from financing activities, such as dealer and retail financing that are carried out through the Group’s financial services companies, are exposed both to the direct risk of default and the deterioration of the creditworthiness of the counterparty, whereas trade receivables arising from the sale of vehicles and spare parts, are mostly exposed to the direct risk of counterparty default. These risks are mitigated by different kinds of securities received and the fact that collection exposure is spread across a large number of counterparties.
The IFRS 9 impairment requirements are based on a forward-looking expected credit loss (“ECL”) model. ECL is a probability-weighted estimate of the present value of cash shortfalls.
The calculation of the amount of ECL is based on the risk of default by the counterparty, which is determined by taking into account the information available at the end of each reporting period as to the counterparty’s solvency, the fair value of any guarantees and the Group’s historical experience. The Group considers a financial asset to be in default when: (i) the borrower is unlikely to pay its obligations in full and without consideration of compensating guarantees or collateral (if any exist); or (ii) the financial asset is more than 90 days past due.
The Group applies two impairment models for financial assets as set out in IFRS 9: the simplified approach and the general approach. The table below indicates the impairment model used for each of our financial asset categories. Impairment losses on financial assets are recognized in the Consolidated Income Statement within the corresponding line items, based on the classification of the counterparty.
Financial asset IFRS 9 impairment model
Trade receivables Simplified approach
Receivables from financing activities General approach
Other receivables General approach
In order to test for impairment, individually significant receivables and receivables for which collectability is at risk are assessed individually, while all other receivables are grouped into homogeneous risk categories based on shared risk characteristics such as instrument type, industry or geographical location of the counterparty.
The simplified approach for determining the lifetime ECL allowance is performed in two steps:
All trade receivables that are in default, as defined above, are individually assessed for impairment; and
A general reserve is recognized for all other trade receivables (including those not past due) based on historical loss rates.
The Group applies the general approach as determined by IFRS 9 by assessing at each reporting date whether there has been a significant increase in credit risk on the financial instrument since initial recognition. The Group considers receivables to have experienced a significant increase in credit risk when certain quantitative or qualitative indicators have been met or the borrower is more than 30 days past due on its contractual payments.

2018 | ANNUAL REPORT 193
The “three-stages” for determining and measuring the impairment based on changes in credit quality since initial recognition are summarized below:
Stage DescriptionTime period for measurement of ECL
Stage 1 A financial instrument that is not credit-impaired on initial recognition 12-month ECL
Stage 2 A financial instrument with a significant increase in credit risk since initial recognition Lifetime ECL
Stage 3 A financial instrument that is credit-impaired or has defaulted Lifetime ECL
Considering forward-looking economic information, ECL is determined by projecting the probability of default, exposure at default and loss given default for each future contractual period and for each individual exposure or collective portfolio. The discount rate used in the ECL calculation is the stated effective interest rate or an approximation thereof. Each reporting period, the assumptions underlying the ECL calculation are reviewed and updated as necessary. Since adoption, there have been no significant changes in estimation techniques or significant assumptions that led to material changes in the ECL allowance.
The gross carrying amount of a financial asset is written-off to the extent that there is no realistic prospect of recovery. This is generally the case when the Group determines that a debtor does not have assets or sources of income that could generate sufficient cash flows to repay the amounts subject to the write-off. However, financial assets that are written off could still be subject to enforcement activities.
Derivative financial instruments (policy applicable from January 1, 2018)Derivative financial instruments are used for economic hedging purposes in order to reduce currency, interest rate and market price risks (primarily related to commodities). In accordance with IFRS 9, derivative financial instruments are recognized on the basis of the settlement date and, upon initial recognition, are measured at fair value less (in case a financial asset is not measured at FVPL) transaction costs that are directly attributable to the acquisition of the financial assets. Subsequent to initial recognition, all derivative financial instruments are measured at fair value. Furthermore, derivative financial instruments qualify for hedge accounting when (i) there is formal designation and documentation of the hedging relationship and the Group’s risk management objective and strategy for undertaking the hedge at inception of the hedge and (ii) the hedge is expected to be effective.
When derivative financial instruments qualify for hedge accounting, the following accounting treatments apply:
Fair value hedges - where a derivative financial instrument is designated as a hedge of the exposure to changes in fair value of a recognized asset or liability attributable to a particular risk that could affect the Consolidated Income Statement, the gain or loss from remeasuring the hedging instrument at fair value is recognized in the Consolidated Income Statement. The gain or loss on the hedged item attributable to the hedged risk adjusts the carrying amount of the hedged item and is recognized in the Consolidated Income Statement.
Cash flow hedges - where a derivative financial instrument is designated as a hedge of the exposure to variability in future cash flows of a recognized asset or liability or a highly probable forecasted transaction and could affect the Consolidated Income Statement, the effective portion of any gain or loss on the derivative financial instrument is recognized directly in Other comprehensive income/(loss). When the hedged forecasted transaction results in the recognition of a non-financial asset, the gains and losses previously deferred in Other comprehensive income/(loss) are reclassified and included in the initial measurement of the cost of the non-financial asset. The effective portion of any gain or loss is recognized in the Consolidated Income Statement at the same time as the economic effect arising from the hedged item that affects the Consolidated Income Statement. The gain or loss associated with a hedge or part of a hedge that has become ineffective is recognized in the Consolidated Income Statement immediately.
When a hedging instrument or hedge relationship is terminated but the hedged transaction is still expected to occur, the cumulative gain or loss realized to the point of termination remains and is recognized in the Consolidated Income Statement at the same time as the underlying transaction occurs. If the hedged transaction is no longer probable, the cumulative unrealized gain or loss held in Other comprehensive income/(loss) is recognized in the Consolidated Income Statement immediately.

194 2018 | ANNUAL REPORT
Consolidated Financial Statements
Notes to the Consolidated Financial Statements
Hedges of a net investment - if a derivative financial instrument is designated as a hedging instrument for a net investment in a foreign operation, the effective portion of the gain or loss on the derivative financial instrument is recognized in Other comprehensive income/(loss). The cumulative gain or loss is reclassified from Other comprehensive income/(loss) to the Consolidated Income Statement upon disposal of the foreign operation.
Hedge effectiveness is determined at the inception of the hedge relationship and through periodic prospective effectiveness assessments to ensure that an economic relationship exists between the hedged item and hedging instrument. The Group enters into hedge relationships where the critical terms of the hedging instrument match closely or exactly with the terms of the hedged item, and so a qualitative assessment of effectiveness is performed. If changes in circumstances affect the terms of the hedged item such that the critical terms no longer match closely or perfectly with the critical terms of the hedging instrument, the Group uses the hypothetical derivative method to assess effectiveness.
Ineffectiveness is measured by comparing the cumulative changes in fair value of the hedging instrument and cumulative change in fair value of the hedged item arising from the designated risk. The primary potential sources of hedge ineffectiveness are mismatches in timing or the critical terms of the hedged item and the hedging instrument.
The hedge ratio is the relationship between the quantity of the derivative and the hedged item. The Group’s derivatives have the same underlying quantity as the hedged items, therefore the hedge ratio is expected to be one for one.
If hedge accounting cannot be applied, the gains or losses from the fair value measurement of derivative financial instruments are recognized immediately in the Consolidated Income Statement.
Refer to Note 16, Derivative financial assets and liabilities, for additional information on fair value measurements.
Transfers of financial assetsThe Group derecognizes financial assets when the contractual rights to the cash flows arising from the asset are no longer held or if it transfers substantially all the risks and rewards of ownership of the financial asset. On derecognition of financial assets, the difference between the carrying amount of the asset and the consideration received or receivable for the transfer of the asset is recognized in the Consolidated Income Statement.
The Group transfers certain of its financial, trade and tax receivables, mainly through factoring transactions. Factoring transactions may be either with recourse or without recourse. Certain transfers include deferred payment clauses requiring first loss cover (for example, when the payment by the factor of a minor part of the purchase price is dependent on the total amount collected from the receivables), whereby the transferor has priority participation in the losses, or requires a significant exposure to the variability of cash flows arising from the transferred receivables to be retained. These types of transactions do not meet the requirements of IFRS 9 for the derecognition of the assets since the risks and rewards connected with ownership of the financial asset are not substantially transferred, and accordingly the Group continues to recognize these receivables within the Consolidated Statement of Financial Position and recognizes a financial liability for the same amount under Asset-backed financing, which is included within Debt. These types of receivables are classified as held-to-collect, since the business model is consistent with the Group’s continuing recognition of the receivables.
TransitionThe total impact on the Group’s Equity attributable to owners of the parent as at January 1, 2018, resulting from the initial application of the IFRS 9 impairment model on the financial assets held by FCA Bank, our jointly-controlled financial services company, which is accounted for under the equity method, is as follows:
At January 1, 2018
(€ million)
Equity attributable to owners of the parent - IAS 39 € 20,819
Impact on the Equity method (net of tax) (9)
Adjusted Equity attributable to owners of the parent - IFRS 9 € 20,810
During the year ended December 31, 2018, the Group reclassified €1 million of gains from OCI to Inventories.
The Group does not expect a material impact to its Net profit on an ongoing basis from the adoption of this standard.

2018 | ANNUAL REPORT 195
On January 1, 2018, the financial instruments of the Group were reclassified into the appropriate IFRS 9 categories. The main effects resulting from the reclassification between measurement categories are as follows:
Financial statement line item
IAS 39 measurement
category(D)
At December
31, 2017Reclas-
sification
At January 1, 2018
IFRS 9 measurement
category Financial statement line item(€ million)
Other financial assets (non-current)
Other financial assets (non-current)
Derivative financial assets FVPL(E) € 19 € — € 19 FVPL(E) Derivative financial assetsDebt securities measured at fair value through profit or loss FVPL 59 (59) (A)
Debt securities held-to-maturity AC 2 (2)
2 2 AC Other assets
Equity instruments measured at cost Cost 43 (43) (B)
20 (B) 20 FVPL Equity instruments measured at FVPLEquity instruments measured at fair value through other comprehensive income FVOCI (AFS) 23 23 (B) 46 FVOCI
Equity instruments measured at FVOCI
Financial receivables AC (L&R) 275 — 275 AC Financial receivables
Collateral deposits FVPL 61 — 61 FVPL Collateral deposits
Total Other financial assets € 482 € (59) € 423 Total Other financial assets
Other receivables (non-current) Other receivables (non-current)
Receivables from financing activities AC (L&R) € 194 € — € 194 AC Receivables from financing activities
Other receivables AC (L&R) 472 — 472 AC Other receivables
Total Other receivables € 666 € — € 666 Total Other receivables
Trade and other receivables (current)
Trade and other receivables (current)
Trade receivables AC (L&R) € 2,460 € (28) (C) € 2,432 AC Trade receivables
28 (C) 28 FVPL Trade receivables
Receivables from financing activities AC (L&R) 2,946 (700) (C) 2,246 AC Receivables from financing activities
700 (C) 700 FVPL Receivables from financing activities
Other receivables AC (L&R) 2,481 — 2,481 AC Other receivables
Total Trade and other receivables € 7,887 € — € 7,887 Total Trade and other receivables
Other financial assets (current) Other financial assets (current)
Derivative financial assets FVPL(E) € 265 € — € 265 FVPL(E) Derivative financial assetsDebt securities measured at fair value through other comprehensive income FVOCI (AFS) 4 (4)
4 4 AC Other financial assetsDebt securities measured at fair value through profit or loss FVPL (HFT) 172 59 (A) 231 FVPL Debt securities measured at FVPL
Held-for-trading investments FVPL (HFT) 46 (46)
46 46 FVPL Equity instruments measured at FVPL
Total Other financial assets € 487 € 59 € 546 Total Other financial assets
Cash and cash equivalents Cash and cash equivalents
Cash at banks FVPL € 6,396 € — € 6,396 AC Cash at banks
Money market securities FVPL 6,242 (3,530) 2,712 FVPL Money market securities
3,530 3,530 AC Other cash equivalents
Total Cash and cash equivalents € 12,638 € — € 12,638 Total Cash and cash equivalents(A) As of January 1, 2018, debt securities of €59 million were reclassified from non-current to current to reflect the held to sell business model
with no impact on retained earnings.(B) As permitted by IFRS 9, the Group has designated certain investments in other companies at the date of initial application as measured at FVOCI(C) Certain trade receivables and receivables from financing activities, mainly attributable to the EMEA region, were reclassified from amortized
cost to FVPL as a result of the held to sell business model.(D) AFS: available-for-sale; HTM: held-to-maturity; L&R: Loans & Receivables; HFT: held-for-trading; FV: fair value.(E) Except for derivatives designated in cash flow hedging relationship, as described above.

196 2018 | ANNUAL REPORT
Consolidated Financial Statements
Notes to the Consolidated Financial Statements
Other new standards and amendmentsThe following amendments and interpretations, which were effective from January 1, 2018, were adopted by the Group. The adoption of these amendments had no effect on the Consolidated Financial Statements.
IFRS 2 - Share-based Payment, to provide requirements on the accounting for (i) the effects of vesting and non-vesting conditions on the measurement of cash-settled share-based payments, (ii) share-based payment transactions with a net settlement feature for withholding tax obligations and (iii) a modification to the terms and conditions of a share-based payment that changes the classification of the transaction from cash-settled to equity-settled.
Applying IFRS 9, Financial Instruments with IFRS 4, Insurance Contracts (Amendments to IFRS 4). The amendments provide two options for entities that issue insurance contracts within the scope of IFRS 4: (i) an option that permits entities to reclassify, from profit or loss to other comprehensive income, some of the income or expenses arising from designated financial assets (the “overlay approach”) and (ii) an optional temporary exemption from applying IFRS 9 for entities whose predominant activity is issuing contracts within the scope of IFRS 4 (the “deferral approach”).
Annual Improvements to IFRS Standards 2014–2016 Cycle, which included amendments to IAS 28 - Investments in Associates and Joint Ventures (effective January 1, 2018). The amendments clarify, correct or remove redundant wording in the related standard.
IFRIC Interpretation 22 - Foreign Currency Transactions and Advance Consideration which addresses the exchange rate to use in transactions that involve advance consideration paid or received in a foreign currency.
New standards and amendments not yet effectiveThe following new standards and amendments were issued by the IASB. We will comply with the relevant guidance no later than their respective effective dates:
In January 2016, the IASB issued IFRS 16 - Leases (“IFRS 16”), which sets out the principles for the recognition, measurement, presentation and disclosure of leases for both parties to a contract and replaces the previous leases standard, IAS 17 - Leases. IFRS 16 is not applicable to service contracts but only to leases or lease components of a contract and defines a lease as a contract that conveys to the customer (lessee) the right to use an asset for a period of time in exchange for consideration. IFRS 16 eliminates the classification of leases for the lessee as either operating leases or finance leases as required by IAS 17 and introduces a single lessee accounting model whereby a lessee is required to recognize assets and liabilities for all leases. IFRS 16 is effective from January 1, 2019.
The Group has elected to adopt IFRS 16 under the Modified Retrospective approach and as such prior-year comparatives will not be restated.
As IFRS 16 substantially carries forward the lessor accounting requirements in IAS 17, we will continue to classify our leases where FCA is a lessor as operating leases or finance leases and account for them accordingly.
We are finalizing the implementation and assessment of the impact of the adoption of the standard on our Consolidated Financial Statements. Based on current information, the estimated impact of the standard on the Group’s Consolidated Statement of Financial Position at January 1, 2019, is an increase in both the right-of-use assets and the lease liabilities of approximately €1.3 billion of which approximately €0.2 billion will be included in Assets and Liabilities held for sale.
The impact of adoption on Net Profit is expected to be immaterial over time but a timing effect will occur due to the front-loading of interest expense as compared to IAS 17. There will be a reclassification from rent expense to depreciation and amortization expense and to interest expense. As a result of this reclassification, cash flows from operating activities will increase and be offset by a decrease in cash flows from financing activities and, accordingly, there will be an immaterial change in the underlying cash flows for the year. The estimated impact on the Consolidated Income Statement from continuing and discontinued operations for 2019 is expected to be immaterial. The opening balance of lease liabilities as at January 1, 2019 will exclude short-term leases, leases of low value assets and will be discounted as compared with the minimum operating lease payments under IAS 17 at December 31, 2018.
In May 2017, the IASB issued IFRS 17 - Insurance Contracts (“IFRS 17”), which replaces IFRS 4 - Insurance Contracts. IFRS 17 requires all insurance contracts to be accounted for in a consistent manner and insurance obligations to be accounted

2018 | ANNUAL REPORT 197
for using current values, instead of historical cost. The new standard requires current measurement of the future cash flows and the recognition of profit over the period that services are provided under the contract. IFRS 17 also requires entities to present insurance service results (including presentation of insurance revenue) separately from insurance finance income or expenses, and requires an entity to make an accounting policy choice of whether to recognize all insurance finance income or expenses in profit or loss or to recognize some of those income or expenses in other comprehensive income. The standard is effective for annual periods beginning on or after January 1, 2021 with earlier adoption permitted. We do not expect a material impact to our Consolidated Financial Statements or disclosures upon adoption of the amendments.
In June 2017, the IASB issued IFRIC Interpretation 23 - Uncertainty over Income Tax Treatment, (the “Interpretation”), which clarifies application of recognition and measurement requirements in IAS 12 - Income Taxes when there is uncertainty over income tax treatments. The Interpretation specifically addresses the following: (i) whether an entity considers uncertain tax treatments separately, (ii) the assumptions an entity makes about the examination of tax treatments by taxation authorities, (iii) how an entity determines taxable profit (tax loss), tax bases, unused tax losses, unused tax credits and tax rates and (iv) how an entity considers changes in facts and circumstances. The Interpretation does not add any new disclosure requirements, however it highlights the existing requirements in IAS 1 - Presentation of Financial Statements, related to disclosure of judgments, information about the assumptions made and other estimates and disclosures of tax-related contingencies within IAS 12 - Income Taxes. The Interpretation is applicable for annual reporting periods beginning on or after January 1, 2019 and it provides a choice of two transition approaches: (i) retrospective application using IAS 8 - Accounting Policies, Changes in Accounting Estimates and Errors, only if the application is possible without the use of hindsight, or (ii) retrospective application with the cumulative effect of the initial application recognized as an adjustment to equity on the date of initial application and without restatement of the comparative information. The Group will apply IFRIC 23 from January 1, 2019 under the retrospective approach with the cumulative effect of the initial application recognized as an adjustment to equity on the date of initial application. We do not expect a material impact to our Consolidated Financial Statements or disclosures upon application of the interpretation.
In October 2017, the IASB issued Prepayment Features with Negative Compensation (Amendments to IFRS 9), allowing companies to measure particular prepayable financial assets with so-called negative compensation at amortized cost or at fair value through other comprehensive income if a specified condition is met, instead of at fair value through profit or loss, effective January 1, 2019. We do not expect a material impact to our Consolidated Financial Statements or disclosures upon adoption of the amendments.
In October 2017, the IASB issued Long-term interests in associates and joint ventures (Amendments to IAS 28), which clarifies that companies account for long-term interests in an associate or joint venture, to which the equity method is not applied, using IFRS 9, effective January 1, 2019. We do not expect a material impact to our Consolidated Financial Statements or disclosures upon adoption of the amendments.
In December 2017, the IASB issued the Annual Improvements to IFRSs 2015-2017, a series of amendments to IFRSs in response to issues raised mainly on IFRS 3 - Business Combinations, which clarifies that a company remeasure its previously held interest in a joint operation when it obtains control of the business, on IFRS 11 - Joint Arrangements, a company does not remeasure its previously held interest in a joint operation when it obtains joint control of the business, on IAS 12 - Income Taxes, which clarifies that all income tax consequences of dividends (i.e. distribution of profits) should be recognized in profit or loss, regardless of how the tax arises, and on IAS 23 - Borrowing Costs, which clarifies that a company treats as part of general borrowing any borrowing originally made to develop an asset when the asset is ready for its intended use or sale. The effective date of the amendments is January 1, 2019. We do not expect a material impact to our Consolidated Financial Statements or disclosures upon adoption of the amendments.
In February 2018, the IASB issued Plan Amendment, Curtailment or Settlement (Amendments to IAS 19) which specifies how companies determine pension expenses when changes to a defined benefit pension plan occur. IAS 19 - Employee Benefits specifies how a company accounts for a defined benefit plan. When a change to a plan-an amendment, curtailment or settlement-takes place, IAS 19 requires a company to remeasure its net defined benefit liability or asset. The amendments require a company to use the updated assumptions from this remeasurement to determine current service cost and net interest for the remainder of the reporting period after the change to the plan. The amendments are effective for plan amendments, curtailments or settlements occurring on or after the beginning of the first annual reporting period that begins on or after January 1, 2019. We do not expect a material impact to our Consolidated Financial Statements or disclosures upon adoption of the amendments.

198 2018 | ANNUAL REPORT
Consolidated Financial Statements
Notes to the Consolidated Financial Statements
In October 2018, the IASB issued amendments to IFRS 3 - Business Combinations which change the definition of a business to enable entities to determine whether an acquisition is a business combination or an asset acquisition. The amendments are effective for annual periods beginning on or after January 1, 2020 with earlier adoption permitted. We do not expect a material impact to our Consolidated Financial Statements or disclosures upon adoption of the amendments.
In October 2018, the IASB issued amendments to its definition of material in IAS 1, Presentation of Financial Statements and IAS 8, Accounting Policies, Changes in Accounting Estimates clarifying the definition of materiality to aid in application. The amendments are effective for annual periods beginning on or after January 1, 2020 with earlier adoption permitted. We do not expect a material impact to our Consolidated Financial Statements or disclosures upon adoption of the amendments.
3. SCOPE OF CONSOLIDATIONThe following table sets forth a list of the principal subsidiaries of FCA, which are grouped by our reportable segments, as well as our holding and other companies:
Name Country Percentage Interest Held
NAFTA
FCA US LLC USA (Delaware) 100.00
FCA Canada Inc. Canada 100.00
FCA Mexico, S.A. de C.V. Mexico 100.00
LATAM
FCA Fiat Chrysler Automoveis Brasil LTDA Brazil 100.00
FCA Automobiles Argentina S.A. Argentina 100.00
Banco Fidis S.A. Brazil 100.00
APAC
Chrysler Group (China) Sales Limited People’s Republic of China 100.00
FCA Japan Ltd. Japan 100.00
FCA Australia Pty Ltd. Australia 100.00
FCA Automotive Finance Co. Ltd. People’s Republic of China 100.00
Alfa Romeo (Shanghai) Automobiles Sales Co. Ltd. People’s Republic of China 100.00
EMEA
FCA Italy S.p.A. Italy 100.00
FCA Melfi S.r.l. Italy 100.00
FCA Poland Spólka Akcyjna Poland 100.00
FCA Powertrain Poland Sp. z o.o. Poland 100.00
FCA Serbia d.o.o. Kragujevac Serbia 66.67
FCA Germany AG Germany 100.00
FCA France S.A.S. France 100.00
Fiat Chrysler Automobiles UK Ltd. United Kingdom 100.00
Fiat Chrysler Automobiles Spain S.A. Spain 100.00
Fidis S.p.A. Italy 100.00
Maserati
Maserati S.p.A. Italy 100.00
Maserati (China) Cars Trading Co. Ltd. People’s Republic of China 100.00
Maserati North America Inc. USA (Delaware) 100.00
Holding Companies and Other Companies
FCA North America Holdings LLC USA (Delaware) 100.00
Fiat Chrysler Finance S.p.A. Italy 100.00
Fiat Chrysler Finance Europe S.A. Luxembourg 100.00

2018 | ANNUAL REPORT 199
Magneti Marelli Held for Sale and Discontinued OperationsOn April 5, 2018, the FCA Board of Directors announced that it had authorized FCA management to develop and implement a plan to separate the Magneti Marelli business from the Group.
At September 30, 2018, the separation within the next twelve months became highly probable and Magneti Marelli operations met the criteria to be classified as a disposal group held for sale. It also met the criteria to be classified as a discontinued operation pursuant to IFRS 5 - Non-current Assets Held for Sale and Discontinued Operations.
On October, 22, 2018, FCA announced that it has entered into a definitive agreement to sell its Magneti Marelli business to CK Holdings, Ltd. Subject to regulatory approvals and other customary closing conditions, the transaction is expected to close in the second quarter of 2019.
The presentation of the Magneti Marelli business is as follows:
The operating results of Magneti Marelli have been excluded from the Group’s continuing operations and are presented net of taxes as a single line item within the Consolidated Income Statement for the years ended December 31, 2018, 2017 and 2016. In order to present the financial effects of a discontinued operation, revenues and expenses arising from intercompany transactions were eliminated except for those revenues and expenses that are considered to continue after the disposal of the discontinued operation. However, no profit or loss is recognized for intercompany transactions within the Consolidated Income Statement.
The assets and liabilities of Magneti Marelli have been classified as Assets held for sale and Liabilities held for sale within the Consolidated Statement of Financial Position at December 31, 2018, while the assets and liabilities of Magneti Marelli have not been reclassified for the comparative Consolidated Statement of Financial Position at December 31, 2017.
Cash flows arising from Magneti Marelli have been presented separately as discontinued cash flows from operating, investing and financing activities within the Consolidated Statements of Cash Flows for the years ended December 31, 2018, 2017 and 2016. These cash flows represent those arising from transactions with third parties.
In accordance with the IFRS 5, depreciation and amortization on the assets of Magneti Marelli ceased as at September 30, 2018. The impact of ceasing depreciation of the property, plant and equipment and amortization of the intangible assets of Magneti Marelli was €96 million, net of tax of €20 million.
The following table represents the assets and liabilities of the Magneti Marelli business which were classified as held for sale at December 31, 2018:
At December 31, 2018(1)
(€ million)
Assets classified as held for sale Total Current Non-current
Intangible assets € 717 € — € 717
Property, plant and equipment 1,793 — 1,793
Deferred tax assets 127 — 127
Inventories 766 766 —
Trade and other receivables 545 492 53
Cash and cash equivalents 719 719 —
Other assets 129 27 102
Total Assets held for sale(2) € 4,796
Liabilities classified as held for sale
Debt € 177 € 64 € 113
Employee benefits liabilities 300 55 245
Provisions 210 100 110
Deferred tax liabilities 99 — 99
Trade and other payables 1,788 1,788 —
Other liabilities 357 305 52
Total Liabilities held for sale € 2,931(1) Amounts presented are not representative of the financial position of Magneti Marelli on a stand-alone basis; amounts are net of transactions
between Magneti Marelli and other companies of the Group.(2) Assets held for sale as presented on the face of the Consolidated Statement of Financial Position at December 31, 2018, includes €5 million
not related to the Magneti Marelli business.

200 2018 | ANNUAL REPORT
Consolidated Financial Statements
Notes to the Consolidated Financial Statements
The following table summarizes the operating results of Magneti Marelli that were excluded from the Consolidated Income Statement for the years ended December 31, 2018, 2017 and 2016:
Years ended December 31(1)
2018 2017 2016(€ million)
Net revenues € 4,998 € 5,204 € 5,220
Expenses 4,493 4,798 4,906
Net financial expenses 85 124 158
Profit before taxes from discontinued operations 420 282 156
Tax expense 118 63 55
Profit from discontinued operations, net of tax € 302 € 219 € 101(1) Amounts presented are not representative of the income statement of Magneti Marelli on a stand-alone basis; amounts are net of transactions
between Magneti Marelli and other companies of the Group.
Itedi S.p.A Held for SaleOn August 1, 2016, FCA announced the signing of a framework agreement setting out the terms of the proposed merger between FCA’s consolidated media and publishing subsidiary, Italiana Editrice S.p.A (“Itedi”), in which FCA had a 77 percent ownership interest, and the Italian media group, GEDI Gruppo Editoriale S.p.A. (“GEDI”), previously known as Gruppo Editoriale L’Espresso S.p.A. All the necessary steps for the merger, including regulatory approvals from Italian state authorities, were completed and on June 27, 2017, FCA and Itedi’s non-controlling shareholder, Ital Press Holding S.p.A. (“Ital Press”), transferred 100 percent of the shares of Itedi to GEDI in exchange for newly issued GEDI shares, resulting in CIR S.p.A., the controlling shareholder of GEDI, holding a 43.4 percent ownership interest in GEDI, FCA holding 14.63 percent and Ital Press holding 4.37 percent.
Following the completion of the merger on June 27, 2017, FCA distributed its entire interest in GEDI to holders of FCA common shares on July 2, 2017 in the ratio of 0.0484 GEDI ordinary shares for each FCA common share. As a result, the Group recorded a gain of €49 million within Gains on disposal in the Consolidated Income Statement for the year ended December 31, 2017.
Deconsolidation of FCA VenezuelaThroughout 2017, macroeconomic conditions in Venezuela continued to deteriorate. In the second quarter of 2017, asset impairment charges of €21 million relating to certain real estate assets in Venezuela were recognized, recorded within Selling, general and other costs. In December 2017, due to the restrictive monetary policy in Venezuela coupled with the inability to pay dividends and U.S. Dollar obligations, as well as the deteriorating economic conditions, which constrained the ability to maintain normal production in Venezuela, we concluded we were no longer able to exert control over our Venezuelan operations in order to affect our returns. As such, in accordance with IFRS 10 - Consolidated Financial Statements, as of December 31, 2017, we deconsolidated our subsidiary FCA Venezuela LLC (“FCA Venezuela”), resulting in a pre-tax, non-cash charge of €42 million recorded within Selling, general and other costs in the Consolidated Income Statement for the year ended December 31, 2017. Upon deconsolidation, FCA’s investment in FCA Venezuela was recognized at fair value, which was nil at December 31, 2017 and has been accounted for at cost in subsequent periods.
In 2016, the “floating” Sistema de Divisa Complementaria, or “DICOM” exchange rate was used to complete the majority of FCA Venezuela’s transactions to exchange VEF for U.S. Dollars. At December 31, 2016, the DICOM exchange rate was 674 VEF per U.S. Dollar and total remeasurement charges, including the devaluation and the write-down of SICAD receivables, of €19 million were recorded within Cost of revenues in the Consolidated Income Statement for the year ended December 31, 2016.

2018 | ANNUAL REPORT 201
The following significant transactions with non-controlling interests occurred:
2018 There were no significant transactions with non-controlling interests.
2017 Disposal of the 16.0 percent of the Group’s interest in FMM Pernambuco to the minority interest in January 2017,
and subsequent loss of control during the third quarter of 2017, resulting in a gain on disposal of €19 million.
2016 There were no significant transactions with non-controlling interests.

202 2018 | ANNUAL REPORT
Consolidated Financial Statements
Notes to the Consolidated Financial Statements
4. NET REVENUESNet revenues were as follows:
Years ended December 31,
2018 2017 2016(€ million)
Revenues from:
Sales of goods € 104,990 € 102,029 € 102,279
Services provided 3,871 2,182 2,212
Contract revenues 958 935 746
Lease installments from assets sold with a buy-back commitment 394 421 405
Interest income of financial services activities 199 163 156
Total Net revenues € 110,412 € 105,730 € 105,798
Net revenues by geographical area were as follows:Years ended December 31,
2018 2017 2016(€ million)
Net revenues in:
North America € 73,405 € 67,500 € 70,199
Italy 8,815 8,407 8,137
Brazil 6,452 5,982 4,584
France 3,204 3,121 2,811
Germany 2,755 2,804 2,825
China 1,974 3,562 3,942
Spain 1,397 1,306 1,173
Argentina 1,384 1,791 1,380
United Kingdom 1,136 1,267 1,513
Turkey 896 1,244 1,488
Japan 718 735 624
Australia 418 496 472
Other countries 7,858 7,515 6,650
Total Net revenues € 110,412 € 105,730 € 105,798
Net revenues attributed by segment for the year ended December 31, 2018 were as follows:
Mass-Market Vehicles
MaseratiOther
activities TotalNAFTA LATAM APAC EMEA(€ million)
Revenues from:
Sale of goods € 69,908 € 7,756 € 2,560 € 21,516 € 2,606 € 644 € 104,990
Services provided 2,287 270 21 945 39 309 3,871
Construction contract revenues — — — — — 958 958
Revenues from goods and services 72,195 8,026 2,581 22,461 2,645 1,911 109,819Lease installments from assets sold with a buy-back commitment 158 — — 235 — 1 394Interest income from financial services activities — 116 65 18 — — 199
Total Net revenues € 72,353 € 8,142 € 2,646 € 22,714 € 2,645 € 1,912 € 110,412
The Group recognized a net decrease in Net revenues of €14 million during the year ended December 31, 2018 from performance obligations satisfied in the prior year. This was primarily due to changes in the estimated cost of sales incentive programs occurring after the Group had transferred control of vehicles to the dealers.

2018 | ANNUAL REPORT 203
5. RESEARCH AND DEVELOPMENT COSTSResearch and development costs were as follows:
Years ended December 31,
2018 2017 2016(€ million)
Research and development expenditures expensed € 1,448 € 1,506 € 1,467
Amortization of capitalized development expenditures 1,456 1,294 1,357
Impairment and write-off of capitalized development expenditures 147 103 106
Total Research and development costs € 3,051 € 2,903 € 2,930
The impairment and write-off of capitalized development expenditures during the year ended December 31, 2018, primarily in EMEA, was due to changes in product plans in connection with the 2018-2022 business plan.
The impairment and write-off of capitalized development expenditures during the year ended December 31, 2017 mainly related to global product portfolio changes in EMEA and changes in the LATAM product portfolio.
The impairment and write-off of capitalized development expenditures during the year ended December 31, 2016 mainly related to the Group’s capacity realignment to SUV production in China, which resulted in an impairment charge of €90 million for the locally produced Fiat Viaggio and Ottimo vehicles.
Refer to Note 10, Other intangible assets, for information on capitalized development expenditures.
6. NET FINANCIAL EXPENSESThe following table summarizes the Group’s financial income and expenses, included within Net financial expenses:
Years ended December 31,
2018 2017 2016(€ million)
Interest income and other financial income € 249 € 220 € 279
Financial expenses:
Interest expense and other financial expenses: 929 1,084 1,452
Interest expense on notes 422 568 749
Interest expense on borrowings from bank 259 350 450
Other interest cost and financial expenses 248 166 253
Write-down of financial assets 6 21 76
Losses on disposal of securities 6 5 6
Net interest expense on employee benefits provisions 276 304 341
Total Financial expenses 1,217 1,414 1,875Net expenses from derivative financial instruments and exchange rate differences 88 151 262Total Financial expenses and Net expenses from derivative financial instruments and exchange rate differences 1,305 1,565 2,137
Net Financial expenses € 1,056 € 1,345 € 1,858

204 2018 | ANNUAL REPORT
Consolidated Financial Statements
Notes to the Consolidated Financial Statements
7. TAX EXPENSEThe following table summarizes Tax expense:
Years ended December 31,
2018 2017 2016(€ million)
Current tax expense € 592 € 832 € 797
Deferred tax expense 520 1,776 433
Tax expense/(benefit) relating to prior periods (334) (20) 7
Total Tax expense € 778 € 2,588 € 1,237
The applicable tax rate used to determine theoretical income taxes was the statutory rate in the United Kingdom (“UK”), the tax jurisdiction in which FCA NV is resident. The reconciliation between the theoretical income taxes calculated on the basis of the theoretical tax rate of 19.0 percent in 2018 (19.25 percent in 2017 and 20 percent in 2016) and income taxes recognized was as follows:
Years ended December 31,
2018 2017 2016(€ million)
Theoretical income taxes € 781 € 1,126 € 590
Tax effect on:
Recognition and utilization of previously unrecognized deferred tax assets — (161) (42)
Permanent differences (416) (397) (217)
Tax credits (135) (23) (340)
Deferred tax assets not recognized and write-downs 633 1,053 520Differences between foreign tax rates and the theoretical applicable tax rate and tax holidays 207 970 633
Taxes relating to prior years (334) (20) 7
Tax rate changes — (22) —
Withholding tax 41 78 54
Other differences (15) (8) (9)
Total Tax expense, excluding IRAP 762 2,596 1,196
Effective tax rate 18.5% 44.2% 40.5%
IRAP (current and deferred) 16 (8) 41
Total Tax expense € 778 € 2,588 € 1,237
As the IRAP taxable basis differs from Profit before taxes, it is excluded from the effective tax rates above.
The decrease in the effective tax rate to 19 percent in 2018 from 44 percent in 2017 was mainly due to: (i) tax expense of €734 million recorded in 2017 as a result of the decrease in recognized deferred tax assets in Brazil; (ii) net tax benefits of €673 million recognized in 2018 for impacts of the Tax Act; and (iii) net tax benefits of €334 million recognized for prior years’ tax positions finalized in 2018; partially offset by (iv) tax impacts from the recognition of a provision for costs related to final settlements reached on civil, environmental and consumer claims related to U.S. diesel emissions matters.
The net tax benefits of €334 million for prior years’ tax positions finalized in 2018 is composed of: (i) tax benefit of €447 million for U.S. provision to return adjustments (including a reduction to the estimated 2017 U.S. one-time deemed repatriation tax expense of €70 million and tax benefit of €94 million from an accelerated discretionary pension contribution, refer to Note 19, Employee benefits liabilities for additional detail); partially offset by (ii) net tax expense of €113 million primarily for the impact of uncertain tax positions and other prior years’ tax positions.

2018 | ANNUAL REPORT 205
The Group recognizes the amount of Deferred tax assets less the Deferred tax liabilities of the individual companies within Deferred tax assets, where these may be offset. Amounts recognized were as follows:
At December 31
2018 2017(€ million)
Deferred tax assets € 1,814 € 2,004
Deferred tax liabilities (937) (388)
Total Net deferred tax assets € 877 € 1,616
The decrease in Net deferred tax assets at December 31, 2018 from December 31, 2017 was mainly due to: (i) a €481 million decrease in NAFTA related to provisions, acceleration of tax depreciation and amortization on capital expenditures and utilization of U.S. tax credit carryforwards; (ii) a €142 million decrease in Net deferred tax assets recognized in Equity, primarily related to employee benefits and foreign currency translation; (iii) a €28 million decrease in Net deferred tax assets for balances transferred to Held for sale; and (iv) €39 million for reductions to other net deferred tax assets.
The significant components of Deferred tax assets and liabilities and their changes during the years ended December 31, 2018 and 2017 were as follows:
At January 1, 2018
Recognized in Consolidated
Income Statement
Recognized in Equity
Transferred to Assets/(Liabilities)
Held for Sale
Translation differences
and other changes
At December 31, 2018
(€ million)
Deferred tax assets arising on:
Provisions € 3,848 € 240 € — € (55) € 94 € 4,127
Provision for employee benefits 1,828 (280) (77) (31) 47 1,487
Intangible assets 192 (24) — (2) — 166
Impairment of financial assets 169 (1) — (13) — 155
Inventories 252 22 — (24) (4) 246
Allowances for doubtful accounts 122 (6) — (7) (13) 96
Other 387 48 4 (77) 323 685
Total Deferred tax assets € 6,798 € (1) € (73) € (209) € 447 € 6,962
Deferred tax liabilities arising on:
Accelerated depreciation € (1,891) € (386) € — € 29 € (48) € (2,296)
Capitalized development assets (2,116) (103) — 81 (302) (2,440)Other Intangible assets and Intangible assets with indefinite useful lives (849) (20) — 2 (45) (912)
Provision for employee benefits (50) (2) (1) 3 (41) (91)
Other (314) (103) 5 86 (98) (424)
Total Deferred tax liabilities € (5,220) € (614) € 4 € 201 € (534) € (6,163)Deferred tax asset arising on tax loss carry-forwards € 4,718 € 708 € — € (328) € (135) € 4,963
Unrecognized deferred tax assets (4,680) (662) (12) 308 161 (4,885)
Total Net deferred tax assets € 1,616 € (569) € (81) € (28) € (61) € 877

206 2018 | ANNUAL REPORT
Consolidated Financial Statements
Notes to the Consolidated Financial Statements
At January 1, 2017
Recognized in Consolidated
Income Statement
Recognized in Equity
Translation differences and
other changes
At December 31, 2017
(€ million)
Deferred tax assets arising on:
Provisions € 6,149 € (1,742) € — € (559) € 3,848
Provision for employee benefits 2,851 (364) (16) (643) 1,828
Intangible assets 211 (19) — — 192
Impairment of financial assets 195 (25) — (1) 169
Inventories 251 3 — (2) 252
Allowances for doubtful accounts 117 19 — (14) 122
Other 385 (13) (14) 29 387
Total Deferred tax assets € 10,159 € (2,141) € (30) € (1,190) € 6,798
Deferred tax liabilities arising on:
Accelerated depreciation € (2,770) € 430 € — € 449 € (1,891)Capitalized development expenditures (2,742) 399 — 227 (2,116)Other Intangible assets and Intangible assets with indefinite useful lives (1,493) 238 — 406 (849)
Provision for employee benefits (14) (30) — (6) (50)
Other (331) 4 (10) 23 (314)
Total Deferred tax liabilities € (7,350) € 1,041 € (10) € 1,099 € (5,220)Deferred tax asset arising on tax loss carry-forwards € 4,444 € 522 € — € (248) € 4,718
Unrecognized deferred tax assets (3,748) (1,195) 9 254 (4,680)
Total Net deferred tax assets € 3,505 € (1,773) € (31) € (85) € 1,616
As of December 31, 2018, the Group had total Deferred tax assets on deductible temporary differences of €6,962 million (€6,798 million at December 31, 2017), of which €898 million was not recognized (€940 million at December 31, 2017). As of December 31, 2018, the Group also had Deferred tax assets on tax loss carry-forwards of €4,963 million (€4,718 million at December 31, 2017), of which €3,987 million was not recognized (€3,740 million at December 31, 2017).
As of December 31, 2018, the Group had net recognized and unrecognized deferred tax assets of €3,370 million (€3,256 million at December 31, 2017) in Italy primarily attributable to Italian tax loss carry-forwards that can be carried forward indefinitely. A deferred tax asset is recognized for Italian tax loss carry-forwards to the extent the realization of the related tax benefit is supported through achievement of the Group’s 2018-2022 business plan. The Group continues to recognize Italian Net deferred tax assets of €884 million (€898 million at December 31, 2017) as the Group considers it probable that we will have sufficient taxable income in the future that will allow realization of these net deferred tax assets. The utilization of Italian tax loss carry-forwards for which currently no deferred tax asset is recognized is subject to future sustained profitability, as well as, the achievement of taxable income in periods which are beyond the Group’s 2018-2022 business plan and therefore this utilization is uncertain. As a result, €2,486 million of Net deferred tax assets in Italy were not recognized as of December 31, 2018 (€2,358 million at December 31, 2017).
As of December 31, 2018, the Group had net recognized and unrecognized deferred tax assets of €1,532 million in Brazil (€1,287 million at December 31, 2017) primarily attributable to Brazilian tax loss carry-forwards which can be carried forward indefinitely. A deferred tax asset is recognized for Brazilian tax loss carry-forwards to the extent the realization of the related tax benefit is supported through achievement of the Group’s 2018-2022 business plan. The Group continues to recognize Brazilian Net deferred tax assets of €133 million (€148 million at December 31, 2017) as the Group considers it probable that we will have sufficient taxable income in the future that will allow realization of these net deferred tax assets. The utilization of Brazilian tax loss carry-forwards for which currently no deferred tax asset is recognized is subject to future sustained profitability, as well as, the achievement of taxable income in periods which are beyond the Group’s 2018-2022 business plan and therefore this utilization is uncertain. As a result, €1,399 million of Net deferred tax assets in Brazil, which include Brazil tax losses, were not recognized as of December 31, 2018 (€1,139 million at December 31, 2017).

2018 | ANNUAL REPORT 207
The realization of these deferred tax assets is sensitive to the assumptions and judgments used in the determination of the taxable income in the future, as well as, our ability to effect tax planning strategies, as necessary. Certain jurisdictions within EMEA in which the Group operates may begin to generate profits or taxable income in the future. While we have not yet recognized deferred tax assets in these jurisdictions, it is possible our assessment of realizability could change, resulting in the recognition of deferred tax assets in our Balance Sheet and the related income tax benefit in our Income Statement. Refer to Note 2, Use of estimates - Recoverability of deferred tax assets for additional detail.
Deferred tax liabilities on the undistributed earnings of subsidiaries have not been recognized, except in cases where it is probable the distribution will occur in the foreseeable future.
Total gross deductible and taxable temporary differences and accumulated tax losses at December 31, 2018, together with the amounts for which deferred tax assets have not been recognized, analyzed by year of expiration, were as follows:
Year of expiration
At December 31, 2018 2019 2020 2021 2022
Beyond 2022
Unlimited/ Indeterminable
(€ million)
Temporary differences and tax losses relating to corporate taxation:
Deductible temporary differences € 28,300 € 3,793 € 3,143 € 3,084 € 3,478 € 14,689 € 113Taxable temporary differences (25,749) (2,484) (2,451) (2,450) (2,499) (12,730) (3,135)
Tax losses 18,978 152 151 111 292 1,868 16,404
Amounts for which deferred tax assets were not recognized (18,295) (132) (67) (130) (248) (3,201) (14,517)
Temporary differences and tax losses relating to corporate taxation € 3,234 € 1,329 € 776 € 615 € 1,023 € 626 € (1,135)
Temporary differences and tax losses relating to local taxation (i.e. IRAP in Italy):
Deductible temporary differences € 9,761 € 1,241 € 827 € 722 € 1,176 € 5,758 € 37Taxable temporary differences (8,123) (657) (650) (649) (700) (5,363) (104)
Tax losses 4,211 8 1 65 231 250 3,656
Amounts for which deferred tax assets were not recognized (5,054) (42) (15) (77) (270) (1,335) (3,315)
Temporary differences and tax losses relating to local taxation € 795 € 550 € 163 € 61 € 437 € (690) € 274
8. OTHER INFORMATION BY NATUREPersonnel costs for the Group continuing operations for the years ended December 31, 2018, 2017 and 2016 amounted to €11.7 billion, €11.7 billion and €11.8 billion, respectively, and included costs that were capitalized mainly in connection with product development activities.
For the years ended December 31, 2018, 2017 and 2016, the Group continuing operations had an average number of employees of 203,122, 197,040 and 198,102, respectively.

208 2018 | ANNUAL REPORT
Consolidated Financial Statements
Notes to the Consolidated Financial Statements
9. GOODWILL AND INTANGIBLE ASSETS WITH INDEFINITE USEFUL LIVESGoodwill and intangible assets with indefinite useful lives at December 31, 2018 and 2017 are summarized below:
At January 1, 2018
Transfers to Assets held
for sale
Translation differences and Other
At December 31, 2018
(€ million)
Gross amount € 10,850 € (96) € 500 € 11,254
Accumulated impairment losses (454) 33 1 (420)
Goodwill 10,396 (63) 501 10,834
Brands 2,994 — 142 3,136
Total Goodwill and intangible assets with indefinite useful lives € 13,390 € (63) € 643 € 13,970
At January 1, 2017
Translation differences
and otherAt December
31, 2017(€ million)
Gross amount € 12,299 € (1,449) € 10,850
Accumulated impairment losses (482) 28 (454)
Goodwill 11,817 (1,421) 10,396
Brands 3,405 (411) 2,994
Total Goodwill and intangible assets with indefinite useful lives € 15,222 € (1,832) € 13,390
Translation differences in 2018 and 2017 primarily related to foreign currency translation of the U.S. Dollar to the Euro.
BrandsBrands, composed of the Chrysler, Jeep, Dodge, Ram and Mopar brands, resulted from the acquisition of FCA US and are allocated to the NAFTA segment. These rights are protected legally through registration with government agencies and through their continuous use in commerce. As these rights have no legal, contractual, competitive or economic term that limits their useful lives, they are classified as intangible assets with indefinite useful lives and are therefore not amortized but are instead tested annually for impairment.
For the purpose of impairment testing, the carrying value of Brands is tested jointly with the goodwill allocated to the NAFTA segment.
GoodwillAt December 31, 2018, Goodwill included €10,801 million from the acquisition of FCA US (€10,311 million at December 31, 2017). At December 31, 2018, €63 million of goodwill was classified within Assets held for sale as a result of Magneti Marelli meeting the held for sale criteria (see Note 3, Scope of consolidation).
There were no impairment charges recognized in respect of Goodwill and intangible assets with indefinite lives during the years ended December 31, 2018, 2017 and 2016. Refer to Note 2, Basis of preparation - Use of estimates for discussion of the assumptions and judgments relating to goodwill impairment testing.
The following table summarizes the allocation of Goodwill between FCA’s reportable segments:At December 31
2018 2017(€ million)
NAFTA € 8,855 € 8,453
APAC 1,152 1,099
LATAM 552 529
EMEA 264 253
Other activities 11 62
Total Goodwill € 10,834 € 10,396

2018 | ANNUAL REPORT 209
10. OTHER INTANGIBLE ASSETS
Capitalized development expenditures
Patents, concessions, licenses and
credits
Other intangible
assets Total(€ million)
Gross carrying amount at January 1, 2017 € 18,739 € 3,552 € 801 € 23,092
Additions 2,586 356 65 3,007
Divestitures (329) (16) (1) (346)
Translation differences and other changes (1,097) (309) (61) (1,467)
At December 31, 2017 19,899 3,583 804 24,286
Additions 2,235 639 93 2,967
Divestitures (568) (224) (89) (881)
Transfer to Assets held for sale (1,553) (132) (131) (1,816)
Translation differences and other changes 215 133 (41) 307
At December 31, 2018 20,228 3,999 636 24,863Accumulated amortization and impairment losses at January 1, 2017 9,380 1,808 482 11,670Amortization 1,424 371 61 1,856
Impairment losses and asset write-offs 110 — — 110
Divestitures (324) (10) — (334)
Translation differences and other changes (388) (140) (30) (558)
At December 31, 2017 10,202 2,029 513 12,744
Amortization 1,543 379 50 1,972
Impairment losses and asset write-offs 153 — — 153
Divestitures (553) (30) (89) (672)
Transfer to Assets held for sale (973) (98) (91) (1,162)
Translation differences and other changes 31 82 (34) 79
At December 31, 2018 10,403 2,362 349 13,114
Carrying amount at December 31, 2017 € 9,697 € 1,554 € 291 € 11,542
Carrying amount at December 31, 2018 € 9,825 € 1,637 € 287 € 11,749
Capitalized development expenditures include both internal and external costs that are directly attributable to the internal product development process, primarily consisting of material costs and personnel related expenses relating to engineering, design and development focused on content enhancement of existing vehicles, new models and powertrain programs.
In 2018, €153 million of impairment losses and asset write-offs were recognized as described in Note 5, Research and development costs. In 2017, of the total €110 million impairment losses and asset write-offs were recognized as described in Note 5, Research and development costs. Refer to Note 2, Use of estimates - Recoverability of non-current assets with definite useful lives for additional detail regarding the assumptions and judgments used when testing these assets for impairment.
Translation differences primarily related to foreign currency translation of the U.S. Dollar to the Euro.
Amortization of capitalized development expenditures is recognized within Research and development costs within the Consolidated Income Statement, as described in Note 5, Research and development costs. Amortization of Patents, concessions, licenses and credits and Other intangibles are recognized within Cost of revenues and Selling, general and other costs.
At December 31, 2018 and 2017, the Group had contractual commitments for the purchase of intangible assets amounting to €215 million and €601 million, respectively.

210 2018 | ANNUAL REPORT
Consolidated Financial Statements
Notes to the Consolidated Financial Statements
11. PROPERTY, PLANT AND EQUIPMENT
LandIndustrial buildings
Plant, machinery
and equipment
Other assets
Advances and tangible
assets in progress Total
(€ million)
Gross carrying amount at January 1, 2017 € 948 € 8,930 € 50,389 € 3,223 € 3,648 € 67,138
Additions 20 256 3,768 187 1,428 5,659
Divestitures (11) (17) (1,163) (88) (4) (1,283)
Change in the scope of consolidation (2) (104) (618) (21) (5) (750)
Translation differences (71) (639) (3,167) (301) (325) (4,503)
Other changes 1 68 1,844 3 (1,930) (14)
At December 31, 2017 885 8,494 51,053 3,003 2,812 66,247
Additions 7 183 1,976 84 811 3,061
Divestitures (11) (16) (872) (40) (5) (944)
Translation differences (10) (34) 123 57 47 183
Transfer to Assets held for sale (21) (401) (3,870) (294) (299) (4,885)
Other changes 1 113 1,607 56 (1,838) (61)
At December 31, 2018 851 8,339 50,017 2,866 1,528 63,601Accumulated depreciation and impairment losses at January 1, 2017 41 3,213 31,694 1,744 15 36,707Depreciation — 313 3,440 279 — 4,032
Divestitures (2) (11) (1,126) (78) — (1,217)
Impairment losses and asset write-offs 1 22 83 6 7 119
Change in the scope of consolidation (1) (76) (287) (18) — (382)
Translation differences (1) (163) (1,693) (152) (1) (2,010)
Other changes (1) — (29) 19 (5) (16)
At December 31, 2017 37 3,298 32,082 1,800 16 37,233
Depreciation — 283 3,303 262 — 3,848
Divestitures (5) — (851) (34) — (890)
Impairment losses and asset write-offs — — 140 — 4 144
Translation differences — (1) 89 30 — 118
Transfer to Assets held for sale — (204) (2,663) (223) (2) (3,092)
Other changes — (11) (68) 20 (8) (67)
At December 31, 2018 32 3,365 32,032 1,855 10 37,294
Carrying amount at December 31, 2017 € 848 € 5,196 € 18,971 € 1,203 € 2,796 € 29,014
Carrying amount at December 31, 2018 € 819 € 4,974 € 17,985 € 1,011 € 1,518 € 26,307
For the year ended December 31, 2018, the Group recognized a total of €144 million of impairment losses and asset write-offs, primarily in EMEA, resulting from changes in product plans in connection with the 2018-2022 business plan. Refer to Note 2, Use of estimates - Recoverability of non-current assets with definite useful lives for additional detail regarding the assumptions and judgments used when testing these assets for impairment.
For the year ended December 31, 2017, the Group recognized a total of €119 million of impairment losses and asset write-offs, of which €21 million related to certain of FCA Venezuela’s assets due to the continued deterioration of the economic conditions in Venezuela prior to deconsolidation. The remaining impairment losses related to changes in the global product portfolio in EMEA and product portfolio changes in LATAM.
These impairment charges were recognized within Selling, administrative and other expenses in the Consolidated Income Statement for the years ended December 31, 2018, and 2017.
In 2018, translation differences of €65 million primarily reflected the strengthening of the U.S Dollar against Euro partially offset by the weakness of the Brazilian Real. In 2017, translation differences of €2,493 million primarily reflected the weakening of the U.S Dollar, Mexican Peso and the Brazilian Real against the Euro.

2018 | ANNUAL REPORT 211
The net carrying amount of assets leased under finance lease agreements includes assets that are legally owned by suppliers but which are recognized in the Consolidated Financial Statements with the recognition of a corresponding financial lease payable in accordance with IFRIC 4 - Determining Whether an Arrangement Contains a Lease, as the arrangement conveys a right to control the use of a specific asset even if that asset is not explicitly referred to in the arrangement. The total net carrying amount of assets leased under finance lease agreements included in Property, plant and equipment was as follows:
At December 31
2018 2017(€ million)
Industrial buildings € 197 € 209
Plant, machinery and equipment 129 193
Total Property, plant and equipment under finance leases € 326 € 402
The carrying amounts of Property, plant and equipment of the Group reported as pledged as security for debt and other commitments, primarily relating to our operations in Brazil, are summarized as follows:
At December 31
2018 2017(€ million)
Land and industrial buildings pledged as security for debt € 892 € 1,031
Plant and machinery pledged as security for debt and other commitments 1,241 1,324
Other assets pledged as security for debt and other commitments 81 17
Total Property, plant and equipment pledged as security for debt and other commitments € 2,214 € 2,372
In addition to the amounts above, at December 31, 2017, FCA US’s Tranche B term loan maturing December 31, 2018 (the “Tranche B Term Loan due 2018”) was secured by a senior priority security interest against substantially all of FCA US’s assets and the assets of its U.S. subsidiary guarantors, subject to certain exceptions. This security interest expired on prepayment of the Tranche B Term Loan due 2018 in November 2018. For additional details, refer Note 21, Debt.
At December 31, 2018 and 2017, the Group had contractual commitments for the purchase of Property, plant and equipment amounting to €539 million and €540 million, respectively.

212 2018 | ANNUAL REPORT
Consolidated Financial Statements
Notes to the Consolidated Financial Statements
12. INVESTMENTS ACCOUNTED FOR USING THE EQUITY METHODThe following table summarizes Investments accounted for using the equity method:
At December 31
2018 2017(€ million)
Joint ventures € 1,866 € 1,866
Associates 96 94
Other 40 48
Total Investments accounted for using the equity method € 2,002 € 2,008
FCA’s ownership percentages and the carrying value of investments in joint ventures accounted for under the equity method were as follows:
Ownership percentage Investment balance
At December 31 At December 31
2018 2017 2018 2017
Joint ventures Ownership percentage (€ million)
FCA Bank S.p.A. 50.0% 50.0% € 1,360 € 1,178
Tofas-Turk Otomobil Fabrikasi A.S. 37.9% 37.9% 233 298
GAC Fiat Chrysler Automobiles Co. 50.0% 50.0% 216 287
Others 57 103
Total € 1,866 € 1,866
FCA Bank is a joint venture with Crédit Agricole Consumer Finance S.A. (“CACF”) which operates in Europe, primarily in Italy, France, Germany, UK and Spain. The Group has agreed with Credit Agricole to extend its term through December 31, 2022, which may be automatically renewed up to December 31, 2024 unless a termination notice is served in the period from January 1, 2019 to June 30, 2019. FCA Bank provides retail and dealer financing and long-term rental services in the automotive sector, directly or through its subsidiaries as a partner of the Group’s mass-market vehicle brands and for Maserati vehicles.
The financial statements of FCA Bank as at and for the year ended December 31, 2018 have not been authorized for issuance as of the date of issuance of the FCA Consolidated Financial Statements. As such, the most recent publicly available financial information is included in the tables below.
The most recently available information was used to estimate FCA’s share of FCA Bank net income and net equity. Any difference between this data and actual results will be adjusted in the 2019 FCA Consolidated Financial Statements when available.

2018 | ANNUAL REPORT 213
The following tables include summarized financial information relating to FCA Bank:
At June 30, 2018
At December 31, 2017
(€ million)
Financial assets € 25,496 € 23,434
Of which: Cash and cash equivalents — 1
Other assets 4,175 3,753
Financial liabilities 25,634 23,424
Other liabilities 1,346 1,250
Equity (100%) 2,691 2,512
Net assets attributable to owners of the parent 2,645 2,469
Group’s share of net assets 1,323 1,235
Elimination of unrealized profits and other adjustments 37 (57)
Carrying amount of interest in FCA Bank(1) € 1,360 € 1,178(1) Amounts as at December 31, 2018 and 2017 respectively.
Six months ended June 30 Years ended December 31
2018 2017 2016(€ million)
Interest and similar income € 471 € 855 € 764
Interest and similar expenses (144) (266) (263)
Income tax expense (80) (139) (105)
Profit from continuing operations 201 383 312
Net profit 201 383 312
Net profit attributable to owners of the parent (A) 199 378 309
Other comprehensive income/(loss) attributable to owners of the parent (B) (5) (8) (64)
Total Comprehensive income attributable to owners of the parent (A+B) € 194 € 370 € 245
Group’s share of net profit(1) € 195 € 189 € 154(1) Amounts for the years ended December 31, 2018, 2017 and 2016 respectively
Tofas-Turk Otomobil Fabrikasi A.S. (“Tofas”), is a joint venture with Koç Holding which is registered with the Turkish Capital Market Board and listed on the İstanbul Stock Exchange. At December 31, 2018, the fair value of the Group’s interest in Tofas was €531 million (€1,375 million at December 31, 2017).
GAC Fiat Chrysler Automobiles Co. (“GAC FCA JV”) is a joint venture with Guangzhou Automobile Group Co., Ltd., which locally produces Jeep vehicles for the Chinese market.

214 2018 | ANNUAL REPORT
Consolidated Financial Statements
Notes to the Consolidated Financial Statements
The Group’s proportionate share of the earnings of our joint ventures, associates and interests in unconsolidated subsidiaries accounted for using the equity method is included within Result from investments in the Consolidated Income Statement. The following table summarizes the share of profits of equity method investees included within Result from investments:
Years ended December 31,
2018 2017 2016(€ million)
Joint Ventures € 221 € 381 € 288
Associates 6 9 7
Other 13 10 13
Total Share of the profit of equity method investees € 240 € 400 € 308
Immaterial Joint Ventures and AssociatesThe aggregate amounts recognized for the Group’s share in all individually immaterial joint ventures and associates accounted for using the equity method were as follows:
Years ended December 31,
2018 2017 2016(€ million)
Joint ventures:
Profit from continuing operations € 27 € 192 € 134
Net profit 27 192 134
Other comprehensive income/(loss) (91) (105) (90)
Total Other comprehensive income € (64) € 87 € 44
Associates:
Income/(loss) from continuing operations € 6 € 9 € 7
Net income/(loss) 6 9 7
Other comprehensive income/(loss) (3) (3) (1)
Total Other comprehensive income/(loss) € 3 € 6 € 6

2018 | ANNUAL REPORT 215
13. OTHER FINANCIAL ASSETS Other financial assets consisted of the following:
At December 31
2018 2017
Current Non-current Total Current Non-current TotalNote (€ million)
Derivative financial assets 16 € 283 € 14 € 297 € 265 € 19 € 284Debt securities measured at fair value through other comprehensive income 23 — — — 4 — 4Debt securities measured at fair value through profit or loss 23 230 — 230 172 59 231Debt securities measured at amortized cost 61 2 63 — — —
Debt securities held-to-maturity — — — — 2 2
Equity instruments measured at cost — — — — 43 43Equity instruments measured at fair value through other comprehensive income 23 — 31 31 — 23 23Equity instruments mandatorily designated at fair value through profit and loss 23 41 2 43 — — —
Held-for-trading investments — — — 46 — 46
Financial receivables — 252 252 — 275 275
Collateral deposits(1) 23 — 61 61 — 61 61
Total Other financial assets € 615 € 362 € 977 € 487 € 482 € 969(1) Collateral deposits are held in connection with derivative transactions and debt obligations.
On March 21, 2017, the Group completed the sale of its investment of 15,948,275 common shares in CNH Industrial N.V. (“CNHI”), representing 1.17 percent of CNHI’s common shares, for an amount of €144 million which was previously reported within Equity instruments measured at fair value through other comprehensive income. The sale did not result in a material gain. The additional 15,948,275 special voting shares owned by the Group which had not been attributed any value, expired upon the sale of the CNHI common shares.
Refer to Note 2, Basis of preparation for information on the impact of the adoption of IFRS 9 on the balances disclosed above.

216 2018 | ANNUAL REPORT
Consolidated Financial Statements
Notes to the Consolidated Financial Statements
14. INVENTORIES
At December 31
2018 2017(€ million)
Finished goods and goods for resale € 6,776 € 8,261
Work-in-progress, raw materials and manufacturing supplies 3,783 4,476
Amount due from customers for contract work 135 185
Total Inventories € 10,694 € 12,922
The amount of inventory write-downs recognized within Cost of revenues during the years ended December 31, 2018, 2017 and 2016 was €669 million, €626 million and €607 million, respectively.
Additionally, during the year ended December 31, 2018, impairments of Inventory totaling €129 million were recognized in APAC in connection with the accelerated adoption of new emission standards in China and slower than expected sales.
The Construction contracts, net asset/(liability) relates to the design and production of industrial automation systems and related products and is summarized as follows:
At December 31
2018 2017(€ million)
Aggregate amount of costs incurred and recognized profits (less recognized losses) to date € 954 € 881
Less: Progress billings (912) (886)
Construction contracts, net asset/(liability) 42 (5)
Construction contract assets 135 185
Less: Construction contract liabilities (Note 22) (93) (190)
Construction contracts, net asset/(liability) € 42 € (5)
Changes in the Group’s construction contracts, net asset/(liability) for the year ended December 31, 2018, were as follows:
At January 1, 2018
Advances received
from customers
Amounts recognized
within revenue
Transfers to Assets/(Liabilities)
held for saleOther
Changes
At December
31, 2018(€ million)
Construction contracts, net asset/(liability) € (5) € (878) € 958 € — € (33) € 42
The entire amount of Construction contracts, net asset/(liability) is expected to be recognized as revenue in the following twelve months.

2018 | ANNUAL REPORT 217
15. TRADE, OTHER RECEIVABLES AND TAX RECEIVABLESThe following table summarizes Trade, other receivables and tax receivables by due date:
At December 31
2018 2017
Total due within
one year (current)
Due between one and
five years
Due beyond
five years
Total due after one year
(non-current) Total
Total due within
one year (current)
Due between one and
five years
Due beyond
five years
Total due after one year
(non-current) Total
(€ million)
Trade receivables € 2,048 € — € — € — € 2,048 € 2,460 € — € — € — € 2,460Receivables from financing activities 3,304 297 13 310 3,614 2,946 194 — 194 3,140
Other receivables 1,836 1,086 88 1,174 3,010 2,481 414 58 472 2,953Total Trade and other receivables € 7,188 € 1,383 € 101 € 1,484 € 8,672 € 7,887 € 608 € 58 € 666 € 8,553
Tax receivables € 419 € 53 € 18 € 71 € 490 € 215 € 62 € 21 € 83 € 298
Trade receivablesTrade receivables are shown net of an ECL allowance, which is calculated using the simplified approach. Changes in the allowance for trade receivables were as follows:
At January 1, 2018 Provision
Use and other
changes
Transferred to Assets
held for sale
At December
31, 2018(€ million)
ECL allowance - Trade receivables € 269 € 56 € (47) € (31) € 247
Trade receivables of an immaterial amount were written off during the year ended December 31, 2018, and are still subject to enforcement activities. As a result of the impairment methodology implemented under IFRS 9, there was an immaterial impact to the ECL allowance at December 31, 2018.
The following table provides information about the exposure to credit risk and ECLs for trade receivables:
At December 31, 2018Current and less
than 90 days past due
90 days or more past due Total
Gross amount 1,920 310 2,230
ECL allowance (65) (182) (247)
Carrying amount 1,855 128 1,983
In addition to the amounts above, a further €65 million of trade receivables were measured at FVPL. Refer to Note 23, Fair value measurement.

218 2018 | ANNUAL REPORT
Consolidated Financial Statements
Notes to the Consolidated Financial Statements
Receivables from financing activitiesReceivables from financing activities mainly relate to the business of financial services companies fully consolidated by the Group and are summarized as follows:
At December 31
2018 2017(€ million)
Dealer financing € 2,654 € 2,295
Retail financing 601 420
Finance leases 3 4
Other 356 421
Total Receivables from financing activities € 3,614 € 3,140
Receivables from financing activities are shown net of an ECL allowance. Changes in the allowance for receivables from financing activities were as follows:
At January 1, 2018 Provision
Use and other
changes
Transferred to Assets
held for sale
At December
31, 2018(€ million)
ECL allowance - Receivables from financing activities € 45 € 87 € (105) € — € 27
Receivables from financing activities of an immaterial amount were written off during the year ended December 31, 2018, and are still subject to enforcement activities. As a result of the impairment methodology implemented under IFRS 9, there was an immaterial impact to the ECL allowance at December 31, 2018.
The following table provides information about the exposure to credit risk and ECLs for receivables from financing activities:
At December 31, 2018
Stage 1 Stage 2 Stage 3 Total
Gross amount 2,465 168 35 2,668
ECL allowance (13) (2) (12) (27)
Carrying amount 2,452 166 23 2,641
In addition to the amounts above, a further €973 million of receivables from financing activities were measured at FVPL. Refer to Note 23, Fair value measurement.
Other receivablesAt December 31, 2018, Other receivables primarily consisted of tax receivables for VAT and other indirect taxes of €2,149 million (€2,153 million at December 31, 2017).

2018 | ANNUAL REPORT 219
Transfer of financial assetsAt December 31, 2018, the Group had receivables due after that date amounting to €8,523 million (€7,866 million at December 31, 2017) which had been transferred without recourse and which were derecognized in accordance with IFRS 9 – Financial Instruments. The transfers related to trade receivables and other receivables for €6,847 million (€6,752 million at December 31, 2017) and receivables from financing activities for €1,676 million (€1,114 million at December 31, 2017). These amounts included receivables of €5,517 million (€4,933 million at December 31, 2017), mainly due from the sales network, transferred to FCA Bank, our jointly controlled financial services company.
At December 31, 2018 and 2017, the carrying amount of transferred financial assets not derecognized and the related liabilities were as follows:
At December 31
2018 2017
Trade receivables
Receivables from
financing activities Total
Tradereceivables
Receivables from
financing activities Total
(€ million)
Carrying amount of assets transferred and not derecognized € 30 € 427 € 457 € 22 € 335 € 357Carrying amount of the related liabilities (Note 21) € 30 € 427 € 457 € 22 € 335 € 357
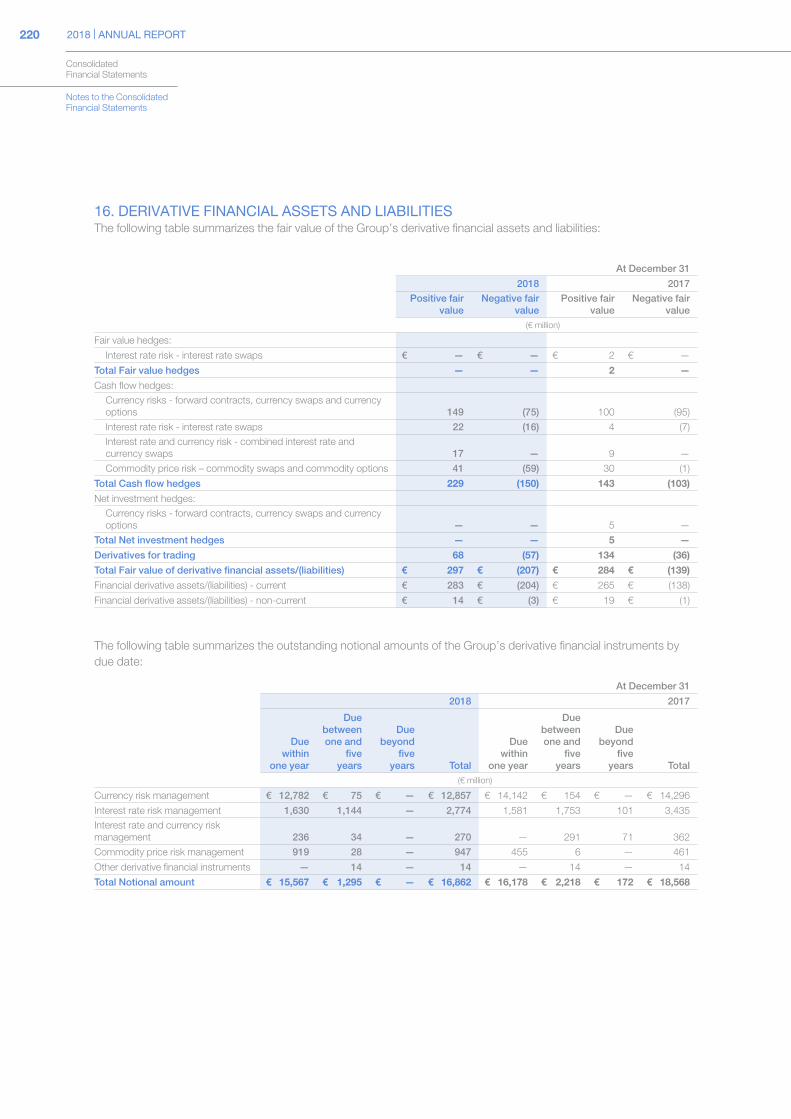
220 2018 | ANNUAL REPORT
Consolidated Financial Statements
Notes to the Consolidated Financial Statements
16. DERIVATIVE FINANCIAL ASSETS AND LIABILITIESThe following table summarizes the fair value of the Group’s derivative financial assets and liabilities:
At December 31
2018 2017
Positive fair value
Negative fair value
Positive fair value
Negative fair value
(€ million)
Fair value hedges:
Interest rate risk - interest rate swaps € — € — € 2 € —
Total Fair value hedges — — 2 —
Cash flow hedges:Currency risks - forward contracts, currency swaps and currency options 149 (75) 100 (95)
Interest rate risk - interest rate swaps 22 (16) 4 (7)Interest rate and currency risk - combined interest rate and currency swaps 17 — 9 —
Commodity price risk – commodity swaps and commodity options 41 (59) 30 (1)
Total Cash flow hedges 229 (150) 143 (103)
Net investment hedges:Currency risks - forward contracts, currency swaps and currency options — — 5 —
Total Net investment hedges — — 5 —
Derivatives for trading 68 (57) 134 (36)
Total Fair value of derivative financial assets/(liabilities) € 297 € (207) € 284 € (139)
Financial derivative assets/(liabilities) - current € 283 € (204) € 265 € (138)
Financial derivative assets/(liabilities) - non-current € 14 € (3) € 19 € (1)
The following table summarizes the outstanding notional amounts of the Group’s derivative financial instruments by due date:
At December 31
2018 2017
Due within
one year
Due between one and
five years
Due beyond
five years Total
Due within
one year
Due between one and
five years
Due beyond
five years Total
(€ million)
Currency risk management € 12,782 € 75 € — € 12,857 € 14,142 € 154 € — € 14,296
Interest rate risk management 1,630 1,144 — 2,774 1,581 1,753 101 3,435Interest rate and currency risk management 236 34 — 270 — 291 71 362
Commodity price risk management 919 28 — 947 455 6 — 461
Other derivative financial instruments — 14 — 14 — 14 — 14
Total Notional amount € 15,567 € 1,295 € — € 16,862 € 16,178 € 2,218 € 172 € 18,568

2018 | ANNUAL REPORT 221
Fair value hedgesThe gains and losses arising from the valuation of outstanding interest rate derivatives (for managing interest rate risk) and currency derivatives (for managing currency risk) are recognized in accordance with fair value hedge accounting and the gains and losses arising from the respective hedged items are summarized as follows:
Years ended December 31,
2018 2017 2016(€ million)
Currency risk
Net gains/(losses) on qualifying hedges € — € 104 € (13)
Fair value changes in hedged items — (104) 13
Interest rate risk
Net (losses) on qualifying hedges (2) (9) (26)
Fair value changes in hedged items 2 10 26
Net gains/(losses) € — € 1 € —
Cash flow hedgesAmounts recognized in the Consolidated Income Statement mainly relate to currency risk management and, to a lesser extent, hedges regarding commodity price risk management and cash flows that are exposed to interest rate risk.
The Group’s policy for managing currency risk normally requires hedging of projected future flows from trading activities which will occur within the following twelve months and from orders acquired (or contracts in progress), regardless of their due dates. The hedging effect arising from this is recorded in the Cash flow hedge reserve within Other comprehensive (loss)/income and will be subsequently recognized in the Consolidated Income Statement, primarily during the following year.
Derivatives relating to interest rate and currency risk management are treated as cash flow hedges and are entered into for the purpose of hedging notes issued in foreign currencies. The amount recorded in Other comprehensive income and within the Cash flow hedge reserve is recognized in the Consolidated Income Statement according to the timing of the cash flows of the underlying notes.
In 2017, the Group entered in interest rate swaps in order to hedge against the increase in interest rates in relation to future debt issuances. In 2018, the maturity dates for a portion of these interest rate swaps were extended. The swaps are designated as a cash flow hedge. For the year ended December 31, 2018, gains of €31 million (for the year ended December 31, 2017, losses of €3 million) relating to such derivatives were recognized in the Cash flow hedge reserve within Other comprehensive (loss)/income.

222 2018 | ANNUAL REPORT
Consolidated Financial Statements
Notes to the Consolidated Financial Statements
The Group reclassified gains/(losses) arising on Cash flow hedges, net of the tax effect, from Other comprehensive income and Inventories to the Consolidated Income Statement as follows:
Years ended December 31,
2018 2017 2016(€ million)
Currency risk
Increase in Net revenues € 100 € 8 € 243
(Increase)/Decrease in Cost of revenues (17) (96) (31)
Net financial income/(expenses) 2 (22) 34
Result from investments 24 28 26
Interest rate risk
Result from investments 1 (1) (1)
Net financial expenses — (3) (4)
Commodity price risk
(Increase)/Decrease in Cost of revenues 29 28 (39)
Ineffectiveness and discontinued hedges (5) 4 12
Tax expense/(benefit) (36) 27 (48)
Items relating to discontinued operations, net of tax 9 1 (21)
Total recognized in the Consolidated Income Statement € 107 € (26) € 171
Net investment hedgesIn order to manage the Group’s foreign currency risk related to its investments in foreign operations, the Group enters into net investment hedges, in particular foreign currency swaps and forward contracts.
For the year ended December 31, 2018, net gains of €17 million related to net investment hedges were recognized in Currency translation differences within Other comprehensive (loss)/income. At December 31, 2018, there were no outstanding net investment hedges.
For the year ended December 31, 2017, gains of €15 million related to net investment hedges were recognized in Currency translation differences within Other comprehensive (loss)/income. There was no ineffectiveness for the year ended December 31, 2017.
Derivatives for tradingAt December 31, 2018 and 2017, Derivatives for trading primarily consisted of derivative contracts entered into for hedging purposes which do not qualify for hedge accounting and one embedded derivative in a bond issuance in which the yield is determined as a function of trends in the inflation rate and related hedging derivative, which converts the exposure to a floating rate (the total value of the embedded derivative is offset by the value of the hedging derivative).
Information on the Group’s risk management strategy and additional information on the Group’s hedging activities is provided in Note 30, Qualitative and quantitative information on financial risks.
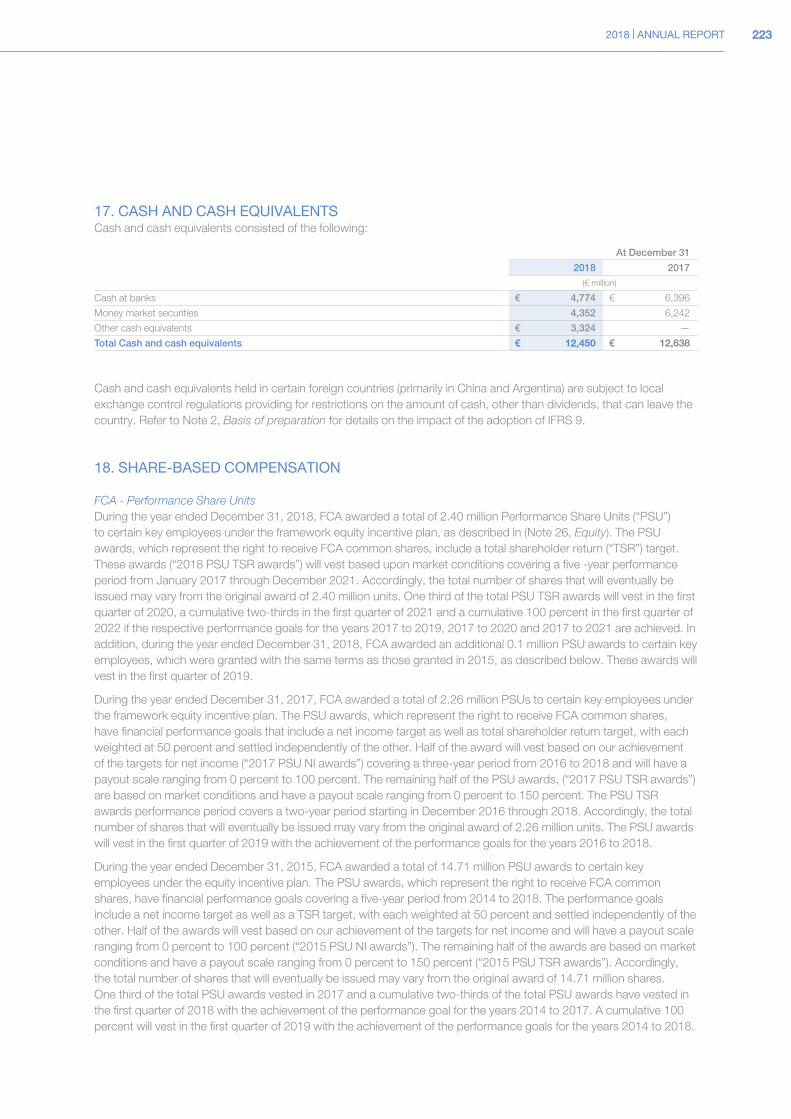
2018 | ANNUAL REPORT 223
17. CASH AND CASH EQUIVALENTSCash and cash equivalents consisted of the following:
At December 31
2018 2017(€ million)
Cash at banks € 4,774 € 6,396
Money market securities 4,352 6,242
Other cash equivalents € 3,324 —
Total Cash and cash equivalents € 12,450 € 12,638
Cash and cash equivalents held in certain foreign countries (primarily in China and Argentina) are subject to local exchange control regulations providing for restrictions on the amount of cash, other than dividends, that can leave the country. Refer to Note 2, Basis of preparation for details on the impact of the adoption of IFRS 9.
18. SHARE-BASED COMPENSATION
FCA - Performance Share UnitsDuring the year ended December 31, 2018, FCA awarded a total of 2.40 million Performance Share Units (“PSU”) to certain key employees under the framework equity incentive plan, as described in (Note 26, Equity). The PSU awards, which represent the right to receive FCA common shares, include a total shareholder return (“TSR”) target. These awards (“2018 PSU TSR awards”) will vest based upon market conditions covering a five -year performance period from January 2017 through December 2021. Accordingly, the total number of shares that will eventually be issued may vary from the original award of 2.40 million units. One third of the total PSU TSR awards will vest in the first quarter of 2020, a cumulative two-thirds in the first quarter of 2021 and a cumulative 100 percent in the first quarter of 2022 if the respective performance goals for the years 2017 to 2019, 2017 to 2020 and 2017 to 2021 are achieved. In addition, during the year ended December 31, 2018, FCA awarded an additional 0.1 million PSU awards to certain key employees, which were granted with the same terms as those granted in 2015, as described below. These awards will vest in the first quarter of 2019.
During the year ended December 31, 2017, FCA awarded a total of 2.26 million PSUs to certain key employees under the framework equity incentive plan. The PSU awards, which represent the right to receive FCA common shares, have financial performance goals that include a net income target as well as total shareholder return target, with each weighted at 50 percent and settled independently of the other. Half of the award will vest based on our achievement of the targets for net income (“2017 PSU NI awards”) covering a three-year period from 2016 to 2018 and will have a payout scale ranging from 0 percent to 100 percent. The remaining half of the PSU awards, (“2017 PSU TSR awards”) are based on market conditions and have a payout scale ranging from 0 percent to 150 percent. The PSU TSR awards performance period covers a two-year period starting in December 2016 through 2018. Accordingly, the total number of shares that will eventually be issued may vary from the original award of 2.26 million units. The PSU awards will vest in the first quarter of 2019 with the achievement of the performance goals for the years 2016 to 2018.
During the year ended December 31, 2015, FCA awarded a total of 14.71 million PSU awards to certain key employees under the equity incentive plan. The PSU awards, which represent the right to receive FCA common shares, have financial performance goals covering a five-year period from 2014 to 2018. The performance goals include a net income target as well as a TSR target, with each weighted at 50 percent and settled independently of the other. Half of the awards will vest based on our achievement of the targets for net income and will have a payout scale ranging from 0 percent to 100 percent (“2015 PSU NI awards”). The remaining half of the awards are based on market conditions and have a payout scale ranging from 0 percent to 150 percent (“2015 PSU TSR awards”). Accordingly, the total number of shares that will eventually be issued may vary from the original award of 14.71 million shares. One third of the total PSU awards vested in 2017 and a cumulative two-thirds of the total PSU awards have vested in the first quarter of 2018 with the achievement of the performance goal for the years 2014 to 2017. A cumulative 100 percent will vest in the first quarter of 2019 with the achievement of the performance goals for the years 2014 to 2018.

224 2018 | ANNUAL REPORT
Consolidated Financial Statements
Notes to the Consolidated Financial Statements
The vesting of the 2017 PSU NI awards and the 2015 PSU NI awards will be determined by comparing the Group’s net profit excluding unusual items to the net income targets derived from the Group’s business plan for the corresponding period. The performance period for the 2017 PSU NI awards commenced on January 1, 2016, and on January 1, 2014 for the 2015 PSU NI awards. As the performance period commenced substantially prior to the commencement of the service period, which coincides with the grant date, the Company determined that the net income target did not meet the definition of a performance condition under IFRS 2 - Share-based Payment, and therefore is required to be accounted for as a non-vesting condition. As such, the fair values of the PSU NI awards were calculated using a Monte Carlo simulation model.
Changes during 2018, 2017 and 2016 for the PSU NI awards under the framework equity incentive plan were as follows:
2018 2017 2016
PSU NI
Weighted average fair value at the
grant date (€) PSU NI
Weighted average fair value at the
grant date (€) PSU NI
Weighted average fair value at the
grant date (€)
Outstanding shares unvested at January 1 8,803,826 € 5.89 11,379,445 € 5.65 7,356,550 € 8.78
Anti-dilution adjustment 32,855 5.87 65,751 5.62 4,001,962 5.68
Granted 71,136 9.73 1,136,250 7.91 168,593 3.61
Vested (3,857,502) 5.58 (3,758,870) 5.65 — —
Canceled — — — — (147,660) 5.83
Forfeited (481,485) 6.27 (18,750) 7.91 — —
Outstanding shares unvested at December 31 4,568,830 € 6.14 8,803,826 € 5.89 11,379,445 € 5.65
The key assumptions utilized to calculate the grant-date fair values for the PSU NI awards are summarized below:
Key assumptions2017 PSU NI
Awards Range2015 PSU NI
Awards Range
Grant date stock price €9.74 - €10.39 €13.44 - €15.21
Expected volatility 40% 40%
Risk-free rate (0.8)% 0.7%
The expected volatility was based on the observed historical volatility for common shares of FCA. The risk-free rate was based on the yields of government and treasury bonds with similar terms to the vesting date of each PSU NI award.
Changes during 2018, 2017 and 2016 for the PSU TSR awards under the framework equity incentive plan were as follows:
2018 2017 2016
PSU TSR
Weighted average fair value at the
grant date (€) PSU TSR
Weighted average fair value at the
grant date (€) PSU TSR
Weighted average fair value at the
grant date (€)
Outstanding shares unvested at January 1 8,803,827 € 10.58 11,379,446 € 10.64 7,356,550 € 16.52
Anti-dilution adjustment 32,855 10.54 65,750 10.58 4,001,962 10.70
Granted 2,473,637 13.15 1,136,250 10.84 168,593 6.71
Vested (3,857,502) 10.51 (3,758,869) 10.63 — —
Canceled — — — — (147,659) 10.84
Forfeited (526,404) 11.50 (18,750) 10.84 — —
Outstanding shares unvested at December 31 6,926,413 € 11.42 8,803,827 € 10.58 11,379,446 € 10.64

2018 | ANNUAL REPORT 225
The weighted average fair value of the PSU TSR awards granted during the years ended December 31, 2018, 2017 and 2015 was calculated using a Monte Carlo simulation model. The key assumptions utilized to calculate the grant date fair values for the PSU TSR awards issued are summarized below:
Key assumptions2018 PSU TSR Awards Range
2017 PSU TSR Awards Range
2015 PSU TSR Awards Range
Grant date stock price € 18.79 €9.74 - €10.39 €13.44 - €15.21
Expected volatility 41% 44% 37% - 39%
Dividend yield —% —% —%
Risk-free rate (0.3)% (0.8)% 0.7% - 0.8%
The expected volatility was based on the observed historical volatility for common shares of FCA. The risk-free rate was based on the yields of government and treasury bonds with similar terms to the vesting date of each PSU TSR award. In addition, since the volatility of each member of the defined peer group are not wholly independent of one another, a correlation coefficient was developed based on historical share price changes for FCA and the defined peer group over a three-year period leading up to the grant date of the awards.
FCA - Restricted Share UnitsDuring the year ended December 31, 2018, FCA awarded 0.58 million Restricted Share Units (“RSUs”) to certain key employees of the Company, which represent the right to receive FCA common shares. These shares will vest in three equal tranches in 2019, 2020 and 2021. The fair values of the awards were measured using the FCA stock price on the grant date. In addition, during the year ended December 31, 2018, FCA awarded 0.05 million RSUs to certain key employees of the Company, which represent the right to receive FCA common shares. These additional awards will vest in the first quarter of 2019.
During the year ended December 31, 2017, FCA awarded 2.29 million RSUs to certain key employees of the Company which represent the right to receive FCA common shares. Half of the awards vested in the first quarter of 2018 with the remaining tranche to vest in the first quarter of 2019. The fair values of the awards were measured using the FCA stock price on the grant date.
During the year ended December 31, 2016, FCA awarded 0.09 million RSUs to certain key employees of the Company, which represent the right to receive FCA common shares. Half of the awards vested in the first quarter of 2018 with the remaining tranche to vest in the first quarter of 2019. The fair values of the awards were measured using the FCA stock price on the grant date.
During the year ended December 31, 2015, FCA awarded 5.20 million RSUs to certain key employees of the Company, which represent the right to receive FCA common shares. One third of the awards vested in the first quarter of 2017, and a cumulative two-thirds of the awards vested in the first quarter 2018 with the remaining tranche to vest in the first quarter of 2019. The fair values of the awards were measured using the FCA stock price on the grant date.
Changes during 2018, 2017 and 2016 for the RSU awards under the framework equity incentive plan were as follows:
2018 2017 2016
RSUs
Weighted average fair value at the
grant date (€) RSUs
Weighted average fair value at the
grant date (€) RSUs
Weighted average fair value at the
grant date (€)
Outstanding shares unvested at January 1 7,600,313 € 9.17 7,969,623 € 8.69 5,196,550 € 13.49
Anti-dilution adjustment 28,299 9.12 46,189 8.64 2,826,922 8.74
Granted 627,081 18.54 2,293,940 10.43 94,222 5.73
Vested (3,690,050) 9.09 (2,671,939) 8.64 — —
Canceled — — — — (148,071) 9.25
Forfeited (274,657) 10.28 (37,500) 10.39 — —
Outstanding shares unvested at December 31 4,290,986 € 10.47 7,600,313 € 9.17 7,969,623 € 8.69
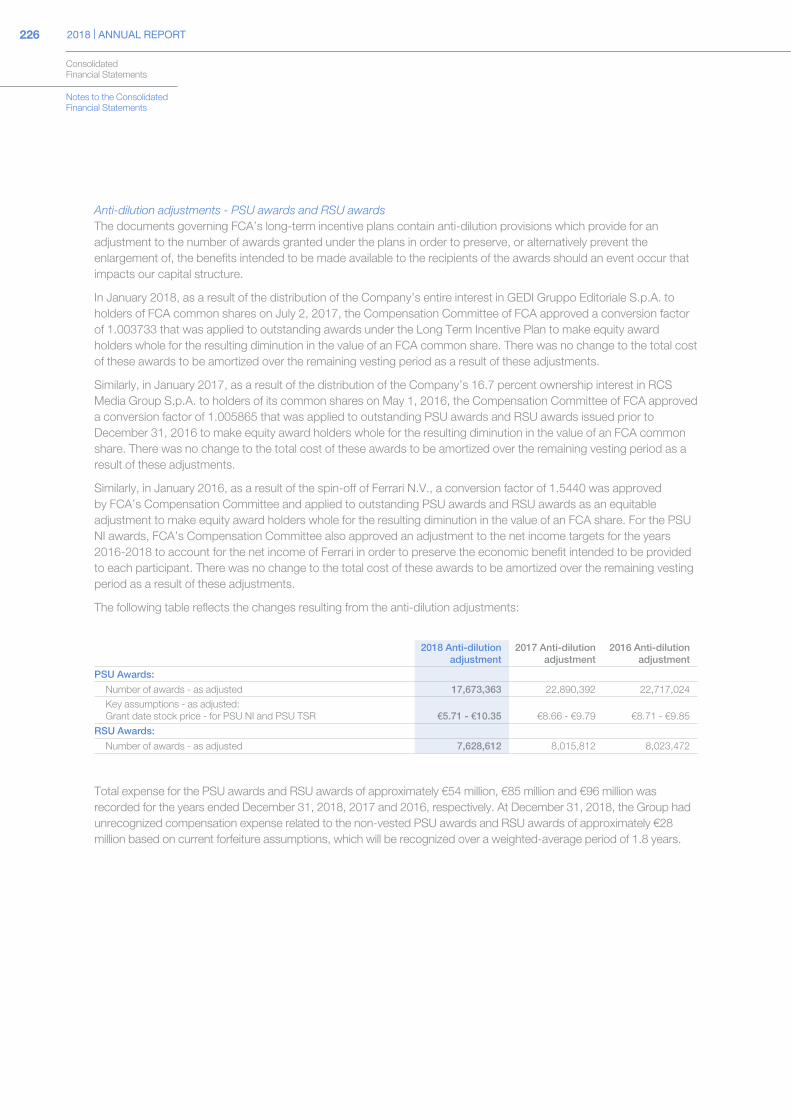
226 2018 | ANNUAL REPORT
Consolidated Financial Statements
Notes to the Consolidated Financial Statements
Anti-dilution adjustments - PSU awards and RSU awardsThe documents governing FCA’s long-term incentive plans contain anti-dilution provisions which provide for an adjustment to the number of awards granted under the plans in order to preserve, or alternatively prevent the enlargement of, the benefits intended to be made available to the recipients of the awards should an event occur that impacts our capital structure.
In January 2018, as a result of the distribution of the Company’s entire interest in GEDI Gruppo Editoriale S.p.A. to holders of FCA common shares on July 2, 2017, the Compensation Committee of FCA approved a conversion factor of 1.003733 that was applied to outstanding awards under the Long Term Incentive Plan to make equity award holders whole for the resulting diminution in the value of an FCA common share. There was no change to the total cost of these awards to be amortized over the remaining vesting period as a result of these adjustments.
Similarly, in January 2017, as a result of the distribution of the Company’s 16.7 percent ownership interest in RCS Media Group S.p.A. to holders of its common shares on May 1, 2016, the Compensation Committee of FCA approved a conversion factor of 1.005865 that was applied to outstanding PSU awards and RSU awards issued prior to December 31, 2016 to make equity award holders whole for the resulting diminution in the value of an FCA common share. There was no change to the total cost of these awards to be amortized over the remaining vesting period as a result of these adjustments.
Similarly, in January 2016, as a result of the spin-off of Ferrari N.V., a conversion factor of 1.5440 was approved by FCA’s Compensation Committee and applied to outstanding PSU awards and RSU awards as an equitable adjustment to make equity award holders whole for the resulting diminution in the value of an FCA share. For the PSU NI awards, FCA’s Compensation Committee also approved an adjustment to the net income targets for the years 2016-2018 to account for the net income of Ferrari in order to preserve the economic benefit intended to be provided to each participant. There was no change to the total cost of these awards to be amortized over the remaining vesting period as a result of these adjustments.
The following table reflects the changes resulting from the anti-dilution adjustments:
2018 Anti-dilution adjustment
2017 Anti-dilution adjustment
2016 Anti-dilution adjustment
PSU Awards:
Number of awards - as adjusted 17,673,363 22,890,392 22,717,024Key assumptions - as adjusted:Grant date stock price - for PSU NI and PSU TSR €5.71 - €10.35 €8.66 - €9.79 €8.71 - €9.85
RSU Awards:
Number of awards - as adjusted 7,628,612 8,015,812 8,023,472
Total expense for the PSU awards and RSU awards of approximately €54 million, €85 million and €96 million was recorded for the years ended December 31, 2018, 2017 and 2016, respectively. At December 31, 2018, the Group had unrecognized compensation expense related to the non-vested PSU awards and RSU awards of approximately €28 million based on current forfeiture assumptions, which will be recognized over a weighted-average period of 1.8 years.

2018 | ANNUAL REPORT 227
19. EMPLOYEE BENEFITS LIABILITIESEmployee benefits liabilities consisted of the following:
At December 31
2018 2017
Current Non-current Total Current Non-current Total(€ million)
Pension benefits € 34 € 4,475 € 4,509 € 34 € 4,789 € 4,823
Health care and life insurance plans 134 2,082 2,216 126 2,153 2,279
Other post-employment benefits 82 737 819 109 878 987
Other provisions for employees 345 581 926 425 764 1,189
Total Employee benefits liabilities € 595 € 7,875 € 8,470 € 694 € 8,584 € 9,278
The Group continuing operations recognized a total expense of €1,518 million for defined contribution and state plans for the year ended December 31, 2018 (€1,472 million in 2017 and €1,372 million in 2016).
The following table summarizes the fair value of defined benefit obligations and the fair value of related plan assets:
At December 31
2018 2017(€ million)
Present value of defined benefit obligations:
Pension benefits € 22,767 € 25,528
Health care and life insurance plans 2,216 2,279
Other post-employment benefits 819 987
Total present value of defined benefit obligations (a) 25,802 28,794
Fair value of plan assets (b) 18,819 21,218
Asset ceiling (c) 13 14
Total net defined benefit plans (a - b + c) 6,996 7,590
of which:
Net defined benefit liability (d) 7,544 8,089
Defined benefit plan asset (548) (499)
Other provisions for employees (e) 926 1,189
Total Employee benefits liabilities (d + e) € 8,470 € 9,278
Pension benefitsLiabilities arising from the Group’s defined benefit plans are usually funded by contributions made by Group subsidiaries, and at times by their employees, into legally separate trusts from which the employee benefits are paid. The Group’s funding policy for defined benefit pension plans is to contribute the minimum amounts required by applicable laws and regulations. Occasionally, additional discretionary contributions are made in excess of those legally required to achieve certain desired funding levels. In the U.S., these excess amounts are tracked and the resulting credit balance can be used to satisfy minimum funding requirements in future years. At December 31, 2018, the combined credit balances for the U.S. and Canada qualified pension plans were approximately €2.5 billion, and the usage of the credit balances to satisfy minimum funding requirements is subject to the plans maintaining certain funding levels. During the year ended December 31, 2018, 2017 and 2016, the Group made pension contributions in the U.S. and Canada totaling €724 million, €124 million and €445 million, respectively, including an accelerated discretionary contribution in September 2018 of €670 million ($800 million) to certain of our U.S. pension plans, which resulted in tax benefits (refer to Note 7, Tax expense for further information). The Group’s contributions to pension plans for 2019 are expected to be €508 million, of which €479 million relate to the U.S. and Canada, with €438 million being discretionary contributions and €41 million which will be made to satisfy minimum funding requirements.

228 2018 | ANNUAL REPORT
Consolidated Financial Statements
Notes to the Consolidated Financial Statements
The expected benefit payments for pension plans are as follows:
Expected benefit payments
(€ million)
2019 € 1,507
2020 € 1,486
2021 € 1,471
2022 € 1,460
2023 € 1,451
2024-2028 € 7,285
The following table summarizes changes in the pension plans:
2018 2017
ObligationFair value of plan assets
Asset ceiling
Liability/ (Asset) Obligation
Fair value of plan assets
Asset ceiling
Liability/ (Asset)
(€ million)
At January 1 € 25,528 € (21,218) € 14 € 4,324 € 28,065 € (23,049) € 12 € 4,668Included in the Consolidated Income Statement 1,189 (680) — 509 1,259 (817) — 442Included in Other comprehensive income:
Actuarial (gains)/losses from:
Demographic and other assumptions (196) — — (196) (42) — — (42)
Financial assumptions (1,530) — — (1,530) 1,567 — — 1,567
Return on assets — 1,530 — 1,530 — (1,589) — (1,589)Changes in the effect of limiting net assets — — (1) (1) — — 3 3
Changes in exchange rates 792 (584) — 208 (3,006) 2,445 (1) (562)
Other:
Employer contributions — (756) — (756) — (141) — (141)
Plan participant contributions 2 (2) — — — (3) — (3)
Benefits paid (1,568) 1,556 — (12) (1,751) 1,735 — (16)
Settlements paid (1,187) 1,187 — — (563) 563 — —
Transfer to Liabilities held for sale (268) 126 — (142) — — — —
Other changes 5 22 — 27 (1) (2) — (3)
At December 31 € 22,767 € (18,819) € 13 € 3,961 € 25,528 € (21,218) € 14 € 4,324
Amounts recognized in the Consolidated Income Statement were as follows:
Years ended December 31,
2018 2017 2016(€ million)
Current service cost € 172 € 169 € 172
Interest expense 925 1,083 1,148
Interest income (759) (907) (939)
Other administration costs 79 94 95
Past service costs/(credits) and (gains)/losses arising from settlements/curtailments 92 (3) (9)
Items relating to discontinued operations — 6 6
Total recognized in the Consolidated Income Statement € 509 € 442 € 473

2018 | ANNUAL REPORT 229
During the year ended December 31, 2018, the Group settled a portion of the supplemental retirement plan in NAFTA, resulting in a refund of excess assets of €22 million. The corresponding settlement charge of €78 million was recognized within Selling, general and other in the Consolidated Income Statement for the year ended December 31, 2018.
During the year ended December 31, 2018, the Group also entered into an annuity buyout relating to two of its U.S. defined benefit plans. A total of €841 million was paid to a third-party insurance company in settlement of FCA’s obligations, resulting in a settlement loss of €12 million that was recognized within Selling, general and other in the Consolidated Income Statement for the year ended December 31, 2018.
During the year ended December 31, 2017, the Group entered into an annuity buyout relating to two of its U.S. defined benefit plans. A total of €563 million was paid to a third-party insurance company in settlement of FCA’s obligations, resulting in a settlement loss of €1 million that was recognized within Cost of revenues and Selling, general and other in the Consolidated Income Statement for the year ended December 31, 2017.
During the year ended December 31, 2016, the Group amended its U.S. defined benefit plan for salaried employees to allow certain terminated vested participants to accept a lump-sum amount. A total of €214 million was paid to participants who accepted the offer in December 2016. The plan amendment resulted in a settlement gain of €29 million that was recognized within Selling, general and other costs in the Consolidated Income Statement for the year ended December 31, 2016.
The fair value of plan assets by class was as follows:
At December 31
2018 2017
Amount
of which have a quoted
market price in an active
market Amount
of which have a quoted
market price in an active
market(€ million)
Cash and cash equivalents € 672 € 615 € 628 € 611
U.S. equity securities 1,286 1,284 1,426 1,426
Non-U.S. equity securities 784 757 1,098 1,098
Commingled funds 1,833 606 2,684 1,138
Equity instruments 3,903 2,647 5,208 3,662
Government securities 2,717 916 2,601 803
Corporate bonds (including convertible and high yield bonds) 4,944 — 5,864 —
Other fixed income 1,307 86 1,071 114
Fixed income securities 8,968 1,002 9,536 917
Private equity funds 2,066 — 1,962 —
Commingled funds 56 53 165 162
Real estate funds 1,392 3 1,374 13
Hedge funds 1,676 26 1,893 49
Investment funds 5,190 82 5,394 224
Insurance contracts and other 86 12 452 50
Total fair value of plan assets € 18,819 € 4,358 € 21,218 € 5,464
Non-U.S. equity securities are invested broadly in developed international and emerging markets. Fixed income securities are debt instruments primarily comprised of long-term U.S. Treasury and global government bonds, as well as U.S., developed international and emerging market companies’ debt securities diversified by sector, geography and through a wide range of market capitalizations. Private equity funds include those in limited partnerships that invest primarily in the equity of companies that are not publicly traded on a stock exchange. Private debt funds include those in limited partnerships that invest primarily in the debt of companies and real estate developers. Commingled funds include common collective trust funds, mutual funds and other investment entities. Real estate fund investments include those in limited partnerships that invest in various commercial and residential real estate projects both domestically and internationally. Hedge fund investments include those seeking to maximize absolute return using a broad range of strategies to enhance returns and provide additional diversification.

230 2018 | ANNUAL REPORT
Consolidated Financial Statements
Notes to the Consolidated Financial Statements
The investment strategies and objectives for pension assets primarily in the U.S. and Canada reflect a balance of liability-hedging and return-seeking investment considerations. The investment objectives are to minimize the volatility of the value of pension assets relative to pension liabilities and to ensure that assets are sufficient to pay plan obligations. The objective of minimizing the volatility of assets relative to liabilities is addressed primarily through asset diversification, partial asset-liability matching and hedging. Assets are broadly diversified across many asset classes to achieve risk-adjusted returns that, in total, lower asset volatility relative to the liabilities. Additionally, in order to minimize pension asset volatility relative to the pension liabilities, a portion of the pension plan assets are allocated to fixed income securities. The Group policy for these plans ensures actual allocations are in line with target allocations as appropriate.
Assets are actively monitored and managed primarily by external investment managers. Investment managers are not permitted to invest outside of the asset class or strategy for which they have been appointed. The Group uses investment guidelines to ensure investment managers invest solely within the mandated investment strategy. Certain investment managers use derivative financial instruments to mitigate the risk of changes in interest rates and foreign currencies impacting the fair values of certain investments. Derivative financial instruments may also be used in place of physical securities when it is more cost-effective and/or efficient to do so. Plan assets do not include FCA shares or properties occupied by Group companies, with the possible exception of commingled investment vehicles where FCA does not control the investment guidelines.
Sources of potential risk in pension plan assets relate to market risk, interest rate risk and operating risk. Market risk is mitigated by diversification strategies and as a result, there are no significant concentrations of risk in terms of sector, industry, geography, market capitalization, manager or counterparty. Interest rate risk is mitigated by partial asset-liability matching. The fixed income target asset allocation partially matches the bond-like and long-dated nature of the pension liabilities. Interest rate increases generally will result in a decline in the fair value of the investments in fixed income securities and the present value of the obligations. Conversely, interest rate decreases will generally increase the fair value of the investments in fixed income securities and the present value of the obligations. Operating risks are mitigated through ongoing oversight of external investment managers’ style adherence, team strength, firm health and internal controls.
The weighted average assumptions used to determine defined benefit obligations were as follows:
At December 31
2018 2017
U.S. Canada UK U.S. Canada UK
Discount rate 4.4% 3.8% 2.8% 3.8% 3.5% 2.7%
Future salary increase rate —% 3.5% 3.0% —% 3.5% 3.2%
The average duration of U.S. and Canadian liabilities was approximately 11 years and 13 years, respectively. The average duration of UK pension liabilities was approximately 20 years.
Health care and life insurance plansLiabilities arising from these unfunded plans comprise obligations for retiree health care and life insurance granted to employees and to retirees in the U.S. and Canada. Upon retirement from the Group, these employees may become eligible for continuation of certain benefits. Benefits and eligibility rules may be modified periodically. The expected benefit payments for unfunded health care and life insurance plans are as follows:
Expected benefit payments
(€ million)
2019 € 134
2020 € 133
2021 € 133
2022 € 133
2023 € 133
2024-2028 € 668

2018 | ANNUAL REPORT 231
Changes in net defined benefit obligations for healthcare and life insurance plans were as follows:
2018 2017
(€ million)
Present value of obligations at January 1 € 2,279 € 2,466
Included in the Consolidated Income Statement 110 120
Included in Other comprehensive income:
Actuarial (gains)/losses from:
- Demographic and other assumptions 37 (52)
- Financial assumptions (161) 160
Effect of movements in exchange rates 81 (278)
Other:
Benefits paid (128) (137)
Transfer to Liabilities held for sale (2) —
Present value of obligations at December 31 € 2,216 € 2,279
Amounts recognized in the Consolidated Income Statement were as follows:
Years ended December 31
2018 2017 2016(€ million)
Current service cost € 22 € 22 € 26
Interest expense 88 98 107
Past service costs/(credits) and losses/(gains) arising from settlements — — (3)
Total recognized in the Consolidated Income Statement € 110 € 120 € 130
Health care and life insurance plans are accounted for on an actuarial basis, which requires the selection of various assumptions. In particular, it requires the use of estimates of the present value of the projected future payments to all participants, taking into consideration the likelihood of potential future events such as health care cost increases and demographic experience.
The weighted average assumptions used to determine the defined benefit obligations were as follows:
At December 31
2018 2017
U.S. Canada U.S. Canada
Discount rate 4.4% 3.8% 3.9% 3.6%
Salary growth 1.5% 1.0% 1.5% 1.0%
Weighted average ultimate healthcare cost trend rate 4.4% 4.0% 4.5% 4.5%
The average duration of the U.S. and Canadian liabilities was approximately 12 years and 16 years, respectively.
The annual rate of increase in the per capita cost of covered U.S. health care benefits assumed for next year and used in the 2018 plan valuation was 6.4 percent (6.8 percent in 2017). The annual rate was assumed to decrease gradually to 4.4 percent through 2037 and remain at that level thereafter. The annual rate of increase in the per capita cost of covered Canadian health care benefits assumed for next year and used in the 2018 plan valuation was 4.4 percent (4.8 percent in 2017). The annual rate was assumed to decrease gradually to 4.0 percent through 2040 and remain at that level thereafter.

232 2018 | ANNUAL REPORT
Consolidated Financial Statements
Notes to the Consolidated Financial Statements
Other post-employment benefitsOther post-employment benefits comprises other employee benefits granted to Group employees in Europe and includes the Italian employee severance indemnity (trattamento di fine rapporto, or “TFR”) obligation required under Italian Law, amounting to €664 million at December 31, 2018 and €752 million at December 31, 2017.
The amount of TFR to which each employee is entitled must be paid when the employee leaves the Group and is calculated based on the period of employment and the taxable earnings of each employee. Under certain conditions, the entitlement may be partially advanced to an employee during their working life.
The legislation governing this scheme was amended by Law 296 of December 27, 2006 and subsequent decrees and regulations issued in 2007. Under these amendments, companies with at least 50 employees were obliged to transfer the TFR obligation to the “Treasury fund” managed by the Italian state-owned social security body (“INPS”) or to supplementary pension funds. Prior to the amendments, accruing TFR for employees of all Italian companies could be managed by the company itself. Consequently, the Italian companies’ obligation to INPS and the contributions to supplementary pension funds take the form of defined contribution plans under IAS 19 - Employee Benefits, whereas the amounts recorded in the provision for employee severance pay retain the nature of defined benefit plans. Accordingly, the provision for employee severance indemnity in Italy consisted of the residual TFR obligation through December 31, 2006. This is an unfunded defined benefit plan as the benefits have already been entirely earned, with the sole exception of future revaluations. Since 2007, the scheme has been classified as a defined contribution plan and the Group recognizes the associated cost over the period in which the employee renders service.
Changes in defined benefit obligations for other post-employment benefits were as follows:
2018 2017
(€ million)
Present value of obligations at January 1 € 987 € 987
Included in the Consolidated Income Statement 23 23
Included in Other comprehensive income:
Actuarial (gains)/losses from:
- Demographic and other assumptions 2 18
- Financial assumptions (5) (3)
Effect of movements in exchange rates (3) (5)
Other:
Benefits paid (50) (48)
Transfer to Liabilities held for sale (98) —
Other changes (37) 15
Present value of obligations at December 31 € 819 € 987

2018 | ANNUAL REPORT 233
Amounts recognized in the Consolidated Income Statement were as follows:
Years ended December 31,
2018 2017 2016(€ million)
Current service cost € 9 € 9 € 6
Interest expense 14 11 14
Past service costs/(credits) and losses/(gains) arising from settlements — — 1
Items relating to discontinued operations — 3 5
Total recognized in the Consolidated Income Statement € 23 € 23 € 26
The discount rates used for the measurement of the Italian TFR obligation are based on yields of high-quality (AA rated) fixed income securities for which the timing and amounts of maturities match the timing and amounts of the projected benefit payments. For this plan, the single weighted average discount rate that reflects the estimated timing and amount of the scheme future benefit payments for 2018 was 1.4 percent (1.2 percent in 2017). The average duration of the Italian TFR is approximately 7 years. Retirement or employee leaving rates are developed to reflect actual and projected Group experience and legal requirements for retirement in Italy.
Other provisions for employeesOther provisions for employees primarily include long-term disability benefits, supplemental unemployment benefits, variable and other deferred compensation, as well as bonuses granted for tenure at the Company.

234 2018 | ANNUAL REPORT
Consolidated Financial Statements
Notes to the Consolidated Financial Statements
20. PROVISIONSProvisions consisted of the following:
At December 31
2018 2017
Current Non-current Total Current Non-current Total(€ million)
Product warranty and recall campaigns € 2,745 € 4,015 € 6,760 € 2,676 € 4,049 € 6,725
Sales incentives 5,999 — 5,999 5,377 — 5,377
Legal proceedings and disputes 849 428 1,277 125 551 676
Commercial risks 442 272 714 481 334 815
Restructuring 134 31 165 26 44 70
Other risks 314 815 1,129 324 792 1,116
Total Provisions € 10,483 € 5,561 € 16,044 € 9,009 € 5,770 € 14,779
Changes in Provisions were as follows:
At January 1,
2018Additional provisions Settlements
Unused amounts
Translation differences
Transfer to Liabilities
held for saleOther
changes
At December
31, 2018(€ million)
Product warranty and recall campaigns € 6,725 € 3,241 € (3,272) € — € 180 € (118) € 4 € 6,760
Sales incentives 5,377 14,514 (14,014) (35) 162 — (5) 5,999
Legal proceedings and disputes 676 971 (113) (67) (6) (59) (125) 1,277
Commercial risks 815 426 (457) (65) 21 (27) 1 714
Restructuring costs 70 105 (26) (3) — (4) 23 165
Other risks 1,116 323 (230) (84) 17 (2) (11) 1,129
Total Provisions € 14,779 € 19,580 € (18,112) € (254) € 374 € (210) € (113) € 16,044
Product warranty and recall campaignsAt December 31, 2018, the Product warranty and recall campaigns provision was substantially in line with 2017. During the year ended December 31, 2018, an additional amount of €114 million was accrued in relation to costs for recall campaigns related to Takata airbag inflators, net of recovery. At December 31, 2017, the Product warranty and recall campaigns provision included €102 million of charges recognized within Cost of revenues in the Consolidated Income Statement for the year ended December 31, 2017 for the estimated costs associated with an expansion of the recall campaigns related to an industry-wide recall of airbag inflators resulting from parts manufactured by Takata, of which €29 million related to the previously announced recall in NAFTA and €73 million related to the preventative safety campaigns in LATAM. Refer to Note 25, Guarantees granted, commitments and contingent liabilities, for additional information. The cash outflow for the non-current portion of the Product warranty and recall campaigns provision is primarily expected within a period through 2021.
Sales incentivesAs described within Note 2, Basis of preparation - Use of estimates, the Group records the estimated cost of sales incentive programs offered to dealers and consumers as a reduction to revenue at the time of sale of the vehicle to the dealer.

2018 | ANNUAL REPORT 235
Legal proceedings and disputesNone of the provisions within the total Legal proceedings and disputes provision are individually significant except for the provision of €748 million recognized during the year ended December 31, 2018, for costs related to final settlements reached on civil, environmental and consumer claims related to U.S. diesel emissions matters (refer to Note 25, Guarantees granted, commitments and contingent liabilities).
As described within Note 2, Basis of preparation - Use of estimates, a provision for legal proceedings is recognized when it is deemed probable that the proceedings will result in an outflow of resources. As the ultimate outcome of pending litigation is uncertain, the timing of cash outflows for the Legal proceedings and disputes provision is also uncertain.
Commercial risksCommercial risks arise in connection with the sale of products and services, such as onerous maintenance contracts, and as a result of certain regulatory emission requirements. For items such as onerous maintenance contracts, a provision is recognized when the expected costs to complete the services under these contracts exceed the revenues expected to be realized. A provision for fines related to certain regulatory emission requirements that can be settled with cash fines is recognized at the time vehicles are sold based on the estimated cost to settle the obligation, measured as the sum of the cost of regulatory credits previously purchased plus the amount, if any, of the fine expected to be paid in cash. The cash outflow for the non-current portion of the Commercial risks provision is primarily expected within a period through 2021.
Other risksOther risks includes, among other items: provisions for disputes with suppliers related to supply contracts or other matters that are not subject to legal proceedings, provisions for product liabilities arising from personal injuries including wrongful death and potential exemplary or punitive damages alleged to be the result of product defects, disputes with other parties relating to contracts or other matters not subject to legal proceedings and management’s best estimate of the Group’s probable environmental obligations, which also includes costs related to claims on environmental matters. The cash outflow for the non-current portion of the Other risks provision is primarily expected within a period through 2021.

236 2018 | ANNUAL REPORT
Consolidated Financial Statements
Notes to the Consolidated Financial Statements
21. DEBTDebt classified within current liabilities includes short-term borrowings from banks and other financing with an original maturity date falling within twelve months, as well as the current portion of long-term debt. Debt classified within non-current liabilities includes borrowings from banks and other financing with maturity dates greater than twelve months (long-term debt), net of the current portion.
The following table summarizes the Group’s current and non-current Debt by maturity date (amounts include accrued interest):
At December 31
2018 2017Due
within one year (current)
Due between one and
five years
Due beyond
five years
Total (non-
current)Total Debt
Due within
one year (current)
Due between one and
five years
Due beyond
five years
Total (non-
current)Total Debt
(€ million)
Notes € 1,598 € 4,977 € 1,250 € 6,227 € 7,825 € 2,054 € 5,071 € 2,501 € 7,572 € 9,626
Borrowings from banks 2,935 2,012 234 2,246 5,181 4,132 2,278 502 2,780 6,912Asset-backed financing (Note 15) 457 — — — 457 357 — — — 357
Other debt 871 151 43 194 1,065 702 347 27 374 1,076
Total Debt € 5,861 € 7,140 € 1,527 € 8,667 € 14,528 € 7,245 € 7,696 € 3,030 € 10,726 € 17,971
NotesThe following table summarizes the notes outstanding at December 31, 2018 and 2017:
At December 31
Currency
Face value of outstanding
notes (million) Coupon % Maturity 2018 2017
Medium Term Note Programme: (€ million)
Fiat Chrysler Finance Europe S.A.(1) EUR 1,250 6.625 March 15, 2018 — 1,250
Fiat Chrysler Finance Europe S.A.(1) EUR 600 7.375 July 9, 2018 — 600
Fiat Chrysler Finance Europe S.A.(2) CHF 250 3.125 September 30, 2019 222 213
Fiat Chrysler Finance Europe S.A.(1) EUR 1,250 6.750 October 14, 2019 1,250 1,250
Fiat Chrysler Finance Europe S.A.(1) EUR 1,000 4.750 March 22, 2021 1,000 1,000
Fiat Chrysler Finance Europe S.A.(1) EUR 1,350 4.750 July 15, 2022 1,350 1,350
FCA NV(1) EUR 1,250 3.750 March 29, 2024 1,250 1,250
Other(3) EUR 7 7 7
Total Medium Term Note Programme 5,079 6,920
Other Notes:
FCA NV(1) U.S.$ 1,500 4.500 April 15, 2020 1,310 1,251
FCA NV(1) U.S.$ 1,500 5.250 April 15, 2023 1,310 1,251
Total Other Notes 2,620 2,502Hedging effect, accrued interest and amortized cost valuation 126 204
Total Notes € 7,825 € 9,626(1) Listing on the Irish Stock Exchange was obtained.(2) Listing on the SIX Swiss Exchange was obtained.(3) Medium Term Notes with amounts outstanding equal to or less than the equivalent of €50 million.

2018 | ANNUAL REPORT 237
Notes Issued Through the Medium Term Note ProgrammeCertain notes issued by the Group are governed by the terms and conditions of the Medium Term Note (“MTN”) Programme (previously known as the Global Medium Term Note Programme, or “GMTN” Programme). A maximum of €20 billion may be used under this programme, of which notes of €5.1 billion were outstanding at December 31, 2018 (€6.9 billion at December 31, 2017). Notes under the MTN Programme are issued, or otherwise guaranteed, by FCA NV. From time to time, we may buy back notes in the market that have been issued. Such buybacks, if made, depend upon market conditions, the Group’s financial situation and other factors which could affect such decisions.
Changes in notes issued under the MTN Programme during the year ended December 31, 2018 were due to the repayment at maturity:
in March 2018 of a note with a principal amount of €1,250 million; and
in July 2018 of a note with a principal amount of €600 million.
Changes in notes issued under the MTN Programme during the year ended December 31, 2017 were due to the repayment at maturity:
in March 2017 of a note with a principal amount of €850 million;
in June 2017 of a note with a principal amount of €1,000 million; and
in November 2017 of a note with a principal amount of CHF 450 million (€385 million).
Notes issued under the MTN Programme impose covenants on the issuer and, in certain cases, on FCA NV as guarantor, which include: (i) negative pledge clauses which require that in the case that any security interest upon assets of the issuer and/or FCA NV is granted in connection with other notes or debt securities having the same ranking, such a security should be equally and ratably extended to the outstanding notes; (ii) pari passu clauses, under which the notes rank and will rank pari passu with all other present and future unsubordinated and unsecured obligations of the issuer and/or FCA NV; (iii) periodic disclosure obligations; (iv) cross-default clauses which require immediate repayment of the notes under certain events of default on other financial instruments issued by FCA’s main entities; and (v) other clauses that are generally applicable to securities of a similar type. A breach of these covenants may require the early repayment of the notes. As of December 31, 2018, FCA was in compliance with the covenants under the MTN Programme.
Other NotesIn 2015, FCA NV issued U.S.$1.5 billion (€1.4 billion) principal amount of 4.5 percent unsecured senior debt securities due April 15, 2020 (the “2020 Notes”) and U.S.$1.5 billion (€1.4 billion) principal amount of 5.25 percent unsecured senior debt securities due April 15, 2023 (the “2023 Notes”) at an issue price of 100 percent of their principal amount. The 2020 Notes and the 2023 Notes, collectively referred to as the “Notes”, rank pari passu in right of payment with respect to all of FCA NV’s existing and future senior unsecured indebtedness and senior in right of payment to any of FCA NV’s future subordinated indebtedness and existing indebtedness, which is by its terms subordinated in right of payment to the Notes. Interest on the 2020 Notes and the 2023 Notes is payable semi-annually in April and October.
The Notes impose covenants on FCA NV including: (i) negative pledge clauses which require that in the case that any security interest upon assets of FCA NV is granted in connection with other notes or debt securities having the same ranking, such a security should be equally and ratably extended to the outstanding Notes; (ii) pari passu clauses, under which the Notes rank and will rank pari passu with all other present and future unsubordinated and unsecured obligations of FCA NV; (iii) periodic disclosure obligations; (iv) cross-default clauses which require immediate repayment of the Notes under certain events of default on other financial instruments issued by FCA’s main entities; and (v) other clauses that are generally applicable to securities of a similar type. A breach of these covenants may require the early repayment of the Notes. As of December 31, 2018, FCA was in compliance with the covenants of the Notes.
Fiat Chrysler Finance US Inc.On March 6, 2017, Fiat Chrysler Finance US Inc. (“FCF US”) was incorporated under the laws of Delaware and became an indirect, 100 percent owned subsidiary of the Company. If FCF US issues debt securities, they will be fully and unconditionally guaranteed by the Company. No other subsidiary of the Company will guarantee such indebtedness.

238 2018 | ANNUAL REPORT
Consolidated Financial Statements
Notes to the Consolidated Financial Statements
Borrowings from banks
FCA US Tranche B Term LoansOn November 13, 2018, FCA US prepaid the U.S.$1,009 million (€893 million) outstanding principal and accrued interest on its Tranche B term loan maturing December 31, 2018 (the “Tranche B Term Loan due 2018”). The prepayment was made with cash on hand and resulted in a €1 million loss on extinguishment.
At December 31, 2017, €836 million, including accrued interest, was outstanding under FCA US’s Tranche B Term Loan maturing December 31, 2018. On February 24, 2017, FCA US prepaid the U.S.$1,826 million (€1,721 million) outstanding principal and accrued interest on its tranche B term loan maturing May 24, 2017 (the “Tranche B Term Loan due 2017”). The prepayment was made with cash on hand and resulted in a €3 million loss on extinguishment. On April 12, 2017, FCA US amended the credit agreement that governs the Tranche B Term Loan due 2018, reducing the applicable interest rate spreads by 0.50 percent per annum and reduced the LIBOR floor by 0.75 percent per annum, to 0.00 percent. For the years ended December 31, 2018, 2017 and 2016, interest was accrued based on LIBOR.
On March 15, 2016, FCA US entered into amendments to the credit agreements that govern the Tranche B Term Loans to, among other items, eliminate covenants restricting the provision of guarantees and payment of dividends by FCA US for the benefit of the rest of the Group, to enable a unified financing platform and to provide free flow of capital within the Group. In conjunction with these amendments, FCA US made a U.S.$2.0 billion (€1.8 billion) voluntary prepayment of principal at par with cash on hand, of which U.S.$1,288 million (€1,159 million) was applied to the Tranche B Term Loan due 2017 and U.S.$712 million (€641 million) was applied to the Tranche B Term Loan due 2018. Accrued interest related to the portion of principal prepaid of the Tranche B Term Loans and related transaction fees were also paid.
The prepayments of principal were accounted for as debt extinguishments and, as a result, a non-cash charge of €10 million was recorded within Net financial expenses in the Consolidated Income Statement for the year ended December 31, 2016 which consisted of the write-off of the remaining unamortized debt issuance costs. The amendments to the remaining principal balance were analyzed on a lender-by-lender basis and accounted for as debt modifications in accordance with IAS 39. As such, the debt issuance costs for each of the amendments were capitalized and amortized over the respective remaining terms of the Tranche B Term Loans.
European Investment Bank BorrowingsFCA has financing agreements with the European Investment Bank (“EIB”) for a total of €0.7 billion outstanding at December 31, 2018 (€1.1 billion outstanding at December 31, 2017), which included the residual debt due under the following facilities:
€250 million (maturing in December 2019) entered into in December 2016 to support the Group’s investment plan (2017-2019) in research and development centers in Italy, which includes a number of key objectives such as greater fuel efficiency, a reduction in CO2 emissions by petrol and alternative fuel engines and the study of new hybrid architectures, as well as certain capital expenditures for facilities located in southern Italy;
€500 million (maturing in June 2021), entered into in May 2011 (guaranteed by SACE and the Serbian Authorities) for an investment program relating to the modernization and expansion of production capacity of an automotive plant in Serbia; and
€420 million (maturing in June 2022), entered into in June 2018 to support research and development projects to be implemented by FCA during the period 2018-2020.

2018 | ANNUAL REPORT 239
BrazilOur Brazilian subsidiaries have access to various local bank facilities in order to fund investments and operations. Total debt outstanding under those facilities amounted to a principal amount of €2.3 billion at December 31, 2018 (€3.2 billion at December 31, 2017). The loans primarily include subsidized loans granted by public financing institutions, such as Banco Nacional do Desenvolvimento (“BNDES”), with the aim to support industrial projects in certain areas. This has provided the Group with the opportunity to fund large investments in Brazil with loans of sizeable amounts at attractive rates. At December 31, 2018, outstanding subsidized loans amounted to €1.4 billion (€2.1 billion at December 31, 2017), of which approximately €1.0 billion (€1.3 billion at December 31, 2017) related to the construction of the plant in Pernambuco (Brazil), which was supported by subsidized credit lines totaling Brazilian Real (“BRL”) 6.5 billion (€1.5 billion). Approximately €0.1 billion (€0.1 billion at December 31, 2017) of committed credit lines contracted to fund scheduled investments in the area were undrawn at December 31, 2018.
Revolving Credit FacilitiesIn March 2018, the Group amended its syndicated revolving credit facility originally signed in June 2015 and previously amended in March 2017 (as amended, the “RCF”). The amendment extended the RCF’s final maturity to March 2023. The RCF is available for general corporate purposes and for the working capital needs of the Group and is structured in two tranches: €3.125 billion, with a 37-month tenor and two extension options of 1-year and of 11-months exercisable on the first and second anniversary of the amendment signing date, respectively, and €3.125 billion, with a 60-month tenor. This amendment was accounted for as a debt modification and, as a result, the new costs associated with the March 2018 amendment, as well as the remaining unamortized debt issuance costs related to the original €5.0 billion RCF and the previous March 2017 amendment, will be amortized over the life of the amended RCF. At December 31, 2018, the €6.25 billion RCF was undrawn.
In the March 2017 amendment, the original RCF was increased from €5.0 billion to €6.25 billion and the final maturity extended to March 2022. The amendment was accounted for as a debt modification and, as a result, the remaining unamortized debt issuance costs related to the original €5.0 billion RCF and the new costs associated with the amendment were amortized over the life of the RCF.
The covenants of the RCF include financial covenants as well as negative pledge, pari passu, cross-default and change of control clauses. Failure to comply with these covenants, and in certain cases if not suitably remedied, can lead to the requirement of early repayment of any outstanding amounts. As of December 31, 2018, FCA was in compliance with the covenants of the RCF.
At December 31, 2018, undrawn committed credit lines totaling €7.7 billion included the €6.25 billion RCF and approximately €1.5 billion of other revolving credit facilities. At December 31, 2017, undrawn committed credit lines totaling €7.6 billion included the €6.25 billion RCF and approximately €1.3 billion of other revolving credit facilities.
Mexico Bank LoanFCA Mexico, S.A. de C.V. (“FCA Mexico”), our principal operating subsidiary in Mexico, has a non-revolving loan agreement (“Mexico Bank Loan”) maturing on March 20, 2022 and bears interest at one-month LIBOR plus 3.35 percent per annum. At December 31, 2018, the Mexico Bank Loan had an outstanding balance of €0.3 billion (€0.4 billion at December 31, 2017). As of December 31, 2018, we may prepay all or any portion of the loan without premium or penalty. The Mexico Bank Loan requires FCA Mexico to maintain certain fixed assets as collateral and comply with certain covenants, including, but not limited to, financial maintenance covenants, limitations on liens, incurrence of debt and asset sales. As of December 31, 2018, FCA Mexico was in compliance with the covenants under the Mexico Bank Loan.

240 2018 | ANNUAL REPORT
Consolidated Financial Statements
Notes to the Consolidated Financial Statements
Asset-backed financingAsset-backed financing represents the amount of financing received through factoring transactions which do not meet the IFRS 9 derecognition requirements and are recognized with assets of the same amount of €457 million (€357 million at December 31, 2017) within Trade and other receivables in the Consolidated Statement of Financial Position (Note 15, Trade, other receivables and tax receivables).
Other debtDuring the year ended December 31, 2017, FCA US’s Canadian subsidiary made payments on the Canada Health Care Trust (“HCT”) Tranche B Note totaling €272 million, which included a scheduled payment of principal and accrued interest and the prepayment of the remaining scheduled payments due on the note. The prepayment of €226 million was accounted for as a debt extinguishment and, as a result, a gain on extinguishment of €9 million was recorded within Net financial expenses in the Consolidated Income Statement for the year ended December 31, 2017. This Canada HCT Note represented FCA US’s principal Canadian subsidiary’s remaining financial liability to the Canadian Health Care Trust arising from the settlement of its obligations for postretirement health care benefits for the National Automobile, Aerospace, Transportation and General Workers Union of Canada “CAW” (now part of Unifor), which represented employees, retirees and dependents.
Other debt also included funds raised from financial services companies, primarily in Latin America, deposits from dealers in Brazil and China and the Group’s payables for finance leases, which is summarized in the table below:
At December 31
2018 2017
Due within
one year
Due between one and
three years
Due between
three and five years
Due beyond
five years Total
Due within
one year
Due between one and
three years
Due between
three and five years
Due beyond
five years Total
(€ million)
Minimum future lease payments € 73 € 106 € 54 € 80 € 313 € 90 € 134 € 19 € 74 € 317
Interest expense (17) (18) (11) (6) (52) (15) (15) (3) (3) (36)Present value of minimum lease payments € 56 € 88 € 43 € 74 € 261 € 75 € 119 € 16 € 71 € 281
Debt secured by assetsAt December 31, 2018, debt secured by assets of the Group amounted to €1,095 million (€1,348 million at December 31, 2017), of which €261 million (€281 million at December 31, 2017) was due to creditors for assets acquired under finance leases and the remaining amount mainly related to subsidized financing in Latin America.
The total carrying amount of assets acting as security for loans for the Group amounted to €2,214 million at December 31, 2018 (€2,372 million at December 31, 2017, excluding the amounts secured in relation to the Tranche B Term Loan). At December 31, 2017, debt secured by assets of FCA US, in relation the Tranche B Term Loan amounted to €836 million. Refer to Note 11, Property, plant and equipment.

2018 | ANNUAL REPORT 241
22. OTHER LIABILITIES AND TAX PAYABLESOther liabilities consisted of the following:
At December 31
2018 2017
Current Non-current Total Current Non-current Total(€ million)
Payables for GDP and buy-back agreements € 2,362 € — € 2,362 € 2,234 € — € 2,234
Accrued expenses and deferred income 783 697 1,480 1,573 2,260 3,833
Indirect tax payables 681 16 697 799 19 818
Payables to personnel 956 16 972 988 16 1,004
Social security payables 265 4 269 313 6 319
Construction contract liabilities (Note 14) 93 — 93 190 — 190
Service contract liability 568 1,521 2,089 — — —
Other 1,349 198 1,547 1,838 199 2,037
Total Other liabilities € 7,057 € 2,452 € 9,509 € 7,935 € 2,500 € 10,435
The impact of the adoption of IFRS 15 on Other liabilities as at January 1, 2018, was as follows:
At December 31, 2017 (as previously reported)
Adjustments/Reclassifications
At January 1, 2018 (as adjusted)
CurrentNon-
Current Total CurrentNon-
Current Total CurrentNon-
Current Total(€ million)
Payables for GDP and buy-back agreements € 2,234 € — € 2,234 € (293) € — € (293) € 1,941 € — € 1,941Accrued expenses and deferred income 1,573 2,260 3,833 (440) (1,414) (1,854) 1,133 846 1,979
Service contract liability — — — 497 1,397 1,894 497 1,397 1,894Balances unaffected by IFRS 15 adoption 4,128 240 4,368 — — — 4,128 240 4,368
Total Other liabilities € 7,935 € 2,500 € 10,435 € (236) € (17) € (253) € 7,699 € 2,483 € 10,182
Other liabilities (excluding Accrued expenses, Deferred income and Service contract liability) by due date were as follows:
At December 31
2018 2017
Total due within
one year (Current)
Due between one and
five years
Due beyond
five years
Total due after one year
(Non-Current) Total
Total due within
one year (Current)
Due between one and
five years
Due beyond
five years
Total due after one year
(Non-Current) Total
(€ million)
Other liabilities (excluding Accrued expenses, deferred income and service contract liability) € 5,706 € 221 € 13 € 234 € 5,940 € 6,362 € 227 € 13 € 240 € 6,602
Payables for GDP and buy-back agreements relate to buy-back agreements entered into by the Group and includes the price received for the product, recognized as an advance at the date of the sale and, subsequently, the repurchase price and the remaining lease installments yet to be recognized.
Accrued expenses and deferred income includes the remaining portion of government grants that will be recognized as income in the Consolidated Income Statement over the same periods as the related costs which they are intended to offset.

242 2018 | ANNUAL REPORT
Consolidated Financial Statements
Notes to the Consolidated Financial Statements
On March 15, 2017, the Brazilian Supreme Court ruled that state value added tax should be excluded from the basis for calculating a federal tax on revenue. At June 30, 2017, the Group determined that the likelihood of economic outflow related to such indirect taxes was no longer probable and the total liability of €895 million that FCA had accrued but not paid for such taxes for the period from 2007 to 2014 was reversed. Due to the materiality of this item and its effect on our results, the amount is presented separately in the line Reversal of a Brazilian indirect tax liability in the Consolidated Income Statement for the year ended December 31, 2017, and is composed of €547 million, originally recognized as a reduction to Net revenues, and €348 million, originally recognized within Net financial expenses. The Brazilian Supreme Court issued summary written minutes of its ruling on September 29, 2017 and Trial Minutes on October 2, 2017. On October 19, 2017, the Brazilian government filed its appeal against the PIS/COFINS over ICMS decision. At December 31, 2017, due to the uncertainty of scope of the application of the Supreme Court ruling taking into account the government’s appeal and request for modulation, and due to Brazil’s current heightened political and economic uncertainty, management believed a risk of economic outflow was still greater than remote. On August 18, 2018, the litigation concerning PIS over ICMS had its final and definitive favorable decision. At September 30, 2018, the Group determined that the likelihood of economic outflow related to such indirect taxes was no longer probable and the total liability of €54 million accrued and paid will be recovered. At December 31, 2018, management believes a risk of economic outflow for COFINS over ICMS is still greater than remote.
The service contract liability is mainly comprised of maintenance plans and extended warranties. Changes in the Group’s service contract liability for the year ended December 31, 2018, were as follows:
At January 1, 2018
Advances received
from customers
Amounts recognized
within revenue
Transfers to Assets/(Liabilities)
held for saleOther
Changes
At December
31, 2018(€ million)
Service contract liability € 1,894 € 879 € (658) € — € (26) € 2,089
Of the total Service contract liability at December 31, 2018, the Group expects to recognize approximately €512 million in 2019, €440 million in 2020, €362 million in 2021 and €775 million thereafter
Tax payablesTax payables by due date were as follows:
At December 31
2018 2017
Total due within
one year (Current)
Due between one and
five years
Due beyond
five years
Total due after one
year (Non-Current) Total
Total due within
one year (Current)
Due between one and
five years
Due beyond
five years
Total due after one
year (Non-Current) Total
(€ million)
Tax payables € 114 € 1 € — € 1 € 115 € 309 € 32 € 42 € 74 € 383

2018 | ANNUAL REPORT 243
23. FAIR VALUE MEASUREMENT
Assets and liabilities that are measured at fair value on a recurring basisThe following table shows the fair value hierarchy, based on observable and unobservable inputs, for financial assets and liabilities that are measured at fair value on a recurring basis:
At December 31
2018 2017
Level 1 Level 2 Level 3 Total Level 1 Level 2 Level 3 TotalNote (€ million)
Debt securities and equity instruments measured at FVOCI 13 € 3 € 15 € 13 € 31 € 3 € 24 € — € 27Debt securities and equity instruments measured at FVPL 13 270 — 3 273 275 — 2 277
Derivative financial assets 16 — 256 41 297 — 254 30 284
Collateral deposits 13 61 — — 61 61 — — 61
Receivables from financing activities 15 — — 973 973 — — — —
Trade receivables 15 — 65 — 65 — — — —
Cash at banks(1) 17 — — — — 6,396 — — 6,396
Money market securities(1) 17 4,352 — — 4,352 4,404 1,838 — 6,242
Total Assets € 4,686 € 336 € 1,030 € 6,052 € 11,139 € 2,116 € 32 € 13,287
Derivative financial liabilities 16 — 205 2 207 — 138 1 139
Total Liabilities € — € 205 € 2 € 207 € — € 138 € 1 € 139(1) Amounts relating to Cash at banks and certain Money market securities were reclassified to amortized cost as January 1, 2018. Refer to Note
2, Basis of preparation - New standards and amendments effective January 1, 2018.
The impact of the adoption of IFRS 9 on the fair value hierarchy as at January 1, 2018 was as follows:
At December 31, 2017 (as previously reported)
Adjustments/Reclassifications
At January 1, 2018 (as adjusted)
Level 1 Level 2 Level 3 Total Level 1 Level 2 Level 3 Total Level 1 Level 2 Level 3 Total(€ million)
Debt securities and equity instruments measured at FVOCI € 3 € 24 € — € 27 € — € (4) € 23 € 19 € 3 € 20 € 23 € 46Debt securities and equity instruments measured at FVPL 275 — 2 277 — — 20 20 275 — 22 297Derivative financial assets — 254 30 284 — — — — — 254 30 284Collateral deposits 61 — — 61 — — — — 61 — — 61Receivables from financing activities — — — — — — 700 700 — — 700 700
Trade receivables — — — — — 28 — 28 — 28 — 28
Cash at banks(1) 6,396 — — 6,396 (6,396) — — (6,396) — — — —Money market securities(1) 4,404 1,838 — 6,242 (1,692) (1,838) — (3,530) 2,712 — — 2,712
Total Assets € 11,139 € 2,116 € 32 € 13,287 € (8,088) € (1,814) € 743 € (9,159) € 3,051 € 302 € 775 € 4,128Derivative financial liabilities — 138 1 139 — — — — — 138 1 139
Total Liabilities € — € 138 € 1 € 139 € — € — € — € — € — € 138 € 1 € 139

244 2018 | ANNUAL REPORT
Consolidated Financial Statements
Notes to the Consolidated Financial Statements
In 2018, there were no transfers between Levels in the fair value hierarchy. For assets and liabilities recognized in the financial statements at fair value on a recurring basis, the Group determines whether transfers have occurred between levels in the hierarchy by re-assessing categorization at the end of each reporting period.
The fair value of derivative financial assets and liabilities is measured by taking into consideration market parameters at the balance sheet date and using valuation techniques widely accepted in the financial business environment, as described below:
the fair value of forward contracts and currency swaps is determined by taking the prevailing exchange rates and interest rates at the balance sheet date;
the fair value of interest rate swaps and forward rate agreements is determined by taking the prevailing interest rates at the balance sheet date and using the discounted expected cash flow method;
the fair value of combined interest rate and currency swaps is determined using the exchange and interest rates prevailing at the balance sheet date and the discounted expected cash flow method; and
the fair value of swaps and options hedging commodity price risk is determined by using suitable valuation techniques and taking market parameters at the balance sheet date (in particular, underlying prices, interest rates and volatility rates).
The fair value of money market securities is also based on available market quotations. Where appropriate, the fair value of cash equivalents is determined with discounted expected cash flow techniques using observable market yields (categorized as Level 2).
The fair value of Receivables from financing activities, which are classified in Level 3 of the fair value hierarchy, has been estimated using discounted cash flow models. The most significant inputs used in this measurement are market discount rates that reflect conditions applied in various reference markets on receivables with similar characteristics, adjusted in order to take into account the credit risk of the counterparties.
The following table provides a reconciliation of the changes in items measured at fair value and categorized within Level 3:
2018 2017
Receivables from financing activities
Debt securities and equity
instruments
Derivativefinancial assets/
(liabilities)
Debt securities and equity
instruments
Derivativefinancial assets/
(liabilities)(€ million)
At January 1 700 45 29 12 19Gains/(Losses) recognized in Consolidated Income Statement — (1) 30 1 27Gains/(Losses) recognized in Other comprehensive income/(loss) — — 9 (1) 18
Issues/Settlements 273 — (29) — (35)
Transfers to Assets/(Liabilities) held for sale — (28) — — —
At December 31 € 973 € 16 € 39 12 29
The gains/(losses) included in the Consolidated Income Statements were recognized within Cost of revenues. Of the total gains/(losses) recognized in Other comprehensive income, €7 million was recognized within Cash flow reserves and €2 million was recognized within Currency translation differences.

2018 | ANNUAL REPORT 245
Assets and liabilities not measured at fair value on recurring basisThe carrying value of debt securities measured at amortized cost, financial receivables, current receivables and payables is a reasonable approximation of fair value as the present value of future cash flows does not differ significantly from the carrying amount.
The carrying value of Cash at banks and Other cash equivalents usually approximates fair value due to the short maturity of these instruments (refer to Note 17, Cash and cash equivalents).
The following table provides the carrying amount and fair value of financial assets and liabilities not measured at fair value on a recurring basis:
At December 31
2018 2017
Carrying amount
Fair Value
Carrying amount
Fair Value
Note (€ million)
Dealer financing € 1,681 € 1,682 € 2,295 € 2,295
Retail financing 601 584 420 405
Finance lease 3 3 4 4
Other receivables from financing activities 356 355 421 421
Total Receivables from financing activities(1) 15 € 2,641 € 2,624 € 3,140 € 3,125
Asset backed financing € 457 € 457 € 357 € 357
Notes 7,825 8,152 9,626 10,365
Other debt 6,246 6,229 7,988 8,001
Total Debt 21 € 14,528 € 14,838 € 17,971 € 18,723(1) Amount at December 31, 2018 excludes receivables measured at FVPL
The fair value of Receivables from financing activities, which are categorized within Level 3 of the fair value hierarchy, has been estimated with discounted cash flows models. The most significant inputs used in this measurement are market discount rates that reflect conditions applied in various reference markets on receivables with similar characteristics, adjusted in order to take into account the credit risk of the counterparties.
Notes that are traded in active markets for which close or last trade pricing is available are classified within Level 1 of the fair value hierarchy. Notes for which such prices are not available are valued at the last available price or based on quotes received from independent pricing services or from dealers who trade in such securities and are categorized as Level 2. At December 31, 2018, €8,145 million and €7 million of notes were classified within Level 1 and Level 2, respectively. At December 31, 2017, €10,358 million and €7 million of notes were classified within Level 1 and Level 2, respectively.
The fair value of Other debt included in Level 2 of the fair value hierarchy has been estimated using discounted cash flow models. The main inputs used are year-end market interest rates, adjusted for market expectations of the Group’s non-performance risk implied in quoted prices of traded securities issued by the Group and existing credit derivatives on Group liabilities. The fair value of Other debt that requires significant adjustment using unobservable inputs is categorized within Level 3. At December 31, 2018, €5,241 million and €988 million of Other Debt was classified within Level 2 and Level 3, respectively. At December 31, 2017, €6,796 million and €1,205 million of Other Debt was classified within Level 2 and Level 3, respectively.

246 2018 | ANNUAL REPORT
Consolidated Financial Statements
Notes to the Consolidated Financial Statements
24. RELATED PARTY TRANSACTIONSIn accordance with IAS 24 - Related Party Disclosures, the related parties of the Group are determined as those entities and individuals capable of exercising control, joint control or significant influence over the Group and its subsidiaries. Related parties include companies belonging to Exor N.V. (the largest shareholder of FCA through its 28.98 percent common shares shareholding interest and 42.11 percent voting power at December 31, 2018), which include Ferrari N.V. and CNHI. Related parties also include associates, joint ventures and unconsolidated subsidiaries of the Group, members of the FCA Board of Directors, executives with strategic responsibilities and certain members of their families.
Transactions carried out by the Group with its related parties are on commercial terms that are normal in the respective markets, considering the characteristics of the goods or services involved, and primarily relate to:
the purchase of engines and engine components for Maserati vehicles from Ferrari N.V.;
transactions related to the display of FCA brand names on Ferrari N.V. Formula 1 cars;
the sale of vehicles to the leasing and renting subsidiaries of the joint ventures Koc Fiat Kredi and FCA Bank;
the sale of engines, other components and production systems to and the purchase of light commercial vehicles from the joint operation Sevel S.p.A. Refer to Note 31, Subsequent events for additional detail;
the sale of engines, other components and production systems to the companies of CNHI;
the purchase of vehicles from, the provision of services and the sale of goods to the joint operation Fiat India Automobiles Private Limited;
the provision of services and the sale of goods to the GAC FCA JV;
the provision of services (accounting, payroll, tax administration, information technology, purchasing and security) to the companies of CNHI;
the purchase of light commercial vehicles and passenger cars from the joint venture Tofas; and
the sale of automotive lighting and automotive components, which is included within discontinued operations, to Ferrari N.V.
The most significant financial transactions with related parties generated Receivables from financing activities of the Group’s financial services companies from joint ventures and Asset-backed financing relating to amounts due to FCA Bank for the sale of receivables, which do not qualify for derecognition under IFRS 9 – Financial Instruments.

2018 | ANNUAL REPORT 247
The amounts for significant transactions with related parties recognized in the Consolidated Income Statements were as follows:
Years ended December 31,
2018 2017 2016
Net Revenues
Cost of revenues
Selling, general
and othercosts,
net
Net Financial
expenses/(income)
Net Revenues
Cost of revenues
Selling, general
and othercosts,
net
Net Financial
expenses/(income)
Net Revenues
Cost of revenues
Selling, general
and othercosts,
net
Net Financial
expenses/(income)
(€ million)
Tofas € 926 € 2,572 € 7 € — € 1,287 € 2,779 € 9 € — € 1,536 € 2,811 € 3 € —
Sevel S.p.A. 402 1 4 — 392 — 5 — 381 — 5 —
FCA Bank 1,611 28 (21) 56 1,715 26 (20) 36 1,571 18 (21) 39
GAC FCA JV 419 11 (49) — 569 — (105) — 683 — (82) —Fiat India Automobiles Limited 2 — — — 25 1 — — 23 1 (1) (1)
Other 27 6 (4) 1 35 2 (4) 2 36 5 (3) —Total joint arrangements 3,387 2,618 (63) 57 4,023 2,808 (115) 38 4,230 2,835 (99) 38Total associates 30 229 (2) (1) 73 52 (3) (1) 91 47 — —CNHI 501 326 6 — 526 329 2 — 543 422 3 —
Ferrari N.V. 64 218 4 — 82 320 1 — 81 246 — —Directors and Key Management — — 77 — — — 114 — — — 143 —
Other 2 — 26 — 1 — 26 — — — 26 —Total CNHI, Ferrari, Directors and other 567 544 113 — 609 649 143 — 624 668 172 —Total unconsolidated subsidiaries 7 8 4 1 61 8 3 1 57 7 8 1Total transactions with related parties € 3,991 € 3,399 € 52 € 57 € 4,766 € 3,517 € 28 € 38 € 5,002 € 3,557 € 81 € 39
Total for the Group € 110,412 € 95,011 € 7,318 € 1,056 € 105,730 € 89,710 € 7,177 € 1,345 € 105,798 € 90,927 € 7,388 € 1,858

248 2018 | ANNUAL REPORT
Consolidated Financial Statements
Notes to the Consolidated Financial Statements
Assets and liabilities from significant transactions with related parties were as follows:
At December 31
2018 2017Trade and
other receivables
Trade payables
Other liabilities
Asset- backed
financing Debt(1)
Trade and other
receivablesTrade
payablesOther
liabilities
Asset- backed
financing Debt(1)
(€ million)
Tofas € 11 € 176 € 40 € — € — € 34 € 240 € 50 € — € —
Sevel S.p.A. 20 — 2 — 11 23 — 6 — 1
FCA Bank 395 258 232 449 28 466 206 199 319 32
GAC FCA JV 63 22 1 — — 58 15 1 — —Fiat India Automobiles Limited — — 6 — — 7 13 5 — —
Other 19 1 — — — 20 1 — — —Total joint arrangements 508 457 281 449 39 608 475 261 319 33Total associates 34 33 10 — — 36 32 13 — —
CNHI 53 71 12 — — 47 86 11 — —
Ferrari N.V. 25 45 3 — — 23 75 — — —
Other 2 2 — — — 1 2 — — —Total CNHI, Ferrari N.V. and other 80 118 15 — — 71 163 11 — —Total unconsolidated subsidiaries 17 7 1 — 26 83 8 1 — 28Total originating from related parties € 639 € 615 € 307 € 449 € 65 € 798 € 678 € 286 € 319 € 61
Total for the Group € 8,672 € 19,229 € 9,509 € 457 € 14,071 € 8,553 € 21,939 € 10,435 € 357 € 17,614(1) Relating to Debt excluding Asset-backed financing, refer to Note, 21 Debt.
Commitments and GuaranteesAs of December 31, 2018, the Group had a take-or-pay commitment with Tofas with future minimum expected obligations as follows:
(€ million)
2019 € 299
2020 € 291
2021 € 267
2022 € 152
2023 € —
2024 and thereafter € —
We provided guarantees to FCA Bank related to certain dealer financing arrangements FCA Bank has with dealers. The amount of the guarantees outstanding at December 31, 2018 was approximately €86 million. The fair value of these guarantees is immaterial due to the value of vehicles in the dealers’ stock pledged to FCA.

2018 | ANNUAL REPORT 249
Compensation to Directors and Key ManagementThe fees of the Directors of the Group for carrying out their respective functions, including those in other consolidated companies, were as follows:
Years ended December 31,
2018 2017 2016(€ thousand)
Directors(1) € 18,830 € 29,861 € 39,329
Total Compensation € 18,830 € 29,861 € 39,329(1) Including the notional compensation cost arising from long-term share-based compensation granted to the Chief Executive Officer and share-
based compensation to non-executive Directors.
Refer to Note 18, Share-based compensation, for information related to the special recognition award granted to the Chief Executive Officer on April 16, 2015 and the PSU and RSU awards granted to certain key employees.
The aggregate compensation expense for remaining executives with strategic responsibilities was approximately €58 million for 2018 (€81 million in 2017 and €103 million in 2016), which, in addition to base compensation, included:
approximately €28 million in 2018 (approximately €49 million in 2017 and approximately €73 million in 2016) for share-based compensation expense;
approximately €7 million in 2018 (approximately €8 million in 2017 and approximately €8 million in 2016) for short-term employee benefits; and
€10 million in 2018 (€9 million in 2017 and €6 million in 2016) for pension and similar benefits.
250 2018 | ANNUAL REPORT
Consolidated Financial Statements
Notes to the Consolidated Financial Statements
25. GUARANTEES GRANTED, COMMITMENTS AND CONTINGENT LIABILITIES
Guarantees grantedAt December 31, 2018, the Group had pledged guarantees on the debt or commitments of third parties totaling €7 million (€5 million at December 31, 2017), as well as guarantees of €3 million on related party debt (€4 million at December 31, 2017).
SCUSA Private-label financing agreementIn February 2013, FCA US entered into a private-label financing agreement (the “SCUSA Agreement”) with Santander Consumer USA Inc. (“SCUSA”), an affiliate of Banco Santander, which launched on May 1, 2013. Under the SCUSA Agreement, SCUSA provides a wide range of wholesale and retail financing services to FCA US’s dealers and consumers in accordance with its usual and customary lending standards, under the Chrysler Capital brand name.
The SCUSA Agreement has a ten-year term from February 2013, subject to early termination in certain circumstances, including the failure by a party to comply with certain of its ongoing obligations under the SCUSA Agreement. In accordance with the terms of the agreement, SCUSA provided an upfront, non-refundable payment of €109 million (U.S.$150 million) in May 2013, which was recognized as deferred revenue and is amortized over ten years. At December 31, 2018, €57 million (U.S.$65 million) remained in deferred revenue.
From time to time, FCA US works with certain lenders to subsidize interest rates or cash payments at the inception of a financing arrangement to incentivize customers to purchase its vehicles, a practice known as “subvention”. FCA US has provided SCUSA with limited exclusivity rights to participate in specified minimum percentages of certain of its retail financing rate subvention programs. SCUSA has committed to certain revenue sharing arrangements, as well as to consider future revenue sharing opportunities. SCUSA bears the risk of loss on loans contemplated by the SCUSA Agreement. The parties share in any residual gains and losses in respect of consumer leases, subject to specific provisions in the SCUSA Agreement, including limitations on FCA US participation in gains and losses.
Other repurchase obligationsIn accordance with the terms of other wholesale financing arrangements in Mexico, FCA Mexico is required to repurchase dealer inventory financed under these arrangements, upon certain triggering events and with certain exceptions, including in the event of an actual or constructive termination of a dealer’s franchise agreement. These obligations exclude certain vehicles including, but not limited to, vehicles that have been damaged or altered, that are missing equipment or that have excessive mileage or an original invoice date that is more than one year prior to the repurchase date. In December 2015, FCA Mexico entered into a ten-year private label financing agreement with FC Financial, S.A De C.V., Sofom, E.R., Grupo Financiaro Inbursa (“FC Financial”), a wholly owned subsidiary of Banco Inbursa, under which FC Financial provides a wide range of financial wholesale and retail financial services to FCA Mexico’s dealers and retail customers under the FCA Financial Mexico brand name. The wholesale repurchase obligation under the new agreement will be limited to wholesale purchases in case of actual or constructive termination of a dealer’s franchise agreement.
At December 31, 2018, the maximum potential amount of future payments required to be made in accordance with these wholesale financing arrangements was approximately €206 million (US$236 million) and was based on the aggregate repurchase value of eligible vehicles financed through such arrangements in the respective dealer’s stock. If vehicles are required to be repurchased through such arrangements, the total exposure would be reduced to the extent the vehicles can be resold to another dealer. The fair value of the guarantee was nil at December 31, 2018.

2018 | ANNUAL REPORT 251
Arrangements with key suppliersFrom time to time and in the ordinary course of our business, the Group enters into various arrangements with key third party suppliers in order to establish strategic and technological advantages. A limited number of these arrangements contain unconditional purchase obligations to purchase a fixed or minimum quantity of goods and/or services with fixed and determinable price provisions. Future minimum purchase obligations under these arrangements at December 31, 2018 were as follows for the Group’s continuing operations:
(€ million)
2019 € 804
2020 € 508
2021 € 349
2022 € 216
2023 € 32
2024 and thereafter € 42
Operating lease contractsThe Group has operating lease contracts for the right to use industrial buildings and equipment with an average term of 10-20 years and 3-5 years, respectively. The following table summarizes the total future minimum lease payments under non-cancellable lease contracts for the Group’s continuing operations:
At December 31, 2018
Due withinone year
Due between one and
three years
Due between
three and five years
Due beyond
five years Total(€ million)
Future minimum lease payments under operating lease agreements € 325 € 331 € 172 € 199 € 1,027
During 2018, the Group recognized lease payments expense of €423 million (€284 million in 2017 and €280 million in 2016).
Other commitments, arrangements and contractual rights
UAW Labor AgreementIn October 2015, FCA US and the UAW agreed to a four-year national collective bargaining agreement, which will expire in September 2019. The provisions of the new agreement continue certain opportunities for success-based compensation upon meeting certain quality and financial performance metrics. The agreement closes the pay gap between “Traditional” and “In-progression” employees over an eight-year period and will continue to provide UAW-represented employees with a simplified adjusted profit sharing plan. The adjusted profit sharing plan was effective for the 2016 plan year and is directly aligned with NAFTA profitability. The agreement included lump-sum payments in lieu of further wage increases of primarily U.S.$4,000 for “Traditional” employees and U.S.$3,000 for “In-progression” employees totaling approximately U.S.$141 million (€127 million) that was paid to UAW members on November 6, 2015. These payments are being amortized ratably over the four-year labor agreement period.

252 2018 | ANNUAL REPORT
Consolidated Financial Statements
Notes to the Consolidated Financial Statements
Italian labor agreementIn April 2015, a four-year compensation agreement was signed by FCA companies within the automobiles business in Italy. The compensation agreement was subsequently included into the labor agreement and was extended to all FCA companies in Italy on July 7, 2015.
The compensation arrangement was effective retrospectively from January 1, 2015 through December 31, 2018 and incentivized all employees toward achievement of the productivity, quality and profitability targets established in the 2015-2018 period of the 2014-2018 business plan developed in May 2014 by adding two variable additional elements to base pay:
an annual bonus, calculated on the basis of production efficiencies achieved and the plant’s World Class Manufacturing audit status; and
a component linked to achievement of the financial targets established in the 2015-2018 period of the 2014-2018 business plan for the EMEA region, including the activities of the premium brands Alfa Romeo and Maserati.
A total of €72 million, €105 million and €101 million related to the additional variable elements above was recorded as an expense included within Net profit from continuing operations for the years ended December 31, 2018, 2017 and 2016, respectively.
Negotiations for the renewal of this labor contract commenced on November 29, 2018. As of February 22, 2019, negotiations are ongoing.
Canada labor agreementFCA entered into a four-year labor agreement with Unifor in Canada that was ratified on October 16, 2016. The terms of this agreement provide a two percent wage increase in the first and fourth years of the agreement for employees hired prior to September 24, 2012 and will continue to close the pay gap for employees hired on or after September 24, 2012 by revising a ten-year progressive pay scale plan. The agreement includes a lump sum payment in lieu of further wage increases of 6,000 Canadian dollars (“CAD$”) per employee totaling approximately CAD$55 million (approximately €38 million) that was paid to Unifor members on November 4, 2016. These payments will be amortized ratably over the four-year labor agreement period. The agreement expires September 2020.
Contingent liabilitiesIn connection with significant asset divestitures carried out in prior years, the Group provided indemnities to purchasers with the maximum amount of potential liability under these contracts generally capped at a percentage of the purchase price. These liabilities refer principally to potential liabilities arising from possible breaches of representations and warranties provided in the contracts and, in certain instances, environmental or tax matters, generally for a limited period of time. Potential obligations with respect to these indemnities were approximately €160 million and a total of €50 million has been recognized within Provisions related to these obligations as of December 31, 2018 and 2017. The Group has provided certain other indemnifications that do not limit potential payment and as such, it was not possible to estimate the maximum amount of potential future payments that could result from claims made under these indemnities.
Takata airbag inflatorsWe are aware of putative class action lawsuits filed in March 2018 against FCA US in the U.S. District Courts for the Southern District of Florida and the Eastern District of Michigan, asserting claims under federal and state laws alleging economic loss due to Takata airbag inflators installed in certain of our vehicles. At this early stage, we are unable to reliably evaluate the likelihood that a loss will be incurred or estimate a range of possible loss.

2018 | ANNUAL REPORT 253
Rear Impact LitigationOn July 9, 2012, a lawsuit was filed against FCA US in the Superior Court of Decatur County, Georgia, U.S., with respect to a March 2012 fatality in a rear-impact collision involving a 1999 Jeep Grand Cherokee. Plaintiffs alleged that the manufacturer had acted in a reckless and wanton fashion when it designed and sold the vehicle due to the placement of the fuel tank behind the rear axle and had breached a duty to warn of the alleged danger. On April 2, 2015, a jury found in favor of the plaintiffs and the trial court entered a judgment against FCA US in the amount of U.S. $148.5 million (€141 million). On July 24, 2015, the Court issued a remittitur reducing the judgment against FCA US to U.S. $40 million (€38 million).
While FCA US respects the decision of the jury, the Company appealed the final judgment issued by the judge. FCA US believes the judgment was not supported by the evidence or the law. FCA US maintains that the 1999 Jeep Grand Cherokee is not defective, and its fuel system does not pose an unreasonable risk to motor vehicle safety. The vehicle met or exceeded all applicable Federal Motor Vehicle Safety Standards, including the standard governing fuel system integrity. Furthermore, FCA US has submitted extensive data to NHTSA validating that the vehicle performs as well as, or better than, peer vehicles in impact studies. During the trial, however, the judge did not permit FCA US to introduce for the jury’s consideration, all data previously provided to NHTSA along with other key evidence, demonstrating the vehicle’s fuel system is not defective.
On November 15, 2016, the Georgia Court of Appeals affirmed the Court’s verdict and judgment of U.S.$40 million (€38 million). On March 15, 2018, the Georgia Supreme Court affirmed the judgment of the Georgia Court of Appeals. FCA US declined to pursue further appeals and the final amount of the outstanding judgment, including accrued interest, did not materially exceed our existing provisions.
Emissions MattersOn January 10, 2019, we announced that FCA US reached final settlements on civil, environmental and consumer claims with the U.S. Environmental Protection Agency (“EPA”), U.S. Department of Justice, the California Air Resources Board, the State of California, 49 other States and U.S. Customs and Border Protection, for which we have accrued €748 million, of which approximately €350 million will be paid in civil penalties to resolve differences over diesel emissions requirements. We also announced that FCA US had reached settlements in connection with a putative class action on behalf of consumers in connection with which FCA US agreed to pay an average of $2,800 per vehicle for each eligible customer affected by the recall.
We remain subject to diesel emissions-related investigations by the U.S. Securities and Exchange Commission and the U.S. Department of Justice, Criminal Division. In addition, we remain subject to a number of related private lawsuits and the potential for additional claims by consumers who choose not to participate in the class action settlement.
We have also received inquiries from other regulatory authorities in a number of jurisdictions as they examine the on-road tailpipe emissions of several automakers’ vehicles and, when jurisdictionally appropriate, we continue to cooperate with these governmental agencies and authorities.
In Europe, we have been working with the Italian Ministry of Transport (“MIT”) and the Dutch Vehicle Regulator (“RDW”), the authorities that certified FCA diesel vehicles for sale in the European Union, and the UK Driver and Vehicle Standards Agency. We also initially responded to inquiries from the German authority, the Kraftfahrt-Bundesamt (“KBA”), regarding emissions test results for our vehicles, and we discussed the KBA reported test results, our emission control calibrations and the features of the vehicles in question. After these initial discussions, the MIT, which has sole authority for regulatory compliance of the vehicles it has certified, asserted its exclusive jurisdiction over the matters raised by the KBA, tested the vehicles, determined that the vehicles complied with applicable European regulations and informed the KBA of its determination. Thereafter, mediations have been held under European Commission (“EC”) rules, between the MIT and the German Ministry of Transport and Digital Infrastructure, which oversees the KBA, in an effort to resolve their differences. The mediation was concluded with no action being taken with respect to FCA. In May 2017, the EC announced its intention to open an infringement procedure against Italy regarding Italy’s alleged failure to respond to EC’s concerns regarding certain FCA emission control calibrations. The MIT has responded to the EC’s allegations by confirming that the vehicles’ approval process was correctly performed.

254 2018 | ANNUAL REPORT
Consolidated Financial Statements
Notes to the Consolidated Financial Statements
In addition, at the request of the French Consumer Protection Agency, the Juge d’Instruction du Tribunal de Grande Instance of Paris is investigating diesel vehicles of a number of automakers including FCA, regarding whether the sale of those vehicles violated French consumer protection laws. In December 2018, the Korean Ministry of Environment announced its determination that 2,428 FCA vehicles imported in Korea during 2015, 2016 and 2017 were not emissions compliant and that the vehicles with a subsequent update of the emission control calibrations voluntarily performed by FCA, although compliant, would have required re-homologation of the vehicles concerned.
The results of the unresolved inquiries and private litigation cannot be predicted at this time and these inquiries and litigation may lead to further enforcement actions, penalties or damage awards, any of which may have a material adverse effect on our business, results of operations and reputation. It is possible that the resolution of these matters may adversely affect our reputation with consumers, which may negatively impact demand for our vehicles and could have a material adverse effect on our business, financial condition and results of operations. At this stage, we are unable to evaluate the likelihood that a loss will be incurred with regard to the unresolved inquiries and private litigation or estimate a range of possible loss.
Safety Recall and Emissions-related Securities Class Action LawsuitOn September 11, 2015, a putative securities class action complaint was filed in the U.S. District Court for the Southern District of New York against us alleging material misstatements regarding our compliance with regulatory requirements and that we failed to timely disclose certain expenses relating to our vehicle recall campaigns. On October 5, 2016, the district court dismissed the claims relating to the disclosure of vehicle recall campaign expenses but ruled that claims regarding the alleged misstatements regarding regulatory requirements would be allowed to proceed. On February 17, 2017, the plaintiffs amended their complaint to allege material misstatements regarding emissions compliance. On November 13, 2017, the Court denied our motion to dismiss the emissions-related claims. On June 15, 2018, the Court certified a class of our stockholders in the case. On February 4, 2019, we entered into an agreement in principle to settle the litigation contingent on court approval and our insurers’ confirmation for an amount within the coverage limits of our applicable insurance policies. As such, any potential loss is not material to the Group.
U.S. Sales Reporting InvestigationsOn July 18, 2016, we confirmed that the U.S. Securities and Exchange Commission had commenced an investigation into our reporting of vehicle unit sales to end customers in the U.S. and that inquiries into similar issues have been received from the U.S. Department of Justice. These vehicle unit sales reports relate to unit sales volumes primarily by dealers to consumers while we generally recognize revenues based on shipments to dealers and other customers and not on vehicle unit sales to consumers. We continue to cooperate with these investigations; however their outcome is uncertain and cannot be predicted at this time. At this stage, we are unable to reliably evaluate the likelihood that a loss will be incurred or estimate a range of possible loss.
As previously reported, two putative securities class action lawsuits were filed against us in the U.S. District Court for the Eastern District of Michigan making allegations with regard to our reporting of vehicle unit sales to end consumers in the U.S. These lawsuits have been consolidated into a single action and on October 4, 2018, we entered into an agreement in principle to settle the consolidated litigation, subject to court approval, for an amount that is not material to the Group.
National Training CenterIn connection with an on-going government investigation into matters at the UAW-Chrysler National Training Center, the U.S. Department of Justice has brought charges against a number of individuals including former FCA US employees and individuals associated with the UAW for, among other things, tax fraud and conspiring to provide money or other things of value to a UAW officer and UAW employees while acting in the interests of FCA US, in violation of the Labor Management Relations (Taft-Hartley) Act. We continue to cooperate with this investigation. Several putative class action lawsuits have been filed against FCA US in U.S. federal court alleging harm to UAW workers as a result of these acts. Those actions have been dismissed at the trial court stage, but remain subject to appeal. At this stage, we are unable to reliably evaluate the likelihood that a loss will be incurred or estimate a range of possible loss.
2018 | ANNUAL REPORT 255
26. EQUITY
Share capitalAt December 31, 2018, the authorized share capital of FCA was forty million Euro (€40,000,000), divided into two billion (2,000,000,000) FCA common shares, nominal value of one Euro cent (€0.01) per share and two billion (2,000,000,000) special voting shares, nominal value of one Euro cent (€0.01) per share.
At December 31, 2018, fully paid-up share capital of FCA amounted to €19 million (€19 million at December 31, 2017) and consisted of 1,550,617,563 common shares and of 408,941,767 special voting shares, all with a par value of €0.01 each (1,540,089,690 common shares and 408,941,767 special voting shares, all with a par value of €0.01 each at December 31, 2017).
The following table summarizes the changes in the number of outstanding common shares and special voting shares of FCA during the year ended December 31, 2018:
Common SharesSpecial Voting
Shares Total
Balance at January 1, 2018 1,540,089,690 408,941,767 1,949,031,457
Shares issued to Key management 10,527,873 — 10,527,873
Balance at December 31, 2018 1,550,617,563 408,941,767 1,959,559,330
On October 29, 2014, the Board of Directors of FCA resolved to authorize the issuance of up to a maximum of 90,000,000 common shares under the equity incentive plan and the long-term incentive program which had been adopted before the closing of the Merger and under which equity awards can be granted to eligible individuals. Any issuance of shares during the period from 2014 to 2018 are subject to the satisfaction of certain performance/retention requirements and any issuances to directors are subject to FCA shareholders’ approval (refer to Note 18, Share-based compensation).
Mandatory Convertible SecuritiesOn December 15, 2016, each U.S.$100 notional amount of the Mandatory Convertible Securities that had been issued in December 2014 was converted to 8.3077 of FCA’s common shares based upon the average volume weighted average prices of FCA common shares on the New York Stock Exchange during the 20 consecutive trading day period beginning November 14, 2016 and ending on December 12, 2016 (inclusive), which resulted in the issuance of total of 238,846,375 FCA common shares.
Other reserves:Other reserves comprised the following:
a legal reserve of €12,831 million at December 31, 2018 (€11,594 million at December 31, 2017) determined in accordance to the Dutch law and primarily relating to development expenditures capitalized by subsidiaries and their earnings, subject to certain restrictions on distributions to FCA;
capital reserves of €5,920 million at December 31, 2018 (€5,817 million at December 31, 2017);
retained earnings, after the separation of the legal reserve, of positive €1,836 million (negative €333 million at December 31, 2017); and
profit attributable to owners of the parent of €3,608 million for the year ended December 31, 2018 (€3,491 million for the year ended December 31, 2017).
256 2018 | ANNUAL REPORT
Consolidated Financial Statements
Notes to the Consolidated Financial Statements
Other comprehensive incomeOther comprehensive income was as follows:
Years ended December 31,
2018 2017 2016(€ million)
Items that will not be reclassified to the Consolidated Income Statement in subsequent periods:
(Losses)/gains on remeasurement of defined benefit plans € 317 € (72) € 616Share of gains/(losses) on remeasurement of defined benefit plans for equity method investees — 2 (5)Gains/(losses) on equity instruments measured at fair value through other comprehensive income (4) 14 15
Items relating to discontinued operations 1 8 (32)
Total Items that will not be reclassified to the Consolidated Income Statement (B1) 314 (48) 594
Items that may be reclassified to the Consolidated Income Statement in subsequent periods:
Gains/(losses) on cash flow hedging instruments arising during the period 99 47 (25)Gains/(losses) on cash flow hedging instruments reclassified to the Consolidated Income Statement (108) 82 (215)
Total Gains/(losses) on cash flow hedging instruments (9) 129 (240)
Foreign exchange gains/(losses) 126 (1,982) 509Share of Other comprehensive income/(loss) for equity method investees arising during the period (77) (94) (97)Share of Other comprehensive income/(loss) for equity method investees reclassified to the Consolidated Income Statement (26) (27) (25)
Total Share of Other comprehensive (loss)/income for equity method investees (103) (121) (122)
Items relating to discontinued operations (91) 58 (60)
Total Items that may be reclassified to the Consolidated Income Statement (B2) (77) (1,916) 87
Total Other comprehensive income (B1)+(B2)=(B) 237 (1,964) 681
Tax effect (82) (30) (196)
Tax effect - discontinued operations 1 (1) 4
Total Other comprehensive income, net of tax € 156 € (1,995) € 489
Gains and losses arising from the remeasurement of defined benefit plans primarily include actuarial gains and losses arising during the period, the return on plan assets (net of interest income recognized in the Consolidated Income Statement) and any changes in the effect of the asset ceiling. These gains and losses are offset against the related defined benefit plan’s net liabilities or assets (Note 19, Employee benefits liabilities).
2018 | ANNUAL REPORT 257
The following table summarizes the tax effect relating to Other comprehensive income:
Years ended December 31,
2018 2017 2016
Pre-tax balance
Tax income/
(expense)Net
balancePre-tax
balance
Tax income/
(expense)Net
balancePre-tax
balance
Tax income/
(expense)Net
balance(€ million)
(Losses)/gains on remeasurement of defined benefit plans € 317 € (76) € 241 € (72) € (18) € (90) € 616 € (265) € 351Gains/(Losses) on cash flow hedging instruments (9) (6) (15) 129 (12) 117 (240) 69 (171)Gains/(losses) on equity instruments measured at fair value through other comprehensive income (4) — (4) 14 — 14 15 — 15Foreign exchange (losses)/gains 126 — 126 (1,982) — (1,982) 509 — 509Share of Other comprehensive income/(loss) for equity method investees (103) — (103) (119) — (119) (127) — (127)Items relating to discontinued operations (90) 1 (89) 66 (1) 65 (92) 4 (88)Total Other comprehensive income € 237 € (81) € 156 € (1,964) € (31) € (1,995) € 681 € (192) € 489
Policies and processes for managing capitalThe objectives identified by the Group for managing capital are to create value for shareholders as a whole, safeguard business continuity and support the growth of the Group. As a result, the Group endeavors to maintain an adequate level of capital that, at the same time, enables it to obtain a satisfactory economic return for its shareholders and guarantee economic access to external sources of funds, including by means of achieving an adequate credit rating.
The Group constantly monitors the ratio between debt and equity, particularly the level of net debt and the generation of cash from its industrial activities. In order to reach these objectives, the Group continues to aim for improvement in the profitability of its operations. Furthermore, the Group may sell part of its assets to reduce the level of its debt, while the Board of Directors may make proposals to FCA shareholders at a general meeting of FCA shareholders to reduce or increase share capital or, where permitted by law, to distribute reserves. The Group may also make purchases of treasury shares, without exceeding the limits authorized at a general meeting of FCA shareholders, under the same logic of creating value, compatible with the objectives of achieving financial equilibrium and an improvement in the Group’s rating.
The FCA Board intends to recommend to the upcoming Annual General Meeting of Shareholders an annual ordinary dividend distribution to holders of FCA common shares of €0.65 per common share (a total distribution of approximately €1 billion). The distribution, from the Company’s 2018 profits, will be subject to the approval by the Annual General Meeting of Shareholders, which is scheduled to be held on April 12, 2019.
If the dividend proposal is approved by shareholders, FCA common shares will be traded ex-dividend as of April 23, 2019 at the NYSE and the MTA. In compliance with the listing requirements of the NYSE and the MTA, the dividend record date will be April 24, 2019. The payment of the dividend is expected to be during May 2019.
No dividends have been declared or paid by FCA in the preceding five years. Proposed dividends on ordinary shares are not recognized as a liability as at December 31, 2018.

258 2018 | ANNUAL REPORT
Consolidated Financial Statements
Notes to the Consolidated Financial Statements
The FCA loyalty voting structureThe purpose of the loyalty voting structure is to reward long-term ownership of FCA common shares and to promote stability of the FCA shareholder base by granting long-term FCA shareholders with special voting shares to which one voting right is attached in addition to the one granted by each FCA common share that they hold. In connection with the Merger, FCA issued 408,941,767 special voting shares with a nominal value of €0.01 each to those eligible shareholders of Fiat who had elected to participate in the loyalty voting structure upon completion of the Merger in addition to FCA common shares. In addition, an FCA shareholder may, at any time, elect to participate in the loyalty voting structure by requesting that FCA register all or some of the number of FCA common shares held by such an FCA shareholder in the Loyalty Register. Only a minimal dividend accrues to the special voting shares, which is allocated to a separate special dividend reserve, and they shall not carry any entitlement to any other reserve of FCA. Having only immaterial economic entitlements, the special voting shares do not impact earnings per share.
27. EARNINGS PER SHARE
Basic earnings per shareThe basic earnings per share for the years ended December 31, 2018, 2017 and 2016 was determined by dividing the Net profit attributable to the equity holders of the parent by the weighted average number of shares outstanding during each period.
The following tables provide the amounts used in the calculation of basic earnings per share:
Years ended December 31,
2018 2017 2016
Net profit attributable to owners of the parent million € 3,608 € 3,491 € 1,803
Weighted average number of shares outstanding thousand 1,548,439 1,535,988 1,513,019
Basic earnings per share € € 2.33 € 2.27 € 1.19
Years ended December 31,
2018 2017 2016
Net profit from continuing operations attributable to owners of the parent million € 3,323 € 3,281 € 1,708
Weighted average number of shares outstanding thousand 1,548,439 1,535,988 1,513,019
Basic earnings per share from continuing operations € € 2.15 € 2.14 € 1.13
Years ended December 31,
2018 2017 2016
Net profit from discontinued operations attributable to owners of the parent million € 285 € 210 € 95
Weighted average number of shares outstanding thousand 1,548,439 1,535,988 1,513,019
Basic earnings per share from discontinued operations € € 0.18 € 0.14 € 0.06
Diluted earnings per shareIn order to calculate the diluted earnings per share, the weighted average number of shares outstanding was increased to take into consideration the theoretical effect of potential common shares that would be issued for the restricted and performance share units outstanding and unvested at December 31, 2018, 2017 and 2016 (Note 18, Share-based compensation), as determined using the treasury stock method.
For the year ended December 31, 2017, the theoretical effect that would arise if some of the PSU NI awards granted in 2015 and 2016 and some of the RSU awards granted in 2017 (refer to Note 18, Share-based compensation) were exercised was not taken into consideration in the calculation of diluted earnings per share as this would have had an anti-dilutive effect. There were no instruments excluded from the calculation of diluted earnings per share because of an anti-dilutive impact for the years ended December 31, 2018 and 2016.

2018 | ANNUAL REPORT 259
The following tables provide the amounts used in the calculation of diluted earnings per share:
Years ended December 31,
2018 2017 2016
Net profit attributable to owners of the parent million € 3,608 € 3,491 € 1,803
Weighted average number of shares outstanding thousand 1,548,439 1,535,988 1,513,019
Number of shares deployable for share-based compensation thousand 19,400 20,318 13,357
Weighted average number of shares outstanding for diluted earnings per share thousand 1,567,839 1,556,306 1,526,376
Diluted earnings per share € € 2.30 € 2.24 € 1.18
Years ended December 31,
2018 2017 2016
Net profit from continuing operations attributable to owners of the parent million € 3,323 € 3,281 € 1,708
Weighted average number of shares outstanding for diluted earnings per share thousand 1,567,839 1,556,306 1,526,376
Diluted earnings per share from continuing operations € € 2.12 € 2.11 € 1.12
Years ended December 31,
2018 2017 2016
Net profit from discontinued operations attributable to owners of the parent million € 285 € 210 € 95
Weighted average number of shares outstanding for diluted earnings per share thousand 1,567,839 1,556,306 1,526,376
Diluted earnings per share from discontinued operations € € 0.18 € 0.13 € 0.06

260 2018 | ANNUAL REPORT
Consolidated Financial Statements
Notes to the Consolidated Financial Statements
28. SEGMENT REPORTINGReportable segments reflect the operating segments of the Group that are regularly reviewed by the Chief Executive Officer (the “chief operating decision maker” as defined under IFRS 8 – Operating Segments) for making strategic decisions, allocating resources and assessing performance and that exceed the quantitative thresholds provided in IFRS 8, or whose information is considered useful for the users of the financial statements. The Group’s reportable segments include the four regional mass-market vehicle operating segments (NAFTA, LATAM, APAC and EMEA) and the Maserati global luxury brand operating segment, which are described as follows:
NAFTA designs, engineers, develops, manufactures and distributes vehicles. NAFTA mainly earns its revenues from the sale of vehicles under the Chrysler, Jeep, Dodge, Ram, Fiat and Alfa Romeo brand names and from sales of the related parts and accessories in the United States, Canada, Mexico and Caribbean islands.
LATAM designs, engineers, develops, manufactures and distributes vehicles. LATAM mainly earns its revenues from the sale of passenger cars and light commercial vehicles and related spare parts under the Fiat and Jeep brand names in South and Central America as well as from the distribution of the Chrysler, Dodge and Ram brand cars in the same region. In addition, the segment provides financial services to the dealer network in Brazil and to the dealer network and retail customers in Argentina.
APAC mainly earns its revenues from the distribution and sale of cars and related spare parts under the Abarth, Alfa Romeo, Chrysler, Dodge, Fiat and Jeep brands mostly in China, Japan, Australia, South Korea and India. These activities are carried out through both subsidiaries and joint ventures. In addition, the segment provides financial services to the dealer network and retail customers in China.
EMEA designs, engineers, develops, manufactures and distributes vehicles. EMEA mainly earns its revenues from the sale of passenger cars and light commercial vehicles under the Fiat, Alfa Romeo, Lancia, Abarth, Jeep and Fiat Professional brand names, the sale of the related spare parts in Europe, Middle East and Africa, and from the distribution of the Chrysler, Dodge and Ram brand vehicles in these areas. In addition, the segment provides financial services related to the sale of cars and light commercial vehicles in Europe, primarily through the FCA Bank joint venture and Fidis S.p.A., a fully owned captive finance company that is mainly involved in the factoring business.
Maserati designs, engineers, develops, manufactures and distributes vehicles. Maserati earns its revenues from the sale of luxury vehicles under the Maserati brand.
Transactions among the mass-market vehicle segments generally are presented on a “where-sold” basis, which reflects the profit/(loss) on the ultimate sale to third party customer within the segment. This presentation generally eliminates the effect of the legal entity transfer price within the segments. Revenues of the other segments, aside from the mass-market vehicle segments, are those directly generated by or attributable to the segment as the result of its usual business activities and include revenues from transactions with third parties as well as those arising from transactions with segments, recognized at normal market prices.
The results of our Magneti Marelli business were previously reported within the Components segment along with our industrial automation systems design and production business and our cast iron and aluminum components business. Following the classification of Magneti Marelli as a discontinued operation for the years ended December 31, 2018 and 2017 (refer to Note 3, Scope of consolidation), the remaining activities within Components segment are no longer considered a separate reportable segment as defined by IFRS 8 and are reported within “Other activities” below.
Other activities include the results of our industrial automation systems design and production business and our cast iron and aluminum components business, as well as the activities and businesses that are not operating segments under IFRS 8 – Operating Segments. In addition, Unallocated items and eliminations include consolidation adjustments, eliminations, as well as costs related to the launch of the Alfa Romeo Giulia platform which were not allocated to the mass-market vehicle segments due to the limited number of shipments. Financial income and expenses and income taxes are not attributable to the performance of the segments as they do not fall under the scope of their operational responsibilities.
Adjusted Earnings Before Interest and Taxes (“Adjusted EBIT”) is the measure used by the chief operating decision maker to assess performance, allocate resources to the Group’s operating segments and to view operating trends, perform analytical comparisons and benchmark performance between periods and among the segments. Adjusted EBIT excludes certain adjustments from Net profit from continuing operations including gains/(losses) on the disposal of investments,

2018 | ANNUAL REPORT 261
restructuring, impairments, asset write-offs and unusual income/(expenses) that are considered rare or discrete events that are infrequent in nature, and also excludes Net financial expenses and Tax expense/(benefit). See below for a reconciliation of Net profit from continuing operations, which is the most directly comparable measure included in our Consolidated Income Statement, to Adjusted EBIT. Operating assets are not included in the data reviewed by the chief operating decision maker, and as a result and as permitted by IFRS 8 – Operating Segments, the related information is not provided.
The following tables summarize selected financial information by segment for the years ended December 31, 2018, 2017 and 2016:
Mass-Market Vehicles
MaseratiOther
activities
Unallocated items &
eliminations FCA2018 NAFTA LATAM APAC EMEA(€ million)
Revenues € 72,384 € 8,152 € 2,703 € 22,815 € 2,663 € 2,888 € (1,193) € 110,412
Revenues from transactions with other segments (31) (10) (57) (101) (18) (976) 1,193 —Revenues from third party customers € 72,353 € 8,142 € 2,646 € 22,714 € 2,645 € 1,912 € — € 110,412
Net profit from continuing operations € 3,330Tax expense € 778
Net financial expenses € 1,056
Adjustments:Charge for U.S. diesel emission matters(1) € — € — € — € — € — € — € 748 € 748Impairment expense and supplier obligations(2) € 16 € 8 € 11 € 307 € — € — € 11 € 353
China inventory impairment(3) € — € — € 129 € — € — € — € — € 129
Costs for recall, net of recovery - airbag inflators(4) € 114 € — € — € — € — € — € — € 114
U.S. special bonus payment(5) € 109 € — € — € — € — € 2 € — € 111
Restructuring costs, net of reversals(6) € — € (28) € — € 123 € — € 8 € — € 103Employee benefits settlement losses(7) € 92 € — € — € — € — € — € — € 92Port of Savona (Italy) fire and flood(8) € — € — € — € 2 € 11 € 30 € — € 43(Recovery of)/costs for recall - contested with supplier(9) € (50) € — € — € — € — € — € — € (50)
NAFTA capacity realignment(10) € (60) € — € — € — € — € — € — € (60)
Brazil indirect tax - reversal of liability/recognition of credits(11) € — € (54) € — € — € — € (18) € — € (72)
Other € 1 € — € — € 30 € — € 12 € 20 € 63
Adjusted EBIT € 6,230 € 359 € (296) € 406 € 151 € (40) € (72) € 6,738
Share of profit of equity method investees € — € — € (67) € 284 € — € 22 € 1 € 240(1) A provision of €748 million was recognized for costs related to final settlements reached on civil, environmental and consumer claims related
to U.S. diesel emissions matters. Refer to Note 25, Guarantees granted, commitments and contingent liabilities;(2) Impairment expense of €297 million and supplier obligations of €56 million, primarily in EMEA, resulting from changes in product plans in
connection with the 2018-2022 business plan;(3) Impairment of inventory in connection with acceleration of new emissions standards in China and slower than expected sales. Refer to Note
14, Inventories;(4) Accrual in relation to costs for recall campaigns related to Takata airbag inflators, net of recovery;(5) Special bonus payment of $2,000 to approximately 60,000 employees in NAFTA as a result of the U.S. Tax Cuts and Jobs Act;(6) Restructuring costs primarily consisting of €123 million in EMEA, partially offset by the reversal of €28 million of previously recorded restructuring
costs in LATAM;(7) Charges arising on settlement of a portion of a supplemental retirement plan and an annuity buyout in NAFTA. Refer to Note 19, Employee
benefits liabilities;(8) Costs in relation to the Port of Savona (Italy) flood and fire;(9) Recovery of amounts accrued in 2016 in relation to costs for recall contested with a supplier;(10) Reduction of costs in relation to the NAFTA capacity realignment which were accrued in 2015;(11) Credits recognized related to indirect taxes in Brazil.
262 2018 | ANNUAL REPORT
Consolidated Financial Statements
Notes to the Consolidated Financial Statements
Mass-Market Vehicles
MaseratiOther
activities
Unallocated items &
eliminations FCA2017 NAFTA LATAM APAC EMEA
(€ million)
Revenues € 66,094 € 8,004 € 3,250 € 22,700 € 4,058 € 3,248 € (1,624) € 105,730Revenues from transactions with other segments (47) (10) (32) (116) (21) (1,398) 1,624 —Revenues from third party customers € 66,047 € 7,994 € 3,218 € 22,584 € 4,037 € 1,850 € — € 105,730
Net profit from continuing operations € 3,291Tax expense € 2,588
Net financial expenses € 1,345
Adjustments:Reversal of a Brazilian indirect tax liability(1) € — € — € — € — € — € — € — € (895)
Impairment expense(2) € — € 77 € — € 142 € — € — € — € 219Recall campaigns - airbag inflators(3) € 29 € 73 € — € — € — € — € — € 102
Restructuring costs/(reversal)(4) € (1) € 75 € — € — € — € 11 € 1 € 86Deconsolidation of Venezuela(5) € — € 42 € — € — € — € — € — € 42NAFTA capacity realignment(6) € (38) € — € — € — € — € — € — € (38)Tianjin (China) port explosion, net of insurance recoveries(7) € — € — € (68) € — € — € — € — € (68)Gain on disposal of investments(8) € — € — € — € — € — € (27) € (49) € (76)
Other € (1) € — € 1 € — € — € 12 € 1 € 13
Adjusted EBIT € 5,227 € 151 € 172 € 735 € 560 € (98) € (138) € 6,609
Share of profit of equity method investees € — € — € 75 € 306 € — € 18 € 1 € 400(1) As this liability related to the Group’s Brazilian operations in multiple segments, it was not attributed to the results of the related segments;(2) Impairment expense in EMEA relates to changes in global product portfolio. Impairment expense in LATAM relates to product portfolio changes
and the impairment of certain real estate assets in Venezuela, in the second quarter of 2017 due to the continued deterioration of the economic conditions;
(3) Refer to Note 20, Provisions and Note 25, Guarantees granted, commitments and contingent liabilities;(4) Primarily related to workforce restructuring costs related to LATAM;(5) Refer to Note 3, Scope of consolidation;(6) Income related to adjustments to reserves for the NAFTA capacity realignment plan;(7) Insurance recoveries related to losses incurred in connection with the explosions at the Port of Tianjin (China) in August 2015 are excluded from
Adjusted EBIT to the extent the insured loss to which the recovery relates was excluded from Adjusted EBIT. Insurance recoveries are included in Adjusted EBIT to the extent they relate to costs, increased incentives or business interruption losses that were included in Adjusted EBIT;
(8) Refer to Note 3, Scope of consolidation.

2018 | ANNUAL REPORT 263
Mass-Market Vehicles
MaseratiOther
activities
Unallocated items &
eliminations FCA2016 NAFTA LATAM APAC EMEA(€ million)
Revenues € 69,094 € 6,197 € 3,662 € 21,860 € 3,479 € 3,116 € (1,610) € 105,798Revenues from transactions with other segments (40) (39) (24) (127) (9) (1,371) 1,610 —Revenues from third party customers € 69,054 € 6,158 € 3,638 € 21,733 € 3,470 € 1,745 € — € 105,798
Net profit from continuing operations € 1,713Tax expense € 1,237
Net financial expenses € 1,858
Adjustments:Recall campaigns - airbag inflators(1) € 414 € — € — € — € — € — € — € 414Costs for recall, net of supplier recoveries - contested with supplier(2) € 132 € — € — € — € — € — € — € 132
NAFTA capacity realignment(3) € 156 € — € — € — € — € — € — € 156Tianjin (China) port explosions, net of insurance recoveries(4) € — € — € (55) € — € — € — € — € (55)
Currency devaluation € — € 19 € — € — € — € — € — € 19
Restructuring costs/(reversal)(5) € (10) € 68 € — € 5 € — € 5 € — € 68
Impairment expense(6) € — € 52 € 109 € 7 € — € 9 € — € 177Gains on disposal of investments € — € — € — € — € — € (13) € — € (13)
Other € (25) € 3 € (10) € — € — € (1) € 7 € (26)
Adjusted EBIT € 5,133 € 5 € 105 € 540 € 339 € (175) € (267) € 5,680
Share of profit of equity method investees € 2 € — € 30 € 272 € — € 3 € 1 € 308(1) Refer to Note 20, Provisions and Note 25, Guarantees granted, commitments and contingent liabilities.;(2) Refer to Note 20, Provisions.;(3) Refer to Note 5, Research and development costs and Note 11, Property plant and equipment;(4) Insurance recoveries related to losses incurred in connection with the explosions at the Port of Tianjin (China) in August 2015 are excluded
from Adjusted EBIT to the extent the insured loss to which the recovery relates was excluded from Adjusted EBIT. Insurance recoveries are included in Adjusted EBIT to the extent they relate to costs, increased incentives or business interruption losses that were included in Adjusted EBIT. Through December 31, 2016, no significant insurance recoveries related to Tianjin have been recognized in Adjusted EBIT;
(5) Restructuring costs within LATAM and Components primarily relate to cost reduction initiatives to right-size to market volume in Brazil;(6) Refer to Note 5, Research and development costs. and Note 11, Property plant and equipment.
Information about geographical areaThe following table summarizes the non-current assets (other than financial instruments, deferred tax assets and post-employment benefits assets) attributed to certain geographic areas:
At December 31
2018 2017(€ million)
North America € 35,493 € 34,099
Italy 11,478 12,458
Brazil 4,125 5,137
Poland 937 1,151
Serbia 571 639
Other countries 1,456 2,536Total Non-current assets (other than financial instruments, deferred tax assets and post-employment benefits assets) € 54,060 € 56,020

264 2018 | ANNUAL REPORT
Consolidated Financial Statements
Notes to the Consolidated Financial Statements
29. EXPLANATORY NOTES TO THE CONSOLIDATED STATEMENT OF CASH FLOWS
Non-cash itemsFor the year ended December 31, 2018, Other non-cash items of €129 million primarily included €297 million of impairments, partially offset by €240 million related to the revaluation of investments accounted for by using the equity method and other amounts that were not individually material.
For the year ended December 31, 2017, Other non-cash items of €(197) million primarily included €400 million related to the revaluation of investments accounted for by using the equity method, partially offset by €219 million of impairments and other amounts that were not individually material.
For the year ended December 31, 2016, Other non-cash items of €87 million primarily included €177 million of impairments, which were partially offset by other amounts that were not individually material.
Operating activitiesFor the year ended December 31, 2018, net cash from operating activities of €9,948 million was primarily the result of: (i) net profit from continuing operations of €3,330 million adjusted to add back €5,507 million for depreciation and amortization expense; in addition to (ii) a net increase of €913 million in provisions primarily due to a provision of €748 million recognized for costs related to final settlements reached on civil, environmental and consumer claims related to U.S. diesel emissions matters; (iii) an increase of €457 million in net deferred tax assets, mainly due to increased deferred tax liabilities in NAFTA; and (iv) cash flow from operating activities of discontinued operations for €484 million. These positive impacts were partially offset by negative effect of the change in working capital of €1,106 million primarily driven by (a) decrease in trade payables of €1,240 million related to lower production volumes in EMEA in December 2018 compared to the same month in 2017 in addition to lower capital expenditure, (b) decrease in other payables net of receivables of €1,284 million mainly as a result of higher indirect tax receivable in LATAM, decreased income tax payable in NAFTA and lower advances from customers in LATAM and EMEA, and (c) decrease in inventories of €1,399 million due to inventory management actions across all the regions.
For the year ended December 31, 2017 the €1,596 million increase in inventories related to ramp-up of new models at year end, including the all-new Alfa Romeo Stelvio and the new Jeep Wrangler, as well as volume increases in LATAM and Maserati. The increase in trade payables of €937 million primarily related to increased production volumes in NAFTA and LATAM in the fourth quarter of 2017 as compared to the same period in 2016.
For the year ended December 31, 2016, the net increase of €1,453 million in provisions was mainly due to the increase in the warranty provision of €414 million in NAFTA for recall campaigns related to an industry wide recall for airbag inflators resulting from parts manufactured by Takata, an increase in accrued sales incentives primarily related to NAFTA and EMEA, as well as estimated net costs of €132 million associated with a recall for which costs are being contested with a supplier. In addition, the €494 million increase in inventories primarily related to the increased production of new vehicle models in EMEA and the €729 million increase in trade payables mainly related to increased production levels in EMEA, which was partially offset by reduced activity in LATAM and the effect of localized Jeep production in China. Furthermore, the change in other payables and receivables of 280 million primarily reflected the net payment of taxes and deferred expenses.
Financing activitiesFor the year ended December 31, 2018, net cash used in financing activities of €2,785 million was primarily the result of; (i) the voluntary prepayment in November 2018 of the outstanding principal and accrued interest of U.S. $1,009 million (€893 million) of FCA US’s tranche B term loan maturing December 31, 2018 (the “Tranche B Term Loan due 2018”); and (ii) the repayment at maturity of two notes under the Medium Term Note Programme (“MTN Programme”, previously referred to as the Global Medium Term Note Programme, or “GMTN” Programme), one with a principal amount of €1,250 million and one with a principal amount of €600 million.

2018 | ANNUAL REPORT 265
For the year ended December 31, 2017, net cash used in financing activities was primarily the result of: (i) the voluntary prepayment in February 2017 of the outstanding principal and accrued interest of U.S.$1,826 million (€1,721 million) of FCA US’s Tranche B Term Loan due 2017; (ii) the repayment of three notes at maturity under the MTN Programme, one with a principal amount of €850 million, one with a principal amount of €1,000 million and one with a principal amount of CHF450 million (€385 million), as described in Note 21, Debt; and (iii) the repayment of other long-term debt, net of proceeds, of a principal amount of €889 million.
For the year ended December 31, 2016, net cash used in financing activities was primarily the result of the (i) the repayment at maturity of three notes issued under the MTN Programme, two of which were for an aggregate principal amount of €2,000 million and one for a principal amount of CHF 400 million (€373 million) as described in Note 21, Debt and (ii) the repayment of other long-term debt for a total of €4,605 million, which included (a) the voluntary prepayments of principal of the FCA US Tranche B Term Loans of U.S.$2.0 billion (€1.8 billion) as described in Note 21, Debt, (b) the payment of the financial liability related to the Mandatory Convertible Securities of €213 million upon their conversion to FCA shares and (c) repayments at maturity of other long-term debt of €2,605 million primarily in Brazil, which were partially offset by (iii) the issuance of a new note under the MTN Programme for a principal amount of €1,250 million and (iv) proceeds from other long-term debt for a total of €1,309 million, which included the proceeds from the €250 million loan entered into with the EIB in December 2016 as described in Note 21, Debt.
The following is a reconciliation of liabilities arising from financing activities for the year ended December 31, 2018 and 2017:
Years ended December 31
2018 2017(€ million)
Total Debt at January 1 € 17,971 € 24,048
Derivative (assets)/liabilities and collateral at January 1 (206) 150
Total Liabilities from financing activities at January 1 € 17,765 € 24,198
Cash flows € (2,795) € (4,470)
Foreign exchange effects € (226) € (1,311)
Fair value changes € (136) € (286)
Changes in scope of consolidation € (3) € (83)
Transfer to (Assets)/Liabilities held for sale € (177) € —
Other changes € (51) € (283)
Total Liabilities from financing activities at December 31 € 14,377 € 17,765
Derivative (assets)/liabilities and collateral at December 31 (151) (206)
Total Debt at December 31 € 14,528 € 17,971
Interest expense and taxes paidDuring the years ended December 31, 2018, 2017 and 2016, the Group paid interest of €1,024 million and received interest of €308 million, €1,190 million and €299 million, and €1,676 million and €370 million, respectively. Amounts indicated are also inclusive of interest rate differentials paid or received on interest rate derivatives.
During the years ended December 31, 2018, 2017 and 2016, the Group made income tax payments, net of refunds, totaling €750 million, €533 million and €622 million, respectively.

266 2018 | ANNUAL REPORT
Consolidated Financial Statements
Notes to the Consolidated Financial Statements
30. QUALITATIVE AND QUANTITATIVE INFORMATION ON FINANCIAL RISKSThe Group is exposed to the following financial risks connected with its operations:
credit risk, principally arising from its normal commercial relations with final customers and dealers, and its financing activities;
liquidity risk, with particular reference to the availability of funds and access to the credit market and to financial instruments in general;
financial market risk (principally relating to exchange rates, interest rates and commodity prices), since the Group operates at an international level in different currencies and uses financial instruments which generate interest. The Group is also exposed to the risk of changes in the price of certain commodities and of certain listed shares.
These risks could significantly affect the Group’s financial position and results and for this reason, the Group systematically identifies and monitors these risks in order to detect potential negative effects in advance and take the necessary action to mitigate them, primarily through its operating and financing activities and if required, through the use of derivative financial instruments in accordance with established risk management policies.
Financial instruments held by the funds that manage pension plan assets are not included in this analysis (refer to Note 19, Employee benefits liabilities).
The following section provides qualitative and quantitative disclosures on the effect that these risks may have upon the Group. The quantitative data reported in the following does not have any predictive value, in particular the sensitivity analysis on finance market risks does not reflect the complexity of the market or the reaction which may result from any changes that are assumed to take place.
Credit riskOverall, the credit risk regarding the Group’s trade receivables and receivables from financing activities is concentrated mainly in NAFTA, EMEA and LATAM.
The maximum credit risk to which the Group is potentially exposed at December 31, 2018 is represented by the carrying amounts of financial assets in the financial statements as discussed in Note 15, Trade, other receivables and tax receivables and the nominal value of the guarantees provided on liabilities and commitments to third parties as discussed in Note 25, Guarantees granted, commitments and contingent liabilities.
The Group’s exposure to credit risk is influenced mainly by the individual characteristics of each counterparty. The Group monitors these exposures and establishes credit lines with single or homogeneous categories of counterparties.
Dealers and final customers for which the Group provides financing are subject to specific assessments of their creditworthiness under a detailed scoring system. To mitigate this risk, the Group could obtain financial and non-financial guarantees. These guarantees are further strengthened where possible by reserve of title clauses on financed vehicle sales to the sales network made by Group financial service companies and on vehicles assigned under finance and operating lease agreements.
Receivables from financing activities amounting to €3,140 million at December 31, 2017, contained balances totaling €5 million, which have been written down on an individual basis. Of the remainder, balances totaling €46 million were past due by up to one month, while balances totaling €21 million were past due by more than one month. In the event of installment payments, even if only one installment is overdue, the entire receivable balance is classified as overdue.
Trade receivables and other receivables amounting to €5,413 million at December 31, 2017 contained balances totaling €15 million, which have been written down on an individual basis. Of the remainder, balances totaling €271 million were past due by up to one month, while balances totaling €233 million were past due by more than one month.
For further information regarding the exposure to credit risk and ECLs of Trade receivables, other receivables and financial receivables at December 31, 2018, refer to Note 15, Trade, other receivables and tax receivables.
Even though our current securities and Cash and cash equivalents consist of balances spread across various primary national and international banking institutions and money market funds that are measured at fair value, there was no exposure to sovereign debt securities at December 31, 2018 which might lead to significant risk of repayment.

2018 | ANNUAL REPORT 267
Liquidity riskLiquidity risk is the risk the Group is unable to obtain the funds needed to carry out its operations and meet its
obligations. Any actual or perceived limitations on the Group’s liquidity may affect the ability of counterparties to do business with the Group or may require additional amounts of cash and cash equivalents to be allocated as collateral for outstanding obligations.
The continuation of challenging economic conditions in the markets in which the Group operates and the uncertainties that characterize the financial markets, necessitate special attention to the management of liquidity risk. In that sense, measures taken to generate funds through operations and to maintain a conservative level of available liquidity are important factors for ensuring operational flexibility and addressing strategic challenges over the next few years.
The main factors that determine the Group’s liquidity situation are the funds generated by or used in operating and investing activities, the debt lending period and its renewal features or the liquidity of the funds employed and market terms and conditions.
The Group has adopted a series of policies and procedures whose purpose is to optimize the management of funds and to reduce liquidity risk as follows:
centralizing the management of receipts and payments where it may be economical in the context of the local civil, currency and fiscal regulations of the countries in which the Group is present;
maintaining a conservative level of available liquidity;
diversifying the means by which funds are obtained and maintaining a continuous and active presence in the capital markets;
obtaining adequate credit lines; and
monitoring future liquidity on the basis of business planning.
The Group manages liquidity risk by monitoring cash flows and keeping an adequate level of funds at its disposal. The operating cash management and liquidity investment of the Group are centrally coordinated in the Group’s treasury companies, with the objective of ensuring effective and efficient management of the Group’s funds. These companies obtain funds in the financial markets from various funding sources.
Certain notes issued by FCA and its treasury subsidiaries include covenants which may be affected by circumstances related to certain subsidiaries; in particular, there are cross-default clauses which may accelerate repayments in the event that such subsidiaries fail to pay certain of their debt obligations.
Details of the repayment structure of the Group’s financial assets and liabilities are provided in Note 15, Trade, other receivables and tax receivables, Note 22, Other liabilities and Tax payables and in Note 21, Debt. Details of the repayment structure of derivative financial instruments are provided in Note 16, Derivative financial assets and liabilities.
The Group believes that the Group’s total available liquidity, in addition to the funds that will be generated from operating and financing activities, will enable the Group to satisfy the requirements of its investing activities and working capital needs, fulfill its obligations to repay its debt at the natural due dates and ensure an appropriate level of operating and strategic flexibility.
Financial market risksDue to the nature of our business, the Group is exposed to a variety of market risks, including foreign currency exchange rate risk, interest rate risk and commodity price risk.
The Group’s exposure to foreign currency exchange rate risk arises both in connection with the geographical distribution of the Group’s industrial activities compared to the markets in which it sells its products, and in relation to the use of external borrowing denominated in foreign currencies.
The Group’s exposure to interest rate risk arises from the need to fund industrial and financial operating activities and the necessity to deploy surplus funds. Changes in market interest rates may have the effect of either increasing or decreasing the Group’s Net profit, thereby indirectly affecting the costs and returns of financing and investing transactions.

268 2018 | ANNUAL REPORT
Consolidated Financial Statements
Notes to the Consolidated Financial Statements
The Group’s exposure to commodity price risk arises from the risk of changes in the price of certain raw materials and energy used in production. Changes in the price of raw materials could have a significant effect on the Group’s results by indirectly affecting costs and product margins.
These risks could significantly affect the Group’s financial position and results and for this reason, these risks are systematically identified and monitored, in order to detect potential negative effects in advance and take the necessary actions to mitigate them, primarily through its operating and financing activities and if required, through the use of derivative financial instruments in accordance with its established risk management policies.
The Group’s policy permits derivatives to be used only for managing the exposure to fluctuations in foreign currency exchange rates and interest rates as well as commodities prices connected with future cash flows and assets and liabilities, and not for speculative purposes.
The Group utilizes derivative financial instruments designated as fair value hedges mainly to hedge:
the foreign currency exchange rate risk on financial instruments denominated in foreign currency; and
the interest rate risk on fixed rate loans and borrowings.
The instruments used for these hedges are mainly foreign currency forward contracts, interest rate swaps and combined interest rate and foreign currency financial instruments.
The Group uses derivative financial instruments as cash flow hedges for the purpose of pre-determining:
the exchange rate at which forecasted transactions denominated in foreign currencies will be accounted for;
the interest paid on borrowings, both to match the fixed interest received on loans (customer financing activity), and to achieve a targeted mix of floating versus fixed rate funding structured loans; and
the price of certain commodities.
The foreign currency exchange rate exposure on forecasted commercial flows is hedged by foreign currency swaps and forward contracts. Interest rate exposures are usually hedged by interest rate swaps and, in limited cases, by forward rate agreements. Exposure to changes in the price of commodities is generally hedged by using commodity swaps and commodity options. In addition, in order to manage the Group’s foreign currency risk related to its investments in foreign operation, the Group enters into net investment hedges, in particular foreign currency swaps and forward contracts. Counterparties to these agreements are major financial institutions.
Information on the fair value of derivative financial instruments held at the balance sheet date is provided in Note 16, Derivative financial assets and liabilities.

2018 | ANNUAL REPORT 269
Quantitative information on foreign currency exchange rate riskThe Group is exposed to risk resulting from changes in foreign currency exchange rates, which can affect its earnings and equity. In particular:
where a Group company incurs costs in a currency different from that of its revenues, any change in exchange rates can affect the operating results of that company.
the principal exchange rates to which the Group is exposed are:
EUR/U.S.$, relating to sales and purchases in U.S.$ made by Italian companies (primarily for Maserati and Alfa Romeo vehicles) and to sales and purchases in Euro made by FCA US;
U.S.$/CAD, primarily relating to FCA Canada’s sales of U.S. produced vehicles, net of FCA US sales of Canadian produced vehicles;
CNY, in relation to sales in China originating from FCA US and from Italian companies (primarily for Maserati and Alfa Romeo vehicles);
GBP, AUD, MXN, CHF, and ARS in relation to sales in the UK, Australian, Mexican, Swiss and Argentinian markets;
PLN and TRY, relating to manufacturing costs incurred in Poland and Turkey;
JPY mainly in relation to purchase of parts from Japanese suppliers and sales of vehicles in Japan; and
U.S.$/BRL, EUR/BRL, relating to Brazilian manufacturing operations and the related import and export flows.
The Group’s policy is to use derivative financial instruments to hedge a percentage of certain exposures subject to foreign currency exchange rate risk for the upcoming 12 months (including such risk before or beyond that date where it is deemed appropriate in relation to the characteristics of the business) and to hedge the exposure resulting from firm commitments unless not deemed appropriate.
Group companies may have trade receivables or payables denominated in a currency different from their respective functional currency. In addition, in a limited number of cases, it may be convenient from an economic point of view, or it may be required under local market conditions, for Group companies to obtain financing or use funds in a currency different from their respective functional currency. Changes in exchange rates may result in exchange gains or losses arising from these situations. The Group’s policy is to hedge, whenever deemed appropriate, the exposure resulting from receivables, payables and securities denominated in foreign currencies different from the respective Group companies’ functional currency.
Certain of the Group’s companies are located in countries which are outside of the Eurozone, in particular the U.S., Brazil, Canada, Poland, Serbia, Turkey, Mexico, Argentina, the Czech Republic, India, China, Australia and South Africa. As the Group’s reporting currency is the Euro, the income statements of those entities that have a reporting currency other than the Euro are translated into Euro using the average exchange rate for the period. In addition, the assets and liabilities of these consolidated companies are translated into Euro at the period-end foreign exchange rate. The effects of these changes in foreign exchange rates are recognized directly in the Cumulative translation adjustments reserve included in Other comprehensive income. Changes in exchange rates may lead to effects on the translated balances of revenues, costs and assets and liabilities reported in Euro, even when corresponding items are unchanged in the respective local currency of these companies.
The Group monitors its principal exposure to conversion exchange risk and, in certain circumstances, enters into derivatives for the purpose of hedging the specific risk.
There have been no substantial changes in 2018 in the nature or structure of exposure to foreign currency exchange rate risk or in the Group’s hedging policies.
The potential loss in fair value of derivative financial instruments held for foreign currency exchange rate risk management (currency swaps/forwards) at December 31, 2018 resulting from a 10 percent change in the exchange rates would have been approximately €704 million (€1,010 million at December 31, 2017).

270 2018 | ANNUAL REPORT
Consolidated Financial Statements
Notes to the Consolidated Financial Statements
This analysis assumes that a hypothetical, unfavorable 10 percent change in exchange rates as at year-end is applied in the measurement of the fair value of derivative financial instruments. Receivables, payables and future trade flows whose hedging transactions have been analyzed were not included in this analysis. It is reasonable to assume that changes in market exchange rates will produce the opposite effect, of an equal or greater amount, on the underlying transactions that have been hedged.
Quantitative information on interest rate riskThe manufacturing companies and treasuries of the Group make use of external borrowings and invest in monetary and financial market instruments. In addition, Group companies sell receivables resulting from their trading activities on a continuing basis. Changes in market interest rates can affect the cost of the various forms of financing, including the sale of receivables, or the return on investments and the employment of funds, thus negatively impacting the net financial expenses incurred by the Group.
In addition, the financial services companies provide loans (mainly to customers and dealers), financing themselves using various forms of direct debt or asset-backed financing (e.g. factoring of receivables). Where the characteristics of the variability of the interest rate applied to loans granted differ from those of the variability of the cost of the financing obtained, changes in the current level of interest rates can affect the operating result of those companies and the Group as a whole.
In order to manage these risks, the Group uses interest rate derivative financial instruments, mainly interest rate swaps and forward rate agreements, when available in the market, with the objective of mitigating, under economically acceptable conditions, the potential variability of interest rates on the Group’s Net profit.
In assessing the potential impact of changes in interest rates, the Group segregates fixed rate financial instruments (for which the impact is assessed in terms of fair value) from floating rate financial instruments (for which the impact is assessed in terms of cash flows).
The fixed rate financial instruments used by the Group consist principally of part of the portfolio of the financial services companies (principally customer financing and financial leases) and part of debt (including subsidized loans and notes).
The potential loss in fair value of fixed rate financial instruments (including the effect of interest rate derivative financial instruments) held at December 31, 2018, resulting from a hypothetical 10 percent change in market interest rates, would have been approximately €83 million (approximately €71 million at December 31, 2017).
Floating rate financial instruments consist principally of cash and cash equivalents, loans provided by the financial services companies to the sales network and part of debt. The effect of the sale of receivables is also considered in the sensitivity analysis as well as the effect of hedging derivative instruments.
A hypothetical 10 percent change in short-term interest rates at December 31, 2018, applied to floating rate financial assets and liabilities, operations for the sale of receivables and derivative financial instruments, would have resulted in increased net financial expenses before taxes, on an annual basis, of approximately €25 million (€27 million at December 31, 2017).
This analysis is based on the assumption that there is an unfavorable change of 10 percent proportionate to interest rate levels across homogeneous categories. A homogeneous category is defined on the basis of the currency in which the financial assets and liabilities are denominated. In addition, the sensitivity analysis applied to floating rate financial instruments assumes that cash and cash equivalents and other short-term financial assets and liabilities which expire during the projected 12-month period will be renewed or reinvested in similar instruments, bearing the hypothetical short-term interest rates.

2018 | ANNUAL REPORT 271
Quantitative information on commodity price riskThe Group has entered into derivative contracts for certain commodities to hedge its exposure to commodity price risk associated with buying raw materials and energy used in its normal operations.
In connection with the commodity price derivative contracts outstanding at December 31, 2018, a hypothetical 10 percent change in the price of the commodities at that date would have caused a fair value loss of €91 million (€51 million at December 31, 2017). Future trade flows whose hedging transactions have been analyzed were not considered in this analysis. It is reasonable to assume that changes in commodity prices will produce the opposite effect, of an equal or greater amount, on the underlying transactions that have been hedged.
31. SUBSEQUENT EVENTSThe Group has evaluated subsequent events through February 22, 2019, which is the date the financial statements were authorized for issuance.
On February 14, 2019, FCA Italy and Groupe PSA announced a signed agreement to extend the Sevel cooperation agreement to 2023 and increase production capacity from 2019. The terms of the new agreement also include continued manufacture by Sevel of Fiat Ducato, Peugeot Boxer and Citroën Jumper large vans as well as additional versions to cover the needs of the Opel and Vauxhall brands.


Company Financial StatementsAT DECEMBER 31, 2018
Index to the Company Financial Statements
Income Statement ________________________________________________________________________________ 274
Statement of Financial Position ____________________________________________________________________ 275
Notes to the Company Financial Statements _________________________________________________________ 276

274 2018 | ANNUAL REPORT
Company Financial Statements
Income Statement
Income Statement(in € million)
Years Ended December 31Note 2018 2017
Other operating income 2 33 61
Personnel costs 3 (12) (12)
Other operating costs 4 (168) (166)
Net financial expenses 5 (168) (281)
Profit before taxes (315) (398)
Income tax benefit 6 14 12
Result from investments 1 3,624 3,667
Net profit from continuing operations 3,323 3,281
Profit from discontinued operations 285 210
Net profit € 3,608 € 3,491
The accompanying notes are an integral part of the Company Financial Statements.

2018 | ANNUAL REPORT 275
Company Financial Statements
Statement of Financial Position
Statement of Financial Position(in € million - before appropriation of results)
At December 31Note 2018 2017
Assets
Property, plant and equipment 7 € 26 € 27
Investments in Group companies and other equity investments 8 31,530 27,323
Other financial assets 9 3,380 3,228
Total Non-current assets 34,936 30,578
Current financial assets 10 3 239
Trade receivables 11 15 15
Other current receivables 12 205 329
Cash and cash equivalents 13 1 1
Total Current assets 224 584
Total Assets € 35,160 € 31,162
Equity and Liabilities
Equity 14
Share capital € 19 € 19
Capital reserves 5,920 5,817
Legal reserves 13,319 11,825
Retained profit/(loss) 1,836 (333)
Profit for the year 3,608 3,491
Total Equity 24,702 20,819
Liabilities
Provisions for employee benefits and other provisions 15 8 39
Non-current debt 16 3,864 3,742
Other non-current liabilities 17 10 11
Total Non-current liabilities 3,882 3,792
Provisions for employee benefits and other current provisions 18 2 2
Trade payables 19 16 7
Current debt 20 6,320 6,142
Other debt 21 238 400
Total Current liabilities 6,576 6,551
Total Equity and liabilities € 35,160 € 31,162
The accompanying notes are an integral part of the Company Financial Statements.

276 2018 | ANNUAL REPORT
Company Financial Statements
Notes to the Company Financial Statements
Notes to the Company Financial Statements
PRINCIPAL ACTIVITIES
The FCA mergerOn January 29, 2014, the Board of Directors of Fiat SpA (“Fiat”) approved a proposed corporate reorganization resulting in the formation of Fiat Chrysler Automobiles N.V. (“FCA” or the “Company”) as a fully integrated global automaker. The Board determined that a redomiciliation into the Netherlands with a listing on the NYSE and an additional listing on the Mercato Telematico Azionario (“MTA”) would be the structure most suitable to Fiat’s profile and its strategic and financial objectives. FCA’s principal executive offices were established in London, United Kingdom.
FCA was incorporated as a public limited liability company (naamloze vennootschap) under the laws of the Netherlands on April 1, 2014, under the name Fiat Investments N.V.. On June 15, 2014, the Board of Directors of Fiat approved the merger plan of Fiat into Fiat Investments N.V., and, at the extraordinary general meeting held on August 1, 2014, the shareholders of Fiat approved the merger that was completed and became effective on October 12, 2014. The merger, which took the form of a reverse merger, resulted in Fiat Investments N.V. being the surviving entity which was then renamed Fiat Chrysler Automobiles N.V.. On October 13, 2014, FCA common shares commenced trading on the NYSE and on the MTA.
Magneti Marelli Discontinued OperationsOn April 5, 2018, the FCA Board of Directors announced that it had authorized FCA management to develop and implement a plan to separate the Magneti Marelli business from the Group.
On October, 22, 2018, FCA announced that it has entered into a definitive agreement to sell its Magneti Marelli business to CK Holdings, Ltd. Subject to regulatory approvals and other customary closing conditions, the transaction is expected to close in the second quarter of 2019. Refer to Note 3 - Scope of consolidation to the Consolidated Financial Statements included elsewhere in this document for additional information.
As a consequence of the agreement above, the results of Magneti Marelli have been excluded from continuing operations, and are shown as a single line item in the Profit from discontinued operations line item for the years ended December 31, 2018 and 2017.
ACCOUNTING POLICIES
Basis of preparationThe 2018 Company Financial Statements represent the separate financial statements of the parent company, Fiat Chrysler Automobiles N.V., and have been prepared in accordance with the legal requirements of Title 9, Book 2 of the Dutch Civil Code. Section 362 (8), Book 2, Dutch Civil Code, allows companies that apply IFRS as adopted by the European Union in their consolidated financial statements to use the same measurement principles in their company financial statements. The accounting policies are described in a specific section, Significant accounting policies, of the Consolidated Financial Statements included in this Annual Report. However, as allowed by the law, investments in subsidiaries, joint ventures and associates are accounted for using the net equity value in the Company Financial Statements.
Format of the financial statementsGiven the activities carried out by FCA, presentation of the Company Income Statement is based on the nature of revenues and expenses. The Consolidated Income Statement for FCA is classified according to function (also referred to as the “cost of sales” method), which is considered more representative of the format used for internal reporting and management purposes and is in line with international practice in the industry.

2018 | ANNUAL REPORT 277
FCA financial statements are prepared in Euros, also the Company’s functional currency, representing the currency in which the main transactions of the Company are denominated.
The Statements of Income and of Financial Position and Notes to the Financial Statements are presented in millions of Euros, except where otherwise stated.
As parent company, FCA has also prepared consolidated financial statements for FCA Group for the year ended December 31, 2018.
New standardsThe Company adopted IFRS 9 Financial Instruments and IFRS 15 Revenues from contracts with customers from January 1, 2018.
The adoption of IFRS 15 did not affect the manner and timing of recognition of the Company’s revenues, deriving only from service activities to subsidiaries that continue to be recognized when the services are transferred to customers and Company’s performance obligations towards them are met.
IFRS 9 - Financial Instruments introduces new criteria for the classification and measurement of financial assets, for the impairment of financial assets and for hedge accounting. In accordance with the transitional provisions in IFRS 9, the Company did not restate prior periods. For hedge accounting, the Company applied the standard prospectively.
The main changes from the adoption of IFRS 9 are described below:
According to IFRS 9 financial assets are measured at amortized cost, or at fair value through profit or loss or at fair value through the income statement according to their contractual characteristics and the business model used for their management. The classification and measurement of financial liabilities according to IFRS 9 is substantially unchanged compared to IAS 39. The application of the new classification measurement criteria of financial assets did not result in any reclassification for the Company as of January 1, 2018.
The accounting for impairment of financial assets is based on an “expected credit loss” (ECL) impairment model, replacing the incurred loss method under IAS 39. Expected losses will be recorded on annual basis or taking into account the contractual duration of the financial activity. The application of these new rules did not have any significant effect on the Company’s financial statements and on the date of first application of the standard.
For financial guarantee contracts, IFRS 9 retains the same definition and initial recognition requirements as IAS 39 but introduces different subsequent measurement requirements. On subsequent measurement financial guarantees contacts are measured at the ‘higher of’:
The ECL allowance as defined above, and
The amount initially recognized (i.e. fair value) less any cumulative amount of income amortization recognized.
This new measurement criteria did not lead to any significant effect in the Company’s financial statements.
Amounts due from Group companiesAmounts due from group companies are stated initially at fair value and subsequently at amortized cost. Amortized cost is determined using the effective interest rate method. The Company recognizes a credit loss for financial assets (such as a loan) based on an ECL which will occur in the next twelve months or, after a significant decrease in credit quality or when the simplified model can be used, based on the entire remaining loan term. Recognition of an ECL for intercompany receivables could result in differences between equity recognized in the consolidated and separate Company financial statements that would be reversed in profit and loss.

278 2018 | ANNUAL REPORT
Company Financial Statements
Notes to the Company Financial Statements
COMPOSITION AND PRINCIPAL CHANGES
1. Result from investmentsThe following table summarizes the Result from investments:
Years Ended December 31
2018 2017(€ million)
Share of the profit/(loss) of Group companies € 3,623 € 3,617
Gains from disposal of investments — 49
Dividends from other companies 1 1
Total Result from investments € 3,624 € 3,667
Result from investments primarily related to the Company’s share in the net profit or loss of subsidiaries and associates.
The share of the profit of Magneti Marelli was recognized within the line item Profit from discontinued operations within the Income Statement.
For the year ended December 31, 2017, gains from disposal of investments consisted of the gain realized on disposal of Italiana Editrice S.p.A., a subsidiary involved in the publishing business.
2. Other operating incomeThe following table summarizes Other operating income:
Years Ended December 31
2018 2017(€ million)
Revenues from services € 33 € 31
Other revenues and income from third parties — 30
Total Other operating income € 33 € 61
Revenues from services consisted of services rendered to the principal subsidiaries of the Group, substantially in line with 2018.
Other revenues and income from third parties reflected the portion paid to FCA NV of the reimbursement from the final settlement of claims for the Tianjin (China) port explosions, which occurred in the third quarter of 2015 (refer to Note 28, Segment reporting, within the Consolidated Financial Statements).
3. Personnel costsPersonnel costs during the year ended December 31, 2018, of €12 million (€12 million in 2017) primarily related to wages and salaries. The average number of employees in 2018 was 46 (48 in 2017), based in the United Kingdom and Italy (all wholly outside the Netherlands).
4. Other operating costsOther operating costs primarily includes costs for services rendered by Group companies (support and consulting in administration, IT systems, press activities, payroll, security and facility management), costs for legal, administrative, financial and IT services in addition to the compensation component from Share-based compensation plans representing the notional cost of the Long Term Incentive Plan awarded to the Chief Executive Officer and Executives (net of the portion already attributed to the relevant subsidiaries), which was recognized directly in the equity reserve, as reported in Note 18, Share-based compensation, within the Consolidated Financial Statements.

2018 | ANNUAL REPORT 279
5. Net financial expensesThe following table summarizes Net financial expenses:
Years Ended December 31
2018 2017(€ million)
Financial income € 183 € 194
Financial expense (332) (457)
Currency exchange gains/(losses) 35 (101)
Net (losses)/gains on derivative financial instruments (54) 83
Total Net financial expenses € (168) € (281)
Financial income relates to interest on loans extended to Fiat Chrysler Automobiles North America Holdings LLC (“FCA NAH LLC”), as included within Other financial assets and Current financial assets. The decrease in financial income related primarily to foreign exchange differences following the revaluation of the 2018 average exchange rate of the Euro against the U.S.$
Financial expense relates to interest payable on the intercompany debt included within Current debt, in addition to the interest on the unsecured senior debt securities of U.S. $3.0 billion issued in April 2015 and €1.25 billion issued in March 2016. The decrease in financial expense related to both the lower average debt and the reduction in the interest rates during 2018 as compared to 2017.
Currency exchange gain of €35 million for the year ended December 31, 2018 reflected the net impact of revaluation of the U.S.$ year end spot rate against the Euro on loans extended to FCA NAH LLC and the unsecured senior debt securities issued in April 2015, both denominated in U.S.$, described above. These Net gains were partially offset by €54 million Net losses on derivative instruments entered into to hedge the foreign currency fluctuations.
6. Income tax benefitIn 2018 and 2017, income taxes were a benefit of €14 million and €12 million respectively, which are primarily related to compensation receivable for tax losses carried forward contributed to the Group’s tax consolidation schemes in Italy and in the United Kingdom.
The Company reported losses for tax purposes as the result from investments is not considered for tax purposes.
7. Property, plant and equipmentAt December 31, 2018, the carrying amount of property, plant and equipment was €26 million (€27 million at December 31, 2017), consisting of the gross carrying amount of assets of €71 million (€70 million at December 31, 2017) and accumulated depreciation of €45 million (€43 million at December 31, 2017), of which €24 million related to the Company’s property in Turin (€25 million at December 31, 2017). No property was subject to liens, pledged as collateral or restricted in use.
Depreciation of property, plant and equipment is recognized in the Income statement within Other operating costs.

280 2018 | ANNUAL REPORT
Company Financial Statements
Notes to the Company Financial Statements
8. Investments in Group companies and other equity investmentsThe following table summarizes Investments in Group companies and other equity investments:
At December 31
2018 2017 Change(€ million)
Investments in Group companies € 31,512 € 27,300 € 4,212
Other equity investments 18 23 (5)
Total Investments in Group companies and other equity investments € 31,530 € 27,323 € 4,207
Investments in Group companies were subject to the following changes during 2018 and 2017:
2018 2017
(€ million)
Balance at beginning of year € 27,300 € 25,087
Net acquisition/(disposal) of subsidiaries from/to Group companies — 383
Net contributions made to subsidiaries 3,108 125
Dividends received from subsidiaries (3,043) (264)
Share of the profit of continuing operations 3,623 3,617
Share of the profit of discontinued operations 285 210
Cumulative translation adjustments and other OCI movements 140 (2,031)
Other 99 173
Balance at end of year € 31,512 € 27,300
The increase in Investments in Group companies in 2018 primarily related to the Share of the profit of Group companies of €3,908 million (including discontinued operations) and net contributions made to subsidiaries of €3,108 million, primarily to FCA Italy S.p.A. for €2,711 million, partially offset by dividends received from FCA North America Holdings LLC and Fiat Chrysler UK LLP of €3,043 million.
The increase in Investments in Group companies in 2017 primarily related to the Share of the profit of Group companies of €3,827 million (including the discontinued operations), net acquisitions from Group companies of €383 million and net contributions made to subsidiaries of €125 million, partially offset by cumulative translation adjustments and other OCI movements of €2,031 million and dividends received from FCA North America Holdings LLC and Fiat Chrysler UK LLP of €264 million.
9. Other financial assetsAt December 31, 2018, Other financial assets amounted to €3,380 million (€3,228 million at December 31, 2017), primarily represented by U.S. $3.9 billion of intercompany loans extended to FCA NAH LLC.
The €152 million decrease in Other financial assets was fully attributable to foreign exchange differences due to the revaluation of the U.S.$ year end spot rate against the Euro.
In January 2015, a loan of U.S. $881.6 million, expiring December 2022, was extended to fund the acquisition of certain subsidiaries based in the U.S. The carrying amount of €770 million at December 31, 2018 (€735 million at December 31, 2017), related to the outstanding principal only, with no accrued interest receivable due.
In April 2015, a further U.S. $2,970 million was extended in two loans of $1,485 million, expiring in April 2020 and April 2023. The carrying amount of €2,594 million at December 31, 2018, related to the outstanding principal amount only, with no accrued interest receivable due (€2,476 million at December 31, 2017).
These loans were hedged into Euro by currency swaps with Fiat Chrysler Finance S.p.A. and Fiat Chrysler Finance Europe S.A., resulting in €0.2 million of intercompany derivative liabilities at December 31, 2018 included within Other financial liabilities (€0.4 million at December 31, 2017).

2018 | ANNUAL REPORT 281
10. Current financial assetsAt December 31, 2018, Current financial assets amounted to €3 million primarily related to intercompany derivative assets with Fiat Chrysler Finance Europe S.A.
At December 31, 2017, Current financial assets were €239 million, primarily related to a short-term intercompany deposit of €201 million with Fiat Chrysler Finance Europe S.A.
11. Trade receivablesAt December 31, 2018, trade receivables totaled €15 million, almost entirely related to Group companies.
The carrying amount of trade receivables is deemed to approximate their fair value. All trade receivables are due within one year and there are no overdue balances.
12. Other current receivablesAt December 31, 2018, Other current receivables amounted to €205 million, a net decrease of €124 million as compared to December 31, 2017, and consisted of the following:
At December 31
2018 2017 Change(€ million)
Receivable from Group companies for consolidated Italian corporate tax € 69 € 153 € (84)
VAT receivables 87 134 (47)
Italian corporate tax receivables 17 19 (2)
Other 32 23 9
Total Other current receivables € 205 € 329 € (124)
Receivables from Group companies for consolidated Italian corporate tax relates to taxes calculated on the taxable income contributed by Italian subsidiaries participating in the domestic tax consolidation program.
VAT receivables relate primarily to VAT credits for Italian subsidiaries participating in the VAT tax consolidation.
Italian corporate tax receivables include credits transferred to FCA N.V. by Italian subsidiaries participating in the domestic tax consolidation program in 2018 and prior years.
13. Cash and cash equivalentsAt December 31, 2018, Cash and cash equivalents totaled €1 million (€1 million as at December 31, 2017) and is primarily represented by amounts held in Euro. The carrying amount of Cash and cash equivalents is deemed to be in line with their fair value.
Credit risk associated with Cash and cash equivalents is considered limited as the counterparties are leading national and international banks.

282 2018 | ANNUAL REPORT
Company Financial Statements
Notes to the Company Financial Statements
14. EquityChanges in Shareholders’ equity during 2018 were as follows:
(€ million)Share
CapitalCapital
Reserves
Legal Reserves:
Cumulative translation
adjustment reserve /
OCI
Legal Reserves:
Other
Retained profit/(loss)
Profit/(loss) for the year
Total equity
At December 31, 2016 € 19 € 5,766 € 2,070 € 10,866 € (1,356) € 1,803 € 19,168
Allocation of prior year result — — — — 1,803 (1,803) —
Share-based compensation — 115 — — — — 115
Net profit for the year — — — — — 3,491 3,491
Current period change in OCI, net of taxes — — (1,839) — — — (1,839)
Legal Reserve — — — 728 (728) — —
Other changes — (64) — — (52) — (116)
At December 31, 2017 19 5,817 231 11,594 (333) 3,491 20,819
Allocation of prior year result — — — — 3,491 (3,491) —
Share-based compensation — 82 — — — — 82
Net profit for the year — — — — — 3,608 3,608
Current period change in OCI, net of taxes — — 257 — — — 257
Legal Reserve — — — 1,237 (1,237) — —
Other changes — 21 — — (85) — (64)
At December 31, 2018 € 19 € 5,920 € 488 € 12,831 € 1,836 € 3,608 € 24,702
Shareholders’ equity increased by €3,883 million in 2018, primarily due to profit for the year of €3,608 million, and movements in OCI of €257 million, relating primarily to the remeasurement of defined benefit plans.
Shareholders’ equity increased by €1,651 million in 2017, primarily due to profit for the year of €3,491 million and movements in OCI of €1,839 million, relating to foreign exchange differences and the remeasurement of defined benefit plans.
Share capitalAt December 31, 2018, the fully paid-up share capital of FCA amounted to €19 million (€19 million at December 31, 2017) and consisted of 1,550,617,563 common shares and 408,941,767 special voting shares, all with a par value of €0.01 each (1,540,089,690 common shares and 408,941,767 special voting shares at December 31, 2017).
Capital reservesAt December 31, 2018, capital reserves amounting to €5,920 million (€5,817 million at December 31, 2017) consisted mainly of the effects of the Merger, resulting in a different par value of FCA common shares (€0.01 each) as compared to Fiat S.p.A. ordinary shares (€3.58 each) where the consequent difference between the share capital before and after the Merger was recognized as an increase to the capital reserves. In addition, capital reserves include the impact of conversion in 2016 of the Mandatory Convertible Securities issued in 2014.

2018 | ANNUAL REPORT 283
Legal reservesPursuant to Dutch law, limitations exist relating to the distribution of shareholders’ equity up to at least the total amount of the legal reserve. By their nature, unrealized losses relating to OCI components reduce shareholders’ equity and thereby distributable amounts.
At December 31, 2018, legal reserves amounted to €12,831 million (€11,594 million at December 31, 2017) and mainly related to development expenditures capitalized by subsidiaries of €10,405 million (€9,697 million at December 31, 2017), the earnings of subsidiaries subject to certain restrictions to distributions to the parent company of €2,422 million (€1,893 million at December 31, 2017), and the reserve in respect of special voting shares of €4 million (€4 million at December 31, 2017). Legal reserves also include unrealized foreign currency translation gains and losses and net gains from cash flow hedges of €1,056 million. Other OCI components primarily include unrealized losses of €567 million related to defined benefit plans.
DividendsRefer to Note 26, Equity within the Consolidated Financial Statements included elsewhere in this report for additional detail on the proposed annual ordinary dividend distribution to holders of FCA common shares.
15. Provisions for employee benefits and other provisionsAt December 31, 2018, provisions for employee benefits and other provisions totaled €8 million, (€39 million at December 31, 2017) with the decrease primarily attributable to benefits related to the former CEO reclassified to other payables.
At December 31, 2017, provisions consisted primarily of unfunded post-employment benefits accruing to employees, former employees and Directors under supplemental company or individual agreements.
16. Non-current debtAt December 31, 2018, non-current debt totaled €3,864 million, representing an increase of €122 million from December 31, 2017, and consisted of the following:
At December 31
2018 2017 Change(€ million)
Third-party debt:
- Unsecured senior debt securities € 3,848 € 3,726 € 122
Total third-party debt € 3,848 € 3,726 € 122
Intercompany debt:
- Intercompany financial payables € 16 € 16 € —
Total intercompany debt € 16 € 16 € —
Total Non-current debt € 3,864 € 3,742 € 122
At December 31, 2018, Non-current debt of €3,864 million (€3,742 million at December 31, 2017), primarily related to the €1,250 million note issued in March 2016 and the U.S. $3.0 billion unsecured senior debt notes issued in April 2015. The increase of €122 million as compared to December 31, 2017 was almost fully attributable to foreign exchange differences following the revaluation U.S. Dollar year end spot rate against the Euro.
As described in more detail in Note 21 - Debt, to the Consolidated Financial Statements, FCA issued a 3.75 percent note at par in March 2016 with a principal value of €1,250 million due March 2024, under the Global Medium Term Note (“GMTN”) Programme.

284 2018 | ANNUAL REPORT
Company Financial Statements
Notes to the Company Financial Statements
In April 2015, FCA issued €1.4 billion (U.S.$1.5 billion) principal amount of 4.5 percent unsecured senior debt securities due April 15, 2020 (the “2020 Notes”) and €1.4 billion (U.S.$1.5 billion) principal amount of 5.25 percent unsecured senior debt securities due April 15, 2023 (the “2023 Notes”) at par. The 2020 Notes and the 2023 Notes, collectively referred to as “the Notes”, rank pari passu in right of payment with respect to all of FCA’s existing and future senior unsecured indebtedness and senior in right of payment to any of FCA’s future subordinated indebtedness and existing indebtedness, which is by its terms subordinated in right of payment to the Notes. Interest on the 2020 Notes and the 2023 Notes is payable semi-annually in April and October.
17. Other non-current liabilitiesAt December 31, 2018, other non-current liabilities totaled €10 million:
At December 31
2018 2017 Change(€ million)
Other non-current liabilities € 10 € 11 € (1)
Total Other non-current liabilities € 10 € 11 € (1)
Other non-current liabilities relate to non-current post-employment benefits, being the present value of future benefits payable to a former CEO and management personnel that have left the Company.
18. Provisions for employee benefits and other current provisionsEmployee benefit provisions primarily reflect the best estimate for variable components of compensation:
At December 31
2018 2017 Change(€ million)
Provisions for employee benefits and other current provisions € 2 € 2 € —
Total Provisions for employee benefits and other current provisions € 2 € 2 € —
19. Trade payablesAt December 31, 2018, trade payables totaled €16 million, a increase of €9 million from December 31, 2017, and consisted of the following:
At December 31
2018 2017 Change(€ million)
Trade payables due to third parties € 11 € 3 € 8
Intercompany trade payables 5 4 1
Total trade payables € 16 € 7 € 9
Trade payables are due within one year and their carrying amount at the reporting date is deemed to approximate their fair value.

2018 | ANNUAL REPORT 285
20. Current debtAt December 31, 2018, current debt totaled €6,320 million, a €178 million increase over December 31, 2017 and related to the following:
At December 31
2018 2017 Change(€ million)
Intercompany debt:
- Current account with Fiat Chrysler Finance S.p.A. € 134 € 99 € 35
- Current account with Fiat Chrysler Finance Europe S.A. 6,121 5,981 140
Total intercompany debt € 6,255 € 6,080 € 175
Third party debt:
- Accrued interest payable 65 62 3
Total third party debt € 65 € 62 € 3
Total current debt € 6,320 € 6,142 € 178
Current intercompany debt of €6,255 million (€6,080 million at December 31, 2017) is denominated in Euro and the carrying amount approximates fair value.
Current account with Fiat Chrysler Finance Europe S.A. represents the overdraft as part of the Group’s centralized treasury management.
Accrued interest payable of €65 million (€62 million at December 31, 2017) relates to the unsecured senior debt securities referred to in Note 16, Non-current debt.
21. Other debtAt December 31, 2018, Other debt totaled €238 million, a net decrease of €162 million over December 31, 2017, and included the following:
At December 31
2018 2017 Change(€ million)
Intercompany other debt:
- Consolidated Italian corporate tax € 65 € 149 € (84)
- Consolidated VAT 130 239 (109)
- Other 3 2 1
Total intercompany other debt € 198 € 390 € (192)
Other debt and taxes payable:
- Taxes payable 2 1 1
- Accrued expenses 3 4 (1)
- Other payables 35 5 30
Total Other debt and taxes payable € 40 € 10 € 30
Total Other debt € 238 € 400 € (162)
At December 31, 2018, intercompany debt relating to consolidated VAT of €130 million (€239 million at December 31, 2017) consisted of VAT credits of Italian subsidiaries transferred to FCA as part of the consolidated VAT regime.
Intercompany debt relating to consolidated Italian corporate tax of €65 million (€149 million at December 31, 2017) consisted of compensation payable for tax losses and Italian corporate tax credits contributed by Italian subsidiaries participating in the domestic tax consolidation program for 2018, for which the Italian branch of FCA N.V. is the consolidating entity.
Other debt and taxes payable are all due within one year and their carrying amount is deemed to approximate their fair value.

286 2018 | ANNUAL REPORT
Company Financial Statements
Notes to the Company Financial Statements
22. Guarantees granted, commitments and contingent liabilities
Guarantees grantedAt December 31, 2018, guarantees issued totaled €6,679 million (€9,318 million at December 31, 2017) wholly provided on behalf of Group companies. The decrease of €2,639 million as compared to 31 December 2017 related principally to the repayment of bonds from Fiat Chrysler Finance Europe S.A.
The main guarantees outstanding at 31 December 2018 were as follows:
€3,914 million for bonds issued;
€1,125 million for borrowings, of which €413 million in favor of the subsidiaries in Brazil mainly related to the construction of the new plant in Pernambuco and the remaining primarily to Fiat Chrysler Finance S.p.A; and
€1,639 million for VAT reimbursements related to the VAT consolidation scheme in Italy.
In addition, in 2005, in relation to the advance received by FCA Partecipazioni S.p.A. on the consideration for the sale of the aviation business, FCA as the successor of Fiat S.p.A. is jointly and severally liable with the fully owned subsidiary FCA Partecipazioni S.p.A. to the purchaser, Avio Holding S.p.A., should FCA Partecipazioni S.p.A. fail to honor (following either an arbitration award or an out-of-court settlement) undertakings provided in relation to the sale and purchase agreement signed in 2003.
Other commitments, contractual rights and contingent liabilitiesFCA has important commitments and rights derived from outstanding agreements in addition to contingent liabilities as described in the notes to the Consolidated Financial Statements at December 31, 2018, to which reference should be made.
23. Audit feesThe following table reports fees paid to the independent auditor Ernst & Young Accountants LLP, or entities in their network, for audit and other services:
Years Ended December 31(€ thousand) 2018 2017
Audit fees € 18,607 € 18,601
Audit-related fees 50 398
Tax fees 346 100
Total € 19,003 € 19,099
Audit fees of Ernst & Young Accountants LLP amounted €260 thousand. No other services were performed by Ernst and Young Accountants LLP.
24. Board remunerationDetailed information on Board of Directors compensation (including their shares and share awards) is included in the REMUNERATION REPORT section of this report.

2018 | ANNUAL REPORT 287
25. Subsequent eventsThe Group has evaluated subsequent events through February 22, 2019, which is the date the financial statements were authorized for issuance, as described in Note 31, Subsequent Events, within the Consolidated Financial Statements.
February 22, 2019
The Board of Directors
John ElkannMichael ManleyJohn AbbottAndrea AgnelliTiberto Brandolini d’AddaGlenn EarleValerie A. MarsRuth J. SimmonsRonald L. ThompsonMichelangelo A. VolpiPatience WheatcroftErmenegildo Zegna

288 2018 | ANNUAL REPORT

2018 | ANNUAL REPORT 289
Other Information

290 2018 | ANNUAL REPORT
Additional Information for Netherlands Corporate Governance
Independent Auditor’s ReportThe report of the Company’s independent auditor, Ernst & Young Accountants LLP, the Netherlands, is set forth following this Annual Report.
DividendsDividends will be determined in accordance with the article 23 of the Articles of Association of Fiat Chrysler Automobiles N.V. The relevant provisions of the Articles of Association read as follows:
1. The Company shall maintain a special capital reserve to be credited against the share premium exclusively for the purpose of facilitating any issuance or cancellation of special voting shares. The special voting shares shall not carry any entitlement to the balance of the special capital reserve. The Board of Directors shall be authorized to resolve upon (i) any distribution out of the special capital reserve to pay up special voting shares or (ii) re-allocation of amounts to credit or debit the special capital reserve against or in favor of the share premium reserve.
2. The Company shall maintain a separate dividend reserve for the special voting shares. The special voting shares shall not carry any entitlement to any other reserve of the Company. Any distribution out of the special voting rights dividend reserve or the partial or full release of such reserve will require a prior proposal from the Board of Directors and a subsequent resolution of the meeting of holders of special voting shares.
3. From the profits shown in the annual accounts, as adopted, such amounts shall be reserved as the Board of Directors may determine.
4. The profits remaining thereafter shall first be applied to allocate and add to the special voting shares dividend reserve an amount equal to one percent (1%) of the aggregate nominal value of all outstanding special voting shares. The calculation of the amount to be allocated and added to the special voting shares dividend reserve shall occur on a time-proportionate basis. If special voting shares are issued during the financial year to which the allocation and addition pertains, then the amount to be allocated and added to the special voting shares dividend reserve in respect of these newly issued special voting shares shall be calculated as from the date on which such special voting shares were issued until the last day of the financial year concerned. The special voting shares shall not carry any other entitlement to the profits.
5. Any profits remaining thereafter shall be at the disposal of the general meeting of Shareholders for distribution of profits on the common shares only, subject to the provision of paragraph 8 of this article.
6. Subject to a prior proposal of the Board of Directors, the general meeting of Shareholders may declare and pay distribution of profits and other distributions in United States Dollars. Furthermore, subject to the approval of the general meeting of Shareholders and the Board of Directors having been designated as the body competent to pass a resolution for the issuance of shares in accordance with Article 6, the Board of Directors may decide that a distribution shall be made in the form of shares or that Shareholders shall be given the option to receive a distribution either in cash or in the form of shares.
7. The Company shall only have power to make distributions to Shareholders and other persons entitled to distributable profits to the extent the Company’s equity exceeds the sum of the paid in and called up part of the share capital and the reserves that must be maintained pursuant to Dutch law and the Company’s Articles of Association. No distribution of profits or other distributions may be made to the Company itself for shares that the Company holds in its own share capital.
8. The distribution of profits shall be made after the adoption of the annual accounts, from which it appears that the same is permitted.
Other Information
Additional Information for Netherlands Corporate Governance

2018 | ANNUAL REPORT 291
9. The Board of Directors shall have power to declare one or more interim distributions of profits, provided that the requirements of paragraph 7 hereof are duly observed as evidenced by an interim statement of assets and liabilities as referred to in Section 2:105 paragraph 4 of the Dutch Civil Code and provided further that the policy of the Company on additions to reserves and distributions of profits is duly observed. The provisions of paragraphs 2 and 3 hereof shall apply mutatis mutandis.
10. The Board of Directors may determine that distributions are made from the Company’s share premium reserve or from any other reserve provided that payments from reserves may only be made to the Shareholders that are entitled to the relevant reserve upon the dissolution of the Company.
11. Distributions of profits and other distributions shall be made payable in the manner and at such date(s) - within four weeks after declaration thereof - and notice thereof shall be given as the general meeting of Shareholders, or the Board of Directors in the case of interim distributions of profits, shall determine.
12. Distributions of profits and other distributions, which have not been collected within five years and one day after the same have become payable, shall become the property of the Company.
Disclosures pursuant to Decree Article 10 EU-Directive on Takeovers
In accordance with the Dutch Besluit artikel 10 overnamerichtlijn (the Decree), the Company makes the following disclosures:
a. For information on the capital structure of the Company, the composition of the issued share capital and the existence of the two classes of shares, please refer to Note 14, Equity to the Company Financial Statements in this Annual Report. For information on the rights attached to the common shares, please refer to the Articles of Association which can be found on the Company’s website. To summarize, the rights attached to common shares comprise pre-emptive rights upon issue of common shares, the entitlement to attend the general meeting of Shareholders and to speak and vote at that meeting and the entitlement to distributions of such amount of the Company’s profit as remains after allocation to reserves. For information on the rights attached to the special voting shares, please refer to the Articles of Association and the Terms and Conditions for the Special Voting Shares which can both be found on the Company’s website and more in particular to the paragraph “Loyalty Voting Structure” of this Annual Report in the chapter “Corporate Governance”. As at December 31, 2018, the issued share capital of the Company consisted of 1,550,617,563 common shares, representing 79 percent of the aggregate issued share capital, and 408,941,767 special voting shares, representing 21 percent of the aggregate issued share capital.
b. The Company has imposed no limitations on the transfer of common shares. The Articles of Association provide in Article 13 for transfer restrictions for special voting shares.
c. For information on participations in the Company’s capital in respect of which pursuant to Sections 5:34, 5:35 and 5:43 of the Dutch Financial Supervision Acts (Wet op het financieel toezicht) notification requirements apply, please refer to the section “Major Shareholders” of this Annual Report. There you will find a list of Shareholders who are known to the Company to have holdings of 3 percent or more at the stated date.
d. No special control rights or other rights accrue to shares in the capital of the Company.
e. The Company does not operate an employee share participation scheme as mentioned in article 1 sub 1(e) of the Decree.
f. No restrictions apply to voting rights attached to shares in the capital of the Company, nor are there any deadlines for exercising voting rights. The Articles of Association allow the Company to cooperate in the issuance of registered depositary receipts for common shares, but only pursuant to a resolution to that effect of the Board of Directors. The Company is not aware of any depository receipts having been issued for shares in its capital.
g. The Company is not aware of the existence of any agreements with Shareholders which may result in restrictions on the transfer of shares or limitation of voting rights.

292 2018 | ANNUAL REPORT
h. The rules governing the appointment and dismissal of members of the Board of Directors are stated in the Articles of Association of the Company. All members of the Board of Directors are appointed by the general meeting of Shareholders. The term of office of all members of the Board of Directors is for a period of approximately one year after appointment, with such a period expiring on the day the first Annual General Meeting of Shareholders is held in the following calendar year. The general meeting of Shareholders has the power to suspend or dismiss any member of the Board of Directors at any time. The rules governing an amendment of the Articles of Association are stated in the Articles of Association and require a resolution of the general meeting of Shareholders which can only be passed pursuant to a prior proposal of the Board of Directors.
i. The general powers of the Board of Directors are stated in the Articles of Association of the Company. For a period of five years from October 12, 2014, the Board of Directors has been irrevocably authorized to issue shares and rights to subscribe for shares up to the maximum aggregate amount of shares as provided for in the Company’s authorized share capital as set out in Article 4.1 of the Articles of Association, as amended from time to time. The Board of Directors has also been designated for the same period as the authorized body to limit or exclude the rights of pre-emption of shareholders in connection with the authority of the Board of Directors to issue common shares and grant rights to subscribe for common shares as referred to above. In the event of an issuance of special voting shares, shareholders have no right of pre-emptions. The Company has the authority to acquire fully paid-up shares in its own share capital, provided that such acquisition is made for no consideration. Further rules governing the acquisition of shares by the Company in its own share capital are set out in article 8 of the Articles of Association.
j. The Company is not a party to any significant agreements which will take effect, be altered or terminated upon a change of control of the Company as a result of a public offer within the meaning of Section 5:70 of the Dutch Financial Supervision Acts (Wet op het financieel toezicht), provided that some of the loan agreements guaranteed by the Company and certain bonds guaranteed by the Company contain clauses that, as it is customary for such financial transactions, may require early repayment or termination in the event of a change of control of the guarantor or the borrower. In certain cases, that requirement may only be triggered if the change of control event coincides with other conditions, such as a rating downgrade.
k. Under the terms of the Company’s Equity Incentive Plan (EIP) and employment agreements entered into with certain executive officers, executives may be entitled to receive severance payments of up to two times annual cash compensation and accelerated vesting of awards under the EIP if, within twenty-four (24) months of a Change of Control (as defined therein), the executive’s employment is involuntarily terminated by the Company (other than for Cause -as defined therein-) or is terminated by the participant for Good Reason (as defined therein).
Other Information
Additional Information for Netherlands Corporate Governance

2018 | ANNUAL REPORT 293
Additional Information for U.S. Listing Purposes
Contractual ObligationsThe following table summarizes payments due under our significant contractual commitments as of December 31, 2018:
Payments due by period
(€ million) TotalLess than
1 year 1-3 years 3-5 yearsMore than
5 years
Long-term debt(1) € 11,331 € 2,860 € 3,412 € 3,601 € 1,458
Capital lease obligations(2) 266 58 90 44 74
Interest on other liabilities(3) 1,695 594 699 340 62
Operating lease obligations(4) 1,027 325 331 172 199
Unconditional minimum purchase obligations(5) 1,951 804 857 248 42
Purchase obligations(6) 1,950 1,583 367 — —
Pension contribution requirements(7) 70 70 — — —
Total € 18,290 € 6,294 € 5,756 € 4,405 € 1,835(1) Amounts presented relate to the principal amounts of long-term debt and exclude the related interest expense that will be paid when due,
fair value adjustments, discounts, premiums and loan origination fees. For additional information see Note 21, Debt, within the Consolidated Financial Statements included elsewhere in this report.
(2) Capital lease obligations consist mainly of industrial buildings and plant, machinery and equipment used in our business. The amounts reported include the minimum future lease payments and payment commitments due under such leases. See Note 21, Debt, within the Consolidated Financial Statements included elsewhere in this report.
(3) Amounts include interest payments based on contractual terms and current interest rates on our debt and capital lease obligations. Interest rates based on variable rates included above were determined using the current interest rates in effect at December 31, 2018.
(4) Operating lease obligations mainly relate to leases for commercial and industrial properties used in our business. The amounts reported above include the minimum rental and payment commitments due under such leases.
(5) Unconditional minimum purchase obligations relate to our unconditional purchase obligations to purchase a fixed or minimum quantity of goods and/or services from suppliers with fixed and determinable price provisions. From time to time, in the ordinary course of our business, we enter into various arrangements with key suppliers in order to establish strategic and technological advantages.
(6) Purchase obligations are comprised of (i) the repurchase price guaranteed to certain customers on sales with a buy-back commitment in an aggregate amount of €1,336 million, (ii) commitments to purchase tangible fixed assets, mainly in connection with planned capital expenditure of various group companies, in an aggregate amount of approximately €539 million, and (iii) commitments to purchase intangible assets relating to regulatory emissions credits for an aggregate amount of approximately €75 million.
(7) Pension contribution requirements are based on the estimate of our minimum funding requirements under our funded pension plans. We may elect to make contributions in excess of the minimum funding requirements. The Group contributions to pension plans for 2019 are expected to be €508 million, of which €479 million relate to the U.S. and Canada, with €438 million being discretionary contributions and €41 million will be made to satisfy minimum funding requirements. Our minimum funding requirements after 2019 will depend on several factors, including investment performance and interest rates. Therefore, the above excludes payments beyond 2019, since we cannot predict with reasonable reliability the timing and amounts of future minimum funding requirements. Refer to Note 19, Employee benefits liabilities, within the Consolidated Financial Statements included elsewhere in this report for expected benefit payments for the Group’s pension plans and for the Group’s unfunded health care and life insurance plans.
Product warranties, recall campaigns and product liabilitiesThe contractual obligations set forth above do not include payments for product warranty and recall campaign costs. We issue various types of product warranties under which we generally guarantee the performance of products delivered for a certain period of time. The estimated future costs of product warranties are principally based on assumptions regarding the lifetime warranty costs of each vehicle line and each model year of that vehicle line, as well as historical claims experience for the Group’s vehicles. We also periodically initiate voluntary service and recall actions to address various customer satisfaction, safety and emissions issues related to the vehicles that we sell. In NAFTA, we accrue estimated costs for recalls at the time of sale, which are based on historical claims experience as well as an additional actuarial analysis that gives greater weight to the more recent calendar year trends in recall campaign activity. In other regions and sectors, however, there generally is not sufficient historical data to support the application of an actuarial-based estimation technique. As a result, estimated recall costs for the other regions and sectors are accrued at the time when they are probable and reasonably estimable, which typically occurs once it is determined a specific recall campaign is approved and is announced. Estimates of the future costs of all these actions are inevitably imprecise due to numerous uncertainties, including the enactment of new laws and regulations, the number of vehicles affected by a service or recall action and the nature of the corrective action. It is reasonably possible that the ultimate costs of these services and recall actions may require us to make expenditures in excess of established reserves over an extended period of time and in a range of amounts that cannot be reasonably estimated. At December 31, 2018, our product warranty and recall campaigns provision was €6,760 million.
Other Information
Additional Information for U.S. Listing Purposes

294 2018 | ANNUAL REPORT
Significant Vehicle Assembly PlantsThe following table provides information about our significant vehicle assembly plants as of December 31, 2018, excluding joint ventures, of which the largest by region are Belvidere (U.S.), Betim (Brazil) and Cassino (Italy).
Each of the assembly plants listed below have a covered area of more than 100,000 square meters:
Country Location
NAFTA
U.S. Belvidere, Illinois
U.S. Jefferson North, Michigan
U.S. Sterling Heights, Michigan
U.S. Toledo North, Ohio
U.S. Toledo Supplier Park, Ohio
U.S. Warren Truck, Michigan
Mexico Toluca, Estado de México
Mexico Saltillo, Coahuila
Canada Brampton, Ontario
Canada Windsor, Ontario
LATAM
Brazil Betim, Minas Gerais
Brazil Goiana, Pernambuco
Argentina Cordoba
EMEA
Italy Cassino
Italy Melfi
Italy Pomigliano
Italy Turin (Mirafiori)
Poland Tychy
Serbia Kragujevac
We have three vehicle assembly plants for Maserati in Italy (including two plants owned by FCA Italy), thirteen plants for Comau and five for Teksid.
Our Share InformationOn October 13, 2014, our common shares began trading on the NYSE under the symbol “FCAU” and on the MTA under the symbol “FCA”. Prior to October 13, 2014, our ordinary shares were listed and traded on the MTA under the symbol “Fiat”.
Dividend PolicyRefer to Note 26, Equity within the Consolidated Financial Statements included elsewhere in this report for additional detail on the proposed annual ordinary dividend distribution to holders of FCA common shares.
For additional information on distribution of profits, refer to ADDITIONAL INFORMATION FOR NETHERLANDS CORPORATE GOVERNANCE - Dividends above.
Other Information
Additional Information for U.S. Listing Purposes

2018 | ANNUAL REPORT 295
Principal Accountant Fees and ServicesEY S.p.A., the member firms of Ernst & Young and their respective affiliates (collectively, the “Ernst & Young Entities”) were appointed to serve as our independent registered public accounting firm for the years ended December 31, 2018 and 2017. We incurred the following fees from the Ernst & Young Entities for professional services for the years ended December 31, 2018 and 2017, respectively:
Years Ended December 31(€ thousands) 2018 2017
Audit fees € 18,607 € 18,601
Audit-related fees 50 398
Tax fees 346 100
Total € 19,003 € 19,099
“Audit fees” are the aggregate fees billed by the Ernst & Young Entities for the audit of our consolidated annual financial statements, reviews of interim financial statements and attestation services that are provided in connection with statutory and regulatory filings or engagements. “Audit-related fees” are fees charged by the Ernst & Young Entities for assurance and related services that are reasonably related to the performance of the audit or review of our financial statements and are not reported under “Audit fees”. This category comprises fees for the audit of employee benefit plans and pension plans, agreed-upon procedure engagements and other attestation services subject to regulatory requirements.
Audit Committee’s pre-approval policies and proceduresOur Audit Committee nominates and engages our independent registered public accounting firm to audit our consolidated financial statements. Our Audit Committee has a policy requiring management to obtain the Audit Committee’s approval before engaging our independent registered public accounting firm to provide any other audit or permitted non-audit services to us or our subsidiaries. Pursuant to this policy, which is designed to ensure that such engagements do not impair the independence of our independent registered public accounting firm, the Audit Committee reviews and pre-approves (if appropriate) specific audit and non-audit services in the categories Audit Services, Audit-Related Services, Tax Services, and any other services that may be performed by our independent registered public accounting firm.

296 2018 | ANNUAL REPORT
TAXATION
Material U.S. Federal Income Tax ConsequencesThis section describes the material U.S. federal income tax consequences of owning FCA stock. It applies solely to persons that hold shares as capital assets for U.S. federal income tax purposes. This section does not apply to members of a special class of holders subject to special rules, including:
a dealer in securities or foreign currencies;
a regulated investment company;
a trader in securities that elects to use a mark-to-market method of accounting for securities holdings;
a tax-exempt organization;
a bank, financial institution, or insurance company;
a person liable for alternative minimum tax;
a person that actually or constructively owns 10 percent or more, by vote or value, of FCA;
a person that holds shares as part of a straddle or a hedging, conversion, or other risk reduction transaction for U.S. federal income tax purposes;
a person that acquired shares pursuant to the exercise of employee stock options or otherwise as compensation; or
a person whose functional currency is not the U.S. Dollar.
This section is based on the Internal Revenue Code of 1986, as amended, the Code, its legislative history, existing and proposed regulations, published rulings and court decisions, as well as on applicable tax treaties, all as of the date hereof. These laws are subject to change, possibly on a retroactive basis.
If an entity or arrangement treated as a partnership for U.S. federal income tax purposes holds shares, the U.S. federal income tax treatment of a partner will generally depend on the status of the partner and the tax treatment of the partnership. A partner in an entity treated as a partnership for U.S. federal income tax purposes holding shares should consult its tax advisors with regard to the U.S. federal income tax treatment of the ownership of FCA stock.
No statutory, judicial or administrative authority directly discusses how the ownership of FCA stock should be treated for U.S. federal income tax purposes. As a result, the U.S. federal income tax consequences of the ownership of FCA stock are uncertain. Shareholders should consult their own tax advisors regarding the U.S. federal, state and local and foreign and other tax consequences of owning and disposing of FCA stock in their particular circumstances.
For the purposes of this discussion, a “U.S. Shareholder” is a beneficial owner of shares that is:
an individual that is a citizen or resident of the United States;
a corporation, or other entity taxable as a corporation, created or organized under the laws of the United States;
an estate whose income is subject to U.S. federal income tax regardless of its source; or
a trust if a U.S. court can exercise primary supervision over the trust’s administration and one or more U.S. persons are authorized to control all substantial decisions of the trust.
Other Information
Additional Information for U.S. Listing Purposes

2018 | ANNUAL REPORT 297
Tax Consequences of Owning FCA Stock
Taxation of DividendsUnder the U.S. federal income tax laws, and subject to the discussion of PFIC taxation below, a U.S. Shareholder must include in its gross income the gross amount of any dividend paid by FCA to the extent of its current or accumulated earnings and profits (as determined for U.S. federal income tax purposes). Dividends will be taxed as ordinary income to the extent that they are paid out of FCA’s current or accumulated earnings and profits. Dividends paid to a non-corporate U.S. Shareholder by certain “qualified foreign corporations” that constitute qualified dividend income are taxable to the shareholder at the preferential rates applicable to long-term capital gains provided that the shareholder holds the shares for more than 60 days during the 121-day period beginning 60 days before the ex-dividend date and meets other holding period requirements. For this purpose, stock of FCA is treated as stock of a qualified foreign corporation if FCA is eligible for the benefits of an applicable comprehensive income tax treaty with the United States or if such stock is listed on an established securities market in the United States. The common shares of FCA are listed on the NYSE and FCA expects to be eligible for the benefits of such a treaty. Accordingly, subject to the discussion of PFIC taxation below, dividends FCA pays with respect to the shares will constitute qualified dividend income, assuming the holding period requirements are met.
A U.S. Shareholder must include any foreign tax withheld from the dividend payment in this gross amount even though the shareholder does not in fact receive the amount withheld. The dividend is taxable to a U.S. Shareholder when the U.S. Shareholder receives the dividend, actually or constructively.
The dividend will not be eligible for the dividends-received deduction allowed to U.S. corporations in respect of dividends received from other U.S. corporations.
Distributions in excess of current and accumulated earnings and profits, as determined for U.S. federal income tax purposes, will be treated as a non-taxable return of capital to the extent of the U.S. Shareholder’s basis in the shares of FCA stock, causing a reduction in the U.S. Shareholder’s adjusted basis in FCA stock, and thereafter as capital gain.
Subject to certain limitations, any non-U.S. tax withheld and paid over to a non-U.S. taxing authority is eligible for credit against a U.S. Shareholder’s U.S. federal income tax liability except to the extent a refund of the tax withheld is available to the U.S. Shareholder under non-U.S. tax law or under an applicable tax treaty. The amount allowed to a U.S. Shareholder as a credit is limited to the amount of the U.S. Shareholder’s U.S. federal income tax liability that is attributable to income from sources outside the U.S. and is computed separately with respect to different types of income that the U.S. Shareholder receives from non-U.S. sources. Subject to the discussion below regarding Section 904(h) of the Code, dividends paid by FCA will be foreign source income and depending on the circumstances of the U.S. Shareholder, will be either “passive” or “general” income for purposes of computing the foreign tax credit allowable to a U.S. Shareholder.
Under Section 904(h) of the Code, dividends paid by a foreign corporation that is treated as 50 percent or more owned, by vote or value, by U.S. persons may be treated as U.S. source income (rather than foreign source income) for foreign tax credit purposes, to the extent the foreign corporation earns U.S. source income. In certain circumstances, U.S. Shareholders may be able to choose the benefits of Section 904(h)(10) of the Code and elect to treat dividends that would otherwise be U.S. source dividends as foreign source dividends, but in such a case the foreign tax credit limitations would be separately determined with respect to such “resourced” income. In general, therefore, the application of Section 904(h) of the Code may adversely affect a U.S. Shareholder’s ability to use foreign tax credits. FCA does not believe that it is 50 percent or more owned by U.S. persons, but this conclusion is a factual determination and is subject to change; no assurance can therefore be given that FCA may not be treated as 50 percent or more owned by U.S. persons for purposes of Section 904(h) of the Code. U.S. Shareholders are strongly urged to consult their own tax advisors regarding the possible impact if Section 904(h) of the Code should apply.
Taxation of Capital GainsSubject to the discussion of PFIC taxation below, a U.S. Shareholder that sells or otherwise disposes of its FCA common shares will recognize capital gain or loss for U.S. federal income tax purposes equal to the difference between the U.S. Dollar value of the amount that the U.S. Shareholder realizes and the U.S. Shareholder’s tax basis in those shares. Capital gain of a noncorporate U.S. Shareholder is generally taxed at preferential rates where the property is held for more than one year. The gain or loss will be U.S. source income or loss for foreign tax credit limitation purposes. The deduction of capital losses is subject to limitations.

298 2018 | ANNUAL REPORT
Loyalty Voting StructureNO STATUTORY, JUDICIAL OR ADMINISTRATIVE AUTHORITY DIRECTLY DISCUSSES HOW THE RECEIPT, OWNERSHIP OR DISPOSITION OF SPECIAL VOTING SHARES SHOULD BE TREATED FOR U.S. FEDERAL INCOME TAX PURPOSES AND AS A RESULT, THE U.S. FEDERAL INCOME TAX CONSEQUENCES ARE UNCERTAIN. ACCORDINGLY, WE URGE U.S. SHAREHOLDERS TO CONSULT THEIR TAX ADVISOR AS TO THE TAX CONSEQUENCES OF THE RECEIPT, OWNERSHIP AND DISPOSITION OF SPECIAL VOTING SHARES.
If a U.S. Shareholder receives special voting shares after requesting all or some of the number of its FCA common shares be registered on the Loyalty Register, the tax consequences of the receipt of special voting shares is unclear. While distributions of stock are tax-free in certain circumstances, the distribution of special voting shares would be taxable if it were considered to result in a “disproportionate distribution.” A disproportionate distribution is a distribution or series of distributions, including deemed distributions, that have the effect of the receipt of cash or other property by some shareholders of FCA and an increase in the proportionate interest of other shareholders of FCA in FCA’s assets or earnings and profits. It is possible that the distribution of special voting shares to a U.S. Shareholder that has requested all or some of the number of its FCA common shares be registered on the Loyalty Register and a distribution of cash in respect of FCA common shares could be considered together to constitute a “disproportionate distribution.” Unless FCA has not paid cash dividends in the 36 months prior to a U.S. Shareholder’s receipt of special voting shares and FCA does not intend to pay cash dividends in the 36 months following a U.S. Shareholder’s receipt of special voting shares, FCA intends to treat the receipt of special voting shares as a distribution that is subject to tax as described above in “Consequences of Owning FCA Stock—Taxation of Dividends.” The amount of the dividend should equal the fair market value of the special voting shares received. For the reasons stated above, FCA believes and intends to take the position that the value of each special voting share is minimal. However, because the fair market value of the special voting shares is factual and is not governed by any guidance that directly addresses such a situation, the IRS could assert that the value of the special voting shares (and thus the amount of the dividend) as determined by FCA is incorrect.
Ownership of Special Voting SharesFCA believes that U.S. Shareholders holding special voting shares should not have to recognize income in respect of amounts transferred to the special voting shares dividend reserve that are not paid out as dividends. Section 305 of the Code may, in certain circumstances, require a holder of preferred shares to recognize income even if no dividends are actually received on such shares if the preferred shares are redeemable at a premium and the redemption premium results in a “constructive distribution.” Preferred shares for this purpose refer to shares that do not participate in corporate growth to any significant extent. FCA believes that Section 305 of the Code should not apply to any amounts transferred to the special voting shares dividend reserve that are not paid out as dividends so as to require current income inclusion by U.S. Shareholders because, among other things, (i) the special voting shares are not redeemable on a specific date and a U.S. Shareholder is only entitled to receive amounts in respect of the special voting shares upon liquidation, (ii) Section 305 of the Code does not require the recognition of income in respect of a redemption premium if the redemption premium does not exceed a de minimis amount and, even if the amounts transferred to the special voting shares dividend reserve that are not paid out as dividends are considered redemption premium, the amount of the redemption premium is likely to be “de minimis” as such term is used in the applicable Treasury Regulations. FCA therefore intends to take the position that the transfer of amounts to the special voting shares dividend reserve that are not paid out as dividends does not result in a “constructive distribution,” and this determination is binding on all U.S. Shareholders of special voting shares other than a U.S. Shareholder that explicitly discloses its contrary determination in the manner prescribed by the applicable regulations. However, because the tax treatment of the loyalty voting structure is unclear and because FCA’s determination is not binding on the IRS, it is possible that the IRS could disagree with FCA’s determination and require current income inclusion in respect of such amounts transferred to the special voting shares dividend reserve that are not paid out as dividends.
Other Information
Additional Information for U.S. Listing Purposes
2018 | ANNUAL REPORT 299
Disposition of Special Voting SharesThe tax treatment of a U.S. Shareholder that has its special voting shares redeemed for zero consideration after removing its common shares from the Loyalty Register is unclear. It is possible that a U.S. Shareholder would recognize a loss to the extent of the U.S. Shareholder’s basis in its special voting shares, which should equal (i) if the special voting shares were received in connection with the Merger, the basis allocated to the special voting shares, and (ii) if the special voting shares were received after the requisite holding period on the Loyalty Register, the amount that was included in income upon receipt. Such loss would be a capital loss and would be a long-term capital loss if a U.S. Shareholder has held its special voting shares for more than one year. It is also possible that a U.S. Shareholder would not be allowed to recognize a loss upon the redemption of its special voting shares and instead a U.S. Shareholder should increase the basis in its FCA common shares by an amount equal to the basis in its special voting shares. Such basis increase in a U.S. Shareholder’s FCA common shares would decrease the gain, or increase the loss, that a U.S. Shareholder would recognize upon the sale or other taxable disposition of its FCA common shares.
THE U.S. FEDERAL INCOME TAX TREATMENT OF THE LOYALTY VOTING STRUCTURE IS UNCLEAR AND U.S. SHAREHOLDERS ARE URGED TO CONSULT THEIR TAX ADVISORS IN RESPECT OF THE CONSEQUENCES OF ACQUIRING, OWNING, AND DISPOSING OF SPECIAL VOTING SHARES.
PFIC Considerations—Consequences of Holding FCA StockFCA believes that shares of its stock are not stock of a PFIC for U.S. federal income tax purposes, but this conclusion is based on a factual determination made annually and thus is subject to change. As discussed in greater detail below, if shares of FCA stock were to be treated as stock of a PFIC, gain realized (subject to the discussion below regarding a mark-to-market election) on the sale or other disposition of shares of FCA stock would not be treated as capital gain, and a U.S. Shareholder would be treated as if such U.S. Shareholder had realized such gain and certain “excess distributions” ratably over the U.S. Shareholder’s holding period for its shares of FCA stock and would be taxed at the highest tax rate in effect for each such year to which the gain was allocated, together with an interest charge in respect of the tax attributable to each such year. With certain exceptions, a U.S. Shareholder’s shares of FCA stock would be treated as stock in a PFIC if FCA were a PFIC at any time during such U.S. Shareholder’s holding period in the shares. Dividends received from FCA would not be eligible for the special tax rates applicable to qualified dividend income if FCA were treated as a PFIC in the taxable years in which the dividends are paid or in the preceding taxable year (regardless of whether the U.S. holder held shares of FCA stock in such year) but instead would be taxable at rates applicable to ordinary income.
FCA would be a PFIC with respect to a U.S. Shareholder if for any taxable year in which the U.S. Shareholder held shares of FCA stock, after the application of applicable “look-through rules”:
75 percent or more of FCA’s gross income for the taxable year consists of “passive income” (including dividends, interest, gains from the sale or exchange of investment property and rents and royalties other than rents and royalties which are received from unrelated parties in connection with the active conduct of a trade or business, as defined in applicable Treasury Regulations); or
at least 50 percent of its assets for the taxable year (averaged over the year and determined based upon value) produce or are held for the production of passive income.
Because the determination whether a foreign corporation is a PFIC is primarily factual and there is little administrative or judicial authority on which to rely to make a determination, the IRS might not agree that FCA is not a PFIC. Moreover, no assurance can be given that FCA would not become a PFIC for any future taxable year if there were to be changes in FCA’s assets, income or operations.
If FCA were to be treated as a PFIC for any taxable year (and regardless of whether FCA remains a PFIC for subsequent taxable years), each U.S. Shareholder that is treated as owning FCA stock for purposes of the PFIC rules (i) would be liable to pay U.S. federal income tax at the highest applicable income tax rates on (a) ordinary income upon the receipt of excess distributions (the portion of any distributions received by the U.S. Shareholder on FCA stock in a taxable year in excess of 125 percent of the average annual distributions received by the U.S. Shareholder in the three preceding taxable years or, if shorter, the U.S. Shareholder’s holding period for the FCA stock) and (b) on any gain from the disposition of FCA stock, plus interest on such amounts, as if such excess distributions or gain had been recognized ratably over the U.S. Shareholder’s holding period of the FCA stock, and (ii) may be required to annually file Form 8621 with the IRS reporting information concerning FCA.

300 2018 | ANNUAL REPORT
If FCA were to be treated as a PFIC for any taxable year and provided that FCA common shares are treated as “marketable stock” within the meaning of applicable Treasury Regulations, which FCA believes will be the case, a U.S. Shareholder may make a mark-to-market election. Under a mark-to-market election, any excess of the fair market value of the FCA common shares at the close of any taxable year over the U.S. Shareholder’s adjusted tax basis in the FCA common shares is included in the U.S. Shareholder’s income as ordinary income. These amounts of ordinary income would not be eligible for the favorable tax rates applicable to qualified dividend income or long-term capital gains. In addition, the excess, if any, of the U.S. Shareholder’s adjusted tax basis at the close of any taxable year over the fair market value of the FCA common shares is deductible in an amount equal to the lesser of the amount of the excess or the amount of the net mark-to-market gains that the U.S. Shareholder included in income in prior years. A U.S. Shareholder’s tax basis in FCA common shares would be adjusted to reflect any such income or loss. Gain realized on the sale, exchange or other disposition of FCA common shares would be treated as ordinary income, and any loss realized on the sale, exchange or other disposition of FCA common shares would be treated as ordinary loss to the extent that such loss does not exceed the net mark-to-market gains previously included by the U.S. Shareholder. It is not expected that the special voting shares would be treated as “marketable stock” and eligible for the mark-to-market election.
The adverse consequences of owning stock in a PFIC could also be mitigated if a U.S. Shareholder makes a valid “qualified electing fund” election, or QEF election, which, among other things, would require a U.S. Shareholder to include currently in income its pro rata share of the PFIC’s net capital gain and ordinary earnings, based on earnings and profits as determined for U.S. federal income tax purposes. Because of the administrative burdens involved, FCA does not intend to provide information to its shareholders that would be required to make such election effective.
A U.S. Shareholder which holds FCA stock during a period when FCA is a PFIC will be subject to the foregoing rules for that taxable year and all subsequent taxable years with respect to that U.S. Shareholder’s holding of FCA stock, even if FCA ceases to be a PFIC, subject to certain exceptions for U.S. Shareholders which made a mark-to-market or QEF election. U.S. Shareholders are strongly urged to consult their tax advisors regarding the PFIC rules, and the potential tax consequences to them if FCA were determined to be a PFIC.
Medicare Tax on Net Investment IncomeA U.S. person that is an individual or estate, or a trust that does not fall into a special class of trusts that is exempt from such tax, is subject to a 3.8 percent tax, the Medicare tax, on the lesser of (i) the U.S. person’s “net investment income” (or undistributed net investment income in the case of an estate or trust) for the relevant taxable year and (ii) the excess of the U.S. person’s modified adjusted gross income for the taxable year over a certain threshold (which in the case of individuals is between U.S.$125,000 and U.S.$250,000, depending on the individual’s circumstances). A shareholder’s net investment income generally includes its dividend income and its net gains from the disposition of shares, unless such dividends or net gains are derived in the ordinary course of the conduct of a trade or business (other than a trade or business that consists of certain passive or trading activities). If a shareholder is a U.S. person that is an individual, estate or trust, the shareholder is urged to consult the shareholder’s tax advisors regarding the applicability of the Medicare tax to the shareholder’s income and gains in respect of the shareholder’s investment in FCA stock.
Information with Respect to Foreign Financial AssetsOwners of “specified foreign financial assets” with an aggregate value in excess of U.S.$50,000, (and in some cases, a higher threshold) may be required to file an information report with respect to such assets with their tax returns. “Specified foreign financial assets” include any financial accounts maintained by foreign financial institutions, as well as any of the following, but only if they are held for investment and not held in accounts maintained by financial institutions: (i) stocks and securities issued by non-U.S. persons; (ii) financial instruments and contracts that have non-U.S. issuers or counterparties; and (iii) interests in foreign entities. U.S. Shareholders are urged to consult their tax advisors regarding the application of this legislation to their ownership of FCA stock.
Other Information
Additional Information for U.S. Listing Purposes

2018 | ANNUAL REPORT 301
Backup Withholding and Information ReportingInformation reporting requirements for a noncorporate U.S. Shareholder, on IRS Form 1099, will apply to:
dividend payments or other taxable distributions made to such U.S. Shareholder within the U.S.; and
the payment of proceeds to such U.S. Shareholder from the sale of FCA stock effected at a U.S. office of a broker.
Additionally, backup withholding (currently at a 24 percent rate) may apply to such payments to a non-corporate U.S. Shareholder that:
fails to provide an accurate taxpayer identification number;
is notified by the IRS that such U.S. Shareholder has failed to report all interest and dividends required to be shown on such U.S. Shareholder’s federal income tax returns; or
in certain circumstances, fails to comply with applicable certification requirements.
A person may obtain a refund of any amounts withheld under the backup withholding rules that exceed the person’s income tax liability by properly filing a refund claim with the IRS.
Material Netherlands Tax ConsequencesThis section describes solely the material Dutch tax consequences of the acquisition, ownership and disposal of FCA common shares and, if applicable, FCA special voting shares by Non-resident holders of such shares (as defined below). It does not consider every aspect of Dutch taxation that may be relevant to a particular holder of FCA common shares and, if applicable, FCA special voting shares in special circumstances or who is subject to special treatment under applicable law. Shareholders and any potential investor should consult their own tax advisors regarding the Dutch tax consequences of acquiring, owning and disposing of FCA common shares and, if applicable, FCA special voting shares in their particular circumstances.
Where in this section English terms and expressions are used to refer to Dutch concepts, the meaning to be attributed to such terms and expressions shall be the meaning to be attributed to the equivalent Dutch concepts under Dutch tax law. Where in this section the terms “the Netherlands” and “Dutch” are used, these refer solely to the European part of the Kingdom of the Netherlands. This summary also assumes that the board shall control the conduct of the affairs of FCA and shall procure that FCA is organized in accordance with the facts, based upon which the competent authorities of the United Kingdom and The Netherlands have ruled that FCA should be treated as solely resident of the United Kingdom for the application of the tax treaty as concluded between the United Kingdom and The Netherlands. A change in facts and circumstances based upon which the ruling was issued may invalidate the contents of this section, which will not be updated to reflect any such change.
This description is based on the tax law of the Netherlands (unpublished case law not included) as it stands at the date of this Form. The law upon which this description is based is subject to change, possibly with retroactive effect. Any such change may invalidate the contents of this description, which will not be updated to reflect such change.
Where in this Dutch taxation discussion reference is made to “a holder of FCA common shares and, if applicable, FCA special voting shares”, that concept includes, without limitation:
1. an owner of one or more FCA common shares and/or FCA special voting shares who in addition to the title to such FCA common shares and/or FCA special voting shares, has an economic interest in such FCA common shares and/or FCA special voting shares;
2. a person who or an entity that holds the entire economic interest in one or more FCA common shares and/or FCA special voting shares;
3. a person who or an entity that holds an interest in an entity, such as a partnership or a mutual fund, that is transparent for Dutch tax purposes, the assets of which comprise one or more FCA common shares and/or FCA special voting shares, within the meaning of 1. or 2. above; or
4. a person who is deemed to hold an interest in FCA common shares and/or FCA special voting shares, as referred to under 1. to 3., pursuant to the attribution rules of article 2.14a, of the Dutch Income Tax Act 2001 (Wet inkomstenbelasting 2001), with respect to property that has been segregated, for instance in a trust or a foundation.

302 2018 | ANNUAL REPORT
Scope of the summaryThe summary of Dutch taxes set out in this section “Material Dutch tax consequences” only applies to a holder of FCA common shares and, if applicable FCA special voting shares who is a Non-Resident holder of such shares. For the purpose of this summary a holder of FCA common shares and, if applicable FCA special voting shares is a Non-Resident holder of such shares if such holder is neither a resident nor deemed to be resident in The Netherlands for purposes of Dutch income tax or corporation tax as the case may be.
This summary does not describe the tax considerations for holders of FCA common shares and, if applicable FCA special voting shares who are individuals and derive benefits from FCA common shares and, if applicable FCA special voting shares that are a remuneration or deemed to be a remuneration in connection with past, present or future employment performed in The Netherlands or management activities and functions or membership of a management board (bestuurder) or a supervisory board (commissaris) of a Netherlands resident entity by such holder or certain individuals related to such holder (as defined in The Dutch Income Tax Act 2001).
Taxes on income and capital gainsA Non-Resident holder (as defined above) of FCA common shares and, if applicable, FCA special voting shares will not be subject to any Dutch taxes on income or capital gains in respect of any benefits derived or deemed to be derived by such holder from such holder’s FCA common shares and, if applicable, FCA special voting shares, including any capital gain realized on the disposal thereof, unless:
such holder derives profits from an enterprise directly, or pursuant to a co-entitlement to the net value of such enterprise, other than as a holder of securities, which enterprise either is managed in the Netherlands or carried on, in whole or in part, through a permanent establishment or a permanent representative which is taxable in the Netherlands, and such holder’s FCA common shares and, if applicable, FCA special voting shares are attributable to such enterprise; or
such holder is an individual and such holder derives benefits from FCA common shares and, if applicable, FCA special voting shares that are taxable as benefits from miscellaneous activities (resultaat uit overige werkzaamheden) in the Netherlands. Such holder may, inter alia, derive, or be deemed to derive, benefits from FCA common shares and, if applicable, FCA special voting shares that are taxable as benefits from miscellaneous activities if such holder’s investment activities go beyond the activities of an active portfolio investor, for instance in the case of use of insider knowledge or comparable forms of special knowledge.
Benefits derived or deemed to be derived from certain miscellaneous activities by a child or a foster child who is under eighteen years of age are attributed to the parent who exercises, or the parents who exercise, authority over the child, irrespective of the country of residence of the child.
Dividend withholding taxFCA is generally required to withhold Dutch dividend withholding tax at a rate of 15 percent from dividends distributed by it. However, the competent authorities of the United Kingdom and The Netherlands have ruled that FCA is resident of the United Kingdom for the application of the tax treaty as concluded between The Netherlands and the United Kingdom. Consequently payments made by FCA on the common shares and or the special voting shares to non-resident shareholders may be made free from Dutch dividend withholding tax.
Gift and inheritance taxesIf a holder of FCA common shares and, if applicable, FCA special voting shares disposes of FCA common shares and, if applicable, FCA special voting shares by way of gift, in form or in substance, or if a holder of FCA common shares and, if applicable, FCA special voting shares who is an individual dies, no Dutch gift tax or Dutch inheritance tax, as applicable, will be due, unless:
the donor is, or the deceased was, resident or deemed to be resident in the Netherlands for purposes of Dutch gift tax or Dutch inheritance tax, as applicable; or
Other Information
Additional Information for U.S. Listing Purposes
2018 | ANNUAL REPORT 303
the donor made a gift of FCA common shares and, if applicable, FCA special voting shares, then became a resident or deemed resident of the Netherlands, and died as a resident or deemed resident of the Netherlands within 180 days of the date of the gift.
For purposes of the above, a gift of FCA common shares and, if applicable, FCA special voting shares made under a condition precedent is deemed to be made at the time the condition precedent is satisfied.
Value Added TaxNo Dutch value added tax will arise in respect of any payment in consideration for the issue of FCA common shares and, if applicable, FCA special voting shares.
Registration taxes and dutiesNo Dutch registration tax, transfer tax, stamp duty or any other similar documentary tax or duty, other than court fees, is payable in the Netherlands by a holder in respect of or in connection with (i) the subscription, issue, placement or allotment of FCA common shares and, if applicable, FCA special voting shares, (ii) the enforcement by way of legal proceedings (including the enforcement of any foreign judgment in the courts of the Netherlands) of the documents relating to the issue of FCA common shares and, if applicable, FCA special voting shares or the performance by FCA of FCA’s obligations under such documents, or (iii) the transfer of FCA common shares and, if applicable, FCA special voting shares.
Material UK Tax ConsequencesThis section describes the material United Kingdom tax consequences of the ownership of FCA common shares for U.S. Shareholders. It does not purport to be a complete analysis of all potential UK tax consequences of holding FCA common shares. This section is based on current UK tax law and what is understood to be the current practice of H.M. Revenue and Customs, as well as on applicable tax treaties. This law and practice and these treaties are subject to change, possibly on a retroactive basis.
This section applies only to shareholders of FCA that are U.S. Shareholders, that are not resident or domiciled in the UK, that are not individuals temporarily non-resident in the UK for a period of up to five years, that hold their shares as an investment (other than through an individual savings account), and that are the absolute beneficial owner of both the shares and any dividends paid on them. This section does not apply to members of any special class of shareholders subject to special rules, such as:
a pension fund;
a charity;
persons acquiring their shares in connection with an office or employment;
a dealer in securities;
an insurance company; or
a collective investment scheme.
In addition, this section may not apply to:
any shareholders that, either alone or together, with one or more associated persons, such as personal trusts and connected persons, control directly or indirectly at least ten percent of the voting rights or of any class of share capital of FCA; or
any person holding shares as a borrower under a stock loan or an interim holder under a repo.
Shareholders should consult their own tax advisors on the UK tax consequences of owning and disposing of FCA common shares in their particular circumstances.

304 2018 | ANNUAL REPORT
Tax Consequences of Owning FCA Common Shares
Taxation of DividendsDividend payments may be made without withholding or deduction for or on account of UK income tax.
A U.S. Shareholder will not be liable to account for income or corporation tax in the UK on dividends paid on the shares unless the shareholder carries on a trade (or profession or vocation) in the UK and the dividends are either a receipt of that trade or, in the case of corporation tax, the shares are held by or for a UK permanent establishment through which the trade is carried on (unless, if certain conditions are met, the trade is carried on through an independent broker or investment manager).
Taxation of Capital GainsA disposal of FCA common shares by a shareholder that is not resident in the United Kingdom for tax purposes will not give rise to a chargeable gain or allowable loss unless that shareholder carries on a trade, profession or vocation in the United Kingdom through a branch, agency or permanent establishment (excluding, if certain conditions are met, an independent broker or investment manager) and has used, held or acquired FCA common shares for the purposes of that trade, profession or vocation or that branch, agency or permanent establishment.
Stamp Duty and Stamp Duty Reserve TaxNo liability to UK stamp duty or Stamp Duty Reserve Tax (“SDRT”) will arise on the issue of FCA common shares to shareholders. FCA will not maintain any share register in the UK and, accordingly, (i) UK stamp duty will not normally be payable in connection with a transfer of common shares, provided that the instrument of transfer is executed and retained outside the UK and no other action is taken in the UK by the transferor or transferee, and (ii) no UK SDRT will be payable in respect of any agreement to transfer FCA common shares.
Tax Consequences of Participating in the Loyalty Voting StructureA U.S. Shareholder that would not be subject to tax on dividends or capital gains in respect of FCA common shares will not be subject to tax in respect of the special voting shares.
FCA will not maintain any share register in the UK and, accordingly, no liability to UK stamp duty or SDRT will arise to shareholders on the issue or repurchase of special voting shares.
Other Information
Additional Information for U.S. Listing Purposes

2018 | ANNUAL REPORT 305
Exhibits
ExhibitNumber Description of Documents
1.1 English translation of the Articles of Association of Fiat Chrysler Automobiles N.V. (incorporated by reference to Exhibit 3.1 to Amendment No. 3 to Registration Statement on Form F-1, filed with the SEC on December 4, 2014, File No. 333-199285)
1.2 English translation of the Deed of Incorporation of Fiat Chrysler Automobiles N.V. (incorporated by reference to Exhibit 3.2 to Registration Statement on Form F-4, filed with the SEC on July 3, 2014, File No. 333-197229)
2.1 Terms and Conditions of the Global Medium Term Notes (incorporated by reference to Exhibit 4.1 to Registration Statement on Form F-4, filed with the SEC on July 3, 2014, File No. 333-197229)
2.2 Deed of Guarantee, dated as of March 19, 2013, by Fiat S.p.A. in favor of the Relevant Account Holders and the holders for the time being of the Global Medium Term Notes and the interest coupons appertaining to the Global Medium Term Notes (incorporated by reference to Exhibit 4.2 to Registration Statement on Form F-4, filed with the SEC on July 3, 2014, File No. 333-197229)
2.3 Indenture, dated as of April 14, 2015, between Fiat Chrysler Automobiles N.V. and The Bank of New York Mellon, as Trustee, relating to senior debt securities (incorporated by reference to Exhibit 4.1 to Report on Form 6-K, filed with the SEC on April 16, 2015, File No. 001-36676)
2.4 Form of 4.500% Global Security for Exchange Notes due 2020 (incorporated by reference to Exhibit 4.3 to Registration Statement on Form F-4, filed with the SEC on May 19, 2015, File No. 333-204303)
2.5 Form of 5.250% Global Security for Exchange Notes due 2023 (incorporated by reference to Exhibit 4.4 to Registration Statement on Form F-4, filed with the SEC on May 19, 2015, File No. 333-204303)There have not been filed as exhibits to this Form 20-F certain long-term debt instruments, none of which relates to indebtedness that exceeds 10% of the consolidated assets of Fiat Chrysler Automobiles N.V. Fiat Chrysler Automobiles N.V. agrees to furnish the Securities and Exchange Commission, upon its request, a copy of any instrument defining the rights of holders of long-term debt of Fiat Chrysler Automobiles N.V. and its consolidated subsidiaries.
4.1 Fiat Chrysler Automobiles N.V. Equity Incentive Plan (incorporated by reference to Exhibit 4.2 to Registration Statement on Form S-8, filed with the SEC on January 12, 2015, File No. 333-201440)
4.2 Fiat Chrysler Automobiles N.V. Remuneration Policy (incorporated by reference to Exhibit 4.3 to Registration Statement on Form S-8, filed with the SEC on January 12, 2015, File No. 333-201440)
8.1 Subsidiaries
12.1 Section 302 Certification of the Chief Executive Officer
12.2 Section 302 Certification of the Chief Financial Officer
13.1 Certification of the Chief Executive Officer Pursuant to 18 U.S.C. Section 1350, As Adopted Pursuant to Section 906 of the Sarbanes-Oxley Act of 2002
13.2 Certification of the Chief Financial Officer Pursuant to 18 U.S.C. Section 1350, As Adopted Pursuant to Section 906 of the Sarbanes-Oxley Act of 2002
23 Consent of Independent Registered Public Accounting Firm
101.INS XBRL Instance Document
101.SCH XBRL Taxonomy Extension Schema Document
101.CAL XBRL Taxonomy Extension Calculation Linkbase Document
101.DEF XBRL Taxonomy Extension Definition Linkbase Document
101.LAB XBRL Taxonomy Extension Label Linkbase Document
101.PRE XBRL Taxonomy Extension Presentation Linkbase Document

306 2018 | ANNUAL REPORT
Company Financial Statements
Notes to the Company Financial Statements

2018 | ANNUAL REPORT
Company Financial Statements
Notes to the Company Financial Statements
307
Independent Auditor’s Report

308 2018 | ANNUAL REPORT
Independent Auditor’s Report
Independent Auditor’s ReportTo: the shareholders and audit committee of Fiat Chrysler Automobiles N.V.
Report on the audit of the financial statements 2018 included in the annual report
Our opinionWe have audited the financial statements 2018 of Fiat Chrysler Automobiles N.V. (the Company), incorporated in Amsterdam, the Netherlands. The financial statements include the consolidated financial statements and the Company financial statements (collectively referred to as the Financial statements).
In our opinion:
The accompanying consolidated financial statements give a true and fair view of the financial position of Fiat Chrysler Automobiles N.V. as at December 31, 2018 and of its result and its cash flows for 2018 in accordance with International Financial Reporting Standards as adopted by the European Union (EU-IFRS) and with Part 9 of Book 2 of the Dutch Civil Code
The accompanying Company financial statements give a true and fair view of the financial position of Fiat Chrysler Automobiles N.V. as at December 31, 2018 and of its result for 2018 in accordance with Part 9 of Book 2 of the Dutch Civil Code
The consolidated financial statements comprise:
The consolidated statement of financial position as at December 31, 2018
The following statements for 2018: consolidated income statement, the consolidated statements of comprehensive income, cash flows and changes in equity
The notes comprising a summary of the significant accounting policies and other explanatory information
The Company financial statements comprise:
The Company statement of financial position as at December 31, 2018
The Company income statement for 2018
The notes comprising a summary of the accounting policies and other explanatory information
Basis for our opinionWe conducted our audit in accordance with Dutch law, including the Dutch Standards on Auditing. Our responsibilities under those standards are further described in the “Our responsibilities for the audit of the financial statements” section of our report.
We are independent of Fiat Chrysler Automobiles N.V. in accordance with the EU Regulation on specific requirements regarding statutory audit of public-interest entities, the Wet toezicht accountants organisaties (Wta, Audit firms supervision act), the Verordening inzake de onafhankelijkheid van accountants bij assurance-opdrachten (ViO, Code of Ethics for Professional Accountants, a regulation with respect to independence) and other relevant independence regulations in the Netherlands. Furthermore we have complied with the Verordening gedrags - en beroepsregels accountants (VGBA, Dutch Code of Ethics).
We believe the audit evidence we have obtained is sufficient and appropriate to provide a basis for our opinion.

2018 | ANNUAL REPORT 309
Materiality
Materiality €370 million (2017: €400 million)
Benchmark applied 5% of Adjusted EBIT (earnings before interest and income taxes)
Explanation Based on our professional judgement we consider Adjusted EBIT as an appropriate benchmark to determine materiality as we believe this is an important measure of the Company’s performance.
Last year, the applied Adjusted EBIT included a forward looking element while this year it is based on the actual Adjusted EBIT reported.
We have also taken misstatements into account and/or possible misstatements that in our opinion are material for the users of the financial statements for qualitative reasons.
We agreed with the audit committee that misstatements in excess of €20 million, which are identified during the audit, would be reported to them, as well as smaller misstatements that in our view must be reported on qualitative grounds.
Scope of the group auditFiat Chrysler Automobiles N.V. is the parent of a group of entities. The financial information of this group is included in the consolidated financial statements of Fiat Chrysler Automobiles N.V. The Company is organized along operating segments and has identified five reportable segments being NAFTA, EMEA, LATAM, APAC, and Maserati, along with certain other corporate functions and unallocated items which are not included within the reportable segments.
Our group audit mainly focused on significant group entities. Group entities are considered significant components either because of their individual financial significance or because they are likely to include significant risks of material misstatement due to their specific nature or circumstances. All such significant group entities (comprising 41 entities) were included in the scope of our group audit.
Accordingly, we identified 5 of Fiat Chrysler Automobiles N.V.’s group entities, which, in our view, required an audit of their complete financial information due to their overall size and their risk characteristics. Specific scope audit procedures on certain balances and transactions were performed on 19 entities. Other procedures are performed on a further 17 entities. The remaining 291 components which are not included in our group scope have been subject to risk assessment analytics.
In establishing the overall approach to the audit, we determined the type of work that is needed to be done by us, as group auditors, or by component auditors from Ernst & Young Global member firms and operating under our instructions. The following matters are audited directly by the group audit team:
The group consolidation, financial statements and disclosures and the audit of the key audit matters:
Valuation of goodwill and other non-current assets with indefinite useful lives, with particular reference to APAC goodwill,
Recoverability of non-current assets with definite useful lives with particular reference to EMEA,
Income taxes with focus on recoverability of the Italian deferred tax assets
The two other key audit matters, provision for NAFTA product warranty and recall campaigns and US emission investigations were audited by the US component team under our direction and supervision.
The group engagement team visited at least once the local management and their auditors of the components which are significant based on size and their related risk: FCA US, FCA Italy and FCA Brasil. For each of these locations we reviewed the audit files of the component auditor and determined the sufficiency and appropriateness of the work performed.

310 2018 | ANNUAL REPORT
Independent Auditor’s Report
The group engagement team visited FCA management in China for CHRYSLER GR. (CHINA) LTD, FCA AUTOM FINANCE CO LTD and MASERATI (CHINA) CARS CO. In addition, we have visited their component auditors as part of our direction and supervision of the group audit.
All component audit teams included in the group scope received detailed instructions from the group engagement team including key risk areas and significant accounts and the group engagement team reviewed their deliverables.
In total these procedures represent 100% of the group’s total assets and 100% of revenues.
Full scope Specific scope Other procedures including risk assessment analytics
By performing the procedures mentioned above at group entities, together with additional procedures at group level, we have been able to obtain sufficient and appropriate audit evidence about the group’s financial information to provide an opinion about the consolidated financial statements.
Our key audit mattersKey audit matters are those matters that, in our professional judgement, were of most significance in our audit of the financial statements. We have communicated the key audit matters to the audit committee. The key audit matters are not a comprehensive reflection of all matters discussed.
These matters were addressed in the context of our audit of the financial statements as a whole and in forming our opinion thereon, and we do not provide a separate opinion on these matters. This year two new key audit matters related to the recoverability of non-current assets with definite useful lives with particular reference to EMEA and the US emissions investigations have been added.
Revenues Total Assets
2018 | ANNUAL REPORT 311
Valuation of goodwill and other non-current assets with indefinite useful lives, with particular reference to APAC goodwill
Risk At December 31, 2018 the recorded amount of goodwill and other non-current assets with indefinite useful lives was €10,834 million and €3,136 million respectively. These amounts have primarily been allocated to the Company’s four cash generating units (‘CGU’) that align with the mass market operating segments (NAFTA, APAC, LATAM and EMEA) as set out in note 9. The amount of goodwill allocated to APAC was €1.1 billion.
The Company’s assessment of the recoverable amount of each CGU involves judgement about the future performance of the business and the discount rates applied to future cash flow forecasts.
Specifically for APAC, expected future cash flows are sensitive to certain assumptions, primarily the expected margins for the terminal period which directly impact the valuation of goodwill.
Considering the level of judgement and complexity of the assumptions applied in estimating the recoverable amount we have determined that this area constitutes a significant risk.
Our audit approach We designed and performed the following audit procedures to be responsive to this risk:• We obtained an understanding of the impairment assessment processes and evaluated the design and tested
the effectiveness of controls in this area relevant to our audit.• We validated that the level at which goodwill and other non-current assets are tested continues to be
appropriate. We tested the carrying amounts included in the impairment tests.• We evaluated whether the impairment methodology applied by the Company is in line with the requirements
per IAS 36, Impairment of Assets• We obtained an understanding of the work performed by the management specialists used for the valuation.• We performed procedures to assess the reasonableness of cash flow forecasts including comparisons to
industry forecasts and sector data.
In addition, we:• Reconciled the cash flow forecasts for each CGU to the Group’s business plan for the period 2019-2022.• Evaluated the appropriateness of the use of these forecasts in light of the historical accuracy of the Company’s
forecasts.• Tested the operational margins, discount rates and long term growth rates applied within the model were
assessed by EY valuation specialists who independently performed their own calculations and also performed sensitivity analyses of key assumptions for each CGU to determine which changes could materially impact the valuation of the recoverable amount.
Finally, we reviewed the adequacy of the disclosures made in Note 2, Basis of preparation by the Company in this area, in particular focusing on whether any reasonable possible changes in key assumptions will lead to an impairment of goodwill.
Key observations Based on the results of our work, we agree with the Company’s conclusion that no impairment of goodwill is required in the current year.
With regards to APAC, as the carrying amount of goodwill is sensitive to certain assumptions, primarily the expected margins for the terminal period, we agree with the additional disclosure made in the consolidated financial statements.

312 2018 | ANNUAL REPORT
Independent Auditor’s Report
Income taxes - recoverability of the Italian deferred tax assets
Risk At December 31, 2018, the Company had deferred tax assets on deductible temporary differences of €6,064 million which were recognized and €898 million which were not recognized. At the same date the Company also had deferred tax assets in respect of tax losses carried forward of €976 million which were recognized and €3,987 million which were not recognized. The recognized and unrecognized amounts related to Italy are €884 million and €2,486 million respectively.
The recognition and recoverability of the deferred tax assets in Italy were significant to our audit because the amounts are material and the assessment of the amounts of deferred tax assets to be recognized involves judgements and estimates in relation to future taxable profits and hence the capacity to utilize available tax assets in both these tax jurisdictions.
The disclosures in relation to income taxes are included in note 7.
Our audit approach We designed the following audit procedures to be responsive to this risk:• We obtained an understanding of the income taxes process, and evaluated the design and tested the
effectiveness of controls in this area relevant to our audit.• We evaluated the forecast periods selected in determining the likelihood of the Group generating suitable future
profits to support the recognition of the deferred tax assets.• We have evaluated the Company’s assumptions and sensitivities in relation to the likelihood of generating
sufficient future taxable income, taking into account local tax regulations.• We evaluated the historical accuracy of forecasting taxable profits for this tax jurisdiction, the integrity of the
forecast models and consistency of the projections with both other forecasts made by the Company and with findings from other areas of our audit.
• We considered the appropriateness of the Company’s disclosures in respect of deferred tax.• We involved EY tax specialists to assist both the Group and component audit teams in performing these
procedures.
Key observations Based on the procedures performed, we concluded that the deferred tax asset balance for the Italian tax jurisdiction, at December 31, 2018, is materially correct.
Provision for NAFTA product warranty and recall campaigns
Risk At December 31, 2018 the provisions for product warranties and recall campaigns amounted to €6,760 million with the most significant amounts related to the NAFTA segment.
The Company establishes provisions for product warranty obligations, including the estimated cost of service and recall actions in the NAFTA region, at the time the vehicle is sold.
The estimated future costs of these actions are principally based on assumptions regarding the lifetime warranty costs of each vehicle line and each model year of that vehicle line, as well as historical claims experience for the vehicles. Estimates of the future costs of these actions are inevitably imprecise due to numerous uncertainties, especially related to the NAFTA region’s warranty and campaign provisions, including the recent enactment of new laws and regulations, the number of vehicles affected by a service or recall action and the nature of the corrective action that may result in adjustments to the established reserves. Costs associated with these actions are recorded in cost of sales in the Consolidated Income Statements.
Due to the size and the uncertainty and potential volatility of these estimated future costs and other factors, such as recently introduced new laws and regulations, changes in assumptions used could materially affect the result of the company’s operations.
The disclosures on warranty provisions are included in note 20.
Our audit approach We designed the following audit procedures to be responsive to this risk:• We obtained an understanding of the warranty process, evaluated the design of, and performed tests of
controls in this area.• We involved EY actuaries to evaluate the appropriateness of the Company’s methodology, evaluate and test
the basis for the assumptions developed and used in the determination of the warranty provisions, and to perform sensitivity analyses to evaluate the judgements made by management.
• EY actuaries determined their own independent range for the provision for the NAFTA product warranty and recall campaigns amount.
• We performed other substantive audit procedures to validate the data applied in the model including warranty payments made in the year and third party confirmations in respect of the completeness and accuracy of current year claims.
Finally, we reviewed the adequacy of the disclosures made by the Company in this area.
Key observations Based on the results of our procedures, including our assessment that the Company’s provision was within the range of possible outcomes independently determined by EY actuaries, we are satisfied that the NAFTA product warranty and recall campaigns provision is appropriate at December 31, 2018.

2018 | ANNUAL REPORT 313
Recoverability of non-current assets with definite useful lives with particular reference to EMEA
Risk At December 31, 2018 the non-current assets with definite useful lives amounted to €38,056 million. Non-current assets with definite useful lives include property, plant and equipment (€26,307 million), intangible assets (€11,749 million). Intangible assets with definite useful lives mainly consist of capitalized development expenditures primarily related to NAFTA and EMEA.
The recoverability of non-current assets with definite useful lives is based on the estimated future cash flows, using the Company’s current business plan, of the cash generating units to which the assets relate. The Company’s business plan could change in response to evolving requirements and emerging technologies, which may result in changes to Company’s estimated future cash flows and could affect the recoverability of Company’s non-current assets with definite useful lives. Any change in recoverability would be accounted for at the time such change to the business plan occurs.
As a result of the operational and financial performance in EMEA, the Company performed an impairment assessment on the non-current assets with definite useful lives of EMEA region.
Due to the size and the uncertainty and potential volatility of the estimated future volumes, contribution margin and other factors, such as new laws and regulations, used in the impairment test, any change in the assumptions used could materially affect the result of the company’s operations.
The disclosures on non-current assets with definite useful lives are included in note 10 and 11.
Our audit approach We designed the following audit procedures to be responsive to this risk:• We obtained an understanding of the impairment assessment processes and evaluated whether the
impairment methodology applied by the Company is in line with the requirements per IAS 36, Impairment of Assets.
• We involved our EY valuation specialists, to test the methodology used in performing the impairment test as of December 31, 2018, including:- Assessment of the impairment test model and evaluation of the discount rates applied within the model and
development of EY independent calculations.- Sensitivity analyses of key assumptions for each platform and alternative scenarios, to determine which
changes could materially impact the valuation of the recoverable amount.• We evaluated the other key assumption applied in determining the recoverable amount with particular
reference to volume, contribution margin, D&A, capex and contributory charge.• We validated that the CGUs (i.e., platforms) identified continue to be appropriate in the current year and tested
the allocation of asset to the carrying value of each platform.• We performed procedures to assess the reasonableness of cash flow forecasts for each platform, including
comparisons to industry forecasts and sector data.• We analyzed the consistency and reconciliation of the forecasted cash flow by platform to the EMEA regional
business plan as used in the goodwill impairment analysis.• We evaluated the appropriateness of the use of these forecasts in light of the historical accuracy of the
Company’s forecasts.• We performed controls and substantive testing over the Prospective Financial Information used for the
purposes of the impairment assessment.• We reviewed any subsequent events which might significantly impact the impairment conclusions reached.
Finally, we reviewed the adequacy of the disclosures made by the Company in this area, which is disclosed in Note 2, Basis of preparation.
Key observations We concur with the Company’s methodology used in performing the impairment test of EMEA segment as of December 31, 2018.
As the recoverability of the carrying amount of non-current assets with definite lives in EMEA depend on the development and launch of additional vehicles, we agree with the additional disclosure made in the consolidated financial statements.

314 2018 | ANNUAL REPORT
Independent Auditor’s Report
US emissions investigations
Risk On January 10, 2019, the Company announced that FCA US reached final settlements on civil, environmental and consumer claims with the U.S. Environmental Protection Agency (“EPA”), U.S. Department of Justice, the California Air Resources Board, the State of California, 49 other States, U.S. Customs and Border Protection and in connection with a putative class action on behalf of consumers, for which the Company has accrued €748 million.
The Company remains subject to diesel emissions-related investigations by the U.S. Securities and Exchange Commission and the U.S. Department of Justice, Criminal Division. In addition, the Company remains subject to a number of related private lawsuits and the potential for additional claims by consumers who choose not to participate in the class action settlement.
The US emissions investigation was elevated to a significant risk during our audit due to the material impact to the financial statements coupled with the uncertainty associated to the timing of the negotiations between the Company and the several counterparties, which might impact the determination of a reasonable range and the related accounting of the provision in the correct period.
Although the Company reached an agreement to settle certain aspects of this litigation in January 2019, and the related level of uncertainty and management judgement has been reduced to a lower level, the US emissions investigation was a matter that was of most significance in the audit of the consolidated financial statements as of and for the year ended December 31, 2018.
The disclosures on the US emissions investigation are included in note 25.
Our audit approach We designed the following audit procedures to be responsive to this risk:
General litigation matters:• We obtained an understanding of the Company’s process, evaluated the design of, and performed tests of
controls in this area.• Performed controls and substantive testing over the underlying calculations and supporting documentation.• We obtained internal and external legal opinions which supports management position.• We inquired with management, internal and external legal counsel to test the conclusions reached.• We use EY specialists in certain litigation matters.
With respect to the US emission settlement and related charge:• We monitored the progress of the US investigation and related settlement discussions through our 2018 audit
opinion date including obtaining and reviewing written communications between regulators and the Company.• We discussed the status and progression of the US investigation with the Company’s internal and external
counsel through the 2018 audit opinion date.• We reviewed the settlement amounts from the January 2019 subsequent event as compared to the September
30, 2018 provision, including the additional charge of €35 million ($41 million).• We reviewed the tax treatment of the various components of the settlement.• We monitored and evaluated management’s conclusions regarding the accounting impact of investigation
on the consolidated financial statements, including review of the Company’s accounting position paper and settlement agreements.
With respect to the open matters associated with the emissions investigation:• We continued our shadow review with the help of EY specialists, including a review of correspondence with
the various regulators and reviewing documentation submitted to the regulators in response to the ongoing investigation through the issuance of our auditor’s reports
Finally, we reviewed the adequacy of the disclosures made by the Company in this area.
Key observations Based on the procedures performed, we concur with the provisions for legal proceedings and disputes as of December 31, 2018.
With regards to the US Emissions investigations, we agree with the accounting for the settlements and the related charge as well as the disclosures made in the financial statements on the open matters associated with the US emissions investigations.

2018 | ANNUAL REPORT 315
Report on other information included in the annual reportIn addition to the financial statements and our auditor’s report thereon, the annual report contains other information that consists of:
The board report
Other information pursuant to Part 9 of Book 2 of the Dutch Civil Code
Based on the following procedures performed, we conclude that the other information:
Is consistent with the financial statements and does not contain material misstatements
Contains the information as required by Part 9 of Book 2 of the Dutch Civil Code
We have read the other information. Based on our knowledge and understanding obtained through our audit of the financial statements or otherwise, we have considered whether the other information contains material misstatements. By performing these procedures, we comply with the requirements of Part 9 of Book 2 of the Dutch Civil Code and the Dutch Standard 720. The scope of the procedures performed is substantially less than the scope of those performed in our audit of the financial statements.
Management is responsible for the preparation of the other information, including the board report in accordance with Part 9 of Book 2 of the Dutch Civil Code and other information as required by Part 9 of Book 2 of the Dutch Civil Code.
Report on other legal and regulatory requirements
EngagementWe were initially engaged by the audit committee of Fiat Chrysler Automobiles N.V. on October 28, 2014 to perform the audit of its 2014 financial statements and have continued as its statutory auditor since then.
No prohibited non-audit servicesWe have not provided prohibited non-audit services as referred to in Article 5(1) of the EU Regulation on specific requirements regarding statutory audit of public-interest entities.
Description of responsibilities for the financial statements
Responsibilities of management and the audit committee for the financial statementsManagement is responsible for the preparation and fair presentation of the financial statements in accordance with EU-IFRS and Part 9 of Book 2 of the Dutch Civil Code. Furthermore, management is responsible for such internal control as management determines is necessary to enable the preparation of the financial statements that are free from material misstatement, whether due to fraud or error.
As part of the preparation of the financial statements, management is responsible for assessing the Company’s ability to continue as a going concern. Based on the financial reporting frameworks mentioned, management should prepare the financial statements using the going concern basis of accounting unless management either intends to liquidate the Company or to cease operations, or has no realistic alternative but to do so. Management should disclose events and circumstances that may cast significant doubt on the company’s ability to continue as a going concern in the financial statements.
The audit committee is responsible for overseeing the company’s financial reporting process.

316 2018 | ANNUAL REPORT
Independent Auditor’s Report
Our responsibilities for the audit of the financial statementsOur objective is to plan and perform the audit engagement in a manner that allows us to obtain sufficient and appropriate audit evidence for our opinion.
Our audit has been performed with a high, but not absolute, level of assurance, which means we may not detect all material errors and fraud during our audit.
Misstatements can arise from fraud or error and are considered material if, individually or in the aggregate, they could reasonably be expected to influence the economic decisions of users taken on the basis of these financial statements. The materiality affects the nature, timing and extent of our audit procedures and the evaluation of the effect of identified misstatements on our opinion.
We have exercised professional judgement and have maintained professional skepticism throughout the audit, in accordance with Dutch Standards on Auditing, ethical requirements and independence requirements. Our audit included among others:
Identifying and assessing the risks of material misstatement of the financial statements, whether due to fraud or error, designing and performing audit procedures responsive to those risks, and obtaining audit evidence that is sufficient and appropriate to provide a basis for our opinion. The risk of not detecting a material misstatement resulting from fraud is higher than for one resulting from error, as fraud may involve collusion, forgery, intentional omissions, misrepresentations, or the override of internal control
Obtaining an understanding of internal control relevant to the audit in order to design audit procedures that are appropriate in the circumstances, but not for the purpose of expressing an opinion on the effectiveness of the Company’s internal control
Evaluating the appropriateness of accounting policies used and the reasonableness of accounting estimates and related disclosures made by management
Concluding on the appropriateness of management’s use of the going concern basis of accounting, and based on the audit evidence obtained, whether a material uncertainty exists related to events or conditions that may cast significant doubt on the Company’s ability to continue as a going concern. If we conclude that a material uncertainty exists, we are required to draw attention in our auditor’s report to the related disclosures in the financial statements or, if such disclosures are inadequate, to modify our opinion. Our conclusions are based on the audit evidence obtained up to the date of our auditor’s report. However, future events or conditions may cause a Company to cease to continue as a going concern
Evaluating the overall presentation, structure and content of the financial statements, including the disclosures
Evaluating whether the financial statements represent the underlying transactions and events in a manner that achieves fair presentation
Because we are ultimately responsible for the opinion, we are also responsible for directing, supervising and performing the group audit. In this respect we have determined the nature and extent of the audit procedures to be carried out for group entities. Decisive were the size and/or the risk profile of the group entities or operations. On this basis, we selected group entities for which an audit or review had to be carried out on the complete set of financial information or specific items.
We communicate with the audit committee regarding, among other matters, the planned scope and timing of the audit and significant audit findings, including any significant findings in internal control that we identify during our audit. In this respect we also submit an additional report to the audit committee in accordance with Article 11 of the EU Regulation on specific requirements regarding statutory audit of public-interest entities. The information included in this additional report is consistent with our audit opinion in this auditor’s report.
We provide the audit committee with a statement that we have complied with relevant ethical requirements regarding independence, and to communicate with them all relationships and other matters that may reasonably be thought to bear on our independence, and where applicable, related safeguards.

2018 | ANNUAL REPORT 317
From the matters communicated with the audit committee, we determine the key audit matters: those matters that were of most significance in the audit of the financial statements. We describe these matters in our auditor’s report unless law or regulation precludes public disclosure about the matter or when, in extremely rare circumstances, not communicating the matter is in the public interest.
Rotterdam, February 22, 2019
Ernst & Young Accountants LLPSigned by Pieter Laan

318 2018 | ANNUAL REPORT

2018 | ANNUAL REPORT 319
Form 20-F Cross Reference

320 2018 | ANNUAL REPORT
Form 20-F Cross Reference
Form 20-F Cross Reference
The table below sets out the location within the document of the information required by the SEC for Annual Reports on Form 20-F. The exact location is included in the column “Cross Reference”. The column “Page” refers to the starting page of the section (or sub-section) for reference only.
Item Section Cross Reference Page
Part I
Item 1. Identity of Directors, Senior Management and Advisers Not applicable
Item 2. Offer Statistics and Expected Timetable Not applicable
Item 3. Key Information
A. Selected Financial Data Selected Financial Data 16
B. Capitalization and Indebtedness Not applicable
C. Reasons for the Offer and Use of Proceeds Not applicable
D. Risk Factors Risk Factors 81
Item 4. Information on the Company
A. History and Development of the Company Group Overview 18
B. Business Overview Group Overview 18
Overview of Our Business 21
Sales Overview 29
Results by Segment 59
Note 25 (Guarantees granted, commitments and contingent Liabilities) to the Consolidated Financial Statements
250
Environmental and Other Regulatory Matters 36
C. Organization Structure Note 3 (Scope of consolidation) to the Consolidated Financial Statements
198
D. Property, Plant and Equipment Property, Plant and Equipment 26
Significant Vehicle Assembly Plants 294
Item 4A. Unresolved Staff Comments None
Item 5. Operating and Financial Review MD&A Overview 43
Our Business Plan 20
Trends, Uncertainties and Opportunities 43
Note 2 (Basis of preparation - Use of estimates) to the Consolidated Financial Statements
172
Non-GAAP Financial Measures 47
A. Operating Results Result of Operations 50
B. Liquidity and Capital Resources Liquidity and Capital Resources 67
C. Research and Development, Patents and Licenses, etc. Research and Development 22
D. Trend Information Trends, Uncertainties and Opportunities 43
E. Off-Balance Sheet Arrangements Note 25 (Guarantees granted, commitments and contingent Liabilities) to the Consolidated Financial Statements
250
F. Tabular Disclosure of Contractual Obligations Contractual Obligations 293
Note 25 (Guarantees granted, commitments and contingent Liabilities) to the Consolidated Financial Statements
250
G. Safe Harbor Forward-Looking Statements 14
Item 6. Directors, Senior Management and Employees
A. Directors and Senior Management Board of Directors 96
Senior Management 106
B. Compensation Remuneration Report 132
C. Board Practices The Audit Committee 104
The Compensation Committee 104
The Governance and Sustainability Committee 105
D. Employees Employees 27
E. Share Ownership Directors’ Share Ownership 103

2018 | ANNUAL REPORT 321
Item Section Cross Reference Page
Item 7. Major Shareholders and Related Party TransactionsA. Major Shareholders Major Shareholders 19B. Related Party Transactions Note 24 (Related party transactions) to the Consolidated
Financial Statements246
C. Interests of Experts and Counsel Not applicableItem 8. Financial Information
A. Consolidated Statements and Other Financial Information Consolidated Financial Statements 165Sales Overview 29Note 25 (Guarantees granted, commitments and contingent Liabilities) to the Consolidated Financial Statements
250
Our Share Information 294B. Significant Changes Presentation of Financial and Other Data 14
Item 9. The Offer and ListingA. Offer and Listing Details Our Share Information 294B. Plan of Distribution Not applicableC. Markets Our Share Information 294D. Selling Shareholders Not applicableE. Dilution Not applicableF. Expenses of the Issue Not applicable
Item 10. Additional InformationA. Share Capital Not applicableB. Memorandum and Articles of Association Articles of Association and Information on FCA Shares 108C. Material Contracts Note 18 (Share-based compensation) to the Consolidated
Financial Statements223
Note 21 (Debt) to the Consolidated Financial Statements 236Note 26 (Equity) to the Consolidated Financial Statements 255
D. Exchange Controls Articles of Association and Information on FCA Shares 108E. Taxation Taxation 296F. Dividends and Paying Agents Not applicableG. Statements of Experts Not applicableH. Documents on Display Documents on Display 13I. Subsidiary Information Not applicable
Item 11. Quantitative and Qualitative Disclosures Note 30 (Qualitative and quantitative information on financial risks) to the Consolidated Financial Statements
266
Item 12. Description of Securities Other than Equity SecuritiesA. Debt Securities Not applicableB. Warrants and Rights Not applicableC. Other Securities Not applicableD. American Depositary Shares Not applicable
Part IIItem 13. Defaults, Dividend Arrearages and Delinquencies Not applicableItem 14. Material Modifications to the Rights of Security Holders and
Use of ProceedsNot applicable
Item 15. Controls and Procedures Controls and Procedures 159Item 16A. Audit Committee Financial Expert The Audit Committee 104Item 16B. Code of Ethics Code of Conduct 124Item 16C. Principal Accountant Fees and Services Principal Accountant Fees and Services 295Item 16D. Exemptions from the Listing Standards for Audit Committees NoneItem 16E. Purchases of Equity Securities by the Issuer and Affiliated
PurchasersNone
Item 16F. Change in the Registrant’s Certifying Accountant Not applicableItem 16G. Corporate Governance Differences between Dutch Corporate Governance
Practices and NYSE Listing Standard126
Item 16H. Mine Safety Disclosure Not applicablePart IIIItem 17. Financial Statements Consolidated Financial Statements 165Item 18. Financial Statements Consolidated Financial Statements 165Item 19. Exhibits Exhibits 305

322 2018 | ANNUAL REPORT

2018 | ANNUAL REPORT 323
Signatures
SignaturesThe registrant hereby certifies that it meets all of the requirements for filing on Form 20-F and that it has duly caused and authorized the undersigned to sign this annual report on its behalf.
FIAT CHRYSLER AUTOMOBILES N.V. (Registrant)
By: /s/ Richard K. Palmer
Name: Richard K. Palmer Title: Chief Financial Officer
Date: February 22, 2019


2018 | ANNUAL REPORT 325
Contact
Corporate Office:25 St James’s Street, London SW1A 1HA - U.K.Tel. +44 (0) 207 7660311

326 2018 | ANNUAL REPORT

Printing
Graphic design and editorial coordination Sunday Turin, Italy
PrintingGraf Art - Officine Grafiche Artistiche Venaria (TO), Italy
Printed in ItalyApril 2019

Fiat Chrysler Automobiles N.V.Registered Office: Amsterdam, The NetherlandsAmsterdam Chamber of Commerce: 60372958Corporate Office: 25 St James’s Street, London SW1A 1HA U.K.