2018 AARP Utah Caregiving Survey Annotation · 2018 AARP Utah Caregiving Survey Annotation 3 Q2....
21
2018 AARP Utah Caregiving Survey Annotation https://doi.org/10.26419/res.00259.006 1 2018 AARP Utah Caregiving Survey Annotation Registered Voters 40-plus September 12-30, 2018 (N=801) SCREENING QUESTIONS S1. Our study is interested in the opinions of people in certain age groups. Could you please tell me your age as of your last birthday? [IN YEARS] ___________ [RECORD ACTUAL AGE AND USE THE AGE GROUPS BELOW TO KEEP TRACK OF HOW MANY RESPONDENTS WE ARE GETTING IN EACH GROUP] All Respondents (N=801) 0.0% Under 40 [DO NOT READ] [ASK TO SPEAK TO SOMEONE 40 OR OLDER AND REPEAT INTRO AND THEN ASK S1. IF NO ONE 40 OR OLDER, TERMINATE] 24.2% 40-49 11.7% 50-54 25.5% 55-64 35.8% 65 or older 2.8% Refused [DO NOT READ] [GO TO S2] S2. [IF REFUSED IN S1] I understand. Some people are not comfortable giving their age, but would you let me know which of the following age ranges you fall into? Respondents Who Refused to Provide Actual Age (n=22) 0.0% Under 40 [ASK TO SPEAK TO SOMEONE 40 OR OLDER. REPEAT INTRO AND THEN ASK S1. IF NO ONE IS 40 OR OLDER, TERMINATE] 27.3% 40-49 9.1% 50-54 18.2% 55-64 45.5% 65+ 0.0% Refused [THANK & TERMINATE] S3. [RECORD RESPONDENT’S GENDER. ASK ONLY IF ABSOLUTELY NECESSARY] “To ensure it is recorded accurately, could you please state your gender?” All Respondents (N=801) 50.0% Male 50.0% Female S4. Are you registered to vote in Utah? All Respondents (N=801) 100.0% Yes 0.0% No [THANK AND TERMINATE]
Transcript of 2018 AARP Utah Caregiving Survey Annotation · 2018 AARP Utah Caregiving Survey Annotation 3 Q2....

2018 AARP Utah Caregiving Survey Annotation https://doi.org/10.26419/res.00259.006 1
2018 AARP Utah Caregiving Survey AnnotationRegistered Voters 40-plusSeptember 12-30, 2018 (N=801)
SCREENING QUESTIONS
S1. Our study is interested in the opinions of people in certain age groups. Could you please tell meyour age as of your last birthday? [IN YEARS] ___________ [RECORD ACTUAL AGE AND USE THE AGEGROUPS BELOW TO KEEP TRACK OF HOW MANY RESPONDENTS WE ARE GETTING IN EACH GROUP]
All Respondents (N=801)0.0% Under 40 [DO NOT READ] [ASK TO SPEAK TO SOMEONE 40 OR OLDER AND REPEAT
INTRO AND THEN ASK S1. IF NO ONE 40 OR OLDER, TERMINATE]24.2% 40-4911.7% 50-5425.5% 55-6435.8% 65 or older2.8% Refused [DO NOT READ] [GO TO S2]
S2. [IF REFUSED IN S1] I understand. Some people are not comfortable giving their age, but would youlet me know which of the following age ranges you fall into?
Respondents Who Refused to Provide Actual Age (n=22)0.0% Under 40 [ASK TO SPEAK TO SOMEONE 40 OR OLDER. REPEAT INTRO AND THEN ASK S1.
IF NO ONE IS 40 OR OLDER, TERMINATE]27.3% 40-499.1% 50-5418.2% 55-6445.5% 65+0.0% Refused [THANK & TERMINATE]
S3. [RECORD RESPONDENT’S GENDER. ASK ONLY IF ABSOLUTELY NECESSARY] “To ensure it isrecorded accurately, could you please state your gender?”
All Respondents (N=801)50.0% Male50.0% Female
S4. Are you registered to vote in Utah?
All Respondents (N=801)100.0% Yes
0.0% No [THANK AND TERMINATE]

2018 AARP Utah Caregiving Survey Annotation https://doi.org/10.26419/res.00259.006 2
S5. Which of the following best describes your current employment status? Are you …? [READ EACHANSWER CATEGORY]
All Respondents (N=801)8.5% Self-employed full-time3.2% Self-employed part-time
29.9% Employed full-time10.2% Employed part-time33.4% Retired and not working at all3.0% Unemployed and looking for work
11.4% Or are you not in the labor force for other reasons0.1% Not sure [DO NOT READ]0.2% Refused [DO NOT READ]
MAIN QUESTIONNAIRE
Q1. A family caregiver is someone who provides UNPAID care for an adult loved one who is ill, frail,elderly, or has a physical, mental, or emotional disability. This unpaid care may include assisting withpersonal needs like bathing and dressing, household chores, meals, shopping, transportation, ormanaging finances or medical care. Are you currently a family caregiver providing UNPAID care toan adult loved one? [INTERVIEWER NOTE: IF THE RESPONDENT ASKS IF THE PERSON THEY AREPROVIDING CARE TO HAS TO LIVE WITH THEM THE INTERVIEWER SHOULD SAY “THIS PERSON DOES NOTHAVE TO LIVE WITH YOU.”]Q14. Have you ever been a family caregiver who provided UNPAID care to an adult loved one?[INTERVIEWER NOTE: IF THE RESPONDENT ASKS IF THE PERSON THEY HAVE PROVIDED CARE TO HAD TOLIVE WITH THEM THE INTERVIEWER SHOULD SAY “THIS PERSON DID NOT HAVE TO LIVE WITH YOU.”]
All Respondents (N=801)14.8% Yes, I am currently providing care to an adult loved one33.0% Yes, I have been a family caregiver in the past52.0% No0.1% Not sure [DO NOT READ]0.0% Refused [DO NOT READ]

2018 AARP Utah Caregiving Survey Annotation https://doi.org/10.26419/res.00259.006 3
Q2. What is the age of the person you are providing care for? [INTERVIEWER: IF THEY ARE PROVIDINGCARE TO MORE THAN ONE PERSON, ASK THEM TO ANSWER BASED ON THE PERSON THEY AREPROVIDING THE MOST CARE TO] [RECORD AGE IF KNOWN AND GIVEN; IF NOT KNOWN OR GIVEN, TRYTO RECORD IT IN THE RANGE BELOW]Q15. What was the age of the person who you most recently provided care to? [INTERVIEWER: IFTHEY ARE PROVIDED CARE TO MORE THAN ONE PERSON, ASK THEM TO ANSWER BASED ON THEPERSON THEY ARE PROVIDING THE MOST CARE TO]. [RECORD AGE IF KNOWN AND GIVEN; IF NOTKNOWN OR GIVEN, TRY TO RECORD IT IN THE RANGE BELOW]
Current Caregivers (n=119)0.0% Under 18 [SKIP TO Q14]
17.8% 18-494.0% 50-596.5% 60-64
71.7% 65+0.0% Not sure [DO NOT READ]0.0% Refused [DO NOT READ]
Former Caregivers (n=265)0% Under 18 [SKIP TO Q27]
3.7% 18-492.7% 50-593.7% 60-64
89.6% 65+0.4% Not sure [DO NOT READ]0.0% Refused [DO NOT READ]
Current and Former Caregivers (n=383)8.1% 18-493.1% 50-594.6% 60-64
84.0% 65+0.3% Not sure [DO NOT READ]0.0% Refused [DO NOT READ]
Q3. Who are you caring for? [PLEASE CODE TO LIST BELOW, IF NOT ON LIST, PLEASE ADD TO THE LIST]Q16. Who did you care for? [PLEASE CODE TO LIST BELOW, IF NOT ON LIST, PLEASE ADD TO THE LIST]
Current Caregivers (n=119)48.9% Parents (mother, father, mother/father-in-law)20.0% Spouse (husband, wife, companion/partner)15.1% Children (son, daughter)5.6% Sibling (brother, sister, sister/brother-in-law)6.6% Other relative (aunt, nephew)3.5% Non-relative (friend, neighbor)0.0% Not sure [DO NOT READ]0.0% Refused [DO NOT READ]

2018 AARP Utah Caregiving Survey Annotation https://doi.org/10.26419/res.00259.006 4
Former Caregivers (n=265)71.3% Parents (mother, father, mother/father-in-law)11.2% Spouse (husband, wife)2.6% Children (son, daughter)4.1% Sibling (brother, sister, sister/brother-in-law)9.3% Other relative (aunt, nephew/grand father/grandmother)1.5% Non-relative (friend, neighbor)0.0% Not sure [DO NOT READ]0.0% Refused [DO NOT READ]
Current and Former Caregivers (n=383)64.3% Parents (mother, father, mother/father-in-law)13.9% Spouse (husband, wife)6.4% Children (son, daughter)4.8% Sibling (brother, sister, sister/brother-in-law)
15.4% Other relative (aunt, nephew/grand father/grandmother)2.1% Non-relative (friend, neighbor)0.0% Not sure [DO NOT READ]0.0% Refused [DO NOT READ]
Q4. Still thinking about the person you are providing care to the most, which of the followingactivities are you providing? Are you …? [INSERT, READ AND RANDOMIZE ITEMS A-G, ASK H and I ASA BLOCK] [RECORD A RESPONSE FOR EACH ITEM]Q17. Thinking about the person you most recently provided care to, which of the following activitiesdid you provide? Did you …? [INSERT, READ AND RANDOMIZE ITEMS A-G AND ASK H and I AS ABLOCK IN ORDER] [RECORD A RESPONSE FOR EACH ITEM]
Current Caregivers (n=119) Yes No NS/REFa. Assist with bathing or dressing 31.7% 68.3% 0.0%b. Provide transportation to appointments 75.0% 25.0% 0.0%c. Take them shopping or shop for them 81.5% 18.5% 0.0%d. Help them with meals 81.7% 18.3% 0.0%e. Help them to manage finances 62.6% 37.4% 0.0%f. Aid with household chores 81.0% 19.0% 0.0%g. Provide social activities or companionship 90.0% 10.0% 0.0%h. Oversee their medication management 51.5% 48.5% 0.0%i. Take responsibility for other medical or nursing tasks 49.8% 47.7% 2.5%
Former Caregivers (n=265) Yes No NS/REFa. Assist with bathing or dressing 50.2% 49.4% 0.4%b. Provide transportation to appointments 88.6% 11.4% 0.0%c. Take them shopping or shop for them 90.8% 8.7% 0.4%d. Help them with meals 84.8% 14.8% 0.4%e. Help them to manage finances 58.1% 41.5% 0.4%f. Aid with household chores 89.7% 9.9% 0.4%g. Provide social activities or companionship 95.0% 4.6% 0.4%h. Oversee their medication management 62.9% 37.1% 0.0%i. Take responsibility for other medical or nursing tasks 43.0% 53.7% 3.4%

2018 AARP Utah Caregiving Survey Annotation https://doi.org/10.26419/res.00259.006 5
Current and Former Caregivers (n=383) Yes No NS/REFa. Assist with bathing or dressing 44.5% 55.2% 0.3%b. Provide transportation to appointments 84.6% 15.4% 0.0%c. Take them shopping or shop for them 88.0% 11.8% 0.3%d. Help them with meals 83.8% 15.9% 0.3%e. Help them to manage finances 59.2% 40.5% 0.3%f. Aid with household chores 87.0% 12.7% 0.3%g. Provide social activities or companionship 93.5% 6.3% 0.3%h. Oversee their medication management 59.4% 40.6% 0.0%i. Take responsibility for other medical or nursing tasks 45.1% 51.8% 3.1%
Q5. Q18. Have you ever been employed either full- or part-time while providing care to your adultloved one?
Current Caregivers (n=119)68.2% Yes [ASK Q7]31.8% No [SKIP TO Q6]0.0% Not sure [DO NOT READ] [SKIP TO Q9]0.0% Refused [DO NOT READ] [SKIP TO Q9]
Former Caregivers (n=265)71.6% Yes [ASK Q20]28.4% No [SKIP TO Q19]0.0% Not sure [DO NOT READ] [SKIP TO Q22]0.0% Refused [DO NOT READ] [SKIP TO Q22]
Current and Former Caregivers (n=383)70.5% Yes29.5% No0.0% Not sure [DO NOT READ]0.0% Refused [DO NOT READ]
Q6. Q19. What reasons, if any, prevented you from working while providing care to your lovedone? [CODE TO LIST BELOW, ADD ANYTHING MENTIONED NOT ON LIST, ACCEPT ALL RESPONSES] SKIPTO Q9 SKIP TO Q22
Current Caregivers Who Did Not Work While Providing Care (n=38)34.3% Was already retired16.0% Too much care was needed for loved one to allow me to work21.6% Have a disability, not able to work20.4% Wasn’t working anyway, out of labor force13.3% Other
Former Caregivers Who Did Not Work While Providing Care (n=75)36.9% Was already retired5.1% Too much care was needed for loved one to allow me to work6.7% Have a disability, not able to work28.1% Wasn’t working anyway, out of labor force23.3% Other
2018 AARP Utah Caregiving Survey Annotation https://doi.org/10.26419/res.00259.006 6
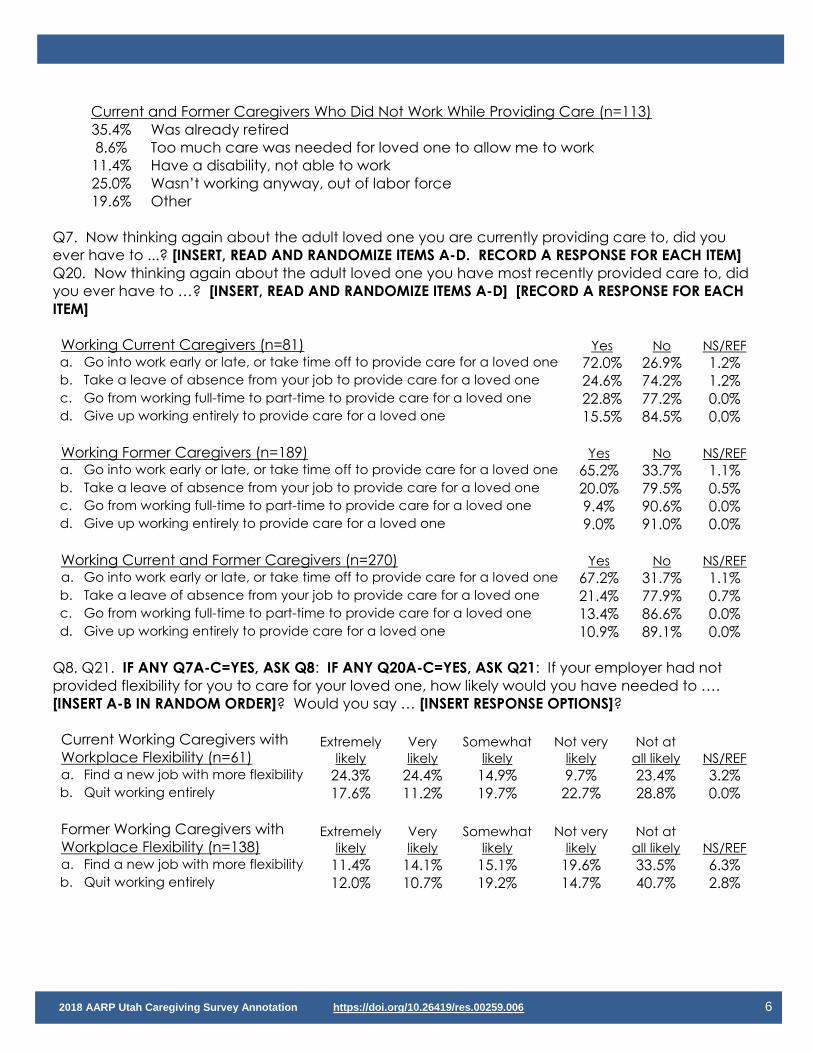
Current and Former Caregivers Who Did Not Work While Providing Care (n=113)35.4% Was already retired8.6% Too much care was needed for loved one to allow me to work11.4% Have a disability, not able to work25.0% Wasn’t working anyway, out of labor force19.6% Other
Q7. Now thinking again about the adult loved one you are currently providing care to, did youever have to ...? [INSERT, READ AND RANDOMIZE ITEMS A-D. RECORD A RESPONSE FOR EACH ITEM]Q20. Now thinking again about the adult loved one you have most recently provided care to, didyou ever have to …? [INSERT, READ AND RANDOMIZE ITEMS A-D] [RECORD A RESPONSE FOR EACHITEM]
Working Current Caregivers (n=81) Yes No NS/REFa. Go into work early or late, or take time off to provide care for a loved one 72.0% 26.9% 1.2%b. Take a leave of absence from your job to provide care for a loved one 24.6% 74.2% 1.2%c. Go from working full-time to part-time to provide care for a loved one 22.8% 77.2% 0.0%d. Give up working entirely to provide care for a loved one 15.5% 84.5% 0.0%
Working Former Caregivers (n=189) Yes No NS/REFa. Go into work early or late, or take time off to provide care for a loved one 65.2% 33.7% 1.1%b. Take a leave of absence from your job to provide care for a loved one 20.0% 79.5% 0.5%c. Go from working full-time to part-time to provide care for a loved one 9.4% 90.6% 0.0%d. Give up working entirely to provide care for a loved one 9.0% 91.0% 0.0%
Working Current and Former Caregivers (n=270) Yes No NS/REFa. Go into work early or late, or take time off to provide care for a loved one 67.2% 31.7% 1.1%b. Take a leave of absence from your job to provide care for a loved one 21.4% 77.9% 0.7%c. Go from working full-time to part-time to provide care for a loved one 13.4% 86.6% 0.0%d. Give up working entirely to provide care for a loved one 10.9% 89.1% 0.0%
Q8. Q21. IF ANY Q7A-C=YES, ASK Q8: IF ANY Q20A-C=YES, ASK Q21: If your employer had notprovided flexibility for you to care for your loved one, how likely would you have needed to ….[INSERT A-B IN RANDOM ORDER]? Would you say … [INSERT RESPONSE OPTIONS]?
Current Working Caregivers withWorkplace Flexibility (n=61)
Extremelylikely
Verylikely
Somewhatlikely
Not verylikely
Not atall likely NS/REF
a. Find a new job with more flexibility 24.3% 24.4% 14.9% 9.7% 23.4% 3.2%b. Quit working entirely 17.6% 11.2% 19.7% 22.7% 28.8% 0.0%
Former Working Caregivers withWorkplace Flexibility (n=138)
Extremelylikely
Verylikely
Somewhatlikely
Not verylikely
Not atall likely NS/REF
a. Find a new job with more flexibility 11.4% 14.1% 15.1% 19.6% 33.5% 6.3%b. Quit working entirely 12.0% 10.7% 19.2% 14.7% 40.7% 2.8%

2018 AARP Utah Caregiving Survey Annotation https://doi.org/10.26419/res.00259.006 7
Current and Former Working Caregiverswith Workplace Flexibility (n=199)
Extremelylikely
Verylikely
Somewhatlikely
Not verylikely
Not atall likely
NS/REF
a. Find a new job with more flexibility 15.3% 17.3% 15.1% 16.6% 30.4% 5.4%b. Quit working entirely 13.7% 10.9% 19.3% 17.2% 37.0% 1.9%
Q9. Now thinking again about the adult loved one you are currently providing care to, did youever have to …? [INSERT, READ AND RANDOMIZE ITEMS A-C] [RECORD A RESPONSE FOR EACH ITEM]Q22. Now thinking again about the adult loved one you have most recently provided care to,while providing this care did you ever have to …? [INSERT, READ AND RANDOMIZE ITEMS A-C][RECORD A RESPONSE FOR EACH ITEM]
Current Caregivers (n=119) Yes No NS/REFa. Use your own money to help provide care 69.2% 30.8% 0.0%b. Make changes to your home for the loved one in your care 43.1% 56.0% 0.9%c. Move into another home to accommodate the loved one in your care 14.6% 85.4% 0.0%
Former Caregivers (n=265) Yes No NS/REFa. Use your own money to help provide care 59.9% 37.4% 2.7%b. Make changes to your home for the loved one in your care 31.4% 68.3% 0.4%c. Move into another home to accommodate the loved one in your care 9.1% 90.9% 0.0%
Current and Former Caregivers (n=383) Yes No NS/REFa. Use your own money to help provide care 62.8% 35.4% 1.8%b. Make changes to your home for the loved one in your care 35.0% 64.5% 0.5%c. Move into another home to accommodate the loved one in your care 10.8% 89.2% 0.0%
Q10. Q23. As a caregiver do you ever …? [INSERT, READ AND RANDOMIZE ITEMS A-I] [RECORD ARESPONSE FOR EACH ITEM]
Current Caregivers (n=119) Yes No NS/REFa. Feel stressed emotionally due to your caregiving responsibilities 69.5% 30.5% 0.0%b. Feel stressed in trying to balance your job and family [SKIP IF
ANSWERED NO, NOT SURE, OR REFUSED TO Q5] [n=81]69.2% 30.8% 0.0%
c. Find it difficult to maintain a healthy diet 36.6% 62.6% 0.8%d. Find it difficult to get enough rest 51.9% 48.1% 0.0%e. Find it difficult to exercise regularly 40.6% 59.4% 0.0%f. Find it difficult to take care of your household responsibilities 48.4% 51.6% 0.0%g. Experience problems with your health 44.2% 54.9% 0.8%h. Find it difficult to make time to visit your doctor 21.2% 77.8% 0.9%i. Feel strained financially due to your caregiving responsibilities 31.4% 67.8% 0.8%

2018 AARP Utah Caregiving Survey Annotation https://doi.org/10.26419/res.00259.006 8
Former Caregivers (n=265) Yes No NS/REFa. Feel stressed emotionally due to your caregiving responsibilities 68.4% 31.6% 0.0%b. Feel stressed in trying to balance your job and family [SKIP IF
ANSWERED NO, NOT SURE, OR REFUSED TO Q18] [n=189]64.3% 35.1% 0.6%
c. Find it difficult to maintain a healthy diet 23.5% 76.1% 0.4%d. Find it difficult to get enough rest 49.3% 49.9% 0.8%e. Find it difficult to exercise regularly 43.7% 54.8% 1.5%f. Find it difficult to take care of your household responsibilities 42.4% 57.2% 0.4%g. Experience problems with your health 20.9% 78.3% 0.7%h. Find it difficult to make time to visit your doctor 13.6% 84.9% 1.5%i. Feel strained financially due to your caregiving responsibilities 19.9% 79.4% 0.7%
Current and Former Caregivers (n=383) Yes No NS/REFa. Feel stressed emotionally due to your caregiving responsibilities 68.8% 31.2% 0.0%b. Feel stressed in trying to balance your job and family [n=270] 65.8% 33.8% 0.4%c. Find it difficult to maintain a healthy diet 27.5% 71.9% 0.5%d. Find it difficult to get enough rest 50.1% 49.3% 0.5%e. Find it difficult to exercise regularly 42.7% 56.2% 1.0%f. Find it difficult to take care of your household responsibilities 44.3% 55.5% 0.3%g. Experience problems with your health 28.1% 71.1% 0.8%h. Find it difficult to make time to visit your doctor 16.0% 82.7% 1.3%i. Feel strained financially due to your caregiving responsibilities 23.5% 75.8% 0.8%
Q11. In caring for your loved one, how difficult has it been to … [INSERT A-H IN RANDOM ORDER]?Is it … [INSERT RESPONSE OPTIONS IN ORDER]?Q24. In caring for your loved one, how difficult was it to … [INSERT A-H IN RANDOM ORDER]? Is it …[INSERT RESPONSE OPTIONS IN ORDER]?
Current Caregivers (n=119)Very
difficultSomewhat
difficultNot
difficultHave not triedto use service NS/REF
a. Find health care providers 7.3% 16.5% 66.9% 6.8% 2.4%b. Find adult day care services 9.8% 8.5% 14.5% 65.6% 1.6%c. Find home health care services 5.7% 15.1% 42.1% 36.2% 0.8%d. Find respite [PRONOUNCED RES-PIT] care
to give you a break from your caregivingresponsibilities
7.5% 13.3% 35.5% 43.7% 0.0%
e. Get your loved one to the care they need 6.5% 27.4% 64.4% NA 1.6%f. Maintain relationships with other family
members11.5% 25.3% 63.2% NA 0.0%
g. Make decisions about the care your lovedone receives
8.9% 32.3% 56.3% NA 2.5%
h. Deal emotionally with your loved one’sillness or condition
20.7% 42.1% 37.2% NA 0.0%

2018 AARP Utah Caregiving Survey Annotation https://doi.org/10.26419/res.00259.006 9
Former Caregivers (n=265)Very
difficultSomewhat
difficultNot
difficultHave not triedto use service NS/REF
a. Find health care providers 4.8% 10.9% 75.3% 5.9% 3.0%b. Find adult day care services 5.8% 7.9% 24.7% 60.5% 1.1%c. Find home health care services 3.7% 12.7% 58.1% 24.7% 0.8%d. Find respite [PRONOUNCED RES-PIT] care
to give you a break from your caregivingresponsibilities
8.7% 12.8% 47.0% 30.3% 1.1%
e. Get your loved one to the care they need 6.0% 30.7% 63.3% NA 0.0%f. Maintain relationships with other family
members7.5% 22.7% 67.9% NA 1.9%
g. Make decisions about the care your lovedone receives
11.9% 32.0% 53.5% NA 2.6%
h. Deal emotionally with your loved one’sillness or condition
26.9% 41.1% 31.2% NA 0.7%
Current and Former Caregivers (n=383)Very
difficultSomewhat
difficultNot
difficultHave not triedto use service NS/REF
a. Find health care providers 5.6% 12.7% 72.7% 6.2% 2.9%b. Find adult day care services 7.1% 8.1% 21.5% 62.1% 1.3%c. Find home health care services 4.3% 13.5% 53.2% 28.3% 0.8%d. Find respite care to give you a break from
your caregiving responsibilities8.4% 12.9% 43.5% 34.5% 0.8%
e. Get your loved one to the care they need 6.2% 29.7% 63.7% NA 0.5%f. Maintain relationships with other family
members8.7% 23.5% 66.4% NA 1.4%
g. Make decisions about the care your lovedone receives
10.9% 32.1% 54.4% NA 2.6%
h. Deal emotionally with your loved one’sillness or condition
25.0% 41.4% 33.1% NA 0.5%
Q12. How important is it to you to be able to provide care for your loved one so that they can keepliving independently in their own home? Is it …? [INSERT AND READ EACH ANSWER CATEGORY]Q25. How important was it to you to be able to provide care for your loved one so that they couldkeep living independently in their own home? Was it …? [INSERT AND READ EACH ANSWERCATEGORY]
Current Caregivers (n=119)55.4% Extremely important29.3% Very important6.0% Somewhat important3.4% Not very important3.3% Not at all important2.6% Not sure [DO NOT READ]0.0% Refused [DO NOT READ]

2018 AARP Utah Caregiving Survey Annotation https://doi.org/10.26419/res.00259.006 10
Former Caregivers (n=265)43.7% Extremely important41.7% Very important8.6% Somewhat important1.1% Not very important3.0% Not at all important1.9% Not sure [DO NOT READ]0.0% Refused [DO NOT READ]
Current and Former Caregivers (n=383)47.3% Extremely important37.9% Very important7.8% Somewhat important1.8% Not very important3.1% Not at all important2.1% Not sure [DO NOT READ]0.0% Refused [DO NOT READ]
Q13. Q26. Q27. How likely do you think it is that you will provide any caregiving or assistance on anunpaid basis for an adult loved one in the future? Is it …? [INSERT AND READ EACH ANSWERCATEGORY]
Current Caregivers (n=119)60.7% Extremely likely18.9% Very likely6.9% Somewhat likely5.9% Not very likely6.7% Not at all likely0.8% Not sure [DO NOT READ]0.0% Refused [DO NOT READ]
Former Caregivers (n=265)22.4% Extremely likely19.4% Very likely20.7% Somewhat likely14.6% Not very likely19.9% Not at all likely3.0% Not sure [DO NOT READ]0.0% Refused [DO NOT READ]
Current and Former Caregivers (n=383)34.3% Extremely likely19.2% Very likely16.5% Somewhat likely11.9% Not very likely15.8% Not at all likely2.3% Not sure [DO NOT READ]0.0% Refused [DO NOT READ]

2018 AARP Utah Caregiving Survey Annotation https://doi.org/10.26419/res.00259.006 11
Never Been Caregivers (n=418)12.9% Extremely likely22.1% Very likely29.5% Somewhat likely17.4% Not very likely15.7% Not at all likely2.4% Not sure [DO NOT READ]0.0% Refused [DO NOT READ]
All Respondents (N=801)23.1% Extremely likely20.7% Very likely23.2% Somewhat likely14.8% Not very likely15.7% Not at all likely2.4% Not sure [DO NOT READ]0.0% Refused [DO NOT READ]
Q28. IF CURRENT CAREGIVER, ASK … In your opinion, as a current caregiver, how helpful would thefollowing types of caregiving support be to you? IF A FORMER CAREGIVER, ASK … In your opinion,as a former caregiver, how helpful would the following types of caregiving support be to you? FORALL OTHER RESPONDENTS, ASK … In your opinion, as someone who may provide care in the future,how helpful would the following types of caregiving support be to you? Would … [INSERT A-H INRANDOM ORDER, KEEP A & B TOGETHER AND ALWAYS ASK A FIRST THEN B] be …? [READ EACHANSWER CATEGORY BELOW]
All Respondents (N=801)Extremely
helpfulVery
helpfulSomewhat
helpful
Notvery
helpful
Not atall
helpful NS/REFa. Assistance with providing transportation
in general9.1% 25.4% 33.1% 13.2% 17.7% 1.6%
b. Assistance with providing transportationto medical appointments
10.7% 27.7% 28.3% 12.9% 18.9% 1.5%
c. Assistance with understanding how tomanage medications
12.5% 25.4% 26.1% 14.9% 19.0% 2.1%
d. Connecting with other caregivers insimilar situations
8.9% 21.9% 36.4% 14.7% 15.0% 3.1%
e. Information about available resourcesfor caregivers in your community
21.4% 36.2% 27.5% 4.8% 8.2% 1.9%
f. Respite care or breaks from caregivingresponsibilities
18.3% 34.1% 25.1% 7.6% 11.2% 3.6%
g. Assistance with providing meals 12.2% 24.5% 32.5% 14.1% 14.7% 2.0%h. Assistance with managing household
chores11.5% 24.0% 33.6% 15.0% 14.6% 1.3%
i. Resources about elder abuse andfinancial exploitation
8.9% 18.5% 28.8% 16.9% 21.8% 5.1%

2018 AARP Utah Caregiving Survey Annotation https://doi.org/10.26419/res.00259.006 12
Q29. Where would you turn to find information about services in your community to help familycaregivers? Would you turn to … [INSERT, READ AND RANDOMIZE ITEMS A-J]? [RECORD A RESPONSEFOR EACH ITEM]
All Respondents (N=801) Yes No NS/REFa. Family or friends 88.0% 11.3% 0.8%b. Your doctors or other health care providers 89.9% 8.9% 1.3%c. Hospitals or other health care facilities 72.2% 24.3% 3.5%d. Senior centers 64.6% 32.1% 3.3%e. The Internet 74.2% 25.3% 0.5%f. The phone book 28.3% 70.5% 1.2%g. Places of worship 65.3% 33.0% 1.8%h. Government agencies 61.2% 35.4% 3.4%i. 2-1-1 information line 19.1% 64.4% 16.5%j. Area Agencies on Aging, such as the Salt Lake County Aging and
Adult Services or the Mountain-lands Association of Governments49.2% 41.2% 9.6%
Q30. Family caregivers help older residents in Utah live independently by performing services likebathing and dressing as well as managing medication and paying bills. How important do you thinkit is to have more resources and training for family caregivers? Do you think it is …? [INSERT ANDREAD EACH ANSWER CATEGORY]
All Respondents (N=801)31.1% Extremely important37.4% Very important25.2% Somewhat important3.5% Not very important1.4% Not at all important1.4% Not sure [DO NOT READ]0.0% Refused [DO NOT READ]

2018 AARP Utah Caregiving Survey Annotation https://doi.org/10.26419/res.00259.006 13
WORKPLACE FLEXIBILITY
Q31. Now I’m going to ask if you support or oppose some proposals that would provide help forworking family caregivers. Do you support or oppose …? [INSERT, READ AND RANDOMIZE ITEMS A-C]Q32. Is that strongly or somewhat?
All Respondents (N=801)Stronglysupport
Somewhatsupport
Neither/not sure
Somewhatoppose
Stronglyoppose REF
a. Requiring employers to provide alimited amount of unpaid leaveto employees who have to taketime off for family caregivingpurposes [IF NECESSARY READ:The Family Medical Leave Actdoes provide for longer term,unpaid leave for persons to carefor a family member who has aserious condition. The unpaidleave mentioned here is morelimited in duration, such as onlyone day, and can be used forroutine or emergency careneeds, like medicalappointments]
48.7% 30.8% 4.8% 7.9% 7.6% 0.1%
b. Requiring employers to providesome paid leave to all employeesthat can be used for familycaregiving purposes
40.8% 27.1% 7.6% 12.2% 11.9% 0.5%
c. Requiring employers to allowemployees to use their existingsick leave for family caregivingpurposes
61.1% 24.8% 5.7% 4.5% 3.8% 0.1%
Q33. ASK IF EMPLOYED FROM S5: Thinking about the job where you worked the most hours last week, …[INSERT A-B IN ORDER]?
Employed Respondents (n=414) Yes No NS/REFa. Do you receive paid time off for sick leave 52.5% 46.3% 1.2%b. Can you take time off without pay as sick leave 71.6% 19.3% 9.0%
Q34. ASK IF Q33A=YES: Does your employer allow you to use your existing sick leave benefits to attendto illnesses or injuries of your relatives, including parents and spouses?
Employed Respondents with Paid Sick Leave (n=217)79.8% Yes7.1% No13.1% Not sure [DO NOT READ]0.0% Refused [DO NOT READ]
2018 AARP Utah Caregiving Survey Annotation https://doi.org/10.26419/res.00259.006 14
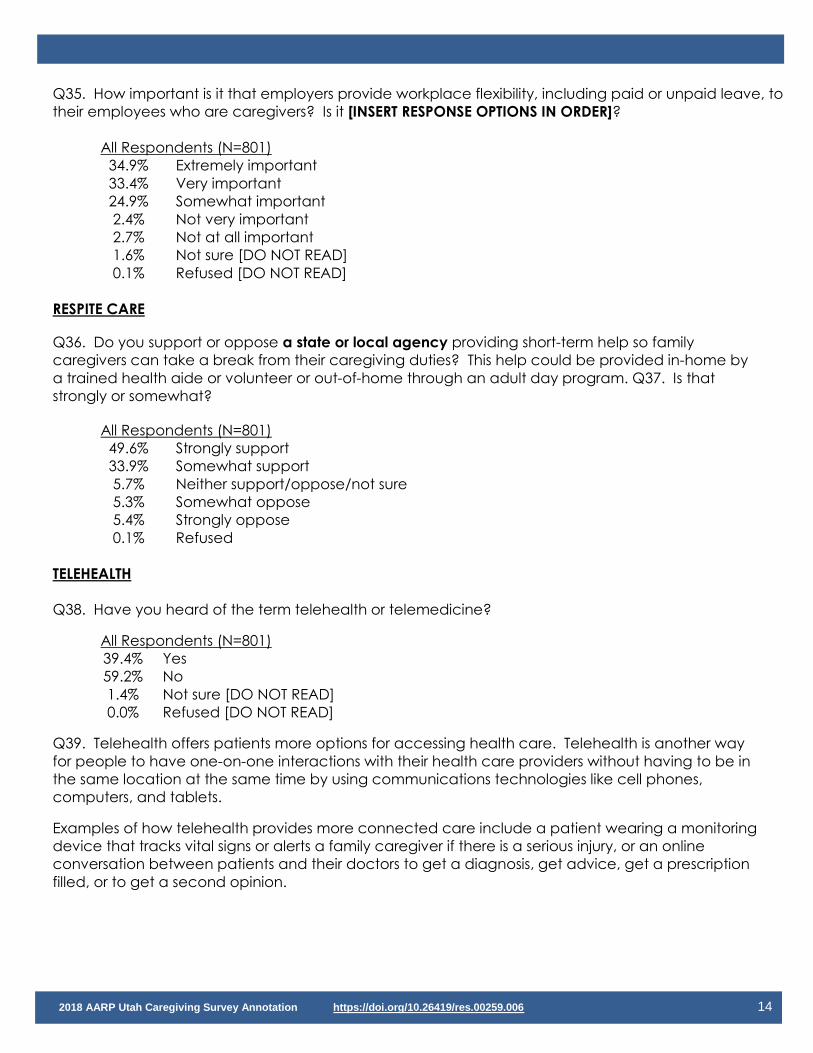
Q35. How important is it that employers provide workplace flexibility, including paid or unpaid leave, totheir employees who are caregivers? Is it [INSERT RESPONSE OPTIONS IN ORDER]?
All Respondents (N=801)34.9% Extremely important33.4% Very important24.9% Somewhat important2.4% Not very important2.7% Not at all important1.6% Not sure [DO NOT READ]0.1% Refused [DO NOT READ]
RESPITE CARE
Q36. Do you support or oppose a state or local agency providing short-term help so familycaregivers can take a break from their caregiving duties? This help could be provided in-home bya trained health aide or volunteer or out-of-home through an adult day program. Q37. Is thatstrongly or somewhat?
All Respondents (N=801)49.6% Strongly support33.9% Somewhat support5.7% Neither support/oppose/not sure5.3% Somewhat oppose5.4% Strongly oppose0.1% Refused
TELEHEALTH
Q38. Have you heard of the term telehealth or telemedicine?
All Respondents (N=801)39.4% Yes59.2% No1.4% Not sure [DO NOT READ]0.0% Refused [DO NOT READ]
Q39. Telehealth offers patients more options for accessing health care. Telehealth is another wayfor people to have one-on-one interactions with their health care providers without having to be inthe same location at the same time by using communications technologies like cell phones,computers, and tablets.
Examples of how telehealth provides more connected care include a patient wearing a monitoringdevice that tracks vital signs or alerts a family caregiver if there is a serious injury, or an onlineconversation between patients and their doctors to get a diagnosis, get advice, get a prescriptionfilled, or to get a second opinion.

2018 AARP Utah Caregiving Survey Annotation https://doi.org/10.26419/res.00259.006 15
How interested are you in using telehealth services for yourself or a loved one if needed? Are you …?[READ RESPONSE OPTIONS IN ORDER]
All Respondents (N=801)17.1% Extremely interested24.1% Very interested33.9% Somewhat interested11.7% Not very interested11.9% Not at all interested1.3% Not sure [DO NOT READ]0.0% Refused [DO NOT READ]
Q40. Do you support or oppose policies that would … [INSERT A-D IN RANDOM ORDER]? Q41. Is thatstrongly or somewhat?
All Respondents (N=801)Stronglysupport
Some-what
support
Neithersupport/oppose/not sure
Some-what
opposeStronglyoppose REF
a. Require health care providers to follow strictguidelines to protect patient information such asusing secure connections and encryption
74.8% 14.9% 3.8% 3.6% 2.9% 0.0%
b. Invest in technology to protect the security ofsensitive health information
67.0% 21.3% 5.3% 2.9% 3.4% 0.1%
c. Require private health insurance or employer-based insurance to cover telehealth services
34.6% 32.8% 10.3% 12.0% 10.1% 0.2%
d. Require Medicare and Medicaid to covertelehealth services
46.0% 30.5% 6.9% 7.6% 8.8% 0.1%
e. Requiring Utah’s Public Employee’s Health Planto cover telehealth services. This is the healthinsurance plan for employees who work in Utah’spublic institutions such as state and localgovernments and schools
38.9% 31.3% 9.8% 10.8% 8.6% 0.6%
f. Invest in broadband Internet coverage and newtechnologies to improve people’s access totelehealth services
35.8% 37.0% 11.0% 9.1% 6.5% 0.7%
Q42. And, do you support or oppose policies that would … [INSERT A-C IN RANDOM ORDER]? Q43. Isthat strongly or somewhat?
All Respondents (N=801)Stronglysupport
Some-what
support
Neithersupport/oppose/not sure
Some-what
opposeStronglyoppose REF
a. Allow you or a loved one to remain at home andreceive telehealth services from a health careprovider located in their office
53.7% 34.2% 5.5% 3.4% 2.8% 0.4%
b. Provide greater access to in-home medicalmonitoring technologies that allow patients withchronic health conditions to connect, consult,and monitor their condition by health careproviders via computers or tablets
53.5% 36.6% 4.5% 2.9% 2.0% 0.5%
c. Allow for the coverage of telehealth servicesregardless of the distance between a person’shome and their health care provider’s office
48.9% 31.8% 8.9% 5.7% 4.3% 0.4%

2018 AARP Utah Caregiving Survey Annotation https://doi.org/10.26419/res.00259.006 16
INDEPENDENT LIVING
Q44. If you or a loved one needed help when the basic tasks of life become more difficult due toaging or illness, where would you prefer to receive that care or help for yourself or a loved one?[INSERT, READ AND RANDOMIZE ITEMS A-C. ACCEPT ONLY ONE ANSWER]
All Respondents (N=801)82.6% a. At home with caregiver assistance10.7% b. In an assisted living facility or group home1.4% c. In a nursing home4.9% Not sure [DO NOT READ]0.4% Refused [DO NOT READ]
Q45. Now I’m going to ask you about some specific community services. Please tell me howimportant you think it is to have the following services available in your community to help olderadults live independently. How important is having … [INSERT, READ AND RANDOMIZE ITEMS A-J.] inyour community? Is it …? [INSERT AND READ EACH IMPORTANCE ANSWER CATEGORY]
All Respondents (N=801)Extremelyimportant
Veryimportant
Somewhatimportant
Not veryimportant
Not at allimportant
NS/REF
a. Senior or communitycenters
23.0% 38.1% 31.7% 3.8% 1.6% 1.8%
b. Chore or homemakerservices where someonecomes in to do lighthousekeeping or cleaningfor low-income and olderpersons
22.8% 35.0% 35.8% 3.8% 1.6% 1.0%
c. Congregate meals such assenior lunch programs [IFNECESSARY READ:Congregate mealprograms provide mealsand nutrition services toolder persons in a groupsetting like a senior center].
22.6% 35.1% 32.1% 5.4% 2.8% 2.0%
d. Home delivered meals 27.4% 34.1% 31.9% 3.1% 2.6% 0.9%e. Visiting nurse services, such
as an RN who comes toyour home after ahospitalization
35.4% 42.0% 20.3% 0.9% 0.5% 0.8%
f. Well-trained certified homehealth care providers
39.7% 44.2% 13.7% 0.6% 0.7% 0.9%
g. Breaks for family caregiversfrom caregiving duties
27.8% 37.8% 28.8% 2.1% 1.8% 1.8%
h. End of life or hospiceservices [IF NECESSARYREAD: Medication orservices provided to relievesymptoms of terminalillness]
47.2% 38.0% 10.3% 1.6% 1.3% 1.5%

2018 AARP Utah Caregiving Survey Annotation https://doi.org/10.26419/res.00259.006 17
All Respondents (N=801)Extremelyimportant
Veryimportant
Somewhatimportant
Not veryimportant
Not at allimportant
NS/REF
i. Special transportationservices such as one forseniors or persons withdisabilities
31.1% 41.5% 23.4% 1.7% 1.2% 1.2%
j. An easy way for caregiversto find information andresources to help themprovide care
35.3% 43.7% 16.7% 0.9% 1.5% 1.8%
Demographics
The following questions are for classification purposes only and will be kept entirely confidential.
D1. What is your current marital status? Are you …? [INSERT AND READ EACH ANSWER CATEGORY]
All Respondents (N=801)78.6% Married1.6% Not married, living with your partner or significant other0.2% Separated5.7% Divorced8.1% Widowed5.6% Or are you currently single and never married0.0% Not sure [DO NOT READ]0.2% Refused [DO NOT READ]
D2. [IF D1=1 ASK: “Are you or your spouse currently a member of A-A-R-P?” IF D1=2 ASK: “Are youor your partner currently a member of A-A-R-P?” OTHERWISE ASK “Are you currently a member of A-A-R-P?”]
All Respondents (N=801)33.5% Yes65.8% No0.6% Not sure [DO NOT READ]0.0% Refused [DO NOT READ]
D3. In general, when compared to most people your age, how would you rate your health? Is it…? [INSERT AND READ EACH ANSWER CATEGORY]
All Respondents (N=801)21.8% Excellent38.0% Very good27.2% Good9.3% Fair3.5% Poor0.1% Not sure [DO NOT READ]0.0% Refused [DO NOT READ]

2018 AARP Utah Caregiving Survey Annotation https://doi.org/10.26419/res.00259.006 18
D4. Thinking about who lives in your household, do you currently …? [INSERT AND READ ITEMS A-CBELOW]
All Respondents (N=801) Yes No Not sure Refuseda. Have any children 18 and under living with you 34.1% 65.8% 0.1% 0.0%b. Have any children 19 and over living with you 31.4% 68.4% 0.0% 0.3%c. Have a parent or adult relative living with you 10.9% 89.0% 0.0% 0.1%
D5. Do you own or rent your primary residence?
All Respondents (N=801)91.7% Own6.6% Rent1.0% Other living arrangement [DO NOT READ]0.1% Not sure [DO NOT READ]0.6% Refused [DO NOT READ]
D6. What is the highest level of education that you completed? Is it …? [READ EACH ANSWERCATEGORY]
All Respondents (N=801)1.5% 0 to 12th grade, but with no diploma
17.1% High school graduate or equivalent16.9% Post high school education, but with no degree16.6% 2 year degree25.3% 4 year degree6.0% Post graduate study, but with no degree
16.4% Graduate or professional degree0.1% Not sure [DO NOT READ]0.1% Refused [DO NOT READ]
D7. Are you of Hispanic, Spanish, or Latino origin or descent?
All Respondents (N=801)3.2% Yes
96.3% No0.1% Not sure [DO NOT READ]0.4% Refused [DO NOT READ]
D8. What is your race? Are you …? [INSERT AND READ EACH ANSWER CATEGORY]
All Respondents (N=801)94.0% White or Caucasian0.7% Black or African American0.5% Native American or Alaskan Native0.2% Asian0.3% Native Hawaiian or other Pacific Islander2.6% Or are you some other race?0.1% Not sure [DO NOT READ]1.6% Refused [DO NOT READ]

2018 AARP Utah Caregiving Survey Annotation https://doi.org/10.26419/res.00259.006 19
D9. Thinking about your state elections for Utah Governor and Legislators in the last 10 years, whichof the following best describes your voting behavior? Would you say you vote …? [INSERT ANDREAD EACH ANSWER CATEGORY]
All Respondents (N=801)67.3% Always26.0% Most of the time4.7% About half of the time1.3% Seldom0.1% Never0.1% Not sure [DO NOT READ]0.4% Refused [DO NOT READ]
D10. Do you consider yourself to be a …? [INSERT, READ AND RANDOMIZE ITEMS A-C, FOLLOW UPWITH D]
All Respondents (N=801)14.3% a. Democrat43.8% b. Republican35.0% c. Independent4.3% d. Something else [DO NOT READ]0.8% Not sure [DO NOT READ]1.9% Refused [DO NOT READ]
D11. How would you characterize your political views? Would you say you are …? [INSERT, READAND RANDOMIZE ITEMS A-C]
All Respondents (N=801)48.8% a. Conservative34.9% b. Moderate11.0% c. Liberal2.2% None of these [DO NOT READ]2.4% Not sure [DO NOT READ]0.7% Refused [DO NOT READ]
D12. Have you ever used any of the following healthcare technology for yourself or someone else?[INSERT, READ, AND RANDOMIZE ITEMS A-E]
All Respondents (N=801) Yes No Not sure Refused
a. Tools that alert you to take medications on time 9.9% 89.5% 0.4% 0.3%b. Personal emergency response systems that let you call for help
easily in an emergency19.0% 79.9% 0.7% 0.4%
c. An online support community for caregivers, like the A-A-R-PCaregiver Resource Center
5.5% 93.5% 0.7% 0.3%

2018 AARP Utah Caregiving Survey Annotation https://doi.org/10.26419/res.00259.006 20
D13. In your residence, do you or any member of your household access the Internet?
All Respondents (N=801)94.1% Yes5.7% No0.1% Not sure [DO NOT READ]0.1% Refused [DO NOT READ]
D14. In general, how comfortable are you in using … [INSERT A-C IN RANDOM ORDER]. Are you …?[READ RESPONSE OPTIONS IN ORDER]
All Respondents (N=801)
Extremelycomfort-
able
Verycomfort-
able
Somewhatcomfort-
able
Not verycomfort-
able
Not at allcomfort-
ableNotsure
Re-fused
a. The Internet 35.7% 32.5% 20.8% 5.0% 5.2% 0.4% 0.5%b. Computers 34.5% 31.3% 22.5% 5.5% 4.8% 1.0% 0.4%c. Cell phones or smart phones 31.1% 33.0% 22.8% 5.4% 5.1% 2.0% 0.6%
D15. We realize income is a private matter and so rather than ask you anything specific about yourincome, I’d like to ask you to please stop me when I get to the category that includes yourhousehold’s income before taxes in 2017. Was it …? [INSERT AND READ EACH ANSWER CATEGORY]
All Respondents (N=801)2.0% Less than $10,0003.3% $10,000 to less than $20,0007.0% $20,000 to less than $30,0008.2% $30,000 to less than $40,0007.5% $40,000 to less than $50,0009.3% $50,000 to less than $60,0009.3% $60,000 to less than $75,000
13.3% $75,000 to less than $100,00012.5% $100,000 to less than $125,0005.7% $125,000 to less than $150,0003.9% $150,000 to less than $200,0005.6% $200,000 or more3.6% Not sure [DO NOT READ]8.7% Refused [DO NOT READ]
That was our last question for tonight/today. Thanks you very much for taking the time to help us out.Have a great day/night!

2018 AARP Utah Caregiving Survey Annotation https://doi.org/10.26419/res.00259.006 21
METHODOLOGY
AARP Utah commissioned a telephone survey among 801 registered voters age 40-plus in Utah tolearn about their experiences with family caregiving. The sample utilized an age-targetedregistered voter landline and cell phone list. The sample was obtained from Aristotle International.The sample database consisted of 822,529 registered voters age 40-plus in the State of Utah. Thereare approximately 393,234 residents of Utah age 40-plus who are not registered to vote, and thereare approximately 291,997 registered voters age 40-plus who did not have a phone number on filethat were not included in the sampling of this study. Quotas were used in this study based on ageand gender and were filled based on responses to questions in the questionnaire. They weredesigned to yield a proportional representation of the Utah age 40-plus registered voterpopulation.
Voter files were selected at random from the voter list to be dialed. American Directions asked tospeak with the registered voter listed on the file. If that person was unavailable, AmericanDirections asked to speak with another member of the household aged 40-plus who was aregistered voter. The interviews averaged 25 minutes in length and were conducted in English.The survey has a margin of sampling error of ±3.5 percent.
This report highlights results from 801 residents interviewed from September 12, 2018 to September30, 2018. The data collection and weighting were performed by American Directions. The data isweighted by age and gender to reflect registered voters in Utah age 40-plus, based on thepopulation of registered voters 40-plus from the sample source.
Percentages reported are rounded. For more information about the methodology, contact TerriGuengerich, AARP Research, [email protected], (202)434-6306.