2018 05 09 - Banco BPM -Consolidated results as at 31 ... · between Banco BPM and Cattolica. On 29...
25
1 NEWS RELEASE RESULTS AS AT 31 MARCH 2018 1 NET INCOME OF € 223 MILLION (€ 115 MILLION AL 31 MARCH 2017) THE GROUP’S MATERIAL DERISKING ACTION IS PROCEEDING NET NON-PERFORMING LOANS DOWN BY € 1.7 BILLION COMPARED TO YEAR-END, WITH AN NPL TO TOTAL LOAN RATIO DECLINING FROM 12.1% (END 2017) TO 10.7% INCREASE IN GROSS NON-PERFORMING LOAN COVERAGE FROM 48.8% AT 31 DECEMBER 2017 TO 53,8% NET BAD LOANS AT € 5.2 BILLION (- € 1.3 BILLION COMPARED TO YEAR-END) WITH AN BAD LOAN TO TOTAL LOAN RATIO DECLINING TO 4.9% (6.0% AT THE END OF 2017) BAD LOAN COVERAGE WENT UP FROM 58.9% TO 66.4% NEW DERISKING PLAN CONFIRMED, TARGETING THE FINALIZATION OF THE SALE OF APPROX. € 5 BILLION OF BAD LOANS BY JUNE 2018 THE RISK PROFILE STRENGTHENING ACTION WAS IMPLEMENTED WHILE MAINTAINING A SOLID CAPITAL POSITION “IFRS9 PHASE-IN” CET 1 RATIO OF 13.48% AND PRO-FORMA 2 “IFRS9 FULLY-PHASED” OF 12.10% CUSTOMER LOANS AT € 106.2 BILLION (PERFORMING + 0.,1%, NON-PERFORMING AT – 12.8% COMPARED TO DECEMBER 2017) 1 Beginning on 1 January 2018, the new accounting standard IFRS 9 on the classification and measurement, impairment and hedge accounting of financial instruments has come into effect, replacing the accounting standard IAS 39. As specifically permitted by IFRS 9 (par. 7.2.15), Banco BPM elected not to restate the prior year’s balances based on the new measurement criteria introduced by IFRS 9. Hence, certain data referred to 31 March 2018 are not comparable with the prior year’s data, since they have been calculated based on different measurement criteria. For a more detailed explanation of the impacts from the adoption of the new accounting standard on shareholders’ equity and on the accounting presentation of financial instruments please refer to the Explanatory Notes (note 2) 2 Accounting also for the expected impacts from the capital management actions that have already been defined and communicated to the market and are expected to be finalized during the current year.
Transcript of 2018 05 09 - Banco BPM -Consolidated results as at 31 ... · between Banco BPM and Cattolica. On 29...

1
NEWS RELEASE
RESULTS AS AT 31 MARCH 20181
NET INCOME OF € 223 MILLION (€ 115 MILLION AL 31 MARCH 2017)
THE GROUP’S MATERIAL DERISKING ACTION IS PROCEEDING
NET NON-PERFORMING LOANS DOWN BY € 1.7 BILLION COMPARED TO YEAR-END,
WITH AN NPL TO TOTAL LOAN RATIO DECLINING FROM 12.1% (END 2017) TO 10.7%
INCREASE IN GROSS NON-PERFORMING LOAN COVERAGE FROM 48.8% AT 31
DECEMBER 2017 TO 53,8%
NET BAD LOANS AT € 5.2 BILLION (- € 1.3 BILLION COMPARED TO YEAR-END) WITH AN
BAD LOAN TO TOTAL LOAN RATIO DECLINING TO 4.9% (6.0% AT THE END OF 2017)
BAD LOAN COVERAGE WENT UP FROM 58.9% TO 66.4%
NEW DERISKING PLAN CONFIRMED, TARGETING THE FINALIZATION OF THE SALE OF
APPROX. € 5 BILLION OF BAD LOANS BY JUNE 2018
THE RISK PROFILE STRENGTHENING ACTION WAS IMPLEMENTED WHILE MAINTAINING
A SOLID CAPITAL POSITION
“IFRS9 PHASE-IN” CET 1 RATIO OF 13.48% AND PRO-FORMA2 “IFRS9 FULLY-PHASED”
OF 12.10%
CUSTOMER LOANS AT € 106.2 BILLION (PERFORMING + 0.,1%, NON-PERFORMING AT
– 12.8% COMPARED TO DECEMBER 2017)
1 Beginning on 1 January 2018, the new accounting standard IFRS 9 on the classification and measurement,
impairment and hedge accounting of financial instruments has come into effect, replacing the accounting standard IAS 39. As specifically permitted by IFRS 9 (par. 7.2.15), Banco BPM elected not to restate the prior year’s balances based on the new measurement criteria introduced by IFRS 9. Hence, certain data referred to 31 March 2018 are not comparable with the prior year’s data, since they have been calculated based on different measurement criteria. For a more detailed explanation of the impacts from the adoption of the new accounting standard on shareholders’ equity and on the accounting presentation of financial instruments please refer to the Explanatory Notes (note 2) 2 Accounting also for the expected impacts from the capital management actions that have already been
defined and communicated to the market and are expected to be finalized during the current year.

2
DIRECT CUSTOMER FUNDS AT € 107.9 BILLION FROM 107.3 BILLION AT DECEMBER
2017
EXCELLENT LIQUIDITY POSITION WITH MORE THAN 243
BILLION OF UNENCUMBERED ELIGIBLE ASSETS
Key balance sheet items
- Loans to customers € 106.2 billion, of which performing +0.1% and non-
performing -12.8% compared to 31 December 2017, mainly as a result of IFRS9
reclassifications and write-downs;
- Direct customer funds € 107.9 billion4 (€ 107.3 billion at the end of December
2017): again in this quarter the growth trend of core funding represented by
demand deposits and checking accounts (+€ 0.9 billion compared to year-
end) and the reduction in more expensive funding sources (- € 1.1 billion for
bonds) were confirmed,
- Indirect customer funds5 € 91.6 billion (compared to € 97.4 billion at 31
December 2017), down by 6.0%, of which:
assets under management € 59.6 billion
assets under administration € 31.9 billion.
Key P&L items
- Net interest income at € 595.1; net of IFRS 9 reclassifications it comes in at €
529.4 million, as compared to € 516.9 million in Q1 2017 (net of the non-recurring
effect on interest income on 2016 TLTRO II loans);
- Net fees and commissions of € 476.5 million compared to 515.8 in Q1 2017;
- Operating costs of € 769.5 million compared to 770.3 million at 31 March 2017.
Adjusted operating costs6 came in at € 699.0 million, down by 3.4% compared
to the corresponding aggregate in Q1 2017;
- Gross profit from operations of € 398.2 compared to 402.8 million at 31 March
2017;
- Customer loan loss provisions stood at € 326.2 million, which net of IFRS 9
reclassifications come in at € 260.5 million, compared to 292.5 million in Q1 2017;
the loan loss provision level reflects a disciplined valuation approach to keep
3 Figure updated at 7 May 2018.
4 Direct customer funds including certificates with unconditional capital protection (€ 3.8 billion at 31 March 2018 compared to € 4.0 billion at year-end 2017), but net of repurchase agreements. 5 Net of certificates with unconditional capital protection included in “direct customer funds”.
6 “Adjusted operating costs” refer to operating costs net of the non-recurring items and system ordinary
charges (contribution to the Single Resolution Fund and to the National Deposit Guarantee Interbank Fund (Fondo Interbancario di Tutela dei Depositi nazionale)

3
high coverage levels aiming at taking advantage of any additional
opportunities to speed up the de-risking process;
- Net income of € 223.3 million, as compared to a Q1 2017 net income of € 115.2
million (net of a badwill of € 3,076 million that had been credited to income in
the quarter).
Capital position:
- Pro-forma “IFRS9 fully-loaded” CET 1 ratio 12.10%
- “IFRS9 phase-in” CET 1 ratio 13.48%;
Credit quality
- Net NPL stock of € 11.4 billion, down by € 1.7 billion compared to the end of
2017 (-12.8%).
Coverage:
Non-performing loans: 53.8% vs 48.8% in 2017;
Bad loans: 66.4% vs 58.9% in 2017
Liquidity profile
- Unencumbered eligible assets at € 18.9 billion at 31 March 2017 (12% of total
assets), of which 95% are Italian Government bonds, guaranteeing an ample
flexibility when managing funding sources.
- LCR >135% and NSFR >100%7.
First-time adoption of the accounting standard IFRS 9
The first-time adoption of IFRS 9 on 1 January 2018 caused a total decline in the
stated shareholders’ equity of € 1.0 billion (net of tax effect) mainly driven by the
adoption of the new loan impairment model. The outright impact on the Common
Equity Tier 1 capital will be diluted over a 5-year period, as the bank elected to
apply the transitional provisions8.
Milan, 9 May 2018 – In today’s meeting, the Board of Directors of Gruppo Banco BPM, chaired by
Mr. Carlo Fratta Pasini, has approved the quarterly balance sheet and operating report as at 31
March 2018 of Gruppo Banco BPM.
In Q1 2018, the management focus centered around the implementation of the capital
management actions announced to the market and the continuation of the projects for the
Group’s business activities reorganization and de-risking set out in the business plan.
Notably, in Q1 the reorganization process of the Bancassurance business line has been progressing,
that had been initiated the prior year and formalized through the agreements for the sale of a 65%
7 NSFR at February 2018, latest available data. 8 The transitional provisions on impacts from the first-time adoption of IFRS 9 is illustrated in the Explanatory notes (note 7)

4
stake in Popolare Vita and in Avipop Assicurazioni and the launch of a 15-year strategic partnership
between Banco BPM and Cattolica. On 29 March last, having received the required authorizations
by the competent authorities, Banco BPM finalized the purchase of 50% + 1 share of Avipop
Assicurazioni S.p.A. and of Popolare Vita S.p.A. for a total amount of € 803.4 million, which brought
its shareholding in the two companies to 100%. On the same date, Banco BPM finalized the sale of
65% of the share capital of Avipop Assicurazioni S.p.A. and Popolare Vita S.p.A. to Cattolica
Assicurazioni.
Because of the above transaction, the Q1 2018 income statement presented a capital gain of €
176 million.
With regard to the reorganization of the Group operations, the new Branch Network model came
on stream on 1 January 2018. This is an important project that involved more than 10,000
colleagues with more than 3,000 resources who took on new professional roles mainly in the branch
network, in the NPL unit and in Wealth Management. This reorganization process is also
underpinning the rationalization of the branch network, with the planned closure of 312 branches.
Moreover, the demerger of Banca Akros’s Private Banking business line in favor of Banca Aletti was
finalized in April.
As to the de-risking process, the Group continued to develop the internal workout and to deploy
the activities aiming at creating all the necessary conditions to finalize the sale on the market of a
pool of about 5 billion of bad loans through a securitization. The deal requires that a guarantee by
issued by the Italian Government on the senior bonds issued by the SPV, and it should be finalized
by the end of the first half of the year. Following this transaction, the stock of net Bad Loans will
decrease to about €3.4 billion, with a share of about 3.3% on total customer loans, as compared to
the current ratio of 4.9%.
While being fully committed on the front of the above described projects, the Group generated a
good commercial and operating performance, with a gross profit from operations of 398.2 million
and a net income of 223.3 million.
Operating performance
Net interest income came in at € 595.1. This figure is not fully comparable with that of the prior year,
as, following the adoption of IFRS 9, net interest income is affected by the positive reclassification of
reversals further to the write-backs from discounting bad loans to present value, which were
previously reported under write-downs on loan impairments) and by the negative reclassification
from the calculation of interest on impaired exposures based on the value net of write-downs and
not on the contractual value. Net of these reclassifications, which came in at + € 65.7 million, net
interest income stands at € 529.4 million, compared to the adjusted9 net interest income in Q1 2017
of € 516.9 million (+2,4%). Even the like-for-like comparison with Q4 2017 shows a growth rate of
0.1%.
The gain on investments in associates carried under the equity method came in at € 42.6 million, in
line with the € 41.6 million reported in the same period last year, yet slightly below the Q4 2017
contribution of € 45.2 million. The main contribution to this line-item was made by consumer credit
through the shareholding held in Agos Ducato, amounting to € 33.6 million, followed by the
insurance business line contribution totaling € 9.4 million.
9 In Q1 2017, TLTRO-II loans related to FY 2016 had earned an interest of € 31.7 million

5
Net fees and commissions added up to € 476.5 million, up by 0.9% compared with € 472.1 million
reported in Q4 2017. Net fees and commissions went down by 7.6% from € 515.8 million in the same
period last year; this dip was mainly driven by brokerage, management and advisory services,
which in absolute terms declined by € 28.7 million (-10.5%) compared to the Q1 2017 figure (that
had benefitted from a quite hectic sale of asset and portfolio management products following the
slowdown at the end of 2016 tied to the merger, posting however a 15.4 million increase over Q4
2017 (+6.7%).
Other net operating income totaled € 24.1 million, practically stable compared to Q4
2017.Compared to Q1 2017 (€ 30.3 million) this line-item showed a decline that was mainly driven
by the reduction in fixed commission (commissioni di istruttoria veloce) (-15.3% compared to 31
March 2017).
Net financial income totaled € 29.3 million compared to € 36.9 million in the same period last year.
Here again the comparison with last year’s data is not fully straightforward following the
introduction of IFRS 9; in particular, a negative component of € 5.5 million was charged to income,
due to the measurement effect of certain instruments that had been previously carried exclusively
through net equity. The decline in net financial income is also attributable to the hedging strategies
of the “hold to collect and sell” portfolio (HTCS), which, following a negative impact through profit
and loss on derivative contracts, reported an increase in positive reserves on this portfolio (up until
the disposal, this impact is carried through net equity).
As a result, total income added up to € 1,167.7 million. Accounting for the effects from the above-
mentioned reclassifications following the introduction of IFRS 9, total income came in at € 1,101.9
million, down compared the adjusted figure of Q1 2017 (-3.5%) mainly as a result of the above-
described commission stream dynamic. Compared to Q4 2017 total income has been slightly
slipping (-1.0%) mainly due to the underperformance of financial activities affected also by the
market performance. Core total income amounted to € 1,071.6 million; on a like-for-like basis it
comes in at € 1,005.9 million, up by 0.5% compared to Q4 2017; compared to Q1 2017 it went down
by 2.6%.
Personnel expenses, totaling € 442.1 million, went down by 3.2% compared to € 456.7 million in the
same period last year. Compared to Q4 2017 – when personnel expenses stood at € 420.8 million –
they went up by 5.1% exclusively as a result of the release at the end of last year of certain
provisions pertaining to prior years; net of these releases and of variable components, the ordinary
personnel cost has been further declining driven by the headcount reduction (-85 resources
compared to 31 December 2017). The total headcount at 31 March 2018 added up to 23,178
employees, compared to 23.263 resources at the end of 2017 (24.680 at 31 December 2016).
Other administrative expenses amounted to € 279.5 million. This figure includes “systemic charges”,
represented by the ordinary contributions to the Single Resolution Fund SRF of € 68.0 million (€ 62.4
million in Q1 2017) and by the fee paid to maintain the deductibility of DTAs of € 6.0 million (€ 6.7
million at 31 March 2017), totaling € 74.0 million (€ 69.1 million in Q1 2017). Moreover, the Q1 2018
figure includes merger and integration charges of € 2.8 million, while Q1 2017 benefitted from an
amount of € 27.2 million, tied to the recovery of the fee paid in 2016 to convert DTAs in 2015. Net of
the above components in the comparison with Q1 2017, this line-item reported a 2.0% decline
driven by efficiency gain actions.
Compared to the figure stated in Q1 2017 (€ 260.7 million), this line-item reported a 7.2% increase
mainly due to the non-recurring component that had benefitted Q1 2017.
Net write-downs of tangible and intangible assets for the period stood at € 47.9 million, down by
9.4% compared to € 52.9 million at 31 March 2017, driven by the rationalization of the Group
information system.
Total operating costs net of non-recurring items went down by 2.4%. The stated amount totals € 769.5 million, basically in line with the € 770.3 million reported in Q1 2017 (-0.1%).

6
Net write-downs on impairment of customer loans stood at € 326.2 million. Even this aggregate has
been affected by the introduction of IFRS 9 both as a result of the new credit valuation method
introduced by the new principle and because of the reclassifications impacting net interest
income. Taking into account exclusively these reclassifications, the Q1 2018 figure comes in at €
260.5 million, compared to € 292.5 million in Q1 2017. The cost of credit, measured as the net loan
loss provision, net of IFRS 9 reclassifications to net loan ratio, came in at 98 bps, down compared to
last year’s figure of 154 bps10 ; the loan loss provision level reflects a disciplined valuation approach
to maintain high coverage levels aimed at taking advantage of any additional opportunities to
speed up the de-risking process.
Net write-backs of securities and other financial assets of € 2.2 million were credited to income in
Q1 (compared to net write-downs of € 8.4 million at 31 March 2017 mainly related to the
impairment of the stake held in the Atlante Fund).
Net provisions for risks and charges reported a charge of € 25.0 million, compared to almost zero in
the same period last year.
In Q1 2018, gains on disposal of equity and other investments of € 179.7 million were reported,
exclusively tied to the impact of the bancassurance business reorganization.
Income tax on continuing operations at 31 March 2018 came in at - € 7.0 million (minus € 27.5 million
at 31 March 2017).
Considering the net income attributable to non-controlling interest (+€ 1.4 million), Q1 2018 closed
with a net income for the period of € 223.3 million, compared to a net income ex badwill of € 115,2
million in the same period last year. (The badwil, totaling € 3,076.1 million, came out once the PPA
process was completed, and it drove the net income for Q1 2017 to € 3,191.3 million).
Key balance sheet items
Direct funding11 at 31 March 2018 amounted to € 107.8 billion, up by 0.5% compared to € 107.3
billion at 31 December 2017. The comparison shows a € 0.9 billion increase in the checking
accounts and demand deposits held with the branch network and a € 0.9 billion increase in
certificates of deposits and other funding, while bonds issued keep following a declining trend (€ -
1.1 billion). The y/y comparison with Q1 2017 data make this trend even clearer, whereby while
direct funding remained fairly stable (+ € 0.1 billion equal to + 0.1%), checking accounts and
demand deposits reported a € 6.6 billion increase in (+ 8.7%) and bonds issued a € 5.9 billion
decline (equal to – 24.9%), in line with the policy aiming at progressively reducing the cost of
funding by cutting back on the more expensive funding sources. The funding guaranteed by the
stock of certificates issued by the Group at 31 March 2018 came in at € 3.8 billion, compared to €
4.0 billion at December 2017 (-4,0%) and € 4.5 billion at March 2017 (-15,8%), thus confirming its
downward trend.
Indirect funding, net of capital protected certificates, amounts to € 91.6 billion. During the quarter,
the exit of an institutional customer, with assets under administration for a total of €4.8 billion, was
registered, characterised by a very marginal profit contribution. Net of the mentioned effect, the
Assets under Custody decline by 0.1% against 31 December 2017 and by 6.3% year on year.
Assets under management amounted to € 59.6 billion, down by 1.5% compared to € 60.5 billion at
31 December 2017, mainly affecting portfolio management, down by 9.8%., while mutual funds
10
The figure is not fully comparable as IFRS 9 introduced a new loan impairment model. 11 Includes checking accounts and demand and term deposits, issued bonds, certificates of deposit and other securities, facilities and other debts, capital protected certificates. Repos are not included.

7
and Sicav reported a positive performance, reporting a growth of € 0.4 billion over the quarter and
of € 3.5 billion year on year.
Financial assets totaled € 36.3 billion, up by 5.1% compared to € 34.5 billion at 31 December 2017.
The increase over the end of 2017 was driven by the increase in the securities held in the Hold to
Collect” portfolio made up of government bonds expected to be held to maturity. At 31 March
2018 the portfolio composition was: € 32.0 billion of debt securities, € 2.0 billion of equity securities
and UCITS units. Exposures in sovereign debt securities amount to € 26.3 billion, of which € 19.0 billion
related to Italian Government bonds. To this respect, diversification is still under way, and the Italian
government bond exposure declined to 72.5% compared to 82.1% at December 2017. Following
the introduction of IFRS9, financial assets include also customer loans and advances mandatorily
measured at fair value (amounting to € 0.3 billion).
At 31 March 2018, net customer loans 12 came in at € 106.2 billion, down by € 1.6 billion compared
to 31 December 2017 due to IFRS9 reclassifications and write-downs affecting mainly non-
performing loans. Taking the figure at 1 January 2018 reclassified on a like-for-like basis, the
customer loan aggregate has remained fairly stable, reporting a slight increase in performing
exposures (+ € 0.3 billion equal to + 0.3%) and a further reduction in non-performing loans (- € 0.2
billion, equal to -1.8%).
Net non-performing exposures (bad loans, unlikely-to-pay and past dues) at 31 March 2018 totaled
€ 11.4 billion, down by € 1.7 billion (-12.8%) compared to 31 December 2017. The decline was
mainly driven by the adoption of IFRS 9, allowing additional write-downs of bad loan of € 1.2 billion
and of performing loans of € 0.1 billion.
The analysis of the single loan classes shows the following dynamic:
• Net bad loans of € 5.2 billion, down by 19.4% compared to 31 December 2017 driven by IFRS
9 write-downs;
• Net unlikely-to-pay loans of € 6.1 billion, down by 6.1% compared to 31 December 2017;
• Net past-due loans of € 67 million, down by 16.9% compared to 31 December 2017.
The aggregate NPL coverage ratio stood at 53.8%, up compared with 48.8% at 31 December 2017.
In greater detail, at 31 December 2017 the coverage ratios were:
• Bad loans at 66.4%, (58,9% at 31 December 2017);
• Unlikely-to-pay loans at 32.2% (32.4% at 31 December 2017);
• Past-due exposures 15.3% (15.7% at 31 December 2017).
The coverage ratio of performing loans came in at 0.41%, compared to 0.32% at 31 December
2017. Net of repo transactions, which are practically risk-free, the performing loans coverage ratio
goes up to 0.44% (0.34% at 31 December 2017). The increase in the coverage ratio was mainly
driven by the adoption of the new impairment model under IFRS 9.
Group capital ratios13
12 The aggregate does not include customer loans that, following the adoption of IFRS 9, must mandatorily be measured at fair value. These loans, amounting to € 325 million (of which € 181 million related to non-performing exposures) are included in financial assets measured at fair value 13 Based on art. 26 paragraph 2 of EU Regulation no. 575/2013 of 26 June 2013 (CRR), the inclusion of interim net income in the Common Equity Tier 1 Capital (CET1) is subject to the prior authorization of the competent authority (ECB), for which it is required that they are audited by the auditing company.

8
At 31 March 2018, Group Own Funds, including the accruing net income at 31 March 2018, totaled
11,141 million, down compared to 11,544 million at 31 December 2017 due to the end of the
transitional regime on 1 January 2018 allowing the phasing-in of certain rules introduced as at 1
January 2014 with the “Basel 3 Framework”.
The Common Equity Tier 1 ratio (CET1 ratio) came in at 13.48% compared to12.36%% at 31
December 2017. The increase was driven by the decline in risk-weighted assets (-9,760 million)
mainly following the authorization issued by the ECB effective on 31 March 2018 to roll out the
credit risk measurement internal models to the subsidiary BPM S.p.A.. This ratio benefits from the
election to fully apply the transitional provision introduced by the new article 473 bis of EU
Regulation no. 575/2013, which phases in the impact on own funds generated by the adoption of
the new impairment model introduced by IFRS9. Accounting for the expected impacts from the
capital management actions that have already been defined and announced to the market, and
that are expected to be finalized during the current year, the pro-forma fully-loaded CET 1 ratio
comes in at 12.10%.
The Tier 1 ratio came in at 13.98% compared to 12.66% at 31 December 2017, while the Total
Capital ratio came in at 16.85% compared to 15.21% at 31 December 2017.
Further streamlining of the Group corporate structure
Today the Boards of Directors of Banco BPM S.p.A., Società Gestione Servizi BP S.C.p.A. and BP
Property Management S.C.a r.l. have approved the plan to merge SGS and BP Property into Banco
BPM.
Business combinations fall within the scope of Gruppo Banco BPM’s corporate and operational
structure rationalization actions and meet the need to simplify and rationalize the structure,
optimize and promote the value of human resources and to reduce costs.
The mergers will be carried out under the simplified regime provided for fully owned companies,
with no need to calculate the swap ratio or to prepare an executive explanatory report.
The mergers are expected to come into effect, subject to the issuance of the required
authorizations from the competent authorities, indicatively in January 2019, and the accounting
and fiscal effects should start on 1 January 2019.
With regard to the applicability of the current regulations on related parties transactions, under
Consob’s Regulation no. 17221 of 12 March 2010 and following amendments (“Consob RPT
Regulation”) and the associated corporate rules adopted by the Bank (the “Banco BPM
Procedure”, available on the website www.bancobpm.it, Corporate Governance section,
Corporate documents), the mergers and the intragroup share/unit transfers of the acquiring SGS
and BP Property fall within the scope of “intragourp” transactions and can therefore benefit from
the expemptions under the above-mentioned Regulation, since it was ascertained that there is no
material interest by other related parties wherefore the transactions would not be completed or
would have been completed along different terms and conditions.
The financial and operating situation of the Group at 31 March 2018 has not undergone a limited audit and Banco BPM will formally apply for the immediate inclusion of the accruing net income in the calculation of CET1 Capital only with respect to data as at 30 June 2018. The data and capital ratio illustrated in this news release include the interim accruing net income at 31 March 2018 as derived from the financial and operating situation of the Group that has been approved today by the Board of Directors.

9
OPERATIONAL OUTLOOK
The word macroeconomic outlook still remains positive, even if the risks of an increase in the level of
protectionism and interest rates exist, which could result into tensions and volatilty on the financial
markets.
In this context, the growth expectations for Italy for the year 2018 remain substantially unchanged
at +1.5%, even if political instability could lead to a slowdown in economic growth over the next
quarters.
The Group, having already completed a relevant number of projects of the Strategic Plan 2016-
2019, among which above all the set-up of the organizational unit dedicated to the management
of nonperforming loans, the integration of IT systems, the definition of the partnership in asset
management and bancassurance as well as the reorganization of the commercial network, will
focus its attention on the rationalisation of the private and investment banking activities, on the
project of digital transformation, on the simplification of the Group's perimeter as well as on the
optimisation of its presence in the territory.
In addition, being able to leverage on the results achieved as well as on its solid capital position,
the Group will forge ahead in its comprehensive derisking activities, in a way that is fully in
coherence with the new ambitous targets already communicated.
The evolution of revenues, in spite of ongoing competitive pressures on margins, is set to benefit
from an addtional containment in the average cost of funding, thanks to the remaining
opportunities for an optimisation of its mix, the positive contribution from participations and the
trend characterising Net fee and commission income, in particular those deriving from
management, intermediation and advisory services.
The containment of operating costs, through an improvement in efficiency, the implementation of
specific actions aimed at cost optimisation and the rationalisation of organisational functions, will
represent one of the key factors of attention.
The NPL coverage levels will remain high, whereby the reduction in the stock levels will procede
both through internal workout activities and, as indicated before, through the implementation of
the actions envisaged in the derisking plan.
***
The financial reporting officer, Mr. Gianpietro Val, in compliance with art. 154, paragraph 2 of the Consolidated act for financial intermediation, hereby states that the accounting information illustrated in this press release is consistent with documental evidence, accounting books and book-keeping entries.
***
The financial results at 31 March 2018 of Gruppo Banco BPM will be presented to the financial community during a conference call to be held today 9 May 2018 at 18.30 (C.E.T.). The documentation supporting the conference call is available on the website of the authorized
central storage mechanism (www.emarketstorage.com), as well as on the Bank’s website (www.bancobpm.it), where all the instructions to connect to the event are also available.
Explanatory notes
This News Release represents the document through which Banco BPM decided to disclose to the public and to the market, on a voluntary basis, supplementary periodic information in addition to the half-year and annual reports (“quarterly

10
reports”), in compliance with the disclosure policy communicated to the market in the press release “2018 Corporate Calendar” released on 23 January 2018, pursuant to art. 82-ter of the Issuers Regulation effective on 2 January 2017. For the sake of completeness, please note that the quarterly reports include also the result presentation handout prepared as a support for the conference call with the financial community to be held after this News Release has been released. This quarterly report includes a comment on the quarterly operating performance that focuses on the dynamic of the key P&L, balance sheet and financial items, and is based on the reclassified balance-sheet and income statements. Please find below some explanatory notes that are deemed useful to better understand the approach followed in preparing the above-mentioned accounting statements as at 31 March 2018 and those referring to the prior FY, as well as the dynamic of the quarterly results commented in this news release.
1. Accounting policies and reference accounting standards
The balance sheet and income statement layouts contained in this news release have been reclassified along management criteria in order to provide an indication on the Group’s overall performance based on easily and rapidly calculable operating and financial data. The layouts have been prepared based on the financial statements layout indicated in the Bank of Italy’s Circular no. 262/2005, update no. 5 of 22 December 2017. It is noted that deposit balance sheet balances include the components pertaining to the custodian bank Business Unit, to be disposed during the year. The accounting standards adopted to prepare the accounting situation at 31 March 2018, as pertains the classification, recognition, measurement and derecognition of assets and liabilities, as well as the recognition of costs and revenues, comply with the IAS/IFRS issued by the International Accounting Standard Board (IASB) and the related interpretations of the International Financial Reporting Interpretations Committee (IFRIC), as endorsed by the European Commission and effective on 31 March 2018, pursuant to EC Regulation no. 1606 of 19 July 2002. To this respect, please note that on 1 January 2018 the new accounting standards IFRS 9 “Financial instruments” and IFRS 15 “Revenue from contracts with customers” have come into effect. The impacts generated by the first-time adoption of IFRS 9 and the attendant changes introduced in the Group’s reclassified statements as compared to those used up until 31 December 2017 are explained in note 2 below; as to IFRS 15, please note that no need for a different accounting treatment of revenues emerged, as it is basically consistent with the recognition procedures provided for by the prior accounting standard IAS 18. The adoption of certain accounting standards necessarily calls for the use of estimates and assumptions that have an impact on the value of assets and liabilities recognized in the balance sheet. The assumptions used to calculate estimates take into account all available information upon preparing the quarterly report as at 31 March 2018. Considering the uncertainty characterizing the reference environment, it cannot be ruled out that the estimates and assumptions, albeit reasonable, may fail to be confirmed in the future scenarios in which the Group may be operating. Therefore, future actual results may differ from the estimates generated to prepare the financial and operating situation as at 31 March 2018 and adjustments may be necessary that cannot be predicted or estimated today against the carrying amount of assets and liabilities recognized in the balance sheet. To illustrate the main uncertainties as to the use of estimates to prepare this interim quarterly report, please refer to the Consolidated annual report as at 31 December 2017. Finally, please note that the information contained in this news release has not been prepared based on IAS 34 on Interim Financial Reporting and has not been audited.
2. First-time adoption of the accounting standard IFRS 9 “Financial instruments”
The new international accounting standard IFRS 9 “Financial instruments”, which includes requirements for recognition, measurement, impairment and hedge accounting of financial instruments, has been endorsed with Regulation no. 2067 of 22 November 2016 to replace the accounting standard IAS 39. The new accounting standard is mandatorily effective for periods beginning on or after 1 January 2018. For Gruppo Banco BPM the adoption of the accounting standard IFRS 9 required an adjustment of the opening shareholders’ equity balances as at 1 January 2018. The Group did not elect to early adopt the standard, except for the accounting treatment of the impact from changes in own credit risk on financial liabilities designated at fair value. The different treatment of the above changes (carried directly at equity and not through profit and loss) has been adopted since FY 2017, as permitted by the standard. Please note that the first-time adoption of IFRS 9 (FTA) called for significant implementations in terms of new processes, procedures, methodologies, IT systems. Considering the significant changes that Banco BPM experienced in financial year 2017 following the merger between Banco Popolare and BPM (the unification of the information systems of the two banks, the rollout of the internal credit risk measurement models of the former Banco Popolare onto BPM and their prior modification, etc.) the new processes could be implemented and made operational only in the first quarter of 2018. The data and information generated by the new systems and processes have undergone a rigorous scrutiny. It should be pointed out that the new processes are still being checked by the internal control structures and by the audit firm and will continue also during the second quarter of the year. External control and validation activities are expected to be completed by the date of the first interim financial statements prepared in compliance with IAS 34, namely the half-yearly report as at 30 June 2018, when an IFRS 9 transition document will be prepared, with all the information requirements under IFRS 7. Hence, although the effects from the first-time adoption of IFRS 9 described in this news release both with respect to the effectiveness date and to 31 March 2018 are deemed reliable, it cannot be ruled out that once the control activities are completed, certain information may become available that is not known today that may require a partial revision to the disclosed impacts. Possible changes may also arise from the communication by associates tied to the final impacts generated by the first-time adoption of the accounting standard on their financial statements. To provide an understanding of the effects generated by the adoption of the new accounting standards, an overview is supplied below, covering the new financial instruments classification and measurement rules with the new impairment model introduced by IFRS 9, as well as the attendant changes to the reclassified balance-sheet and P&L layouts, the impact on the stated net equity and on own funds. To gain a better understanding of the intervening changes, we provide also the statements bridging former IAS 39 balances with IFRS 9 balances for financial assets and liabilities, by single category and by single type of financial instrument.

11
Classification and measurement requirements for financial assets and liabilities under IFRS 9
IFRS 9 requires that the classification of financial assets depend on the combination of the following two drivers: - The entity’s Business Model: it reflects the objectives that the company management is pursuing by holding the
financial assets. More precisely: • “Hold to Collect” (HTC), if the objective is to collect the contractual cash flows, holding the financial
instrument to maturity; • “Hold to Collect and Sell” (HTC&S), if the financial assets are held with the objective of both collecting the
contractual cash flows throughout the assets life, and then collecting the proceeds from the sale of the same financial assets;
• “Other”: if the objectives differ from those described above, as for example if the aim is to generate cash flows through trades (“Sell”).
- Cash flow contractual characteristics: depending on whether the cash flows represent solely payments of principal and interest (“Solely Payments of Principal and Interest”, or SPPI) or depend also on other variables (for example: profit distribution, like dividends, or repayment of invested capital based on the issuer’s performance, etc.). The test conducted to verify the cash flow contractual characteristics is called the “SPPI test”.
Based on the various combinations between business model and cash-flow characteristics, the following accounting categories are determined:
- financial assets measured at amortized cost: include debt instruments (loans and securities) with a “Hold to Collect” business model, where the contractual terms represent solely payments of principal and interest (SPPI test passed);
- financial assets measured at fair value through other comprehensive income (FVTOCI), with recycling to profit or loss: include debt instruments (loans and securities) with a “Hold to Collect and Sell” business model, where the contractual terms represent solely payments of principal and interest (SPPI test passed);
- financial assets measured at fair value through profit or loss (FVTPL): include all trading assets, including non-hedging derivatives and, irrespective of the business model, assets that must mandatorily be measured at fair value because cash flows do not represent solely payments of principal and interest (SPPI test failed). They include all equity instruments, unless the entity irrevocably designates at its sole option to classify an investment in equity instruments as financial assets designated at fair value through other comprehensive income, with no recycling to profit or loss of the gains or losses upon derecognition (except for dividend income which continues to be recognized in profit or loss).
In addition to the categories described above, there is the possibility of using the accounting category of financial assets designated at fair value through profit or loss; this option is irrevocable and is permitted only to eliminate or significantly reduce a measurement or recognition inconsistency that would otherwise arise from measuring assets or liabilities or recognizing the gains and losses on them on different bases (known as an “accounting mismatch”). With regard to the new classification rules based on the cash flow characteristics, IFRS 9 eliminates the rule to separate embedded derivatives from the financial assets not measured at fair value through profit or loss. As to financial liabilities, IFRS 9 confirms the classification and measurement rules under IAS 39, based on which financial liabilities are measured at amortized cost, except for financial liabilities held for trading, including derivatives, and financial liabilities that have been designated at fair value through profit or loss. As to the latter category of liabilities, IFRS 9 requires that the amount of fair value change attributable to changes in own credit risk be presented in other comprehensive income and not through profit or loss as required by IAS 39, unless such a presentation would create or enlarge an accounting mismatch, in which case the entire fair value change must be presented in profit or loss. Based on what described above, upon adopting IFRS 9, Gruppo Banco BPM defined the classification of financial instruments in accordance with the new accounting categories under IFRS 9 - taking into account the business model at 1 January 2018 and the characteristics of the contractual cash flows of the instrument upon its origination – and it remeasured them based on their measurement criteria.
IFRS 9 impairment methodology based on expected credit losses (ECL)
Under IFRS 9, all financial assets that are not measured at fair value through profit or loss, represented by debt securities and loans, off-balance-sheet exposures (commitments and guarantees issued) must be assessed under the new impairment model based on Expected Credit Losses (ECL). The aim of the new approach is to guarantee an earlier recognition of losses compared to the previous model under IAS 39, where losses were to be recognized only in case of objective evidence after the initial recognition of the financial asset (known as “incurred losses”). According to the calculation model of Expected Credit Losses, losses must always be recognized not only based on the objective evidence of impairment losses already occurred at the date of reporting, but also based on future expected impairment losses that have not materialized yet. The impairment model introduced by IFRS 9 hinges also on a “forward-looking” valuation concept. More precisely, the ECL model requires that financial assets measured at amortized cost be classified in three separate stages, tied to different expected loss measurement criteria:
- stage 1: to be assessed based on an estimation of expected credit loss on a 12-month time horizon. It includes performing financial assets where no significant credit risk impairment has been identified since the initial recognition date;
- stage 2: to be assessed based on an estimation of expected credit loss on a full lifetime basis. It includes performing financial assets that have undergone a significant increase in credit risk since initial recognition;
- stage 3: to be assessed based on an estimation of expected credit loss assuming a probability of default of 100%. All non-performing assets fall within this category.
Future expected losses that have not materialized yet must therefore be calculated so as to reflect: - the probability that a range of various outcomes may occur; - the discounting effect using the effective interest rate; - past events, current and future conditions

12
As a result, measuring expected losses is a complex exercise that requires significant judgmental and estimation elements, also with respect to macro-economic forward-looking data, that must be incorporated in the impairment model. For further details on the framework defined by the Group to measure the existence of a significant credit risk impairment guiding the assignment of the relevant Stage, and on the models that were developed to calculate expected losses, please refer to the Annual Report as at 31 December 2017, Part A – Accounting policies in the consolidated explanatory notes. Changes in reclassified balance-sheet and income statement faces
The reclassified balance sheet at 31 March 2018 has undergone some adjustments in order to include the new financial instrument accounting categories introduced by update no. 5 of the Bank of Italy’s Circular no. 262, mentioned above. More precisely, the prior aggregates called “Financial assets and hedging derivatives”, “Due from banks” and “Loans to customers” have been replaced by the following new aggregates:
- “Loans and advances measured at amortized cost (AC)”, which include the following line-items: o “Loans and advances to banks”: due from banks represented by loans and advances and presented in
the Bank of Italy’s template under the assets line-item “40. Financial assets measured at amortized cost a) Loans and advances to banks). Therefore, exposures represented by debt securities are excluded and are presented under the aggregate “Other financial assets”;
o “Loans and advances to customers”: due from clients represented by loans and advances and presented in the Bank of Italy’s template under the assets line-item “40. Financial assets measured at amortized cost b) Loans and advances to customers);
The Loans and advances aggregate therefore does not include debt securities issued by banks and customers posted in the aggregate “Other financial assets” as explained below;
- “Other financial assets”, comprising the following line-items: o “Fair Value assets through Profit or Loss” include the financial instruments presented in the portfolios of
“Financial assets measured at Fair value through profit or loss” and of “Hedging derivatives”, posted under assets line-items 20 and 50 of the Bank of Italy’s template;
o “Fair Value assets through other comprehensive income (OCI)” corresponds to the assets line-item 30 of the Bank of Italy’s template;
o “Assets measured at amortized cost (AC)" are exposures to banks and customers represented by debt securities (included under the assets line-item 40 of the Bank of Italy’s template).
No material changes are to be reported about the reclassified liabilities line-items; the previous aggregate “Due to customers, debt securities in issue and financial liabilities designated at fair value” has been renamed as “Direct funding”, with breakdown between the line-item “Deposits from customers” (liabilities line-item 10 b) of the Bank of Italy’s template) and “Debt securities and financial liabilities designated at fair value” (liabilities line-items 10 c and 30) of the Bank of Italy’s template). For the remaining line-items of the reclassified balance sheet, the aggregation criteria illustrated in the 2017 consolidated financial statements have remained unchanged. As to the reclassified income statement, the adoption of IFRS 9 required the redefinition of aggregates relating to the net financial result and to impairment losses, based on the new financial instrument categories and the associated measurement criteria. Below a bridge is provided between the new line-items and the income statement prepared in accordance with the Bank of Italy’s Circular no. 262:
- the line-item “Net financial result” includes the results generated by the measurement or disposal of all the financial instruments, except for loan loss provisions which are presented separately. In particular, this line-item includes dividends on shares classified in the portfolio of financial assets measured at fair value through profit or loss and through other comprehensive income (line-item 70), the net trading and hedging results (line-items 80 and 90), gains and losses from disposal or repurchase (line-item 100), except for the result from the disposal of financial assets measured at amortized cost represented by loans and advances, net results arising on other financial assets and liabilities measured at fair value through profit or loss (line-item 110);
- the line-item “Net write-downs of loans and advances to customers” includes the line-item 130 a) Net credit risk write-downs/write-backs of a) financial assets measured at amortized costs, exclusively for the component represented by loans and advances to customers and the related operating results generated by their disposal (included in the line-item 100 a) “Gains (losses) on disposal or repurchase of financial assets measured at amortized cost”);
- the line-item “Net write-downs of securities and other financial assets” represents expected losses on securities and loans and advances to banks classified in the portfolios of “Financial assets measured at amortized cost” (corresponding to line-item 130 b) Net credit risk write-downs/write-backs of b) financial assets measured at fair value through other comprehensive income, as well as a component of the above-mentioned line-item130 a));
- the line-item “Net allowance to provisions for risks and charges” corresponds to the line-item 200 of the income statement face set out in the Bank of Italy’s Circular no. 262 and it includes provisions for commitments and guarantees issued.
For the remaining line-items of the reclassified income statement, the aggregation criteria illustrated in the 2017 consolidated financial statements have remained unchanged. As expressly permitted by IFRS 9 (note 7.2.15), Banco BPM elected not to recalculate the balances of the prior year based
on the new measurement criteria introduced by IFRS 9, Please note that in order to favor a more like-for-like comparison:
- the reclassified balance sheet face shows both the balances as at 31 December 2017 and an indication of te

13
balances at 1 January 2018 restated based on IFRS 9; - when preparing the reclassified income statement face, the operating results of the prior periods have been re-
presented to the best possible extent based on available information. More specifically:
• the “Net financial result” of the prior periods under comparison has been restated to include write-downs on impairment of equity securities classified in the former portfolio of “Financial assets available for sale”, previously included in the aggregate item “Write-downs of loans and advances to banks and other assets”;
• the line-item “Net write-downs on loans and advances to customers” corresponds to the previous aggregate “Net write-downs of customer loans”, net of write-downs of securities measured at amortized cost posted under the line-item “Loan loss provisions: securities and other assets” and of write-downs of guarantees and commitments, now presented under the line-item “Net allowances to provisions for risks and charges”;
• the line-item “Net write-downs on securities and other financial assets” corresponds to the previous aggregate item “Net write-downs of loans to banks and other assets”, net of write-downs of equity securities, but including write-downs of debt securities measures at amortized cost, as illustrated above;
• the line-item “Net allowances to provisions for risks and charges” corresponds to the same line-item of the previous aggregate and it includes write-downs of guarantees and commitments.
Moreover, with regard to the presentation of interest income, IFRS 9 requires that interest accrued on impaired financial assets (Stage 3) must be stated in the accounts based on the amortized cost methodology, i.e., based on the effective interest calculated taking expected collection flows into account. Moreover, the standard requires that loan write-backs tied to the time value must also be included in interest income. Following the adoption of these new presentation rules, net interest income in Q1 2018 reported a total increase of 65.8 million as a combined result of the inclusion in this aggregate of write-backs tied to the time value, which up to 31 December 2017 were posted under the line-item net write-downs on loans as well as the net presentation of interest accrued on UTP loans (up to 31 December 2017 the interest amount considered to be irrecoverable was presented under the line-item net write-downs on loans). Notwithstanding the interventions described above, the data presented in the reclassified income statements attached to this news release under the line-items indicated above have not been calculated in a similar manner and are therefore not readily comparable. IFRS 9 impact on stated net equity 1 January 2018
Under IFRS 9, the consolidated shareholders’ equity of Gruppo Banco BPM reported a decrease of 1,037.8 million net of tax effect, from 11,963.5 million to 10,925.7 million. Notably, the decrease is attributable to the following effects:
- -1,245.8 million, due to the increase in loan loss provisions after applying the new impairment model to non-preforming loans (bad exposures only);
- -91.2 million, due to the increase in loan loss provisions after applying the new impairment model to performing loans (Stage 1 and Stage 2 exposures) represented by loans and advances and debt securities;
- -0.02 million, due to the increase in liability provisions tied to the measurement of guarantees issued and commitments;
- +42.3 million after applying the new financial assets and liabilities classification and measurement rules, excluding impacts from the new model to calculate expected credit losses, as explained above;
- -87.3 million, due to the impairment of investments in associates carried at equity, as a result of the negative impact on their shareholders’ equity reported by the associates upon the FTA of IFRS 9;
- +344.2 million, due to the recognition of higher deferred tax assets arising from accruing tax losses as a result of the above-described decline in stated net equity14.
In particular, the above-mentioned effects produced a decline in valuation reserves of 78.2 million, and of the other equity reserves of 959.6 million. These effects are shown in greater detail in the table below, which provides a bridge between the shareholders’ equity at 31 December 2017 in accordance with the retired IAS 39 and the shareholders’ equity remeasured at 1 January 2018, following the adoption of the new accounting standard.
14
The Decree issued by the Ministry of Economy and Finance on 10 January 2018 established that the negative equity impact caused by the
adoption of the new impairment model introduced by the accounting standard principio IFRS 9 is deductible from the IRES and IRAP taxable income in FY 2018. Therefore, at the date of the first-time adoption an accruing tax loss was generated. Based on current regulations, IRES tax
losses can be carried forward and can be recovered through the generation of taxable income in the following financial years with no time limit. IRAP tax losses instead cannot be carried forward. In the light of this regulation, only the IRES tax loss caused by the adoption of the new
accounting standard was deemed likely to be recovered, hence new deferred tax assets of 342.1 million were recognized.

14
Table 1: reconciliation statement of net equity as at 31.12.2017 (ex IAS 39) and as at 01.01.2018 (IFRS 9)
- in thousand euro -
- o/w: FTA
IFRS 9 on
"Valuation
Reserves"
- o/w: FTA
IFRS 9 on
"Reserves"
A Consolidated shareholders’ equity as at 31 December 2017 (ex IAS 39) 11,963,540
B IFRS 9 ECL measurement impact on impaired financial assets (Stage 3) -1,245,844 - -1,245,844
Assets measured at amortized cost – Loans and advances to customers -1,245,844 -1,245,844
C IFRS 9 ECL measurement impact on performing financial assets (Stage 1 and
Stage 2) -91,156 7,137 -98,293
Financial assets measured at amortized cost – Loans and advances to customers -75,904 -75,904
Financial assets measured at amortized cost – Loans and advances to banks -1,777 -1,777
Financial assets measured at amortized cost – Debt securities -13,475 -13,475
Financial assets measured at fair value through OCI - 7,137 -7,137
D IFRS 9 ECL measurement exposure on off-balance-sheet exposures 17 - 17
Guarantees and commitments 17 17
E IFRS 9 Classification&Measurement impact (excluding ECL measurement) 42,317 -80,210 122,527
Financial assets measured at fair value through profit or loss - Debt securities -12,237 -6,823 -5,414
Financial assets measured at fair value through profit or loss – Equity securities
and UCITS units - -128,042 128,042
Financial assets measured at fair value through profit or loss - Loans and
advances to customers -3,124 -3,124
Financial assets measured at fair value through OCI - Debt securities 51,600 51,859 -259
Assets measured at amortized cost - Debt securities 17,714 17,504 210
Financial liabilities designated at fair value -15,254 -14,708 -546
Trading financial liabilities 3,618 3,618
F IFRS 9 impact on investments in associates (equity method) -87,351 - -87,351
Investments in associates -87,351 -87,351
G=B+C+D
+E+F
Total IFRS 9 impact on consolidated shareholders’ equity as at 1 January 2018
(gross of tax effect) -1,382,017 -73,073 -1,308,944
H Tax effect on 1 January 2018 344,156 -5,155 349,308
I=G+H Total IFRS 9 impact on consolidated shareholders’ equity as at 1 January 2018
(net of tax effect) -1,037,861 -78,228 -959,636
A+I Consolidated shareholders’ equity as at 01 January 2018 (IFRS 9) 10,925,679
Legend FV: Fair Value
PL: Profit or Loss
OCI: Other Comprehensive Income
IFRS 9 impact on own funds at 1 January 2018
The impacts illustrated in the previous paragraph in terms of capital ratios bring about a reduction of 180bps in the fully-loaded CET 1 ratio, which goes from 11.92% on 1 January 2018, prior to the first-time adoption of the new accounting standard, to 10.12%. The impacts do not take into account the option that had already been elected to fully adopt the transitional provision introduced by the new article 473 bis of the EU Regulation no. 575/2013, which phases in the impact on own funds caused by the adoption of the new impairment model introduced by the new accounting standard. Under said arrangements, part of the increase reported by loan loss provisions may be included in the CET1 capital in the first five financial years (staggering from 95%, to 85%, 70%, 50% and 25% starting from 2018 to 2022). Then as of 1 January 2023
the impact from the first-time adoption of IFRS 9 must be fully reflected in the calculation of own funds.15
Taking into account said transitional provision, the impact from the first-time adoption of IFRS 9 on CET1 for full-year 2018 is limited to 4 bps. Reconciliation statement between balances as at 31 December 2017 ex IAS 39 and those as at 1 January 2018 IFRS 9
The reclassified balance sheet as at 31 December 2017 pursuant to ex IAS 39 values reconciled with balances as at 1 January 2018, restated in compliance with IFRS 9 and used to compare balance sheet balances as at 31 March 2018, is attached to this News Release. To better understand the transition from the old IAS 39 portfolios to the new IFRS 9 portfolios, the table below provides the reconciliation between balances as at 31 December 2017 (IAS 39 values) and balances as at 1 January 2018 (IFRS 9 values) for each reclassified balance sheet line-item tied to financial assets and liabilities, with a separate presentation of changes due to new classification criteria (Classification impacts), of impacts arising from the new measurement criteria (Measurement impacts) and from the new impairment model (ECL impact – Expected Credit Losses). To this end, balances as at 31 December 2017 (ex IAS 39) have been conventionally attributed to the new accounting categories (column 31/12/2017 (IAS 39)); IAS 39 balances are presented under the “Classification Impact” column, reallocated based on the new decisions made with regard to the classification of financial assets based on the new accounting standard, while impacts from new measurement criteria and impairment are presented respectively under the columns “Measurement impacts” and “ECL Impacts”.
15 The transitional provision is illustrated in note 7 of these explanatory notes.

15
Table 2: reconciliation statement of financial assets/liabilities between balances at 31.12.2017 (IAS 39) and balances at
01.01.2018 (IFRS 9)
(thousand €) 31/12/2017
(IAS 39)
Classification
impacts
31/12/2017
(IAS 39)
reclassified
Measurement
impacts ECL impacts
01/01/2018
(IFRS 9)
Loans and advances measured at AC 112,681,902 -346,576 112,335,326
-1,323,525 111,011,801
- Loans and advances to banks 4,939,223 (1) 0 4,939,223
-1,777 4,937,446
- Loans and advances to customers 107,742,679 (2) -346,576 107,396,103
-1,321,748 106,074,355
Other financial assets 34,533,172 346,576 34,879,748 53,953 -13,475 34,920,226
- Assets measured at FV through PL 5,184,586 1,283,285 6,467,871 -15,361
6,452,510
- Trading assets 4,911,824 -17,390 4,894,434
4,894,434
- Assets designated at FV 28,952 -28,952 0
0
- Assets mandatorily measured at FV 1,329,627 1,329,627 -15,361
1,314,266
- Hedging derivatives 243,810
243,810
243,810
- Assets measured at FV through OCI 17,128,622 (3) -430,149 16,698,473 51,600
16,750,073
- Assets measured at AC 12,219,964 (4) -506,560 11,713,404 17,714 -13,475 11,717,643
Total financial assets 147,215,074 - 147,215,074 53,953 -1,337,000 145,932,027
Due to banks 27,199,304
27,199,304
27,199,304
Direct funding 107,509,849
107,509,849 15,254
107,525,103
- Deposits from customers 87,848,146
87,848,146
87,848,146
- Debt securities and financial liabilities desig. at FV
19,661,703 - 19,661,703 15,254
19,676,957
- Debt securities in issue 16,248,143 160,370 16,408,513 15,254
16,423,767
- Financial liabilities designated at fair
value 3,413,560 -160,370 3,253,190
3,253,190
Trading financial liabilities and hedging
derivatives 8,707,966
8,707,966 -3,618
8,704,348
Total financial liabilities 143,417,119 0 143,417,119 11,636 - 143,428,755
Total impact on shareholders’ equity 42,317 -1,337,000
(1) Corresponding to the retired balance sheet item “due from banks” (5,164,715 thousand), net of assets represented by debt
securities (225,492 thousand) (2) Corresponding to the retired balance sheet item “loans to customers” (108,176,382 thousand), net of assets represented by debt
securities (433,703 thousand) (3) The ex IAS 39 portfolio of “Financial assets available for sale” has been fully assigned to the line-item “Assets measured at FV
through OCI” (4) The balance of the ex IAS 39 portfolio of “Financial assets held to maturity” (11,560,769 thousand) and loans to customers and banks
represented by debt securities, as described in the above notes 1) and 2) (totaling 659,195 thousand), has been assigned to the line-item “Financial activities measured at amortized cost)
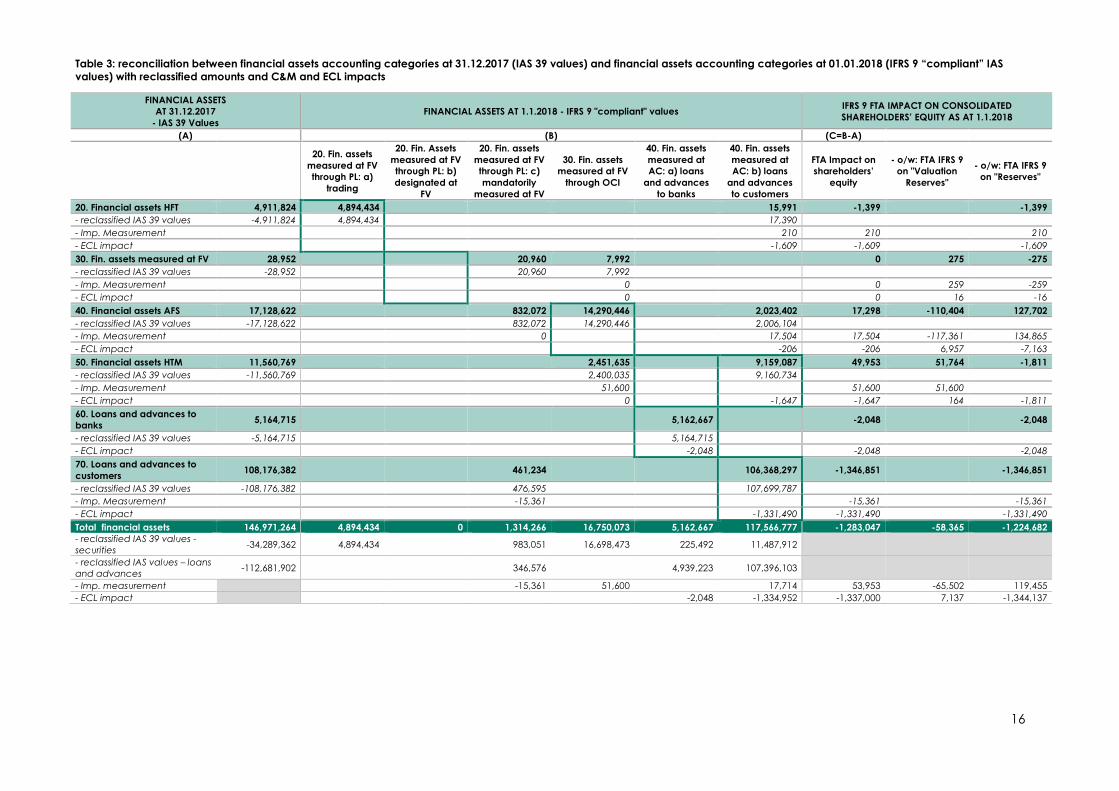
The tables below provide detailed information on the reconciliation between the ex IAS 39 portfolios and the IFRS 9 portfolios, based on the balance sheet items indicated in the Bank of Italy’s Circular no. 262 (before ad after IFRS 9), presenting the reclassified amounts and the related FTA impacts. In detail, the tables show the reclassification of ex IAS 39 balances into the new IFRS 9 portfolios by accounting category (table 3) and by type of financial strategy (table 4); moreover, the total impact on the shareholders’ equity as at 1 January 2018 is presented, specifying the impact on the “Valuation reserve” and on “Retained earnings”. The tables do not include hedging derivatives as they are not affected by the adoption of the new accounting standard IFRS 9. For the sake of a smoother comparison between the financial assets portfolios of tables 3 and 4 and the reclassified balance sheet items (table 9), please note that financial assets measured at amortized cost (loans and advances to banks and loans and advances to customers) are presented in the reclassified face under the line-item “Loans and advances measured at amortized cost” with regard to loans and advances, and under the line-item “Other financial assets – financial assets measured at AC” with regard to securities.
16
Table 3: reconciliation between financial assets accounting categories at 31.12.2017 (IAS 39 values) and financial assets accounting categories at 01.01.2018 (IFRS 9 “compliant” IAS
values) with reclassified amounts and C&M and ECL impacts
FINANCIAL ASSETS
AT 31.12.2017
- IAS 39 Values
FINANCIAL ASSETS AT 1.1.2018 - IFRS 9 "compliant" values IFRS 9 FTA IMPACT ON CONSOLIDATED
SHAREHOLDERS’ EQUITY AS AT 1.1.2018
(A) (B) (C=B-A)
20. Fin. assets
measured at FV
through PL: a)
trading
20. Fin. Assets
measured at FV
through PL: b)
designated at
FV
20. Fin. assets
measured at FV
through PL: c)
mandatorily
measured at FV
30. Fin. assets
measured at FV
through OCI
40. Fin. assets
measured at
AC: a) loans
and advances
to banks
40. Fin. assets
measured at
AC: b) loans
and advances
to customers
FTA Impact on
shareholders’
equity
- o/w: FTA IFRS 9
on "Valuation
Reserves"
- o/w: FTA IFRS 9
on "Reserves"
20. Financial assets HFT 4,911,824 4,894,434 15,991 -1,399 -1,399
- reclassified IAS 39 values -4,911,824 4,894,434 17,390
- Imp. Measurement 210 210 210
- ECL impact -1,609 -1,609 -1,609
30. Fin. assets measured at FV 28,952 20,960 7,992 0 275 -275
- reclassified IAS 39 values -28,952 20,960 7,992
- Imp. Measurement 0 0 259 -259
- ECL impact 0 0 16 -16
40. Financial assets AFS 17,128,622 832,072 14,290,446
2,023,402 17,298 -110,404 127,702
- reclassified IAS 39 values -17,128,622 832,072 14,290,446 2,006,104
- Imp. Measurement 0 17,504 17,504 -117,361 134,865
- ECL impact -206 -206 6,957 -7,163
50. Financial assets HTM 11,560,769 2,451,635 9,159,087 49,953 51,764 -1,811
- reclassified IAS 39 values -11,560,769 2,400,035 9,160,734
- Imp. Measurement 51,600
51,600 51,600
- ECL impact 0 -1,647 -1,647 164 -1,811
60. Loans and advances to
banks 5,164,715 5,162,667 -2,048 -2,048
- reclassified IAS 39 values -5,164,715 5,164,715
- ECL impact -2,048
-2,048 -2,048
70. Loans and advances to
customers 108,176,382 461,234 106,368,297 -1,346,851 -1,346,851
- reclassified IAS 39 values -108,176,382 476,595 107,699,787
- Imp. Measurement -15,361 -15,361 -15,361
- ECL impact -1,331,490 -1,331,490
-1,331,490
Total financial assets 146,971,264 4,894,434 0 1,314,266 16,750,073 5,162,667 117,566,777 -1,283,047 -58,365 -1,224,682
- reclassified IAS 39 values -
securities -34,289,362 4,894,434 983,051 16,698,473 225,492 11,487,912
- reclassified IAS values – loans
and advances -112,681,902 346,576 4,939,223 107,396,103
- Imp. measurement -15,361 51,600 17,714 53,953 -65,502 119,455
- ECL impact -2,048 -1,334,952 -1,337,000 7,137 -1,344,137

17
Table 4: reconciliation between financial assets accounting categories at 31.12.2017 (IAS 39 values) and financial assets accounting categories at 01.01.2018 (IFRS 9 “compliant” IAS
values) by type of financial instrument
FINANCIAL ASSETS
AT 31.12.2017
- IAS 39 Values
FINANCIAL ASSETS AT 1.1.2018 - IFRS 9 "compliant" values IFRS 9 FTA IMPACT ON CONSOLIDATED
SHAREHOLDERS’ EQUITY AS AT 1.1.2018
(A) (B) (C=B-A)
20. Fin. assets
measured at FV
through PL: a)
trading
20. Fin. Assets
measured at FV
through PL: b)
designated at
FV
20. Fin. assets
measured at FV
through PL: c)
mandatorily
measured at FV
30. Fin. assets
measured at FV
through OCI
40. Fin. assets
measured at
AC: a) loans
and advances
to banks
40. Fin. assets
measured at
AC: b) loans
and advances
to customers
FTA Impact on
shareholders’
equity
- o/w: FTA IFRS 9
on "Valuation
Reserves"
- o/w: FTA IFRS 9
on "Reserves"
20. Financial assets HFT 4,911,824 4,894,434 15,991 -1,399 -1,399
- debt securities 2,283,911 2,266,521 15,991 -1,399 -1,399
- equity securities 693,004 693,004
- UCITS units 29,661 29,661
- derivatives 1,905,248 1,905,248
30. Financial assets
measured at FV 28,952 20,960 7,992 0 275 -275
- debt securities 9,412 1,420 7,992 0 275 -275
- equity securities 579 579
- UCITS units 18,961 18,961
40. Financial assets AFS 17,128,622 832,072 14,290,446 2,023,402 17,298 -110,404 127,702
- debt securities 15,716,663 179,445 13,531,114 2,023,402 17,298 17,638 -340
- equity securities 993,472 234,140 759,332 -112,391 112,391
- UCITS units 418,487 418,487 -15,651 15,651
50. Financial assets HTM 11,560,769 2,451,635 9,159,087 49,953 51,764 -1,811
- debt securities 11,560,769 2,451,635 9,159,087 49,953 51,764 -1,811
60. Loans and advances
to banks 5,164,715 5,162,667 -2,048 -2,048
- loans and advances 4,939,223 4,937,446 -1,777 -1,777
- debt securities 225,492 225,221 -271 -271
70. Loans and advances
to customers 108,176,382 461,234 106,368,297 -1,346,851 -1,346,851
- loans and advances 107,742,679 343,452 106,074,355 -1,324,872 -1,324,872
- debt securities 433,703 117,782 293,942 -21,979 -21,979
Total financial assets 146,971,264 4,894,434 1,314,266 16,750,073 5,162,667 117,566,777 -1,283,047 -58,365 -1,224,682

18
Based on what shown in the above tables, the measurement criteria of the new IFRS9 accounting categories under which the instruments outstanding on the transition date have been classified are basically in line with those of the retired IAS 39 categories, except for limited cases attributable to changes in the business model, to the inherent characteristics of the financial instruments, and to the adoption of accounting options permitted by the standard. To this regard, it should be pointed out that the portfolio represented by UCITS units has been fully assigned to “Financial assets measure at fair value through profit or loss – c) financial assets mandatorily measured at fair value, since the associated cash flows do not represent solely payments of principal and interest. For these instruments, also further to the clarifications provided by IFRIC (IFRS Interpretation Committee) in May 2017, the possibility of resorting to the category of financial assets designated at fair value through OCI for these instruments has been ruled out, since as a rule, these UCITS units are not comparable to equity securities, as they feature a contractual obligation to deliver certain financial assets or a net asset in case of liquidation or redemption application by the investor. In more detail, on first-time adoption, the classification of the financial assets portfolio, based on the business model as at 1 January 2018, has been carried out in accordance with the following guidelines:
- the IAS 39 portfolio of “Financial assets held for trading” (4,911.8 million) has been almost fully classified in the IFRS 9 accounting category of “Financial assets measured at fair value through profit or loss – a) financial assets held for trading” (4,894.4 million), except for one debt security issued by a corporate counterparty that has been classified in the category of “Financial assets measured at amortized cost”, in keeping with the business model change that took place after the purchase of the security. On FTA, the measurement at amortized cost (equal to 16.0 million) compared to its fair value (17.4 million) generated an equity charge of 1.4 million, as a result of the combined effect of the reversal of valuation capital losses (+ 0.2 million) and the recognition of expected losses (-1.6 million);
- the IAS 39 portfolio of “Financial assets measured at fair value” (29.0 million) has been mostly reassigned to the IFRS 9 accounting category of “Financial assets measured at fair value through profit or loss – c) financial assets mandatorily measured at fair value” (21.0 million), whereby only residual items were classified in the category of “Financial assets measured at fair value through other comprehensive income - OCI” (8.0 million). The reclassification as financial assets mandatorily measured at fair value, mainly related to the UCITS units, was due to the failure of the SPPI test. On FTA, the classification did not cause any impact on total shareholders’ equity, since fair value represents the criterion to measure the financial assets under examination both under IAS 39 and under IFRS 9. On 1 January 2018, there were no financial instruments for which the Group had elected the designation at fair value through profit or loss;
- the IAS portfolio of debt securities included in the category of “Financial assets available for sale” (15,716.7 million) has been mostly classified in the IFRS 9 accounting category of “Financial assets measured at fair value through OCI” (13,531.1 million), except for certain government bonds (2,006.1 million) that have been classified in the IFRS 9 category of “Financial assets measured at amortized cost”, owing to the management method of these assets at the transition date. This choice generated a positive equity impact of roughly 17.5 million, equal to the difference between the recognition book value at 31 December 2017 representing the fair value (2,006.1 million) and the value resulting from the amortized cost method (2,023.6 million), net of expected losses (-0.2 million). Moreover, there are certain debt securities, little in number and value (179.4 million), that had to be classified under the IFRS 9 category of “Financial assets measured at fair value through profit or loss – c) financial assets mandatorily measured at fair value”, due to the failed SPPI test;
- the IAS 39 portfolio of equity instruments included in the category of “Financial assets available for sale” (993.5 million) has been prevailingly classified (759.3 million) among “Financial assets designated at fair value through other comprehensive income - OCI”, based on the option permitted by the standard for instruments that are not held for trading purposes. The residual amount (234.1 million) was classified in the IFRS 9 category of “Financial assets measured at fair value through profit and loss – c) financial assets mandatorily measured at fair value”. This classification did not generate any impact on total shareholders’ equity, considering that the assets were and are still measured at fair value;
- the IAS portfolio of “Financial assets held to maturity” (11,560.8 million) has been almost fully reassigned to the IFRS 9 accounting category of “Financial assets measured at amortized cost” (9,160.7 million), except for certain government bonds (2,400.0 million) that were reassigned to the IFRS 9 portfolio of “Financial assets measured at fair value through OCI” consistently with the purpose for which they are held. On FTA for the latter securities a positive stated net equity impact was determined (51.6 million) equal to the difference between their carrying amount at 31 December 2017 represented by the amortized cost (2,400.0 million) and their fair value measured on 1 January 2018 (2,451.6 million). Expected losses were then calculated for the securities under the amortized cost category, giving rise to a negative impact on net equity on FTA of 1.6 million;
- positions classified in the IAS portfolio of “Due from banks”, amounting to 5,164.7 million, have been entirely classified in the IFRS 9 category of “Financial assets measured at amortized cost: a) loans and advance to banks”, consistently with the purpose for which they are held. On FTA the measurement of expected losses gave rise to an increase in loan loss provision of 2.0 million;
- of the positions classified in the IAS portfolio of “Loans to customers”, amounting to 108,176.4 million, 107.699,8 million were classified in the IFRS 9 category of “Financial assets measured at amortized cost: b) loans and advances to customers”; the measurement of expected losses based on the new impairment model gave rise to a negative impact on net equity of 1,331.5 million, of which 1,245.8 million tied to bad loans (stage 3). An exception to this rule is represented by exposures, amounting to 476.6 million (346.6 million represented by loans and advances, and 130,0 million by debt securities), which failed the SPPI test, and had to be reassigned to the portfolio of “Financial assets measured at fair value through profit or loss – c) financial assets mandatorily measured at fair value”. For the latter positions, the negative net equity impact due to the different measurement criterion came in at 15,3 million (3,1 million for loans and advances and 12.2 million for debt securities).

19
Given that the impact from the FTA classification and measurement of financial assets, not associated with the new impairment measurement method, is not meaningful, please note that the increase in securities measured at fair value through profit or loss, specifically related to equity securities and UCITS units that were previously classified in the portfolio of “Financial assets available for sale”, will cause, ceteris paribus, a higher volatility of the operating results as of 1 January 2018. With regard to financial liabilities, Gruppo Banco BPM elected to early adopt the changes in the accounting treatment of own credit rating changes when measuring financial liabilities designated at fair value, right from the 2017 annual report. No FTA impact is attributable to the different presentation of the effects tied to the different own credit rating recognition method. Considering that IFRS 9 practically reflects the classification and measurement criteria of IAS 39, the transition to the new standard caused no impact on net equity, except for two bonds classified in the IAS 39 portfolio “Financial liabilities measured at fair value” where, in accordance with the standard’s transitional provisions, it was necessary to reclassify them under “Financial liabilities measured at amortized cost”, since it was impossible to justify the prior measurement with the need to eliminate an accounting mismatch existing at the date of transition to the new accounting standard16. the financial liability was recognized at amortized cost, amounting to 176 million, as compared to the prior recognition (at fair value) amounting to 160.4 million. The resulting recognition under liabilities of a higher value caused a negative net equity impact of 15.2 million. Finally, the 3.6 million decline in the aggregate represented by “Financial liabilities held for trading and hedging derivatives”, was due to the reversal of the embedded derivative of certain finance contracts, taking into account the new IFRS 9 rules governing the separation of derivatives from financial assets and the fact that these assets have been reclassified under the line-item “Financial assets measured at fair value through profit or loss – c) financial assets mandatorily measured at fair value” due to the failed SPPI test.
3. PPA (Purchase Price Allocation) effects for the business combination with former Gruppo Banca Popolare di Milano
and the former Groups Banca Popolare Italiana and Banca Italease
In compliance with IFRS3, the income statement of Gruppo Banco BPM includes the P&L effects from the allocation of the prices paid for the combination with Gruppo Banca Popolare di Milano finalized in financial year 2017 and for the acquisition of the Groups Banca Popolare Italiana and Banca Italease finalized in FY 2007 and 2009, respetively.
The overall effect on the consolidated net income in Q1 2018, as a result of the reversal of the value adjustment of net assets acquired came in at plus € 30.6 million(mainly related to the former group Banca Popolare di Milano)
4. Charges generated by the contribution to resolution mechanisms
In April 2018, the Bank of Italy communicated to the banks of the Group the contribution amount to be paid to the Single Resolution Fund for FY 2018, totaling € 68.0 million (€ 62.4 million being the ordinary contribution for FY 2017). The contribution has been fully charged to income in Q1 under the line-item “other administrative expenses”. The contribution has been fully charged to income in Q1 under the line-item “other administrative expenses”. Please note that in 2018, as in the prior year, the Group did not exercise the option of paying up to 15% of the total contributions due with irrevocable payment commitments (IPC). 5. Changes in consolidation scope
In Q1 2018 the only change in consolidation scope was the exit of the subsidiary Pami Finance S.r.l. (in liquidation) following the cancellation from the Company Register. The reorganization of the Bancassuance business, following the non-renewal of the distribution agreements with Gruppo Unipol for the life-insurance business and with Gruppo Aviva for the P&C insurance business, and the subsequent agreement signed with Cattolica Assicurazioni, did not entail any change in the consolidation scope as at 31 March 2018 for the shareholdings held in Popolare Vita (now Vera Vita S.p.A.) and Avipop Assicurazioni (now Vera Assicurazioni S.p.A.), over which at 31 March 2018 the Group is still exercising a significant influence. The only change regarded the stake held in the two associates, which in both cases went from 50% to 35%. 6. Non-recurring items in the combined income statement of l Gruppo Banco BPM
In compliance with Consob Communication no. DEM/6064293 of 28 July 2006, the effects of the main non-recurring items are illustrated in the operating report, as summarized below:
First quarter 2018:
• the line-item “other administrative expenses” includes € 2.8 million of integration charges; • the line-item “Gains on disposal of equity and other investments” is equal to € 179,7 million. The main component
(equal to € 176,0 million) is represented by the result from the reorganization of the Bancassurance business with the sale to Cattolica of the two stakes in the insurance companies Popolare Vita (now Vera Vita) and Avipop Assicurazioni (now Vera Assicurazioni);
• the line-item “income tax on continuing operations” includes the overall positive effect of the non-recurring items itemized above, totaling € 7.8 million.
16
The derivative contract hedging the risks associated with the above-mentioned liabilities that had justified the original designation to fair
value had been subsequently terminated.

20
Overall, non-recurring items in the first quarter made a positive contribution of € 184,6 million. First quarter 2017: • the line-item “net interest income” included interest income from the TLTRO II laon pertaining to FY 2016 amounting to €
31.7 million, gross of tax effect; • the line-item “other administrative expenses” included the contingent asset of € 27.2 million, gross of tax effect, related to
the reversal of the 2015 fee paid to obtain the guarantee to turn certain DTAs into tax credits. This amount had been charged to income in FY 2016 and had been declared no longer due based on the regulatory provisions introduced with law no. 15 of 17 February 2017; the item also included integration charges of € 12 million
• the line-item “net write-downs of other assets” mainly included the impairment of € -8.8 million, gross of tax effect, of the investment in the Atlante Fund, classified under financial assets available for sale;
• the line-item “Gains on disposal of equity and other investments” included non-recurring net proceeds of € 17.1 million, gross of tax effect.
Overall, net of tax effect (equal to - €12.5millioni) non-recurring items in the first quarter of FY 2017 made a positive contribution of € 42.7 million. 7. Capital requirements regulation
On 1 January 2014, the new harmonized prudential rules for banks and investment firms contained in the Capital Requirements Regulation (EU) no. 575/2013 (“CRR”) and in the Capital Requirements Directive 2013/36/EU (CRD IV”) of 26 June 2013 have come into effect, transposing the banking supervisory standards defined by the Basel Committee (Basel 3 framework) in the European Union. The Regulation and its technical rules are directly applicable in national legislations and represent the so called “Single Rulebook”. The minimum capital requirements for 2018 are:
• minimum Common Equity Tier 1 ratio (“CET1 ratio”): 4.5% + 2.5% of Capital Conservation Buffer (“CCB”); • minimum Tier 1 ratio: 6.0% + 2.5% of CCB; • minimum total capital ratio: 8% + 2.5% of CCB.
Please note that on 4 October 2016, the Bank of Italy, with Update no. 18 of Circular no. 285, brought the CCB down to 1.875% for 2018. With communication of 23 September 2017, the Bank of Italy confirmed the Countercyclical Capital Buffer ratio at zero per cent. With communication of 30 November 2017, the Bank of Italy identified the banking group Banco BPM as an Other Systemically Important Institution (O-SII). The 2018 O-SII reserve is equal to zero, while Banco BPM is required to gradually build up a reserve equal to 0.25% with linear increments beginning on 1 January 2019 up until 1 January 2022. On 27 December 2017, the European Central Bank (ECB) notified Banco BPM its final decision on the minimum capital ratios that Banco BPM is required to comply with on an ongoing basis. The decision is based on the supervisory review and evaluation (SREP) conducted in accordance with art. 4(1)(f) of EU Regulation no. 1024/2013. Hence, in compliance with art. 16(2)(a) of the same Regulation no. 1024/2013, which gives the ECB the power to require that supervised bank hold an amount of own funds greater than the minimum capital requirements provided for under the current regulations, a 2.50% requirement was added to the above requirements. Taking into account the SREB CCB requirements, at consolidated level Gruppo Banco BPM must comply with the following capital ratios:
• CET1 ratio: 8.875%; • Tier 1 ratio: 10.375%; • Total Capital ratio: 12.375%.
By the deadline of 1 February 2018, Banco BPM informed the European Central Bank that it elected to fully apply the transitional provision under the new article 473 bis of EU Regulation no. 575/2013, which phases in the impact on own funds generated by the adoption of the new impairment model introduced by IFRS9. Under the transitional provision, it is possible to include a transitional positive component to the Tier 1 capital by a percentage of the increase in expected loan loss provisions further to the adoption of IFRS 9. The percentage decreases over time over a 5-year period, as described below:
• period between 1 January and 31 December 2018: 95% of the increase in expected loan loss provision further to the adoption of IFRS 9. The negative impact expected to be caused on own funds by the adoption of the new impairment model is thus reduced to 5% of the impact recognized at stated net equity level on 1 January 2018;
• period between 1 January 2019 and 31 December 2019: 85% of the increase in expected loan loss provisions; • period between 1 January 2020 and 31 December 2020: 70% of the increase in expected loan loss provisions; • period between 1 January 2021 and 31 December 2021: 50% of the increase in expected loan loss provisions; • period between 1 January 2022 and 31 December 2022: 25% of the increase in expected loan loss provisions.
Beginning on 1 January 2023 the impact from the first-time adoption of IFRS 9 will be fully recognized in the calculation of own funds.

21
In addition to the possibility of phasing in the impact from the first-time adoption of the accounting standard on 1 January 2018, the transitional provision gives the possibility to phase in any impacts that the implementation of the new impairment model may cause also in the following few years after the first-time adoption of the new accounting standard, albeit limited to impacts from the measurement of performing financial assets. The estimates of the Group’s capital ratios, all other things being equal, had it not elected to exercise the above option, are defined in brief “IFRS9 fully-phased”. The capital ratios called “IFRS9 phase-in” instead are calculated based on the above-mentioned transitional rules. 8. Other explanatory notes
The reclassified balance sheet and income statement reflect on a consolidated basis the financial accounts of Banco BPM and its subsidiaries with respect to 31 March 2018, or, when not available, to the most recently approved financial reports. Similarly, the equity method-based treatment of associates was carried out based on the accounting information submitted to Banco BPM as at 31 March 2018, or, if not available, on the most recent financial reports prepared by the associates.
Attachments
- Reclassified consolidated balance sheet as at 31 March 2018 compared with data at 31 December 2017 as well as with IFRS 9 data as at 01 January 2018
- Reclassified consolidated balance sheet – Reconciliation with IFRS 9 data as at 01 January 2018
- Reclassified consolidated income statement for Q1 2018 compared with Q1 2017data
- Reclassified consolidated income statement – 2018 and 2017 quarterly evolution
Contacts: Investor Relations
Roberto Peronaglio +39 02.77.00.2057 [email protected]
Communications
Matteo Cidda +39 02.77.00.7438 [email protected]
Press Office
Monica Provini +39 02.77.00.3515 [email protected]

22
BANCO BPM GROUP
Reclassified consolidated balance sheet (*)
(euro thousand) 31/03/2018 01/01/2018 31/12/2017
Changes
vs.
01/01/2018
Changes %
vs
01/01/2018
Cash and cash equivalents 829,760 976,686 976,686 -146,926 -15.0%
Financial assets at amortised cost 111,838,513 111,011,801 112,681,902 826,712 0.7%
- Due from banks 5,670,265 4,937,446 4,939,223 732,819 14.8%
- Customer loans 106,168,248 106,074,355 107,742,679 93,893 0.1%
Financial assets and hedging derivatives 36,280,323 34,920,226 34,533,172 1,360,097 3.9%
- Financial assets designated at FV through P&L 6,251,206 6,452,510 5,184,586 -201,304 -3.1%
- Financial assets designated at FV through OCI 16,711,989 16,750,073 17,128,622 -38,084 -0.2%
- Financial assets at amortised cost 13,317,128 11,717,643 12,219,964 1,599,485 13.7%
Equity investments 1,369,107 1,261,840 1,349,191 107,267 8.5%
Property and equipment 2,755,583 2,735,182 2,735,182 20,401 0.7%
Intangible assets 1,303,925 1,297,160 1,297,160 6,765 0.5%
Tax assets 4,852,396 4,886,588 4,520,189 -34,192 -0.7%
Non-current assets held for sale and discontinued operations 4,678 106,121 106,121 -101,443 -95.6%
Other assets 3,018,459 3,007,162 3,007,162 11,297 0.4%
Total ASSETS 162,252,744 160,202,766 161,206,765 2,049,978 1.3%
Due to banks 29,555,476 27,199,304 27,199,304 2,356,172 8.7%
Direct funding 107,056,042 107,525,103 107,509,849 -469,061 -0.4%
- Due to customers (*) 88,683,413 87,848,146 87,848,146 835,267 1.0%
- Debt securities issued and fin. liabilities designated at FV 18,372,629 19,676,957 19,661,703 -1,304,328 -6.6%
Other financial liabilities designated at FV 8,414,115 8,704,348 8,707,966 -290,233 -3.3%
Liability provisions 1,562,694 1,580,444 1,580,461 -17,750 -1.1%
Tax liabilities 663,282 691,737 669,494 -28,455 -4.1%
Liabilities associated with assets held for sale 53 35 35 18 51.4%
Other liabilities 3,871,914 3,576,116 3,576,116 295,798 8.3%
Total LIABILITIES 151,123,576 149,277,087 149,243,225 1,846,489 1.2%
Minority interests 54,857 57,567 63,310 -2,710 -4.7%
Shareholders' equity 11,074,311 10,868,112 11,900,230 206,199 1.9%
CONSOLIDATED SHAREHOLDERS 'EQUITY 11,129,168 10,925,679 11,963,540 203,489 1.9%
(*) "Deposits from customers" include also Custodian Bank, which is going to be disposed.

23
BANCO BPM GROUP
Reclassified consolidated balance sheet Reconciliation statement between balances at 31.12.2017 (IAS 39) and balances at 01.01.2018 (IFRS 9)
(euro thousand) 31/12/2017 Classification
(a)
Measurement
impacts
(b)
ECL
impacts
(c)
01/01/2018
IFRS 9
impacts
(b+c)
Cash and cash equivalents 976,686 - - - 976,686 -
Financial assets at amortised cost 112,681,902 -346,576 - -1,323,525 111,011,801 -1,323,525
- Due from banks 4,939,223 - - -1,777 4,937,446 -1,777
- Customer loans 107,742,679 -346,576 - -1,321,748 106,074,355 -1,321,748
Financial assets and hedging derivatives 34,533,172 346,576 53,953 -13,475 34,920,226 40,478
- Financial assets designated at FV through P&L
5,184,586 1,283,285 -15,361 - 6,452,510 -15,361
- Financial assets designated at FV through OCI
17,128,622 -430,149 51,600 - 16,750,073 51,600
- Financial assets at amortised cost 12,219,964 -506,560 17,714 -13,475 11,717,643 4,239
Equity investments (*) 1,349,191 - -87,351 - 1,261,840 -87,351
Property and equipment 2,735,182 - - - 2,735,182 -
Intangible assets 1,297,160 - - - 1,297,160 -
Tax assets 4,520,189 - - 366,399 4,886,588 366,399
Non-current assets held for sale and discontinued operations
106,121 - - - 106,121 -
Other assets 3,007,162 - - - 3,007,162 -
Total ASSETS 161,206,765 - -33,398 -970,601 160,202,766 -1,003,999
Due to banks 27,199,304 - - - 27,199,304 -
Direct funding 107,509,849 - 15,254 - 107,525,103 15,254
- Due to customers 87,848,146 - - - 87,848,146 -
- Debt securities issued and fin. liabilities designated at FV
19,661,703 - 15,254 - 19,676,957 15,254
Other financial liabilities designated at FV 8,707,966 - -3,618 - 8,704,348 -3,618
Liability provisions 1,580,461 - - -17 1,580,444 -17
Tax liabilities 669,494 - 21,092 1,151 691,737 22,243
Liabilities associated with assets held for sale 35 - - - 35 -
Other liabilities 3,576,116 - - - 3,576,116 -
Total LIABILITIES 149,243,225 - 32,728 1,134 149,277,087 33,862
Minority interests 63,310 - - -5,743 57,567 -5,743
Shareholders' equity 11,900,230 - -66,126 -965,992 10,868,112 -1,032,118
CONSOLIDATED SHAREHOLDERS 'EQUITY 11,963,540 - -66,126 -971,735 10,925,679 -1,037,861
a) Reclassification of the IAS 39 balances according the new items of the financial assets and liabilities
b) IFRS 9 FTA impacts from the new measurement criteria of the financial assets and liabilities (excluding ECL)
c) IFRS 9 FTA impacts from the new Expected Credit Loss (ECL) model (*) Estimated impact on Equity investments following the new calculation of the net equity of the investments according to the IFRS 9 rules

24
BANCO BPM GROUP
Reclassified consolidated income statement
(in euro thousand) Q1 2018 Q1 2017 Changes Changes
%
Net interest income 595,111 548,607 46,504 8.5%
Income (loss) from investments in associates carried at equity 42,585 41,585 1,000 2.4%
Net interest, dividend and similar income 637,696 590,192 47,504 8.0%
Net fee and commission income 476,520 515,774 -39,254 -7.6%
Other net operating income 24,150 30,316 -6,166 -20.3%
Net financial result 29,308 36,857 -7,549 -20.5%
Other operating income 529,978 582,947 -52,969 -9.1%
Total income 1,167,674 1,173,139 -5,465 -0.5%
Personnel expenses -442,089 -456,719 14,630 -3.2%
Other administrative expenses -279,485 -260,699 -18,786 7.2%
Amortization and depreciation -47,926 -52,883 4,957 -9.4%
Operating costs -769,500 -770,301 801 -0.1%
Profit (loss) from operations 398,174 402,838 -4,664 -1.2%
Net adjustments on loans to customers -326,239 -292,490 -33,749 11.5%
Net adjustments on securities and other financial assets 2,228 -8,357 10,585
Net provisions for risks and charges -24,964 504 -25,468
Profit (loss) on the disposal of equity and other investments 179,654 17,066 162,588 N.S.
Income (loss) before tax from continuing operations 228,853 119,561 109,292 91.4%
Tax on income from continuing operations -6,976 -27,500 20,524 -74.6%
Income (loss) after tax from discontinued operations -14 20,003 -20,017
Income (loss) attributable to minority interests 1,430 3,138 -1,708 -54.4%
Net income (loss) for the period excluding Badwill 223,293 115,202 108,091 93.8%
Badwill - 3,076,137 -3,076,137
Net income (loss) for the period 223,293 3,191,339 -2,968,046 -93.0%

25
BANCO BPM GROUP
Reclassified consolidated income statement
(in euro thousand) Q1 2018 Recl.
Q1 2018
without
reclassification
Q1 2017 Q2 2017 Q3 2017 Q4 2017
Net interest income 595,111 -65,750 529,361 548,607 511,149 524,923 528,768
Income (loss) from investments in associates carried at equity
42,585
42,585 41,585 40,354 38,931 45,166
Net interest, dividend and similar income 637,696 -65,750 571,946 590,192 551,503 563,854 573,934
Net fee and commission income 476,520
476,520 515,774 503,605 458,935 472,096
Other net operating income 24,150
24,150 30,316 14,362 29,401 24,738
Net financial result 29,308
29,308 36,857 63,320 12,957 41,915
Other operating income 529,978
529,978 582,947 581,287 501,293 538,749
Total income 1,167,67
4 -65,750 1,101,924 1,173,139 1,132,790 1,065,147 1,112,683
Personnel expenses -442,089
-442,089 -456,719 -456,711 -450,628 -420,796
Other administrative expenses -279,485
-279,485 -260,699 -233,055 -273,178 -212,334
Amortization and depreciation -47,926
-47,926 -52,883 -56,406 -62,160 -95,466
Operating costs -769,500
-769,500 -770,301 -746,172 -785,966 -728,596
Profit (loss) from operations 398,174 -65,750 332,424 402,838 386,618 279,181 384,087
Net adjustments on loans to customers -326,239 65,750 -260,489 -292,490 -354,530 -340,816 -673,127
Net adjustments on securities and other financial assets
2,228
2,228 -8,357 -70,820 -48,322 -12,718
Net provisions for risks and charges -24,964
-24,964 504 -9,641 4,615 -9,235
Profit (loss) on the disposal of equity and other investments
179,654
179,654 17,066 -3,765 333 12,064
Income (loss) before tax from continuing
operations 228,853
228,853 119,561 -52,138 -105,009 -298,929
Tax on income from continuing operations -6,976
-6,976 -27,500 1,122 45,612 103,202
Income (loss) after tax from discontinued operations
-14
-14 20,003 25,790 16,498 699,971
Income (loss) attributable to minority interests
1,430
1,430 3,138 4,256 1,397 867
Net income (loss) for the period excluding
Badwill 223,293 - 223,293 115,202 -20,970 -41,502 505,111
Impairment of goodwill and client
relationship net of tax -1,017,616
Badwill
3,076,137
Net income (loss) for the period 223,293
223,293 3,191,339 -20,970 -41,502 -512,505
![[BPM Congress GP 2012] BANCO CENTRAL-PMI Implantando uma Visão Integrada de Gestão](https://static.fdocuments.net/doc/165x107/58f0052f1a28ab4e548b4597/bpm-congress-gp-2012-banco-central-pmi-implantando-uma-visao-integrada-de.jpg)