2017/18 ANNUAL REPORTpmg-assets.s3-website-eu-west-1.amazonaws.com/1/NHLS_AR...ANNUAL REPORT...
288
2017/18 National Health Laboratory Service ANNUAL REPORT 2017/18
Transcript of 2017/18 ANNUAL REPORTpmg-assets.s3-website-eu-west-1.amazonaws.com/1/NHLS_AR...ANNUAL REPORT...

2017
/18National Health Laboratory Service
ANNUAL REPORT
2017/18

National Health Laboratory Service Annual Report 2017/18

Part A: General Information.....................................................................................................................
General Information ....................................................................................................................................................................................
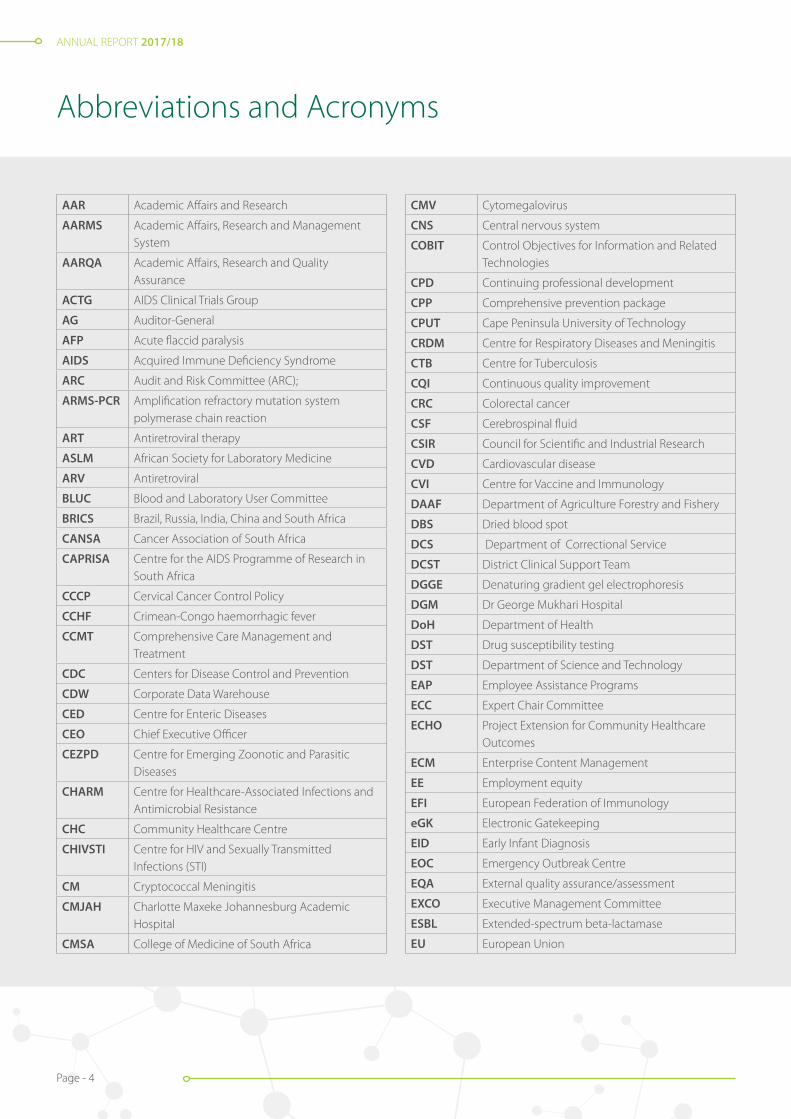
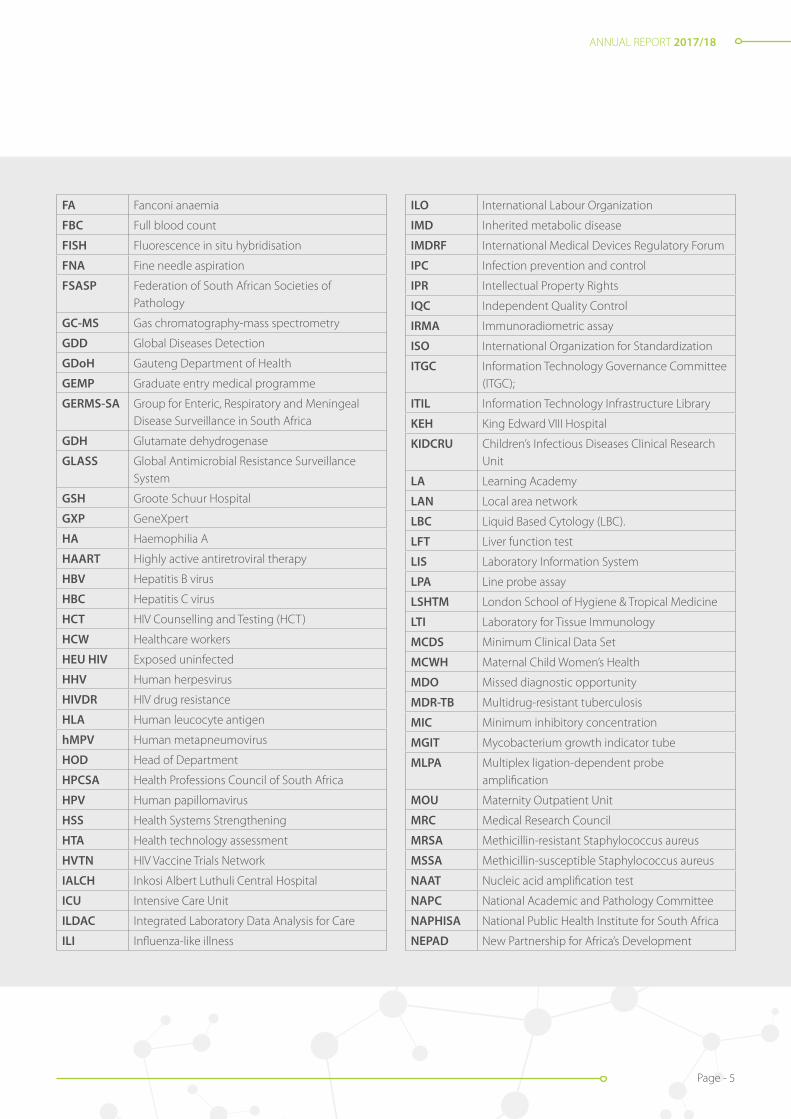
Abbreviations and Acronyms.................................................................................................................................................................
Foreword by the Chairperson................................................................................................................................................................
Acting Chief Executive Officer’s Overview.....................................................................................................................................
Board Members...............................................................................................................................................................................................
Statement of Responsibility and Confirmation of Accuracy for the Annual Report............................................
Strategic Overview........................................................................................................................................................................................
Legislative and Other Mandates...........................................................................................................................................................
Organisational Structure............................................................................................................................................................................
Part B: Performance Information.............................................................................................................
Auditor’s Report: Predetermined Objectives.................................................................................................................................
Situational Analysis ......................................................................................................................................................................................
Performance Information by Programme......................................................................................................................................
Business Unit Performance......................................................................................................................................................................
Performance Information by Regions...............................................................................................................................................
Performance Information by Subsidiary..........................................................................................................................................
Performance Information by Institutes.............................................................................................................................................
Part C: Governance.....................................................................................................................................
Board Composition.......................................................................................................................................................................................
Committees of the Board..........................................................................................................................................................................
Portfolio Committee.....................................................................................................................................................................................
Company Secretary.......................................................................................................................................................................................
Remuneration of Board Members.......................................................................................................................................................
Risk Management..........................................................................................................................................................................................
Report of the Audit and Risk Committee .......................................................................................................................................
Part D: Human Resources..........................................................................................................................
Executive Summary.......................................................................................................................................................................................
Human Resources Oversight Statistics..............................................................................................................................................
Part E: Financial Information....................................................................................................................
Chief Financial Officer’s report ..............................................................................................................................................................
Summary of Group salient information ..........................................................................................................................................
3
4
8
11
14
17
18
20
22
24
25
28
42
90
145
146
152
157
167
167
168
168
172
175
176
181
183
CONTENTS

ANNUAL REPORT 2017/18
Page - 2
General Information
PART A

ANNUAL REPORT 2017/18
Page - 3
Registered name of the public entity National Health Laboratory Service (NHLS)
Legal form Schedule 3A public entity
Practice number PR5200296
Registered office address 1 Modderfontein RoadRietfonteinSandringhamJohannesburg, 2000
Postal address Private Bag X8Johannesburg2131
Contact telephone number 011 386 6000
Email address [email protected]
Website address http://www.nhls.ac.za
Company Secretary Adv. Mpho Mphelo
External auditors SizweNtsalubaGobodo Grant Thornton Inc
Bankers First National Bank Limited, Rand Merchant Bank Limited, Investec Limited and Nedbank Limited
General Information
ANNUAL REPORT 2017/18
Page - 4
AAR Academic Affairs and Research
AARMS Academic Affairs, Research and Management System
AARQA Academic Affairs, Research and Quality Assurance
ACTG AIDS Clinical Trials Group
AG Auditor-General
AFP Acute flaccid paralysis
AIDS Acquired Immune Deficiency Syndrome
ARC Audit and Risk Committee (ARC);
ARMS-PCR Amplification refractory mutation system polymerase chain reaction
ART Antiretroviral therapy
ASLM African Society for Laboratory Medicine
ARV Antiretroviral
BLUC Blood and Laboratory User Committee
BRICS Brazil, Russia, India, China and South Africa
CANSA Cancer Association of South Africa
CAPRISA Centre for the AIDS Programme of Research in South Africa
CCCP Cervical Cancer Control Policy
CCHF Crimean-Congo haemorrhagic fever
CCMT Comprehensive Care Management and Treatment
CDC Centers for Disease Control and Prevention
CDW Corporate Data Warehouse
CED Centre for Enteric Diseases
CEO Chief Executive Officer
CEZPD Centre for Emerging Zoonotic and Parasitic Diseases
CHARM Centre for Healthcare-Associated Infections and Antimicrobial Resistance
CHC Community Healthcare Centre
CHIVSTI Centre for HIV and Sexually Transmitted Infections (STI)
CM Cryptococcal Meningitis
CMJAH Charlotte Maxeke Johannesburg Academic Hospital
CMSA College of Medicine of South Africa
CMV Cytomegalovirus
CNS Central nervous system
COBIT Control Objectives for Information and Related Technologies
CPD Continuing professional development
CPP Comprehensive prevention package
CPUT Cape Peninsula University of Technology
CRDM Centre for Respiratory Diseases and Meningitis
CTB Centre for Tuberculosis
CQI Continuous quality improvement
CRC Colorectal cancer
CSF Cerebrospinal fluid
CSIR Council for Scientific and Industrial Research
CVD Cardiovascular disease
CVI Centre for Vaccine and Immunology
DAAF Department of Agriculture Forestry and Fishery
DBS Dried blood spot
DCS Department of Correctional Service
DCST District Clinical Support Team
DGGE Denaturing gradient gel electrophoresis
DGM Dr George Mukhari Hospital
DoH Department of Health
DST Drug susceptibility testing
DST Department of Science and Technology
EAP Employee Assistance Programs
ECC Expert Chair Committee
ECHO Project Extension for Community Healthcare Outcomes
ECM Enterprise Content Management
EE Employment equity
EFI European Federation of Immunology
eGK Electronic Gatekeeping
EID Early Infant Diagnosis
EOC Emergency Outbreak Centre
EQA External quality assurance/assessment
EXCO Executive Management Committee
ESBL Extended-spectrum beta-lactamase
EU European Union
Abbreviations and Acronyms
ANNUAL REPORT 2017/18
Page - 5
FA Fanconi anaemia
FBC Full blood count
FISH Fluorescence in situ hybridisation
FNA Fine needle aspiration
FSASP Federation of South African Societies of Pathology
GC-MS Gas chromatography-mass spectrometry
GDD Global Diseases Detection
GDoH Gauteng Department of Health
GEMP Graduate entry medical programme
GERMS-SA Group for Enteric, Respiratory and Meningeal Disease Surveillance in South Africa
GDH Glutamate dehydrogenase
GLASS Global Antimicrobial Resistance Surveillance System
GSH Groote Schuur Hospital
GXP GeneXpert
HA Haemophilia A
HAART Highly active antiretroviral therapy
HBV Hepatitis B virus
HBC Hepatitis C virus
HCT HIV Counselling and Testing (HCT)
HCW Healthcare workers
HEU HIV Exposed uninfected
HHV Human herpesvirus
HIVDR HIV drug resistance
HLA Human leucocyte antigen
hMPV Human metapneumovirus
HOD Head of Department
HPCSA Health Professions Council of South Africa
HPV Human papillomavirus
HSS Health Systems Strengthening
HTA Health technology assessment
HVTN HIV Vaccine Trials Network
IALCH Inkosi Albert Luthuli Central Hospital
ICU Intensive Care Unit
ILDAC Integrated Laboratory Data Analysis for Care
ILI Influenza-like illness
ILO International Labour Organization
IMD Inherited metabolic disease
IMDRF International Medical Devices Regulatory Forum
IPC Infection prevention and control
IPR Intellectual Property Rights
IQC Independent Quality Control
IRMA Immunoradiometric assay
ISO International Organization for Standardization
ITGC Information Technology Governance Committee (ITGC);
ITIL Information Technology Infrastructure Library
KEH King Edward VIII Hospital
KIDCRU Children’s Infectious Diseases Clinical Research Unit
LA Learning Academy
LAN Local area network
LBC Liquid Based Cytology (LBC).
LFT Liver function test
LIS Laboratory Information System
LPA Line probe assay
LSHTM London School of Hygiene & Tropical Medicine
LTI Laboratory for Tissue Immunology
MCDS Minimum Clinical Data Set
MCWH Maternal Child Women’s Health
MDO Missed diagnostic opportunity
MDR-TB Multidrug-resistant tuberculosis
MIC Minimum inhibitory concentration
MGIT Mycobacterium growth indicator tube
MLPA Multiplex ligation-dependent probe amplification
MOU Maternity Outpatient Unit
MRC Medical Research Council
MRSA Methicillin-resistant Staphylococcus aureus
MSSA Methicillin-susceptible Staphylococcus aureus
NAAT Nucleic acid amplification test
NAPC National Academic and Pathology Committee
NAPHISA National Public Health Institute for South Africa
NEPAD New Partnership for Africa’s Development
ANNUAL REPORT 2017/18
Page - 6
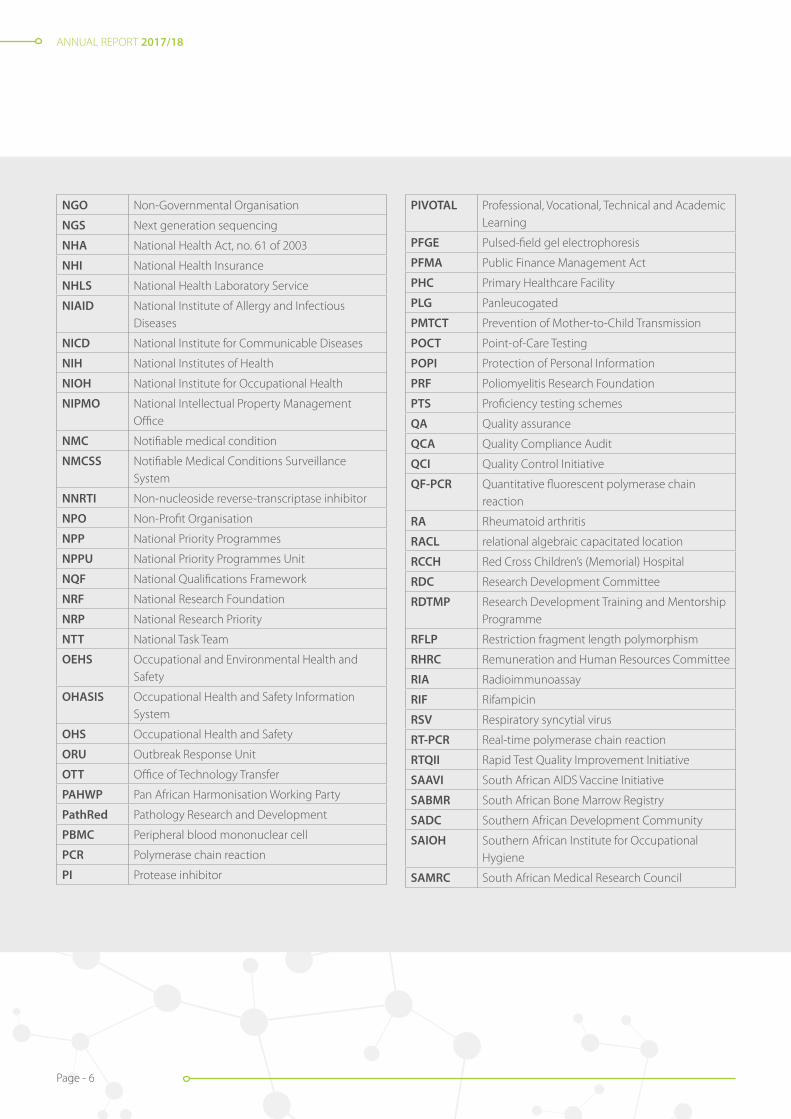
NGO Non-Governmental Organisation
NGS Next generation sequencing
NHA National Health Act, no. 61 of 2003
NHI National Health Insurance
NHLS National Health Laboratory Service
NIAID National Institute of Allergy and Infectious Diseases
NICD National Institute for Communicable Diseases
NIH National Institutes of Health
NIOH National Institute for Occupational Health
NIPMO National Intellectual Property Management Office
NMC Notifiable medical condition
NMCSS Notifiable Medical Conditions Surveillance System
NNRTI Non-nucleoside reverse-transcriptase inhibitor
NPO Non-Profit Organisation
NPP National Priority Programmes
NPPU National Priority Programmes Unit
NQF National Qualifications Framework
NRF National Research Foundation
NRP National Research Priority
NTT National Task Team
OEHS Occupational and Environmental Health and Safety
OHASIS Occupational Health and Safety Information System
OHS Occupational Health and Safety
ORU Outbreak Response Unit
OTT Office of Technology Transfer
PAHWP Pan African Harmonisation Working Party
PathRed Pathology Research and Development
PBMC Peripheral blood mononuclear cell
PCR Polymerase chain reaction
PI Protease inhibitor
PIVOTAL Professional, Vocational, Technical and Academic Learning
PFGE Pulsed-field gel electrophoresis
PFMA Public Finance Management Act
PHC Primary Healthcare Facility
PLG Panleucogated
PMTCT Prevention of Mother-to-Child Transmission
POCT Point-of-Care Testing
POPI Protection of Personal Information
PRF Poliomyelitis Research Foundation
PTS Proficiency testing schemes
QA Quality assurance
QCA Quality Compliance Audit
QCI Quality Control Initiative
QF-PCR Quantitative fluorescent polymerase chain reaction
RA Rheumatoid arthritis
RACL relational algebraic capacitated location
RCCH Red Cross Children’s (Memorial) Hospital
RDC Research Development Committee
RDTMP Research Development Training and Mentorship Programme
RFLP Restriction fragment length polymorphism
RHRC Remuneration and Human Resources Committee
RIA Radioimmunoassay
RIF Rifampicin
RSV Respiratory syncytial virus
RT-PCR Real-time polymerase chain reaction
RTQII Rapid Test Quality Improvement Initiative
SAAVI South African AIDS Vaccine Initiative
SABMR South African Bone Marrow Registry
SADC Southern African Development Community
SAIOH Southern African Institute for Occupational Hygiene
SAMRC South African Medical Research Council
ANNUAL REPORT 2017/18
Page - 7
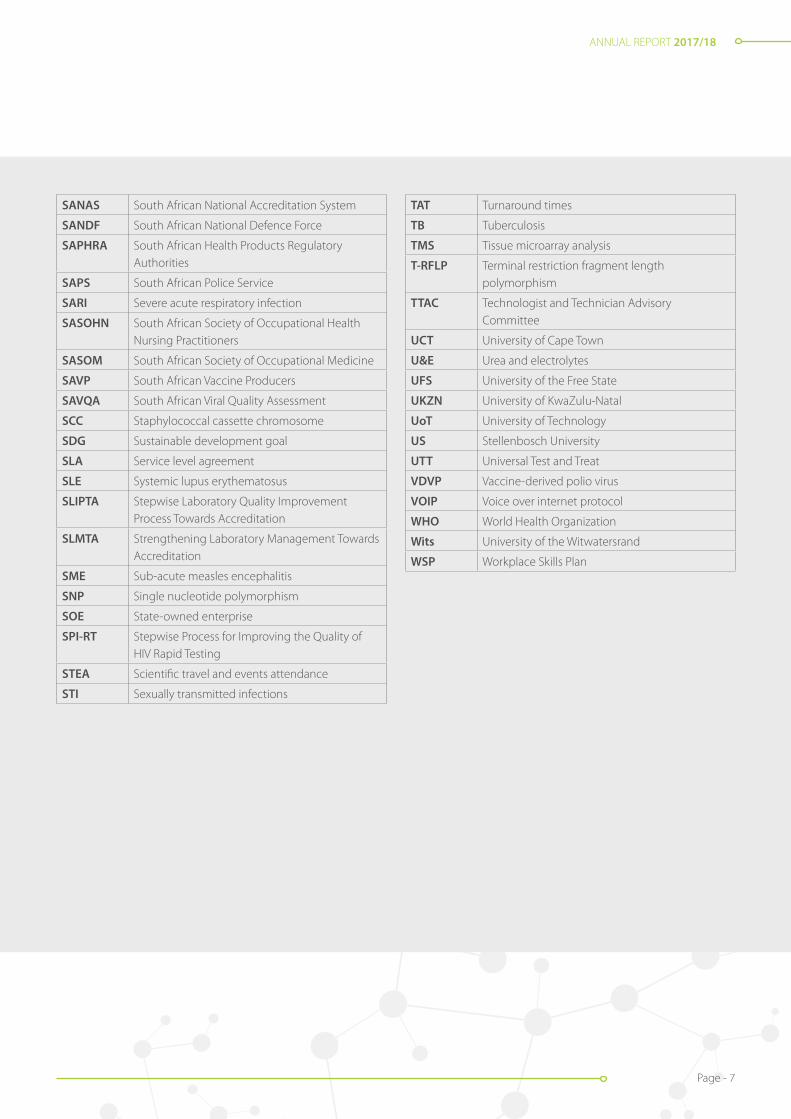
SANAS South African National Accreditation System
SANDF South African National Defence Force
SAPHRA South African Health Products Regulatory Authorities
SAPS South African Police Service
SARI Severe acute respiratory infection
SASOHN South African Society of Occupational Health Nursing Practitioners
SASOM South African Society of Occupational Medicine
SAVP South African Vaccine Producers
SAVQA South African Viral Quality Assessment
SCC Staphylococcal cassette chromosome
SDG Sustainable development goal
SLA Service level agreement
SLE Systemic lupus erythematosus
SLIPTA Stepwise Laboratory Quality Improvement Process Towards Accreditation
SLMTA Strengthening Laboratory Management Towards Accreditation
SME Sub-acute measles encephalitis
SNP Single nucleotide polymorphism
SOE State-owned enterprise
SPI-RT Stepwise Process for Improving the Quality of HIV Rapid Testing
STEA Scientific travel and events attendance
STI Sexually transmitted infections
TAT Turnaround times
TB Tuberculosis
TMS Tissue microarray analysis
T-RFLP Terminal restriction fragment length polymorphism
TTAC Technologist and Technician Advisory Committee
UCT University of Cape Town
U&E Urea and electrolytes
UFS University of the Free State
UKZN University of KwaZulu-Natal
UoT University of Technology
US Stellenbosch University
UTT Universal Test and Treat
VDVP Vaccine-derived polio virus
VOIP Voice over internet protocol
WHO World Health Organization
Wits University of the Witwatersrand
WSP Workplace Skills Plan

ANNUAL REPORT 2017/18
Page - 8
Introduction
South Africa’s health system consists of a large public sector that serves the poorer majority of South Africans and a private sector serving largely the 17% who have medical insurance. The core mandates of the National Health Laboratory Service (NHLS) are to provide a pathology and laboratory service for public sector users, as well as to train professionals for and to research in the field. To meet its mandate, the NHLS has approximately 266 laboratories cross the country, ranging from highly sophisticated central academic laboratories to laboratories in the most distant rural hospitals. The NHLS provides a huge volume of cutting edge HIV and tuberculosis (TB) services, which form the backbone of our country’s highly acclaimed services that are bringing down these disease burdens for our country.
Being part of the public health sector poses a huge challenge to the NHLS to offer value for money, as the public health sector only accounts for approximately 40% of all expenditure on health. While this amounts to around 11% of the government’s total budget, funding is tight, especially given the heavy national burden of disease for which treatment and care must be provided by the public sector. This means the more efficient the NHLS is, the less of their budgets will the provinces need to use on laboratory services. The NHLS is proud
Foreword by the Chairperson
of the fact that its basket of tests continues to be substantially cheaper than the private sector in spite of the additional costs associated with providing services in rural areas. The NHLS is also proud of the quality of its service and its turnaround times.
Not surprisingly, the NHLS is the biggest provider by far of diagnostic laboratory services for the country. This annual report shows volumes of tests we provide to support clinicians, strategic planners and decision-makers in the public health care sector.
As the Chairperson of the NHLS Board, I am proud to have been afforded the opportunity to lead an organisation making such a valuable contribution to our country.
Strategic Overview
The NHLS has a mammoth task to perform, and has been entrusted with far-reaching and live-saving responsibilities. This annual report provides a picture of the services provided, including in each province, as well as the performance of the NHLS. The NHLS operates under the umbrella of 5 programmes, as the foundation to meet the challenges it set itself in its strategic plan and its annual performance plan. These are: Laboratory Services; Academic Affairs, Research and Quality Assurance; Surveillance of Communicable Diseases; Occupational Health and Safety; and Administration.
Laboratory Services – This is a core function and the largest component of the NHLS: to provide cost-effective and efficient health laboratory services to the country’s public healthcare sector, and other stakeholders on request. This can only be achieved if the NHLS’ delivery machine - its network of laboratories - is effective in carrying out this mandate. Hence the focus of this programme is to ensure that NHLS laboratory services can be accessed as widely as possible by the population and by clinicians, improve the quality of services rendered, enhance operational efficiency and ensure that its laboratories are on par with the best in the world. The indictors that measure this performance show that, in spite of setting standards higher, most of the targets were achieved. However, there is room for improvement going forward, including determining the optimum platform and balance of services to offer even better value for the public funds entrusted in us.
Academic Affairs, Research and Quality Assurance – In addition to the ongoing quality assurance programme, during the year, many laboratories went through stringent quality compliance audits, and significant improvements were recorded. The project to achieve national coverage, particularly by academic and provincial tertiary laboratories providing pathologist cover has also experienced steady improvement. Our partnership with Universities and Universities of Technology received considerable attention. The NHLS continued to
Chairperson: Prof. Eric Buch

ANNUAL REPORT 2017/18
Page - 9
support training of pathologists, medical scientists and laboratory technologists. While the registration rates improved, the pass rates still need to receive ongoing attention by the NHLS and universities. The improved focus on the NHLS research mandate is starting to bear results. In addition to a host of publications and research reports that added to the global body and national body of knowledge and supported our contribution to service provision, four research outputs translated into improved diagnostic practices.
Surveillance of Communicable Diseases – This vital national and continental function is performed by one of the institutes of the NHLS, the National Institute for Communicable Diseases (NICD). Its specialised laboratory and public capacity has attained global recognition and it serves as a reference laboratory for the public and private sectors in South Africa and Africa. This year we saw the NICD lead the investigation into the largest ever recorded outbreak of listeriosis, for which its state-of-the-art ability to perform pathogen whole genome sequencing provided key scientific evidence to identify the source. This event demonstrated the importance of collaborative efforts with relevant stakeholders, as well as the epidemiological and laboratory capacity needed to cope with outbreaks of this magnitude. However, such high profile activities should not mask the exceptional ongoing work of the Institute’s seven centres and other entities who met their targets. The re-engineering of the notifiable medical conditions (NMC) surveillance systems and the launch of a mobile application for real-time reporting of cases was another highlight that will greatly improve early detection and response to outbreaks that pose a threat to public health.
Occupational Health and Safety (OHS) – The National Institute for Occupational Health (NIOH) continues to play a vital niche role in Occupational Health and Safety (OHS). A focus of the past year was engaging directly with workplaces and with communities around workplaces to profile OHS prevention and health promotion and to implement the National Strategic Plan on HIV, TB and STIs. As a World Health Organization (WHO) Collaborating Centre the NIOH is the global lead for the WHO project on the informal economy and vulnerable workers. The NIOH also delivers a Gender@Work Programme and a Workplace Ethics and Trust Project. While delivering for South Africa, the NIOH also collaborates globally, including on nanotechnology research. Its specialised laboratories provide services throughout the continent. An occupational health and safety information system (OHASIS) was implemented, extensive OHS train-the-trainer courses were provided for several NEPAD countries and health workforce training was delivered in Southern Africa through the WHO/IInternational Labour Organization (ILO) HealthWISE programme. In South Africa the NIOH supports the training of the next generation of OHS professionals through engagement with multiple academic and civil organizations. The NIOH met all its key targets and we look forward to another productive year.
Administration – In spite of challenges, including those leading to the suspension of the CEO, and other managers, the NHLS improved on all the functions and processes that enable it to carry out its mandate more effectively and efficiently – Finance, Human Resources, Information Technology and Governance. As can be seen in this report, the NHLS managed to improve its current ratio quite significantly, putting the organisation in a more liquid position than before. While expenses increased due to higher than inflation costs of staff, equipment and consumables, this was offset by a higher turnover than budgeted, due to increased test volumes. The long-standing problem of creditor days was reduced and the organisation paid its suppliers on a regular basis. Our supplier relationships improved, except for those with whom we had contractual disputes. On-time payment by provinces also improved, although there were some difficulties towards the end of the financial year. While we continued to experience challenges in our Information and Communications Technology (ICT) environment improved policies and systems were being put in place to radically modernise the NHLS ICT infrastructure to deliver an integrated support to the business of the organisation. Human Resources (HR) practices were also focussed on driving organisational practice to be on par with the best in the industry. Ensuring the development and retention of a skilled and sustainable human capital for the NHLS is crucial to advancing the NHLS value proposition.
Strategic Relationships
The value of strategic relationships for the NHLS in the public healthcare sector cannot be underestimated. I am therefore appreciative of all the meaningful relationships and support that the NHLS has enjoyed during the period under review, starting with the Minister and Director General of Health. Positive relationships and partnerships were fostered with the National and Provincial Departments of Health, other government departments, universities and universities of technology, research institutions, non-governmental organisations (NGOs), professional associations and industry bodies. Internationally, the NHLS retained its strong historical partnerships with the World Health Organization (WHO), Centres for Disease Control (CDC) and the African Society of Laboratory Medicine (ASLM). All these partnerships continue to impact positively on the work of the NHLS, and its ability to execute its mandate. The NHLS leadership and management teams will continue to cement and strengthen these relationships in the interest of enriching the public healthcare system and our other mandates.

ANNUAL REPORT 2017/18
Page - 10
The NHLS Board
The NHLS Board continued to deliver diligently on its governance mandate, setting the strategic direction, policies and budget; enabling delivery on the strategic and annual performance plan, improving the financial and human resource status, and providing oversight of and direction to the executives. During the year under review the Board not only facilitated stability but enabled significant advances. The Board will continue to perform its oversight and strategy function until the NHLS is a well-oiled organisation, delivering optimally now and ready to meet the challenges of the future.
The year ahead
The Board has much to attend to in the next financial year. It starts with striving to ensure that there is stability in the top echelons of the organisation and that our workforce is well looked after and that morale and motivation are high. There is still work to do in achieving the financial position we aspire to, while resources are mobilised to invest in equipment and infrastructure and continue to keep our annual tariff increases down. Preparations to change our financial model from a fee for service basis to a modified capitated reimbursement model will gain momentum. To offer even better value for money, we not only have to further improve the efficiency of what we are doing, but also determine the best national platform – the optimum configuration, size, service offering and opening hours of our different laboratories and services. Accelerating laboratory quality accreditation is vital for users to feel that our standards of service are guaranteed. The academic platform will continue to receive support for its vital role, with special attention to the retention of senior pathologists and the pass rate challenges faced by registrars (pathologists in training). Improved grant management is essential to retain confidence of our funders.
The year ahead is likely to see approval of the NHLS Amendment Bill and the establishment of the National Public Health Institute of South Africa (NAPHISA), once the NAPHISA Bill has been passed. Together they will herald major changes for the NHLS. The Board is planning for this future. The publication of the draft National Health Insurance (NHI) Bill also heralds major changes for the NHLS of the future. Further work on how to operate and for the NHI to deliver will be undertaken.
Conclusion and Acknowledgements
The year has seen many challenges but also successes. The NHLS ends the year stronger than it started it. This would not have been achieved without the committed service of staff of the NHLS and the Executive Team. Particular thanks are due to Professor Shabir Mahdi and Dr Kamy Chetty, for availing themselves to act as the CEO and for the vital contributions they have made. Thanks are also due to other staff who have acted in executive positions during the year and to Prof Lynn Morris for acting as and then accepting the position of Interim Director of the NICD and Dr Sophia Kisting for agreeing to a further period as Executive Director of the NIOH.
My sincere gratitude and that of the entire Board goes to the Minister of Health, Dr Aaron Motsoaledi for his unwavering backing of the NHLS, his commitment to a successful NHLS for the public healthcare system, and his commitment to clean governance. I am thankful to the Director-General of Health, Ms Malebona Precious Matsoso for being a pillar of support and wisdom. Our appreciation goes to the Members of the Executive Council (MECs) for Health and Heads of Provincial Health Departments who have recognised the national asset the NHLS is and, in spite of financial challenges have prioritised payments to the NHLS.
In conclusion, I would like to thank my fellow Board Members for their expertise and strategic counsel that they have brought to the organisation, and for serving with great dedication, including on the various sub-committees of the Board, to ensure that we provide a full oversight function over the NHLS. Many serve on the Board without remuneration and others for a fraction of what they would receive in a comparable private sector organisation. I am sure that the public, who depend on the NHLS for affordable and accessible laboratory and pathology services to support their health care, join me in acknowledging their service.
Prof. Eric BuchChairperson

ANNUAL REPORT 2017/18
Page - 11
It gives me great pleasure to present the NHLS Annual Report for the 2017/18 financial year. Despite all the challenges that the organisation went through last year, the NHLS was able to deliver on its mandate in support of the country’s increasing demands on the public healthcare system. Below are some of the notable achievements that I wish to highlight:
Financial Overview
One of the key historical problems that the NHLS has always encountered over the years is under-payment by some of the Provincial Health Departments for their consumption of NHLS diagnostic laboratory services – which had unfortunately left the organisation under severe financial stress over a prolonged period of time. However, during the period under review, the provinces acknowledged that a financially healthy and stable NHLS is for the benefit of the entire public healthcare system. The fact that the NHLS provides its services to over 80% of the population is a reality that cannot be ignored.
Acting Chief Executive Officer’s Overview
After extensive negotiations with all the key stakeholders, most of the provinces have now substantially reduced their historic debt and have been adequately paying for their current consumption. This has assisted in improving the financial position of the NHLS, and has enabled the organisation to meet some of its financial obligations.
Despite the above, as at 31 March 2018, the NHLS was still owed R5.4 billion, (from provinces) with KwaZulu-Natal and Gauteng owing the NHLS a combined amount of R4.5 billion or 84% of the outstanding debt. However, a settlement agreement has already been reached with Gauteng province, and negotiations are currently underway to reach the same with KwaZulu-Natal. Nonetheless, we will continue engaging with all the provinces to ensure regular payment. As long as the provinces continue to do this, the financial position of the NHLS will stabilise. For this I would like to thank the Minister and Director-General of Health as well as the NHLS Board, especially the Chairperson of the Board, who played a leading role in committing the Provinces to pay for services rendered to ensure that the NHLS remains a going concern.
Revenue and other income grew from R7.3 billion to R8.2 billion, with the provinces accounting for 78% of the total revenue generated. The increase in revenue was largely due to the increases of Viral Load, Creatinine Automated, Profile Discrete Analyser U & E, EXF Cytology (Gynae) 1st smear and HIV PCR laboratory tests.
Production costs, which include direct labour and materials, increased by 8% from R5.8 billion to R6.2 billion. This increase can mainly be attributed to increases in labour, volume, price increases and fluctuations in the exchange rate. Labour comprised 42% of the total revenue compared with the 46% in the previous financial year. Average test revenue per capita increased by 1.0%, compared with the 5% increase recorded in the previous financial year.
The NHLS was able to generate a surplus for the year amounting to R1.3 billion compared to a restated R1.9 billion deficit in the previous financial year due to the reversal of the provision of doubtful debt.
Cash flow amounted to R8 billion compared with R6.7 billion in the previous financial year. Of this R8 billion, R3.3 billion was utilised for personnel costs and R3.7 billion for goods and services. Creditor days were also reduced from 75 days to 51 days during the year under review. Whilst debtor days has not dramatically decreased, there is continuous improvement in the collection of debt.
Although the financial position of the NHLS might have improved, the organisation is still in a tight financial corner. Management has therefore committed itself to implementing prudent financial practices to ensure that costs do not escalate. A cost containment strategy has already been developed and it will be driven from my office and the office of the Chief Financial Officer (CFO). Various and critical cost saving measures have already been identified and will be implemented in the coming financial year.
Acting CEO: Dr Kamy Chetty
ANNUAL REPORT 2017/18
Page - 12
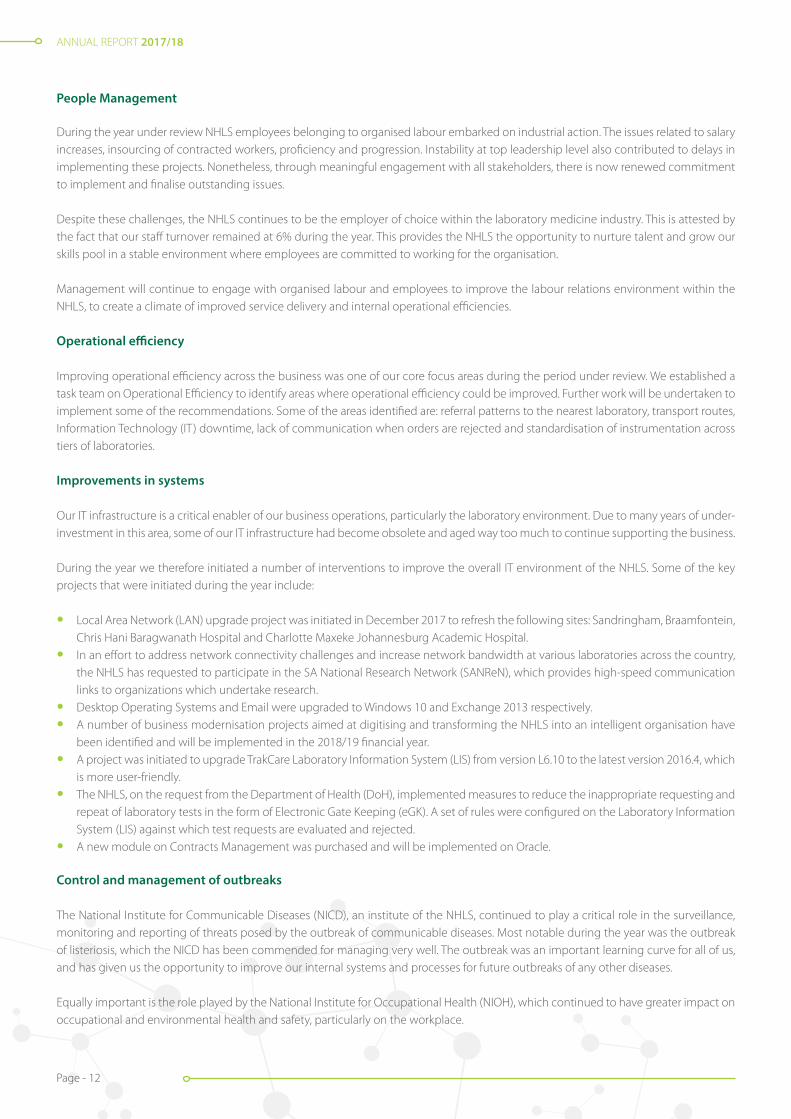
People Management
During the year under review NHLS employees belonging to organised labour embarked on industrial action. The issues related to salary increases, insourcing of contracted workers, proficiency and progression. Instability at top leadership level also contributed to delays in implementing these projects. Nonetheless, through meaningful engagement with all stakeholders, there is now renewed commitment to implement and finalise outstanding issues.
Despite these challenges, the NHLS continues to be the employer of choice within the laboratory medicine industry. This is attested by the fact that our staff turnover remained at 6% during the year. This provides the NHLS the opportunity to nurture talent and grow our skills pool in a stable environment where employees are committed to working for the organisation.
Management will continue to engage with organised labour and employees to improve the labour relations environment within the NHLS, to create a climate of improved service delivery and internal operational efficiencies.
Operational efficiency
Improving operational efficiency across the business was one of our core focus areas during the period under review. We established a task team on Operational Efficiency to identify areas where operational efficiency could be improved. Further work will be undertaken to implement some of the recommendations. Some of the areas identified are: referral patterns to the nearest laboratory, transport routes, Information Technology (IT) downtime, lack of communication when orders are rejected and standardisation of instrumentation across tiers of laboratories.
Improvements in systems
Our IT infrastructure is a critical enabler of our business operations, particularly the laboratory environment. Due to many years of under-investment in this area, some of our IT infrastructure had become obsolete and aged way too much to continue supporting the business.
During the year we therefore initiated a number of interventions to improve the overall IT environment of the NHLS. Some of the key projects that were initiated during the year include:
• Local Area Network (LAN) upgrade project was initiated in December 2017 to refresh the following sites: Sandringham, Braamfontein, Chris Hani Baragwanath Hospital and Charlotte Maxeke Johannesburg Academic Hospital.
• In an effort to address network connectivity challenges and increase network bandwidth at various laboratories across the country, the NHLS has requested to participate in the SA National Research Network (SANReN), which provides high-speed communication links to organizations which undertake research.
• Desktop Operating Systems and Email were upgraded to Windows 10 and Exchange 2013 respectively.
• A number of business modernisation projects aimed at digitising and transforming the NHLS into an intelligent organisation have been identified and will be implemented in the 2018/19 financial year.
• A project was initiated to upgrade TrakCare Laboratory Information System (LIS) from version L6.10 to the latest version 2016.4, which is more user-friendly.
• The NHLS, on the request from the Department of Health (DoH), implemented measures to reduce the inappropriate requesting and repeat of laboratory tests in the form of Electronic Gate Keeping (eGK). A set of rules were configured on the Laboratory Information System (LIS) against which test requests are evaluated and rejected.
• A new module on Contracts Management was purchased and will be implemented on Oracle.
Control and management of outbreaks
The National Institute for Communicable Diseases (NICD), an institute of the NHLS, continued to play a critical role in the surveillance, monitoring and reporting of threats posed by the outbreak of communicable diseases. Most notable during the year was the outbreak of listeriosis, which the NICD has been commended for managing very well. The outbreak was an important learning curve for all of us, and has given us the opportunity to improve our internal systems and processes for future outbreaks of any other diseases.
Equally important is the role played by the National Institute for Occupational Health (NIOH), which continued to have greater impact on occupational and environmental health and safety, particularly on the workplace.
ANNUAL REPORT 2017/18
Page - 13
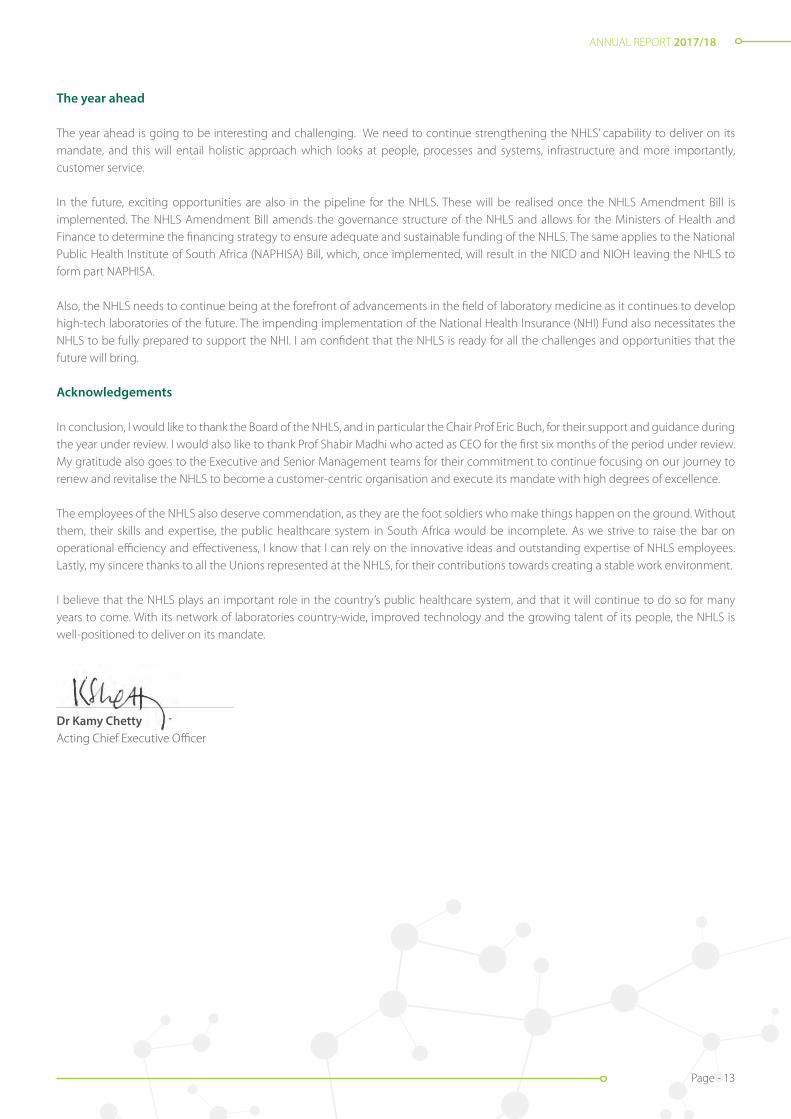
The year ahead
The year ahead is going to be interesting and challenging. We need to continue strengthening the NHLS’ capability to deliver on its mandate, and this will entail holistic approach which looks at people, processes and systems, infrastructure and more importantly, customer service.
In the future, exciting opportunities are also in the pipeline for the NHLS. These will be realised once the NHLS Amendment Bill is implemented. The NHLS Amendment Bill amends the governance structure of the NHLS and allows for the Ministers of Health and Finance to determine the financing strategy to ensure adequate and sustainable funding of the NHLS. The same applies to the National Public Health Institute of South Africa (NAPHISA) Bill, which, once implemented, will result in the NICD and NIOH leaving the NHLS to form part NAPHISA.
Also, the NHLS needs to continue being at the forefront of advancements in the field of laboratory medicine as it continues to develop high-tech laboratories of the future. The impending implementation of the National Health Insurance (NHI) Fund also necessitates the NHLS to be fully prepared to support the NHI. I am confident that the NHLS is ready for all the challenges and opportunities that the future will bring.
Acknowledgements
In conclusion, I would like to thank the Board of the NHLS, and in particular the Chair Prof Eric Buch, for their support and guidance during the year under review. I would also like to thank Prof Shabir Madhi who acted as CEO for the first six months of the period under review. My gratitude also goes to the Executive and Senior Management teams for their commitment to continue focusing on our journey to renew and revitalise the NHLS to become a customer-centric organisation and execute its mandate with high degrees of excellence.
The employees of the NHLS also deserve commendation, as they are the foot soldiers who make things happen on the ground. Without them, their skills and expertise, the public healthcare system in South Africa would be incomplete. As we strive to raise the bar on operational efficiency and effectiveness, I know that I can rely on the innovative ideas and outstanding expertise of NHLS employees. Lastly, my sincere thanks to all the Unions represented at the NHLS, for their contributions towards creating a stable work environment.
I believe that the NHLS plays an important role in the country’s public healthcare system, and that it will continue to do so for many years to come. With its network of laboratories country-wide, improved technology and the growing talent of its people, the NHLS is well-positioned to deliver on its mandate.
Dr Kamy Chetty Acting Chief Executive Officer

ANNUAL REPORT 2017/18
Page - 14
Board Members (Present)
Dr Tim Tucker
Chairperson: Prof. Eric Buch
Prof. Larry Obi
Dr Balekile MzangwaDr Gerhard Goosen
Vice Chairperson: Dr Sibongile Zungu Acting CEO: Dr Kamy Chetty
Prof. Haroon Saloojee Prof. Mary Ross

ANNUAL REPORT 2017/18
Page - 15
Ms Nelisiwe MkhizeMs Sphiwe Mayinga
Mr Ben Durham
Ms Nicolene Van der Westhuizen
Dr Zwelibanzi Mavuso Mr Michael Shingange
Mr Ian van der Merwe Dr Monde Tom

ANNUAL REPORT 2017/18
Page - 16
Board Members (Past)
Prof. Barry Schoub(20 April 2017 - 29 April 2018)
Prof. Willem Sturm(27 August 2015 - 1 September 2017)
Mr A Venter(2 January 2015 - 2 January 2018)
Mr Michael Manning(30 April 2015 - 30 April 2018)
Mr Stanley Harvey(1 February 2015 - 1 February 2018)
Ms Ntombi Mapukata(1 February 2015 - 1 February 2018)
Mr Lunga Ntshinga (Deceased: 13 August 2017)
Acting CEO: Prof. Shabir Madhi (24 February - 31 August 2017)

ANNUAL REPORT 2017/18
Page - 17
To the best of our knowledge and belief, we confirm the following:
• All information and amounts disclosed in the NHLS Annual Report are consistent with the Annual Financial Statements (AFS) audited by Sizwe NtsalubaGobodo Inc Grant Thornton inc.
• The Annual Report (AR) is complete, accurate and free from any omissions.
• The AR was prepared in accordance with the Annual Report Guidelines as issued by National Treasury.
• The Annual Financial Statements (Part E) were prepared in accordance with the Standards of Generally Recognised Accounting Practice (GRAP), applicable to the NHLS.
• The Accounting Authority is responsible for the preparation of the AFS and for the Judgements made in this information.
• The Accounting Authority is responsible for establishing and implementing a system of internal control, designed to provide reasonable assurance as to the integrity and reliability of the performance information, the human resources information and the AFS.
• The external auditors are engaged to express an independent opinion on the AFS.
In our opinion, the NHLS AR fairly reflects the operations, performance information, human resources information and financial affairs of the NHLS for the financial year that ended 31 March 2018.
Yours faithfully
Dr Kamy Chetty Prof. Eric Buch Acting Chief Executive Officer Chairperson of the Board
Statement of responsibility and confirmation of accuracy of the National Health Laboratory Service (NHLS) annual report

ANNUAL REPORT 2017/18
Page - 18
About the NHLS
The National Health Laboratory Service (NHLS) is a national public entity, established in terms of the National Health Laboratory Service Act, no. 37 of 2000, to provide quality, affordable and sustainable health laboratory and related public health services. It has approximately 266 laboratories across the nine provinces of South Africa, excluding depots, and serves approximately 80% of the South African population.
The NHLS is the main provider of clinical support services to the national, provincial and local departments of health, through its countrywide network of quality assured diagnostic laboratories. It also provides surveillance support for communicable diseases, occupational health and cancer.
The NHLS is managed according to the provisions of the National Health Laboratory Service Act; the NHLS Rules, gazetted in July 2007; and the Public Finance Management Act (PFMA), no. 1 of 1999. It is a Schedule 3A Public Entity, governed by a Board and a Chief Executive Officer (CEO).
It has a clear organisational structure consisting of a head office in Sandringham, Johannesburg, six regions (Mpumalanga and Limpopo; KwaZulu-Natal; Eastern Cape; Western and Northern Cape; Free State and North West; and Gauteng) and two institutes, namely: The National Institute for Communicable Diseases (NICD), incorporating the National Cancer Registry (NCR) and the National Institute for Occupational Health (NIOH). The six regions are purposefully designed to ensure that the NHLS plans, agrees on budgets and monitors laboratory services jointly with provincial health partners, with the intention for laboratory services to be perceived and accepted as part of the public health delivery system.
The NHLS delivers services throughout the public sector, from national central, provincial tertiary, regional and district hospitals, to primary healthcare facilities. The level of complexity and sophistication of services increases from the peripheral laboratories to the central urban laboratories (with specialised surveillance infrastructure existing at specific sites).
South African Vaccine Producers (SAVP) is a wholly owned subsidiary of the NHLS and provides the following services:
• The manufacturing of biologicals, namely polyvalent, Echis, Boomslang, spider, and scorpion antivenom;
• Safety testing for pharmaceutical companies;
• Research on routine products authorised via the animal ethics committee involving animals;
• Preparation of horse and sheep serum; and
• Preparation and sampling of horse blood.
Vision
To render efficient patient centred services and become a global centre of excellence for innovative laboratory medicine.
Mission
To provide quality, affordable and sustainable health laboratory services through an integrated network of laboratories, the provision of training for health science education and the execution of innovative and relevant research with focus on patient care.
Values
The following values are guiding principles that were established to govern and align the behaviour of all NHLS employees:
Strategic Overview

ANNUAL REPORT 2017/18
Page - 19
Value Description
3.1 Care Caring about the environment and society: This involves consideration of our impact on the environment and local communities, acting with concern and sensitivity. The NHLS is committed to behave ethically and contribute to the economic development of the workforce, community and society at large. It is about giving back to society and the environment, as well as capacity building for a sustainable future.
3.2 Unity of purpose All working together towards a common goal: All employees should be united by a common vision and support each other in contributing to a beneficial and safe working environment. Teamwork and cohesion are key, and collaboration should include pooling resources and communicating about each other’s roles. Foster trust and honesty in interactions with colleagues and behave professionally. Value all contributions, treat everyone consistently and fairly and capitalise on diverse viewpoints. Address and resolve conflicts effectively. Listen to others to fully understand and give clear, concise information when communicating expectations and accountabilities and providing feedback during coaching. Making NHLS goals a priority, using NHLS resources wisely and effectively and taking responsibility for your work.
3.3 Service excellence Valuing good work ethics and striving towards service excellence for customers: This speaks to being committed to working with customers and building good relationships with them by understanding their needs, responding quickly and providing appropriate solutions. We treat them with respect at all times; we are helpful, courteous, accessible, responsible and knowledgeable in our interactions. We understand that we have internal and external customers that we provide services and information to. This information should be presented in a clear and concise form, and the message should be adapted to the audience.
3.4 Transformation Looking forward to the future and growing together: This encompasses investing in professional growth of staff by sharing knowledge and experience, peer networking, education through training and seeking opportunities to develop. It covers creative problem solving, informed risk-taking, learning from our mistakes and experiences and behaving professionally. We should adapt to change timeously and positively, address setbacks and ambiguity and adapt our thinking/approach as a situation changes. Ideas should be shared and implemented effectively. Leaders should develop innovative approaches and drive continuous improvement, as well as effective and smooth change initiatives.
3.5 Innovation Pioneering relevant research solutions and training: Identifying needs to broad challenges present in local society. Creating space for research to be done and backing fresh ideas by bringing them to the market. Pursuing cost-effective solutions in research and training. Monitoring the impact of solutions on the challenges faced. Supporting the application of new ways of doing things at senior management level in the organisation. Encouraging pioneering personalities to operate outside the research box. Rewarding and publicising boundary-breaking initiatives. Giving credit to those to whom it is due.
3.6 Integrity Working with integrity and responsibility: Setting and achieving goals, consistently delivering business results, while complying with standards and meeting deadlines. Displaying commitment to organisational success; proactively identifying ways to contribute and taking initiative to address problems/opportunities. Building efficiency in the best use of public resources.
ANNUAL REPORT 2017/18
Page - 20
The legislative mandate of the NHLS is derived from the Constitution, the National Health Act, No. 61 of 2003 (NHA), the NHLS Act 37 of 2000, and several laws, regulations and policies issued by Parliament.
Constitutional Mandate
In terms of the constitutional provisions, the NHLS is, amongst others, guided by the following sections and schedules:1. The Constitution of the Republic of South Africa, 1996, places obligations on the state to progressively realise socio-economic rights,
including access to healthcare.
2. Section 27 of the Constitution states the following with regards to healthcare, food, water, and social security:(i). Everyone has the right to have access to:
o Healthcare services, including reproductive healthcare;o Sufficient food and water; ando Social security, including, if they are unable to support themselves and their dependents, appropriate social assistance.
(ii). The state must take reasonable legislative and other measures, within its available resources, to achieve the progressive realisation of each of these rights; and
(iii). No one may be refused emergency medical treatment.
The National Health Act, No. 61 of 2003
This act provides a framework for a structured and uniform health system within South Africa, considering the obligations imposed by the Constitution and other laws on the national, provincial and local governments regarding health services. The objectives of the NHA are to:
• Unite the various elements of the national health system in a common goal to actively promote and improve the national health system in South Africa;
• Provide for a system of cooperative governance and management of health services, within national guidelines, norms and standards, in which each province, municipality and health district must address questions of health policy and delivery of quality healthcare services;
• Establish a health system based on decentralised management, principles of equity, efficiency, sound governance, internationally recognised standards of research and a spirit of enquiry and advocacy which encourage participation;
• Promote a spirit of cooperation and shared responsibility among public and private health professionals and providers and other relevant sectors within the context of national, provincial and district health plans; and
• Create the foundation of the healthcare system that must be understood alongside other laws and policies that relate to health.
The National Health Laboratory Service Act, No. 37 of 2000
This act mandates the NHLS to provide cost-effective and efficient health laboratory services to all public sector healthcare providers; any other government institution inside and outside of South Africa that may require such services; and any private healthcare provider that requests such services. The act also mandates the NHLS to support health research and provide training for health science education.
Additional governance contexts
The NHLS is required to comply, inter alia, with the following:
• General rules established in terms of Section 27 of the National Health Laboratory Service Act;
• The Companies Act, No. 71 of 2008;
• The Protocol on Good Corporate Governance in the Public Sector;
• The Public Finance Management Act, No. 1 of 1999 (as amended) (PFMA);
• Treasury regulations issued in terms of the PFMA, 1999;
Legislative and other Mandates

ANNUAL REPORT 2017/18
Page - 21
• The Preferential Procurement Framework Act, No. 5 of 2000;
• All legislation that are applicable to the health sector;
• The Annual Report Guide for Schedule 3A and 3C Public Entities; and
• The King III Code on Good Corporate Governance.
Other policy initiatives
As articulated in its Strategic Plan 2015/2016–2019/2020, the NHLS is committed to support the following:
• The National Health Insurance (NHI), which will cover a defined basket of pathology services that are aligned with the package of services required per level of care. The pathology service will be delivered at public healthcare level, as well as at higher levels of care as defined by the NHLS Act and in line with the NHA. The latter requires the setting, monitoring and enforcing of quality control standards applicable to pathology services, to ensure patient safety.
• The National Public Health Institute for South Africa (NAPHISA), that has the following functions:o Communicable diseases;o National Cancer Registry (NCR);o Occupational health;o Non-communicable diseases; ando Injury and violence prevention.
The various departments that will form part of NAPHISA are still being determined but it is anticipated that the NICD, including the NCR and the NIOH will be incorporated into NAPHISA.

ANNUAL REPORT 2017/18
Page - 22
Organisational Structure
Minister of Health
NHLS Board
Chief Executive
Audit and Risk Committee
Senior Manager:Monitoring and
Evaluation
Chief Financial
Executive Manager:
HR
Executive Manager:
Laboratory Service
Executive Manager:
AARQA
Chief Information Director:
NICDDirector:
NIOH
ExecutiveManager:
NPP
Manager:SAVP
Company Secretary
Senior Manager:
O�cer
Communications, Marketing and PR
Head: Risk Management and Internal Audit
ANNUAL REPORT 2017/18
Page - 23
Performance Information
PART B
ANNUAL REPORT 2017/18
Page - 24
The independent auditor performed the necessary audit procedure on the performance information of the NHLS to provide reasonable assurance in the form of an audit conclusion. The audit conclusion on the performance of the NHLS against its predetermined objectives, is included in the report to management, with material findings being reported under the ‘Predetermined objectives’ heading in the report in the ‘Other legal and regulatory requirements’ section of the auditor’s report on pages 187 to 193.
Auditor’s report predetermined objectives

ANNUAL REPORT 2017/18
Page - 25
Service delivery environment
The NHLS continues to provide quality service to its stakeholders. The organisation strives to ensure accessibility of service to all communities, through having a presence in all hospitals and through collecting samples from all primary healthcare facilities, daily.
Through the NHLS, South Africa was the first out of 18 countries in Africa to have two laboratories that were awarded five-star level, following an audit by the African Society for Laboratory Medicine (ASLM), that uses the World Health Organization (WHO) Stepwise Laboratory Quality Improvement Process Towards Accreditation (SLIPTA) system, to conduct their assessments.
From April to December 2016, the average performance of NHLS laboratories that were tested through proficiency testing schemes (PTS) of an external quality assessment (EQA) has been 91%, with a total of 84% of laboratories achieving a performance score of more than 80%. Since the beginning of 2016/2017, the laboratories that have been audited internally, have also achieved an average performance score of 84%, compared to a score of 82% achieved at the end of 2015/2016.
The NHLS successfully completed the rollout of its Laboratory Information System (LIS) in all laboratories across the country, which resulted in seamless and integrated management of laboratory data. The NHLS’ Corporate Data Warehouse (CDW), enabled the development of the first National CD4/Viral Load Monitoring Dashboard, an online tool that that was launched in November 2016 and that monitors CD4 count and viral load in South Africa’s HIV positive patients.
The NHLS information technology (IT) infrastructure, which has been a challenge for some time, was prioritised. The aim is to build a strong IT foundation based on a robust and agile infrastructure with core laboratory and enterprise capabilities and innovative solutions to help build state-of-the-art laboratory services in the country.
The South African Vaccine Producers (SAVP), a wholly-owned subsidiary of the NHLS, continued to supply strategic products with outstanding results. Excellent feedback was received from as far as Spain and Thailand, including a report from Kenya stating that “the anti-venom has saved lives in these serious snakebite areas”.
Organisational environment
South Africa experiences a quadruple burden of disease comprising communicable diseases, non-communicable diseases and occupational health and injuries. The NHLS is the main provider of clinical support services to the national, provincial and local Departments of Health, through its countrywide network of quality assured diagnostic laboratories. It also provides surveillance support for communicable diseases and cancer, as well as occupational and environmental health services, which in turn assists in addressing the burden of disease.
The NHLS supports Government’s plans towards addressing the challenges of HIV/AIDS and Tuberculosis (TB) in an integrated manner. For this reason, the NHLS has been and will remain an important partner in the successful implementation of the HIV Counselling and Testing (HCT) Campaign, the Prevention of Mother-to-Child Transmission (PMTCT), and the Comprehensive Care, Management and Treatment (CCMT) Programmes through the National Priority Programmes Unit (NPPU). The announcement that the Minister of Health, Dr Pakishe Aaron Motsoaledi, made during his budget speech on the 10th of May 2016, that the country will implement the WHO evidence-based guidelines on Universal Test and Treat (UTT) by 1 September 2016; is expected to have an impact on the demand of service by the DoH, at various levels.
The NHLS is a custodian of a wealth of valuable health data that could inform policy and guidelines through collaborative engagement and our diagnostic and monitoring services are critical in contributing to the reduction of disease progression, improving quality of care, quality of life and to ultimately reduce premature deaths.
Situational Analysis
ANNUAL REPORT 2017/18
Page - 26
Accessibility to pathologist services
Pathologists play a vital role in health laboratory services. There is a clear need to improve access to pathologists’ support outside of the major academic centres. The ideal would be to place clinical pathologists and mono-specialist pathologists at provincial, tertiary and regional laboratories. Any clinician working in the public sector should, at the very least, have telephonic access to a pathologist/pathology registrar in the relevant discipline for clinically related queries. A pathologist ‘hotline’ for relevant queries should be established that is capacitated through a combination of on- and off-site pathologists that are placed on a roster and that is clearly communicated to clinicians. Pathologists should furthermore participate in the District Clinical Support Teams’ (DCSTs) as envisaged in the NHI strategy, and this must be incorporated on the clinical platform to complement patient care, add value in clinical decision-making and ultimately contribute to improved patient outcomes.
Accessibility to testing services
The current model involves an extended laboratory “footprint” with numerous services provided close to the periphery. The NHLS is guided by the directives, policies and guidelines of the DoH. Accessibility to services can be extended through electronic access to test results. Doctors and nurses rely on data from the NHLS to inform their decisions about patient diagnoses and treatment. A technology-driven results system is far superior to courier-delivered paper results, as it saves time, is more cost-effective and efficient, and can be accessed via the Internet, or transmitted via SMS printers and mobile cellular devices.
Point-of-Care Testing (POCT) could also improve access and revolutionise laboratory and diagnostic services for patients and health providers. Rapid technological advances have made near- and/or on-site performing of such tests a reality and this has become the fastest growing segment of the diagnostic industry. The NHLS is currently conducting pilot studies that address aspects of quality assurance and control, instrument monitoring, as well as the downloading of results into the LIS, as part of the patient pathology records and public health surveillance.
The National Health Insurance (NHI)
The government has tabled the NHI in a bid to expand accessible healthcare to all South Africans and to provide universal coverage of health services, while controlling costs. The NHLS, together with the DoH, are working on means to reduce laboratory diagnostic test costs through rational laboratory usage or electronic gate keeping projects.
The public pathology services in South Africa constitute less than 3% of the total health spend in the public sector. The benefit of pathology to health has however been established in both developed and developing countries, right through from training of undergraduate and postgraduate health professionals, to clinical consultation, surveillance, infection control and prevention, diagnosis and monitoring of disease. Data from developed countries show that pathology services are important in 70 - 80% of critical medical decisions.
Health promotion, that is strongly emphasised in the NHI policy, requires a thorough understanding of the epidemiology of disease in South Africa. National laboratory surveillance is crucial to providing detailed information on a national and local level, to inform policy formulation and drive appropriate interventions. The NHLS has significant surveillance capacity with a data powerhouse supported by a seamless LIS. In this regard, the NHLS is a national asset.
Management Information Systems
The power of this database has already been demonstrated through the national mapping of multi-drug and extensive drug resistant TB. A national LIS is required to allow retrieval of patient results as patients are referred or migrate between districts. The establishment of a business intelligence unit dealing with patient data, will improve decision-making and healthcare provisioning. Such a system will furthermore enable consistent gatekeeping, eliminate unnecessary requests for testing and reduce wasteful expenditure.
ANNUAL REPORT 2017/18
Page - 27
Affordability
The NHLS provides pathology services that are affordable.
The entity is also in the process of reviewing new funding models including Modified Capitation Funding Model. in addition, these models will be complemented by:
• Minimum Clinical Data Set (MCDS): The project serves to improve the completeness of information, relating to the patient and specimen, as received on the NHLS request form. The billing of provinces is intricately linked to the request form, which is the source document that provides a link to the clinician. The accuracy and completeness of the patient and clinician demographics is vital to improved efficiency and billing.
• Electronic Gatekeeping (eGK): eGK in a pathology laboratory is the process whereby access to laboratory testing is controlled by using rules that are programmed into the LIS. These rules will either allow or disallow the laboratory test to be done. Currently a set of eGK rules (formulated by a Hospital Medical Committee) are embedded in the LIS with the aim to promote rational use of laboratory services, by avoiding unnecessary testing (e.g. repetitions) without compromising patient care and also encourage good clinical practice.
These projects will further enhance the affordability of the service.
Delivery on the academic mandate
The NHLS has the mandate to support and undertake the training of pathologists, medical scientists, medical technologists and medical technicians, has joint appointment arrangements with all universities with medical schools and some with dental schools and has a formal relationship with a number of comprehensive universities and universities of technology. Clinical pathology, the generalist discipline in the field, needs greater focus, as the requirement for clinical pathologists to be placed at regional laboratories increases, to improve accessibility to pathology consultancy services.
Research was mandated as a function of the NHLS by the NHLS Act No 37, 2000. A balance will need to be established between the research interests of the NHLS, the National Research Priorities (NRPs) of the country, individual researchers and external funders. Clear alignment between the research and service delivery agendas should be driven.
Resource constraints
Given the strategic alignment with Government programmes, the NHLS must ensure it has sufficient capacity, whether human, technology or infrastructure – to adequately respond to the increasing burden of disease outbreak, despite the resource-constrained environment faced. This will require innovation, creativity, flexibility, agility, foresight, prioritisation of tests and services.
Key policy developments and legislative changes
The following Bills, which are either going through a parliamentary process or broader public comments, will impact on the NHLS once they have been implemented. They are:
• NHLS Amendment Bill – which aims to strengthen the governance and funding mechanism of the NHLS;
• National Health Insurance Bill 2018 – which has been designed to create a single compulsory medical scheme for all citizens and permanent residents, with a special fund for refugees;
• Medical Schemes Amendment Bill 2018 – which seeks to improve the legislative oversight of medical schemes; and
• The National Public Health Institute of South Africa (NAPHISA) Bill – which seeks to establish a single national public entity that will coordinate, and where appropriate, conduct disease and injury surveillance; provide specialised public health services, public health interventions, training and research directed towards the major health challenges affecting the population of South Africa.

ANNUAL REPORT 2017/18
Page - 28
Introduction
Performance information enables the organisation to track how well the organisation is progressing in meeting its planned strategic goals and strategic objectives. The performance information is key to effective management, including planning, budgeting, implementation, monitoring and reporting of information. It also facilitates accountability and enables stakeholders and interested parties to track progress and identify the scope of improvement plans and better understand the issues involved (Framework Performance of Information: National Treasury).
The National Health Laboratory service managed to achieve 60% of its set targets. The performance was impacted by the resignation of executive managers and supply chain challenges.
Programme 1: Administration
Programme purposeThe Administration Programme plays a crucial role in the delivery of the NHLS services through the provision of a range of support services, such as organisational development, HR and labour relations, information technology, property management, security services, legal, communication and an integrated planning function. The NHLS depends highly on the effective management of financial resources and procurement processes, as administered within the financial department. Generating sufficient revenue remains a critical focus area for NHLS to ensure financial viability and sustainability. There are four sub-programmes, namely:
Sub-programme - Financial ManagementThe purpose of this sub-programme is to improve the cash flow position of the NHLS.
Strategic objective: To improve the liquidity position of the NHLS.Objective statement: Improve the cash flow position of the NHLS by improving the cash flow coverage ratio from 2.6 to 2.1 by 2020 and thereby ensure that there is liquid capital to implement key plans and priorities. Increase the current ratio rating from 2.6 to 2.0 by 2020 to optimise the margin of current assets over current liabilities.
Programme 1: Administration
Sub-programme: Financial Management
Performance indicator
2014/15 2015/16 2016/17 2017/18 2017/18
Reason for deviation from the planned targetActual Actual Actual
Planned target Actual
1.1.1 Current ratio (current assets/current liabilities)
New New 1.3 2.6 times: (2.0 times)
1.9 times Target not achieved. Despite a year-on-year increase in both current assets and current liabilities, the growth in short term liabilities exceeded the growth in current assets by 2.2%, which led to a reduction in liquidity. A reduction in the accounting provision for doubtful debt offsets potential concerns around reductions in company liquidity.
1.1.2 Cash flow coverage ratio (Operating cash in-flows/total debt)
New New 1.9 2.5 times: (2.1 times)
2.3 times Target achieved. Increases in the cash coverage is as a result of improved cash collections.
1.1.3 Turnover (including other income): Rbn
5.9bn 6.9bn 7.3bn R7.2bn R8.2bn Target achieved. Actual turnover exceeded the planned target by R1bn due to increases in test volumes as well as an increase in non-exchange revenue, viz the revenue budget allocation from the DoH.
1.1.4 Percentage of materials to test revenue
40% 44% 44% 38%: (43%) 43% Target achieved. This is due to the effective management of price increases as well as an improvement in the exchange rate volatility.
Performance information by Programme
ANNUAL REPORT 2017/18
Page - 29
Performance indicator
2014/15 2015/16 2016/17 2017/18 2017/18
Reason for deviation from the planned targetActual Actual Actual
Planned target Actual
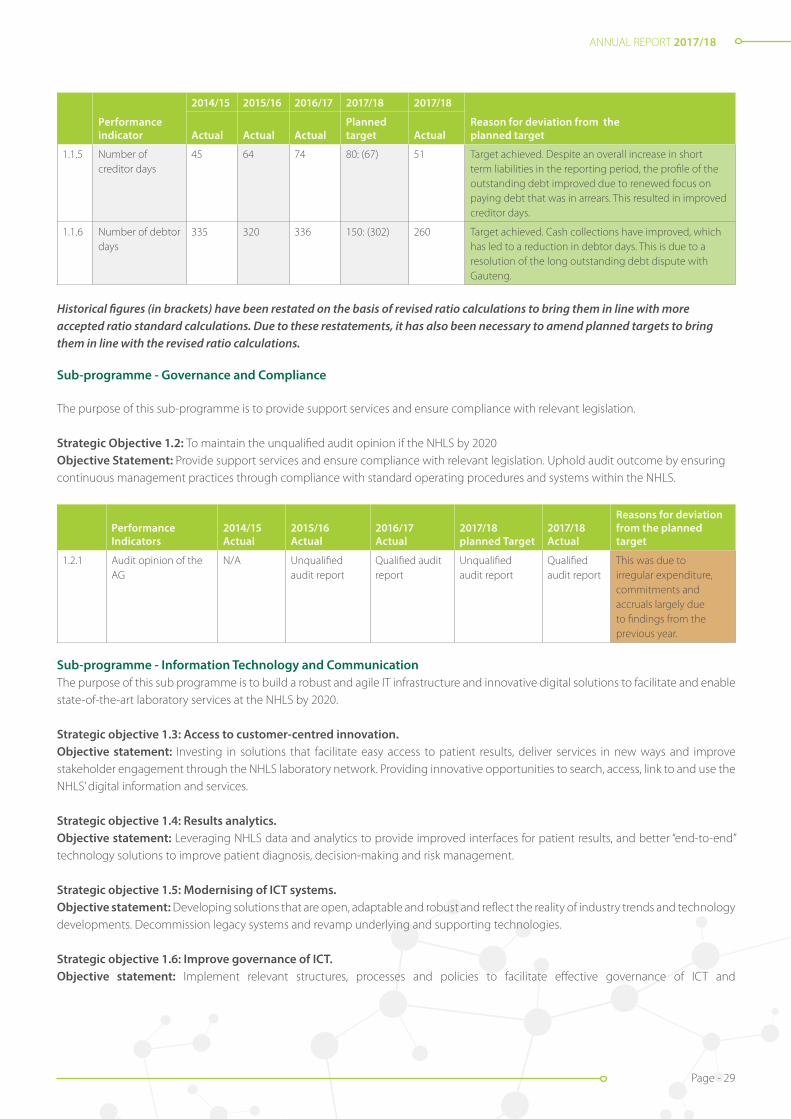
1.1.5 Number of creditor days
45 64 74 80: (67) 51 Target achieved. Despite an overall increase in short term liabilities in the reporting period, the profile of the outstanding debt improved due to renewed focus on paying debt that was in arrears. This resulted in improved creditor days.
1.1.6 Number of debtor days
335 320 336 150: (302) 260 Target achieved. Cash collections have improved, which has led to a reduction in debtor days. This is due to a resolution of the long outstanding debt dispute with Gauteng.
Historical figures (in brackets) have been restated on the basis of revised ratio calculations to bring them in line with more accepted ratio standard calculations. Due to these restatements, it has also been necessary to amend planned targets to bring them in line with the revised ratio calculations.
Sub-programme - Governance and Compliance
The purpose of this sub-programme is to provide support services and ensure compliance with relevant legislation.
Strategic Objective 1.2: To maintain the unqualified audit opinion if the NHLS by 2020Objective Statement: Provide support services and ensure compliance with relevant legislation. Uphold audit outcome by ensuring continuous management practices through compliance with standard operating procedures and systems within the NHLS.
Performance Indicators
2014/15 Actual
2015/16 Actual
2016/17 Actual
2017/18 planned Target
2017/18 Actual
Reasons for deviation from the planned target
1.2.1 Audit opinion of the AG
N/A Unqualified audit report
Qualified audit report
Unqualified audit report
Qualified audit report
This was due to irregular expenditure, commitments and accruals largely due to findings from the previous year.
Sub-programme - Information Technology and CommunicationThe purpose of this sub programme is to build a robust and agile IT infrastructure and innovative digital solutions to facilitate and enable state-of-the-art laboratory services at the NHLS by 2020.
Strategic objective 1.3: Access to customer-centred innovation.Objective statement: Investing in solutions that facilitate easy access to patient results, deliver services in new ways and improve stakeholder engagement through the NHLS laboratory network. Providing innovative opportunities to search, access, link to and use the NHLS’ digital information and services.
Strategic objective 1.4: Results analytics.Objective statement: Leveraging NHLS data and analytics to provide improved interfaces for patient results, and better “end-to-end” technology solutions to improve patient diagnosis, decision-making and risk management.
Strategic objective 1.5: Modernising of ICT systems.Objective statement: Developing solutions that are open, adaptable and robust and reflect the reality of industry trends and technology developments. Decommission legacy systems and revamp underlying and supporting technologies.
Strategic objective 1.6: Improve governance of ICT.Objective statement: Implement relevant structures, processes and policies to facilitate effective governance of ICT and

ANNUAL REPORT 2017/18
Page - 30
decision-making.
Sub-programme: Information Technology and Communication
Performance indicator
2014/15 2015/16 2016/17 2017/18 2017/18
Reason for deviation from the planned targetActual Actual Actual
Planned target Actual
1.3.1 Percentage of new IT strategy completed
New New New 100% 75% Target not achieved. The compilation of the draft strategy commenced late, due to changes in management. The first draft is complete and will be implemented in 2018/2019.
1.3.2 Percentage of projects implemented as per the approved IT roadmap
New New New 40% 0% Target not achieved. The first draft is complete. The strategy will be implemented in 2018/2019. The roadmap is detailed in the IT strategy.
1.3.3 Number of dashboard, analytics and customer channel projects implemented
New New New 4 4 Target achieved. The projects implemented are:• Laboratory performance dashboard (TATNPP);• Rejection report; • Facility report; and • APP.
1.4.1 Percentage system uptime for critical systems
99% 99% 99% 99% 99% Target achieved.
1.5.1 Number of modernisation projects completed
New New New 8 5 The target is not achieved because there was adelay in the implementation of the LAN and VOIPprojects and procurement of computers for ECMwas delayed.
Five projects which were completed are:• Migration to Exchange.• OS and Office IT modernisation.• Implementation of MS monitoring tools.• Migration to MTN MPLS VPN.• Replacement of CDW equipment.
1.6.1 Percentage projects implemented against approved IT governance framework and security strategy implementation plans
New New New 60% 75% (3/4) Target achieved. Projects completed:• IT governance framework approved.• IT policy reviewed and updated.• Project management framework implemented.
Sub-programme - Human Resource ManagementThe purpose of this sub-programme is to provide effective services through efficient processes and adequate human resources.
Strategic objective 1.7: To ensure adequate and skilled human resources by 2020.Objective statement: Provide effective services through efficient processes and adequate human resources. Improve the motivation and performance levels of all employees.
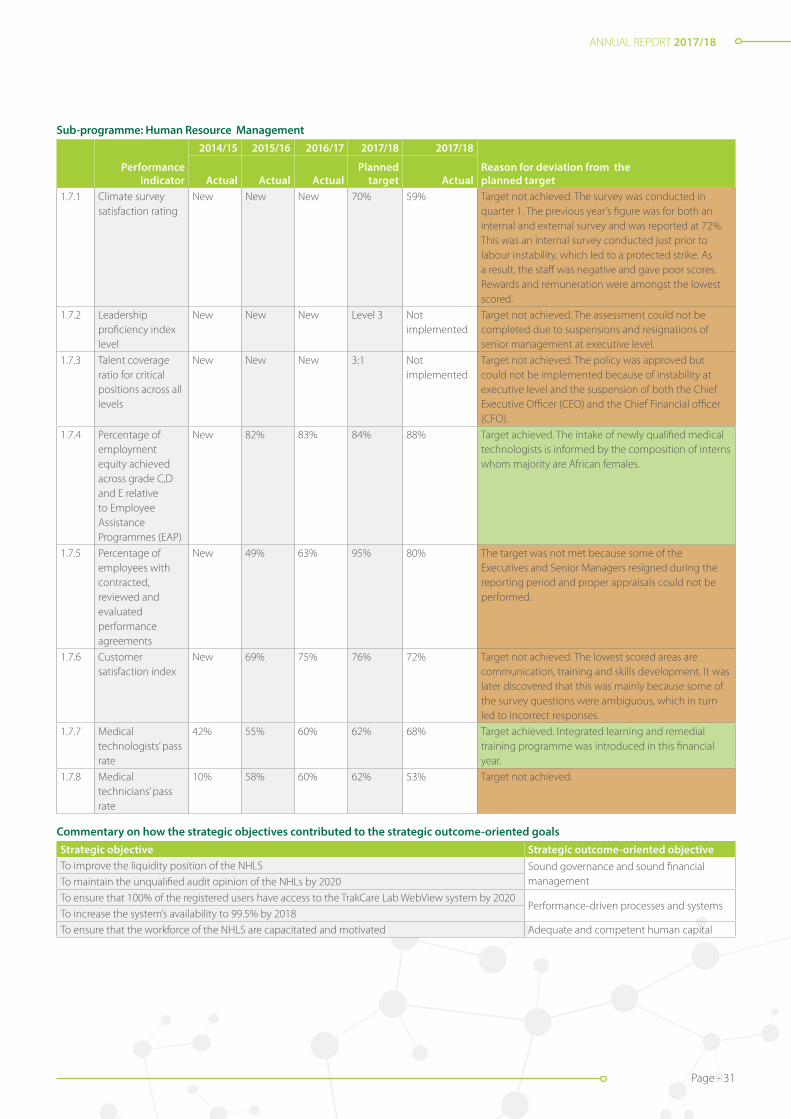
ANNUAL REPORT 2017/18
Page - 31
Sub-programme: Human Resource Management
Performance indicator
2014/15 2015/16 2016/17 2017/18 2017/18
Reason for deviation from the planned targetActual Actual Actual
Planned target Actual
1.7.1 Climate survey satisfaction rating
New New New 70% 59% Target not achieved. The survey was conducted in quarter 1. The previous year’s figure was for both an internal and external survey and was reported at 72%. This was an internal survey conducted just prior to labour instability, which led to a protected strike. As a result, the staff was negative and gave poor scores. Rewards and remuneration were amongst the lowest scored.
1.7.2 Leadership proficiency index level
New New New Level 3 Not implemented
Target not achieved. The assessment could not be completed due to suspensions and resignations of senior management at executive level.
1.7.3 Talent coverage ratio for critical positions across all levels
New New New 3:1 Not implemented
Target not achieved. The policy was approved but could not be implemented because of instability at executive level and the suspension of both the Chief Executive Officer (CEO) and the Chief Financial officer (CFO).
1.7.4 Percentage of employment equity achieved across grade C,D and E relative to Employee Assistance Programmes (EAP)
New 82% 83% 84% 88% Target achieved. The intake of newly qualified medical technologists is informed by the composition of interns whom majority are African females.
1.7.5 Percentage of employees with contracted, reviewed and evaluated performance agreements
New 49% 63% 95% 80% The target was not met because some of the Executives and Senior Managers resigned during the reporting period and proper appraisals could not be performed.
1.7.6 Customer satisfaction index
New 69% 75% 76% 72% Target not achieved. The lowest scored areas are communication, training and skills development. It was later discovered that this was mainly because some of the survey questions were ambiguous, which in turn led to incorrect responses.
1.7.7 Medical technologists’ pass rate
42% 55% 60% 62% 68% Target achieved. Integrated learning and remedial training programme was introduced in this financial year.
1.7.8 Medical technicians’ pass rate
10% 58% 60% 62% 53% Target not achieved.
Commentary on how the strategic objectives contributed to the strategic outcome-oriented goals Strategic objective Strategic outcome-oriented objectiveTo improve the liquidity position of the NHLS Sound governance and sound financial
managementTo maintain the unqualified audit opinion of the NHLs by 2020
To ensure that 100% of the registered users have access to the TrakCare Lab WebView system by 2020Performance-driven processes and systems
To increase the system’s availability to 99.5% by 2018
To ensure that the workforce of the NHLS are capacitated and motivated Adequate and competent human capital
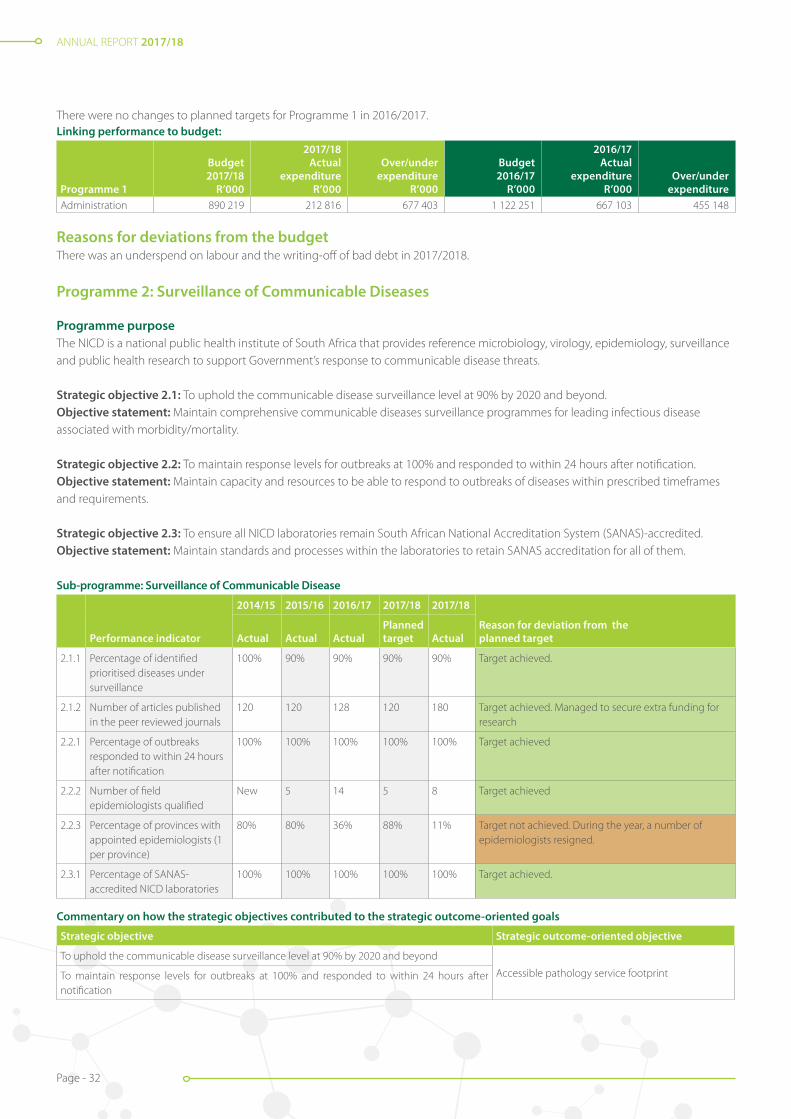
ANNUAL REPORT 2017/18
Page - 32
There were no changes to planned targets for Programme 1 in 2016/2017.Linking performance to budget:
Programme 1
Budget 2017/18
R’000
2017/18 Actual
expenditure R’000
Over/under expenditure
R’000
Budget 2016/17
R’000
2016/17 Actual
expenditure R’000
Over/under expenditure
Administration 890 219 212 816 677 403 1 122 251 667 103 455 148
Reasons for deviations from the budgetThere was an underspend on labour and the writing-off of bad debt in 2017/2018.
Programme 2: Surveillance of Communicable Diseases
Programme purposeThe NICD is a national public health institute of South Africa that provides reference microbiology, virology, epidemiology, surveillance and public health research to support Government’s response to communicable disease threats.
Strategic objective 2.1: To uphold the communicable disease surveillance level at 90% by 2020 and beyond. Objective statement: Maintain comprehensive communicable diseases surveillance programmes for leading infectious disease associated with morbidity/mortality.
Strategic objective 2.2: To maintain response levels for outbreaks at 100% and responded to within 24 hours after notification. Objective statement: Maintain capacity and resources to be able to respond to outbreaks of diseases within prescribed timeframes and requirements.
Strategic objective 2.3: To ensure all NICD laboratories remain South African National Accreditation System (SANAS)-accredited.Objective statement: Maintain standards and processes within the laboratories to retain SANAS accreditation for all of them.
Sub-programme: Surveillance of Communicable Disease
Performance indicator
2014/15 2015/16 2016/17 2017/18 2017/18
Reason for deviation from the planned targetActual Actual Actual
Planned target Actual
2.1.1 Percentage of identified prioritised diseases under surveillance
100% 90% 90% 90% 90% Target achieved.
2.1.2 Number of articles published in the peer reviewed journals
120 120 128 120 180 Target achieved. Managed to secure extra funding for research
2.2.1 Percentage of outbreaks responded to within 24 hours after notification
100% 100% 100% 100% 100% Target achieved
2.2.2 Number of field epidemiologists qualified
New 5 14 5 8 Target achieved
2.2.3 Percentage of provinces with appointed epidemiologists (1 per province)
80% 80% 36% 88% 11% Target not achieved. During the year, a number of epidemiologists resigned.
2.3.1 Percentage of SANAS-accredited NICD laboratories
100% 100% 100% 100% 100% Target achieved.
Commentary on how the strategic objectives contributed to the strategic outcome-oriented goals
Strategic objective Strategic outcome-oriented objective
To uphold the communicable disease surveillance level at 90% by 2020 and beyond
Accessible pathology service footprintTo maintain response levels for outbreaks at 100% and responded to within 24 hours after notification
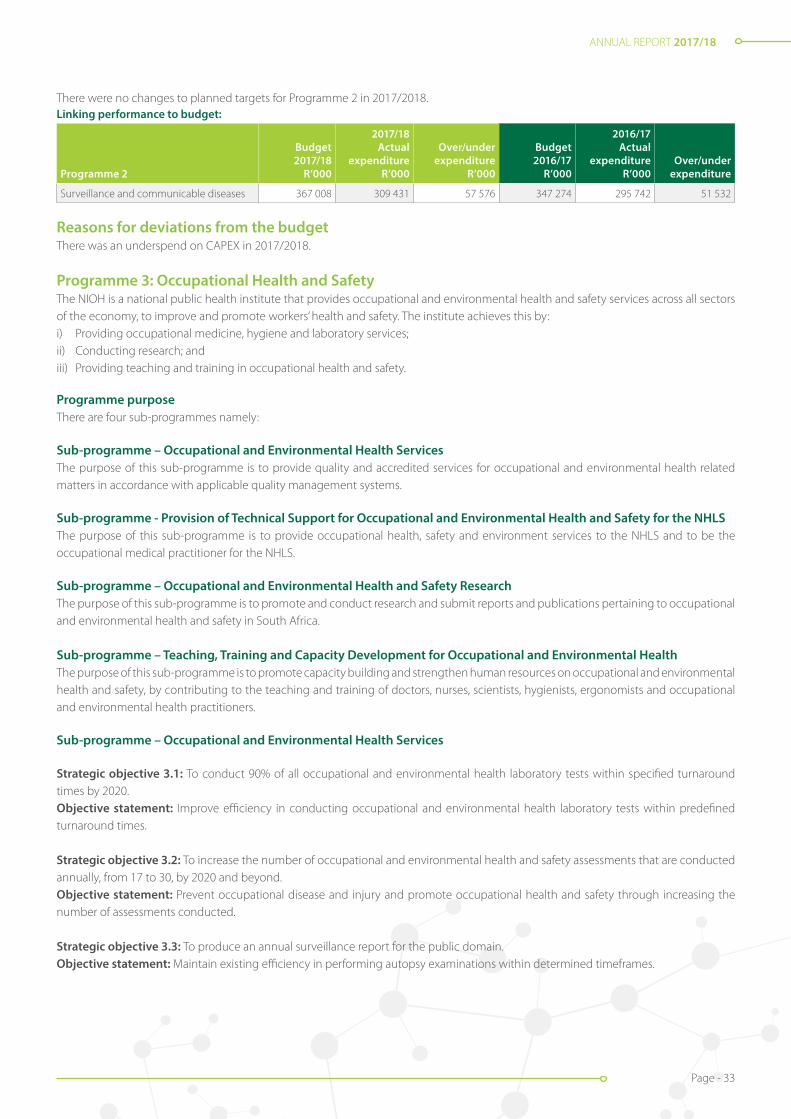
ANNUAL REPORT 2017/18
Page - 33
There were no changes to planned targets for Programme 2 in 2017/2018.Linking performance to budget:
Programme 2
Budget 2017/18
R’000
2017/18 Actual
expenditure R’000
Over/under expenditure
R’000
Budget 2016/17
R’000
2016/17 Actual
expenditure R’000
Over/under expenditure
Surveillance and communicable diseases 367 008 309 431 57 576 347 274 295 742 51 532
Reasons for deviations from the budgetThere was an underspend on CAPEX in 2017/2018.
Programme 3: Occupational Health and SafetyThe NIOH is a national public health institute that provides occupational and environmental health and safety services across all sectors of the economy, to improve and promote workers’ health and safety. The institute achieves this by:i) Providing occupational medicine, hygiene and laboratory services;ii) Conducting research; andiii) Providing teaching and training in occupational health and safety.
Programme purposeThere are four sub-programmes namely:
Sub-programme – Occupational and Environmental Health ServicesThe purpose of this sub-programme is to provide quality and accredited services for occupational and environmental health related matters in accordance with applicable quality management systems.
Sub-programme - Provision of Technical Support for Occupational and Environmental Health and Safety for the NHLS The purpose of this sub-programme is to provide occupational health, safety and environment services to the NHLS and to be the occupational medical practitioner for the NHLS.
Sub-programme – Occupational and Environmental Health and Safety ResearchThe purpose of this sub-programme is to promote and conduct research and submit reports and publications pertaining to occupational and environmental health and safety in South Africa.
Sub-programme – Teaching, Training and Capacity Development for Occupational and Environmental Health The purpose of this sub-programme is to promote capacity building and strengthen human resources on occupational and environmental health and safety, by contributing to the teaching and training of doctors, nurses, scientists, hygienists, ergonomists and occupational and environmental health practitioners.
Sub-programme – Occupational and Environmental Health Services
Strategic objective 3.1: To conduct 90% of all occupational and environmental health laboratory tests within specified turnaround times by 2020.Objective statement: Improve efficiency in conducting occupational and environmental health laboratory tests within predefined turnaround times.
Strategic objective 3.2: To increase the number of occupational and environmental health and safety assessments that are conducted annually, from 17 to 30, by 2020 and beyond.Objective statement: Prevent occupational disease and injury and promote occupational health and safety through increasing the number of assessments conducted.
Strategic objective 3.3: To produce an annual surveillance report for the public domain.Objective statement: Maintain existing efficiency in performing autopsy examinations within determined timeframes.

ANNUAL REPORT 2017/18
Page - 34
Sub-programme: Occupational and Environmental Health Services
Performance indicator
2014/15 2015/16 2016/17 2017/18 2017/18
Reason for deviation from the planned targetActual Actual Actual
Planned target Actual
3.1.1 Percentage of occupational and environ-mental health laboratory tests conducted within predefined turnaround time
New 77% 85% 85% 86% Target achieved. There was an improvement in the quality control processes because most laboratories had limited equipment breakdowns, are adequately staffed and could therefore efficiently meet their turnaround times.
3.2.1 Number of occupational and environmental health and safety assessments completed
New 17 22 25 29 Target achieved. The occupational hygiene section has an existing service level agreement (SLA) with the Department of Correctional Services (DCS) which increased the number of requested exposure assessments. The section also recruited two new occupational hygienists.
3.3.1 Number of surveillance reports produced
New New New 1 2 Target achieved. Routinely collected data over the past 15 years was documented in a report which will be produced annually
Sub-programme – Provision of Technical Support for Occupational and Environmental Health and Safety for the NHLS
Strategic objective 3.4: To improve occupational health services within the NHLS, by auditing 90% of targeted laboratories by 2020.Objective statement: Conduct audits on the NHLS Laboratories.
3.4 Sub-programme: Provision of Technical Support for Occupational and Environmental Health and Safety for the NHLS
Performance indicator
2014/15 2015/16 2016/17 2017/18 2017/18
Reason for deviation from the planned targetActual Actual ActualPlanned target Actual
3.4.1 Percentage of NHLS laboratories audited which had a compliance figure of below 95% in 2016/17
New New New 99% 98% Target not achieved. The annual target was 140 laboratories that were identified that needed to be audited in 2017/18. Out of these 140 laboratories only 137 laboratories were audited, because three other laboratories were closed down.
Sub-programme – Occupational and Environmental Health and Safety Research
Strategic objective 3.5: To increase research outputs and reports to 27 by 2020 to improve the surveillance of exposure to disease and to investigate the effect of new technologies for improved management, risk communication and prevention of occupational disease and injury. Objective statement: Promote and conduct research and submit reports and publications pertaining to occupational health in South Africa
Sub-programme: Occupational and Environmental Health and Safety Research
Performance indicator
2014/15 2015/16 2016/17 2017/18 2017/18
Reason for deviation from the planned targetActual Actual Actual
Planned target Actual
3.5.1 Number of articles published in the peer reviewed journals.
New 23 24 25 25 Target achieved.
Sub-programme – Teaching, Training and Capacity Development for Occupational and Environmental Health
Strategic objective 3.6: To maintain and increase occupational health and safety professionals trained on an annual basis.Objective statement: Promote capacity building of strengthened human resources on occupational and environmental health and safety by contributing to the teaching and training of doctors, nurses, scientists, hygienists, ergonomists and occupational health
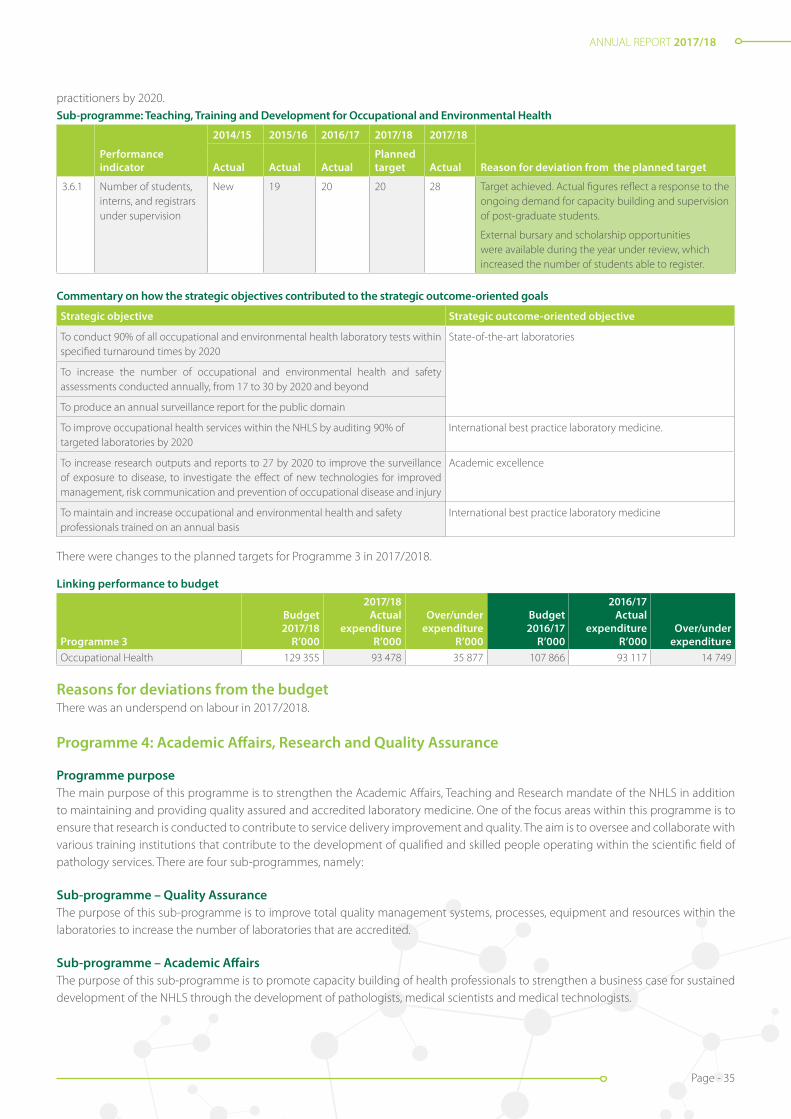
ANNUAL REPORT 2017/18
Page - 35
practitioners by 2020.Sub-programme: Teaching, Training and Development for Occupational and Environmental Health
Performance indicator
2014/15 2015/16 2016/17 2017/18 2017/18
Reason for deviation from the planned targetActual Actual ActualPlanned target Actual
3.6.1 Number of students, interns, and registrars under supervision
New 19 20 20 28 Target achieved. Actual figures reflect a response to the ongoing demand for capacity building and supervision of post-graduate students.
External bursary and scholarship opportunities were available during the year under review, which increased the number of students able to register.
Commentary on how the strategic objectives contributed to the strategic outcome-oriented goals
Strategic objective Strategic outcome-oriented objective
To conduct 90% of all occupational and environmental health laboratory tests within specified turnaround times by 2020
State-of-the-art laboratories
To increase the number of occupational and environmental health and safety assessments conducted annually, from 17 to 30 by 2020 and beyond
To produce an annual surveillance report for the public domain
To improve occupational health services within the NHLS by auditing 90% of targeted laboratories by 2020
International best practice laboratory medicine.
To increase research outputs and reports to 27 by 2020 to improve the surveillance of exposure to disease, to investigate the effect of new technologies for improved management, risk communication and prevention of occupational disease and injury
Academic excellence
To maintain and increase occupational and environmental health and safety professionals trained on an annual basis
International best practice laboratory medicine
There were changes to the planned targets for Programme 3 in 2017/2018.
Linking performance to budget
Programme 3
Budget 2017/18
R’000
2017/18 Actual
expenditure R’000
Over/under expenditure
R’000
Budget 2016/17
R’000
2016/17 Actual
expenditure R’000
Over/under expenditure
Occupational Health 129 355 93 478 35 877 107 866 93 117 14 749
Reasons for deviations from the budgetThere was an underspend on labour in 2017/2018.
Programme 4: Academic Affairs, Research and Quality Assurance
Programme purposeThe main purpose of this programme is to strengthen the Academic Affairs, Teaching and Research mandate of the NHLS in addition to maintaining and providing quality assured and accredited laboratory medicine. One of the focus areas within this programme is to ensure that research is conducted to contribute to service delivery improvement and quality. The aim is to oversee and collaborate with various training institutions that contribute to the development of qualified and skilled people operating within the scientific field of pathology services. There are four sub-programmes, namely:
Sub-programme – Quality AssuranceThe purpose of this sub-programme is to improve total quality management systems, processes, equipment and resources within the laboratories to increase the number of laboratories that are accredited.
Sub-programme – Academic AffairsThe purpose of this sub-programme is to promote capacity building of health professionals to strengthen a business case for sustained development of the NHLS through the development of pathologists, medical scientists and medical technologists.

ANNUAL REPORT 2017/18
Page - 36
Sub-programme – ResearchThe purpose of this sub-programme is to increase the knowledge base on diseases and influence the decisions taken to diagnose, treat and care for these diseases through research outputs and published articles.
Sub-programme – National CoverageThe purpose of this sub-programme is to ensure national coverage for NHLS pathologists to ensure adequate and relevant contribution to diagnostic laboratory services outside of the academic centres, access by and clinical interaction with clinicians outside academic centres and contribution to the improvement of service delivery across the NHLS platform.
Sub-programme – Quality Assurance
Strategic objective 4.1: To increase levels of quality tests performed within the laboratories by ensuring they are well equipped, resourced and maintained by 2020 and beyond.Objective statement: Improve total quality management systems, processes, equipment and resources within laboratories to increase the number of laboratories that are accredited.
Sub-programme: Quality Assurance
Performance indicator
2014/15 2015/16 2016/17 2017/18 2017/18
Reason for deviation from the planned targetActual Actual Actual
Planned target Actual
4.1.1 Percentage compliance achieved by laboratories during annual quality compliance audits
80% 81% 90% 83% 90% Target achieved. The quality assurance (QA) department introduced improvements in the quality management systems. More training was offered through the Strengthening Laboratory Management Through Accreditation (SLMTA) programme. Due to the implementation of standardised procedures in the NHLS, the majority of the laboratories complied.
4.1.2 Percentage of health technology assessment (HTA) project completed within 18 months
New New New 50% 62% Target achieved. The majority of the projects that were completed in less than 18 months, were upgrades. The HTA project prioritises upgrades to allow the laboratories to seamlessly transition to the new reagents and equipment. Following guidelines received from some expert committees, the upgrade period is shortened.
Sub-programme - Academic Affairs
Strategic objective 4.2: To increase the pool of available pathology health professionals by 2020.Objective statement: Promote capacity building of health professionals to strengthen a business case for sustained development of the NHLS through the development of pathologists, medical scientists and medical technologists.
Sub-programme: Academic Affairs
Performance indicator
2014/15 2015/16 2016/17 2017/18 2017/18
Reason for deviation from the planned targetActual Actual Actual
Planned target Actual
4.2.1 Number of registrars admitted per year
New New 243* 10 63 Target achieved. The registrar intake is dependent on the available training positions as per accreditation funded from the Health Professions Council of South Africa (HPCSA).
4.2.2 Medical scientist registration rate
New New New 25% 100% Target achieved. Medical scientist interns and their supervisors adhered to the HPCSA requirements such as submitting good quality portfolios on time.
* 2016/17 figure is actual number of all registrars on the training platform.
Sub-programme - Research
Strategic objective 4.3: To increase research outputs that translate into diagnostic practice to four by 2020. Strategic objective 4.4: To increase the number of articles published in peer reviewed journals to 653 by 2020.
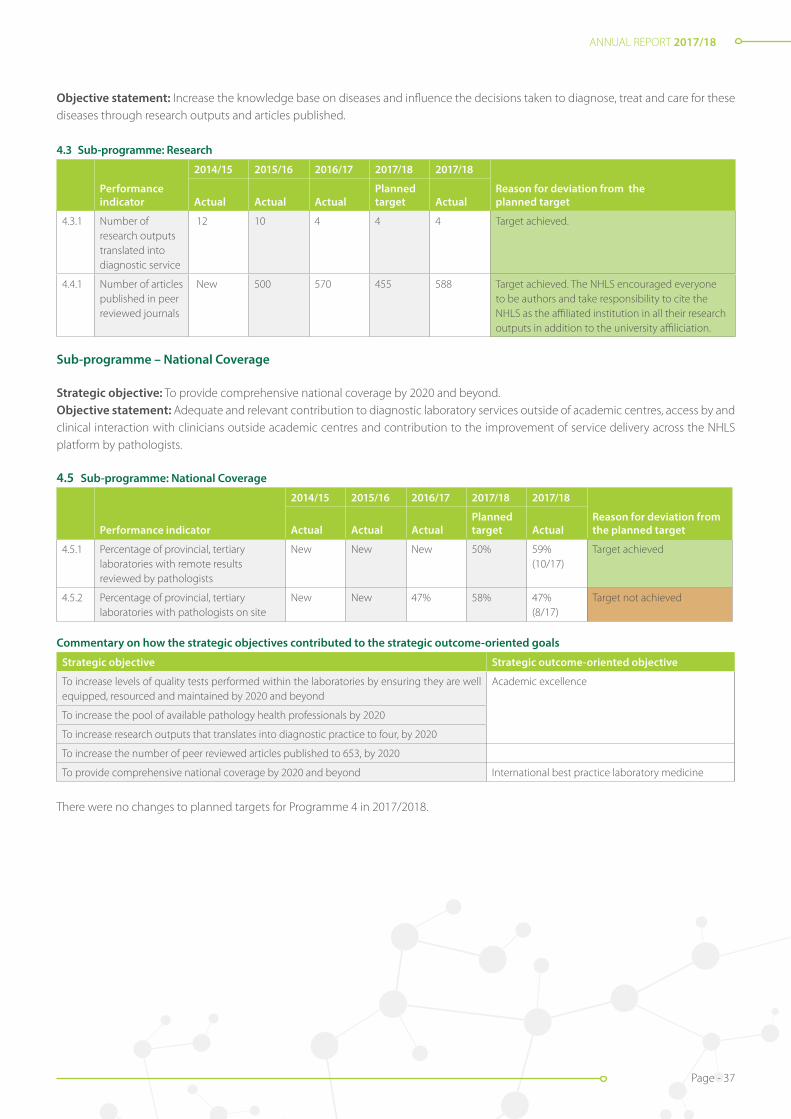
ANNUAL REPORT 2017/18
Page - 37
Objective statement: Increase the knowledge base on diseases and influence the decisions taken to diagnose, treat and care for these diseases through research outputs and articles published.
4.3 Sub-programme: Research
Performance indicator
2014/15 2015/16 2016/17 2017/18 2017/18
Reason for deviation from the planned targetActual Actual Actual
Planned target Actual
4.3.1 Number of research outputs translated into diagnostic service
12 10 4 4 4 Target achieved.
4.4.1 Number of articles published in peer reviewed journals
New 500 570 455 588 Target achieved. The NHLS encouraged everyone to be authors and take responsibility to cite the NHLS as the affiliated institution in all their research outputs in addition to the university affiliciation.
Sub-programme – National Coverage
Strategic objective: To provide comprehensive national coverage by 2020 and beyond.Objective statement: Adequate and relevant contribution to diagnostic laboratory services outside of academic centres, access by and clinical interaction with clinicians outside academic centres and contribution to the improvement of service delivery across the NHLS platform by pathologists.
4.5 Sub-programme: National Coverage
Performance indicator
2014/15 2015/16 2016/17 2017/18 2017/18
Reason for deviation from the planned targetActual Actual Actual
Planned target Actual
4.5.1 Percentage of provincial, tertiary laboratories with remote results reviewed by pathologists
New New New 50% 59% (10/17)
Target achieved
4.5.2 Percentage of provincial, tertiary laboratories with pathologists on site
New New 47% 58% 47% (8/17)
Target not achieved
Commentary on how the strategic objectives contributed to the strategic outcome-oriented goals
Strategic objective Strategic outcome-oriented objective
To increase levels of quality tests performed within the laboratories by ensuring they are well equipped, resourced and maintained by 2020 and beyond
Academic excellence
To increase the pool of available pathology health professionals by 2020
To increase research outputs that translates into diagnostic practice to four, by 2020
To increase the number of peer reviewed articles published to 653, by 2020
To provide comprehensive national coverage by 2020 and beyond International best practice laboratory medicine
There were no changes to planned targets for Programme 4 in 2017/2018.
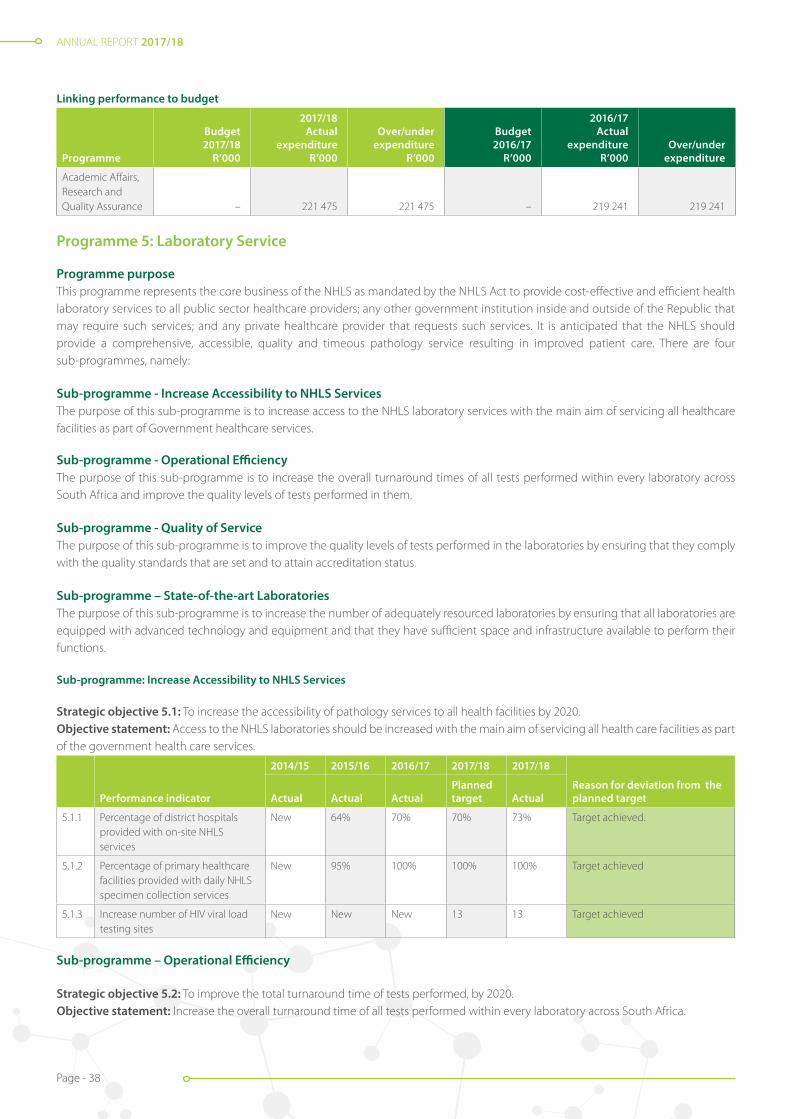
ANNUAL REPORT 2017/18
Page - 38
Linking performance to budget
Programme
Budget 2017/18
R’000
2017/18 Actual
expenditure R’000
Over/under expenditure
R’000
Budget 2016/17
R’000
2016/17 Actual
expenditure R’000
Over/under expenditure
Academic Affairs, Research and Quality Assurance – 221 475 221 475 – 219 241 219 241
Programme 5: Laboratory Service
Programme purposeThis programme represents the core business of the NHLS as mandated by the NHLS Act to provide cost-effective and efficient health laboratory services to all public sector healthcare providers; any other government institution inside and outside of the Republic that may require such services; and any private healthcare provider that requests such services. It is anticipated that the NHLS should provide a comprehensive, accessible, quality and timeous pathology service resulting in improved patient care. There are four sub-programmes, namely:
Sub-programme - Increase Accessibility to NHLS ServicesThe purpose of this sub-programme is to increase access to the NHLS laboratory services with the main aim of servicing all healthcare facilities as part of Government healthcare services.
Sub-programme - Operational EfficiencyThe purpose of this sub-programme is to increase the overall turnaround times of all tests performed within every laboratory across South Africa and improve the quality levels of tests performed in them.
Sub-programme - Quality of ServiceThe purpose of this sub-programme is to improve the quality levels of tests performed in the laboratories by ensuring that they comply with the quality standards that are set and to attain accreditation status.
Sub-programme – State-of-the-art LaboratoriesThe purpose of this sub-programme is to increase the number of adequately resourced laboratories by ensuring that all laboratories are equipped with advanced technology and equipment and that they have sufficient space and infrastructure available to perform their functions.
Sub-programme: Increase Accessibility to NHLS Services
Strategic objective 5.1: To increase the accessibility of pathology services to all health facilities by 2020.Objective statement: Access to the NHLS laboratories should be increased with the main aim of servicing all health care facilities as part of the government health care services.
Performance indicator
2014/15 2015/16 2016/17 2017/18 2017/18
Reason for deviation from the planned targetActual Actual Actual
Planned target Actual
5.1.1 Percentage of district hospitals provided with on-site NHLS services
New 64% 70% 70% 73% Target achieved.
5.1.2 Percentage of primary healthcare facilities provided with daily NHLS specimen collection services
New 95% 100% 100% 100% Target achieved
5.1.3 Increase number of HIV viral load testing sites
New New New 13 13 Target achieved
Sub-programme – Operational Efficiency
Strategic objective 5.2: To improve the total turnaround time of tests performed, by 2020.Objective statement: Increase the overall turnaround time of all tests performed within every laboratory across South Africa.

ANNUAL REPORT 2017/18
Page - 39
Strategic objective 5.3: To increase quality compliance of tests to 80%, by 2020.Objective statement: Improve the quality levels of tests performed in the laboratories.
Performance indicator
2014/15 2015/16 2016/17 2017/18 2017/18
Reason for deviation from the planned targetActual Actual Actual
Planned target Actual
5.2.1 Percentage TB microscopy tests performed within 40 hours
92% 91% 96% 95% 94% Target partially achieved.The turnaround times were negatively impacted by the following: • Breakdown of analysers; • Intermittent downtime of network which
affected the availability of the LIS.
5.2.2 Percentage TB GXP tests performed within 40 hours
New New 97% 95% 91%
5.2.3 Percentage CD4 tests performed within 40 hours
90% 89% 94% 85% 91% Target achieved
5.2.4 Percentage viral load tests performed within 96 hours
86% 64% 87% 75% 82% Target achieved
5.2.5 Percentage HIV PCR tests performed within 96 hours
82% 73% 82% 70% 77% Target achieved
5.2.6 Percentage cervical smear tests performed within 5 weeks
63% 48% 97% 70% 90% Target achieved
5.2.7 Percentage laboratory tests (FBC) performed within 8 hours
New New 80% 90% 94% Target achieved
5.2.8 Percentage laboratory tests (UandE) performed within 8 hours
New New 80% 90% 91% Target achieved
5.2.9 Percentage laboratory tests (LFT) performed within 8 hours
New New New 90% 91% Target achieved
Sub-programme – Quality of Service
Strategic objective 5.4: To increase the percentage of SANAS-accredited regional laboratories to 60%, by 2020.Objective statement: Improve quality levels of tests performed in the laboratories by ensuring that they comply with the quality standards that are set and attain accreditation status.
Sub-programme: Quality of Service
Performance indicator
2014/15 2015/16 2016/17 2017/18 2017/18
Reason for deviation from the planned targetActual Actual Actual
Planned target Actual
5.3.1 Percentage of national central laboratories that are SANAS-accredited
91% 86% 90% 95% 92% Target not achieved. The preparation for accreditation is quite a lengthy process with multiple pre-audits and NHLS is in the process of reviewing this process with the aim of shortening it.
5.3.2 Percentage of provincial tertiary laboratories that are SANAS-accredited
41% 52% 47% 70% 71% Target achieved
5.3.3 Percentage of regional laboratories that are SANAS-accredited
21% 37% 11% 40% 27% Target not achieved. The preparation for accreditation is quite a lengthy process with multiple pre-audits and NHLS is in the process of reviewing this process with the aim of shortening it. The number and availability of auditors was also a challenge. The strategy is to train more and increase the pool of auditor.

ANNUAL REPORT 2017/18
Page - 40
Performance indicator
2014/15 2015/16 2016/17 2017/18 2017/18
Reason for deviation from the planned targetActual Actual Actual
Planned target Actual
5.3.4 Percentage of district laboratories that are SANAS-accredited
New New New 5% 3% Target not achieved. The preparation for accreditation is quite a lengthy process with multiple pre-audits and NHLS is in the process of reviewing this process with the aim of shortening it. The number and availability of auditors was also a challenge. The strategy is to train more and increase the pool of auditors
5.3.5 Percentage of laboratories achieving proficiency testing scheme performance standards of 80%
New 80% New 82% 92% Target achieved. The NHLS introduced improvements in the Quality Management Systems. More training was offered through the SLMTA programme. The implementation of standardised procedures within the NHLS, resulted in the majority of laboratories complying.
Sub-programme – State-of-the-art Laboratories
Strategic objective 5.5: To increase the percentage of adequately resourced laboratories to at least 90%, by 2020.Strategic objective 5.6: To ensure that 90% of capital budgets are spent to improve the quality of laboratories in South Africa.Objective statement: Increase the numbers of adequately resourced laboratories by ensuring all of them are equipped with advanced technology and equipment and that they have sufficient space and infrastructure available to perform their functions.
Sub-programme: State-of-the-art Laboratories
Performance indicator
2014/15 2015/16 2016/17 2017/18 2017/18
Reason for deviation from the planned targetActual Actual Actual
Planned target Actual
5.5.1 Percentage of provincial tertiary laboratories with pre-analytical automation
New New 6% 40% 17.6% (3/17)
Target not achieved. There was a delay inawarding of tenders
5.5.2 Percentage of building, repair and maintenance projects completed
New New 101% 90% 100% (72/72)
Target achieved.
Commentary on how the strategic objectives contributed to the strategic outcome-oriented goals
Strategic objective Strategic outcome-oriented objective
To increase the accessibility of pathology services to all health facilities by 2020 and beyond Accessible pathology service footprint
To continuously improve the total turnaround time of tests performedInternational best practice laboratory medicine
To increase the percentage of SANAS-accredited laboratories in the NHLS
To increase the percentage of adequately resourced laboratories to at least 90%, by 2020 Performance-driven processes and systems
There were changes to the planned targets for Programme 5 in 2017/2018.
Linking performance to budget
Programme 5
Budget 2017/18
R’000
2017/18 Actual
expenditure R’000
Over/under expenditure
R’000
Budget 2016/17
R’000
2016/17 Actual
expenditure R’000
Over/under expenditure
Laboratory Services 6 080 474 5 928 534 151 940 5 232 459 5 675 692 -443 233

ANNUAL REPORT 2017/18
Page - 41
Reasons for deviations from the budgetThere was an under spent on labour in 2017/2018. The underspending on labour was mainly due to cash flow management.
Linkage to budget for all programmes
ProgrammeBudget 2017/18
Actual expenditure
2017/18Over/under
expenditure Comments Budget 2016/17
Actual expenditure
2016/17Over/under
expenditure Comments R’000 R’000 R’000 R’000 R’000 R’000 R’000 R’000
Administration 890 219 212 816 677 403 Underspent on labour and bad debt write-off
1 122 251 667 103 455 148 Underspent due cash flow constraint (Infrastructure enhancement)
Surveillance and Communicable Diseases
367 008 309 431 57 576 Underspent on Capital Expenditure
347 274 295 742 51 532 Underspent on direct labour
Occupational Health
129 355 93 478 35 877 Underspent on Labour
107 866 93 117 14 749 Underspent because vacancies which were budgeted for were not filled, as well as operating expenses
Academic Affairs. Research and QA
– 221 475 -221 475 – 219 241 -219 241
Laboratory Services 6 080 474 5 928 534 151 940 Underspent on Labour
5 232 459 5 675 692 -443 233 Overspent on direct labour and direct material
7 467 056 6 765 735 701 321 6 809 850 6 950 895 -141 045
ANNUAL REPORT 2017/18
Page - 42
INFORMATION TECHNOLOGY
The aim of the NHLS Information Technology (IT) is to build a strong IT foundation based on robust and agile infrastructure with core laboratory and enterprise capabilities and innovative solutions to help build state-of-the-art laboratory services. As a subscription member of Gartner, the NHLS maximised its membership benefits by getting expert advice from analysts and accessing cutting edge research, which assisted in identifying gaps and strengthening capabilities. The Gartner research assisted with the development of the IT Governance Framework and Project Management Framework which have been implemented.
The IT strategy formulation process was initiated later in the year and the aim is to have an approved IT strategy which is fully aligned to the NHLS business objectives in the 2018/19 financial year. The ability to recruit and retain the required skills remains a significant challenge. The plan is to prioritise and review key roles and redesign the IT operating model in line with the IT strategy to ensure that IT continues to be a strategic business enabler.
Data and Insights
Corporate Data Warehouse (CDW) is a national investment from which the following emerged: the ability to produce business intelligence reports, disease surveillance, dashboards for monitoring service delivery and dashboards for monitoring priority diseases such as HIV and TB. An upgrade of the IBM Netezza Data Warehouse Appliance, which is the ‘engine’ of the CDW was implemented. This led to improved user experience, stability and additional capacity to manage the ever increasing data volumes. An upgrade of the Thusano integrated Billing Portal was also implemented. The Thusano portal provides invaluable insights on daily and monthly billing for the Department of Health (DoH) and also enables the various Provincial Departments of Health to monitor their laboratory costs and test volumes.
Laboratory Information System (LIS)
The NHLS, on the request of the DoH, implemented measures to reduce the inappropriate requesting and repeat of laboratory tests in the form of Electronic Gate Keeping (eGK). eGK promotes the rational use of laboratory services. A set of rules were configured on the Laboratory Information System (LIS) against which test requests are evaluated and rejected if the rules are not met. These rules are the culmination of significant work executed by the NHLS Expert Chair Committees (ECCs), which included appropriate engagement with all stakeholders to ultimately define best pathology practice. Standardised eGK rules were implemented successfully across most provinces in October 2017, and implementation in the Northern Cape and Free State was completed in March 2018.
A joint pilot project with the Centre for Scientific and Industrial Research (CSIR) and the DoH was implemented to support the rollout of the patient unique identifier. The aim of the project is to enable effective management of patients’ demographic data and ensure efficient and quality patient care. The ability to electronically access laboratory test results is being improved with additional channels of access via direct interfaces to systems i.e. the Meditech Hospital Information System in KwaZulu-Natal and Tier.Net. Direct access of test results via the Web continues to increase month-on-month. A TrakCare LIS upgrade project to migrate to the latest system version which has improved user friendly functionalities was initiated, and is expected to be rolled out across all sites in the third quarter of the 2018/19 financial year.
Infrastructure Modernisation and Digitisation
Network infrastructure and connectivity remain a challenge and projects aiming at upgrading the infrastructure and replacing old and obsolete equipment were prioritised. Local Area Network (LAN) upgrade project was initiated in December 2017 to refresh the following sites: Sandringham, Braamfontein, Chris Hani Baragwanath Hospital and Charlotte Maxeke Johannesburg Academic Hospital.
In an effort to address network connectivity challenges and increase network bandwidth at various laboratories across the country, the NHLS approached the Meraka Institute of the CSIR in February 2018 to request for participation in their South African National Research Network (SANReN). Desktop Operating Systems and Email were upgraded to Windows 10 and Exchange 2013 respectively. A number of business modernisation projects aimed at digitising and transforming the NHLS into an intelligent organisation have been identified and will be implemented in the 2018/19 financial year.
Acting Chief Information Officer: Letlhogonolo Tlhako(Appointed 1 June 2018)
Business Unit Performance
ANNUAL REPORT 2017/18
Page - 43
COMMUNICATIONS, MARKETING AND PUBLIC RELATIONS
Communication is an important and strategic function in any organisation, particularly for an organisation that offers such a critical function to the public such as the NHLS. It is an essential value chain in organisational reputation management, and needs to be executed in a co-ordinated fashion.
This function, however, is subject to the prevailing circumstances within the organisation. The period under review was challenging for the NHLS and ultimately this was reflected in the Communication, Marketing and Public Relations Unit. Nonetheless, the Unit managed to pull through despite these challenges
Internal Communication
The Unit continued to support the management of the organisation in improving the culture of internal communication within the organisation. This was achieved through dissemination of the bi-monthly newsletter and other internal tools such as newsflashes and communiqués. This was to ensure that all executive decisions and other important organisational information was communicated timeously to employees.
Senior Manager: Communications, Marketing and Public Relations Tebogo Seate
The intranet remains an internal repository of important information for employees, but has not been utilised optimally to improve internal communication due to the ageing Information Technology infrastructure. Going forward, the Unit will be working closely with the NHLS ICT Department to revamp this important tool and introduce more functionalities to make it more effective and efficient as an integral part of the internal communication mix.
Publications and other marketing collateral
The Unit project-managed the production of the NHLS 2017 Annual Report and submitted to Parliament on time as prescribed by Treasury regulations. In addition, the Communications team also project-managed the production of three other annual publications, namely: NICD, NIOH and AARQA Annual Reviews. The unit also continued to produce other marketing collateral such as promotional material and brochures as per the need of the organisation.
Events management
Events management is also a responsibility of the Unit, aimed at increasing NHLS brand visibility but also to cement relations with key stakeholders. During the year under review, the Unit participated in the following industry events:
Laboratory Medicine Congress in Durban 19-21 May 2017The Laboratory Medicine Congress (LMC) was held in Durban from 19-21 May 2017. It is a premier event hosted by Society of Medical Laboratory Technology of South Africa (SMLTSA), KwaZulu-Natal Branch. The LMC 2017 served as a fundamental platform for all practitioners involved in the field of Clinical Laboratory Medicine, to share the most up-to date developments in laboratory medicine, research results and accomplishments in their related disciplines. This congress brought together key professionals and experts involved in laboratory medicine such as Medical technologists, technicians, assistants, phlebotomists, students, medical scientists, pathologists and other medical laboratory personnel.
HEAIDS conference in Durban 9-11 June 2017The NHLS also participated in the Higher Education and Training HIV/AIDS Programme (HEAIDS) Youth Conference which was held from 9 - 11 June 2017 in Durban. The conference brought together a wide range of delegates, including youth from schools, TVET colleges, universities, communities from across all provinces within South Africa. The main aim of the Conference was to enable delegates to interact and share emerging best practices on HIV, STIs, TB general health and wellness issues as they are cross cutting to the achievement of South Africa’s core educational outcomes. The NHLS participated in the Conference as a key strategic partner of government in the fight against HIV / AIDS, especially among young people at institutions of higher learning.
ANNUAL REPORT 2017/18
Page - 44
8TH SA AIDS Conference The 8th SA AIDS Conference was held in Durban from 13 to 15 June 2017, under the theme “The Long Walk to Prevention: Every Voice Counts”. The purpose of the Conference was to discuss all issues related to the fight against the Aids pandemic. The Conference was attended by over 2000 delegates, 200 speakers, 400 poster presentations and 70 exhibitors. This was a remarkable gathering of people who shared their voices and committed to keep fighting the long walk to HIV prevention in South Africa. The NHLS professionals participated meaningfully in the conference as speakers, chairs of sessions, poster presenters and exhibitors.
NHLS Pathred Congress 2017In addition to the above external industry events, the Unit supported the NHLS Pathred Congress, which was held from 22–24 June 2017 in Johannesburg under the theme “The Drive to Innovation and Laboratory Excellence”. The Congress was organized in collaboration with the Federation of South African Societies of Pathology (FSASP). It was attended by diverse NHLS research scientists and healthcare professionals working in different pathology disciplines and other health science research initiatives. The programme incorporated Key Note Presentations, Satellite Sessions, Oral and Poster Presentations, and Exhibitions.
Media relations
There are two key events during the year that triggered increased media coverage of the NHLS and its subsidiary the NICD which were both handled by the Communication Unit, namely: the NHLS industrial action that took place in July 2017 and the outbreak of listeriosis that was announced by the Minister of Health in December 2017.
The strike was widely covered in all the media, which lasted for approximately two weeks. The role of the Unit was to ensure accurate reporting in the media as events unfolded, by ensuring that all media queries were timeously responded to and requests for interviews were managed properly.
The listeriosis outbreak is the major event that the Unit had to manage during the period under review. Soon after the outbreak was announced in December, there was a massive interest by the media in covering the event – both national and international media. As a result of the above two events, the Unit issued 12 media statements, facilitated 87 media interviews and handled 77 queries. Advertising Value Equivalency (AVE) achieved was 18 578 467 from a clip count of 417, reaching an audience of 65 550 126 in the process.
Other work of the NHLS continued to feature in specialist media, particularly DNA Testing and Genetic Ancestry.
Other services
Other services offered by the Unit to the organisation included the following:
Provision of photographic services and maintaining an image library: During the year under review, the Unit took, processed and stored 2042 photographic images.
Provision of graphic design servicesThe Unit is responsible for all creative work done within the NHLS, as well as maintaining the organisation’s corporate identity. During the period under review, Communication produced 148 pieces of creative work for various stakeholders in the organisation. A process was also started to revamp and refresh the organisation’s Corporate Identity Manual, which will be finalised in the new year.
Internal Climate SurveyDuring the year, an Internal Climate Survey was conducted, which was project-managed by Communications but owned and managed by the Human Resource Department. The purpose of the survey was to enable the leadership of the organisation to make an honest assessment of how employees felt about the working environment and how things were being done within the organisation. The results thereof will be used to identify areas of improvement in order to transform the NHLS into the best organisation to work for.

ANNUAL REPORT 2017/18
Page - 45
Handling of customer queries and complaintsThe Unit also handles a number of external customer complaints and queries on a daily basis, mostly via the NHLS enquiries mailbox and telephonically. Majority of them are forwarded to the relevant departments for action, but traction is still a problem. The solution going forward is to implement a Customer Relations Management (CRM) system, which will ensure proper management and monitoring of how speedily the NHLS responds to customer queries and complaints, as failure to do so may result in reputational damage for the organisation.
Web management servicesThe Unit has a dedicated website content manager, who is responsible for the look and feel of all NHLS websites, including the intranet, as well as uploading relevant information. During the year under review, usage of the internet was as follows:
Internet usage
Year Unique visitors Number of visitors Pages Hits
2016-2017 526 483 909 917 6 000 501 36 191 282
2017-2018 357 077 584 156 6 668 080 20 317 364
Difference 169 406 325 761 -667 579 15 873 918
Percentage 47.40% 55.80% -10% 78.10%
Intranet usage
Year Unique visitors Number of visitors Pages Hits
2016-2017 86 560 1 442 228 177 517 175 386 959 820
2017-2018 86 190 1 454 214 191 060 021 358 970 135
Difference -370 11 986 13 542 846 -27 989 685
Percentage -0.43% 0.8% 7.1% -7.8%
A project is currently underway to revamp and refresh the NHLS website, which is scheduled to be finalised in the new year.
Conclusion
In conclusion, more needs to be done to enable the NHLS to communicate more effectively with its various stakeholders, both internally and externally. This entails a more engaging approach to employee communication, a more proactive media engagement strategy, a centrally co-ordinated stakeholder engagement and communication approach, and a robust educational and awareness campaign, to tell good stories about the NHLS.
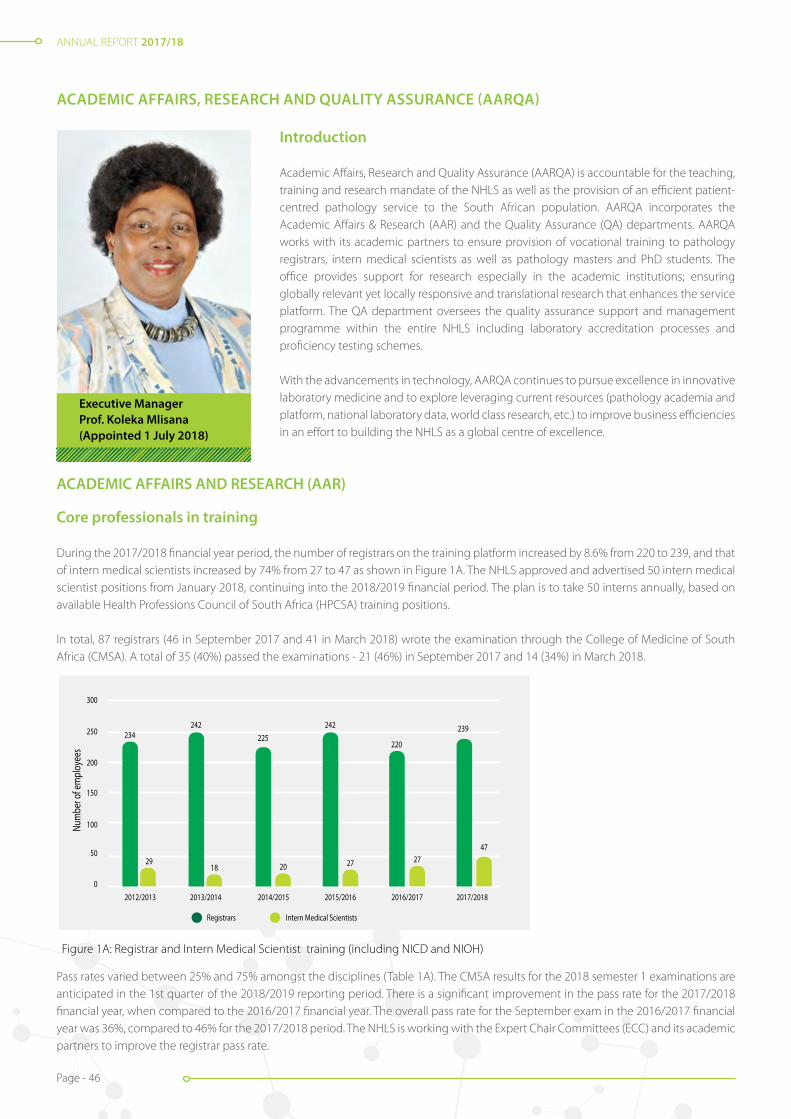
ANNUAL REPORT 2017/18
Page - 46
ACADEMIC AFFAIRS, RESEARCH AND QUALITY ASSURANCE (AARQA)
Executive Manager Prof. Koleka Mlisana(Appointed 1 July 2018)
Introduction
Academic Affairs, Research and Quality Assurance (AARQA) is accountable for the teaching, training and research mandate of the NHLS as well as the provision of an efficient patient-centred pathology service to the South African population. AARQA incorporates the Academic Affairs & Research (AAR) and the Quality Assurance (QA) departments. AARQA works with its academic partners to ensure provision of vocational training to pathology registrars, intern medical scientists as well as pathology masters and PhD students. The office provides support for research especially in the academic institutions; ensuring globally relevant yet locally responsive and translational research that enhances the service platform. The QA department oversees the quality assurance support and management programme within the entire NHLS including laboratory accreditation processes and proficiency testing schemes.
With the advancements in technology, AARQA continues to pursue excellence in innovative laboratory medicine and to explore leveraging current resources (pathology academia and platform, national laboratory data, world class research, etc.) to improve business efficiencies in an effort to building the NHLS as a global centre of excellence.
Figure 1A: Registrar and Intern Medical Scientist training (including NICD and NIOH)
2012/2013
Num
ber o
f em
ploy
ees
Registrar and Medical Scientist Interns300
250
200
150
100
50
02013/2014 2014/2015 2015/2016 2016/2017 2017/2018
234 225220
29 27 2747
242 242 239
18 20
Registrars Intern Medical Scientists
ACADEMIC AFFAIRS AND RESEARCH (AAR)
Core professionals in training
During the 2017/2018 financial year period, the number of registrars on the training platform increased by 8.6% from 220 to 239, and that of intern medical scientists increased by 74% from 27 to 47 as shown in Figure 1A. The NHLS approved and advertised 50 intern medical scientist positions from January 2018, continuing into the 2018/2019 financial period. The plan is to take 50 interns annually, based on available Health Professions Council of South Africa (HPCSA) training positions.
In total, 87 registrars (46 in September 2017 and 41 in March 2018) wrote the examination through the College of Medicine of South Africa (CMSA). A total of 35 (40%) passed the examinations - 21 (46%) in September 2017 and 14 (34%) in March 2018.
Pass rates varied between 25% and 75% amongst the disciplines (Table 1A). The CMSA results for the 2018 semester 1 examinations are anticipated in the 1st quarter of the 2018/2019 reporting period. There is a significant improvement in the pass rate for the 2017/2018 financial year, when compared to the 2016/2017 financial year. The overall pass rate for the September exam in the 2016/2017 financial year was 36%, compared to 46% for the 2017/2018 period. The NHLS is working with the Expert Chair Committees (ECC) and its academic partners to improve the registrar pass rate.

ANNUAL REPORT 2017/18
Page - 47
A total of 818 core pathology workers and trainees are included on the NHLS platforms including the NICD and NIOH. 75% (614) of the professionals and trainees are placed in NHLS service and academic platforms (excluding the NIOH and NICD).
The majority are Whites (41%), followed by Africans (35%), Indians (19%), Coloureds (4%) and Chinese (0.5%) (Table 1B). Table 1C shows the distribution of employees based on discipline and the majority (25%) are in the anatomical pathology discipline.
Table 1B: NHLS researchers by race, gender and occupational category (excluding NICD and NIOH staff)
Occupational category African Chinese Coloured Indian White Grand
total
F M All F M All F M All F M All F M All
Medical scientist 25 5 30 0 0 0 4 3 7 14 10 24 41 15 56 117
Intern medical scientist
18 9 27 0 0 0 1 1 2 1 1 6 1 7 37
Pathologist 46 10 56 1 1 2 5 7 45 14 59 63 38 101 224
Registrar 70 32 102 1 1 2 6 3 9 27 8 35 51 37 88 236
Grand total 159 56 215 2 1 3 13 12 25 86 33 119 161 91 252 614
Figure 1B: Intern Medical Scientists who completed training for the 2017/2018 financial year
ClinicalBiochemistry
HaematologyHuman
GeneticsMedical
MicrobiologyMolecular
Biology Virology
Total 4 1 2 6 2 2
Percentage 24% 6% 12% 35% 12% 12%
0
1
2
3
4
5
6
7
Num
ber o
f Em
ploy
ees
Intern Medical Scientists who completed training for 2017/18 Financial Year
Table 1A: Registrars who wrote the CMSA exam: 2016/2017 and 2017/2018 financial yearsOverall Pass Rate 2017/2018 Financial Year
2016/17 2017/18
Discipline Failed Passed Grand TotalPass Percentage Failed Passed Grand Total
Pass Percentage
Anatomical Pathology 8 7 15 47% 22 11 33 33%
Chemical Pathology 2 0 2 0% 6 2 8 25%
Clinical Pathology 2 1 3 33% 1 3 4 75%
Haematology 5 2 7 29% 10 5 15 33%
Medical Microbiology 6 4 10 40% 9 8 17 47%
Medical Virology 2 0 2 0% 4 6 10 60%
Grand Total 25 14 39 36% 52 35 87 40%
Over the period, 17 intern medical scientists successfully submitted their training portfolios and achieved full registration with the HPCSA as medical scientists in the following disciplines: medical microbiology (6), clinical biochemistry (4), human genetics (2), molecular biology (2), virology (2) and haematology (1) (Figure 1b). The newly qualified medical scientists according to race were: Africans 11 (65%); Whites 3 (18%); Indians 2 (12%); and Coloureds 1 (6%).
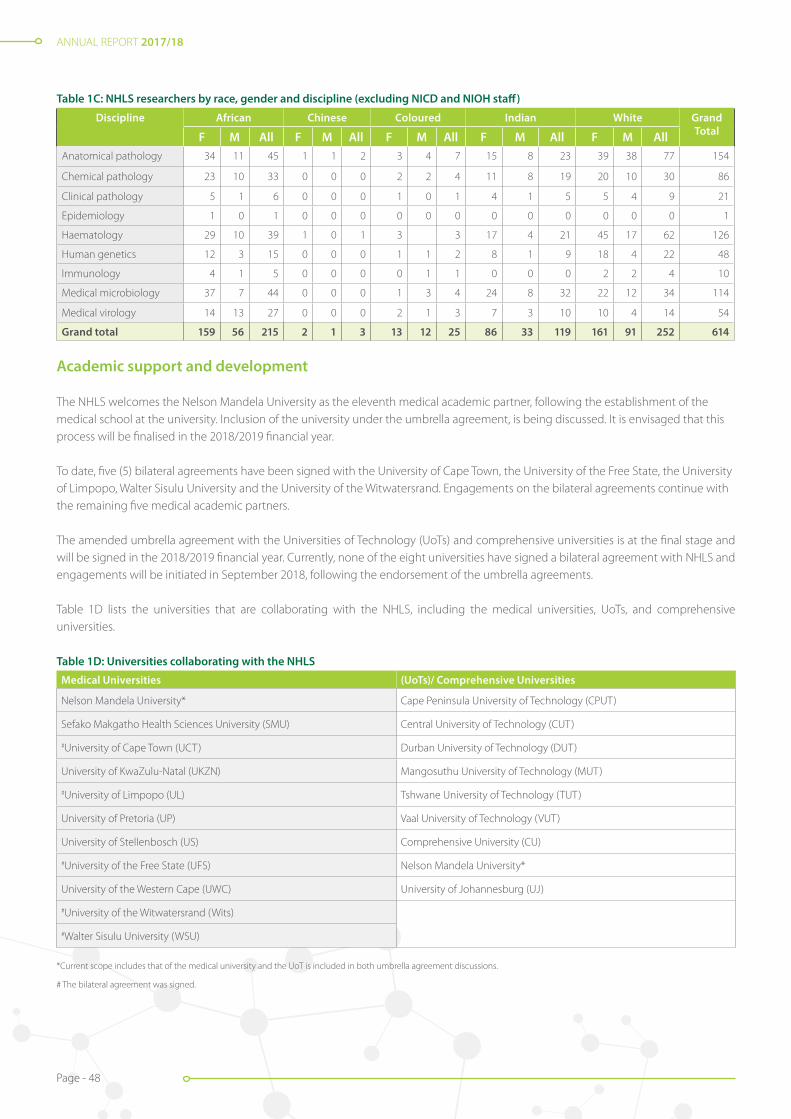
ANNUAL REPORT 2017/18
Page - 48
Table 1C: NHLS researchers by race, gender and discipline (excluding NICD and NIOH staff)
Discipline African Chinese Coloured Indian White Grand TotalF M All F M All F M All F M All F M All
Anatomical pathology 34 11 45 1 1 2 3 4 7 15 8 23 39 38 77 154
Chemical pathology 23 10 33 0 0 0 2 2 4 11 8 19 20 10 30 86
Clinical pathology 5 1 6 0 0 0 1 0 1 4 1 5 5 4 9 21
Epidemiology 1 0 1 0 0 0 0 0 0 0 0 0 0 0 0 1
Haematology 29 10 39 1 0 1 3 3 17 4 21 45 17 62 126
Human genetics 12 3 15 0 0 0 1 1 2 8 1 9 18 4 22 48
Immunology 4 1 5 0 0 0 0 1 1 0 0 0 2 2 4 10
Medical microbiology 37 7 44 0 0 0 1 3 4 24 8 32 22 12 34 114
Medical virology 14 13 27 0 0 0 2 1 3 7 3 10 10 4 14 54
Grand total 159 56 215 2 1 3 13 12 25 86 33 119 161 91 252 614
Academic support and development
The NHLS welcomes the Nelson Mandela University as the eleventh medical academic partner, following the establishment of the medical school at the university. Inclusion of the university under the umbrella agreement, is being discussed. It is envisaged that this process will be finalised in the 2018/2019 financial year.
To date, five (5) bilateral agreements have been signed with the University of Cape Town, the University of the Free State, the University of Limpopo, Walter Sisulu University and the University of the Witwatersrand. Engagements on the bilateral agreements continue with the remaining five medical academic partners.
The amended umbrella agreement with the Universities of Technology (UoTs) and comprehensive universities is at the final stage and will be signed in the 2018/2019 financial year. Currently, none of the eight universities have signed a bilateral agreement with NHLS and engagements will be initiated in September 2018, following the endorsement of the umbrella agreements.
Table 1D lists the universities that are collaborating with the NHLS, including the medical universities, UoTs, and comprehensive universities.
Table 1D: Universities collaborating with the NHLS
Medical Universities (UoTs)/ Comprehensive Universities
Nelson Mandela University* Cape Peninsula University of Technology (CPUT)
Sefako Makgatho Health Sciences University (SMU) Central University of Technology (CUT)
#University of Cape Town (UCT) Durban University of Technology (DUT)
University of KwaZulu-Natal (UKZN) Mangosuthu University of Technology (MUT)
#University of Limpopo (UL) Tshwane University of Technology (TUT)
University of Pretoria (UP) Vaal University of Technology (VUT)
University of Stellenbosch (US) Comprehensive University (CU)
#University of the Free State (UFS) Nelson Mandela University*
University of the Western Cape (UWC) University of Johannesburg (UJ)
#University of the Witwatersrand (Wits)
#Walter Sisulu University (WSU)
*Current scope includes that of the medical university and the UoT is included in both umbrella agreement discussions.
# The bilateral agreement was signed.
ANNUAL REPORT 2017/18
Page - 49
Research compliance management
The NHLS’ drive to support research and implement process that will encourage compliance and development is shown by the implementation of the intellectual Property Policy and Research Conflict of Interest Policy. Following the classification of the NHLS as a Schedule 1 Institution, the organization has started reporting to the National Intellectual Property Management Office (NIPMO), in terms of the Intellectual Property Rights (IPR) Act.
Plans for 2018/2019
It is envisaged that the focus will also to strengthen and promote understanding of research compliance including to promote understanding of the Protection of Personal Information (POPI) Act and implement appropriate policies, guidelines and measures to encourage and promote compliance. The process to establish the NHLS Office of Technology Transfer (OTT) will also be initiated.
In order to improve the coordination and management of research activities better, the NHLS developed a web-based application system, namely the Academic Affairs, Research and Management System (AARMS), that will allow the NHLS to execute its support for its research, teaching and training mandate efficiently and effectively.
The AARMS is an online management system utilised to ensure the efficient submission, review, management, monitoring and evaluation of research, scientific and training-related applications and output by NHLS staff, the academic community, and stakeholders.
The AARMS will minimise manual interventions, improve compliance and turnaround times and provide effective management of research, scientific and training activities, and dissemination of information and reporting. Internal and external stakeholders should furthermore be able to submit requests through the system.
The system was piloted and internal user acceptance testing was approved in this financial period. External piloting is planned for the first quarter of the 2018/2019 financial year. Phase one of the AARMS was deployed to the live environment and its logo is readily available for installation on the intranet. The Academic Affairs and Research Office is embarking on the development of phase two of the system, which will add more features on the AARMS.
Research Development and Training Mentorship Programme
The Academic Affairs Research and Quality Assurance (AARQA) in conjunction with the Research Development Committee (RDC) embarked on the establishment of the Research Development Training and Mentorship Programme (RDTMP). The RDTMP aims to engage private partners to work in close collaboration with the NHLS in supporting skills development and capacity building of emerging junior professionals and researchers. This will promote career development and allow inter- and intra-institutional mentoring to share experience, knowledge and skills. Essentially, the RDTMP is a capacity building initiative that aims to:
• Create an enabling research, teaching and training environment that will foster the growth and development of the laboratory workforce, including pathologists, medical scientists and technologists;
• Enhance the training platform to increase the pool of pathology professionals by improving the registrars and medical scientist interns attrition rate and registrations as independent qualified HPCSA registered professionals; and
• Provide opportunities for mentorship and coaching by NHLS experts for workforce self-development and career growth
The RDTMP furthermore adresses the institutional and national research development, training and mentorship gaps by:
• Driving skills development and training initiatives towards the improvement of career advancement opportunities;
• Strengthening collaboration between the NHLS departments, its academic partners and other stakeholders;
• Establishing a mentorship programme to offer staff opportunities to acquire relevant research skills and knowledge to become research competent and grow as established researchers; and
• Strategically positioning the NHLS at the forefront of health science through the support for development, piloting and introduction of modern diagnostic technology.
Financial support for intern medical scientist positions was secured through the programme and will be implemented from March 2018. The RDTMP is envisaged to derive further partnerships, as well as better collaborations and networks, that will encourage sustainability of research innovative solutions and enable access to funding opportunities. It also provides an opportunity to establish succession planning and ensure alignment with the NHLS research strategy, in consultation with partner institutions and other key stakeholders.

ANNUAL REPORT 2017/18
Page - 50
Figure 1C: Map indicating the 14 NHLS ECHO sites
Mahikeng
Mankweng
TAD
Witbank
Nelspruit
UniversitasNgwelezane
Bloemfontein
DMG
Prince Street
Greenpoint
Mthata
Port Elizabeth
Project Extension for Community Healthcare Outcomes
Project Extension for Community Healthcare Outcomes (ECHO) is an innovative distance-based training solution which will link subject matter speciality experts within the academic centres (the “hub”), to multiple secondary urban and rural learning sites (the “spokes”) and especially in the medically under-serviced regions. This will provide an opportunity for an expanded and more effective platform for sharing of knowledge in building a skilled laboratory capacity nationally, across all pathology professions. ECHO will offer improved access to:
• Specialised teaching, training and diagnostic methodologies;
• Skills development;
• Interactive lectures;
• Consultations and case discussions; and
• Interactive document reviews.
Some of the perceived benefits of utilising ECHO by NHLS include the following:
• Improving national coverage of training and research interventions;
• Enabling remote connection to under-serviced areas through one-on-one, group, and remote discussions;
• Improving turnaround times in patient diagnostic and treatment interventions by pathologists;
• Providing the opportunity for national interventions to improve examination pass rates, for medical scientists, researchers, registrars and pathologists; and
• Ensuring that the dissemination of information required to help address the NHLS training needs for laboratorians will be realised and applied.
NHLS Area Managers selected the sites to serve as ECHO sites within their regions. The following 14 sites were identified (Figure 1C).
ANNUAL REPORT 2017/18
Page - 51
Research strategy and operational plan
The strategic research plan will be finalised at the RDC retreat that is planned for April 2018 and submitted to relevant NHLS structures for approval. The strategy highlights the unique position of the NHLS, which enables the organisation to provide superior quality diagnostic laboratory services to the country and substantive support to the African continent. Researchers at the NHLS have access to clinical material from all areas of pathology, the CDW that records over 80 million pathology tests that are performed annually and the national biobank.
The NHLS encourages the use of this wealth of material and data by its researchers to maintain a sustainable, quality world-class diagnostic service. The organisation partnered with medical universities to establish and maintain a notable research profile.
The 5-year research strategy aligns with the NHLS mandate of teaching, training and research. It aims to leverage current research infrastructure and networks to encourage cross-disciplinary work. Operational and translational research, to improve diagnostic and algorithmic approaches in pathology, remains a key cornerstone of the strategy.
The plan is specifically underpinned by the following six key strategic objectives: 1. Develop and sustain research programmes that contribute to the knowledge base of South Africa, 2. Develop, evaluate and implement state-of-the-art diagnostic tests to support pathology service, 3. Educate the next generation of leaders in pathology and laboratory medicine, 4. Create an enabling and healthy environment for employees;5. Establish centres of excellence that promote innovative research; and6. Drive innovation towards diagnostic excellence and better health outcomes.
Committee highlights - Academic Affairs and Research
The RDC endeavours to promote research within the NHLS that is targeted towards supporting the broader vision of the NHLS to become a “global centre of excellence for innovative laboratory medicine”. The RDC is supporting the RDTMP strategies to be implemented and ensures that the programme aligns with the NHLS Research Strategic Plan.
The RDC rendered the following support:
• Reviewing the guidelines for the recruitment and placement of medical scientists;
• Sponsoring capacity development for medical scientists; and
• Developing RDTMP draft documents which address skills development, service excellence and knowledge translation.
The success of implementing the RDTMP strategic objectives is dependent on an effective and efficient coordinating function of the RDC, identification of priority research focus areas, funding opportunities and relevant mechanisms. With these objectives in mind, the RDC successfully meet quarterly with key members who are aligned to guide and involve other NHLS key departments such as the Learning Academy (LA) to enhance internal and external collaborations and networks.
The RDC has introduced a media column titled “Researchers Spotlight”. This seeks to highlight the career and achievements of leading researchers within the NHLS as well as young researchers who are early in their careers. Interviews with nominated researchers in the spotlight are published in the NHLS LabRap communication. The inaugural Researcher Spotlight focused on Professor Lynn Morris and was published in the PathReD Indaba newsletter and the January – March 2017 issue of LabRap.

ANNUAL REPORT 2017/18
Page - 52
Expert Chair Committees (ECCs)
The ECCs comprise HODs who respectively represent the disciplines of microbiology, haematology, anatomical pathology, immunology, genetics, clinical pathology and chemical pathology. The ECCs form an effective means of communication between academics and executive management. The chairs of the various disciplines comprise an amalgamated committee, ably chaired in 2017 by Prof Jaya George, and by Prof Meshack Bida from early 2018. The chair of the chairs is an invited member to the NHLS ECC meetings.
During 2017, the ECCs contributed to several initiatives, including compilation of strategic plans per discipline and input into the NHLS strategic goals. The committees supported human resources to refine plans for proficiency and input into key performance indicators for annual performance assessments. The committees are also represented at the National Academic Pathology Committee, a board sub-committee, where feedback was provided regarding the registrar climate and culture survey.
The ECCs furthermore engage with the Health Technology Agency to improve and approve validation protocols and reports for assessment of new equipment. The ECCs also contributed to the development of standard operating procedures, including the Registrar Policy. The immunology executive committee published a standard operating procedure for investigation of primary immune deficiencies. A minimum organogram for academic business units was submitted to executive management for directing strategic growth. Plans for improving national coverage of pathology services were actively monitored.
Members of the NHLS Research Development Committee
Front row: left to right:Dr Babatyi Malope-Kgokong (NHLS), Prof Jim Phillips (NIOH), Prof Himla Soodyall (NHLS and Wits) and Dr Pieter Meyer (NHLS and UP).
Back row: left to right: Prof Gloria Selabe (NHLS and SMU), Dr Verena Gounden (NHLS and UKZN), Prof Tandi Matsha (NHLS and CPUT), Prof Richard Naidoo (NHLS and UCT), Dr Aijaz Ahmad (NHLS and Wits), Prof Muriel Meiring (NHLS and UFS), and Prof Rajeev Erasmus (NHLS and SU).
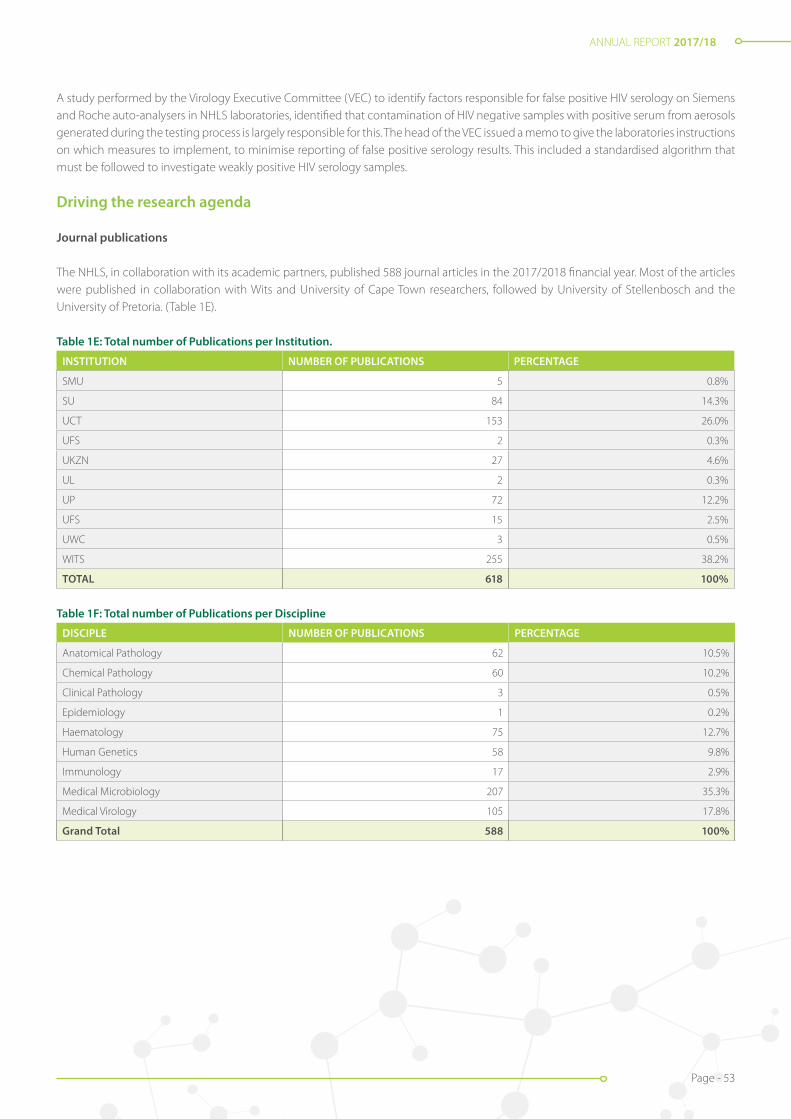
ANNUAL REPORT 2017/18
Page - 53
A study performed by the Virology Executive Committee (VEC) to identify factors responsible for false positive HIV serology on Siemens and Roche auto-analysers in NHLS laboratories, identified that contamination of HIV negative samples with positive serum from aerosols generated during the testing process is largely responsible for this. The head of the VEC issued a memo to give the laboratories instructions on which measures to implement, to minimise reporting of false positive serology results. This included a standardised algorithm that must be followed to investigate weakly positive HIV serology samples.
Driving the research agenda
Journal publications
The NHLS, in collaboration with its academic partners, published 588 journal articles in the 2017/2018 financial year. Most of the articles were published in collaboration with Wits and University of Cape Town researchers, followed by University of Stellenbosch and the University of Pretoria. (Table 1E).
Table 1E: Total number of Publications per Institution.
INSTITUTION NUMBER OF PUBLICATIONS PERCENTAGE
SMU 5 0.8%
SU 84 14.3%
UCT 153 26.0%
UFS 2 0.3%
UKZN 27 4.6%
UL 2 0.3%
UP 72 12.2%
UFS 15 2.5%
UWC 3 0.5%
WITS 255 38.2%
TOTAL 618 100%
Table 1F: Total number of Publications per Discipline
DISCIPLE NUMBER OF PUBLICATIONS PERCENTAGE
Anatomical Pathology 62 10.5%
Chemical Pathology 60 10.2%
Clinical Pathology 3 0.5%
Epidemiology 1 0.2%
Haematology 75 12.7%
Human Genetics 58 9.8%
Immunology 17 2.9%
Medical Microbiology 207 35.3%
Medical Virology 105 17.8%
Grand Total 588 100%
ANNUAL REPORT 2017/18
Page - 54
Translation to policy
NHLS staff members were involved in conducting research that generated useful knowledge to inform the development of a policy that can be adopted to provide guidance in the delivery and intervention of healthcare services. Three translations were reported, including Guidelines for Managing Advanced HIV Disease and Rapid Initiation of Antiretroviral Therapy which was published by the World Health Organization (WHO). The objectives of these guidelines are to provide recommendations for a public health approach to manage people who are presenting with advanced HIV disease symptoms, and to provide guidance on the timing of initiation of antiretroviral therapy (ART) for all people living with HIV.
Another translation is the Guidelines for The Diagnosis, Prevention and Management of Cryptococcal Disease in HIV-Infected Adults, Adolescents and Children. These guidelines provide recommendations for the following:
• Good practice guidance on an optimal approach to diagnosing cryptococcal meningitis;
• Preventing invasive cryptococcal disease through cryptococcal antigen screening and pre-emptive fluconazole therapy;
• Treating cryptococcal meningitis with combination antifungal therapy regimens;
• Preventing, monitoring and managing amphotericin B drug toxicity;
• Adjunctive therapy with systemic corticosteroids; and
• The timing of antiretroviral therapy (ART) initiation.
The final translation was the Guidelines on the Public Health Response to Pre-treatment HIV Drug Resistance which provides guidance on the public health response to:
• Pre-treatment HIV drug resistance (HIVDR) to non-nucleoside reverse-transcriptase inhibitors (NNRTIs) among people without prior antiretroviral (ARV) drug exposure; or
• People with prior ARV exposure who are initiating or reinitiating first-line antiretroviral therapy (ART).
It also provides consensus on the prevalence or threshold of pre-treatment HIVDR to NNRTIs at which specific public health actions are triggered.
Translation to diagnostic service
Four research outputs were translated into diagnostic service. These were reported on the annual performance plan (APP) and standard operating procedures (SOP) were loaded on the NHLS Q-pulse system. The following are the translations:
• The reverse transcriptase polymerase chain reaction (PCR) for the detection of the intron 22 inversion in severe Haemophilia A patients;
• Generic protocol for panleucogated PLG CD4 testing using the Beckman Coulter AQUIOS CL Flow Cytometer system;
• Analysis of next generation sequencing data produced for the Oncomine BRCA Research Assay to detect mutations within the familial breast cancer genes BRCA1 and BRCA2; and
• Diagnostic screening for large exonic rearrangements using multiplex ligation-dependent probe amplification (MLPA).
Pathology Research and Development (PathRed) Congress
The PathReD 2017 Congress was held at Emperors Palace in Johannesburg, South Africa from Friday, 23 June to Saturday, 24 June 2017. The Congress was organised by the NHLS, in collaboration with the Federation of South African Societies of Pathology (FSASP). The event provided an integrated platform to showcase the exciting research and diagnostic development occurring countrywide and brought together 381 delegates across the full-spectrum of diagnostic and public health sciences (pathologists, technologists, medical scientists and clinicians) with an interest in laboratory medicine.
Pathology disciplines such as anatomical pathology, chemical pathology, haematology, human genetics, immunology and medical virology and microbiology was included. A total of 15 Continuing Education Units (CEU) were accredited for full attendance of the relevant congress sessions, including the pre-congress workshops through the Wits Health Consortium.
The 2017 PathReD 2017 theme was “Driving Innovation and Laboratory Excellence”. Input into the scientific tracks (laboratory service and systems strengthening and diagnostics; infectious diseases; non-communicable diseases; epidemiology and health policy and management) was provided by world-class national and international speakers including Professor Glenda Gray, CEO of the South African Medical Research Council (SAMRC).

ANNUAL REPORT 2017/18
Page - 55
Professor Gray highlighted the focus on capacity development and sustaining a research culture. This was echoed by the A-rated NHLS-affiliated scientists and top researchers who participated in all PathReD sessions. The PathRed 2017 Chairperson indicated that the common goal is to improve health care in South Africa and beyond, through research.
A total of 48 Honourable Mentions were awarded to the best oral and poster presentations. Pre-conference workshops were held on topics such as scientific writing skills; research ethics; grant application; writing for publication; basic data management and analysis skills. Mentorship roundtable discussions between pathology experts and junior researchers were also conducted.
Grant Programme Management
The Grant Programme Management component of AAR provides pre- and post-award support and administration to grant holders. The programme office advises applicants and grantees on financial and management issues relevant to their applications and provides assistance in administering the portfolio, including setting appropriate work priorities.
The year 2017/2018 saw a successful closeout of the Centers For Disease Control and Prevention (CDC) Global Diseases Detection (GDD) Co-Agreement which ran from September 2012 to October 2017 (awarded a total of eight million dollars over the five years).
Measures were implemented to ensure a speedy and frequent review response for NHLS Research Trust grants, which support research from applicants within pathology laboratories. Overall grants awarded for the 2017/2018 financial year and managed through the NHLS Grants office amounted to R65.6 million. Table 2 shows NHLS Research Trust (NHLSRT) applications per institution for the 2017/2018 financial year.
Table 2: NHLS Research Trust applications per institution for the 2017/2018 financial year
Institution Development Research Grand total
National Institute for Communicable Diseases 5 3 8
• University of Cape Town 10 1 11
• University of Free State 2 2 4
• University of KwaZulu-Natal 2 1 3
• University of Limpopo 1 0 1
• University of Pretoria 11 5 16
• University of Stellenbosch 7 5 12
• University of Witwatersrand 14 4 18
• Walter Sisulu University 0 1 1
• Grand total 52 22 74
CDC US President’s Emergency Plan for AIDS Relief (PEPFAR)
The funding and technical support provided in the past year has been valuable in helping the NHLS to achieve the required levels to initiate implementation of six project objectives as per the Funding Opportunity Announcement (FOA). Most activities managed to achieve and exceed their targets, and at least 70% of the set targets were met by the end of quarter three of the co-agreement.
CDC-SA and CDC-Atlanta collaborated to assist with implementation of the intervention and Monitoring and Evaluation (M&E). The CDC participated in project technical working group meetings and teleconferences with NICD, NHLS, DoH and other stakeholders. On-site technical support from the CDC-SA laboratory and extramural branch included training sessions, workshops and assistance with project planning, implementation and reporting processes.

ANNUAL REPORT 2017/18
Page - 56
Notable achievements of projects funded by CDC PEPFAR
Activity performance
Activity title: Implementation of quality assurance rapid HIV testing point of care
Since the HIV Rapid Test Quality Improvement Initiative (RTQII) programme started in February 2016, approximately 1870 (95%) testing sites of 1969 target facilities were trained on the initiative and enrolled on the Quality Control Initiative (QCI), including an Independent Quality Control (IQC) programme. 1628 (82.7%) testing sites were enrolled on the PT programme. In total, 1834 testing sites were assessed to evaluate the progress and impact of the RTQII implementation.
SPI-RT audit performance
• During the period under review, approximately 196 health facilities were trained on RTQII and enrolled on CQI during the IQC programme and 681 testing sites were assessed using the Stepwise Process for Improving the Quality of HIV Rapid Testing (SPI-RT) checklist. Of the 681 testing sites that were assessed, 0.6% (n= 4 sites) scored less than 40% which is Level 0, followed by 10.7% sites at Level 1 (40% - 59% score), 55.9% sites at Level 2 (60% - 79%), 30.1% sites at Level 3 (80% - 89%) and 2.6% sites at certification Level 4 (≥90%). The Western Cape Province site assessment was suspended by the province to allow the province to develop and implement a quality assurance plan.
Activity title: strengthening and improving access to HIV viral load testing in South Africa
• The objective of this activity is to enhance the clinic-laboratory interface to streamline processes, improve turnaround times and ensure that quality services are rendered for HIV viral load. A mobile ICT solution named “eLabs” was configured for the South African setting by the NPP and Mezzanine to strengthen the clinic-laboratory interface for the pre- and post- analytical aspects of HIV viral load monitoring. Measurable outcomes were observed and the project is now entering the pilot phase, with 25 healthcare facilities in the Ekurhuleni and Sedibeng Districts selected as pilot sites.
Activity title: monitoring and evaluation of a cryptococcal screening programme in South Africa
• Reflex laboratory screening for cryptococcal antigenaemia (CrAg) was implemented across South Africa. From the 1st of October 2016, all NHLS CD4 labs are conducting reflex screening for CrAg. An estimated quarter of a million persons with advanced HIV disease (CD4 count <100) will be screened per annum. South Africa is the first country in the world to conduct screening for cryptococcal disease on this scale.
• CrAg results were delivered using NHLS SMS printers at 1969 facilities in PEPFAR-supported districts. Currently, 199 health care managers at 119 facilities are registered to receive Results for Action (RfA) reports
• The NHLS continued to strengthen relationships and collaborations with the DoH and development partners.
Overall cooperative agreement performance All progress reports were received timeously and showed improved financial performance highlighting improved understanding of CDC requirements and development of new tools. The total spend to date is $2,858,487 from the $2,997,004 (including carryover funds, leaving a balance of $138.516.
This balance is expected to be reduced drastically as all the committed funds will be finalised and all expenses that have not appeared on Oracle which were loaded on the system before end of March, will form the bulk of the remaining balance.
The grants office has up until June 2018 to finalise all expenses related to this financial period. As soon as all expenses have been accounted for, the final Federal Financial Report (FFR) for the financial period from April 2017 – March 2018 will be submitted to CDC Atlanta.
ContinuationA continuation application for Year 4 to the amount of $5,916 322 was approved for the 12-month financial period from April 2018 - March 2019. The NHLS was requested to submit a revised budget of $2 880,144 for the six months from April to September, to align it with the CDC funding periods. The CDC has moved the NHLS from an April awardee to a September awardee.
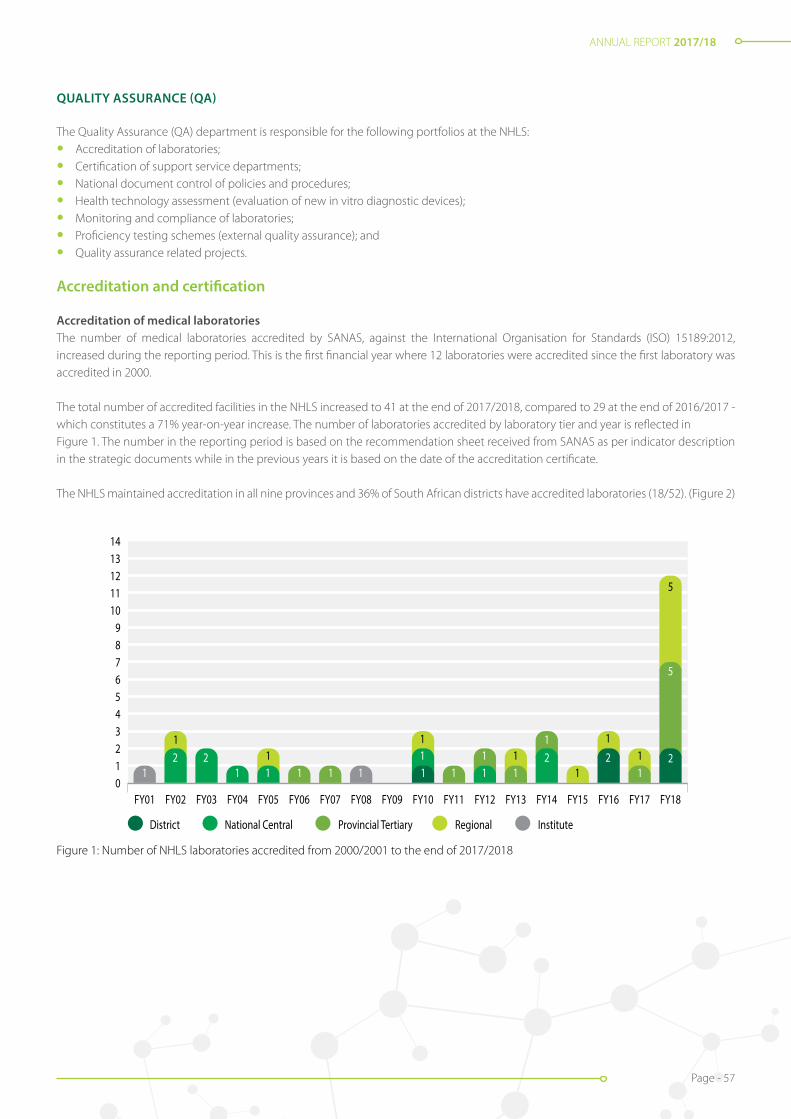
ANNUAL REPORT 2017/18
Page - 57
Figure 1: Number of NHLS laboratories accredited from 2000/2001 to the end of 2017/2018
QUALITY ASSURANCE (QA)
The Quality Assurance (QA) department is responsible for the following portfolios at the NHLS:
• Accreditation of laboratories;
• Certification of support service departments;
• National document control of policies and procedures;
• Health technology assessment (evaluation of new in vitro diagnostic devices);
• Monitoring and compliance of laboratories;
• Proficiency testing schemes (external quality assurance); and
• Quality assurance related projects.
Accreditation and certification
Accreditation of medical laboratoriesThe number of medical laboratories accredited by SANAS, against the International Organisation for Standards (ISO) 15189:2012, increased during the reporting period. This is the first financial year where 12 laboratories were accredited since the first laboratory was accredited in 2000.
The total number of accredited facilities in the NHLS increased to 41 at the end of 2017/2018, compared to 29 at the end of 2016/2017 - which constitutes a 71% year-on-year increase. The number of laboratories accredited by laboratory tier and year is reflected in Figure 1. The number in the reporting period is based on the recommendation sheet received from SANAS as per indicator description in the strategic documents while in the previous years it is based on the date of the accreditation certificate.
The NHLS maintained accreditation in all nine provinces and 36% of South African districts have accredited laboratories (18/52). (Figure 2)
Figure 01: Number of NHLS laboratories accredited from 2000/2001 to the end of 2017/18
0123456789
1011121314
FY18FY17FY16FY15FY14FY13FY12FY11FY10FY09FY08FY07FY06FY05FY04FY03FY02FY01
District National Central Provincial Tertiary Regional Institute
1 1 1 1 1 1 11 1 1
112222 2
5
5
1111 1
111 1
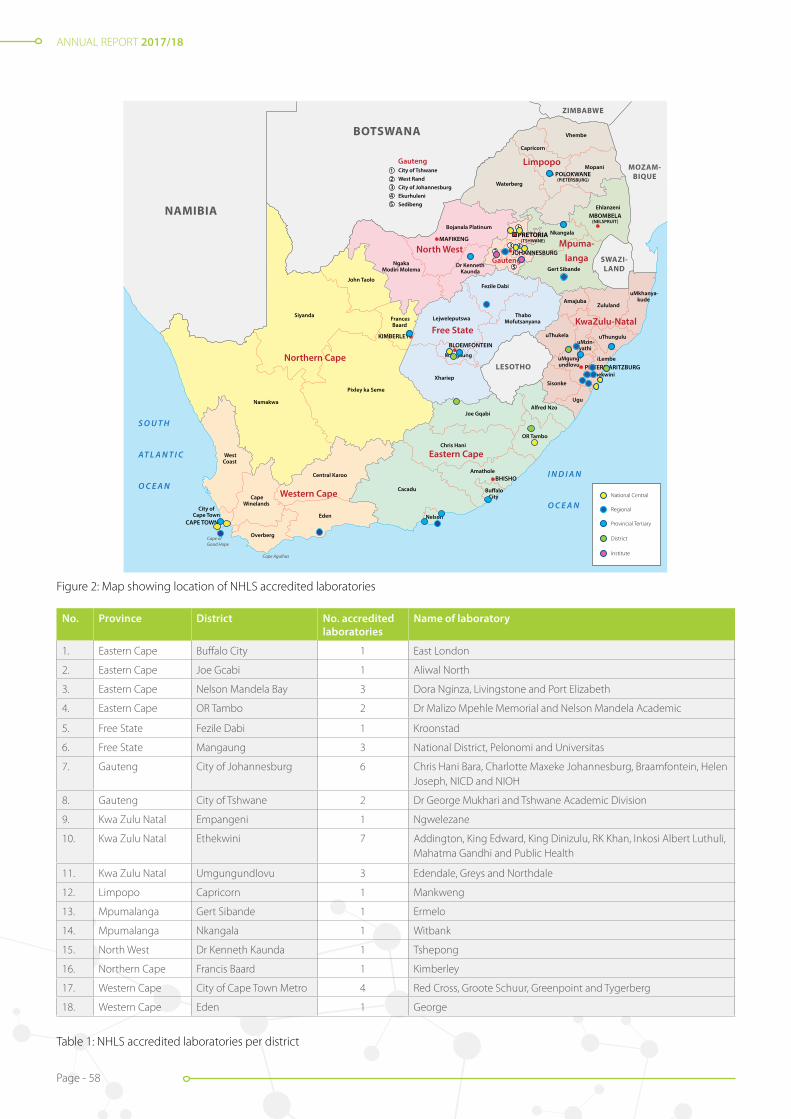
ANNUAL REPORT 2017/18
Page - 58
Figure 2: Map showing location of NHLS accredited laboratories
No. Province District No. accredited laboratories
Name of laboratory
1. Eastern Cape Buffalo City 1 East London
2. Eastern Cape Joe Gcabi 1 Aliwal North
3. Eastern Cape Nelson Mandela Bay 3 Dora Nginza, Livingstone and Port Elizabeth
4. Eastern Cape OR Tambo 2 Dr Malizo Mpehle Memorial and Nelson Mandela Academic
5. Free State Fezile Dabi 1 Kroonstad
6. Free State Mangaung 3 National District, Pelonomi and Universitas
7. Gauteng City of Johannesburg 6 Chris Hani Bara, Charlotte Maxeke Johannesburg, Braamfontein, Helen Joseph, NICD and NIOH
8. Gauteng City of Tshwane 2 Dr George Mukhari and Tshwane Academic Division
9. Kwa Zulu Natal Empangeni 1 Ngwelezane
10. Kwa Zulu Natal Ethekwini 7 Addington, King Edward, King Dinizulu, RK Khan, Inkosi Albert Luthuli, Mahatma Gandhi and Public Health
11. Kwa Zulu Natal Umgungundlovu 3 Edendale, Greys and Northdale
12. Limpopo Capricorn 1 Mankweng
13. Mpumalanga Gert Sibande 1 Ermelo
14. Mpumalanga Nkangala 1 Witbank
15. North West Dr Kenneth Kaunda 1 Tshepong
16. Northern Cape Francis Baard 1 Kimberley
17. Western Cape City of Cape Town Metro 4 Red Cross, Groote Schuur, Greenpoint and Tygerberg
18. Western Cape Eden 1 George
Table 1: NHLS accredited laboratories per district
National Central
Regional
Provincial Tertiary
District
Institute

ANNUAL REPORT 2017/18
Page - 59
Figure 15: Percentage of NHLS laboratories accredited per laboratory tier
0
10
20
30
40
50
60
70
80
90
100
FY16 Accredited laboratories
National Central laboratories Provincial Tertiary laboratories Regional laboratories District laboratories
FY17 Accredited laboratories FY18 Accreditation FY18 Accreditation Target
93 93 94 95
70.6
47
3540
27.3
2.7 5
1614
70
0
20
40
60
80
100
120
140
160
Support Service managers
2015/16
Num
ber o
f tra
ined
indi
vidua
ls
2016/17 2017/18
Support Service staff
3
20
67
3
35
145
Figure 15: Percentage of NHLS laboratories accredited per laboratory tier
Figure 3: Percentage of NHLS laboratories accredited per laboratory tier
All tiers of laboratories showed an improvement compared to the previous reporting period. The accreditation Strategic and Annual Performance Plan (APP) target for 2017/2018 was only reached by the provincial tertiary laboratories as shown in the figure below. This is the first financial year where the district laboratories are reported as part of the NHLS strategy and APP.
ISO 9001 Quality Management System in support of service departmentsThe implementation and maintenance of ISO 9001:2015 continued during the reporting period with the following achievements:
• All three diagnostic media products maintained their certification;
• Local quality management review meetings were held in 3/5 (60%) support service departments, prior to participation in the national management review meeting by all departments;
• Internal audits were conducted after the gap assessments in 21/35 (60%) support service units.
Figure 4 shows the percentage improvement in conformity to various ISO 9001:2015 clauses observed, following clearance of gapsidentified.

ANNUAL REPORT 2017/18
Page - 60
0
20
40
60
80
100
120
National Score Western andNorthern Cape
KwaZulu Natal Limpopo Mpumalanga
Gauteng Free State and North West
Eastern Cape
Figure 18: Average percentage achieved on the NHLS PTS by NHLS laboratories
2017/20182016/20172015/2016
919084
9190
79
8991
67
929290 928989
90 8692
8986
97
Figure 6 and Table 2: Countries enrolled in the NHLS PTS
Number Name of Country Number Name of Country
1. Angola 14 Mozambique
2. Botswana 15. Namibia
3. Burkina Faso 16. Niger
4. Cameroon 17. Nigeria
5. Eritrea 18. Sierra Leone
6. Ethiopia 19. South Africa
7. Gabon 20. Swaziland
8. Ghana 21. Tanzania
9. Guinea 22. Uganda
10. Ivory Coast 23.United States of America
11. Kenya 24. Zambia
12. Lesotho 25. Zimbabwe
13. Malawi
Figure 5: Average percentage achieved on the NHLS PTS by NHLS laboratories
NHLS proficiency testing schemes (PTS)The NHLS continued to outperform its annual strategic targets for PTS performance with 94% of reporting laboratories achieving results above 80% compared to a target of 82%. The figure below demonstrates the laboratory performance by region, compared with national averages.
Proficiency Testing Schemes (PTS) enrolments NHLS laboratories, private laboratories in South Africa and countries outside South Africa subscribe to the NHLS PTS. There was an increase to 4709 enrolments (16%) in the 2017/2018 financial year. The number of countries enrolled on the NHLS PTS increased by 1 from 24 to 25 when compared to the previous financial year, as illustrated in the figure here below. Two additional schemes were implemented for NHLS laboratories (D-dimer and the Separate Malaria Rapid Diagnostic Test).
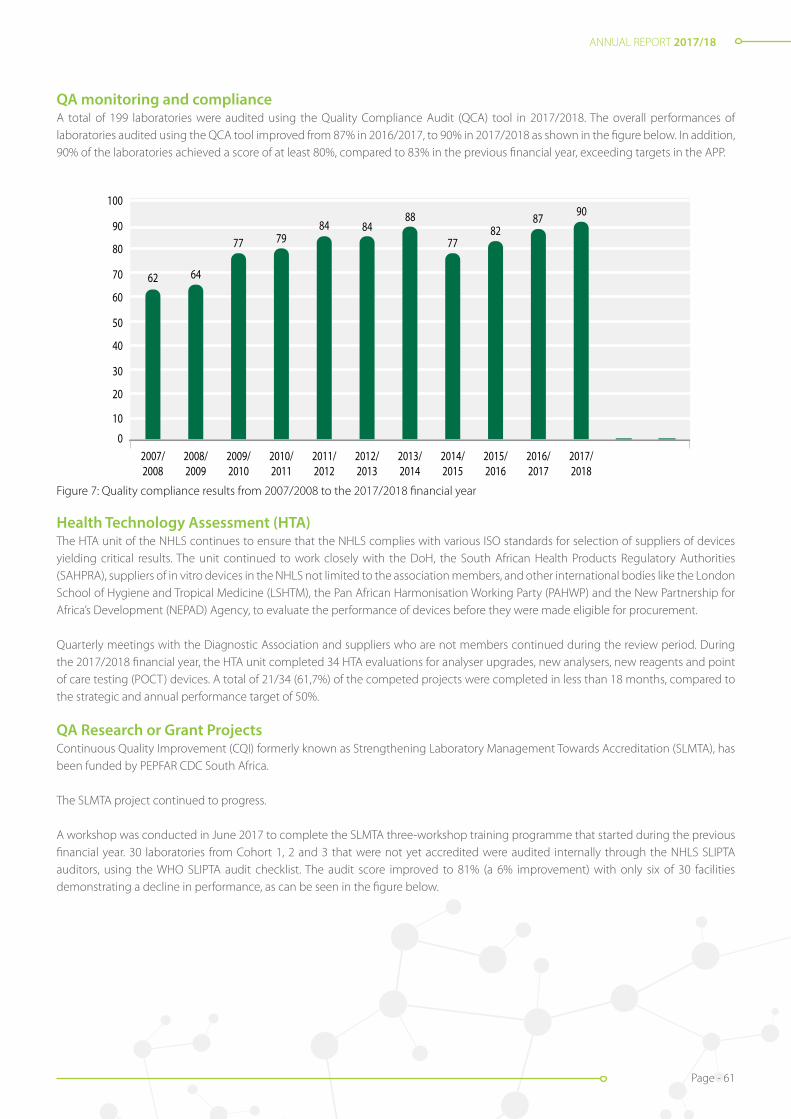
ANNUAL REPORT 2017/18
Page - 61
Figure 7: Quality compliance results from 2007/2008 to the 2017/2018 financial year
0
10
20
30
40
50
60
70
80
90
100
2017/2018
2016/2017
2015/2016
2014/2015
2013/2014
2012/2013
2011/2012
2010/2011
2009/2010
2008/2009
2007/2008
62 64
77 7984 84
88
7782
87 90
0
Figure 20: Quality compliance results from 2007/2008 to the 2017/2018 financial year
QA monitoring and complianceA total of 199 laboratories were audited using the Quality Compliance Audit (QCA) tool in 2017/2018. The overall performances of laboratories audited using the QCA tool improved from 87% in 2016/2017, to 90% in 2017/2018 as shown in the figure below. In addition, 90% of the laboratories achieved a score of at least 80%, compared to 83% in the previous financial year, exceeding targets in the APP.
Health Technology Assessment (HTA)The HTA unit of the NHLS continues to ensure that the NHLS complies with various ISO standards for selection of suppliers of devices yielding critical results. The unit continued to work closely with the DoH, the South African Health Products Regulatory Authorities (SAHPRA), suppliers of in vitro devices in the NHLS not limited to the association members, and other international bodies like the London School of Hygiene and Tropical Medicine (LSHTM), the Pan African Harmonisation Working Party (PAHWP) and the New Partnership for Africa’s Development (NEPAD) Agency, to evaluate the performance of devices before they were made eligible for procurement.
Quarterly meetings with the Diagnostic Association and suppliers who are not members continued during the review period. During the 2017/2018 financial year, the HTA unit completed 34 HTA evaluations for analyser upgrades, new analysers, new reagents and point of care testing (POCT) devices. A total of 21/34 (61,7%) of the competed projects were completed in less than 18 months, compared to the strategic and annual performance target of 50%.
QA Research or Grant Projects Continuous Quality Improvement (CQI) formerly known as Strengthening Laboratory Management Towards Accreditation (SLMTA), has been funded by PEPFAR CDC South Africa.
The SLMTA project continued to progress.
A workshop was conducted in June 2017 to complete the SLMTA three-workshop training programme that started during the previous financial year. 30 laboratories from Cohort 1, 2 and 3 that were not yet accredited were audited internally through the NHLS SLIPTA auditors, using the WHO SLIPTA audit checklist. The audit score improved to 81% (a 6% improvement) with only six of 30 facilities demonstrating a decline in performance, as can be seen in the figure below.

ANNUAL REPORT 2017/18
Page - 62
Seven of the 30 laboratories completed pre-SANAS audits and were either recommended for accreditation, in the final stages of recommendation, or have already been accredited . Eleven of the 30 laboratories will be audited by the African Society for Laboratory Medicine (ASLM) in May 2018
2016/17 2017/18 Di�erence
-5-4 -5 -3-9 -7
8581 63 81 90 90 81 62 72 75 80 78 53 61 76 76 92 78 60 54 77 86 87 83 62 65 82 87 75 73
8585 75 77 92 85 90 85 82 86 95 82 76 78 79 71 93 84 64 86 78 90 78 76 81 62 91 87 80 80
175
09
19
432
6
34
17
12
12
4 010
85
92
15
23
1
4
Worcester
Welkom
Uitenhage
Tshilidzini
Thelle MogoeraneTembisa
Tambo MemorialStanger
St Elizabeth
Rustenburg
RK Khan
Queenstown
Potchefstroom
Port Shepsto
ne
Port Alfre
d
PolokwanePaarl
NelspruitManapo
Ma�keng
MadadeniLetaba
Leraton
Lebowakgom
Ladysmith
Khayelitsha
Kalafong
EdenvaleDundee
Cecilia Makiwane
Figure 8: SLIPTA audit results for 2016/2017 compared to 2017/2018
Figure 9: Representative of laboratories going for ASLM audits in May 2018
Implementation of PTS at South African voluntary counselling and testing sites funded by PEPFAR CDC South Africa since October 2016
The HIV POCT programme aims to assess the integrity of the rapid HIV testing processes, to educate and help improve facilities’ performance in QA. The objective of the HIV PTS is to monitor performance and continuously build capacity in the field of HIV diagnostics, by allowing the participants to obtain an objective measure of their diagnostic ability and to improve where necessary. The PTS for rapid HIV testing facilities was conducted at all nine provinces in South Africa during the reporting period, as indicated in the figure below.
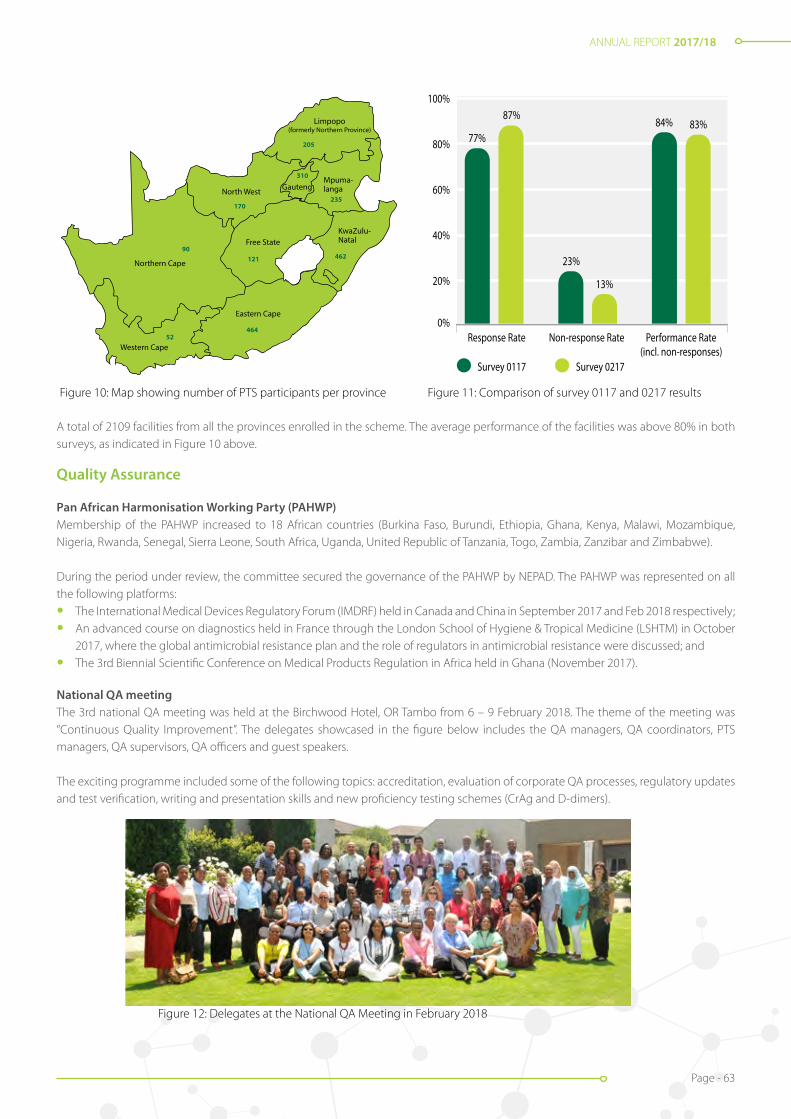
ANNUAL REPORT 2017/18
Page - 63
Figure 10: Map showing number of PTS participants per province Figure 11: Comparison of survey 0117 and 0217 results
Northern Cape
Western Cape
Eastern Cape
North West
Free StateKwaZulu-Natal
Mpuma-langa
Limpopo(formerly Northern Province)
Gauteng
205
310
235
462121
464
170
90
52
0%
20%
40%
60%
80%
100%
Survey 0117
Response Rate Non-response Rate Performance Rate(incl. non-responses)
Survey 0217
23%
84% 83%77%
87%
13%
Figure 25: Comparison of survey 0117 and 0217 results
A total of 2109 facilities from all the provinces enrolled in the scheme. The average performance of the facilities was above 80% in both surveys, as indicated in Figure 10 above.
Quality Assurance
Pan African Harmonisation Working Party (PAHWP)Membership of the PAHWP increased to 18 African countries (Burkina Faso, Burundi, Ethiopia, Ghana, Kenya, Malawi, Mozambique, Nigeria, Rwanda, Senegal, Sierra Leone, South Africa, Uganda, United Republic of Tanzania, Togo, Zambia, Zanzibar and Zimbabwe).
During the period under review, the committee secured the governance of the PAHWP by NEPAD. The PAHWP was represented on all the following platforms:
• The International Medical Devices Regulatory Forum (IMDRF) held in Canada and China in September 2017 and Feb 2018 respectively;
• An advanced course on diagnostics held in France through the London School of Hygiene & Tropical Medicine (LSHTM) in October 2017, where the global antimicrobial resistance plan and the role of regulators in antimicrobial resistance were discussed; and
• The 3rd Biennial Scientific Conference on Medical Products Regulation in Africa held in Ghana (November 2017).
National QA meetingThe 3rd national QA meeting was held at the Birchwood Hotel, OR Tambo from 6 – 9 February 2018. The theme of the meeting was “Continuous Quality Improvement”. The delegates showcased in the figure below includes the QA managers, QA coordinators, PTS managers, QA supervisors, QA officers and guest speakers.
The exciting programme included some of the following topics: accreditation, evaluation of corporate QA processes, regulatory updates and test verification, writing and presentation skills and new proficiency testing schemes (CrAg and D-dimers).
Figure 12: Delegates at the National QA Meeting in February 2018

ANNUAL REPORT 2017/18
Page - 64
DirectorProfessor Wendy Stevens
Operations ManagerDr Pedro da Silva
NATIONAL PRIORITY PROGRAMMES (NPP)
Overview
The National Priority Programmes (NPP) was established in 2010 to address the DoH’s need to provide increased access to patient testing to enhance treatment and care programmes with a focus on certain priority areas in public healthcare, including HIV and associated opportunistic infections, such as TB and Cryptococcus.
The NPP has been responsible for the implementation of several national laboratory programmes such as early infant HIV diagnosis, CD4 testing, HIV viral load testing, pulmonary and extra-pulmonary TB diagnosis through molecular testing, HIV drug-resistance testing, and reflexing cryptococcal antigen testing, following CD4 determination.
Many lessons were learnt, skill sets developed, and experience gained during implementation of these programmes. Implementation was extended to the specific diagnostic needs of key populations in South Africa, such as the mining and peri-mining communities, and offenders in the Department of Correctional Services (DCS).
The NPP comprise a multidisciplinary technical and clinical team with members representing both the NHLS and the Wits Health Consortium. The multidisciplinary team allows for a complete systems approach in supporting the implementation process through the following:
• Research and development of diagnostic platforms;
• Determining diagnostic needs;
• Conducting site assessments;
• Offering technical assistance during and after implementation;
• Overseeing quality assurance aspects;
• Providing ongoing technical and clinical training;
• Conducting ongoing M&E to ensure programme maturation; and
• Research activities to support programme improvements such as connectivity strategies and innovations.
Implementation science is further expanded to:
• Guide surveillance for programmatic purposes;
• Highlight disease transmission hot-spots;
• Improving linkage-to-care needs;
• Identifying service delivery gaps; and
• Integrating management at all levels of a tiered laboratory structure.

ANNUAL REPORT 2017/18
Page - 65
Programme implementation and development would not be possible without private-public partnerships as has been demonstrated in research work done with suppliers of diagnostic platforms and engineering groups for application, software, and SMS printer development. The team continues to work closely with international and national stakeholders, as well as funders such as the Global Fund, CDC, USAID through Right to Care, the Bill and Melinda Gates Foundation, Grand Challenges Canada, the WHO, London School of Hygiene and Tropical Medicine (LSHTM) and Unitaid, to name but a few. Activities of the respective projects/programmes conducted in 2017/2018 are detailed below.
National Testing Services for TB
National Xpert Mycobacterium Tuberculosis / Rifampicin (MTB / RIF) Testing Programme Testing Programme
Overview
The NPP is responsible for the implementation and continued programmatic monitoring of the Xpert MTB/RIF Programme for the diagnosis of pulmonary and extra-pulmonary TB. This was implemented in 2011, in conjunction with the DoH, to improve TB healthcare services due to its increased sensitivity for TB detection and reduced testing time. The technology identifies the causative agent of TB, Mycobacterium tuberculosis, and its susceptibility to rifampicin (RIF), a drug used in TB treatment.
The programme manages 325 Xpert instruments of varying capacity (GX4: 127; GX16: 189; GX48: 1; GX80: 8) distributed across 203 laboratories in South Africa. Since inception, 12 770 380 tests have been performed, 1 309 146 positive for TB (10.3%), and rifampicin resistance detected in 82 565 (6.3%).
Operations
From April 2017 to March 2018, 2 136 272 Xpert MTB/RIF tests were performed. The average national TB positivity rate is at 9.7%. Average RIF resistance detection rates remained at 6%. The number of unsuccessful tests reported remained below 2%, with corrective actions implemented where necessary.
Implementation of Xpert MTB/RIF Ultra test
In December 2010, the WHO endorsed the Xpert instrument using the Xpert MTB/RIF cartridge for the diagnosis of TB. A more sensitive cartridge, Xpert MTB/RIF Ultra, became available. The ultra-test increases the detection of TB cases, particularly amongst patients living with HIV, using the same specimen types, specimen volumes, current Xpert instrumentation platforms, and the same specimen processing protocols.
A multi-centre (10 site, 8 country) study determined the non-inferiority of the ultra test compared to the current Xpert MTB/RIF version in diagnosing pulmonary TB among adults. The multi-centre study was performed in collaboration with TB Clinical Diagnostics Research Consortium, the Foundation for New Innovative Diagnostics, the NHLS NPP at Wits and the University of Cape Town. The primary study observed a 6% increase in sensitivity (for the detection of TB) of the ultra-version over Xpert, with an increase of 17% among smear-negative culture positive participants, and 14% among HIV co-infected participants. Similar findings of increased sensitivity among smear negative and HIV co-infected individuals were found in South African participants. The increased sensitivity for detection relates to identification of unique multi-copy amplification targets and includes improvements in assay chemistry and cartridge design.
In October 2017, the NPP initiated national rollout of the Xpert MTB/RIF Ultra test, commencing in Gauteng and following a phased approach throughout the rest of the provinces. The rollout was completed in March 2018. Laboratory staff were trained prior to site reagent changeover, with distribution of updated documentation and assay files prior ultra kit stock shipments. Since commencement, 467 977 specimens have been processed on Xpert MTB/RIF Ultra.
Programmatic monitoring and evaluation
All Xpert laboratories are monitored in terms of test volumes, instrument utilisation, in-laboratory turn-around times (TAT), TB positivity, RIF resistance, and error rates by data extraction from the CDW and the Cepheid C360 real time monitoring dashboard. Summary reports on laboratory performance are compiled and distributed monthly to area and business managers.

ANNUAL REPORT 2017/18
Page - 66
Figure NPP1: Laboratory staff attending Advanced Xpert Training Course, East London.
Quality assurance (QA)
To monitor testing quality, all NHLS Xpert MTB/RIF testing laboratories are enrolled on the Smartspot® dried culture spot Expernal Quality Assurance (EQA) programme. Three EQA panels, containing four samples each, were distributed to all Xpert testing sites with results submitted and analysed online. Smartspot® provided quality panels for the verification of Xpert Ultra cartridges on existing Xpert systems, on a national basis.
Laboratory and clinical training
The NPP training team is responsible for monitoring Xpert testing across the country and provides training on quality procedures to healthcare workers (HCW), such as appropriate specimen collection for testing which aims to reduce rejected specimens. This is an ongoing process and supports the DoH training activities related to the clinical diagnostic algorithm for TB diagnosis.
In the 2017/2018 financial year, 798 laboratory staff and 1 876 HCWs were trained. Training activities included advanced Xpert workshops conducted in collaboration with Cepheid, where 121 super-users completing the training. Thirty-four trouble-shooting and support site visits were furthermore conducted in 2017/2018.
Table NPP1: Laboratory staff trained on Xpert-related topics in 2017/2018
Region Number trained Region Number trainedEastern Cape 96 KwaZulu-Natal 169
Northern Cape 20 Gauteng 174
Western Cape 85 Mpumalanga 53
Free State 52 Limpopo 88
Total 737

ANNUAL REPORT 2017/18
Page - 67
Table NPP2: Healthcare workers trained on Xpert-related topics in 2017/2018
Province District Number trained Province District Number trained
Gauteng Ekurhuleni 76 Northern Cape Namaqua 48
City of Johannesburg 133 Francis Baard 91
Tshwane 194 KwaZulu-Natal EThekwini 117
Sedibeng 13 Harry Gwala 21
West Rand 72 UMgungundlovu 180
North West Bojanala 51 Eastern Cape Buffalo City 114
NMM 85 OR Tambo 48
Dr K Kaunda 78 Nelson Mandela 29
RSM 25 Free State Mangaung 20
Mpumalanga Nkangala 210 Fezile Dabi 5
Ehlanzeni 139 Lejweleputswa 5
Gert Sibande 117 Thabo Mufutswanyana 5
Total 1 876
Outputs
Publications translating into standard operating proceduresThe national rollout of Xpert MTB/RIF Ultra testing was informed by the non-inferiority study findings. Standard Operating Procedure (SOP) GPL4284 ‘Transitioning from Xpert MTB/RIF G4 to Xpert MTB/RIF Ultra’ which was published to guide the transition. All Xpert MTB/RIF-related SOPs were updated with ultra specifics, and validation reports were released to all laboratories for quality assurance purposes. Xpert MTB/RIF Ultra verification studies for TB detection from specimen types, other than pulmonary, was initiated at three academic laboratories: Charlotte Maxeke Johannesburg Academic, Green Point, and Port Elizabeth, with the validation reports anticipated in 2018/2019.
Training and support activities for visiting delegationsIn April 2018, the NHLS/NPP hosted a high-level delegation from the Ministry of Public Health, Democratic Republic of Congo, in collaboration with the South African DoH. The delegates aimed to bench mark good practices in the following areas:1. Basic molecular biology techniques for TB and HIV diagnostic testing;2. Point-of-care testing to address challenges around patient management in rural settings;3. Implementation of large-scale programmes for Early Infant Diagnosis HIV-PCR/HIV viral load testing;4. QA for strengthening quality management systems;5. External/internal quality management mechanisms;6. Quality assurance/maintenance of the Xpert MTB/RIF programme in South Africa; 7. Laboratory information management systems for developing standardised data reporting systems for selected diseases; and8. Systems overview for keeping records of policies and SOPs.
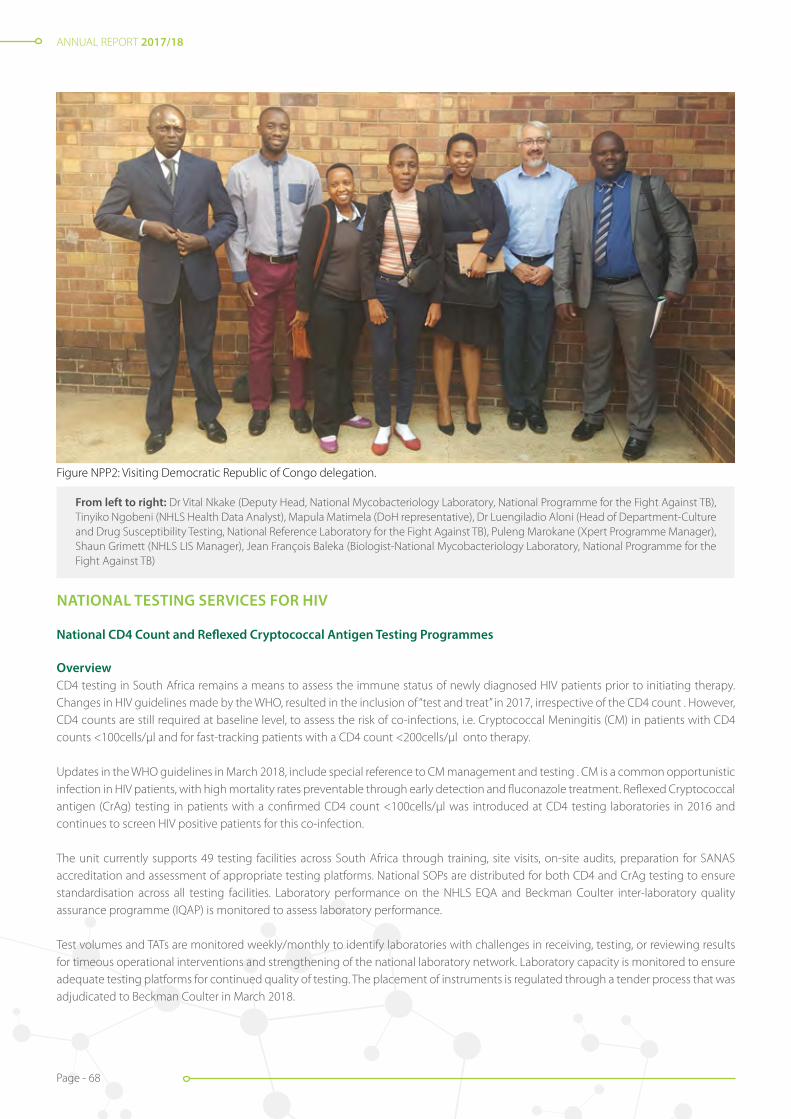
ANNUAL REPORT 2017/18
Page - 68
NATIONAL TESTING SERVICES FOR HIV
National CD4 Count and Reflexed Cryptococcal Antigen Testing Programmes
OverviewCD4 testing in South Africa remains a means to assess the immune status of newly diagnosed HIV patients prior to initiating therapy. Changes in HIV guidelines made by the WHO, resulted in the inclusion of “test and treat” in 2017, irrespective of the CD4 count . However, CD4 counts are still required at baseline level, to assess the risk of co-infections, i.e. Cryptococcal Meningitis (CM) in patients with CD4 counts <100cells/µl and for fast-tracking patients with a CD4 count <200cells/µl onto therapy.
Updates in the WHO guidelines in March 2018, include special reference to CM management and testing . CM is a common opportunistic infection in HIV patients, with high mortality rates preventable through early detection and fluconazole treatment. Reflexed Cryptococcal antigen (CrAg) testing in patients with a confirmed CD4 count <100cells/µl was introduced at CD4 testing laboratories in 2016 and continues to screen HIV positive patients for this co-infection.
The unit currently supports 49 testing facilities across South Africa through training, site visits, on-site audits, preparation for SANAS accreditation and assessment of appropriate testing platforms. National SOPs are distributed for both CD4 and CrAg testing to ensure standardisation across all testing facilities. Laboratory performance on the NHLS EQA and Beckman Coulter inter-laboratory quality assurance programme (IQAP) is monitored to assess laboratory performance.
Test volumes and TATs are monitored weekly/monthly to identify laboratories with challenges in receiving, testing, or reviewing results for timeous operational interventions and strengthening of the national laboratory network. Laboratory capacity is monitored to ensure adequate testing platforms for continued quality of testing. The placement of instruments is regulated through a tender process that was adjudicated to Beckman Coulter in March 2018.
Figure NPP2: Visiting Democratic Republic of Congo delegation.
From left to right: Dr Vital Nkake (Deputy Head, National Mycobacteriology Laboratory, National Programme for the Fight Against TB), Tinyiko Ngobeni (NHLS Health Data Analyst), Mapula Matimela (DoH representative), Dr Luengiladio Aloni (Head of Department-Culture and Drug Susceptibility Testing, National Reference Laboratory for the Fight Against TB), Puleng Marokane (Xpert Programme Manager), Shaun Grimett (NHLS LIS Manager), Jean François Baleka (Biologist-National Mycobacteriology Laboratory, National Programme for the Fight Against TB)
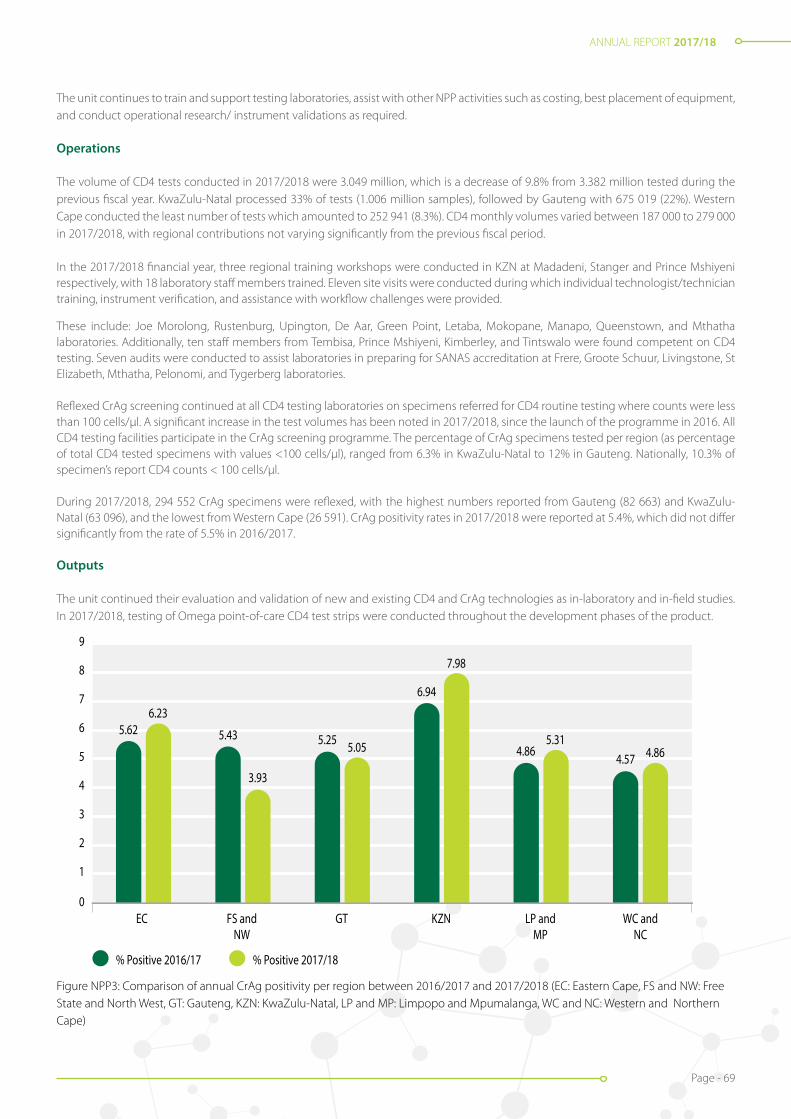
ANNUAL REPORT 2017/18
Page - 69
The unit continues to train and support testing laboratories, assist with other NPP activities such as costing, best placement of equipment, and conduct operational research/ instrument validations as required.
Operations
The volume of CD4 tests conducted in 2017/2018 were 3.049 million, which is a decrease of 9.8% from 3.382 million tested during the previous fiscal year. KwaZulu-Natal processed 33% of tests (1.006 million samples), followed by Gauteng with 675 019 (22%). Western Cape conducted the least number of tests which amounted to 252 941 (8.3%). CD4 monthly volumes varied between 187 000 to 279 000 in 2017/2018, with regional contributions not varying significantly from the previous fiscal period.
In the 2017/2018 financial year, three regional training workshops were conducted in KZN at Madadeni, Stanger and Prince Mshiyeni respectively, with 18 laboratory staff members trained. Eleven site visits were conducted during which individual technologist/technician training, instrument verification, and assistance with workflow challenges were provided.
These include: Joe Morolong, Rustenburg, Upington, De Aar, Green Point, Letaba, Mokopane, Manapo, Queenstown, and Mthatha laboratories. Additionally, ten staff members from Tembisa, Prince Mshiyeni, Kimberley, and Tintswalo were found competent on CD4 testing. Seven audits were conducted to assist laboratories in preparing for SANAS accreditation at Frere, Groote Schuur, Livingstone, St Elizabeth, Mthatha, Pelonomi, and Tygerberg laboratories.
Reflexed CrAg screening continued at all CD4 testing laboratories on specimens referred for CD4 routine testing where counts were less than 100 cells/µl. A significant increase in the test volumes has been noted in 2017/2018, since the launch of the programme in 2016. All CD4 testing facilities participate in the CrAg screening programme. The percentage of CrAg specimens tested per region (as percentage of total CD4 tested specimens with values <100 cells/µl), ranged from 6.3% in KwaZulu-Natal to 12% in Gauteng. Nationally, 10.3% of specimen’s report CD4 counts < 100 cells/µl.
During 2017/2018, 294 552 CrAg specimens were reflexed, with the highest numbers reported from Gauteng (82 663) and KwaZulu-Natal (63 096), and the lowest from Western Cape (26 591). CrAg positivity rates in 2017/2018 were reported at 5.4%, which did not differ significantly from the rate of 5.5% in 2016/2017.
Outputs
The unit continued their evaluation and validation of new and existing CD4 and CrAg technologies as in-laboratory and in-field studies. In 2017/2018, testing of Omega point-of-care CD4 test strips were conducted throughout the development phases of the product.
Figure NPP3: Comparison of annual CrAg positivity per region between 2016/2017 and 2017/2018 (EC: Eastern Cape, FS and NW: Free State and North West, GT: Gauteng, KZN: KwaZulu-Natal, LP and MP: Limpopo and Mpumalanga, WC and NC: Western and Northern Cape)
0
1
2
3
4
5
6
7
8
9
% Positive 2016/17
EC FS and NW
GT KZN LP and MP
WC and NC
% Positive 2017/18
5.626.23
5.43
3.93
5.25 5.05
6.94
7.98
4.865.31
4.57 4.86
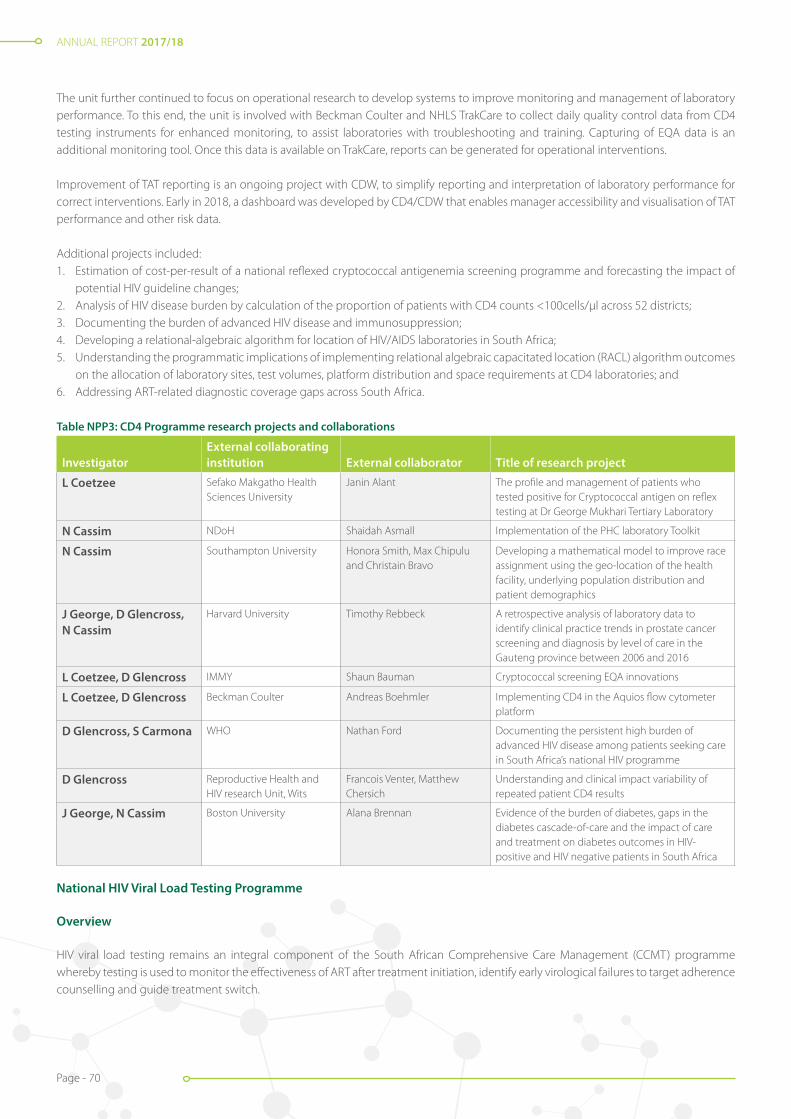
ANNUAL REPORT 2017/18
Page - 70
The unit further continued to focus on operational research to develop systems to improve monitoring and management of laboratory performance. To this end, the unit is involved with Beckman Coulter and NHLS TrakCare to collect daily quality control data from CD4 testing instruments for enhanced monitoring, to assist laboratories with troubleshooting and training. Capturing of EQA data is an additional monitoring tool. Once this data is available on TrakCare, reports can be generated for operational interventions.
Improvement of TAT reporting is an ongoing project with CDW, to simplify reporting and interpretation of laboratory performance for correct interventions. Early in 2018, a dashboard was developed by CD4/CDW that enables manager accessibility and visualisation of TAT performance and other risk data.
Additional projects included: 1. Estimation of cost-per-result of a national reflexed cryptococcal antigenemia screening programme and forecasting the impact of
potential HIV guideline changes;2. Analysis of HIV disease burden by calculation of the proportion of patients with CD4 counts <100cells/µl across 52 districts;3. Documenting the burden of advanced HIV disease and immunosuppression;4. Developing a relational-algebraic algorithm for location of HIV/AIDS laboratories in South Africa;5. Understanding the programmatic implications of implementing relational algebraic capacitated location (RACL) algorithm outcomes
on the allocation of laboratory sites, test volumes, platform distribution and space requirements at CD4 laboratories; and6. Addressing ART-related diagnostic coverage gaps across South Africa.
Table NPP3: CD4 Programme research projects and collaborations
InvestigatorExternal collaborating institution External collaborator Title of research project
L Coetzee Sefako Makgatho Health Sciences University
Janin Alant The profile and management of patients who tested positive for Cryptococcal antigen on reflex testing at Dr George Mukhari Tertiary Laboratory
N Cassim NDoH Shaidah Asmall Implementation of the PHC laboratory Toolkit
N Cassim Southampton University Honora Smith, Max Chipulu and Christain Bravo
Developing a mathematical model to improve race assignment using the geo-location of the health facility, underlying population distribution and patient demographics
J George, D Glencross, N Cassim
Harvard University Timothy Rebbeck A retrospective analysis of laboratory data to identify clinical practice trends in prostate cancer screening and diagnosis by level of care in the Gauteng province between 2006 and 2016
L Coetzee, D Glencross IMMY Shaun Bauman Cryptococcal screening EQA innovations
L Coetzee, D Glencross Beckman Coulter Andreas Boehmler Implementing CD4 in the Aquios flow cytometer platform
D Glencross, S Carmona WHO Nathan Ford Documenting the persistent high burden of advanced HIV disease among patients seeking care in South Africa’s national HIV programme
D Glencross Reproductive Health and HIV research Unit, Wits
Francois Venter, Matthew Chersich
Understanding and clinical impact variability of repeated patient CD4 results
J George, N Cassim Boston University Alana Brennan Evidence of the burden of diabetes, gaps in the diabetes cascade-of-care and the impact of care and treatment on diabetes outcomes in HIV-positive and HIV negative patients in South Africa
National HIV Viral Load Testing Programme
Overview
HIV viral load testing remains an integral component of the South African Comprehensive Care Management (CCMT) programme whereby testing is used to monitor the effectiveness of ART after treatment initiation, identify early virological failures to target adherence counselling and guide treatment switch.
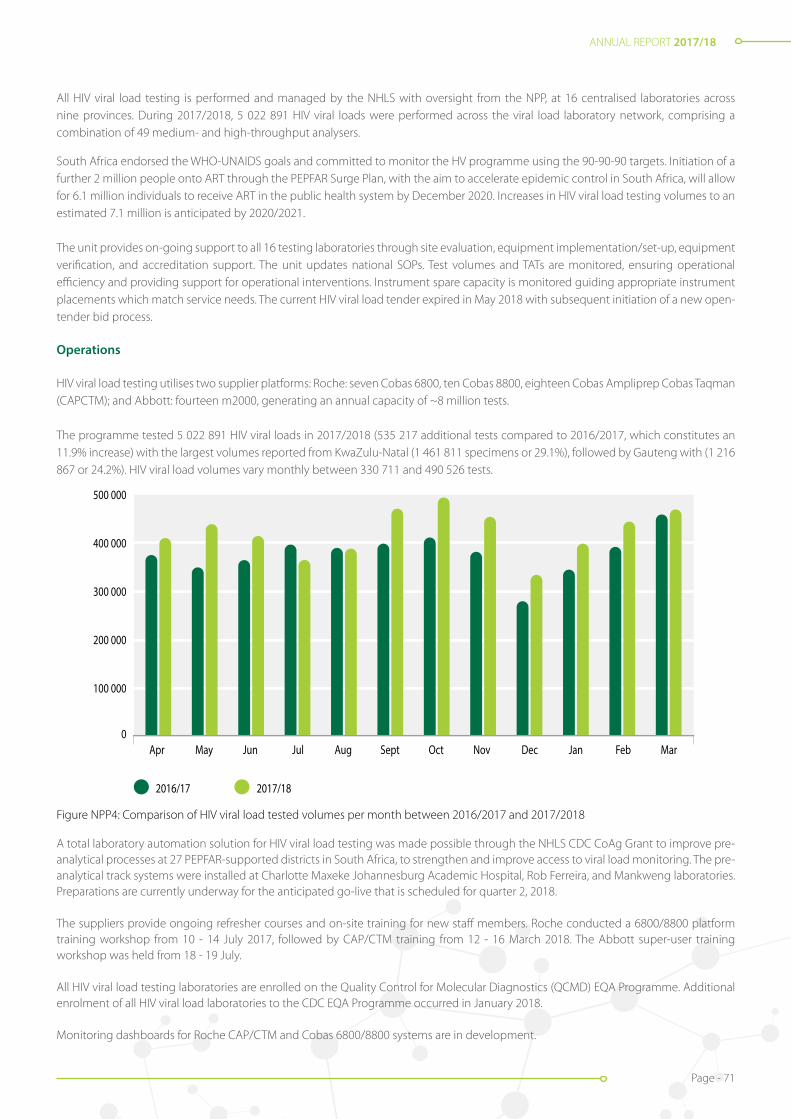
ANNUAL REPORT 2017/18
Page - 71
All HIV viral load testing is performed and managed by the NHLS with oversight from the NPP, at 16 centralised laboratories across nine provinces. During 2017/2018, 5 022 891 HIV viral loads were performed across the viral load laboratory network, comprising a combination of 49 medium- and high-throughput analysers.
South Africa endorsed the WHO-UNAIDS goals and committed to monitor the HV programme using the 90-90-90 targets. Initiation of a further 2 million people onto ART through the PEPFAR Surge Plan, with the aim to accelerate epidemic control in South Africa, will allow for 6.1 million individuals to receive ART in the public health system by December 2020. Increases in HIV viral load testing volumes to an estimated 7.1 million is anticipated by 2020/2021.
The unit provides on-going support to all 16 testing laboratories through site evaluation, equipment implementation/set-up, equipment verification, and accreditation support. The unit updates national SOPs. Test volumes and TATs are monitored, ensuring operational efficiency and providing support for operational interventions. Instrument spare capacity is monitored guiding appropriate instrument placements which match service needs. The current HIV viral load tender expired in May 2018 with subsequent initiation of a new open-tender bid process.
Operations
HIV viral load testing utilises two supplier platforms: Roche: seven Cobas 6800, ten Cobas 8800, eighteen Cobas Ampliprep Cobas Taqman (CAPCTM); and Abbott: fourteen m2000, generating an annual capacity of ~8 million tests.
The programme tested 5 022 891 HIV viral loads in 2017/2018 (535 217 additional tests compared to 2016/2017, which constitutes an 11.9% increase) with the largest volumes reported from KwaZulu-Natal (1 461 811 specimens or 29.1%), followed by Gauteng with (1 216 867 or 24.2%). HIV viral load volumes vary monthly between 330 711 and 490 526 tests.
Figure NPP4: Comparison of HIV viral load tested volumes per month between 2016/2017 and 2017/2018
0
100 000
200 000
300 000
400 000
500 000
2016/17 2017/18
Apr May Jun Jul Aug Sept Oct Nov Dec Jan Feb Mar
A total laboratory automation solution for HIV viral load testing was made possible through the NHLS CDC CoAg Grant to improve pre-analytical processes at 27 PEPFAR-supported districts in South Africa, to strengthen and improve access to viral load monitoring. The pre-analytical track systems were installed at Charlotte Maxeke Johannesburg Academic Hospital, Rob Ferreira, and Mankweng laboratories. Preparations are currently underway for the anticipated go-live that is scheduled for quarter 2, 2018.
The suppliers provide ongoing refresher courses and on-site training for new staff members. Roche conducted a 6800/8800 platform training workshop from 10 - 14 July 2017, followed by CAP/CTM training from 12 - 16 March 2018. The Abbott super-user training workshop was held from 18 - 19 July.
All HIV viral load testing laboratories are enrolled on the Quality Control for Molecular Diagnostics (QCMD) EQA Programme. Additional enrolment of all HIV viral load laboratories to the CDC EQA Programme occurred in January 2018.
Monitoring dashboards for Roche CAP/CTM and Cobas 6800/8800 systems are in development.
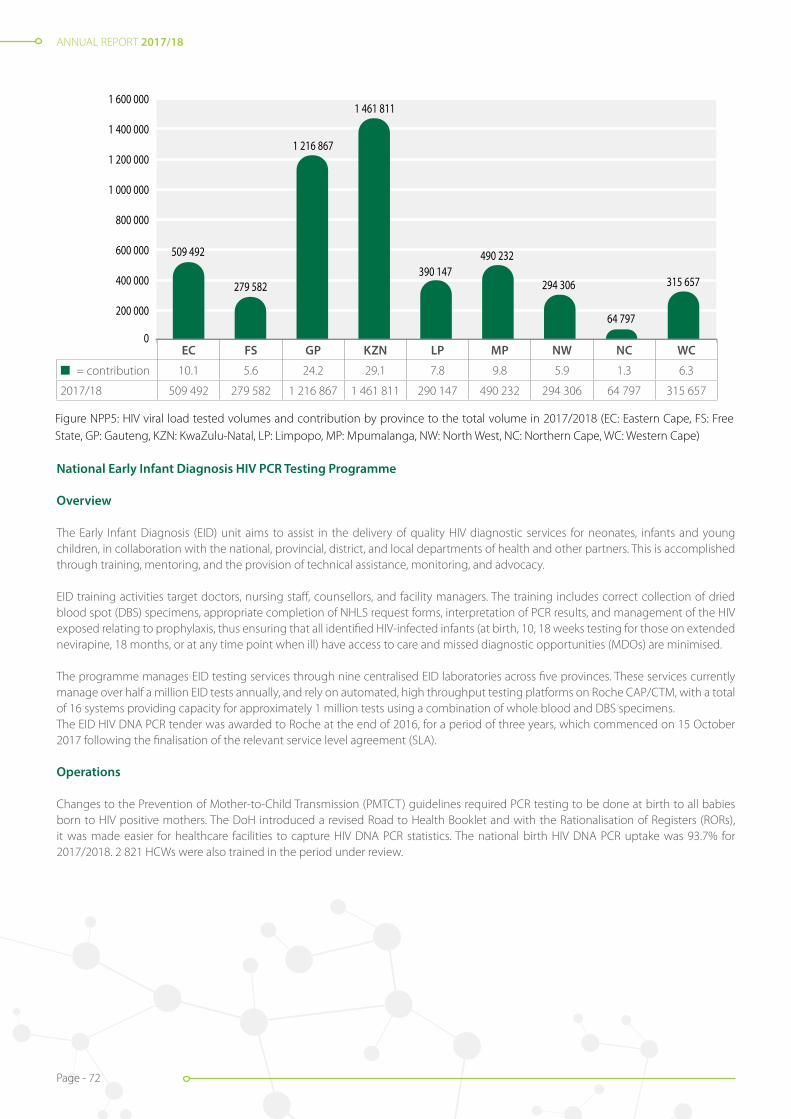
ANNUAL REPORT 2017/18
Page - 72
National Early Infant Diagnosis HIV PCR Testing Programme
Overview
The Early Infant Diagnosis (EID) unit aims to assist in the delivery of quality HIV diagnostic services for neonates, infants and young children, in collaboration with the national, provincial, district, and local departments of health and other partners. This is accomplished through training, mentoring, and the provision of technical assistance, monitoring, and advocacy.
EID training activities target doctors, nursing staff, counsellors, and facility managers. The training includes correct collection of dried blood spot (DBS) specimens, appropriate completion of NHLS request forms, interpretation of PCR results, and management of the HIV exposed relating to prophylaxis, thus ensuring that all identified HIV-infected infants (at birth, 10, 18 weeks testing for those on extended nevirapine, 18 months, or at any time point when ill) have access to care and missed diagnostic opportunities (MDOs) are minimised.
The programme manages EID testing services through nine centralised EID laboratories across five provinces. These services currently manage over half a million EID tests annually, and rely on automated, high throughput testing platforms on Roche CAP/CTM, with a total of 16 systems providing capacity for approximately 1 million tests using a combination of whole blood and DBS specimens.The EID HIV DNA PCR tender was awarded to Roche at the end of 2016, for a period of three years, which commenced on 15 October 2017 following the finalisation of the relevant service level agreement (SLA).
Operations
Changes to the Prevention of Mother-to-Child Transmission (PMTCT) guidelines required PCR testing to be done at birth to all babies born to HIV positive mothers. The DoH introduced a revised Road to Health Booklet and with the Rationalisation of Registers (RORs), it was made easier for healthcare facilities to capture HIV DNA PCR statistics. The national birth HIV DNA PCR uptake was 93.7% for 2017/2018. 2 821 HCWs were also trained in the period under review.
Figure NPP5: HIV viral load tested volumes and contribution by province to the total volume in 2017/2018 (EC: Eastern Cape, FS: Free State, GP: Gauteng, KZN: KwaZulu-Natal, LP: Limpopo, MP: Mpumalanga, NW: North West, NC: Northern Cape, WC: Western Cape)
0
200 000
400 000
600 000
800 000
1 000 000
1 200 000
1 400 000
1 600 000
2017/18
EC FS GP KZN LP MP NW NC WC
509 492
279 582
1 216 867
1 461 811
390 147490 232
294 306
64 797
315 657
EC FS GP KZN LP MP NW NC WC
n = contribution 10.1 5.6 24.2 29.1 7.8 9.8 5.9 1.3 6.3
2017/18 509 492 279 582 1 216 867 1 461 811 290 147 490 232 294 306 64 797 315 657
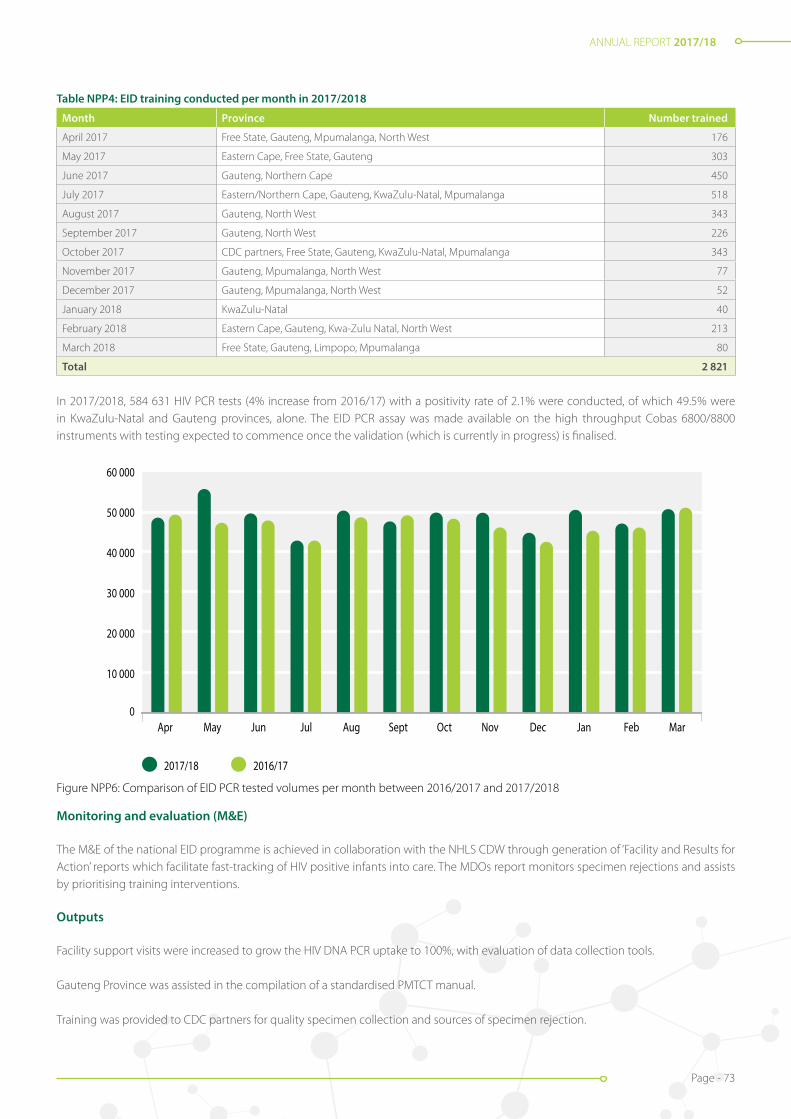
ANNUAL REPORT 2017/18
Page - 73
Table NPP4: EID training conducted per month in 2017/2018
Month Province Number trained
April 2017 Free State, Gauteng, Mpumalanga, North West 176
May 2017 Eastern Cape, Free State, Gauteng 303
June 2017 Gauteng, Northern Cape 450
July 2017 Eastern/Northern Cape, Gauteng, KwaZulu-Natal, Mpumalanga 518
August 2017 Gauteng, North West 343
September 2017 Gauteng, North West 226
October 2017 CDC partners, Free State, Gauteng, KwaZulu-Natal, Mpumalanga 343
November 2017 Gauteng, Mpumalanga, North West 77
December 2017 Gauteng, Mpumalanga, North West 52
January 2018 KwaZulu-Natal 40
February 2018 Eastern Cape, Gauteng, Kwa-Zulu Natal, North West 213
March 2018 Free State, Gauteng, Limpopo, Mpumalanga 80
Total 2 821
In 2017/2018, 584 631 HIV PCR tests (4% increase from 2016/17) with a positivity rate of 2.1% were conducted, of which 49.5% were in KwaZulu-Natal and Gauteng provinces, alone. The EID PCR assay was made available on the high throughput Cobas 6800/8800 instruments with testing expected to commence once the validation (which is currently in progress) is finalised.
0
10 000
20 000
30 000
40 000
50 000
60 000
2017/18
Apr May Jun Jul Aug Sept Oct Nov Dec Jan Feb Mar
2016/17
Figure NPP9: Comparison of EID PCR tested volumes per month between 2016/2017 and 2017/2018Figure NPP6: Comparison of EID PCR tested volumes per month between 2016/2017 and 2017/2018
Monitoring and evaluation (M&E)
The M&E of the national EID programme is achieved in collaboration with the NHLS CDW through generation of ‘Facility and Results for Action’ reports which facilitate fast-tracking of HIV positive infants into care. The MDOs report monitors specimen rejections and assists by prioritising training interventions.
Outputs
Facility support visits were increased to grow the HIV DNA PCR uptake to 100%, with evaluation of data collection tools.
Gauteng Province was assisted in the compilation of a standardised PMTCT manual.
Training was provided to CDC partners for quality specimen collection and sources of specimen rejection.

ANNUAL REPORT 2017/18
Page - 74
National HIV Genotyping Programme
Overview
There are five NHLS HIV drug resistance testing laboratories located throughout South Africa at Charlotte Maxeke Johannesburg Academic (CMJAH), Tygerberg, Inkosi Albert Luthuli Central (IALCH), Universitas, and Dr George Mukhari hospitals. These are managed by the respective laboratory managers and supported by business and area Managers who are directly responsible to ensure continuous service delivery.
HIV drug resistance testing in the public sector is only recommended for patients failing ritonavir boosted protease inhibitor (PI)-based ART. Confirmed resistance to PI-based treatment, by means of a genotype, is required before patients can be switched to third-line integrase inhibitor-based ART.
Figure NPP7: Tsakani Mhlongo at an EID training session, Dr Harry Surtie Memorial Hospital, Upington, Northern Cape
Figure NPP8: Tsakani Mhlongo demonstrating appropriate collection of DBS specimen, Dr Harry Surtie Memorial Hospital, Upington, Northern Cape
Figure NPP9: Tsakani Mhlongo and Dr Pedro da Silva (NPP) with the Northern Cape Provincial DoH team auditing birth files for clinical management compliance as per guidelines, Dr Harry Surtie Memorial Hospital, Upington, Northern Cape

ANNUAL REPORT 2017/18
Page - 75
Operations
The Department of Virology at Dr George Mukhari Hospital commenced with HIV drug resistance testing in January 2018.
Among all laboratories, 3 865 specimens were processed for HIV drug resistance testing in 2017/2018, which is an 8% increase from 2016/2017. CMJAH (53%), Tygerberg (22%), and IALCH (18%) laboratories processed the bulk of these volumes.
Universitas Hospital Laboratory obtained SANAS-accreditation for HIV drug resistance testing in June 2018.
Testing services for key populations: TB and HIV
Department of DCS TB and HIV Programme
Overview
Following the previous establishment of seven DCS laboratories, the NHLS received further Global Fund funding to support the DCS on the comprehensive prevention package (CPP) for TB, HIV, and sexually transmitted infection screening. All DCS Xpert MTB/RIF tests are funded through the Global Fund.
The CDC PEPFAR, through the Aurum Institute, continued funding the NHLS to offer Health Systems Strengthening (HSS) by training DCS HCWs on Xpert MTB/RIF diagnostic testing algorithms, SOP’s relating to appropriate specimen collection, independent quality control (IQC), and EQA. Funds were channelled to procure IQC and EQA materials to support all DCS centres.
Operations
DCS TB Programme
In 2017/2018, 56 699 Xpert MTB/RIF tests were performed, which is 10.2% less that in 2016/2017, with the Western Cape contributing the highest test volumes (12 815) followed by Gauteng with 12 483. The seven NHLS DCS Xpert MTB/RIF laboratories processed 12 045 (21.2%) of the total tests requested by the DCS with 98% that delivered results within 40 hours.
Of the tested Xpert MTB/RIF specimens, 2 904 (5.1%) were positive for TB with 116 (4.0%) detecting rifampicin resistance. RIF resistance rates were the highest in Mpumalanga (8.8%) and the Western Cape (5.6%), with the lowest resistance rates in Eastern Cape (1.8%).
DCS HIV Programme
In 2017/2018, 32 917 CD4 tests were performed, which is 6.3% less tests than in 2016/2017 with 1 328 (4.0%) CD4 counts <100cells/µl. HIV viral load volumes increased significantly by 94.3% in 2017/2018 (33 422 tests) when compared to 2016/2017 test volumes. HIV viral loads registering values >1 000 copies/ml comprised 15.7% (5 256 tests), which represents a significant improvement in viral suppression, as opposed to the 35.7% >1 000 copies/ml in 2016/2017.
Training activities
Training activities are funded under the Aurum Institute/CDC grant (year 4). Details of the completed training activities are detailed in Grant Funded Activities section, below.
Monitoring and evaluation
Xpert MTB/RIF, CD4, HIV viral load, specimen rejection rates, and TAT data are compiled and shared monthly, for programmatic monitoring and interventions. In 2017/2018, 2 202 specimens were rejected (notable, 1 439 were because of insufficient volume, 156 were submitted in empty containers, and 748 were because of specimens that leaked). These rejection rates inform and guide which training activities must be targeted.
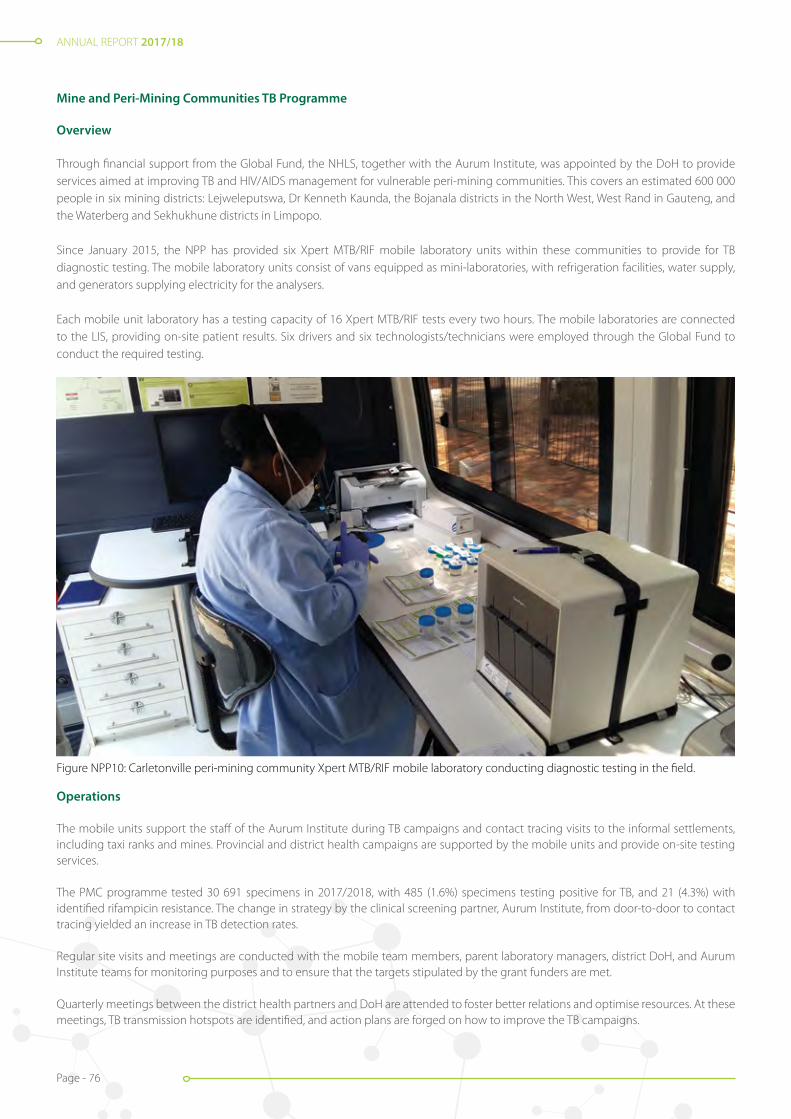
ANNUAL REPORT 2017/18
Page - 76
Mine and Peri-Mining Communities TB Programme
Overview
Through financial support from the Global Fund, the NHLS, together with the Aurum Institute, was appointed by the DoH to provide services aimed at improving TB and HIV/AIDS management for vulnerable peri-mining communities. This covers an estimated 600 000 people in six mining districts: Lejweleputswa, Dr Kenneth Kaunda, the Bojanala districts in the North West, West Rand in Gauteng, and the Waterberg and Sekhukhune districts in Limpopo.
Since January 2015, the NPP has provided six Xpert MTB/RIF mobile laboratory units within these communities to provide for TB diagnostic testing. The mobile laboratory units consist of vans equipped as mini-laboratories, with refrigeration facilities, water supply, and generators supplying electricity for the analysers.
Each mobile unit laboratory has a testing capacity of 16 Xpert MTB/RIF tests every two hours. The mobile laboratories are connected to the LIS, providing on-site patient results. Six drivers and six technologists/technicians were employed through the Global Fund to conduct the required testing.
Figure NPP10: Carletonville peri-mining community Xpert MTB/RIF mobile laboratory conducting diagnostic testing in the field.
Operations
The mobile units support the staff of the Aurum Institute during TB campaigns and contact tracing visits to the informal settlements, including taxi ranks and mines. Provincial and district health campaigns are supported by the mobile units and provide on-site testing services.
The PMC programme tested 30 691 specimens in 2017/2018, with 485 (1.6%) specimens testing positive for TB, and 21 (4.3%) with identified rifampicin resistance. The change in strategy by the clinical screening partner, Aurum Institute, from door-to-door to contact tracing yielded an increase in TB detection rates.
Regular site visits and meetings are conducted with the mobile team members, parent laboratory managers, district DoH, and Aurum Institute teams for monitoring purposes and to ensure that the targets stipulated by the grant funders are met.
Quarterly meetings between the district health partners and DoH are attended to foster better relations and optimise resources. At these meetings, TB transmission hotspots are identified, and action plans are forged on how to improve the TB campaigns.
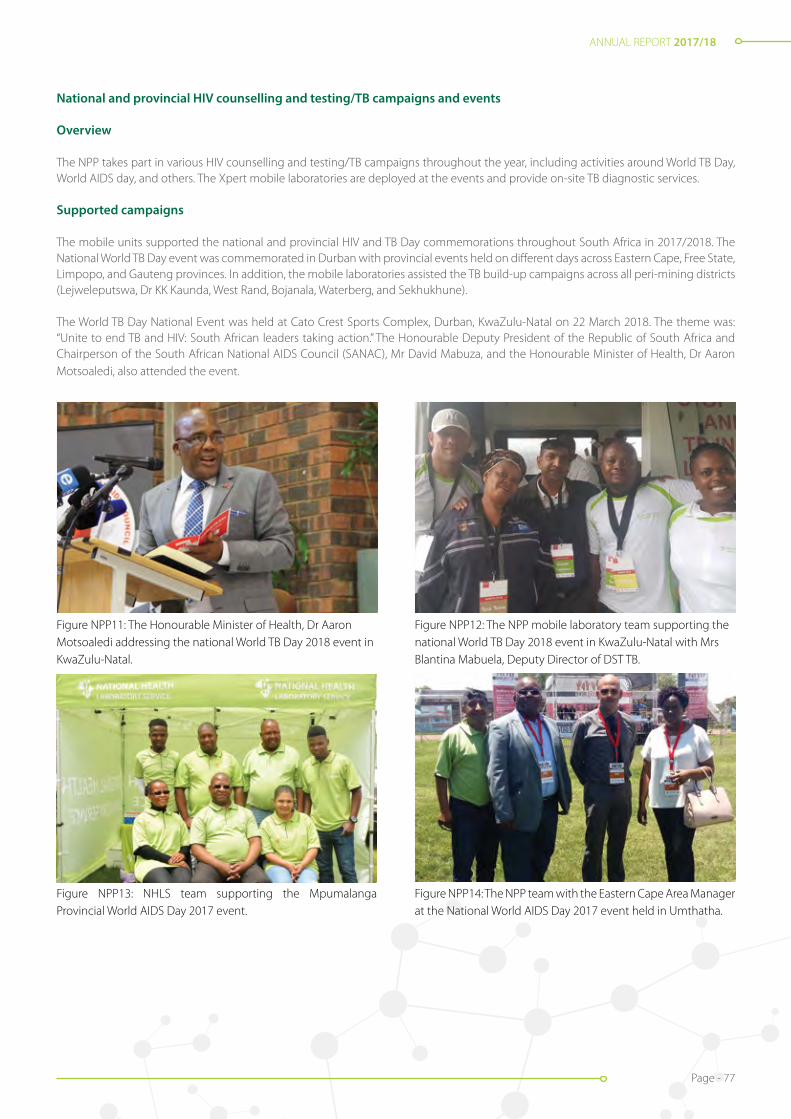
ANNUAL REPORT 2017/18
Page - 77
National and provincial HIV counselling and testing/TB campaigns and events
Overview
The NPP takes part in various HIV counselling and testing/TB campaigns throughout the year, including activities around World TB Day, World AIDS day, and others. The Xpert mobile laboratories are deployed at the events and provide on-site TB diagnostic services.
Supported campaigns
The mobile units supported the national and provincial HIV and TB Day commemorations throughout South Africa in 2017/2018. The National World TB Day event was commemorated in Durban with provincial events held on different days across Eastern Cape, Free State, Limpopo, and Gauteng provinces. In addition, the mobile laboratories assisted the TB build-up campaigns across all peri-mining districts (Lejweleputswa, Dr KK Kaunda, West Rand, Bojanala, Waterberg, and Sekhukhune).
The World TB Day National Event was held at Cato Crest Sports Complex, Durban, KwaZulu-Natal on 22 March 2018. The theme was: “Unite to end TB and HIV: South African leaders taking action.” The Honourable Deputy President of the Republic of South Africa and Chairperson of the South African National AIDS Council (SANAC), Mr David Mabuza, and the Honourable Minister of Health, Dr Aaron Motsoaledi, also attended the event.
Figure NPP12: The NPP mobile laboratory team supporting the national World TB Day 2018 event in KwaZulu-Natal with Mrs Blantina Mabuela, Deputy Director of DST TB.
Figure NPP11: The Honourable Minister of Health, Dr Aaron Motsoaledi addressing the national World TB Day 2018 event in KwaZulu-Natal.
Figure NPP14: The NPP team with the Eastern Cape Area Manager at the National World AIDS Day 2017 event held in Umthatha.
Figure NPP13: NHLS team supporting the Mpumalanga Provincial World AIDS Day 2017 event.

ANNUAL REPORT 2017/18
Page - 78
Data Management and Connectivity
Information and data management
Overview
For programmatic M&E purposes, the NPP generates an array of monthly and quarterly reports for distribution to partners, funders, the DoH, provincial departments of health and coordinators. These reports are prepared as Excel-based spreadsheets/dashboards providing multiple user-friendly views of specimen and facility-level laboratory data.
The data is extracted via the CDW. Data variables include test volumes, positivity rates, laboratory workflow analyses, TAT, instrument percentage utilisation rates, exception reporting such as tests with CD4 values <100cells/µl, HIV VL >1’000 copies/ml, and test data disaggregated by sex and/or age.
In December 2016, the WITS Human Research Ethics Committee granted ethics approval to the NPP (Clearance M160978), for the analysis of the LIS for programmatic M&E purposes under the established Integrated Laboratory Data Analysis for Care (ILDAC) Programme. Programmatic data requests are directed to the operations manager, who ensures that the data request complies with the conditions of the ethics approval, prior data release, under the ILDAC programme.
National laboratory result SMS printer project
Overview
The NHLS bi-directional SMS printer has the capability to allow for results (upon authorisation of CD4 count, reflex cryptococcal antigen, HIV viral load, infant HIV PCR, TB microscopy and/or Xpert MTB/RIF results) to be sent from the testing laboratory via the LIS, to the printer placed at Primary and Community Healthcare Clinics, ‘Push’.
The printer can also retrieve patient results from the LIS database, by scanning the barcode on the specimen requisition at the healthcare clinic, ‘Pull’. Bi-directional laboratory result printer technology aims to improve rapid delivery of HIV and TB diagnostic results throughout South Africa.
The NPP secured funding and successfully procured 2 096 printers for PHCs and community healthcare centres (CHCs) that provide HIV/TB services. This only covers 50% of all the facilities that offer HIV/TB services nationally.
A number of challenges were experienced with the utilisation of the SMS printers. To address these challenges, the NHLS initiated the following:1. Implementing a move from SMS to a Global Data Services Platform (GDSP), accompanied by national roaming available in all
countries to improve network connectivity;2. Prioritising the modification of scanners and power supplies, and replacing external antennae with internal ones, to reduce the
likelihood of components getting removed or lost; and3. Creating potential for transmission of additional laboratory test results, which was not previously possible due to SMS limiting factors
and costs, for tests such as TB culture and line probe assays.
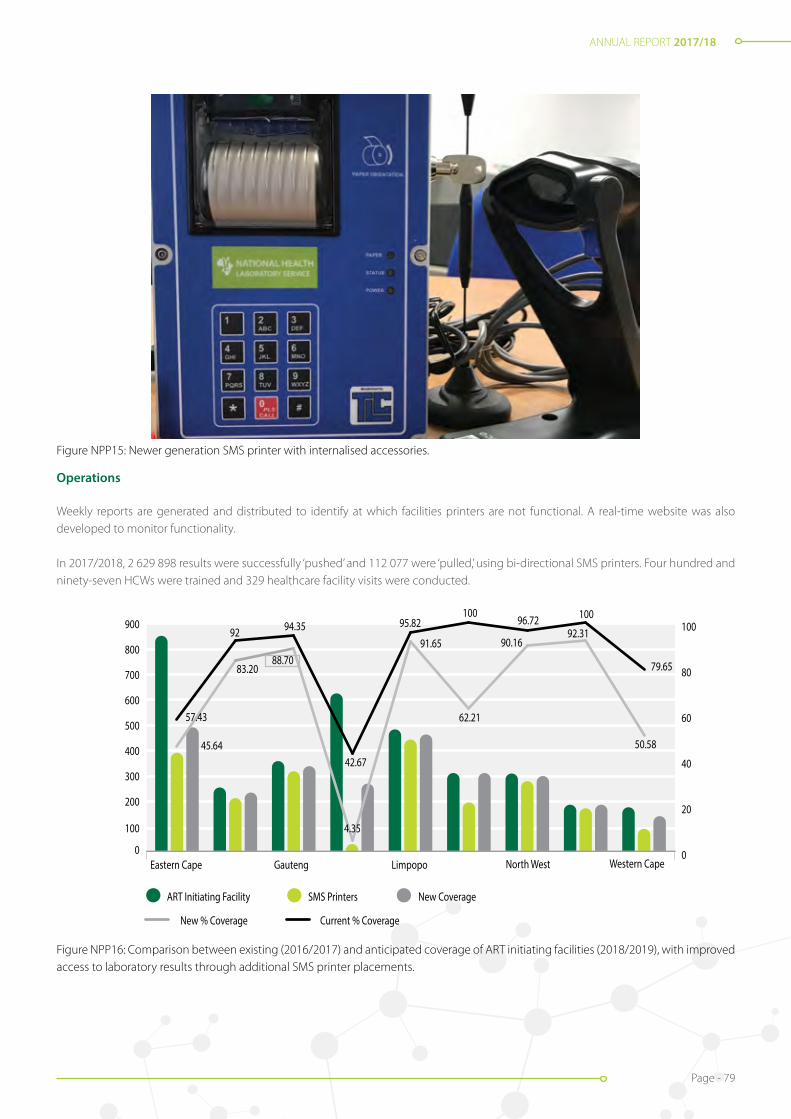
ANNUAL REPORT 2017/18
Page - 79
Figure NPP15: Newer generation SMS printer with internalised accessories.
Operations
Weekly reports are generated and distributed to identify at which facilities printers are not functional. A real-time website was also developed to monitor functionality.
In 2017/2018, 2 629 898 results were successfully ‘pushed’ and 112 077 were ‘pulled,’ using bi-directional SMS printers. Four hundred and ninety-seven HCWs were trained and 329 healthcare facility visits were conducted.
Figure NPP16: Comparison between existing (2016/2017) and anticipated coverage of ART initiating facilities (2018/2019), with improved access to laboratory results through additional SMS printer placements.
0
100
200
300
400
500
600
700
800
900
Eastern Cape Gauteng Limpopo North West Western Cape
ART Initiating Facility SMS Printers
New % Coverage Current % Coverage
New Coverage
0
20
40
60
80
10094.35
79.65
10096.72100
95.82
42.67
57.43
45.64
4.35
92
83.2088.70
91.65
62.21
90.1692.31
50.58
Figure NPP19: Comparison between existing (2016/2017) and anticipated coverage of ART initiating facilities (2018/2019), with improved access to laboratory results through additional SMS printer placements.

ANNUAL REPORT 2017/18
Page - 80
Research and development to support the national programmes
Research and development activities
Overview
The NPP Research and Development (RandD) group comprises a multidisciplinary team specialising in applied research and implementation of new laboratory diagnostics for HIV and TB and includes quality management systems of high to low throughput testing platforms as well as “big data” analytics. The group’s outputs under the leadership of Professor Lesley Scott contribute to improved services within the NHLS, knowledge transfer to the NPP, policy development for the DoH, and global quality management for several diagnostic tests.
Contributing to Africa and Global Innovation through Science: Verification and External Quality Assurance Programmes
Xpert MTB/RIF EQA Programme: The RandD team continues to support the dried culture spot technology programme (developed by the group) for verification and EQA of the Xpert MTB/RIF platform. In 2017, the programme supplied EQA material to 208 NHLS sites (326 instruments) and 75 international sites (90 instruments) across 28 countries. The programme is managed by SmartSpot Quality Pty (Ltd), the first spin-off company of Wits, and dried culture spot preparation is now semi-automated.
MTB Combo EQA Programme: The MTB Combo EQA, comprising the GenoType® MTBDRplus (HAIN diagnostics, Nehren, Germany) EQA and the Strip Interpretation Analysis (SIA) programmes, was initially trialled in collaboration with the AIDS Clinical Trial Group (ACTG), and expanded to 20 (22 instruments) sites in 2017. This programme includes educational support to sites performing the MTBDRplus assay and is also managed by SmartSpot Quality Pty (Ltd), who co-developed the web portal for result receipt and reporting.
HIV Viral Load Programmes: The RandD team supplies the South African Viral Quality Assessment (SAVQA) panel with instrument verification and evaluation. No new panels were prepared in 2017, but its bio repository was drawn from. The SAVQA panel was adapted for Xpert HIV-1 Viral Load (Cepheid, Sunnyvale, CA, USA) instrument verification.
The panel was stabilised using a molecular transport medium (Longhorn Diagnostics, San Antonia, TX, USA) to enable sites in remote areas to obtain quality assessment panels, without the requirement of refrigeration or complicated shipping with panel stability for 21 days. The verification panels were piloted in the 13 NHLS Point-of-care Xpert HIV-1 VL trial sites in November 2017 and all modules were successfully verified and additional staff training needs were identified. The RandD team developed the scoring and reporting templates which were automated through SmartSpot Quality Pty (Ltd).
Contributing to the National Health TB Policy: aiming for improvements in sensitivity of TB molecular diagnostics
Several new Laboratory TB diagnostics became available for early evaluation and collaborative ongoing development with the RandD group and industry partners as summarised below. Much experience was gained through these evaluations, which led to improved trial designs that are better equipped to provide pragmatic information and recommendations for national TB programmes.
One such outcome was the Xpert MTB/RIF Ultra, which, through collaboration with the Foundation for Innovative New Diagnostics, led to a ten-site (8 country) evaluation, WHO recommendations, and national implementation through the NPP. This study demonstrated improved sensitivity of the Xpert MTB/RIF Ultra assay, especially among HIV/TB co-infected individuals, over the existing Xpert MTB/RIF version.
Table NPP5: RandD activities in TB diagnostic platform evaluations and collaborationsIndustry partner TB diagnostic assay Laboratory evaluation Single (multiple) site
clinical evaluation National uptake and policy change
Roche Molecular MTB, MAI, MTB RIF/INH √
Hain Lifesciences FluoroType® MTB and FluoroType® MTBDR
√
Abbott RT MTB, RIF/INH √ √
Cepheid Xpert MTB/RIF Ultra √ √
Xpert MTB/RIF Ultra for EPTB √
ANNUAL REPORT 2017/18
Page - 81
The Xpert MTB/RIF assay was evaluated for its potential use in the diagnosis of childhood TB on stool specimens, and a prototype technology developed by Rutgers University was investigated.
The RandD group further adapted the dried culture spot programme together with SmartSpot Quality for use in the national implementation of the Xpert MTB/RIF Ultra, with a focus on the “Trace” result.
The HAIN FluoroType® MTB and FluoroType® MTBDR are two new assays being developed for use on the GenoXtract® 96 and Fluorocycler instruments from HAIN, as a potential automated option over the current MTBDRplus assay. Based on early results, software updates were performed in September 2017.
In addition, a protocol was developed for the storage of positive-Mycobacterium tuberculosis cultures on microbeads. This will allow multiple sub-cultures to be produced as opposed to the current storage method allowing for only one subculture. This will improve the material diversity and speed for laboratory evaluation studies on new platforms.
Data analytics translated into care
An NIH R21 study is underway in the Eastern Cape Province to evaluate laboratory and clinic indicators for TB transmission and control. In particular, the mean Xpert MTB/RIF cycle threshold (as measure of mycobacterial burden) is being investigated as a potential surrogate for community bacterial load, in facilities within the Eastern Cape. Data was collected from 62 clinics in the province and is being analysed.The Newton Medical Research Council/South Africa/United Kingdom funded project (“Technology supported systems for rapid impact on TB control”) to investigate mapping of molecular characteristics from the Xpert MTB/RIF assay across districts in SA, led to several collaborations with institutions such as IBM, Wits School of Public Health, Boston University, the LSHTM and BiTanium. NPP Xpert MTB/RIF data was cleaned and applied to various mapping software platforms. A draft dashboard is under development, with the aim to integrate it with the current HIV viral load dashboard.
Embracing future HIV testing needs with new molecular technologies
The use of “off-label” specimens for the Cepheid Xpert HIV-1 Viral Load (Xpert VL; Cepheid Sunnyvale, CA, USA) to expand viral load testing is ongoing. A clinical trial was completed in March-December 2017, to determine the potential of the Xpert HIV for HIV viral load testing using different blood collection tubes, whole-blood finger stick specimens (for true point-of-care testing), DBS and low volume EDTA-plasma and reports were prepared. Early results were shared at the 11th Interest Meeting.
Innovating the laboratory value chain
A new initiative within the Department of Molecular Medicine and Haematoglogy, to which the RandD group contribute, is the establishment of iLEAD (innovation: Laboratory engineered accelerated diagnostics) enabled through the Bill and Melinda Gates Foundation funding. The innovation focus areas across the laboratory value chain include patient local testing, specimen collection, specimen transport, and central laboratory testing and system-wide connectivity.
A pipeline of new technologies is being developed across the three collaborating centres:1. South Africa: Department of Molecular Medicine and Haematology – Prof Wendy Stevens; 2. Senegal: Institut de Recherche en Santé, de Surveillance Epidémiologique et de Formation [Institute for Health Research,
Epidemiological Surveillance and Training] (IRESSEF) – Prof Soulemayne Mboup; and3. Mozambique: Instituto Nacional de Saúde (INS) - Dr Ilesh Jani).
The product development phases include phase 0 (concept) through to phase 3 (clinical evaluation). An update on the pipeline is based on the endpoints for each project. Currently 15 projects were entered into the pipeline, ranging from biometrics for unique identification and finger stick point-of-care assay development - to new TB diagnostic platforms and re-engineered laboratory information systems.

ANNUAL REPORT 2017/18
Page - 82
Grant-funded activities to support national programmes
Global Fund to fight AIDS, TB and malaria (year 2)
The NHLS was awarded R98 800 262 for both HIV and TB activities for the entire grant period. The NHLS’s interventions are:
• Provision of Xpert MTB/RIF testing either on-site or at the nearest referral laboratory for improved case detection in the peri-mining communities;
• Provision of Xpert MTB/RIF testing either on-site or at the nearest referral laboratory for improved case detection in the DCS;
• Xpert MTB/RIF diagnosis in informal settlements;
• Provision of Xpert training for both clinical and laboratory staff;
• Provision of Infection Prevention and Control (IPC) training for the DCS
• Expansion of HIV viral load testing services to address gaps in service delivery; and
• Improving quality of HIV rapid testing in the field.
Provision of Xpert MTB/RIF testing for improved case detection in peri-mining communities
The NHLS’s interventions in this programme are to assist the DoH in improving TB/HIV case findings by working closely with Aurum Institute, another sub-recipient and the clinical partner, to screen and test for TB with the Xpert MTB/RIF in the peri-mining communities.In the previous round of Global Fund grant, the DoH identified six districts for the peri-mining community roll-out. These six districts are provided with Xpert MTB/RIF-equipped mobile laboratories. The mobile laboratories are run with two employees, a driver/clerk and a technician and are linked to the closest NHLS laboratory which support the mobiles for reagents, consumables, and overflow of Xpert specimens. The 2017/2018 activities are detailed in ‘Mines and Peri-Mining Communities TB Programme’ section, above.
Provision of Xpert MTB/RIF testing for improved case detection in the DCS
NHLS, as a pathology group, servicing the state sector in South Africa, is responsible for testing the inmate population in the DCS for TB diagnosis with the Xpert MTB/RIF test.
The success of this programme can be attributed to frequent visits to all the DCS management areas by the NHLS staff where all issues pertaining to a comprehensive care package are discussed and mentoring is done to ensure that DCS clinical staff follow the national testing guidelines and algorithms. The 2017/2018 activities are detailed in the ‘Department of DCS TB and HIV Programme’ section, above.
Provision of Xpert MTB/RIF training for both clinical and laboratory staff
The NHLS implemented the Xpert MTB/RIF test as the initial TB diagnostic test for individuals suspected of MDR-TB or HIV/TB from March 2011. Training of personnel is an ongoing process to support the DoH on the clinical algorithm and to train laboratory staff on the most efficient operation of the analysers, whilst ensuring result quality. The 2017/2018 activities are detailed in the ‘National Xpert MTB/RIF Testing Programme’ section, above.
Infection Prevention and Control (IPC) training for the DCS
Overview
On 11 December 2012, the Constitutional Court delivered a Judgement upholding an appeal against a decision of the Supreme Court of Appeal, which overturned the decision of the Western Cape High Court in an action for delictual damages. The case concerned a Mr. Lee who contracted TB while in prison. He sued the Minister for damages on the basis that poor prison health management caused his infection.
The High Court upheld the claim on the basis that the prison authorities failed to take “reasonable steps” to prevent Mr. Lee from contracting TB. Following the Judgement, in 2014, a National Task Team (NTT) was formed to address the issue of TB prevention in the DCS. The NTT included representatives of the DCS, the DoH and partners.
The Laboratory and Infection Prevention and Control (Laboratory/IPC) sub-committee working group of the NTT commenced with in-depth baseline IPC audits, which were conducted in 20 correctional centres spanning the six DCS management areas in the country. The centres were selected by the regional DCS health services leadership.

ANNUAL REPORT 2017/18
Page - 83
Operations
Professor Adriano Dusé, the IPC team at NHLS and Wits, together with the NPP, developed an IPC training course supported by trainer and trainee manuals. The first round of training was completed in 2016 and 205 health managers (nursing staff ) in the DCS were trained.A second round of training was completed in February 2018 in all six DCS regions countrywide that targeted security, food services, environmental hygiene officials, occupational health/safety officers, and supply chain management. An additional training session requested by the DCS for newly appointed regional coordinators was completed in the first week of December 2017.
Parallel to the second round of training for the DCS, the team conducted follow up assessments in all six regions. A Quality Improvement Tool (QIT) was developed and piloted which aims to track progress with the quality improvement interventions committed to by the facilities after training was completed. The QIT also provides guidance on addressing the findings raised by the in-depth baseline IPC assessments. These assessments were conducted according to a schedule approved by the DCS Commissioner on 23 March 2017.
The aim of the follow up visits was to assess whether sufficient measures were implemented in the DCS facilities to address the Constitutional Court expectation of “reasonable steps” being taken to prevent transmission of TB. A further series of enabling/support visits to selected centres has in the meantime commenced, with the aim of assisting DCS officials in implementing and monitoring IPC quality improvement projects.
Figure NPP17: IPC Training Session for DCS representatives, Protea Hotel, Tshwane.
Figure NPP18: IPC Training Session for DCS representatives during which the IPC trainee manual was piloted, Bloemfontein.
ANNUAL REPORT 2017/18
Page - 84
Outputs
Development of a DCS-specific IPC Policy: IPC SOPs to support the IPC Policy were completed in draft format and submitted to the DCS for inputs.
A DCS-approved IPC short audit tool was developed. This tool, currently in use, serves as a six monthly rapid IPC assessment tool which identifies key “red flag” issues. Initial training on the use of this tool was provided to 205 DCS health managers, consisting of nursing staff at facility and management levels.
The second round of training of 185 custodial and non-nursing officials was completed in February 2018. The evaluation forms completed by the attendees reflect that the training was understandable, “an eye opener”, practical, and applicable to all DCS officials.
Trainee and trainer DCS-specific IPC manuals were piloted, printed and used in the second round of training. The training curriculum, written especially for the DCS, was directly aligned to the assessed IPC needs of the DCS.
The QIT tool which was developed to assist the DCS with tracking of progress with the implementation of IPC interventions is a dynamic tool that can be adapted as the need arises. The tool covers all findings raised from the in-depth baseline assessments. It also provides guidance on the selection of three action items, at a time, for each of ten IPC themes derived from the in-depth DCS baseline audits, until all actions items are addressed.
The QIT furthermore details actions required and provides an assessment method, it prioritises ranks and actions, assigns responsibility, and requires timeframes for completion of actions. In addition, the tool allows derivation of a compliance score and progress measurement, adding significant value to the quality improvement programme.
Infection Prevention and Control Activities relating to the South African Police Service
Overview
In late 2016, the South African Police Service (SAPS) in the Eastern Province requested IPC TB training from the TB/HIV Care Association. The request was forwarded to Professor Dusé at Wits. The Laboratory/IPC working group committed to extending the model used for the DCS to address the issue of preventing TB transmission during periods that offenders are in police custody. The offender’s journey begins at the scene of arrest, continues through transport to the police holding cells and from there to the courts and back before incarceration at a DCS facility or release.
At several stages in this journey, there are points of aggregation at which the risk of transmission of not only TB, but other infectious diseases are high. It was considered vital to address the whole continuum of the offender’s journey in an effort to prevent disease transmission and to empower the police service personnel to apply basic principles of IPC in the cell blocks, in police transport vehicles, and in the court cells.
There was a further request to consider introducing an IPC module into basic police training in the police colleges. This is a unique initiative in the country and possibly the world. A steering committee was established to spearhead this work, which included the DoH, TB/HIV Care Association representatives, police representation at provincial and local cluster commander level, and representatives of the courts.
Operations
Five assessments of SAPS stations and cellblocks were completed, and findings raised were used to develop a draft audit tool for use across all SAPS facilities. Common themes were identified to inform an IPC TB training package. The training curriculum was developed and approved by SAPS and partners. Training dates were arranged, and training commenced in June 2017.
Seven hundred and eighty-seven SAPS officials in the Eastern Cape were targeted for training over 11 sessions in 2017. These officers represented the 22 clusters of police stations in the Eastern Cape Province. A formal ‘call-up instruction’ was issued by the provincial SAPS Office to the clusters.
Training materials were forwarded to the cluster commanders a week in advance of each training session. All the sessions were organised and attended by representatives of SAPS at provincial level. The partners and the Eastern Cape DoH were invited to attend and give input during training sessions. The involvement of the DoH in training has strengthened ties between the SAPS and the provincial DoH.

ANNUAL REPORT 2017/18
Page - 85
Outputs:
Development of an audit tool for SAPS police stations and holding cells.
Completion of five audits of police stations, large and small, rural and urban.
A SAPS-specific training programme in IPC was developed, piloted and amended as required. Eleven scheduled IPC SAPS training sessions were completed. 787 police officers were called up for training with 74% attendance of expected delegates on the first training day, and 61% attendance on the second day. Full buy-in, support and drive were received from top executives that form part of the Eastern Cape provincial management.
Marketing opportunities were identified by SAPS to showcase the initiative and encourage adoption by other provinces in South Africa.A medical screening form was developed and is being piloted in the Eastern Cape. The screening form will accompany the detainee to court and to the correctional facility on incarceration and will serve as an early warning of the need to separate and isolate presumptive TB sufferers on admission to DCS.
A medication control form was developed to assist in the continuity of care of detainees taking chronic and TB medication and to prevent defaulting on treatment. By venturing into training of police officials in IPC, the entire continuum of the offender’s journey will be covered. Medical screening and medication monitoring before the offender’s arrival at a DCS facility may ensure earlier separation, isolation, and continuity of medical care.
A pocket guide was developed and printed. Five hundred and fifty-five copies were handed over to the national SAPS at the last training session in Grahamstown in mid-November 2017.
Feedback on training was provided to a combined Department of Justice (DOJ)/DoH meeting on 6 February 2018. A plan of action for SAPS Eastern Cape structures to take IPC interventions forward was shared and feedback was received from the provincial office on plans to implement the medical screening form.
Figure NPP19: IPC practical activities for the SAPS representatives receiving respirator training, Aliwal North, August 2017.
Figure NPP20: IPC practical activities for the SAPS representatives where attendees were required to identify risk areas for TB transmission within respective units and propose solutions to minimise risk, October 2017.
Expansion of HIV Viral Load Testing Services to Address Gaps in Service Delivery:
OverviewThe NHLS provides HIV viral load testing services through 16 high throughput centralised laboratory sites throughout the country, but gaps remain in service coverage. A pilot is being undertaken to close identified service related delivery gaps through decentralisation of viral load testing services in South Africa.
A tiered, hybrid model was developed, consisting of centralised laboratory-based testing as well as more decentralised testing to facilitate improved access to viral load testing services, reduced viral load testing TATs and decreasing the testing burden at centralised sites. To this end, existing technology, which the NHLS already has extensive technical and operational expertise in, namely the Xpert platform (Cepheid) was implemented, utilising the new Xpert HIV-1 VL assay.
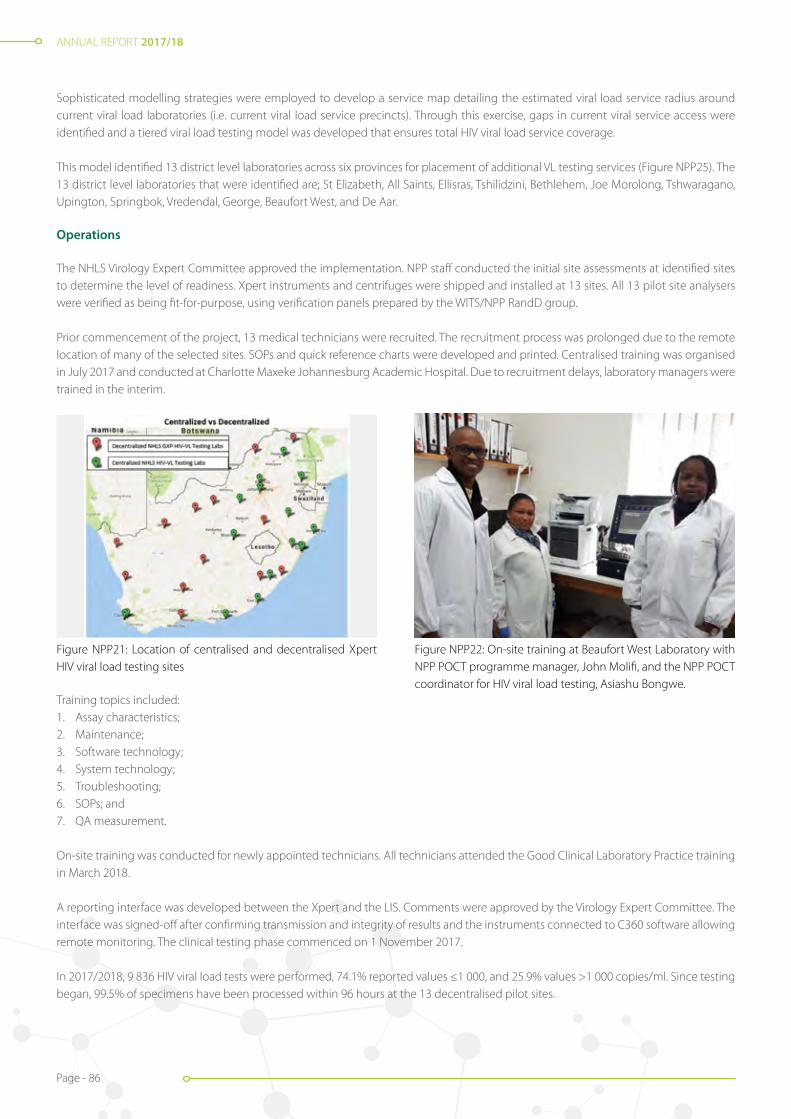
ANNUAL REPORT 2017/18
Page - 86
Sophisticated modelling strategies were employed to develop a service map detailing the estimated viral load service radius around current viral load laboratories (i.e. current viral load service precincts). Through this exercise, gaps in current viral service access were identified and a tiered viral load testing model was developed that ensures total HIV viral load service coverage.
This model identified 13 district level laboratories across six provinces for placement of additional VL testing services (Figure NPP25). The 13 district level laboratories that were identified are; St Elizabeth, All Saints, Ellisras, Tshilidzini, Bethlehem, Joe Morolong, Tshwaragano, Upington, Springbok, Vredendal, George, Beaufort West, and De Aar.
Operations
The NHLS Virology Expert Committee approved the implementation. NPP staff conducted the initial site assessments at identified sites to determine the level of readiness. Xpert instruments and centrifuges were shipped and installed at 13 sites. All 13 pilot site analysers were verified as being fit-for-purpose, using verification panels prepared by the WITS/NPP RandD group.
Prior commencement of the project, 13 medical technicians were recruited. The recruitment process was prolonged due to the remote location of many of the selected sites. SOPs and quick reference charts were developed and printed. Centralised training was organised in July 2017 and conducted at Charlotte Maxeke Johannesburg Academic Hospital. Due to recruitment delays, laboratory managers were trained in the interim.
Figure NPP21: Location of centralised and decentralised Xpert HIV viral load testing sites
Figure NPP22: On-site training at Beaufort West Laboratory with NPP POCT programme manager, John Molifi, and the NPP POCT coordinator for HIV viral load testing, Asiashu Bongwe.
Training topics included: 1. Assay characteristics;2. Maintenance;3. Software technology;4. System technology;5. Troubleshooting;6. SOPs; and7. QA measurement.
On-site training was conducted for newly appointed technicians. All technicians attended the Good Clinical Laboratory Practice training in March 2018.
A reporting interface was developed between the Xpert and the LIS. Comments were approved by the Virology Expert Committee. The interface was signed-off after confirming transmission and integrity of results and the instruments connected to C360 software allowing remote monitoring. The clinical testing phase commenced on 1 November 2017.
In 2017/2018, 9 836 HIV viral load tests were performed, 74.1% reported values ≤1 000, and 25.9% values >1 000 copies/ml. Since testing began, 99.5% of specimens have been processed within 96 hours at the 13 decentralised pilot sites.

ANNUAL REPORT 2017/18
Page - 87
RandD team will develop and set-up an EQA Programme for the Xpert HIV viral load sites. Participation in the EQA programme will run in two cycles in 2018/2019.
Improving quality of HIV rapid testing in the field
Overview
Rapid diagnostic tests (RDTs) or dip-sticks are performed in large numbers in both rural and urban settings but have little or no innate quality control and thus are difficult to monitor at a central level.
In South Africa, there are over 4 000 facilities which offer HIV Counselling and Testing (HCT) services to the public sector, using RDTs. Innovative solutions using wireless technologies such as reader/smartphone applications are a potential strategy to ensure quality assurance through automated test result interpretation and data capture for real-time quality monitoring.
One option which is commercially available and has already shown promise in malaria testing is the Deki Reader (Fio Corporation, Toronto, Canada). The Deki Reader is a small portable device that can provide automated result analysis, data capture, quality control checks and workflow prompting for any standard, commercially available lateral flow test strip.
Operations
A pilot laboratory validation to assess the performance (concordance and reproducibility) of the Deki Reader (V100) versus human visual result interpretation (gold standard) was completed on three commercially available HIV RDTs (viz., First Response, Determine and Uni-Gold). Overall, the Deki Reader had a 99.5% concordance (n=774 individual RDTs measured) with visual result interpretation.
These results prompted the development of the clinical evaluation protocol in collaboration with Right to Care (ethics approval #M150160). All contracts were approved, and the evaluation was conducted in two phases: Phase 2A and 2B. In preparation for Phase 2A, Fio Team visited South Africa to conduct training in April 2017. This training was aimed at two Right to Care sites: Thembalethu Clinic (Fixed Location Testing) and Dreams Team (Sub-District A and Sub-District B; Community testing).
Thirty-six staff members were trained on the usage of the Deki Reader and Fionet web portal, including managers and HIV counsellors. Phase 2A, which served to evaluate the Deki Reader robustness, operability, data capture, and connectivity capabilities, commenced in May 2017.
Twenty Deki readers were made available for this phase of the study (15 in use and five spare). Five Deki Readers were placed at the HCT services at the Right to Care offices, Helen Joseph Hospital, Johannesburg and ten Deki Readers were placed with Right to Care community teams working within sub-district A and B of the Johannesburg Health District.
During Phase 2A, between May and October 2017, 3 159 patients were tested for HIV with a positivity rate of 11.8% (374/3 159). The devices could collect, aggregate, and transmit 100% of the data uploaded. 95.41% of the patient records were uploaded within 10 minutes.
Phase 2B followed shortly after the completion of Phase 2A (from October 2017 to date). Phase 2B is currently being conducted to determine the performance (concordance) between visual interpretation by HCWs and the automated Deki Reader interpretation of residual HIV rapid tests used in HCT. The study is currently being conducted in collaboration with Right to Care (Thembalethu Clinic and Dreams Team) and Gauteng DoH facilities (Eyethu, OR Tambo, Diepsloot, Windsor, Hillbrow and Yeoville), where 23 Deki Readers were placed.
Prior to the commencement of Phase 2B, Fio staff visited South Africa to conduct training (October 2017) at all the selected sites and prepare the users. To date, 73 staff members were trained on the usage of the Deki Reader and Fionet web portal, including managers and HIV counsellors. From October 2017 to March 2018, 4 469 patients were tested for HIV, with an overall positivity rate of 10.7% (480/4 469). Phase 2B is currently ongoing and data is being analysed to determine feasibility for national scale up.
The V200 Deki Reader version has improved features such as a bigger screen, high definition 5MP camera, 2 USB ports, replaceable battery, on-board system check, total control of supply chain, walk-away and step-by-step workflows, amongst other changes. The new version is currently undergoing laboratory validation.
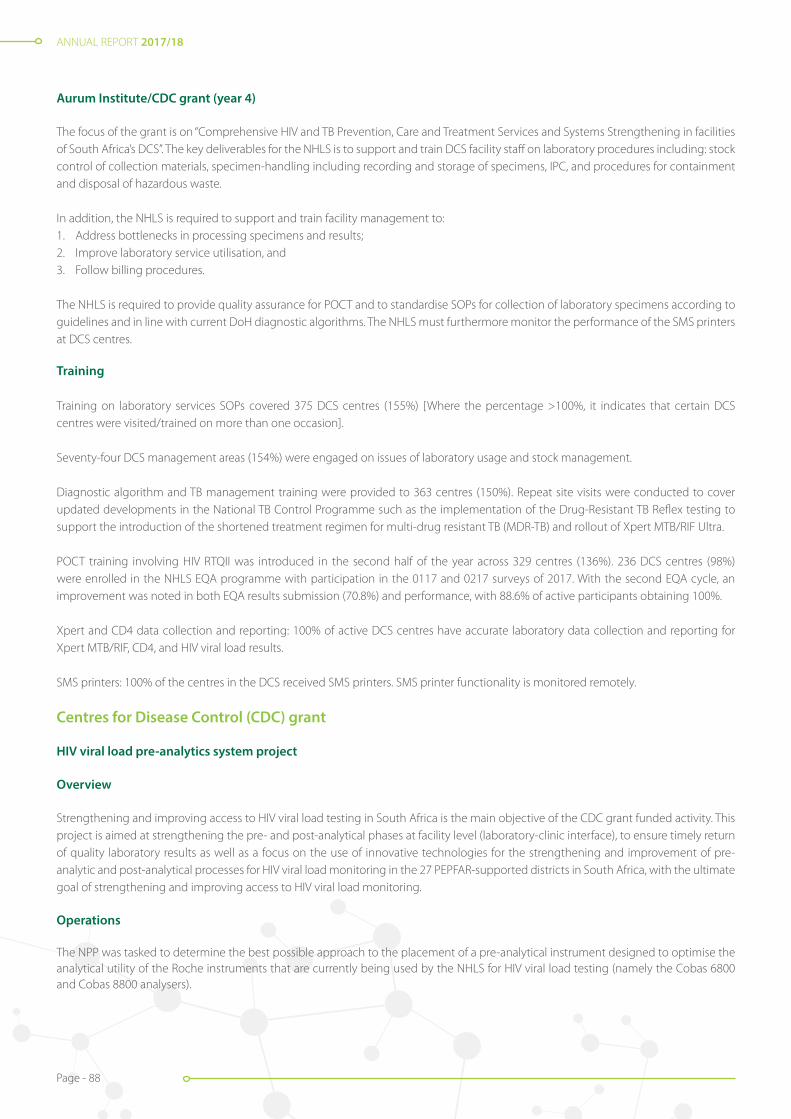
ANNUAL REPORT 2017/18
Page - 88
Aurum Institute/CDC grant (year 4)
The focus of the grant is on “Comprehensive HIV and TB Prevention, Care and Treatment Services and Systems Strengthening in facilities of South Africa’s DCS”. The key deliverables for the NHLS is to support and train DCS facility staff on laboratory procedures including: stock control of collection materials, specimen-handling including recording and storage of specimens, IPC, and procedures for containment and disposal of hazardous waste.
In addition, the NHLS is required to support and train facility management to:1. Address bottlenecks in processing specimens and results;2. Improve laboratory service utilisation, and3. Follow billing procedures.
The NHLS is required to provide quality assurance for POCT and to standardise SOPs for collection of laboratory specimens according to guidelines and in line with current DoH diagnostic algorithms. The NHLS must furthermore monitor the performance of the SMS printers at DCS centres.
Training
Training on laboratory services SOPs covered 375 DCS centres (155%) [Where the percentage >100%, it indicates that certain DCS centres were visited/trained on more than one occasion].
Seventy-four DCS management areas (154%) were engaged on issues of laboratory usage and stock management.
Diagnostic algorithm and TB management training were provided to 363 centres (150%). Repeat site visits were conducted to cover updated developments in the National TB Control Programme such as the implementation of the Drug-Resistant TB Reflex testing to support the introduction of the shortened treatment regimen for multi-drug resistant TB (MDR-TB) and rollout of Xpert MTB/RIF Ultra.
POCT training involving HIV RTQII was introduced in the second half of the year across 329 centres (136%). 236 DCS centres (98%) were enrolled in the NHLS EQA programme with participation in the 0117 and 0217 surveys of 2017. With the second EQA cycle, an improvement was noted in both EQA results submission (70.8%) and performance, with 88.6% of active participants obtaining 100%.
Xpert and CD4 data collection and reporting: 100% of active DCS centres have accurate laboratory data collection and reporting for Xpert MTB/RIF, CD4, and HIV viral load results.
SMS printers: 100% of the centres in the DCS received SMS printers. SMS printer functionality is monitored remotely.
Centres for Disease Control (CDC) grant
HIV viral load pre-analytics system project
Overview
Strengthening and improving access to HIV viral load testing in South Africa is the main objective of the CDC grant funded activity. This project is aimed at strengthening the pre- and post-analytical phases at facility level (laboratory-clinic interface), to ensure timely return of quality laboratory results as well as a focus on the use of innovative technologies for the strengthening and improvement of pre-analytic and post-analytical processes for HIV viral load monitoring in the 27 PEPFAR-supported districts in South Africa, with the ultimate goal of strengthening and improving access to HIV viral load monitoring.
Operations
The NPP was tasked to determine the best possible approach to the placement of a pre-analytical instrument designed to optimise the analytical utility of the Roche instruments that are currently being used by the NHLS for HIV viral load testing (namely the Cobas 6800 and Cobas 8800 analysers).
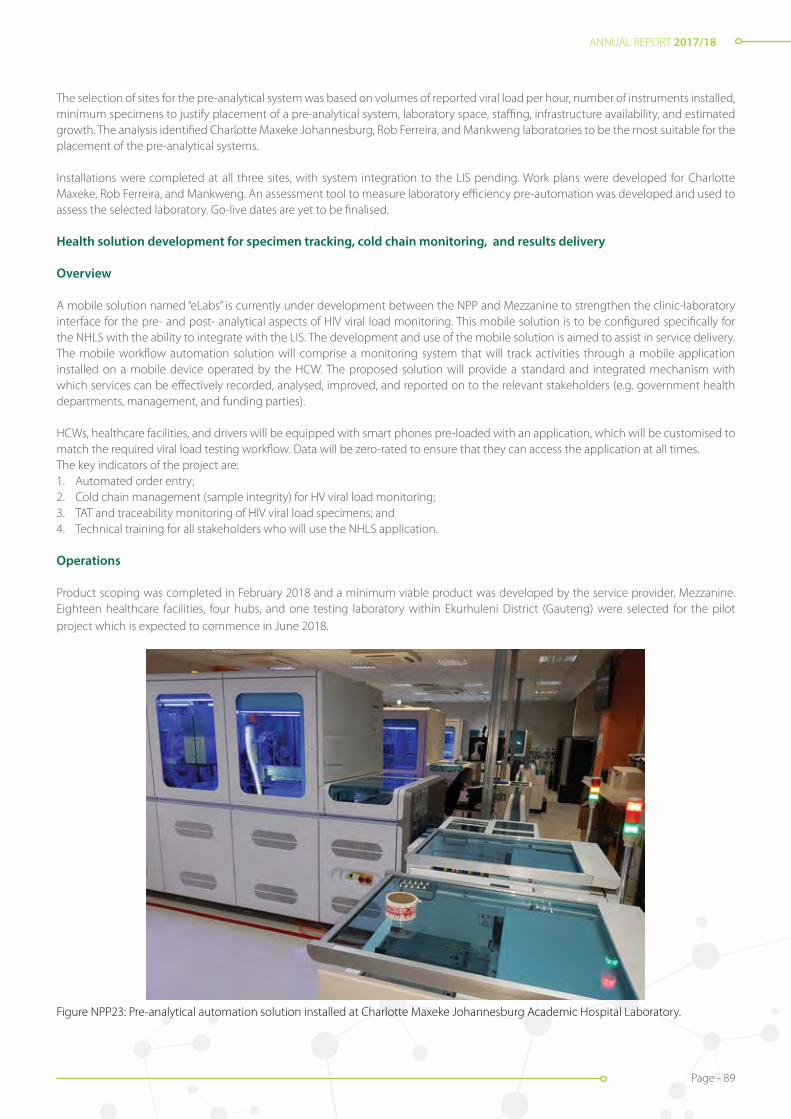
ANNUAL REPORT 2017/18
Page - 89
The selection of sites for the pre-analytical system was based on volumes of reported viral load per hour, number of instruments installed, minimum specimens to justify placement of a pre-analytical system, laboratory space, staffing, infrastructure availability, and estimated growth. The analysis identified Charlotte Maxeke Johannesburg, Rob Ferreira, and Mankweng laboratories to be the most suitable for the placement of the pre-analytical systems.
Installations were completed at all three sites, with system integration to the LIS pending. Work plans were developed for Charlotte Maxeke, Rob Ferreira, and Mankweng. An assessment tool to measure laboratory efficiency pre-automation was developed and used to assess the selected laboratory. Go-live dates are yet to be finalised.
Health solution development for specimen tracking, cold chain monitoring, and results delivery
Overview
A mobile solution named “eLabs” is currently under development between the NPP and Mezzanine to strengthen the clinic-laboratory interface for the pre- and post- analytical aspects of HIV viral load monitoring. This mobile solution is to be configured specifically for the NHLS with the ability to integrate with the LIS. The development and use of the mobile solution is aimed to assist in service delivery.The mobile workflow automation solution will comprise a monitoring system that will track activities through a mobile application installed on a mobile device operated by the HCW. The proposed solution will provide a standard and integrated mechanism with which services can be effectively recorded, analysed, improved, and reported on to the relevant stakeholders (e.g. government health departments, management, and funding parties).
HCWs, healthcare facilities, and drivers will be equipped with smart phones pre-loaded with an application, which will be customised to match the required viral load testing workflow. Data will be zero-rated to ensure that they can access the application at all times. The key indicators of the project are: 1. Automated order entry;2. Cold chain management (sample integrity) for HV viral load monitoring;3. TAT and traceability monitoring of HIV viral load specimens; and4. Technical training for all stakeholders who will use the NHLS application.
Operations
Product scoping was completed in February 2018 and a minimum viable product was developed by the service provider, Mezzanine. Eighteen healthcare facilities, four hubs, and one testing laboratory within Ekurhuleni District (Gauteng) were selected for the pilot project which is expected to commence in June 2018.
Figure NPP23: Pre-analytical automation solution installed at Charlotte Maxeke Johannesburg Academic Hospital Laboratory.

ANNUAL REPORT 2017/18
Page - 90
Area Manager: Tabita Makula
EASTERN CAPE REGION
IntroductionThe NHLS in the Eastern Cape (EC) offers laboratory services to all the public health facilities with different tiers of laboratories in five business units. The region maintained the same number of laboratories from the previous year, which is 38 laboratories and seven depots. The services are clustered into five business units which were previously named: Northern Transkei; Southern Transkei; Nelson Mandela Academic Laboratory; Border and Ibhayi. In the year under review, the region restructured the business units to align it to the Eastern Cape District Health System. The names of the business units were therefore changed, and some laboratories were repositioned with effect from 1 April 2017, as indicated in table EC1 below.. The new setup made it possible for the region to improve its communication and service delivery.
The region continued to offer excellent service to the DoH to improve patient outcomes. In partnership with the EC DoH strategies, cost saving mechanisms were implemented.
Table EC1: EC laboratories per health district
*Laboratories in OR Tambo which were grouped under Alfred Nzo and Joe Gqabi business units due to their geographic location.
Table EC2: Depots per health district
OR Tambo Amathole Alfred Nzo
Isilimela Tafalofefe Greenville
Qumbu Health Centre Maluti
Nessie Knight
Bambisana
Health District
Nelson Mandela Metropolitan
Sarah Baartman
Buffalo City Metropolitan
Amathole OR Tambo Chris Hani Alfred Nzo Joe Gqabi
Business Unit
Nelson Mandela & Sarah Baartman
Buffalo City and Amathole Nelson Mandela Academic Lab
OR Tambo & Chris Hani Alfred Nzo & Joe Gqabi
Laboratory Port Elizabeth Provincial Tertiary
Graaff Reinet East London (Frere) Tertiary
Butterworth Chemical Pathology
Zitulele Queenstown Regional
Matatiele Empilisweni
Livingstone Tertiary
Somerset East Cecilia Makiwane Regional
Madwaleni Haematology Canzibe Glen Grey Mt Ayliff Aliwal North
Dora Nginza Regional
Humansdorp Bisho Willowvale Microbiology St Barnabas
Hewu St Patricks Mt Fletcher
Uitenhage Grahamstown SS Gida TB Cradock Madzikane KaZulu
Port Alfred Victoria Cytology Cofimvaba *St Elizabeth Regional
Histology All Saints *Holy cross
Virology Cala *Dr Malizo Mpehle Memorial
Lab Support Services
9 laboratories 8 laboratories 8 laboratories 10 laboratories 10 laboratories
Performance information by Regions
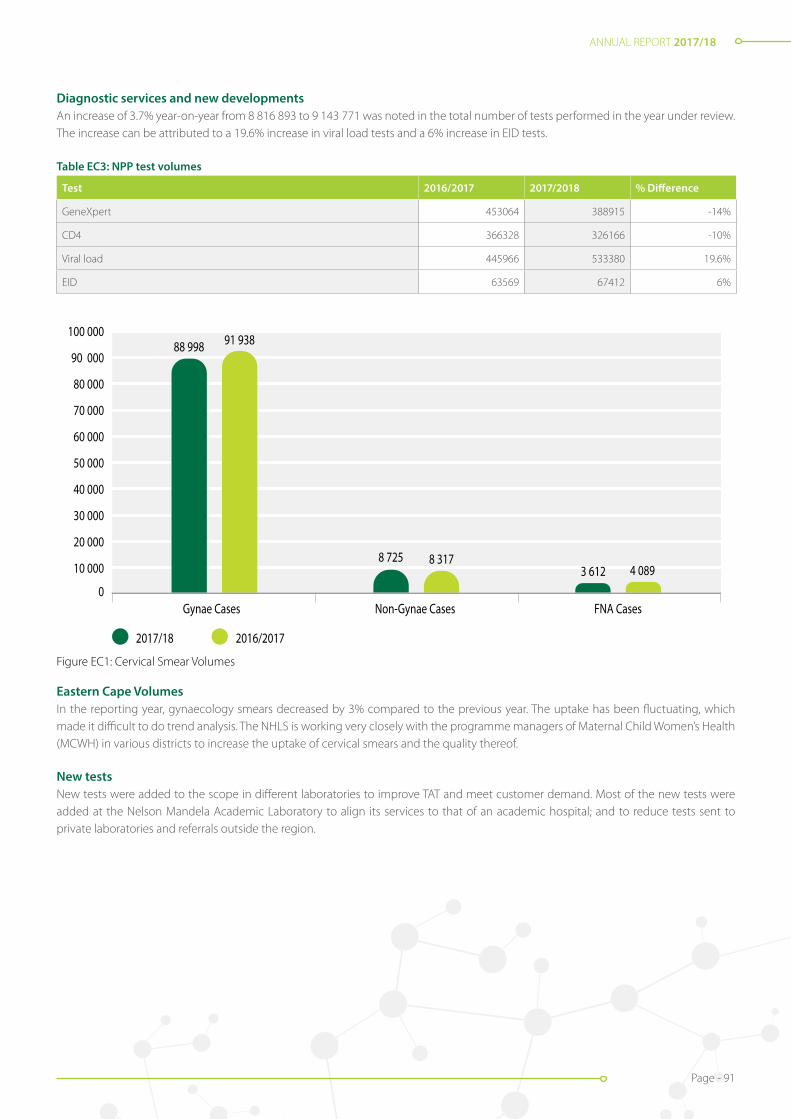
ANNUAL REPORT 2017/18
Page - 91
0
10 000
20 000
30 000
40 000
50 000
60 000
70 000
80 000
90 000
100 000
2017/18
Gynae Cases Non-Gynae Cases FNA Cases
2016/2017
8 7253 612 4 089
88 998 91 938
8 317
Figure EC1: Cervical smear volumes
Diagnostic services and new developmentsAn increase of 3.7% year-on-year from 8 816 893 to 9 143 771 was noted in the total number of tests performed in the year under review. The increase can be attributed to a 19.6% increase in viral load tests and a 6% increase in EID tests.
Table EC3: NPP test volumes
Test 2016/2017 2017/2018 % Difference
GeneXpert 453064 388915 -14%
CD4 366328 326166 -10%
Viral load 445966 533380 19.6%
EID 63569 67412 6%
Eastern Cape VolumesIn the reporting year, gynaecology smears decreased by 3% compared to the previous year. The uptake has been fluctuating, which made it difficult to do trend analysis. The NHLS is working very closely with the programme managers of Maternal Child Women’s Health (MCWH) in various districts to increase the uptake of cervical smears and the quality thereof.
New testsNew tests were added to the scope in different laboratories to improve TAT and meet customer demand. Most of the new tests were added at the Nelson Mandela Academic Laboratory to align its services to that of an academic hospital; and to reduce tests sent to private laboratories and referrals outside the region.
Figure EC1: Cervical Smear Volumes

ANNUAL REPORT 2017/18
Page - 92
Table EC4: New tests per laboratory
Business unit Laboratory New test
Nelson Mandela Academic Laboratory
Chemistry Insulin, Cortisol, ATPOA, Trop-T HS, Gentamycin, Digoxin, and Vancomycin and Electrophoresis
Virology Respiratory Synctial Virus (RSV) and Toxoplasma lgM and lgG
TB Line Probe Essay
Nelson Mandela and Sarah Baartman
Microbiology Clostridium difficile
Cytology Liquid Base Cytology
Buffalo City and Amathole EL Chemistry Pro-BNP
EL Cytology Liquid Base Cytology
Cecilia Makiwane HIV ELISA: TSH: T4 and Quant β -HCG
OR Tambo and Chris Hani Cofimvaba HBA1c
Queenstown, Cradock, Hewu, Glen Grey, St Barnabas Hepatitis B Surface antigen rapid
Canzibe Hepatitis B Surface antigen rapid, CRP and cholesterol
Service delivery and coverageThe laboratories at each of the five business units offer services to provide for the different levels of care across all eight health districts. Couriers are collecting specimens on a daily basis from hospitals and PHCs that have no on-site laboratory services. Central, tertiary, regional and large district laboratories offer a 24-hour service; and the medium and small district laboratories are on-call after hours and weekends.
Table EC5: Levels of healthcare per business unit
NHLS Business Unit Central Tertiary Regional District PHC DCS
Nelson Mandela Academic Lab 1 1 32 1
Nelson Mandela & Sarah Baartman 2 1 13 132 5
Buffalo City & Amathole 1 1 14 231 9
OR Tambo & Chris Hani 1 24 204 6
Alfred Nzo & Joe Gqabi 1 18 196 11
Total 1 3 5 69 795 32
Liquid base cytology (LBC) implementationOn 25 August 2017, the Cervical Cancer Control Policy (CCCP) was launched at the Frere Hospital in the Eastern Cape which prompted the installation of LBC equipment at East London (Frere) Cytology laboratory.
Immediately after the launch, Buffalo City clinics were trained on the method of collecting cervical smears for LBC, followed by Amathole and Joe Gqabi districts. By the end of financial year, nine sub districts from the three districts were using the LBC method.

ANNUAL REPORT 2017/18
Page - 93
Figure EC2: LBC equipment in East London and Port Elizabeth Cytology laboratories
The introduction of LBC increased the adequacy rate in all nine sub-districts by 16%.
Table EC6: Adequacy rate of Cervical Smears
District Sub-district Total Baseline
Buffalo City Bisho 63% 45%
Mdantsane 74% 56%
East London 65% 46%
Amathole Amahlathi 52% 36%
Mbhashe 52% 47%
Mnquma 53% 46%
Nkonkobe 47% 38%
Joe Gqabi Maletswai 87% 37%
Senqu 50% 42%
Total 58% 42%
Later in the financial year, Nelson Mandela Metropolitan and Sarah Baartman sub-districts were also trained. However, due to a late start, their adequacy rate could not be measured in the reporting year. OR Tambo district was also trained on LBC and implementation will commence in the new financial year.
In line with the NPP and in attempt to upscale viral load testing, St Elizabeth Regional laboratory in OR Tambo District and All Saints District laboratory in Chris Hani District received viral load near POCT equipment, to pilot viral load testing at their sites.
Turnaround Times (TAT) of NPP testsTAT targets were met for most of the tests in all the business units. The TB laboratories in Nelson Mandela Academic did not achieve its targets for GeneXpert and in Nelson Mandela and Sarah Baartman business units, TAT targets were not met for GeneXpert and TB microscopy respectively.
This was due to referred specimens with shared tests between microbiology and TB laboratories. All CD4 testing laboratories are earmarked to receive new equipment for CD4 tests in the new financial year, which will reduce equipment breakdown and improve TATs.

ANNUAL REPORT 2017/18
Page - 94
Figure EC3: Cecilia Makiwane state-of-the-art laboratory
Table EC:7 Turnaround time for measured tests
Business unit
TB microscopy in 40 hours
GXP in 40 hours
CD4 in 40 hours
Viral load in 96 hours
HIV PCR in 96 hours
Cervical smear in 312 hours
UE, LFT and FBC within 8 hours
Target 95% 95% 95% 70% 70% 70% 90%
Nelson Mandela Academic Laboratory 97% 84% 82% 76% 94% 96% 97%
Nelson Mandela and Sarah Baartman 85% 79% 96% 92% 76% 100% 93%
Buffalo City and Amathole 96% 99% 95% 73% ND 77% 92%
OR Tambo and Chris Hani 96% 97% 89% N/A N/A N/A 91%
Alfred Nzo and Joe Gqabi 98% 97% 94% N/A N/A N/A 91%
EC Region 90% 90% 92% 79% 86% 91% 92%
New laboratories and upgradesCecilia Makiwane Regional laboratory relocated from the old Celillia Makiwane Hospital to a state-of-the-art facility in the newly built Cecilia Makiwane Hospital. This was as a result of good partnership with the hospital right from the planning stages.
Taylor Bequest – Mt Fletcher and Mt Ayliff laboratories underwent minor infrastructure renovations in their mobile unit structures which assisted the laboratories with compliance to the Occupational Health and Safety Act (OHSA).
St Elizabeth Regional laboratory was allocated space to place a mobile unit on the hospital premises. Procurement and placement of the mobile unit is expected to be completed within the first quarter of the 2018/2019 financial year.
The floor of the mobile unit at Queenstown laboratory was sagging due to the weight of the analysers. The laboratory was renovated and restructured to an open plan to improve the workflow.
The kitchens of four laboratories, Hewu; Zitulele; St Barnabas and All Saints were renovated to improve the staff working environment. All Saints Laboratory was allocated extra space by the hospital to increase the workspace, and subsequently, some minor renovations were completed. A water purifier for drinking water and a tank were installed to ensure that the laboratory has as a contingency plan for instances when there is a water scarcity within the hospital.

ANNUAL REPORT 2017/18
Page - 95
Figure EC4: Dr. Malizo Mpehle Memorial laboratory staff celebrating their SANAS accreditation with the Area Manager, Business Manager and QA Coordinator
Figure EC5: Aliwal North Laboratory staff celebrating their SANAS accreditation with the Area Manager, Bbusiness Manager and QA Coordinator
A water distiller was installed at Cala laboratory to supply the OR Tambo business unit with distilled water, instead of having to order from Port Elizabeth.
Additional telephone lines were installed at Cala and Glen Grey laboratories to improve laboratory accessibility to clients.
Notable achievementsOne of the strategic objectives for the year under review, was to increase the percentage of SANAS-accredited laboratories in the NHLS. EC made history in the NHLS with two district laboratories recommended for initial SANAS accreditation in one month from the same business unit. The laboratories were Dr. Malizo Mpehle Memorial in OR Tambo National Health Insurance(NHI) pilot district and Aliwal North in Joe Gqabi District.
All the SANAS-accredited laboratories maintained their accreditation in the year under review.
Table EC8: Accredited laboratories
Business Unit Laboratory SANAS Lab Tier
Nelson Mandela Academic Lab
Chemical Pathology Accredited
National Central
Histopathology Accredited
Cytology Accredited
Haematology Accredited
Microbiology Accredited
TB Accredited
Virology Accredited
LSS Accredited
Nelson Mandela Bay and Sarah Baartman Bay
PE – Histopathology Accredited
Provincial Tertiary
PE – Cytopathology Accredited
PE – Haematology P2 Planned FY 18/19
PE – Microbiology Accredited
PE – Media/Glassware ISO 9001
PE – Tuberculosis Accredited
PE – Serology and Virology Accredited
PE – LSS Accredited
Livingstone – Chemical Pathology Accredited
Livingstone – Haematology Accredited
Livingstone – LSS Accredited
Dora Nginza – Clin Path and LSS Accredited Regional

ANNUAL REPORT 2017/18
Page - 96
0102030
4050
6070
8090
100
110
120
2018
Eastern Cape Region
Alfred Nzo & Joe Gqabi
OR Tambo &Chris Hani
Bu�alo City& Amathole
Nelson Mandela &Sarah Baartman
2017
93 92 93.688.1
93.4 94.689.5 89.8
94 94.5
Figure EC6: Quality compliance audits
Business Unit Laboratory SANAS Lab Tier
Buffalo city and Amathole
EL – Chemical Pathology Accredited
Provincial Tertiary
EL – Histopathology No accredited, no Pathologist
EL – Cytopathology Accredited
EL – Haematology Accredited
EL – Microbiology Accredited
EL – Serology Accredited
EL – LSS Accredited
Afred Nzo and Joe Gqabi BU Dr Malizo Mpehle Memorial Hospital (DRMMM) Accredited District (NHI pilot district)
Aliwal North Accredited
NHLS laboratories that are non-accredited are subjected to quality compliance audits to assess the laboratories’ compliance to the ISO 15189 standard. The region achieved an average of 93% compliance.
SLIPTA audits For the past two years, three regional laboratories that are not SANAS-accredited, were enrolled in SLIPTA, in preparation for SANAS accreditation. The laboratories achieved 3-star ratings in their exit audits and are earmarked for SANAS accreditation in the 2018/2019 financial year.
Table EC9: SLIPTA audit results
Laboratory name Baseline audit Exit audit
Cecilia Makiwane 73% (2-star rating) 80% (3-star-rating)
Queenstown 78% (3-star rating) 82% (3-star rating)
St Elizabeth 72% (2-star rating) 82% (3-star rating)
Uitenhage 63% (1-star rating) 75% (3-star-rating)
Port Alfred 76% (3-star-rating) 79% (3-star-rating)
Figure EC6: Quality compliance audits

ANNUAL REPORT 2017/18
Page - 97
Figure EC7: Nelson Mandela Academic laboratory celebrating a 100% pass rate for their student medical technicians
Figure EC8: Eastern Cape headcount
0
20
40
60
80
100
120
140
160
180
Area Manager
Business Managers
Pathologists
Medical O�cer
Registrar
QA Coordinators
Nurse Specialists
Supervisor Nursing Services
Lab Managers
Lab Supervisors
Medical Technologists
Medical Technicians
Lab Clerks
Phlebotomist and Pheb Technique
Lab Assistants
Messengers
Cleaners/Messe
ngers
Learners
OTHERS/SUPPORT
1 5 4 1 1 5 4 1
54
9
153
114
140
166
32
47 51
87
Three laboratories, namely Nelson Mandela Academic laboratory; East London and Port Elizabeth and Livingstone laboratories achieved continued HPCSA accreditation to train medical technologists and technicians.
It is worth noting that the region achieved a 100% pass rate for eight student medical technicians who completed their SMLTSA board exam in October 2017. All newly qualified technicians were offered permanent employment at the NHLS, and mostly in the district laboratories, to improve service delivery.
Port Elizabeth (PE) NHLS laboratory played a critical role in the very first successful faecal transplant at Livingstone Hospital for the treatment of unremitting Clostridium difficile associated diarrhoea. The PE NHLS laboratory successfully implemented the two-step algorithm for the diagnosis of Clostridium difficile infection. Prior to this, all specimens were sent to a private laboratory for testing. Since the implementation of this algorithm at the PE NHLS laboratory, the TAT has been significantly improved, cost savings have been earned and it has made a positive impact on patient care and infection, prevention and control (IPC) in general.
Headcount The total headcount increased from 701 in the previous year to 731 with a total of 88 vacancies. The increase was predominantly due to student intake.
Although the region experienced challenges in attracting pathologists in all disciplines, a microbiologist and a haematology registrar were successfully recruited for the Port Elizabeth Provincial Tertiary laboratory.
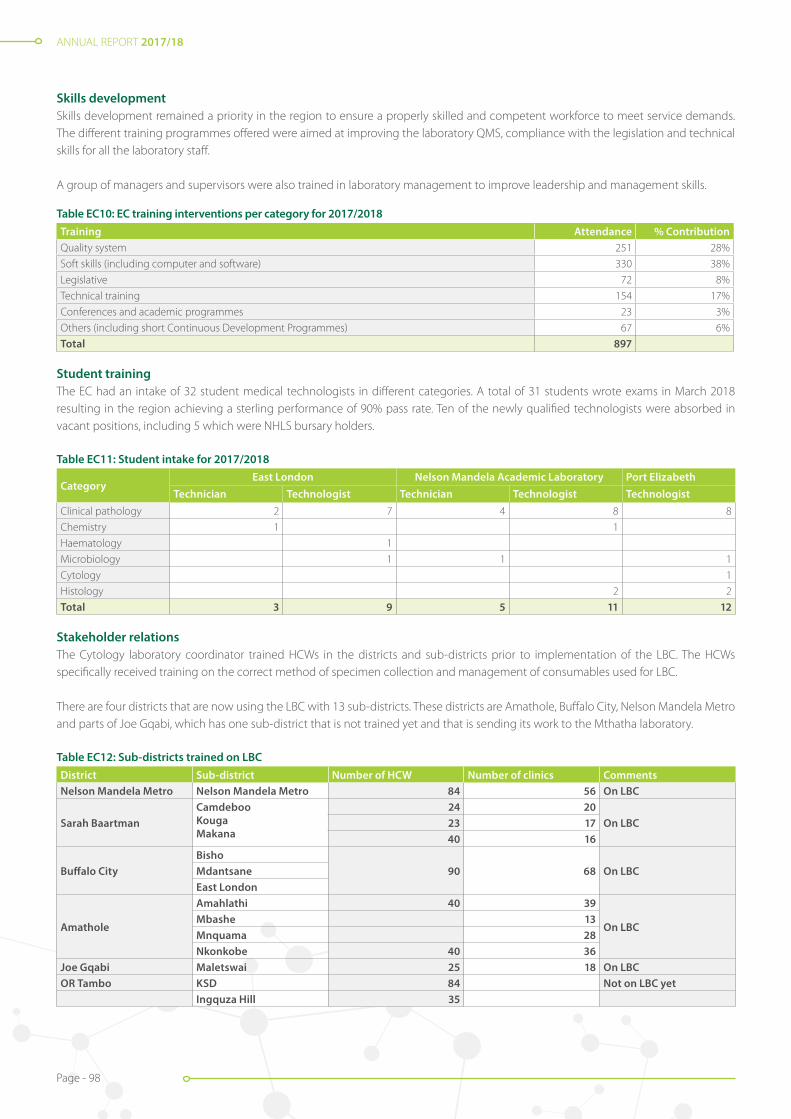
ANNUAL REPORT 2017/18
Page - 98
Skills developmentSkills development remained a priority in the region to ensure a properly skilled and competent workforce to meet service demands. The different training programmes offered were aimed at improving the laboratory QMS, compliance with the legislation and technical skills for all the laboratory staff.
A group of managers and supervisors were also trained in laboratory management to improve leadership and management skills.
Table EC10: EC training interventions per category for 2017/2018Training Attendance % ContributionQuality system 251 28%
Soft skills (including computer and software) 330 38%
Legislative 72 8%
Technical training 154 17%
Conferences and academic programmes 23 3%
Others (including short Continuous Development Programmes) 67 6%
Total 897
Student trainingThe EC had an intake of 32 student medical technologists in different categories. A total of 31 students wrote exams in March 2018 resulting in the region achieving a sterling performance of 90% pass rate. Ten of the newly qualified technologists were absorbed in vacant positions, including 5 which were NHLS bursary holders.
Table EC11: Student intake for 2017/2018
Category East London Nelson Mandela Academic Laboratory Port Elizabeth
Technician Technologist Technician Technologist TechnologistClinical pathology 2 7 4 8 8
Chemistry 1 1
Haematology 1
Microbiology 1 1 1
Cytology 1
Histology 2 2
Total 3 9 5 11 12
Stakeholder relationsThe Cytology laboratory coordinator trained HCWs in the districts and sub-districts prior to implementation of the LBC. The HCWs specifically received training on the correct method of specimen collection and management of consumables used for LBC.
There are four districts that are now using the LBC with 13 sub-districts. These districts are Amathole, Buffalo City, Nelson Mandela Metro and parts of Joe Gqabi, which has one sub-district that is not trained yet and that is sending its work to the Mthatha laboratory.
Table EC12: Sub-districts trained on LBCDistrict Sub-district Number of HCW Number of clinics CommentsNelson Mandela Metro Nelson Mandela Metro 84 56 On LBC
Sarah BaartmanCamdebooKougaMakana
24 20On LBC23 17
40 16
Buffalo CityBisho
90 68 On LBCMdantsaneEast London
Amathole
Amahlathi 40 39
On LBCMbashe 13Mnquama 28Nkonkobe 40 36
Joe Gqabi Maletswai 25 18 On LBCOR Tambo KSD 84 Not on LBC yet
Ingquza Hill 35
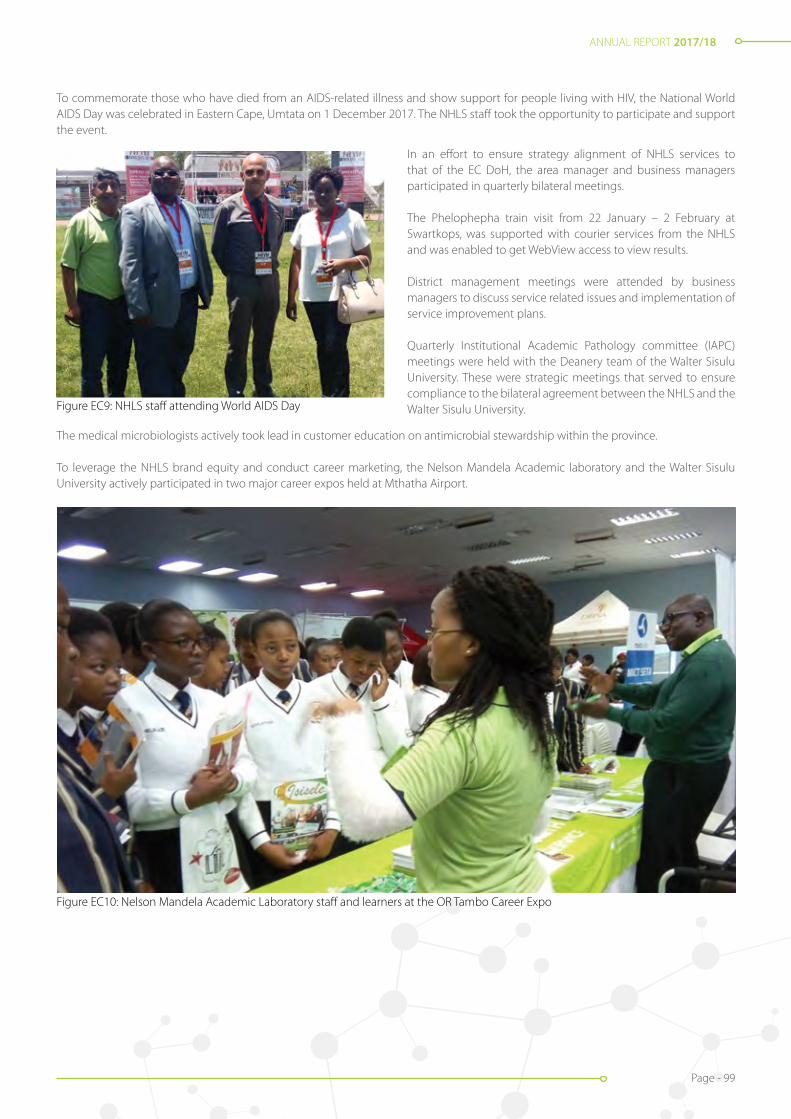
ANNUAL REPORT 2017/18
Page - 99
Figure EC10: Nelson Mandela Academic Laboratory staff and learners at the OR Tambo Career Expo
Figure EC9: NHLS staff attending World AIDS Day
To commemorate those who have died from an AIDS-related illness and show support for people living with HIV, the National World AIDS Day was celebrated in Eastern Cape, Umtata on 1 December 2017. The NHLS staff took the opportunity to participate and support the event.
In an effort to ensure strategy alignment of NHLS services to that of the EC DoH, the area manager and business managers participated in quarterly bilateral meetings.
The Phelophepha train visit from 22 January – 2 February at Swartkops, was supported with courier services from the NHLS and was enabled to get WebView access to view results.
District management meetings were attended by business managers to discuss service related issues and implementation of service improvement plans.
Quarterly Institutional Academic Pathology committee (IAPC) meetings were held with the Deanery team of the Walter Sisulu University. These were strategic meetings that served to ensure compliance to the bilateral agreement between the NHLS and the Walter Sisulu University.
The medical microbiologists actively took lead in customer education on antimicrobial stewardship within the province.
To leverage the NHLS brand equity and conduct career marketing, the Nelson Mandela Academic laboratory and the Walter Sisulu University actively participated in two major career expos held at Mthatha Airport.

ANNUAL REPORT 2017/18
Page - 100
A workshop on specimen collection, handling and shipping was conducted in various districts which led to a decrease in the specimen rejection rate.
Continued in-service training on EID was conducted throughout the year at identified facilities, to improve and manage MDOs.
The business units also conducted a customer satisfaction survey to identify gaps in service delivery. The results of the survey were analysed to inform the development of an action plan for improvement. The laboratory managers also visited the clinics to close the gaps.
Constant interaction strengthened our relationships with clients, including the DoH and DCS. These engagements took place at all levels. For example, laboratory managers attended hospital management and PHC meetings and conducted clinic visits.
ConclusionThe NHLS Eastern Cape region has once again shown commitment to offering a patient-centred laboratory service to the Eastern Cape community. Stakeholder relations grew from strength to strength through constant engagement. Laboratory upgrades boosted staff morale and provided meaningful, satisfactory work experiences.
The positive contribution made by Eastern Cape employees to achieve outstanding performance in the year under review, deserves recognition and appreciation. The dedication and enthusiasm demonstrated proved every employee to be an asset to the organisation.
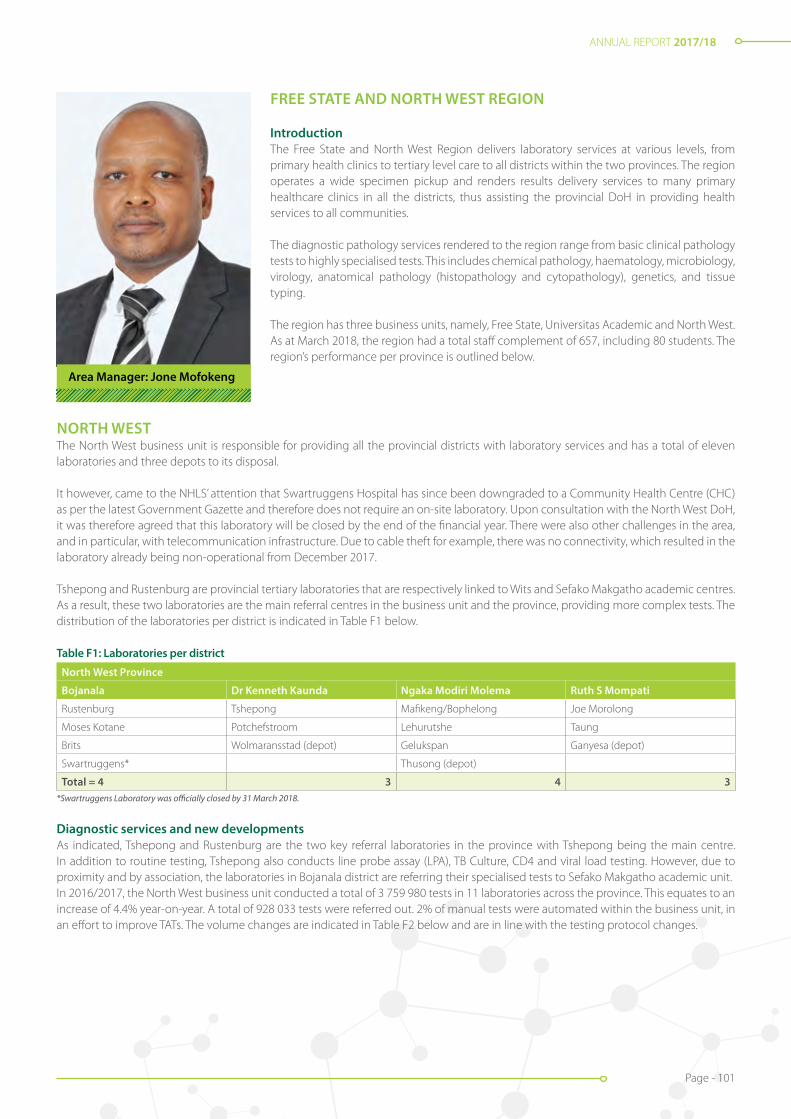
ANNUAL REPORT 2017/18
Page - 101
Area Manager: Jone Mofokeng
FREE STATE AND NORTH WEST REGION
IntroductionThe Free State and North West Region delivers laboratory services at various levels, from primary health clinics to tertiary level care to all districts within the two provinces. The region operates a wide specimen pickup and renders results delivery services to many primary healthcare clinics in all the districts, thus assisting the provincial DoH in providing health services to all communities.
The diagnostic pathology services rendered to the region range from basic clinical pathology tests to highly specialised tests. This includes chemical pathology, haematology, microbiology, virology, anatomical pathology (histopathology and cytopathology), genetics, and tissue typing.
The region has three business units, namely, Free State, Universitas Academic and North West. As at March 2018, the region had a total staff complement of 657, including 80 students. The region’s performance per province is outlined below.
NORTH WESTThe North West business unit is responsible for providing all the provincial districts with laboratory services and has a total of eleven laboratories and three depots to its disposal.
It however, came to the NHLS’ attention that Swartruggens Hospital has since been downgraded to a Community Health Centre (CHC) as per the latest Government Gazette and therefore does not require an on-site laboratory. Upon consultation with the North West DoH, it was therefore agreed that this laboratory will be closed by the end of the financial year. There were also other challenges in the area, and in particular, with telecommunication infrastructure. Due to cable theft for example, there was no connectivity, which resulted in the laboratory already being non-operational from December 2017.
Tshepong and Rustenburg are provincial tertiary laboratories that are respectively linked to Wits and Sefako Makgatho academic centres. As a result, these two laboratories are the main referral centres in the business unit and the province, providing more complex tests. The distribution of the laboratories per district is indicated in Table F1 below.
Table F1: Laboratories per district
North West Province
Bojanala Dr Kenneth Kaunda Ngaka Modiri Molema Ruth S Mompati
Rustenburg Tshepong Mafikeng/Bophelong Joe Morolong
Moses Kotane Potchefstroom Lehurutshe Taung
Brits Wolmaransstad (depot) Gelukspan Ganyesa (depot)
Swartruggens* Thusong (depot)
Total = 4 3 4 3*Swartruggens Laboratory was officially closed by 31 March 2018.
Diagnostic services and new developmentsAs indicated, Tshepong and Rustenburg are the two key referral laboratories in the province with Tshepong being the main centre. In addition to routine testing, Tshepong also conducts line probe assay (LPA), TB Culture, CD4 and viral load testing. However, due to proximity and by association, the laboratories in Bojanala district are referring their specialised tests to Sefako Makgatho academic unit.In 2016/2017, the North West business unit conducted a total of 3 759 980 tests in 11 laboratories across the province. This equates to an increase of 4.4% year-on-year. A total of 928 033 tests were referred out. 2% of manual tests were automated within the business unit, in an effort to improve TATs. The volume changes are indicated in Table F2 below and are in line with the testing protocol changes.
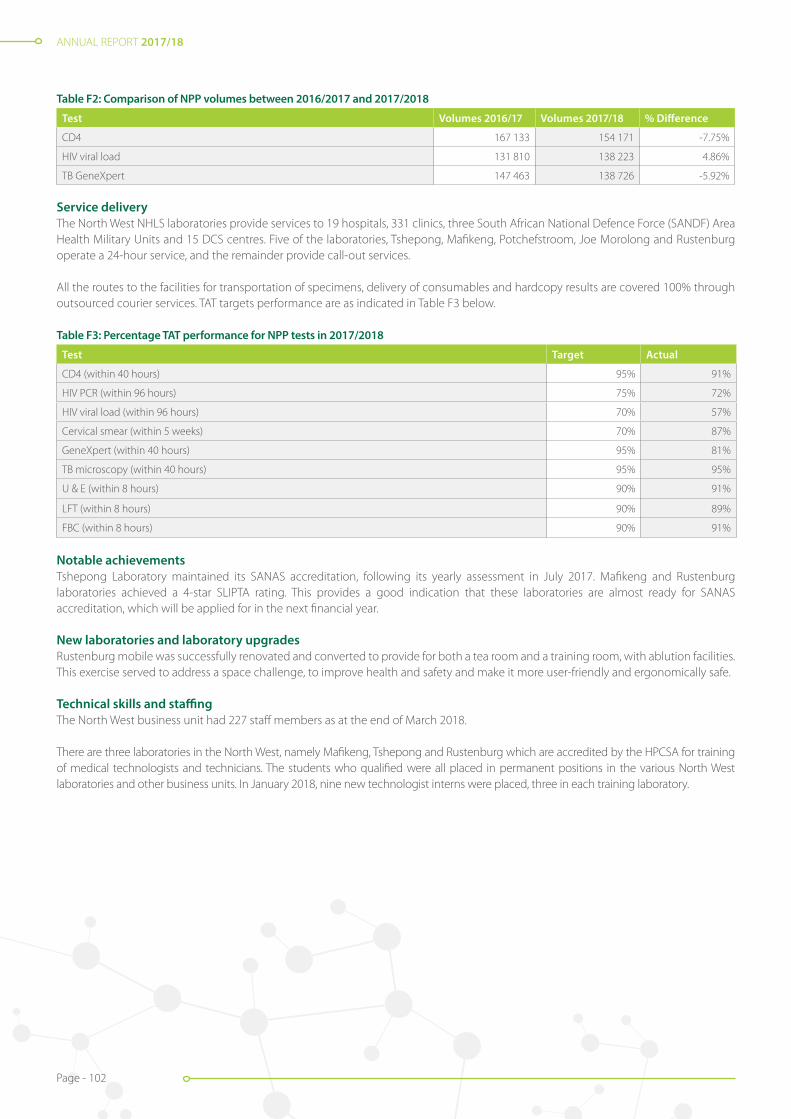
ANNUAL REPORT 2017/18
Page - 102
Table F2: Comparison of NPP volumes between 2016/2017 and 2017/2018
Test Volumes 2016/17 Volumes 2017/18 % Difference
CD4 167 133 154 171 -7.75%
HIV viral load 131 810 138 223 4.86%
TB GeneXpert 147 463 138 726 -5.92%
Service deliveryThe North West NHLS laboratories provide services to 19 hospitals, 331 clinics, three South African National Defence Force (SANDF) Area Health Military Units and 15 DCS centres. Five of the laboratories, Tshepong, Mafikeng, Potchefstroom, Joe Morolong and Rustenburg operate a 24-hour service, and the remainder provide call-out services.
All the routes to the facilities for transportation of specimens, delivery of consumables and hardcopy results are covered 100% through outsourced courier services. TAT targets performance are as indicated in Table F3 below.
Table F3: Percentage TAT performance for NPP tests in 2017/2018
Test Target Actual
CD4 (within 40 hours) 95% 91%
HIV PCR (within 96 hours) 75% 72%
HIV viral load (within 96 hours) 70% 57%
Cervical smear (within 5 weeks) 70% 87%
GeneXpert (within 40 hours) 95% 81%
TB microscopy (within 40 hours) 95% 95%
U & E (within 8 hours) 90% 91%
LFT (within 8 hours) 90% 89%
FBC (within 8 hours) 90% 91%
Notable achievementsTshepong Laboratory maintained its SANAS accreditation, following its yearly assessment in July 2017. Mafikeng and Rustenburg laboratories achieved a 4-star SLIPTA rating. This provides a good indication that these laboratories are almost ready for SANAS accreditation, which will be applied for in the next financial year.
New laboratories and laboratory upgradesRustenburg mobile was successfully renovated and converted to provide for both a tea room and a training room, with ablution facilities. This exercise served to address a space challenge, to improve health and safety and make it more user-friendly and ergonomically safe.
Technical skills and staffingThe North West business unit had 227 staff members as at the end of March 2018.
There are three laboratories in the North West, namely Mafikeng, Tshepong and Rustenburg which are accredited by the HPCSA for training of medical technologists and technicians. The students who qualified were all placed in permanent positions in the various North West laboratories and other business units. In January 2018, nine new technologist interns were placed, three in each training laboratory.

ANNUAL REPORT 2017/18
Page - 103
TrainingTraining was conducted in line with the workplace skills development plan (WSP) and attendance is indicated in Table F4 below.
Table F4: WSP Training 2017/2018
Training interventionNumber of employees Training intervention
Number of employees
Bacteriology workshop 3 Health & safety representative 1
Diversity management train the trainer 2 FLLM leadership and development 10
Employment equity 5 Initiating and chairing disciplinary hearing skills 14
Excel 6 ISO 9001 3
Excel 2 1 Morphology training 14
Excel 3 1 Parasitology 4
Fire warden 6 Post Graduate Diploma in Business Management 1
Speed typing 5 Time management 1
TrakCare super user training 5
Total: 82
Stakeholder relationsThe SLA between the NHLS and the North West provincial DoH is in place and current. This SLA is however expected to be reviewed on an annual basis and to be updated accordingly, should it be necessary. The prescribed meetings between the two parties were conducted in the period under review.
The NHLS participated fully in relevant health campaigns, including the Cervical Cancer Campaigns during the month of September.The region operates mobile laboratories in conjunction with Rustenburg and Potchefstroom laboratories. These are largely used in the peri-mining communities, to provide on-the-spot testing of TB, and other services during HIV/AIDS and Sexually Transmitted Diseases and TB (HAST) campaigns.
FREE STATE
The Free State province is serviced by two NHLS business units, namely the Universitas Academic Unit and the Free State Business Unit. Universitas is servicing the academic hospital, including the National district hospital, while the Free State Business Unit is servicing the Pelonomi provincial tertiary hospital and the rest of the hospitals in the province.
Pelonomi and Universitas laboratories are the pathology training platforms associated with the University of the Free State Medical School. For this reason, these two laboratories are also the main referral centres that provide full pathology services, including paternity testing. The distribution of the laboratories per district is indicated in the Table F5 below.
Table F5: Free State laboratories per district
Free State ProvinceFezile Dabi Lejweleputswa Motheo Thabo Mofutsanyane
Sasolburg Bongani Hospital Universitas Academic Hospital Dihlabeng Hospital
Boitumelo Hospital National District Hospital Mofumahadi Manapo Mopedi Hospital
Pelonomi Tertiary Hospital
Botshabelo District Hospital
Total = 2 1 4 2

ANNUAL REPORT 2017/18
Page - 104
Diagnostic services and new developments
Universitas as the tertiary laboratory in the province is conducting the majority of the specialised tests, except for the CD4 testing which is done at Pelonomi laboratory. CD4 testing is however also conducted at Welkom and Manapo regional laboratories. The total provincial statistics are in line with the 90-90-90 policy and are indicated in Table F6 below.
Table F6: Comparison of NPP volumes between 2016/2017 and 2017/2018Test Volumes 2016/2017 Volumes 2017/2018 % DifferenceCytology 86 571 81 977 -5.3%
CD4 182 877 164 650 -9.97%
HIV DNA PCR 42 795 43 389 1.38%
HIV viral load 328 380 351 449 7.02%
TB GeneXpert 109 932 103 293 -6.04%
Service delivery
The Free State Business Unit has seven laboratories which provide services to 225 PHC facilities and 10 CHCs. These laboratories also service 15 other district hospitals and 18 correctional service units. Universitas Laboratory is also responsible for servicing the national district hospital, as well as 3-Military Hospital. The NHLS has an outsourced courier service provider who is responsible for the collection of specimen and delivery of results and consumables. The routes are covered 100% and collection occurs daily, on week days. TAT results are indicated in Table F7 below.
Table F7: Percentage TAT performance for NPP tests in 2017/2018Test Target Actual Test Target ActualCD4 (within 40 hours) 95% 83% TB microscopy (within 40 hours) 95% 94%
HIV PCR (within 96 hours) 75% 80% UandE (within 8 hours) 90% 95%
HIV viral load (within 96 hours) 70% 57% LFT (within 8 hours) 90% 95%
Cervical smear (within 5 weeks) 70% 97% FBC (within 8 hours) 90% 93%
GeneXpert (within 40 hours) 95% 90%
Kroonstad SANAS celebration
Notable achievements
Kroonstad Laboratory was fully accredited by SANAS in this reporting period and is currently the only regional laboratory accredited in the province and the region. Pelonomi provincial tertiary laboratory was also SANAS-accredited in this financial year. Universitas maintained its SANAS accreditation following the annual assessment, except for in one department, namely genetics.
New laboratories and laboratory upgrades
In pursuit of state-of-the-art laboratories, Welkom Laboratory is earmarked for major renovations to improve its workflow and increase its total capacity. Professional consultants were appointed to design the anticipated changes and manage the project. The actual renovations will be completed in the next financial year. Minor renovations were also done to upgrade the Bethlehem call room.
NHLS Pelonomi Staff Photo

ANNUAL REPORT 2017/18
Page - 105
Technical skills and staffing
The Free State province had 349 staff members as at the end of March 2018. There was an increase of 24 staff members, mainly because of insourcing of cleaners and security staff. Two QA coordinators were appointed to support all laboratories in maintaining excellent total QA and to work towards maintaining and attaining SANAS accreditation.
Universitas, Pelonomi, Welkom and Kroonstad laboratories are all accredited by the HPCSA for the training of medical technicians and technologists. Universitas is also accredited for the training of pathologists (registrars) and scientists.
Training
Training was conducted in line with the WSP and attendance is indicated in Table F8 below.
Table F8: Free State WSP training in 2017/2018
Training intervention Number of employees Training intervention Number of employees
Bacteriology workshop 4 Conflict management 1
Diploma in Procurement 1 Employment equity 3
Excel 21 Firefighting training 8
Fire warden 7 First aid 12
FLLM leadership and development 14 Haemoglobinopathy workshop 1
Initiating and chairing disciplinary hearing skills 14 International Conference of Human Genetics Diseases and Disorders
2
Morphology training 1 MTAC verification method 1
Oracle purchasing 1 Parasitology 5
Speed typing 5 Stock control management 2
TrakCare 1 TrakCare super user 12
Total: 116
Stakeholder relations
The NHLS was well represented at and supported health commemoration events such as World AIDS Day and World TB Day and fully participated in relevant health campaigns, including the Cervical Cancer Campaigns during the month of September.
The province operates a mobile laboratory in conjunction with Welkom Laboratory. This is mainly used to reach out to the peri-mining communities for on-the-spot testing of TB, and during HIV/AIDS and Sexually Transmitted Diseases and TB (HAST) campaigns.
The relationship with the University of Free State is governed by the Umbrella Agreement and the mandatory meetings and engagements such as the IAPC took place as prescribed, during this reporting period.
The SLA between the NHLS and the Free State provincial DoH is in place and current. The prescribed meetings between the two parties were held during the period under review. The relationship with FSDoH, our major stakeholder, remained strong and positive, with Blood and Laboratory User Committee (BLUC) meetings assisting with managing the laboratory – clinician interface.
ANNUAL REPORT 2017/18
Page - 106
Area Manager: Bahule Motlonye
GAUTENG REGION
Introduction
Gauteng is situated in the Highveld and is the smallest province in South Africa, accounting for only 1,5% of the land area. Nevertheless, it is highly urbanised, containing the country’s largest city, Johannesburg, its administrative capital Pretoria and other large areas such as Midrand and Vanderbijlpark.
Gauteng is the most populous province in South Africa with a population of approximately 14 million which places a tremendous strain on the health budget due to the influx of the people into the province.
The NHLS Gauteng region provides services to a network of academic, provincial tertiary, regional, district hospitals and PHC facilities. These are distributed across the five districts within the Gauteng Province.
Laboratories per district
Tshwane Ekurhuleni City of Johannesburg Sedibeng West Rand
Tshwane Academic Division Tembisa Provincial Tertiary Charlotte Maxeke Academic
Sebokeng Regional Leratong Regional
Dr George Mukhari Academic Tambo Memorial Regional Chris Hani Baragwanath Academic
Kopanong District Dr Yusuf Dadoo District
Kalafong Provincial Tertiary Pholosong Regional Helen Joseph Provincial Tertiary
Carletonville District
Mamelodi Regional Far East Rand Regional Edenvale Regional
Jubilee District Thelle Mogoerane Regional South Rand District
Odi District Bertha Gxowa District Braamfontein Complex
The region is divided into six business units, with a footprint across the entire five districts in the province, as outlined above. The NHLS serve as referral sites for some of the local provinces, as well as sites outside the borders of South Africa, including Southern African Development Community (SADC) countries and other African states.
Diagnostic services and new developments
The laboratories completed a total of 25 511 122 tests in this reporting period which is an increase of 2,7% compared to the 2016/2017 financial year. The work was performed across the different business units with highest volumes being conducted in Ekurhuleni Tshwane, followed by Johannesburg, Sedibeng and West Rand. These business units service the bulk of the primary health facilities.
Business units – workload distribution FY 16/17 FY 17/18
Charlotte Maxeke Academic (CMAH) 4 479 986 4 741 059
Chris Hani Baragwanath Academic (CHB) 4 271 335 4 154 455
Tshwane Academic Division (TAD) 3 676 559 3 912 317
Dr George Mukhari Academic (DGM) 2 428 875 2 382 819
Johannesburg, Sedibeng and West Rand (JSW) 4 887 883 4 970 994
Ekurhuleni and Tshwane (ET) 5 076 382 5 349 478
24 821 020 25 511 122
The region has laboratories on sites in four central, three provincial tertiary, eight regional, and seven district hospitals across the province. In addition, the NHLS has three depots located in different districts.
The latest inclusion in the NHLS family is the Nelson Mandela Children’s Hospital (NMCH) which the institution started servicing from February 2018.

ANNUAL REPORT 2017/18
Page - 107
0
1 000 000
2 000 000
3 000 000
4 000 000
5 000 000
6 000 000
2017/2018
ET JSW DGM TAD CHB CMJAH
2016/2017
Business Units – Workload
0
500 000
1 000 000
1 500 000
2 000 000
2 500 000
3 000 000
2016/17
Apr May Jun Jul Aug Sept Oct Nov Dec Jan Feb Mar
2017/18
Gauteng Workload
The NHLS continues to work closely with the Gauteng Department of Health (GDoH) and supports all the National Priority Programmes (NPP): TB, Cervical Screening and HIV/AIDS. The data above demonstrates the volumes that were processed in NHLS laboratories in the 2017/2018 financial year.
NPP volumes
Tests 2016/17 2017/18 Difference % Increase Comment
Viral load 1 240 003 1 348 740 108 737 8,7% Increase
HIV PCR (EID) 273 353 273 845 492 0,1% Increase
CD4 762 760 661 337 (101 423) -13% Decrease (due to policy changes)
Gene Xpert 386 496 332 478 (54 018) -14% Decrease
Apr May June July Aug Sep Oct Nov Dec Jan Feb Mar
FY 16-17 2022957 1933491 1995228 1975062 1969009 2143072 2104811 1831382 1849684 1849684 2391519 2361645
FY 17-18 2054256 2184738 2124199 1967553 2046782 2323440 2071982 2261040 1912420 2056430 2171785 2336497
ANNUAL REPORT 2017/18
Page - 108
Cervical screening volumes
Tests 2016/17 2017/18 Difference % Increase Comment
Gynaecological 307 756 306 999 (757) - 0,25% Decrease
Non-gynaecological 37 222 17 425 (19,797) - 53% Decrease
Fine Needle Aspiration (FNA) 16 152 14 491 1,661 - 10% Decrease
New tests
Charlotte Maxeke introduced the following new tests:
Department New tests Test type
Chemical pathology Therapeutic drug monitoring for ART drugs
Tenofovir, Lopinavir, Zidovudine, Ritonavir, Efavirnez, Emtricitabine, Nevirapine, Lamivudine, Dolutegravir and Atazanavir
Virology Hepatitis A – IgG
Infection control Influenza A
Influenza B
RSV respiratory virus
Pneumocystis jirovecii
Service delivery and coverage
The NHLS delivers these services with a total staff compliment of 2021, which include training staff, pathologists, scientists, medical technologists, medical technicians and other support functions.
A 100% Clinic-Laboratory specimen collection coverage was maintained, and the optimisation of routes allowed for increased frequency, especially at the community health centres.
There is improved interaction between the NHLS and the Gauteng health facilities and HCWs to address identified challenges and enhance working relationships.
As indicated in the previous annual report (FY2016/2017), the NHLS delivered on its mandate by providing support to the Gauteng DoH in the implementation of the new Primary Health Care (PHC) handbook and request forms. This was initiated on 24 January 2018 and was subsequently rolled out in April 2018 throughout the province.
Laboratory Interface (CLI), a CLI coordinator was appointed who will commence work in June 2018. The intention of the appointment is to ensure that we foster a good relationship with the Gauteng DoH and improve the overall quality of service.
Turnaround times (TATs)
Even though some of the KPI targets for 2017/2018 were not met, the region’s performance improved compared to the previous financial year and we continue to search for new ways to achieve excellence.
We developed intervention strategies during the period under review and towards the end of the financial year, targets were met. The regional TAT performance is demonstrated in the table below:TATs for Gauteng Region
Data Source CDWAnnual target
2017/18 Actual performance 2017/18Percentage TB microscopy tests performed within 40 hours 95% 98%
Percentage TB GXP tests performed within 40 hours 95% 89%
Percentage CD4 tests performed within 40 hours 95% 94%
Percentage viral load tests performed within 96 hours 70% 94%
Percentage HIV PCR tests performed within 96 hours 75% 80%
Percentage cervical smear tests performed within 5 weeks 70% 90%
Percentage laboratory tests (FBC) performed within 8 hours 90% 95%
Percentage Laboratory tests (U&E) performed within 8 hours 90% 87%
Percentage Laboratory tests (LFT) performed within 8 hours 90% 86%

ANNUAL REPORT 2017/18
Page - 109
Thelle Mogoerane: Placement of a new Chemistry Analyser:CH Baragwanath: Chemistry Analyser
The table below indicates the various business units’ contribution to the TAT performance. It is worth noting that the environment that each business unit operates in is not only dynamic, but also presents different challenges, which calls for a flexible approach that allows for mitigating these challenges differently as well.
TATs per business unit TB microscopy Gene Xpert CD4 tests Viral load HIV PCR Cervical smears
Target95% within
40 hours95% within
40 hours95% within
40 hours70% within
96 hours75% within
96 hours70% within
5 weeksChris Hani Baragwanath 99% 90% 98% n/a 97% n/a
Johannesburg, Sedibeng and West Rand 97% 85% n/a n/a n/a 84%
Dr George Mukhari Academic 95% 84% 95% 89% n/a 88%
Charlotte Maxeke Academic 96% 84% 90% 95% 76% n/a
Tshwane Academic Division 99% 90% 95% n/a 72% 99%
Ekurhuleni Tshwane 99% 94% 95% n/a n/a n/a
Notable achievements
Accreditation: The following laboratories maintained the ISO 15189 accreditation in all their divisions: Charlotte Maxeke Academic, Dr George Mukhari Academic, Chris Hani Baragwanath, Tshwane Academic Division (Steve Biko) and Braamfontein Complex (TB Laboratory, Immunology and Cytology).
Helen Joseph Provincial Tertiary received SANAS accreditation in November 2017 and Tambo Memorial applied for a SANAS assessment in March 2018. Increasing the number of accredited laboratories. This will continue to be a focus area for the region.
Laboratories upgrading
Chris Hani Baragwanath Academic: Upgraded to a new Roche platform, which is a fully automated system with a track system and high throughput to improve TATs, general efficiency and improve productivity.
The emergency laboratory also received a new Roche 501 analyser which will enable the laboratory to operate seamlessly, with minimal service interruptions.
Tshwane Academic Division: New Cobas 8800 systems were installed for testing HIV- and other PCRs. The Cytology Laboratory also received an automated analyser which will enable the implementation of Liquid Based Cytology (LBC).
Technical skills and staffing
The total head count as at March 2018 was 2021, of which a total of 298 are staff in training (registrars, intern medical technologists, intern scientists and student medical technicians).
A human resource challenge remains in the histopathology discipline, but we are formulating a number of options and managed to encourage a number of intern medical technologists to enrol for histopathology with the new intake.

ANNUAL REPORT 2017/18
Page - 110
Cobas 8800 – PCR Platform Liquid Based Cytology Platform
Business units: category breakdown PathologistsMedical
technologistsMedical
techniciansLaboratory
clerks Other* TotalChris Hani Baragwanath Academic 9 52 18 49 94 222
Johannesburg, Sedibeng and West Rand 5 79 40 89 133 346
Dr George Mukhari Academic 18 64 22 25 45 174
Charlotte Maxeke Academic 43 76 35 46 167 367
Tshwane Academic Division 17 70 27 34 60 208
Ekurhuleni Tshwane 2 72 22 70 45 211
Total 94 413 164 313 534 1428
*Other denotes: business managers, laboratory managers, QA coordinators, phlebotomists, phlebotomy technicians, stores clerks and assistants and laboratory assistants.
Skills development
As part of the NHLS credo, we endeavour to develop and upskill our employees in different areas to meet the needs of the organisation, as well as the employees. The pivotal training which constitutes tertiary qualifications such as certificate, diplomas and degrees, was also offered as internal bursaries to 40 employees. The workplace skills plan target for non-pivotal training interventions for the 2016 / 2017 financial year was 789 and we trained 818 employees. This consisted of mandatory legislative and technical courses (e.g. Quality Management System – ISO 15189).
Stakeholder relations
The region has a very good relationship with the stakeholders, including its DoH partners. These relations are strengthened through several committees and meetings/activities that take place regularly, e.g.:
• Provincial stakeholder meetings to discuss the SLA and quarterly review meetings;
• Monthly participation in Medical Advisory Committee meetings;
• NICD: assisting in the identification of complicated organisms that need further testing;
• Significant pathologist/registrar participation in IPC, as well as the Therapeutic Committee (DMC) and the Medical Advisory Committee;
• Rendering support to the GDoH by training PHC HCWs on the new Laboratory Handbook;
• Participation in quarterly TB meetings with the DoH and bi-monthly visits to the clinics; and
• IAPC meetings with the deans of the universities (Wits, UP and SMU).
• Hospital open days;
• World AIDS Commemoration Day; and
• Planning and participation of the World TB Day.
Conclusion
The Gauteng Region is committed to a patient-centric approach and has thus aligned our organisational strategy to the mission and vision of the DoH. We have furthermore upgraded our resources (equipment and staff ) to meet the many challenges that face the public health sector.

ANNUAL REPORT 2017/18
Page - 111
Area Manager: Sibulele Bandezi
KWAZULU-NATAL REGION
Introduction
The KwaZulu-Natal (KZN) region of the NHLS supports the KZN Provincial Department of Health and other government departments including, but not limited to: The Department of Agriculture Forestry and Fishery (DAFF) and DCS, as well as several NGOs and Non-Profit Organisations (NPOs).
The region supports eleven health districts with access coverage of 100% of laboratories at all hospital levels of care, including national central hospitals, provincial tertiary hospitals, regional hospitals and district hospitals. At PHC level, there are a few CHCs that have on-site laboratory services, ranging from TB microscopy to full routine laboratory testing facilities. The PHCs are covered through daily specimen collection through an outsourced courier service. The region prides itself in 100% provincial pathologists coverage, through availability of laboratory medicine specialists (pathologists) in all clinical pathology disciplines, either through telephonic expert advice to clinicians throughout the province, or through physical interactions where required and possible.
As captured in our slogan: “quality now and everything else will follow,” the KZN region takes an uncompromising approach to QA by deploying different strategies and tactics to ensure optimal customer satisfaction, sound finances and a strong focus on quality. This approach is paying huge dividends which is evident in the fact that seven of our laboratories passed the initial SANAS assessment (newly SANAS-accredited), and four laboratories passed the pre SANAS assessment, including the Public Health ISO:17025 requirements. This again is an unprecedented milestone within the organisation, which surpasses KZN ‘s record of SANAS accrediting five laboratories in one financial period. The four laboratories that passed pre-SANAS are preparing for accreditation in the next financial year. Ten out of ten laboratories passed SANAS surveillance assessment, thereby maintaining 100% accreditation status.
The region continued to impress in financial management, by meeting all its financial targets as set out in the NHLS Annual Performance Plan (APP). Particularly encouraging, is the fact that even the Academic Complex has managed to post a surplus (meaning it is not running at a loss), for the past three consecutive years.
The KZN Region comprises seven business units with a total of 64 laboratories situated in public hospitals as illustrated in Table K1 below.
Table K1: KZN business units and laboratories, health districts and laboratories
Business unit Health District / Laboratories
Academic Complex Inkosi Albert Luthuli Central Hospital:- Chemical pathology- Haematology- Microbiology- Virology- Cytopathology- Histology
King Edward Hospital:- Chemistry- Haematology- Microbiology- Laboratory support
eThekwini eThekwini health DistrictAddingtonKing DinuZuluPrince MshiyeniRK KhanWentworthMahatma GandhiOsindisweniKwaMashuPublic Health
Harry Gwala-Ugu Harry Gwala Health District:KokstadRietvleiChrist The KingSt Appolinaris
Ugu Health District:ScottburghPort ShepstoneMurchisonSt Andrews

ANNUAL REPORT 2017/18
Page - 112
Business unit Health District / Laboratories
Lembe-Thungulu uThungulu Health District:Catherine BootheKhombeeShoweMbongolwaneeMpangeniNgwelezaneNkandlaSt Mary’s
iLembe Health District:NtunjambiliMontebelloStangeruMphumulo
Mgungundlovu-Thukela uMgungundlovu Health District:AppelsboschEdendaleGreysNorthdale
uThukela Health District:EmmausEstcourtLadysmith
Maju-Mzinyathi Amajuba Health District:MadadeniNewcastle
uMzinyathi Health District:DundeeCharles Johnson MemorialChurch of ScotlandGreytown
Mkhanya-Zulu uMkhanyakude Health District:BethesdaHlabisaManguziMosveldMseleni
Zululand Health District:BenedictineCezaDumbeItshelejubaNkonjeniVryheid
Diagnostic services and new developments
During the 2017/2018 financial year, a total of 24 826 962 tests were performed and billed in the region. This reflects a marginal decrease of 3.56% in tests volumes compared to the previous financial year, which is mainly due to the July 2017 strike, as well as new measures introduced by the KZN DoH for the sake of improving efficiency. These measures include the decentralisation of the monitoring of laboratory testing to hospital management and the implementation of eGK.
Table K2: KZN billed volumes in 2017/2018Business unit 1ST QTY 2ND QTY 3RD QTY 4TH QTY 2018 YTDAcademic Complex 1 154 370 1 131 913 1 235 969 1 250 871 4 773 123
eThekwini 1 839 975 1 744 575 1 657 256 1 813 186 7 054 992
Harry Gwala-Ugu 417 955 432 609 428 930 469 353 1 748 847
Lembe-Thungulu 736 746 757 686 760 955 828 210 3 083 597
Mgungundlovu-Thukela 1 025 495 973 984 1 031 744 1 074 868 4 106 091
Maju-Mzinyathi 446 347 411 592 434 965 466 241 1 759 145
Mkhanya-Zululand 527 851 593 009 583 034 597 273 2 301 167
Grand Total 6 148 739 6 045 368 6 132 853 6 500 002 24 826 962
Turnover for the year increased by R100 million (6%) from R1 739 billion in 2016/2017 to R1 839 billion in 2017/2018. This increase can mainly be attributed to an increase in testing for HIV.
The value of the KZN DoH invoices also increased by R74 million (4%), from R1 754 billion to R1 828 billion.
Overheads increased by R32 million (4%) from R730 million to R762 million. This can be attributed mainly to the outsourcing of testing of histology specimens.
The cost of direct materials increased by R4 million (1%) from R627 million to R631 million. Mainly due to GeneXpert and FOREX.
KZN’s Academic Complex provides specialised and routine diagnostic pathology services to Albert Luthuli Central Hospital, King Edward VIII Hospital and their clinics and serve as the referral Centre for tests from all other NHLS laboratories in the province.
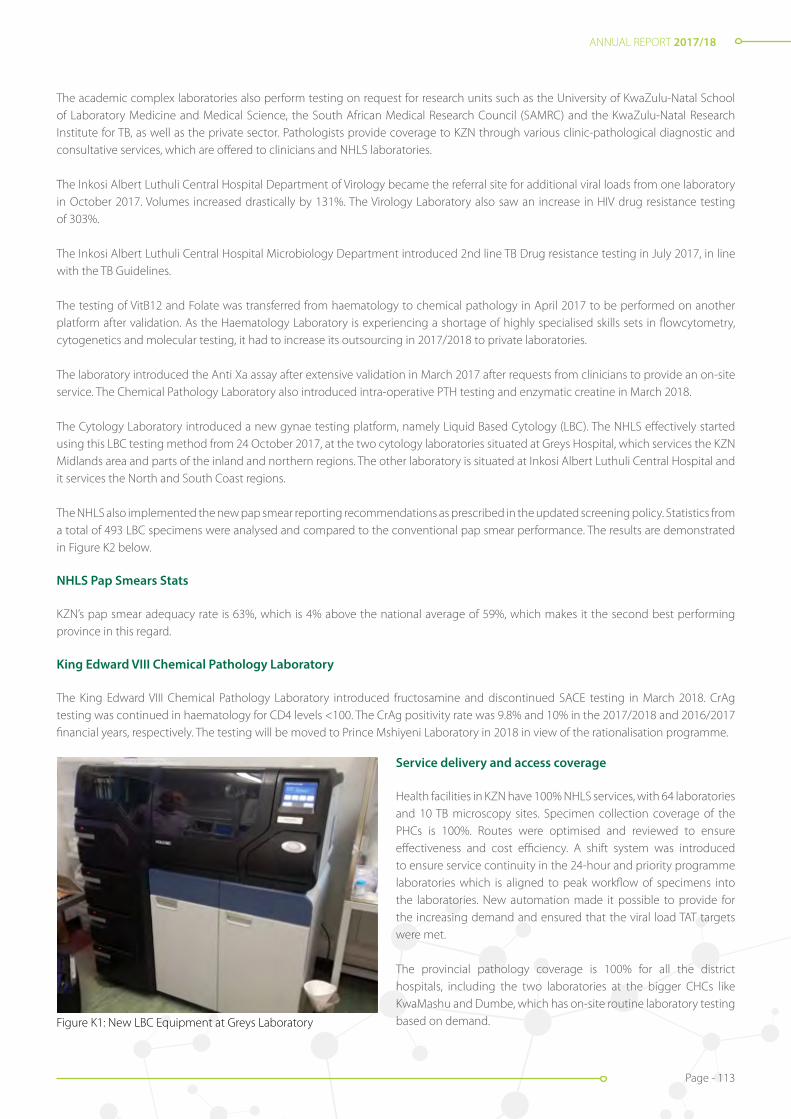
ANNUAL REPORT 2017/18
Page - 113
The academic complex laboratories also perform testing on request for research units such as the University of KwaZulu-Natal School of Laboratory Medicine and Medical Science, the South African Medical Research Council (SAMRC) and the KwaZulu-Natal Research Institute for TB, as well as the private sector. Pathologists provide coverage to KZN through various clinic-pathological diagnostic and consultative services, which are offered to clinicians and NHLS laboratories.
The Inkosi Albert Luthuli Central Hospital Department of Virology became the referral site for additional viral loads from one laboratory in October 2017. Volumes increased drastically by 131%. The Virology Laboratory also saw an increase in HIV drug resistance testing of 303%.
The Inkosi Albert Luthuli Central Hospital Microbiology Department introduced 2nd line TB Drug resistance testing in July 2017, in line with the TB Guidelines.
The testing of VitB12 and Folate was transferred from haematology to chemical pathology in April 2017 to be performed on another platform after validation. As the Haematology Laboratory is experiencing a shortage of highly specialised skills sets in flowcytometry, cytogenetics and molecular testing, it had to increase its outsourcing in 2017/2018 to private laboratories.
The laboratory introduced the Anti Xa assay after extensive validation in March 2017 after requests from clinicians to provide an on-site service. The Chemical Pathology Laboratory also introduced intra-operative PTH testing and enzymatic creatine in March 2018.
The Cytology Laboratory introduced a new gynae testing platform, namely Liquid Based Cytology (LBC). The NHLS effectively started using this LBC testing method from 24 October 2017, at the two cytology laboratories situated at Greys Hospital, which services the KZN Midlands area and parts of the inland and northern regions. The other laboratory is situated at Inkosi Albert Luthuli Central Hospital and it services the North and South Coast regions.
The NHLS also implemented the new pap smear reporting recommendations as prescribed in the updated screening policy. Statistics from a total of 493 LBC specimens were analysed and compared to the conventional pap smear performance. The results are demonstrated in Figure K2 below.
NHLS Pap Smears Stats
KZN’s pap smear adequacy rate is 63%, which is 4% above the national average of 59%, which makes it the second best performing province in this regard.
King Edward VIII Chemical Pathology Laboratory
The King Edward VIII Chemical Pathology Laboratory introduced fructosamine and discontinued SACE testing in March 2018. CrAg testing was continued in haematology for CD4 levels <100. The CrAg positivity rate was 9.8% and 10% in the 2017/2018 and 2016/2017 financial years, respectively. The testing will be moved to Prince Mshiyeni Laboratory in 2018 in view of the rationalisation programme.
Figure K1: New LBC Equipment at Greys Laboratory
Service delivery and access coverage
Health facilities in KZN have 100% NHLS services, with 64 laboratories and 10 TB microscopy sites. Specimen collection coverage of the PHCs is 100%. Routes were optimised and reviewed to ensure effectiveness and cost efficiency. A shift system was introduced to ensure service continuity in the 24-hour and priority programme laboratories which is aligned to peak workflow of specimens into the laboratories. New automation made it possible to provide for the increasing demand and ensured that the viral load TAT targets were met.
The provincial pathology coverage is 100% for all the district hospitals, including the two laboratories at the bigger CHCs like KwaMashu and Dumbe, which has on-site routine laboratory testing based on demand.
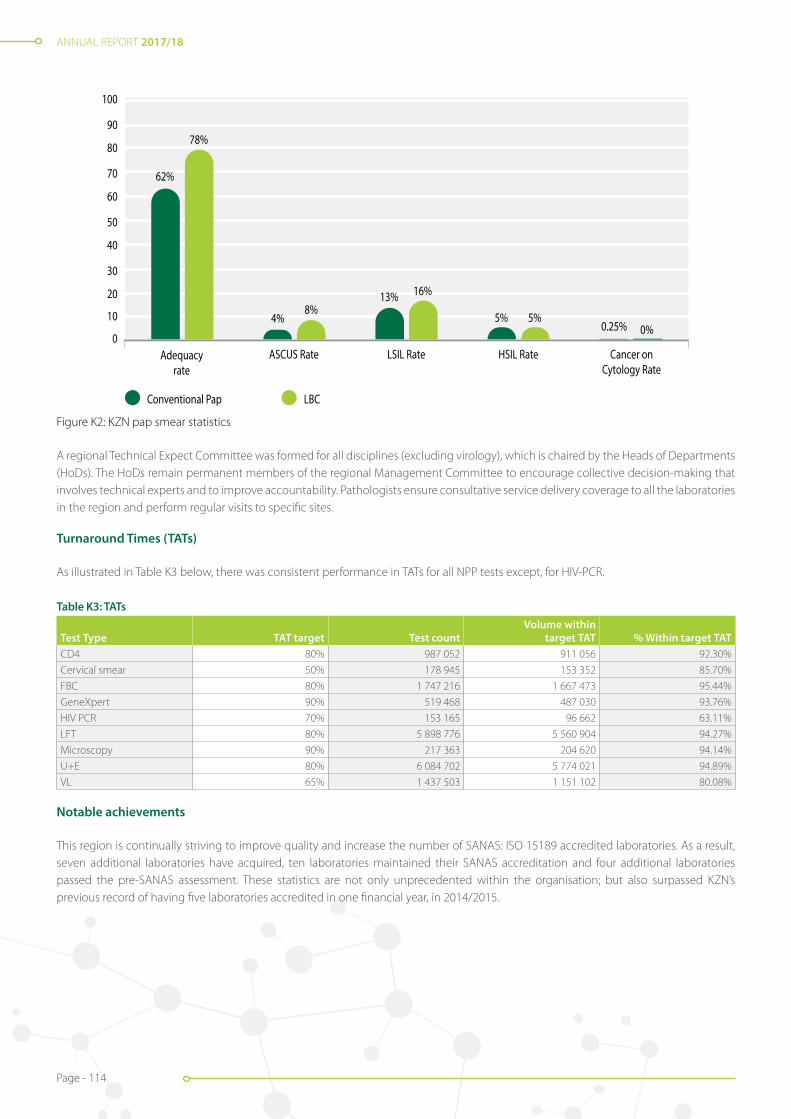
ANNUAL REPORT 2017/18
Page - 114
A regional Technical Expect Committee was formed for all disciplines (excluding virology), which is chaired by the Heads of Departments (HoDs). The HoDs remain permanent members of the regional Management Committee to encourage collective decision-making that involves technical experts and to improve accountability. Pathologists ensure consultative service delivery coverage to all the laboratories in the region and perform regular visits to specific sites.
Figure K2: KZN pap smear statistics
Turnaround Times (TATs)
As illustrated in Table K3 below, there was consistent performance in TATs for all NPP tests except, for HIV-PCR.
Table K3: TATs
Test Type TAT target Test countVolume within
target TAT % Within target TATCD4 80% 987 052 911 056 92.30%
Cervical smear 50% 178 945 153 352 85.70%
FBC 80% 1 747 216 1 667 473 95.44%
GeneXpert 90% 519 468 487 030 93.76%
HIV PCR 70% 153 165 96 662 63.11%
LFT 80% 5 898 776 5 560 904 94.27%
Microscopy 90% 217 363 204 620 94.14%
U+E 80% 6 084 702 5 774 021 94.89%
VL 65% 1 437 503 1 151 102 80.08%
Notable achievements
This region is continually striving to improve quality and increase the number of SANAS: ISO 15189 accredited laboratories. As a result, seven additional laboratories have acquired, ten laboratories maintained their SANAS accreditation and four additional laboratories passed the pre-SANAS assessment. These statistics are not only unprecedented within the organisation; but also surpassed KZN’s previous record of having five laboratories accredited in one financial year, in 2014/2015.
0
10
20
30
40
50
60
70
80
90
100
Conventional Pap
Adequacyrate
ASCUS Rate LSIL Rate HSIL Rate Cancer onCytology Rate
LBC Pap
62%
78%
4%8%
13% 16%
5% 5%0.25% 0%
Figure K2: KZN pap smear statistics
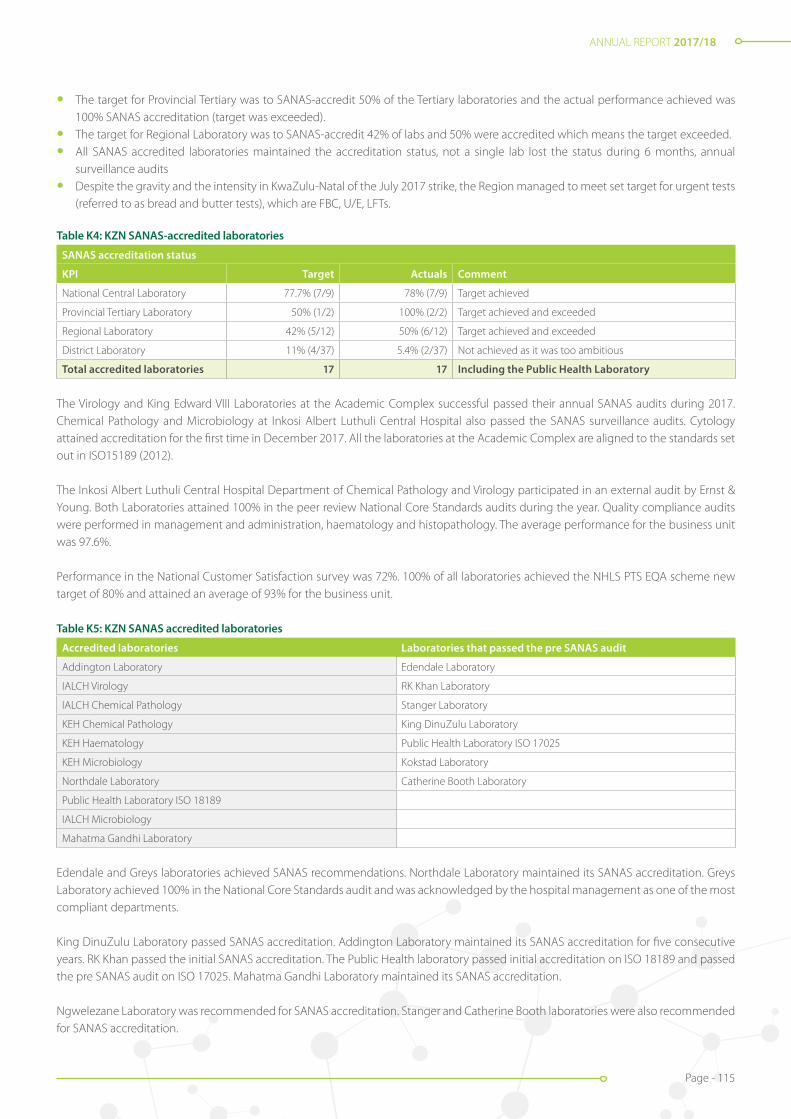
ANNUAL REPORT 2017/18
Page - 115
• The target for Provincial Tertiary was to SANAS-accredit 50% of the Tertiary laboratories and the actual performance achieved was 100% SANAS accreditation (target was exceeded).
• The target for Regional Laboratory was to SANAS-accredit 42% of labs and 50% were accredited which means the target exceeded.
• All SANAS accredited laboratories maintained the accreditation status, not a single lab lost the status during 6 months, annual surveillance audits
• Despite the gravity and the intensity in KwaZulu-Natal of the July 2017 strike, the Region managed to meet set target for urgent tests (referred to as bread and butter tests), which are FBC, U/E, LFTs.
Table K4: KZN SANAS-accredited laboratories
SANAS accreditation status
KPI Target Actuals Comment
National Central Laboratory 77.7% (7/9) 78% (7/9) Target achieved
Provincial Tertiary Laboratory 50% (1/2) 100% (2/2) Target achieved and exceeded
Regional Laboratory 42% (5/12) 50% (6/12) Target achieved and exceeded
District Laboratory 11% (4/37) 5.4% (2/37) Not achieved as it was too ambitious
Total accredited laboratories 17 17 Including the Public Health Laboratory
The Virology and King Edward VIII Laboratories at the Academic Complex successful passed their annual SANAS audits during 2017. Chemical Pathology and Microbiology at Inkosi Albert Luthuli Central Hospital also passed the SANAS surveillance audits. Cytology attained accreditation for the first time in December 2017. All the laboratories at the Academic Complex are aligned to the standards set out in ISO15189 (2012).
The Inkosi Albert Luthuli Central Hospital Department of Chemical Pathology and Virology participated in an external audit by Ernst & Young. Both Laboratories attained 100% in the peer review National Core Standards audits during the year. Quality compliance audits were performed in management and administration, haematology and histopathology. The average performance for the business unit was 97.6%.
Performance in the National Customer Satisfaction survey was 72%. 100% of all laboratories achieved the NHLS PTS EQA scheme new target of 80% and attained an average of 93% for the business unit.
Table K5: KZN SANAS accredited laboratories
Accredited laboratories Laboratories that passed the pre SANAS audit
Addington Laboratory Edendale Laboratory
IALCH Virology RK Khan Laboratory
IALCH Chemical Pathology Stanger Laboratory
KEH Chemical Pathology King DinuZulu Laboratory
KEH Haematology Public Health Laboratory ISO 17025
KEH Microbiology Kokstad Laboratory
Northdale Laboratory Catherine Booth Laboratory
Public Health Laboratory ISO 18189
IALCH Microbiology
Mahatma Gandhi Laboratory
Edendale and Greys laboratories achieved SANAS recommendations. Northdale Laboratory maintained its SANAS accreditation. Greys Laboratory achieved 100% in the National Core Standards audit and was acknowledged by the hospital management as one of the most compliant departments.
King DinuZulu Laboratory passed SANAS accreditation. Addington Laboratory maintained its SANAS accreditation for five consecutive years. RK Khan passed the initial SANAS accreditation. The Public Health laboratory passed initial accreditation on ISO 18189 and passed the pre SANAS audit on ISO 17025. Mahatma Gandhi Laboratory maintained its SANAS accreditation.
Ngwelezane Laboratory was recommended for SANAS accreditation. Stanger and Catherine Booth laboratories were also recommended for SANAS accreditation.

ANNUAL REPORT 2017/18
Page - 116
The National PTS Targets year to date averages were met. 91% of the laboratories achieved > 80%.
Figure K3: Edendale laboratory staff and area manager celebrating their SANAS accreditation
Figure K5: King DinuZulu Hospital CEO, medical manager, nursing manager, NHLS area manager and laboratory staff celebrate their SANAS accreditation
Figure K6: Catherine Booth Laboratory passed the pre SANAS audit
Figure K7: Mahatma Gandhi Laboratory staff celebrate their SANAS accreditation
Figure K4: Celebration of RK Khan for achieving their accreditation status
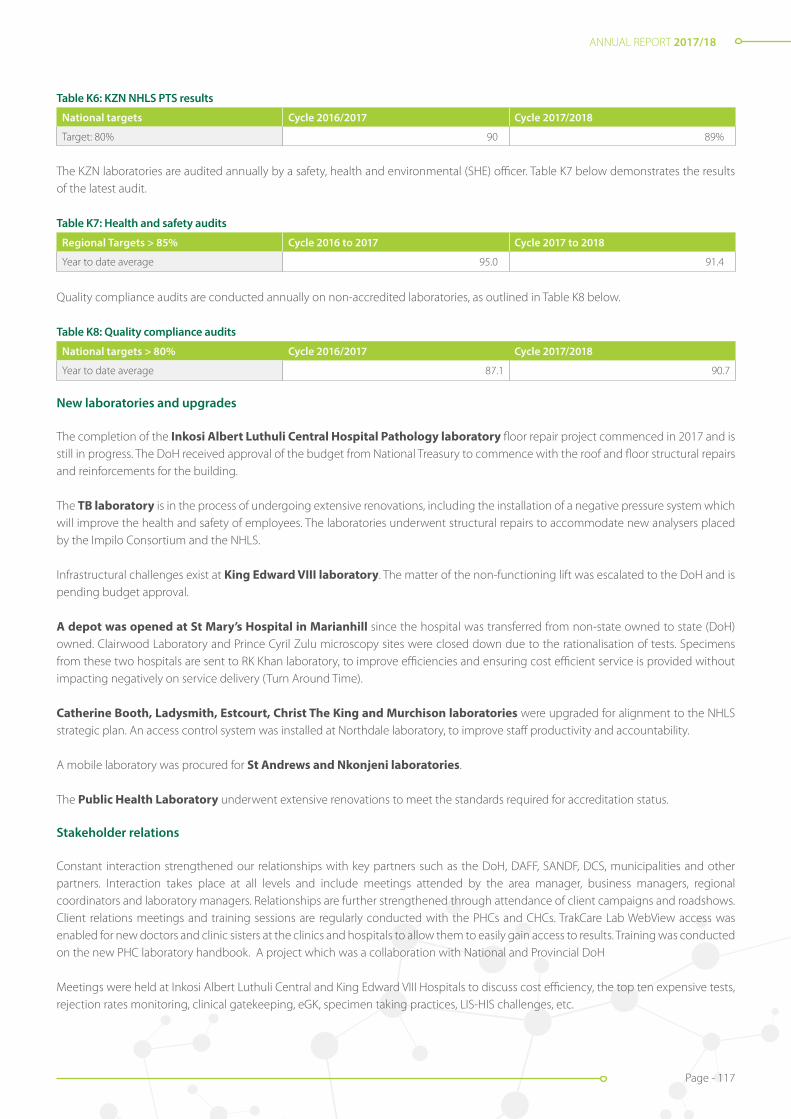
ANNUAL REPORT 2017/18
Page - 117
Table K6: KZN NHLS PTS results
National targets Cycle 2016/2017 Cycle 2017/2018
Target: 80% 90 89%
The KZN laboratories are audited annually by a safety, health and environmental (SHE) officer. Table K7 below demonstrates the results of the latest audit.
Table K7: Health and safety audits
Regional Targets > 85% Cycle 2016 to 2017 Cycle 2017 to 2018
Year to date average 95.0 91.4
Quality compliance audits are conducted annually on non-accredited laboratories, as outlined in Table K8 below.
Table K8: Quality compliance audits
National targets > 80% Cycle 2016/2017 Cycle 2017/2018
Year to date average 87.1 90.7
New laboratories and upgrades
The completion of the Inkosi Albert Luthuli Central Hospital Pathology laboratory floor repair project commenced in 2017 and is still in progress. The DoH received approval of the budget from National Treasury to commence with the roof and floor structural repairs and reinforcements for the building.
The TB laboratory is in the process of undergoing extensive renovations, including the installation of a negative pressure system which will improve the health and safety of employees. The laboratories underwent structural repairs to accommodate new analysers placed by the Impilo Consortium and the NHLS.
Infrastructural challenges exist at King Edward VIII laboratory. The matter of the non-functioning lift was escalated to the DoH and is pending budget approval.
A depot was opened at St Mary’s Hospital in Marianhill since the hospital was transferred from non-state owned to state (DoH) owned. Clairwood Laboratory and Prince Cyril Zulu microscopy sites were closed down due to the rationalisation of tests. Specimens from these two hospitals are sent to RK Khan laboratory, to improve efficiencies and ensuring cost efficient service is provided without impacting negatively on service delivery (Turn Around Time).
Catherine Booth, Ladysmith, Estcourt, Christ The King and Murchison laboratories were upgraded for alignment to the NHLS strategic plan. An access control system was installed at Northdale laboratory, to improve staff productivity and accountability.
A mobile laboratory was procured for St Andrews and Nkonjeni laboratories.
The Public Health Laboratory underwent extensive renovations to meet the standards required for accreditation status.
Stakeholder relations
Constant interaction strengthened our relationships with key partners such as the DoH, DAFF, SANDF, DCS, municipalities and other partners. Interaction takes place at all levels and include meetings attended by the area manager, business managers, regional coordinators and laboratory managers. Relationships are further strengthened through attendance of client campaigns and roadshows. Client relations meetings and training sessions are regularly conducted with the PHCs and CHCs. TrakCare Lab WebView access was enabled for new doctors and clinic sisters at the clinics and hospitals to allow them to easily gain access to results. Training was conducted on the new PHC laboratory handbook. A project which was a collaboration with National and Provincial DoH
Meetings were held at Inkosi Albert Luthuli Central and King Edward VIII Hospitals to discuss cost efficiency, the top ten expensive tests, rejection rates monitoring, clinical gatekeeping, eGK, specimen taking practices, LIS-HIS challenges, etc.
ANNUAL REPORT 2017/18
Page - 118
Additional meetings were convened with the NHLS to discuss the Global Green Healthy Hospital Initiative, the IALCH Pathology laboratory floor repair project and the Meditech PatientTrak challenges, as well as the crises in clinical haematology and specialised reflex testing and histopathology services.
An Intern orientation workshop was held at King Edward VIII Hospital in January 2018 to orientate incoming interns on good specimen taking practices, MCDS, eGK and protocols. The medical interns were given web access to enable the viewing of laboratory results via the internet. Intern committee meetings with medical interns and supervisors were attended at King Edward VIII Hospital and customer complaints were addressed to ensure optimal access to laboratory results.
The University of KwaZulu-Natal School of Laboratory Medicine and Medical Sciences Board meetings were attended by HODs, acting HODs, the business manager and other jointly appointed staff. College of Health Sciences meetings with the NHLS academic staff were held and chaired by the DVC, the Dean and the Head of School. Discussions revolved around motivating academics to pursue postgraduate studies, in particular, PhD degrees, KPAs, the undergraduate curriculum, postgraduate support, the visual learning project, the ROBOT system, etc.
IAPC meetings were held to address operational and academic matters not resolved at PMC level, as per the umbrella agreement and to finalise the local bilateral agreement between the UKZN and the NHLS KZN Academic Complex. The Dean/Head of School and the school’s operational manager also attended the PMC meeting (by invitation) to ensure that academic challenges are highlighted and resolved, and that teaching, training and research platforms are optimised for service delivery.
The Academic Complex Business unit trains registrars, intern medical scientists, student medical technologists and student technicians. The Haematology Department is preparing to be re-audited by the HPCSA in 2018 to regain their HPCSA training status for registrars. In the interim, the Wits Medical school is overseeing the programme, together with the acting HOD.
Conclusion
The KZN region demonstrated overall excellent performance against the set strategic objectives targets with marked improvements noted from the previous year in service delivery, internal operations, which include quality assurance and financial sustainability.
This was accomplished despite continued challenges on the training and service platforms with regard to critical skills shortage, financial cash-flow situations due to delayed payments by provinces (which impacted negatively on available resources for maintenance and improvement of operations and the seven days July strike which affected KZN gravely.
Other challenges experienced were IT-related, such as infrastructure and bandwidth, which affected the performance of Laboratory Information System (LIS). Challenges in Supply Chain Management affected procurement turn-around times, which in turn had a negative impact on operations. Valuable lessons were learned during the period under review, which will form the basis of improved operational performance in the year ahead.

ANNUAL REPORT 2017/18
Page - 119
Area Manager: Jacob Lebudi
LIMPOPO AND MPUMALANGA REGION
LIMPOPO
Introduction
In Limpopo, the NHLS has presence in all 37 general hospitals in the province as well as all five districts of the province. The NHLS is divided into the following three business units that are aligned to the health districts:
• Capricorn Business Unit has eight laboratories which services six district hospitals, two provincial tertiary hospitals, a psychiatric hospital, the SANDF and Department of Correctional Services (DCS). The Polokwane laboratory has four pathologists: a microbiologist, haematologist, virologist and a microbiology HOD. The two tertiary hospitals offer a 24-hour service, for seven days a week, and the other laboratories offer a continuous service through a staggered shift system and on a call-out basis.
• Sekhukhune-Waterberg Business Unit has 15 laboratories which service 12 district hospitals and three regional hospitals, the MDR TB Unit, and the SANDF. Mokopane Laboratory is a referral centre for CD4 testing for four laboratories in the Waterberg District. All laboratories offer a continuous service through a staggered shift system and on a call-out basis.
• Vhembe- Mopani Business Unit has 14 laboratories servicing 14 hospitals, three psychiatric hospitals, 237 primary healthcare facilities, DCS and the SANDF units in the Vhembe and Mopani districts of Limpopo. The business unit has two regional laboratories, namely Tshilidzini (Vhembe) and Letaba (Mopani) and the other 12 are district laboratories. The regional laboratories offer a 24-hour service and the district laboratories operate on a call-out system. Letaba is a referral site for laboratories in the Vhembe and Mopani districts. The distribution of the laboratories in the province are outlined in Table L1 below.
Table L1: Laboratories in Limpopo
HEALTH DISTRICT CAPRICORN SEKHUKHUNE WATERBERG VHEMBE MOPANI
BUSINESS UNIT CAPRICON SEKHUKHUNE - WATERBERG VHEMBE - MOPANI
LABORATORY Botlokwa Dilokong Bela Bela (Warmbaths) Tshilidzini Letaba
Helen Franz Mecklenburg Nylstroom Elim Namakgale
Lebowakgomo Jane Furse Potgietersrus Donald Fraser Sekororo
Mankweng St Ritas Mokopane Malamulele Giyani
Polokwane Matlala George Masebe Siloam Kgapane
Seshego Groblersdal Witpoort Louis Trichardt CN Phatudi
WF Knobel Philadelphia Ellisras Musina Tzaneen
Zebediela Thabazimbi
Diagnostic services and new developments
Diagnostic services in Limpopo are offered through a network of laboratories across the entire province that are associated to each general hospital of the provincial DoH. The total number of diagnostic tests performed in the province increased by 4.7% to 6 329 617 in 2017 / 2018.
The NPP of the DoH were supported.
The following tests are performed within the province:
• CD4: Performed in Polokwane, Letaba, Tshilidzini and Mokopane laboratories;
• HIV viral load: Performed in Mankweng Laboratory;
• Cervical cancer screening: Performed in Polokwane; and
• TB testing: Conducted in the majority of the laboratories.
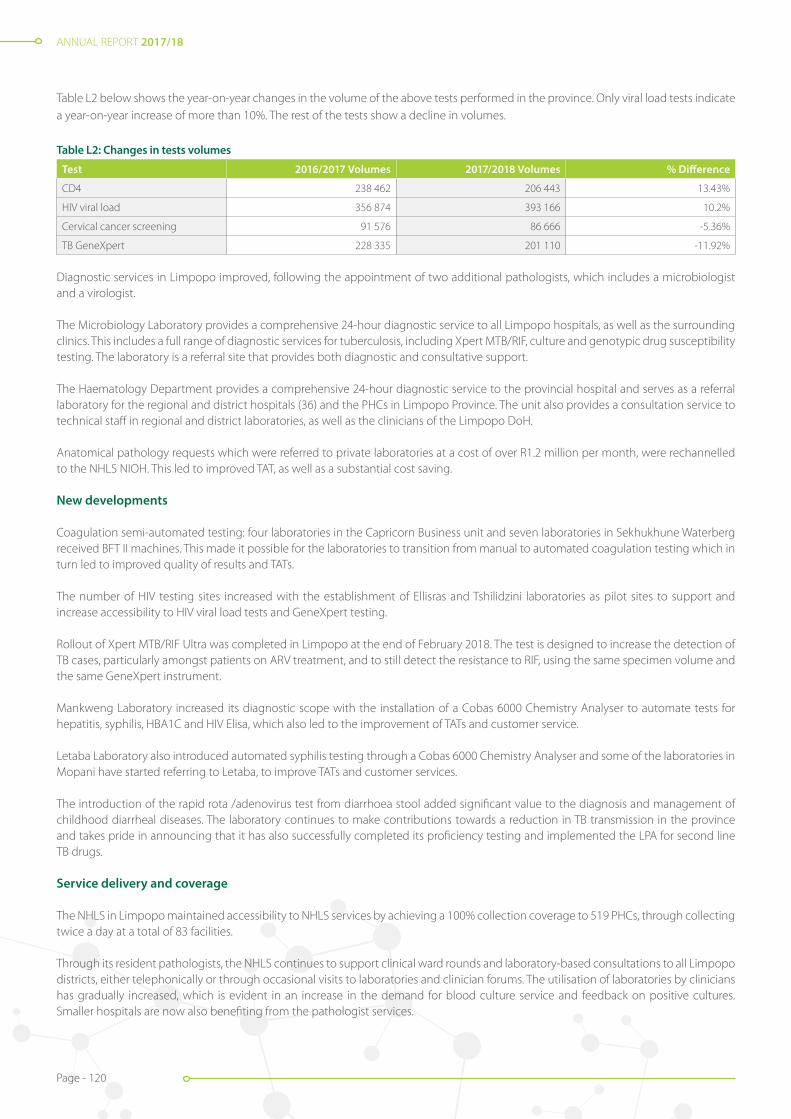
ANNUAL REPORT 2017/18
Page - 120
Table L2 below shows the year-on-year changes in the volume of the above tests performed in the province. Only viral load tests indicate a year-on-year increase of more than 10%. The rest of the tests show a decline in volumes.
Table L2: Changes in tests volumes
Test 2016/2017 Volumes 2017/2018 Volumes % Difference
CD4 238 462 206 443 13.43%
HIV viral load 356 874 393 166 10.2%
Cervical cancer screening 91 576 86 666 -5.36%
TB GeneXpert 228 335 201 110 -11.92%
Diagnostic services in Limpopo improved, following the appointment of two additional pathologists, which includes a microbiologist and a virologist.
The Microbiology Laboratory provides a comprehensive 24-hour diagnostic service to all Limpopo hospitals, as well as the surrounding clinics. This includes a full range of diagnostic services for tuberculosis, including Xpert MTB/RIF, culture and genotypic drug susceptibility testing. The laboratory is a referral site that provides both diagnostic and consultative support.
The Haematology Department provides a comprehensive 24-hour diagnostic service to the provincial hospital and serves as a referral laboratory for the regional and district hospitals (36) and the PHCs in Limpopo Province. The unit also provides a consultation service to technical staff in regional and district laboratories, as well as the clinicians of the Limpopo DoH.
Anatomical pathology requests which were referred to private laboratories at a cost of over R1.2 million per month, were rechannelled to the NHLS NIOH. This led to improved TAT, as well as a substantial cost saving.
New developments
Coagulation semi-automated testing: four laboratories in the Capricorn Business unit and seven laboratories in Sekhukhune Waterberg received BFT II machines. This made it possible for the laboratories to transition from manual to automated coagulation testing which in turn led to improved quality of results and TATs.
The number of HIV testing sites increased with the establishment of Ellisras and Tshilidzini laboratories as pilot sites to support and increase accessibility to HIV viral load tests and GeneXpert testing.
Rollout of Xpert MTB/RIF Ultra was completed in Limpopo at the end of February 2018. The test is designed to increase the detection of TB cases, particularly amongst patients on ARV treatment, and to still detect the resistance to RIF, using the same specimen volume and the same GeneXpert instrument.
Mankweng Laboratory increased its diagnostic scope with the installation of a Cobas 6000 Chemistry Analyser to automate tests for hepatitis, syphilis, HBA1C and HIV Elisa, which also led to the improvement of TATs and customer service.
Letaba Laboratory also introduced automated syphilis testing through a Cobas 6000 Chemistry Analyser and some of the laboratories in Mopani have started referring to Letaba, to improve TATs and customer services.
The introduction of the rapid rota /adenovirus test from diarrhoea stool added significant value to the diagnosis and management of childhood diarrheal diseases. The laboratory continues to make contributions towards a reduction in TB transmission in the province and takes pride in announcing that it has also successfully completed its proficiency testing and implemented the LPA for second line TB drugs.
Service delivery and coverage
The NHLS in Limpopo maintained accessibility to NHLS services by achieving a 100% collection coverage to 519 PHCs, through collecting twice a day at a total of 83 facilities.
Through its resident pathologists, the NHLS continues to support clinical ward rounds and laboratory-based consultations to all Limpopo districts, either telephonically or through occasional visits to laboratories and clinician forums. The utilisation of laboratories by clinicians has gradually increased, which is evident in an increase in the demand for blood culture service and feedback on positive cultures. Smaller hospitals are now also benefiting from the pathologist services.
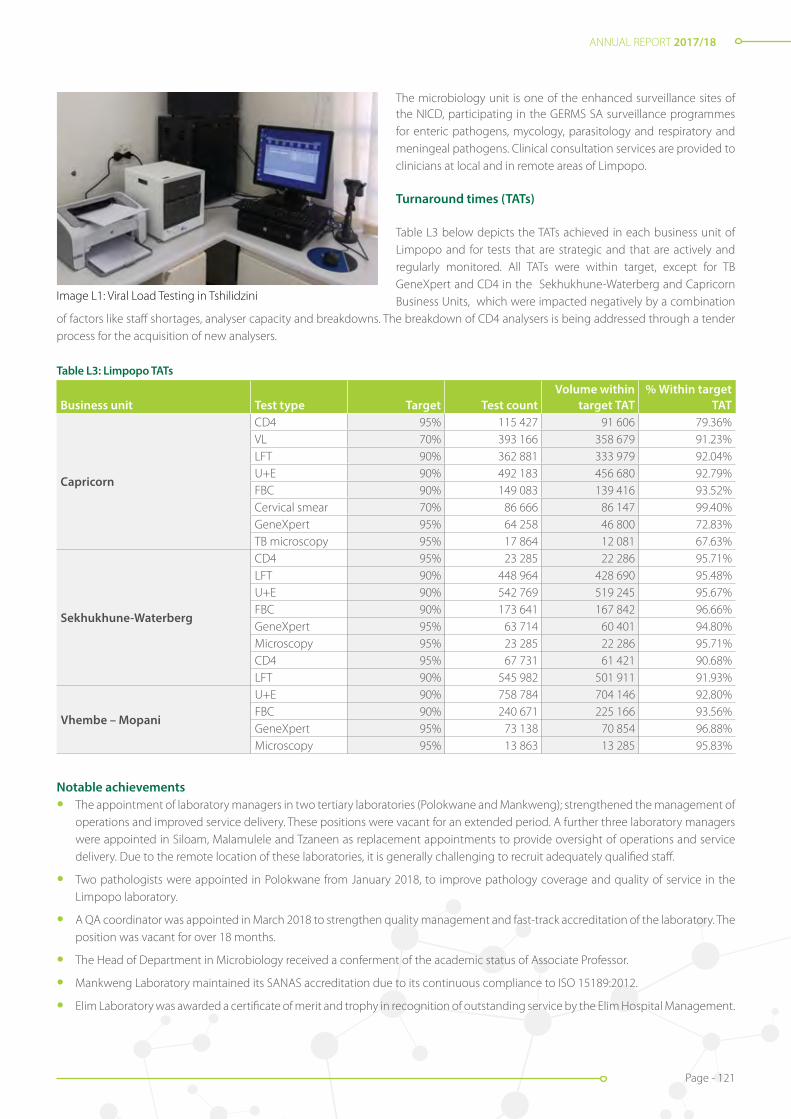
ANNUAL REPORT 2017/18
Page - 121
Image L1: Viral Load Testing in Tshilidzini
The microbiology unit is one of the enhanced surveillance sites of the NICD, participating in the GERMS SA surveillance programmes for enteric pathogens, mycology, parasitology and respiratory and meningeal pathogens. Clinical consultation services are provided to clinicians at local and in remote areas of Limpopo.
Turnaround times (TATs)
Table L3 below depicts the TATs achieved in each business unit of Limpopo and for tests that are strategic and that are actively and regularly monitored. All TATs were within target, except for TB GeneXpert and CD4 in the Sekhukhune-Waterberg and Capricorn Business Units, which were impacted negatively by a combination
of factors like staff shortages, analyser capacity and breakdowns. The breakdown of CD4 analysers is being addressed through a tender process for the acquisition of new analysers.
Table L3: Limpopo TATs
Business unit Test type Target Test countVolume within
target TAT% Within target
TAT
Capricorn
CD4 95% 115 427 91 606 79.36%VL 70% 393 166 358 679 91.23%LFT 90% 362 881 333 979 92.04%U+E 90% 492 183 456 680 92.79%FBC 90% 149 083 139 416 93.52%Cervical smear 70% 86 666 86 147 99.40%GeneXpert 95% 64 258 46 800 72.83%TB microscopy 95% 17 864 12 081 67.63%
Sekhukhune-Waterberg
CD4 95% 23 285 22 286 95.71%LFT 90% 448 964 428 690 95.48%U+E 90% 542 769 519 245 95.67%FBC 90% 173 641 167 842 96.66%GeneXpert 95% 63 714 60 401 94.80%Microscopy 95% 23 285 22 286 95.71%CD4 95% 67 731 61 421 90.68%LFT 90% 545 982 501 911 91.93%
Vhembe – Mopani
U+E 90% 758 784 704 146 92.80%FBC 90% 240 671 225 166 93.56%GeneXpert 95% 73 138 70 854 96.88%Microscopy 95% 13 863 13 285 95.83%
Notable achievements• The appointment of laboratory managers in two tertiary laboratories (Polokwane and Mankweng); strengthened the management of
operations and improved service delivery. These positions were vacant for an extended period. A further three laboratory managers were appointed in Siloam, Malamulele and Tzaneen as replacement appointments to provide oversight of operations and service delivery. Due to the remote location of these laboratories, it is generally challenging to recruit adequately qualified staff.
• Two pathologists were appointed in Polokwane from January 2018, to improve pathology coverage and quality of service in the Limpopo laboratory.
• A QA coordinator was appointed in March 2018 to strengthen quality management and fast-track accreditation of the laboratory. The position was vacant for over 18 months.
• The Head of Department in Microbiology received a conferment of the academic status of Associate Professor.
• Mankweng Laboratory maintained its SANAS accreditation due to its continuous compliance to ISO 15189:2012.
• Elim Laboratory was awarded a certificate of merit and trophy in recognition of outstanding service by the Elim Hospital Management.
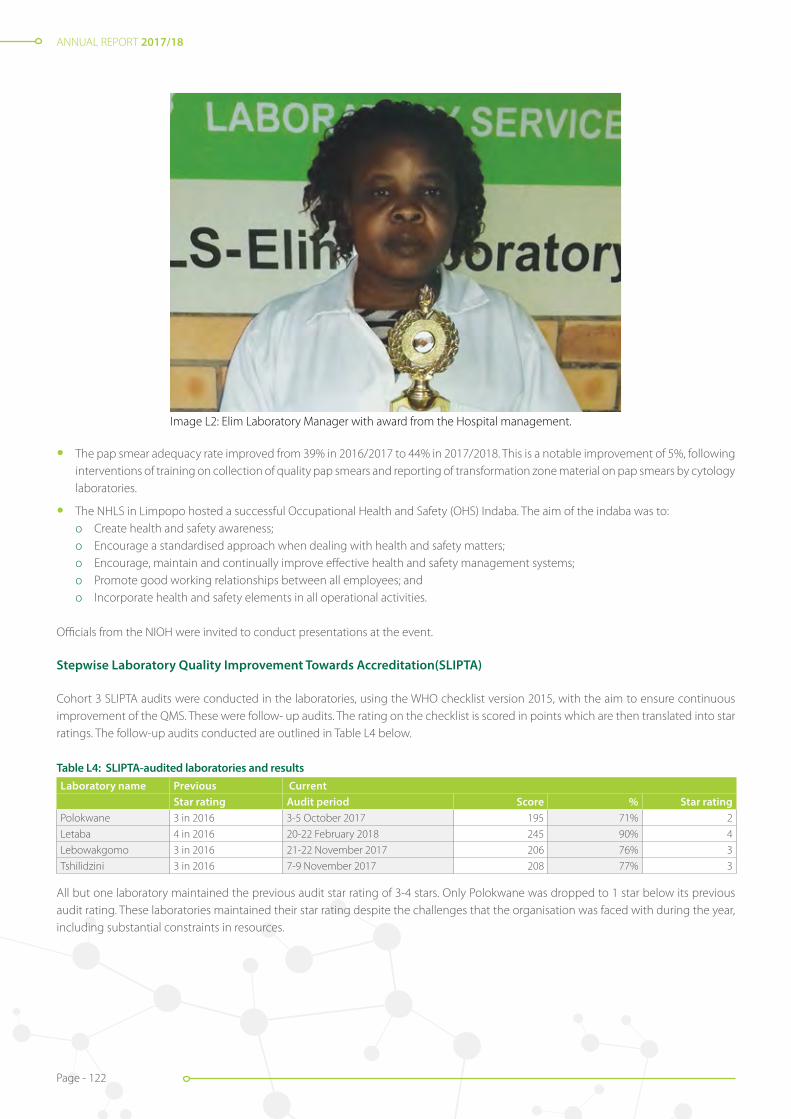
ANNUAL REPORT 2017/18
Page - 122
Image L2: Elim Laboratory Manager with award from the Hospital management.
• The pap smear adequacy rate improved from 39% in 2016/2017 to 44% in 2017/2018. This is a notable improvement of 5%, following interventions of training on collection of quality pap smears and reporting of transformation zone material on pap smears by cytology laboratories.
• The NHLS in Limpopo hosted a successful Occupational Health and Safety (OHS) Indaba. The aim of the indaba was to:o Create health and safety awareness;o Encourage a standardised approach when dealing with health and safety matters; o Encourage, maintain and continually improve effective health and safety management systems; o Promote good working relationships between all employees; ando Incorporate health and safety elements in all operational activities.
Officials from the NIOH were invited to conduct presentations at the event.
Stepwise Laboratory Quality Improvement Towards Accreditation(SLIPTA)
Cohort 3 SLIPTA audits were conducted in the laboratories, using the WHO checklist version 2015, with the aim to ensure continuous improvement of the QMS. These were follow- up audits. The rating on the checklist is scored in points which are then translated into star ratings. The follow-up audits conducted are outlined in Table L4 below.
Table L4: SLIPTA-audited laboratories and resultsLaboratory name Previous Current
Star rating Audit period Score % Star ratingPolokwane 3 in 2016 3-5 October 2017 195 71% 2
Letaba 4 in 2016 20-22 February 2018 245 90% 4
Lebowakgomo 3 in 2016 21-22 November 2017 206 76% 3
Tshilidzini 3 in 2016 7-9 November 2017 208 77% 3
All but one laboratory maintained the previous audit star rating of 3-4 stars. Only Polokwane was dropped to 1 star below its previous audit rating. These laboratories maintained their star rating despite the challenges that the organisation was faced with during the year, including substantial constraints in resources.

ANNUAL REPORT 2017/18
Page - 123
New laboratories and upgrades
• The Botlokwa laboratory call room was revamped in February 2018 to improve comfort for staff when on call to provide continuous services.
• Mankweng laboratory renovations commenced in January 2018 to provide for a new pre-analytical analyser for full laboratory automation.
• Access control and alarm systems were installed at the Limpopo regional offices, and at five laboratories in Capricorn and seven laboratories in Sekhukhune-Waterberg, to increase security and restrict access to these facilities.
• Furthermore, nine access control systems were installed in Vhembe-Mopani laboratories to improve security.
• CN Phatudi received a new mobile laboratory and relocated on 24 August 2017, for the sake of improving laboratory space, working conditions and compliance to safety standards.
• Four laboratories were earmarked for upgrading. Upgrades were successfully completed at Elim. Renovations are in progress at Donald Fraser, Sekororo and Siloam laboratory and will be completed in the next financial year.
Image L3: New CN Phatudi laboratory
Technical skills and staffing
The total number of staff in Limpopo was 311 at 31st March 2018. There was an increase in the staff complement, due to the insourcing of 38 cleaners and messengers. The number of technical staff members, which makes up 54% of the staff complement, remained the same.
Skills development and training
The NHLS invested substantially in the skills development and training of staff and about 92% of the WSP was implemented in the period under review.
Stakeholder relations
Relations with stakeholders were maintained through different types and levels of engagements throughout the year.
Department of Health (DoH)
• 32 representatives from the province attended training by Thusano at the DoH, for better management of accounts.
• A district SLA meeting was held in May 2017 and follow-up meetings were held at respective hospitals.
• Continuous clinic visits took place to offer support and review service delivery.
• Provincial TB DOT meetings were held quarterly, to review progress on TB management programmes.
• The area manager attended the provincial World AIDS Day commemoration which took place at Bavaria, Ga-Mathapo village in the Waterberg District. NHLS services were made available through the presence of a mobile laboratory.
• The provincial TB Day commemoration was held at CN Phatudi Hospital, in Mopani district. NHLS services were made available through the presence of a mobile laboratory.
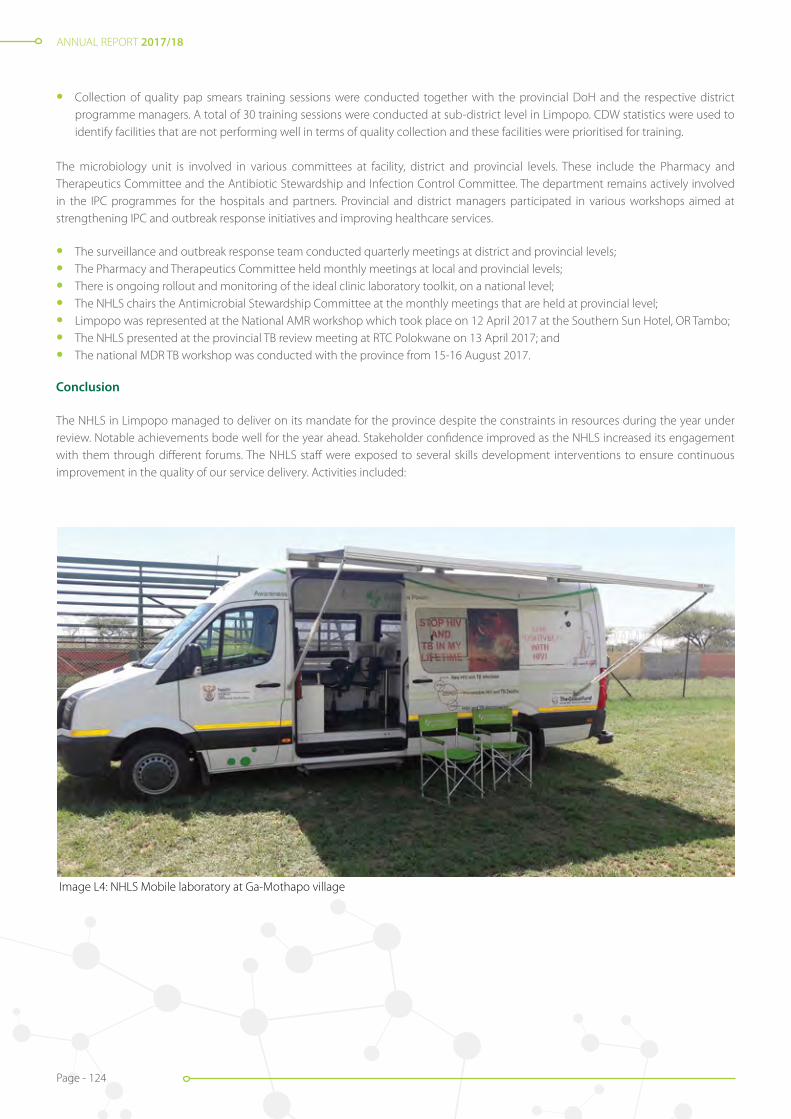
ANNUAL REPORT 2017/18
Page - 124
• Collection of quality pap smears training sessions were conducted together with the provincial DoH and the respective district programme managers. A total of 30 training sessions were conducted at sub-district level in Limpopo. CDW statistics were used to identify facilities that are not performing well in terms of quality collection and these facilities were prioritised for training.
The microbiology unit is involved in various committees at facility, district and provincial levels. These include the Pharmacy and Therapeutics Committee and the Antibiotic Stewardship and Infection Control Committee. The department remains actively involved in the IPC programmes for the hospitals and partners. Provincial and district managers participated in various workshops aimed at strengthening IPC and outbreak response initiatives and improving healthcare services.
• The surveillance and outbreak response team conducted quarterly meetings at district and provincial levels;
• The Pharmacy and Therapeutics Committee held monthly meetings at local and provincial levels;
• There is ongoing rollout and monitoring of the ideal clinic laboratory toolkit, on a national level;
• The NHLS chairs the Antimicrobial Stewardship Committee at the monthly meetings that are held at provincial level;
• Limpopo was represented at the National AMR workshop which took place on 12 April 2017 at the Southern Sun Hotel, OR Tambo;
• The NHLS presented at the provincial TB review meeting at RTC Polokwane on 13 April 2017; and
• The national MDR TB workshop was conducted with the province from 15-16 August 2017.
Conclusion
The NHLS in Limpopo managed to deliver on its mandate for the province despite the constraints in resources during the year under review. Notable achievements bode well for the year ahead. Stakeholder confidence improved as the NHLS increased its engagement with them through different forums. The NHLS staff were exposed to several skills development interventions to ensure continuous improvement in the quality of our service delivery. Activities included:
Image L4: NHLS Mobile laboratory at Ga-Mothapo village
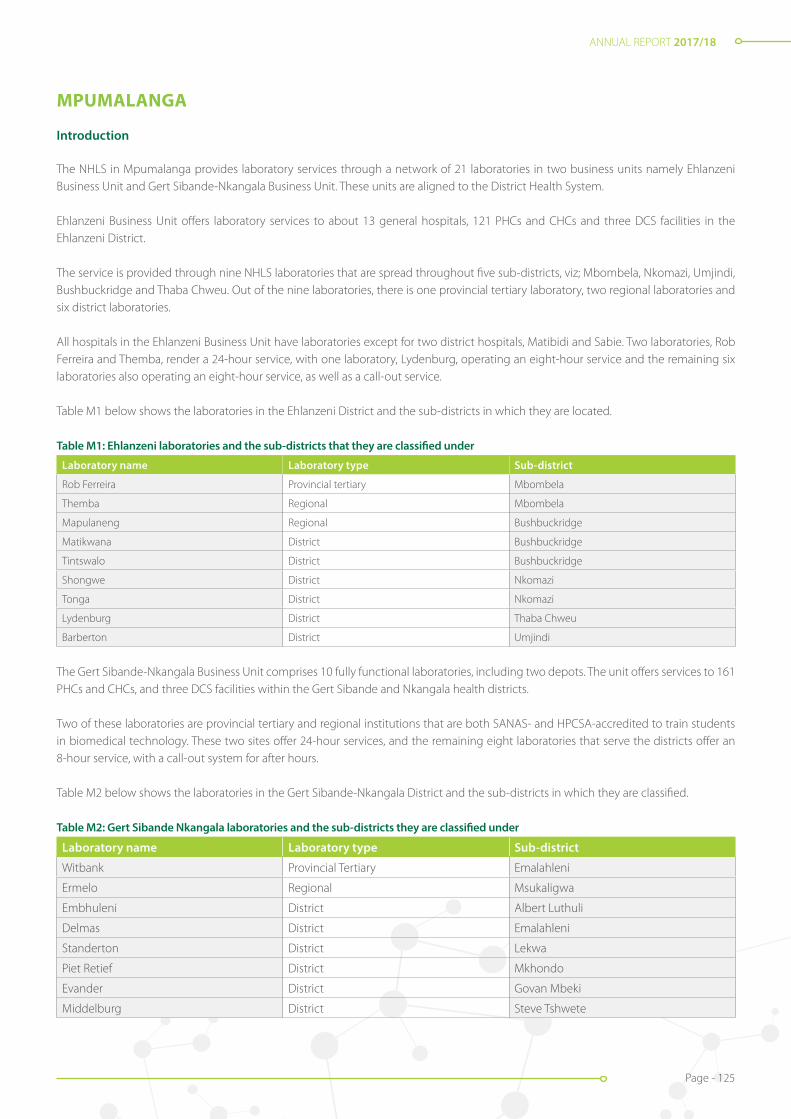
ANNUAL REPORT 2017/18
Page - 125
MPUMALANGA
Introduction
The NHLS in Mpumalanga provides laboratory services through a network of 21 laboratories in two business units namely Ehlanzeni Business Unit and Gert Sibande-Nkangala Business Unit. These units are aligned to the District Health System.
Ehlanzeni Business Unit offers laboratory services to about 13 general hospitals, 121 PHCs and CHCs and three DCS facilities in the Ehlanzeni District.
The service is provided through nine NHLS laboratories that are spread throughout five sub-districts, viz; Mbombela, Nkomazi, Umjindi, Bushbuckridge and Thaba Chweu. Out of the nine laboratories, there is one provincial tertiary laboratory, two regional laboratories and six district laboratories.
All hospitals in the Ehlanzeni Business Unit have laboratories except for two district hospitals, Matibidi and Sabie. Two laboratories, Rob Ferreira and Themba, render a 24-hour service, with one laboratory, Lydenburg, operating an eight-hour service and the remaining six laboratories also operating an eight-hour service, as well as a call-out service.
Table M1 below shows the laboratories in the Ehlanzeni District and the sub-districts in which they are located.
Table M1: Ehlanzeni laboratories and the sub-districts that they are classified under
Laboratory name Laboratory type Sub-district
Rob Ferreira Provincial tertiary Mbombela
Themba Regional Mbombela
Mapulaneng Regional Bushbuckridge
Matikwana District Bushbuckridge
Tintswalo District Bushbuckridge
Shongwe District Nkomazi
Tonga District Nkomazi
Lydenburg District Thaba Chweu
Barberton District Umjindi
The Gert Sibande-Nkangala Business Unit comprises 10 fully functional laboratories, including two depots. The unit offers services to 161 PHCs and CHCs, and three DCS facilities within the Gert Sibande and Nkangala health districts.
Two of these laboratories are provincial tertiary and regional institutions that are both SANAS- and HPCSA-accredited to train students in biomedical technology. These two sites offer 24-hour services, and the remaining eight laboratories that serve the districts offer an 8-hour service, with a call-out system for after hours.
Table M2 below shows the laboratories in the Gert Sibande-Nkangala District and the sub-districts in which they are classified.
Table M2: Gert Sibande Nkangala laboratories and the sub-districts they are classified under
Laboratory name Laboratory type Sub-district
Witbank Provincial Tertiary Emalahleni
Ermelo Regional Msukaligwa
Embhuleni District Albert Luthuli
Delmas District Emalahleni
Standerton District Lekwa
Piet Retief District Mkhondo
Evander District Govan Mbeki
Middelburg District Steve Tshwete

ANNUAL REPORT 2017/18
Page - 126
Image M1: Pre-Analytical System
Laboratory name Laboratory type Sub-districtKwa Mhlanga District Thembisile Hani
Mmametlhake District Dr JS Moroka
Bethal District Govan Mbeki
Volkrust District Pixley Ka Seme
Diagnostic services and new developments
The total number of tests performed in the Mpumalanga Province was 5 027 634 in 2017/2018. Testing at the NHLS Ehlanzeni Business Unit increased by approximately 1.2%, from 2 820 623 tests in 2016/2017 to 2 854 968 tests in 2017/2018. There were 2 207 011 tests performed at Gert Sibande- Nkangala which constitutes a 1% decrease from last year.
The NPP tests were well monitored and supported. Table M3 below shows the year-on-year changes in the provincial test volumes.
Table M3: Mpumalanga test volumes per type
Test type Volumes 2016/2017 Volumes 2017/2018 % DifferenceCD4 298 755 252 771 -15.39%
HIV viral load 405 446 450 308 11.0%
Cervical cancer screening 68 096 68 121 -0.037%
TB GeneXpert 114 333 100 433 -12.16%
Viral load testing shows an increase of 11% in 2017/2018, when compared to 2016/2017, while CD4 count tests declined by 18%. These variances were expected due to the introduction of eGK and the changes in the national guidelines for HIV management.
New developments
A new, fully automated pre-analytical system was installed in the viral load testing facility at Rob Ferreira Laboratory. The Roche Cobas p512 pre-analytical system was connected to Cobas 6800 and Cobas 8800 analysers to improve workflow and increase efficiency, thus improving TAT and preventing backlogs.
To improve the detection and diagnosis of TB from fine needle aspirates, the mycobacterium transport medium which contains 1.5ml of Middlebrook medium was introduced and made available to clinicians in the Ehlanzeni district. The media is inoculated at the patient bedside during the fine needle aspiration biopsy procedure. 0.7ml of the inoculated medium is used to perform the Xpert MTB/ RIF and the rest can be send for TB culture testing, if requested.

ANNUAL REPORT 2017/18
Page - 127
In addition, the Rob Ferreira Laboratory successfully verified and implemented C. DIFF QUIK CHEK COMPLETE® kits. These kits enable enzyme immunoassays tests used for the rapid detection of C. difficile-specific glutamate dehydrogenase (GDH) and/or toxin A/B antigens in stool specimens. The tests are also used for the diagnosis of clostridium difficile infection (CDI). It was found to have good sensitivity and specificity.
Rapid and accurate diagnosis of CDI is crucial for patient care as most infections are hospital-acquired and associated with the use of broad spectrum antibiotics.
C. DIFF QUIK CHEK COMPLETE® takes 25 minutes to perform and the results are available within an hour. Positive results are phoned out to the clinicians immediately. The kits have improved laboratory detection and diagnosis of CDI from stool samples significantly.
At the Gert Sibande Business Unit, all RPR requests from clinics serviced by the other 10 laboratories were fully automated and referred to Ermelo laboratory for testing, as a result of the automated Roche Syphilis test what was made available. This decreased the number of manual tests performed at the unit and also reduced manual labour, which in turn alleviated the issue of staff having to work prolonged hours to fulfil the requests for RPR tests.
LBC testing was implemented in Mpumalanga, at four sub districts; Emalahleni, Victor Khanye and Steve Tshwete and Emakhazeni.
Service delivery and coverage
The NHLS in Mpumalanga ensured accessibility to pathology services by maintaining 100% daily coverage in 282 PHCs and CHCs, through its specimen collection service. Twenty-two of these facilities (8%) are visited for collection twice a day. Some small district hospitals without on-site NHLS services, such as Matibidi, Sabie and Carolina and other hospitals, are also covered through specimen collection twice a day.
Carolina and Bethal Hospitals have blood gas analysers that assist the clinicians in quick diagnostic testing for their emergency cases, with a plan in place to install additional blood gas analysers at two additional sites that do not have an NHLS presence on site.
Mpumalanga managed to successfully recruit a microbiologist at Rob Ferreira Hospital which improved service delivery and customer service for the whole province as she visits and consults clinicians on medical microbiology issues, to improve patient care.
The microbiology pathologist furthermore contributed toward improving liaison with the clinicians. She is available to attend to microbiology queries on a call-out basis, every day. She also ensures that all critical microbiology results are phoned out and that appropriate advice is given to HCWs.
The pathologist has already visited several hospitals in the province; including: Themba, Sabie, Mapulaneng, Embhuleni, Barberton, Ermelo and Witbank. She also conducts ward rounds in ICU twice a week, to discuss microbiology results and treatment options while encouraging antibiotic stewardship. This is the first time that such a service is available in the province.
The Mpumalanga region also managed to establish a microbiology working group. The working group was created to:
• Review and standardise microbiology procedures in NHLS Mpumalanga;
• Ensure competency and compliance with accreditation;
• Promote good practice in laboratory medicine; and
• Implement laboratory procedures to reduce costs and improve TAT.
The group has already commenced with a process of reviewing all the SOPs in the microbiology laboratories, with the aim of streamlining processes.

ANNUAL REPORT 2017/18
Page - 128
Turnaround Times (TATs)
Table M4: TATs of tests
Business unit Test group Test type Target Test countVolume within
target TAT% Within target
TAT
Ehlanzeni
ARVCD4 95% 130 910 108 651 83.00%
VL 70% 450 308 386 759 85.89%
CHEMLFT 90% 479 231 398 552 83.16%
U+E 90% 513 900 437 909 85.21%
HAEM FBC 90% 162 600 140 630 86.49%
TBGeneXpert 95% 46 974 45 376 96.60%
Microscopy 95% 21 685 20 888 96.32%
Gert Sibande-Nkangala
ARV CD4 95% 121 861 115 924 95.13%
CHEMLFT 90% 497 055 436 021 87.72%
U+E 90% 520 102 459 168 88.28%
HAEM FBC 90% 161 539 144 283 89.32%
TB GeneXpert 95% 53 459 50 830 95.08%
Microscopy 95% 21 286 19 625 92.20%
Poor TATs were caused by delays in authorisation of results when technicians were working over weekends, without a technologist on site to approve the results. Other tests such as TB microscopy, TB GeneXpert and HIV viral load are on auto review and do not need to be approved by a technologist.
Notable achievements
Stepwise Laboratory Quality Improvement Process Towards Accreditation (SLIPTA)
Rob Ferreira laboratory maintained 3 stars (84%) in the October 2017 SLIPTA audit. The results showed that the laboratory is almost ready for SANAS accreditation, although a few gaps in the QMS requirements were identified. The laboratory supervisor position has since been filled which will contribute to improvement of the QMS, to prepare the laboratory for SANAS accreditation.
The pap smear adequacy rate improved from 46% in 2016/2017 to 51% in 2017/2018. This is a notable improvement of 5%, following interventions on collection of quality pap smears and reporting of transformation zone material on pap smears by the cytology laboratories.
The unit was able to participate in the Pathology Research and Development (PathRed) Congress that was held during the month of June 2017. One of our employees from Ermelo laboratory presented a poster on TB Blood Culture analysis, using the Hein MTBDR+ kit for the identification of M-Tuberculosis.
The study covered data analysed at Ermelo TB laboratory from 2015 to mid-2017. It also included 67 cases of miliary TB that were sourced from Mpumalanga Province. The study was supported by Professor N. Mbele and Dr M. Said (TAD) and Dr F. Ismail (NICD).
The Klebsiella pnemoniae resistant to carbapenem was isolated from three patients in Rob Ferreira ICU and was confirmed positive for the New Delhi Metallo beta-lactamase (NDM) genes at NICD. This was the first time that an NDM carbapenemase-producing isolate has been isolated in Mpumalanga.

ANNUAL REPORT 2017/18
Page - 129
Image M2: Participation in PATHRED.
The NHLS in Mpumalanga hosted a successful OHS Indaba. The aim of the meeting was to:o Create health and safety) awareness; o Encourage a standardised approach when dealing with health and safety matters;o Encourage, maintain and continually improve effective health and safety management systems;o Promote good working relationships between all employees; ando Incorporate health and safety elements in all operational activities.
Officials from the NIOH were invited to conduct presentations at the event.
SANAS Accreditation
Ermelo Regional Laboratory was able to maintain its full SANAS accreditation status in all tests offered, including TB, with only two non-conformities that were raised by the external auditors.
Witbank Laboratory was able to only maintain its SANAS accreditation status, with a plan to soon increase its scope of tests. These accreditations were achieved despite a year that was marked by minimal resources within the organisation.
Laboratory upgrades
Barberton Laboratory: The laboratory was re-painted and additional benchtops and cabinets were installed to improve working and storage space. An access control system was installed to create a safe environment for employees and protect NHLS assets.
Mapulaneng Laboratory: An access control was installed to create a safe working environment for NHLS employees and protect NHLS assets.
Shongwe Laboratory: A Jojo tank was installed at Shongwe laboratory to counteract the issue of poor quality water that was received from the municipality which increased water purification costs for the laboratory. This intervention reduced operating costs and reduced breakdowns of the chemistry analyser.
Rob Ferreira Laboratory: The microbiologist office was renovated to create a more user-friendly environment for the pathologist and improve working conditions.
Technical skills and staffing
The total number of staff in Mpumalanga as at 31 March 2018 was 204; of whom 105 were stationed at Ehlanzeni and 99 at Gert Sibande-Nkangala Business Units. Only 44% of the staff complement consist of technical skills. This includes laboratory managers and supervisors, medical technologists and technicians.

ANNUAL REPORT 2017/18
Page - 130
20 Cleaners and messengers were insourced which increased the total staff complement, but due to organisational financial challenges, the number of technical staff remained the same.
Skills development and training
The NHLS made a significant investment in the skills development and training of staff and about 92% of the WSP was implemented.
Stakeholder relations
Stakeholder relations in the Mpumalanga are continuously managed through engagements at different levels and through different programmes. SLA review meetings with the provincial DoH were held on a quarterly basis, during which the following were addressed:
• Services delivered during the period under review;
• Perceived quality, efficiency, effectiveness and economy of laboratory service delivery;
• Timeliness of payments made by the department to the NHLS;
• Cost utilities arising from municipality services; and
• Other management and administrative matters as determined as necessary.
In addition, engagements were held with the following stakeholders:
Mpumalanga DoH
• Quarterly PMTCT meetings were held with the Mpumalanga DoH during which their performance on the HIV Mother-To-Child Transmission programme was presented. Challenges experienced by laboratories with regard to high rejection rates were also discussed and ways to curb or reduce rejections were explored.
• PHC laboratory handbook training sessions were attended in preparation of the rollout of the new request forms, in line with the ideal clinic strategy.
• The CEOs and clinical managers from the Gert Sibande - Nkangala Business Unit also attended training presented by Thusano, which was aimed at improving the management of costs in pathology services at their hospitals.
• There were also engagements with the DCS, to address operational issues and identify gaps in service delivery.
• Collection of quality pap smears training sessions were conducted together with the provincial DoH and the respective district programme managers. A total of 30 training sessions were conducted at sub-district level in Mpumalanga. CDW statistics were used to identify facilities that are not performing well in terms of quality collection and these facilities were prioritised for training.
Non-governmental organisations (NGOs)
There was a collaboration between the DoH, the NHLS and Broad Reach for the development of training material to address operational challenges at PHC level in the Gert Sibande district on 2 March 2017.
Conclusion
During the reporting period, the NHLS in Mpumalanga delivered services in line with the mandate of the organisation. The NHLS maintained a high level of accessibility and quality through a network of laboratories, specimen collection services and quality management systems. This was achieved because of exceptionally dedicated employees, who optimised the limited resources to their avail. Regular interaction with numerous and important stakeholders, remained a key priority.
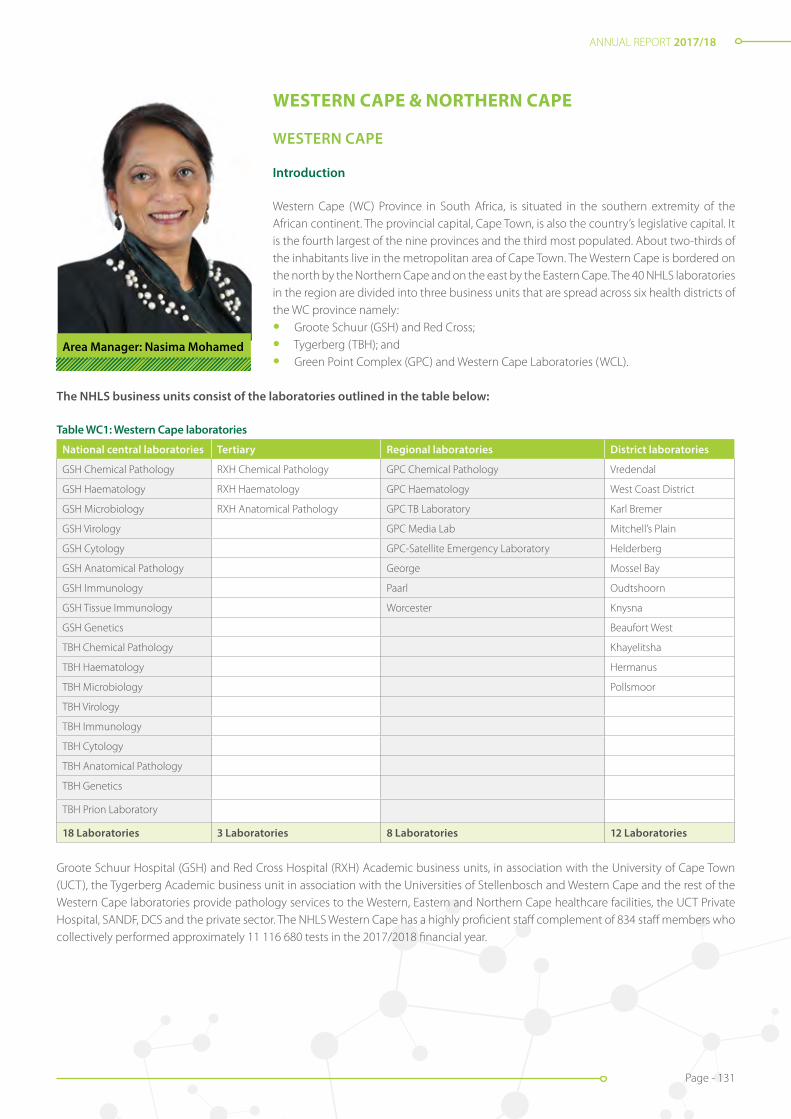
ANNUAL REPORT 2017/18
Page - 131
WESTERN CAPE & NORTHERN CAPE
WESTERN CAPE
Introduction
Western Cape (WC) Province in South Africa, is situated in the southern extremity of the African continent. The provincial capital, Cape Town, is also the country’s legislative capital. It is the fourth largest of the nine provinces and the third most populated. About two-thirds of the inhabitants live in the metropolitan area of Cape Town. The Western Cape is bordered on the north by the Northern Cape and on the east by the Eastern Cape. The 40 NHLS laboratories in the region are divided into three business units that are spread across six health districts of the WC province namely:
• Groote Schuur (GSH) and Red Cross;
• Tygerberg (TBH); and
• Green Point Complex (GPC) and Western Cape Laboratories (WCL).Area Manager: Nasima Mohamed
The NHLS business units consist of the laboratories outlined in the table below:
Table WC1: Western Cape laboratories
National central laboratories Tertiary Regional laboratories District laboratories
GSH Chemical Pathology RXH Chemical Pathology GPC Chemical Pathology Vredendal
GSH Haematology RXH Haematology GPC Haematology West Coast District
GSH Microbiology RXH Anatomical Pathology GPC TB Laboratory Karl Bremer
GSH Virology GPC Media Lab Mitchell’s Plain
GSH Cytology GPC-Satellite Emergency Laboratory Helderberg
GSH Anatomical Pathology George Mossel Bay
GSH Immunology Paarl Oudtshoorn
GSH Tissue Immunology Worcester Knysna
GSH Genetics Beaufort West
TBH Chemical Pathology Khayelitsha
TBH Haematology Hermanus
TBH Microbiology Pollsmoor
TBH Virology
TBH Immunology
TBH Cytology
TBH Anatomical Pathology
TBH Genetics
TBH Prion Laboratory
18 Laboratories 3 Laboratories 8 Laboratories 12 Laboratories
Groote Schuur Hospital (GSH) and Red Cross Hospital (RXH) Academic business units, in association with the University of Cape Town (UCT), the Tygerberg Academic business unit in association with the Universities of Stellenbosch and Western Cape and the rest of the Western Cape laboratories provide pathology services to the Western, Eastern and Northern Cape healthcare facilities, the UCT Private Hospital, SANDF, DCS and the private sector. The NHLS Western Cape has a highly proficient staff complement of 834 staff members who collectively performed approximately 11 116 680 tests in the 2017/2018 financial year.
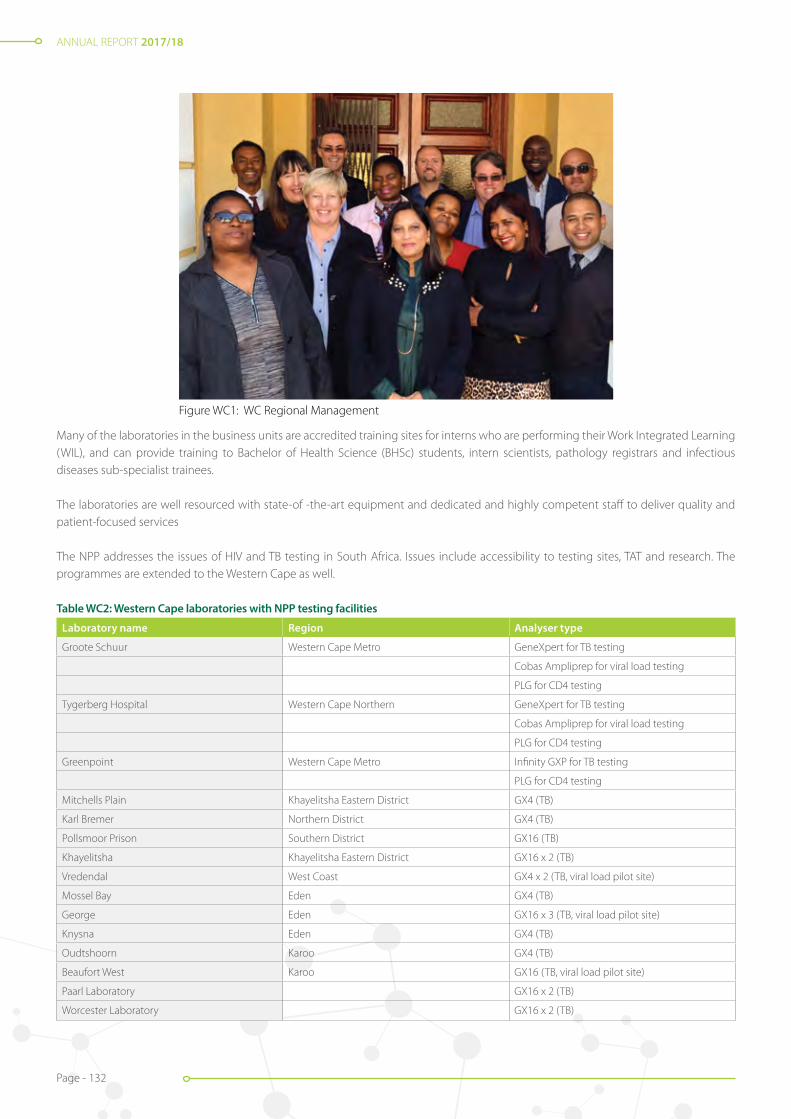
ANNUAL REPORT 2017/18
Page - 132
Figure WC1: WC Regional Management
Many of the laboratories in the business units are accredited training sites for interns who are performing their Work Integrated Learning (WIL), and can provide training to Bachelor of Health Science (BHSc) students, intern scientists, pathology registrars and infectious diseases sub-specialist trainees.
The laboratories are well resourced with state-of -the-art equipment and dedicated and highly competent staff to deliver quality and patient-focused services
The NPP addresses the issues of HIV and TB testing in South Africa. Issues include accessibility to testing sites, TAT and research. The programmes are extended to the Western Cape as well.
Table WC2: Western Cape laboratories with NPP testing facilities
Laboratory name Region Analyser type
Groote Schuur Western Cape Metro GeneXpert for TB testing
Cobas Ampliprep for viral load testing
PLG for CD4 testing
Tygerberg Hospital Western Cape Northern GeneXpert for TB testing
Cobas Ampliprep for viral load testing
PLG for CD4 testing
Greenpoint Western Cape Metro Infinity GXP for TB testing
PLG for CD4 testing
Mitchells Plain Khayelitsha Eastern District GX4 (TB)
Karl Bremer Northern District GX4 (TB)
Pollsmoor Prison Southern District GX16 (TB)
Khayelitsha Khayelitsha Eastern District GX16 x 2 (TB)
Vredendal West Coast GX4 x 2 (TB, viral load pilot site)
Mossel Bay Eden GX4 (TB)
George Eden GX16 x 3 (TB, viral load pilot site)
Knysna Eden GX4 (TB)
Oudtshoorn Karoo GX4 (TB)
Beaufort West Karoo GX16 (TB, viral load pilot site)
Paarl Laboratory GX16 x 2 (TB)
Worcester Laboratory GX16 x 2 (TB)

ANNUAL REPORT 2017/18
Page - 133
TB testing is offered at 15 sites throughout the Western Cape. Some of these sites offer laboratory services to health facilities in the the Northern Cape as well, such as Sutherland, Fraserburg, Calvinia, Loeriesfontein and Nieuwoudtville. Polsmoor prison has a fully functional TB lab on site.
HIV testing including viral load testing as well HIV PCR for EID is offered at the two academic sites in the WC namely Groote Schuur and Tygerberg Hospital. CD4 testing is offered at four sites, namely Groote Schuur, Tygerberg, Greenpoint and George laboratories.
Figure WC2a: Pollsmoor Prison laboratory Figure WC2b: Pollsmoor Prison laboratory
Diagnostic services and new developments
The Western Cape achieved a 3% increase year-on-year from 10 777 164 tests performed in 2016/2017 to 11 116 880 tests performed in the year under review. The workload increase can be contributed to an increase in viral load testing, anatomical pathology and microbiology samples.
Table WC3: NPP test volume comparison between 2016/2017 and 2017/2018
Business Unit Test Group Test Method Metrics Test Count 2017 test Count 2018 % Difference
Western Cape
Art
CD4 222 270 190 282 (14.39)
HIV PCR 38 083 41 256 8.33
VL 298 150 319 708 7.23
CYTO Cervical Smear 137 696 122 229 (11.23)
TBGeneXpert 250 648 235 018 (6.24)
Microscopy 160 221 144 125 (10.05)
The new GXP Ultra MTB assay was launched. The new assay offered an increase in sensitivity. It was rolled out in a phased manner throughout the country and implemented in the WC at the Khayelitsha laboratory on 13 December 2017.
A pilot study was launched to start viral load testing on the GXP analyser. Three sites were chosen in the WC viz; Vredendal, George and Beaufort West. Currently, data is being collected and results are being compared to the standard method on the Cobas Ampliprep analysers.
To improve document HIV rapid testing at facility level, the WC region is currently capturing patient HIV results from a pilot site, onto the LIS, so that these results are available countrywide on TrakCare Lab WebView.
The Tygerberg Virology laboratory is the only unit performing routine cell culture, virus isolation and Coxsackie virus neutralisation assays. It remains one of only a few NHLS laboratories performing HIV drug resistance testing for routine diagnostic purposes.
The new Primary Healthcare Laboratory Handbook was finally launched. This ushered in an era of standardisation across the province, as well as throughout the country. New request forms were also introduced. The new forms incorporate both TB and HIV testing, thus reducing complexity when ordering tests.
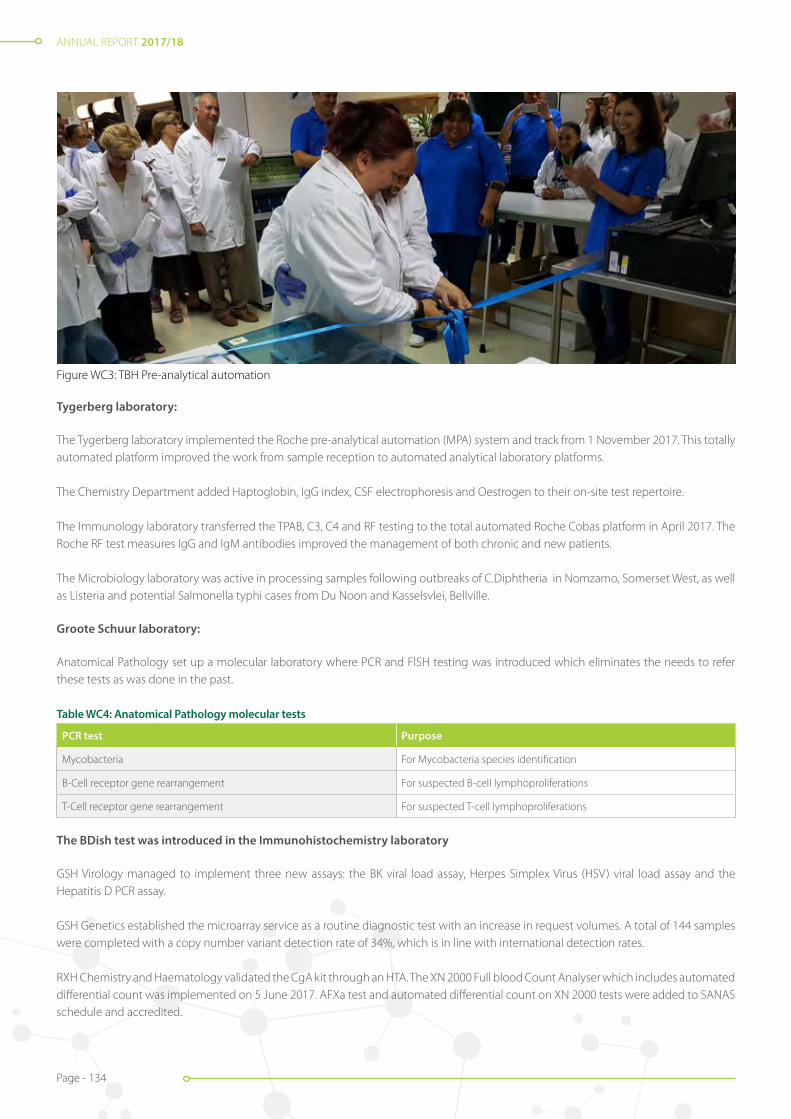
ANNUAL REPORT 2017/18
Page - 134
Figure WC3: TBH Pre-analytical automation
Tygerberg laboratory:
The Tygerberg laboratory implemented the Roche pre-analytical automation (MPA) system and track from 1 November 2017. This totally automated platform improved the work from sample reception to automated analytical laboratory platforms.
The Chemistry Department added Haptoglobin, IgG index, CSF electrophoresis and Oestrogen to their on-site test repertoire.
The Immunology laboratory transferred the TPAB, C3, C4 and RF testing to the total automated Roche Cobas platform in April 2017. The Roche RF test measures IgG and IgM antibodies improved the management of both chronic and new patients.
The Microbiology laboratory was active in processing samples following outbreaks of C.Diphtheria in Nomzamo, Somerset West, as well as Listeria and potential Salmonella typhi cases from Du Noon and Kasselsvlei, Bellville.
Groote Schuur laboratory:
Anatomical Pathology set up a molecular laboratory where PCR and FISH testing was introduced which eliminates the needs to refer these tests as was done in the past.
Table WC4: Anatomical Pathology molecular tests
PCR test Purpose
Mycobacteria For Mycobacteria species identification
B-Cell receptor gene rearrangement For suspected B-cell lymphoproliferations
T-Cell receptor gene rearrangement For suspected T-cell lymphoproliferations
The BDish test was introduced in the Immunohistochemistry laboratory
GSH Virology managed to implement three new assays: the BK viral load assay, Herpes Simplex Virus (HSV) viral load assay and the Hepatitis D PCR assay.
GSH Genetics established the microarray service as a routine diagnostic test with an increase in request volumes. A total of 144 samples were completed with a copy number variant detection rate of 34%, which is in line with international detection rates.
RXH Chemistry and Haematology validated the CgA kit through an HTA. The XN 2000 Full blood Count Analyser which includes automated differential count was implemented on 5 June 2017. AFXa test and automated differential count on XN 2000 tests were added to SANAS schedule and accredited.

ANNUAL REPORT 2017/18
Page - 135
The WC Regional laboratories achieved a 9.9% increase in tests volumes year on year which is attributed to the expanded tests repertoire for Paarl and Worcester laboratories (Treponema Pallidum Antibody (TPAB) and HIV Elisa testing).
Service delivery and coverage
Health facilities in the Western Cape have 100% coverage of specimen collections with a large number of facilities having more than one collection per day.
The TB/HIV co-ordinator, cytology coordinator, managers and pathologists remain involved in regular training and teaching programmes for HCWs.
Phlebotomy services are provided in support of the area’s military health (SANDF), which monitors occupational health and safety for the military.
Western Cape pathologists play a pivotal role in pathology coverage within the NHLS. Pathologists, registrars and HODs participate in various clinical meetings and forums contributing to and guiding patient management.
Pathologists, as well as a number of senior technologists and managers serve on among others the medical technologist scientific advisory committees; the National Education Committee; and the NHLS Expert committees. There is also participation in setting and moderation of Board examinations.
GSH and TBH Chemical pathologists provided quality control guidance and clinical input to the Kimberley Laboratory.
The Tygerberg Chemistry Laboratory offers an improved service to the hospital by providing Intra-operative PTH tests to confirm the complete removal of parathyroid glands, which in turn reduces the need for further surgery.
The Immunology Laboratory TBH screened potential VHF patients in collaboration with the NICD for confirmation/ exclusion of Rickettsial and Leptospiral cases during 2017 and in January 2018.
Turnaround Times (TATs)
NPP targets have all been met and maintained in the period under review. U&E, FBC and LFT targets were all consistently achieved during this period.
Notable achievements
The DMP laboratory at GPC was successfully audited for SABS certification using the SANAS ISO 9001:2015 standard. The DMP laboratory is the first to achieve this certification in the NHLS.
The GSH Tissue Immunology Department maintained European Federation of Immunology (EFI) Accreditation. They are the only laboratory in Africa with EFI Accreditation.
The Virology Laboratory achieved WHO Pre-qualification Evaluation Laboratory status in January 2018. The laboratory can evaluate kits/reagents for the following tests: HIV nucleic acids, HIV antigen/ antibody, HB surface antigen, HBV nucleic acids and HCV nucleic acids.
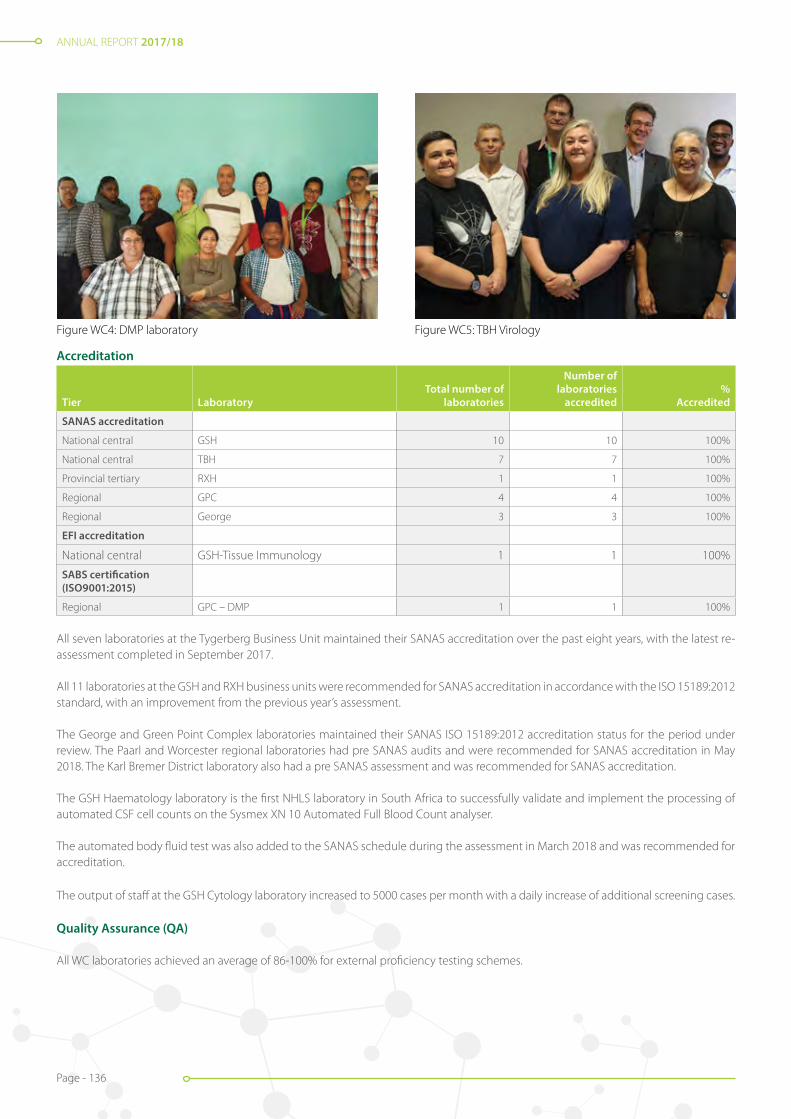
ANNUAL REPORT 2017/18
Page - 136
Accreditation
Tier LaboratoryTotal number of
laboratories
Number of laboratories
accredited%
Accredited
SANAS accreditation
National central GSH 10 10 100%
National central TBH 7 7 100%
Provincial tertiary RXH 1 1 100%
Regional GPC 4 4 100%
Regional George 3 3 100%
EFI accreditation
National central GSH-Tissue Immunology 1 1 100%
SABS certification (ISO9001:2015)
Regional GPC – DMP 1 1 100%
All seven laboratories at the Tygerberg Business Unit maintained their SANAS accreditation over the past eight years, with the latest re-assessment completed in September 2017.
All 11 laboratories at the GSH and RXH business units were recommended for SANAS accreditation in accordance with the ISO 15189:2012 standard, with an improvement from the previous year’s assessment.
The George and Green Point Complex laboratories maintained their SANAS ISO 15189:2012 accreditation status for the period under review. The Paarl and Worcester regional laboratories had pre SANAS audits and were recommended for SANAS accreditation in May 2018. The Karl Bremer District laboratory also had a pre SANAS assessment and was recommended for SANAS accreditation.
The GSH Haematology laboratory is the first NHLS laboratory in South Africa to successfully validate and implement the processing of automated CSF cell counts on the Sysmex XN 10 Automated Full Blood Count analyser.
The automated body fluid test was also added to the SANAS schedule during the assessment in March 2018 and was recommended for accreditation.
The output of staff at the GSH Cytology laboratory increased to 5000 cases per month with a daily increase of additional screening cases.
Quality Assurance (QA)
All WC laboratories achieved an average of 86-100% for external proficiency testing schemes.
Figure WC4: DMP laboratory Figure WC5: TBH Virology

ANNUAL REPORT 2017/18
Page - 137
RXH Anatomical pathology
A new lung biopsy protocol has been implemented in conjunction with the Paediatric Pulmonology Clinic, which is more effective in diagnosing paediatric interstitial lung disease. The method entails taking redefined sections from a lung biopsy, to achieve maximum results.
New stain highlighting biofilms in organisms
The laboratory introduced a new stain, which uses a combined Sandiford-Alcian Blue method to demonstrate Klebsiella biofilms. This is the first time these two stains were used together in a study. This new dual stain highlights a high-risk group with infection by Gram negative bacteria that possess a biofilm. This may also help further research in the topic of biofilms.
New laboratories and upgrades
West Coast District laboratory moved into the new Vredenburg Hospital in June 2017. The laboratory was unveiled in August 2017 and features an open plan design with improved workflow to allow for TAT improvements for the laboratory tests.
The Western Cape NHLS HIV PCR laboratory moved from its site at the Tygerberg Medical School to the routine laboratory in Tygerberg Hospital. Minor renovations were completed.
The water crisis in the Western Cape necessitated major changes to water consumption and supply in the province. Boreholes were sunk at facilities to ensure water supply to the respective hospitals. Filtration units are in the process of being installed at all sites and should be operational by mid-2018. This will ensure that the hospital and laboratories are supplied with quality municipal water.
Stakeholder relations
The NHLS in collaboration with the UCT Medical School, facilitated a workshop on International Pathology Day, to demonstrate how research improves patient care and forensic investigations.
The NHLS GSH committed to assist the 2 Military Hospital in Wynberg with all referral tests. As part of national coverage, the main laboratories at GSH and TBH assisted the NHLS laboratories from Kimberley in the Northern Cape to Port Elizabeth, Umtata and East London in the Eastern Cape.
The NHLS GSH and TBH laboratories in partnership with the NDoH, took on community service doctors during January and March 2018 respectively. The ultimate aim is to encourage these doctors to apply for our registrar programme during 2019.
The NHLS management staff continues to participate and assist from a laboratory perspective in the yearly WC hospitals intern doctors’ orientation for 2018.
Together with external supplier’s extensive phlebotomy training was offered to hospital and clinic nursing staff. The purpose was to improve the quality of samples received for testing and reduce the rejection rate. Additional monitoring of rejection rates and discussions on strategies to reduce these rates occur regularly, at sub-district meetings and hospital meeting forums.
The year was characterised by a strike of an unprecedented scale which was partially peaceful, and partially disruptive. At the Greenpoint Complex in Cape Town, all the staff, including the area manager, joined hands and worked tirelessly through several nights to process samples and minimise the impact of the strike.
ANNUAL REPORT 2017/18
Page - 138
Even though some of the WC laboratories had to be closed down, the Province continued to provide a full service to its clients.
HAST and district meetings
As part of our stakeholder relationships, we regularly attend district and sub-district meetings. Attendees at these meetings include the facility managers and sub-district managers. We leverage these opportunities to highlight challenges experienced at the laboratories and to conduct some training. During the last part of the year, there has been a strong focus on phlebotomy, as we realised that a lot of specimen rejections at the laboratory was due to poor collection of blood samples.
Outreach on the farms in Piketberg in WC
For this outreach we deployed our mobile laboratories on the farms in Piketberg. On site GXP testing was conducted and further follow up testing was referred to our Greenpoint laboratory.
World AIDS Day 2017
The NHLS offered support to the various facilities on World AIDS Day. Outreach stands and tents were strategically set up in various places such as railway stations and large malls, in an attempt to attract a significant number of the public for testing.
Conclusion
The WC NHLS continues to provide high quality diagnostic services to stakeholders in the Western Cape and other provinces. WC laboratories improved their services to clients and 25 laboratories managed to maintain their SANAS accreditation. The Province will continue to support the key objective the NHLS strategy, which is to achieve accreditation of all laboratories in the region.
Business Managers, Heads of Department and the Area Manager are all committed to the organisation’s values, which has ensured that the WC NHLS laboratories excelled in service delivery, quality assurance and financial management.

ANNUAL REPORT 2017/18
Page - 139
NORTHERN CAPE
Introduction
Northern Cape is the largest and the most sparsely populated province in South Africa. It has a surface area of 372-889km² with a total population of approximately 1-185 600 (2015). It has five districts, namely Frances Baard, John Taolo Gaetsewe, ZF Mgcawu, Pixley Ka Seme (NHI site) and Namaqua. There is one NHLS laboratory in each district.
In line with the overall NHLS strategy, we are working at increasing accessibility to services by increasing the laboratories in each business unit. This will be achieved by having a laboratory at each district hospital. The initial focus is Kuruman and Hartswater (Connie Vorster) hospitals. This project was delayed due to non-payment of the NHLS account. The total staff complement in the business unit was 92, as at the end of March 2018.
We are also working tirelessly to achieve SANAS accreditation for all our laboratories. Kimberley laboratory maintained their accreditation status after an assessment in December 2017. De Aar, Tshwaragano, Upington and Springbok are being prepared for SANAS accreditation as well. Internal audits were conducted at Upington and De Aar laboratories, in preparation for pre SANAS assessment and application in April/May 2018. These laboratories should be SANAS accredited by the end of 2018.
We continue to support and align our services with the mandate of the DoH, and we are committed to contribute to the government’s vision of a “long and healthy life for all South Africans,” as well as the 90-90-90 goals. We work very close with the provincial DoH in the implementation of the ideal clinic guidelines, using the ideal clinic checklist.
All laboratories perform TB microscopy and GeneXpert tests. There are three CD4 testing sites, namely, Kimberley, Upington and De Aar laboratories. Specialised tests are referred to Braamfontein, Universitas, Tygerberg, Green Point, Charlotte Maxeke Johannesburg and Tshwane Academic hospitals.
The province implemented the national eGK rules in March 2018. This initiative is meant to curb wasteful expenditure in laboratory testing, ensuring that tests are not duplicated unnecessarily, and that guidelines are adhered to. All laboratories are on the TrakCare Lab WebView LIS, which enables seamless specimen referral and access to the results on the NHLS intranet. A Metrofile system was implemented for easy storage, accessibility and retrieval of documents. ECM scanning is implemented in all the laboratories, to ensure easy access to request forms during audits.
We were also involved in the PHC handbook training and implementation. The training was conducted at both provincial and district level. This is meant to enable laboratories to align with of the ideal clinic requirements. The handbooks were sent to the facilities.
The HCWs and laboratory staff were trained on GeneXpert Ultra, which was implemented in March 2018. This method is designed to increase the detection of TB particularly amongst patients living with HIV. The specimen type, analysers, specimen processing protocol, specimen type and volumes used, remains the same.
The electricity upgrade at Tshwaragano Hospital was a great achievement as frequent power failures affected the efficiency of laboratory negatively. We are now also connected to the main hospital generator, which is very helpful during power failures.
Table NC1: NHLS laboratories per district
Province District Lab After-hour service
NC Frances Baard Kimberley Night shift/24-hour laboratory
NC John Taolo Gaetsewe Tshwaragano On-call
NC ZF Mgcawu Upington Night shift/ On-call weekends
NC Pixley ka Seme De Aar On-call
NC Namaqua Springbok On-call
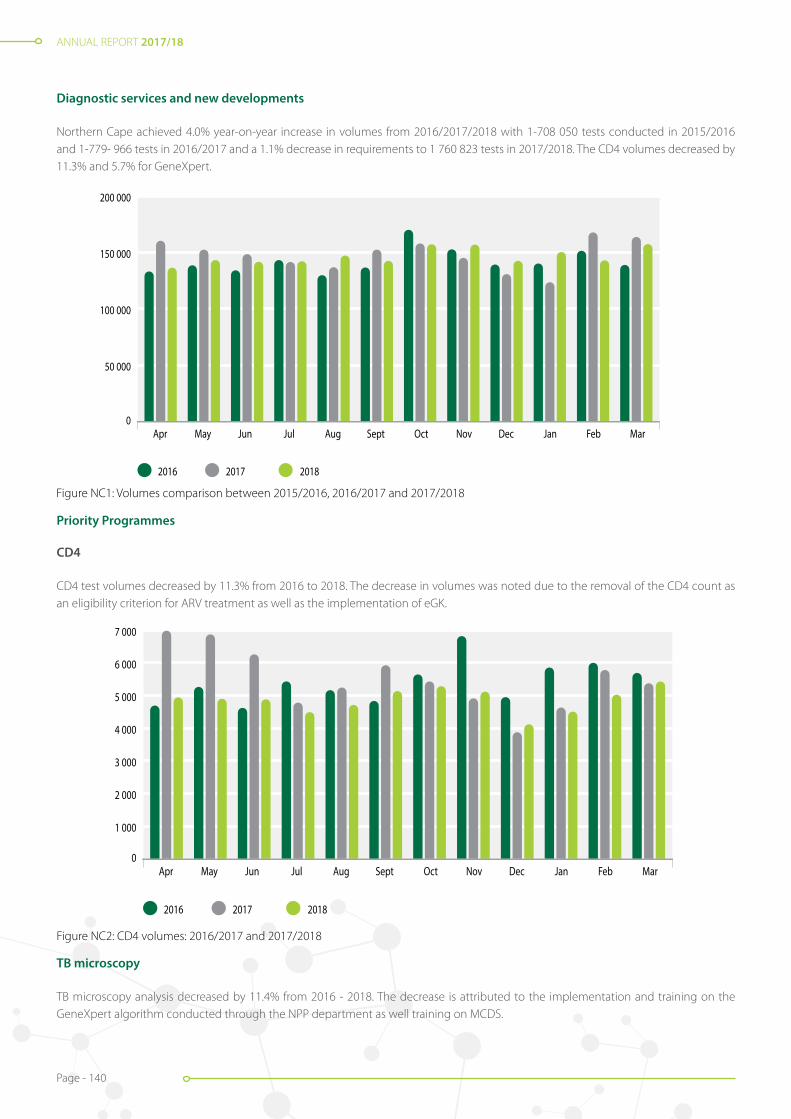
ANNUAL REPORT 2017/18
Page - 140
TB microscopy
TB microscopy analysis decreased by 11.4% from 2016 - 2018. The decrease is attributed to the implementation and training on the GeneXpert algorithm conducted through the NPP department as well training on MCDS.
0
1 000
2 000
3 000
4 000
5 000
6 000
7 000
2016 2017 2018
Apr May Jun Jul Aug Sept Oct Nov Dec Jan Feb Mar
Figure NC 2: CD4 volumes: 2016/2017 and 2017/2018Figure NC2: CD4 volumes: 2016/2017 and 2017/2018
Diagnostic services and new developments
Northern Cape achieved 4.0% year-on-year increase in volumes from 2016/2017/2018 with 1-708 050 tests conducted in 2015/2016 and 1-779- 966 tests in 2016/2017 and a 1.1% decrease in requirements to 1 760 823 tests in 2017/2018. The CD4 volumes decreased by 11.3% and 5.7% for GeneXpert.
0
50 000
100 000
150 000
200 000
2016 2017 2018
Apr May Jun Jul Aug Sept Oct Nov Dec Jan Feb Mar
Figure NC 1: Volumes comparison between 2015/2016, 2016/2017 and 2017/2018Figure NC1: Volumes comparison between 2015/2016, 2016/2017 and 2017/2018
Priority Programmes
CD4
CD4 test volumes decreased by 11.3% from 2016 to 2018. The decrease in volumes was noted due to the removal of the CD4 count as an eligibility criterion for ARV treatment as well as the implementation of eGK.

ANNUAL REPORT 2017/18
Page - 141
Figure NC3: TB microscopy volumes
0
500
1 000
1 500
2 000
2 500
2016 2017 2018
Apr May Jun Jul Aug Sept Oct Nov Dec Jan Feb Mar
Figure NC 3: TB microscopy volumes
GeneXpert Analysis
GeneXpert analysis decreased by 5.5% from 78 461 in 2015/2016 to 74-188 in 2016/2017 and by 5.7% to 69 995 in 2017/2018. The decrease is attributed to continuous training and support provided by the NPP department on GeneXpert algorithm implementation. The DoH also implemented cost containment measures for laboratory testing, including eGK. The decrease could also be due to the decrease in the TB infection rate.
Figure NC4: GeneXpert volumes
0
2 000
4 000
6 000
8 000
10 000
2016 2017 2018
Apr May Jun Jul Aug Sept Oct Nov Dec Jan Feb Mar
Figure NC 4: GeneXpert volumes
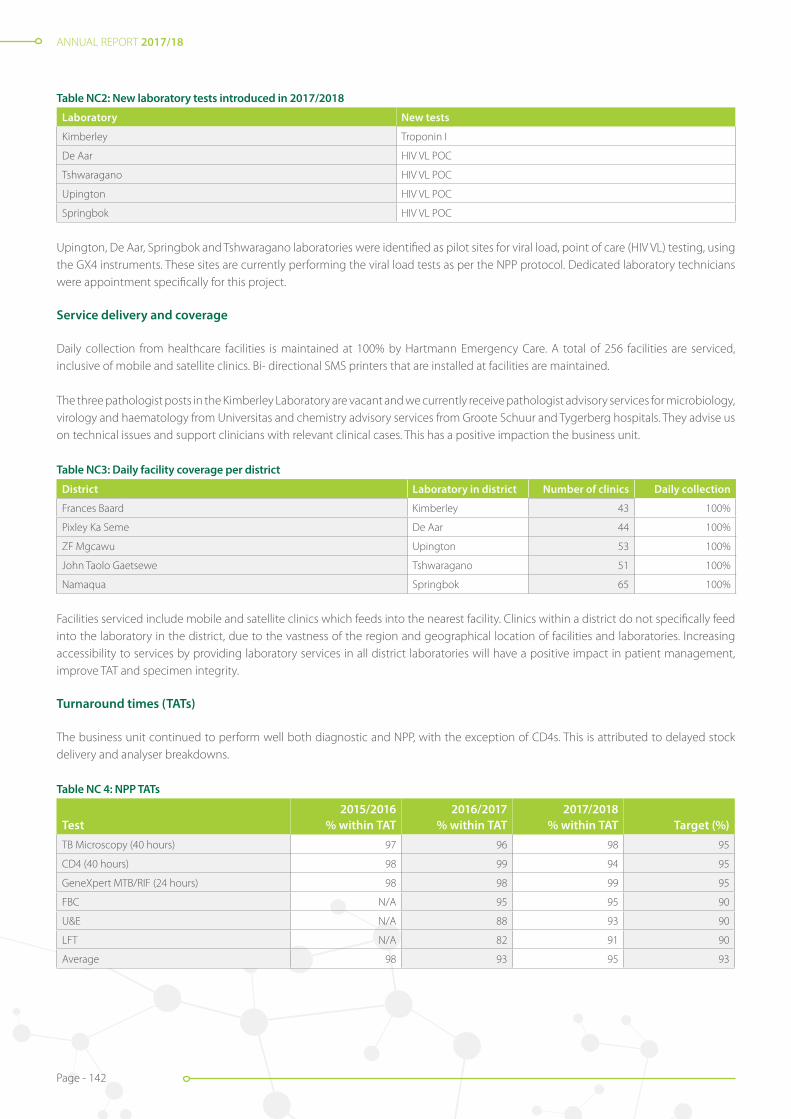
ANNUAL REPORT 2017/18
Page - 142
Table NC2: New laboratory tests introduced in 2017/2018
Laboratory New tests
Kimberley Troponin I
De Aar HIV VL POC
Tshwaragano HIV VL POC
Upington HIV VL POC
Springbok HIV VL POC
Upington, De Aar, Springbok and Tshwaragano laboratories were identified as pilot sites for viral load, point of care (HIV VL) testing, using the GX4 instruments. These sites are currently performing the viral load tests as per the NPP protocol. Dedicated laboratory technicians were appointment specifically for this project.
Service delivery and coverage
Daily collection from healthcare facilities is maintained at 100% by Hartmann Emergency Care. A total of 256 facilities are serviced, inclusive of mobile and satellite clinics. Bi- directional SMS printers that are installed at facilities are maintained.
The three pathologist posts in the Kimberley Laboratory are vacant and we currently receive pathologist advisory services for microbiology, virology and haematology from Universitas and chemistry advisory services from Groote Schuur and Tygerberg hospitals. They advise us on technical issues and support clinicians with relevant clinical cases. This has a positive impaction the business unit.
Table NC3: Daily facility coverage per district
District Laboratory in district Number of clinics Daily collection
Frances Baard Kimberley 43 100%
Pixley Ka Seme De Aar 44 100%
ZF Mgcawu Upington 53 100%
John Taolo Gaetsewe Tshwaragano 51 100%
Namaqua Springbok 65 100%
Facilities serviced include mobile and satellite clinics which feeds into the nearest facility. Clinics within a district do not specifically feed into the laboratory in the district, due to the vastness of the region and geographical location of facilities and laboratories. Increasing accessibility to services by providing laboratory services in all district laboratories will have a positive impact in patient management, improve TAT and specimen integrity.
Turnaround times (TATs)
The business unit continued to perform well both diagnostic and NPP, with the exception of CD4s. This is attributed to delayed stock delivery and analyser breakdowns.
Table NC 4: NPP TATs
Test2015/2016
% within TAT2016/2017
% within TAT2017/2018
% within TAT Target (%)TB Microscopy (40 hours) 97 96 98 95
CD4 (40 hours) 98 99 94 95
GeneXpert MTB/RIF (24 hours) 98 98 99 95
FBC N/A 95 95 90
U&E N/A 88 93 90
LFT N/A 82 91 90
Average 98 93 95 93
ANNUAL REPORT 2017/18
Page - 143
Client interaction management
The presence of client liaison officer improved stakeholder relationships in the business unit. It also reduced the number of complaints as she spent most of her time in the districts and the laboratories, assisting with service improvement issues and training.
District meetings were also attended to ensure that issues are addressed at district level. Overall, our Client Liaison Officer visited 71 clinics and 20 hospital wards, trained 833 HCWs on MCDS, WebView access, pap smears, PCR (EID), GeneXpert, blood collection and use of SMS printers.
We also strengthened stakeholder relationships significantly, by continuing to participate provincial meetings, which has in turn led to improved services. The business unit was also actively involved in the provincial commemoration of World TB Day, as well as the World AIDS Day in Upington.
In an initiative to address the skills shortage in the province, we had an exhibition at the career day at Sol Plaatje University (SPU)in Kimberley, with the support of the training department.
70 Grade 11 learners visited the Kimberley laboratory in the fourth quarter of 2017/2018 to be introduced to the career of a medical technologist. One learner from the previous year’s group did official job shadowing in October 2017.
Technical skills and training
The business unit made a considerable effort to ensure that training takes place at all levels. A total of 883 HCWs and 118 staff members were trained.
Technical staff and pathologist retention remains a challenge. The posts are advertised but are either unsuitable, or no candidates applying. This poses a critical operational challenge, especially with the implementation of a sustainable shift system in all departments, over a 24-hour period.
Training of students
Kimberley laboratory is the only training laboratory in the business unit. Of the five technician students who wrote exams in October 2017, only one passed and was appointed at Kimberley laboratory. One previous intern technologist re-wrote her exam in September 2017, passed and was subsequently appointed in Kimberley. Seven student medical technologists were appointed in February 2017 and wrote their exams in March 2018, with results still pending.
The students are continuously assessed to identify gaps and challenges and address them timeously. They also attend the refresher courses offered by the training department. The Training department provides support in terms of learning material, block sessions and mock examinations.
Retention of students in the rural/outlying areas remains a challenge. The students stay for the duration of their contracts, but immediately leave when their contracts come to an end. One of the reasons for this, as cited by staff, is the high cost of accommodation in the area.
Accreditation
The Kimberley laboratory was accredited in June 2017 after successfully addressing all areas of non-conformance which was highlighted during their initial SANAS audit in February 2017. The laboratory also managed to retain its SANAS accreditation status after the 6-month follow-up audit in December 2017. This was a great achievement for the Northern Cape as this is the only tertiary laboratory in the province.
The business unit is supported by an on-site QA coordinator, who is supported by the quality manager. He provides support to all the laboratories in the business unit and played an instrumental role in the accreditation process.
De Aar Laboratory was identified as the NHI pilot site. It is also being prepared for accreditation and to apply for a pre SANAS audit, following an internal audit in February 2018. The QA department is working closely with all the laboratories to ensure that they perform at an accredited laboratory level and are ultimately able to obtain accreditation status.

ANNUAL REPORT 2017/18
Page - 144
Figure NC6 new De Aar HospitalFigure NC5: World TB Day door to door visits with the Premier
Information technology
On 5 March 2018, eGK was implemented at all the facilities in the Northern Cape as per the national eGK rules and as requested by the DoH. The implementation was coordinated by a combined team from DoH and the NHLS.
All the network points in the Kimberley laboratory were replaced and additional points were installed as part of the laboratory renovation project. The server room was moved to a new location and a new switch cabinet was installed to accommodate the expansion of the IT network.
The HL7 project in the Kimberley Hospital is ready to be revived after it was on hold for one year.
New laboratories and upgrades
The new hospital at De Aar is complete and the laboratory occupied its new premises. Kimberley laboratory was recommended for pre-analytical automation, but the tender process has not yet been completed.
The first stage of the renovations at Kimberley started with a site visit in March 2018. The renovations will take place in the laboratory support department and include the expansion of the phlebotomy service. The structural changes within the receiving office will improve workflow tremendously and prepare the department for pre-analytical automation.
Conclusion
Overall the business unit’s performance improved and is stable. Great improvements were noted in the compliance and safety audits. The Kimberley laboratory achieved accreditation and appointed the students who passed their board exams.
We remain hopeful that we will be able to attract pathologists and that the new high school learner’s retention strategy will address this skills challenge. As a team, we are however committed to optimise the resources to our avail to continue to improve patient care and service delivery in the province.

ANNUAL REPORT 2017/18
Page - 145
Performance Information by Subsidiary
SOUTH AFRICAN VACCINE PRODUCERS (SAVP)
SAVP continues to supply our strategic antivenom products. We have feedback on a recent black mamba bite incident: “A male in the Mpumalanga region was bitten by a black mamba. Approximately 11 minutes after the bite he had symptoms of neurotoxic envenomation but fortunately arrived at a hospital. Just prior to the need for intubation, 10 ampoules of polyvalent antivenom were administered. Twenty-six minutes after administration all symptoms had mostly reversed. The patient was able to be discharged the following day.”
SAVP dispatched 108 66 units of antivenom in the 2017/2018 financial year, the breakdown of which is as follows:
• 27% to the DoH;
• 47% to the private market (vets/wholesalers); and
• 26% for export.Manager: Megan Saffer
We observed a marked increase in the sale of Boomslang antivenom which was up by 125% from the previous year, to 210 units. Considering that a maximum of two units are required to treat a Boomslang envenomation, this equates to approximately 105 Boomslang envenomations throughout the year.
SAVP remains the sole manufacturer of Boomslang antivenom worldwide.
SAVP stables
Two foals, a colt and a filly, were born from October to November 2017. We are very proud of our beautiful new additions to the family.
700 litres of horse and sheep blood was sold for diagnostic purposes, of which 46% was utilised by NHLS laboratories.
271 units of normal horse serum were sold.
SAVP animal unit
The animal unit continues to supply animals to various universities such as Wits, Sefako Makgatho, Johannesburg, Cape Town, Pretoria, North West, Nelson Mandela and Transkei. In addition, we are supplying to Retrasol, which is a private company that conducts TB research studies in Witbank.
We are also exporting animals twice monthly to Windhoek, Namibia.
The strike actions had a profound effect on the two animal units. SAVP requested from executive management that staff employed in this category be classified as “Essential services”.
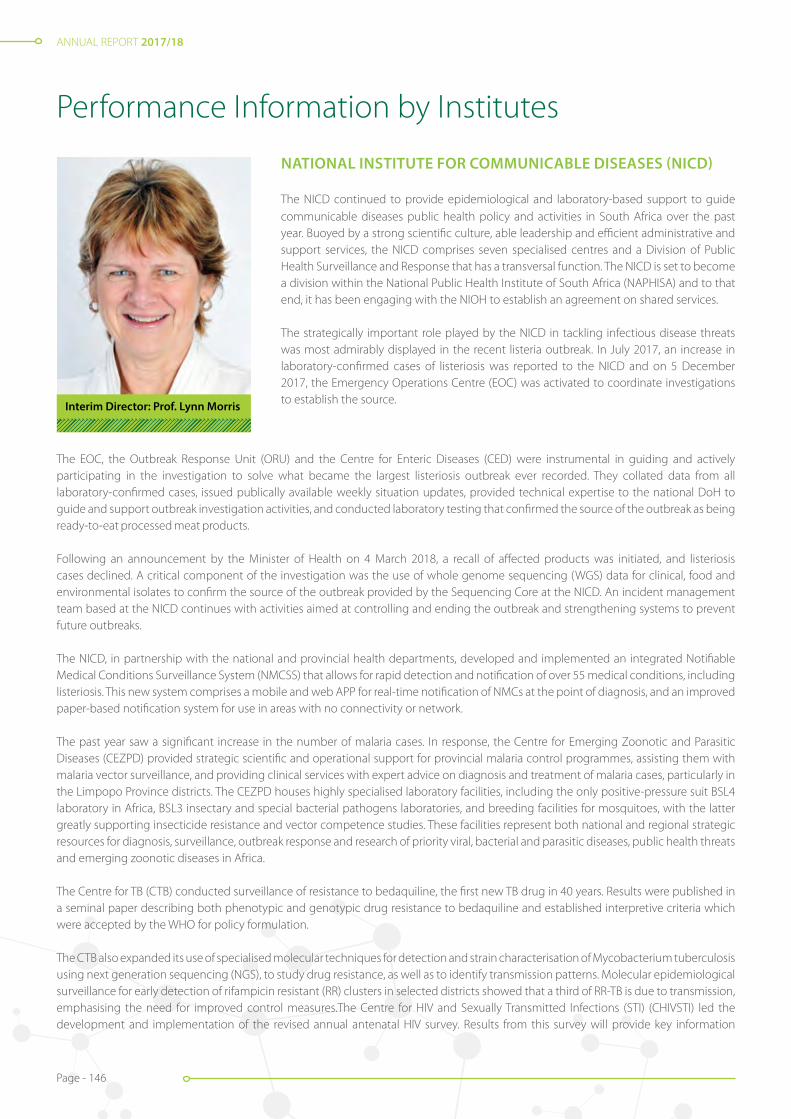
ANNUAL REPORT 2017/18
Page - 146
Performance Information by Institutes
Interim Director: Prof. Lynn Morris
NATIONAL INSTITUTE FOR COMMUNICABLE DISEASES (NICD)
The NICD continued to provide epidemiological and laboratory-based support to guide communicable diseases public health policy and activities in South Africa over the past year. Buoyed by a strong scientific culture, able leadership and efficient administrative and support services, the NICD comprises seven specialised centres and a Division of Public Health Surveillance and Response that has a transversal function. The NICD is set to become a division within the National Public Health Institute of South Africa (NAPHISA) and to that end, it has been engaging with the NIOH to establish an agreement on shared services.
The strategically important role played by the NICD in tackling infectious disease threats was most admirably displayed in the recent listeria outbreak. In July 2017, an increase in laboratory-confirmed cases of listeriosis was reported to the NICD and on 5 December 2017, the Emergency Operations Centre (EOC) was activated to coordinate investigations to establish the source.
The EOC, the Outbreak Response Unit (ORU) and the Centre for Enteric Diseases (CED) were instrumental in guiding and actively participating in the investigation to solve what became the largest listeriosis outbreak ever recorded. They collated data from all laboratory-confirmed cases, issued publically available weekly situation updates, provided technical expertise to the national DoH to guide and support outbreak investigation activities, and conducted laboratory testing that confirmed the source of the outbreak as being ready-to-eat processed meat products.
Following an announcement by the Minister of Health on 4 March 2018, a recall of affected products was initiated, and listeriosis cases declined. A critical component of the investigation was the use of whole genome sequencing (WGS) data for clinical, food and environmental isolates to confirm the source of the outbreak provided by the Sequencing Core at the NICD. An incident management team based at the NICD continues with activities aimed at controlling and ending the outbreak and strengthening systems to prevent future outbreaks.
The NICD, in partnership with the national and provincial health departments, developed and implemented an integrated Notifiable Medical Conditions Surveillance System (NMCSS) that allows for rapid detection and notification of over 55 medical conditions, including listeriosis. This new system comprises a mobile and web APP for real-time notification of NMCs at the point of diagnosis, and an improved paper-based notification system for use in areas with no connectivity or network.
The past year saw a significant increase in the number of malaria cases. In response, the Centre for Emerging Zoonotic and Parasitic Diseases (CEZPD) provided strategic scientific and operational support for provincial malaria control programmes, assisting them with malaria vector surveillance, and providing clinical services with expert advice on diagnosis and treatment of malaria cases, particularly in the Limpopo Province districts. The CEZPD houses highly specialised laboratory facilities, including the only positive-pressure suit BSL4 laboratory in Africa, BSL3 insectary and special bacterial pathogens laboratories, and breeding facilities for mosquitoes, with the latter greatly supporting insecticide resistance and vector competence studies. These facilities represent both national and regional strategic resources for diagnosis, surveillance, outbreak response and research of priority viral, bacterial and parasitic diseases, public health threats and emerging zoonotic diseases in Africa.
The Centre for TB (CTB) conducted surveillance of resistance to bedaquiline, the first new TB drug in 40 years. Results were published in a seminal paper describing both phenotypic and genotypic drug resistance to bedaquiline and established interpretive criteria which were accepted by the WHO for policy formulation.
The CTB also expanded its use of specialised molecular techniques for detection and strain characterisation of Mycobacterium tuberculosis using next generation sequencing (NGS), to study drug resistance, as well as to identify transmission patterns. Molecular epidemiological surveillance for early detection of rifampicin resistant (RR) clusters in selected districts showed that a third of RR-TB is due to transmission, emphasising the need for improved control measures.The Centre for HIV and Sexually Transmitted Infections (STI) (CHIVSTI) led the development and implementation of the revised annual antenatal HIV survey. Results from this survey will provide key information

ANNUAL REPORT 2017/18
Page - 147
including the 90-90-90 coverage as well as HIV prevalence and incidence rates among pregnant women. National EID, including results for action reporting with a self-service portal and birth testing dashboard, and infant HIV diagnostic support were supported.
STI data from the national aetiological survey and GERMS-SA were used to revise national syndromic management guidelines for PHCs. Research towards the development of an HIV vaccine remains a major priority within the centre with members of the team conducting validated end-point antibody and molecular diagnostic assays for HIV vaccine trials. The report of a South African child who has achieved sustained virological control for almost nine years in the absence of Antiretroviral Therapy (ART), provided important insights into the possibility of a functional cure or remission from HIV infection.
The Centre for Healthcare-Associated Infections and Antimicrobial Resistance (CHARM), incorporates national reference laboratories for antimicrobial resistance and mycoses and houses the National Biological Sample Collection of pathogenic bacteria and fungi. In June 2017, the Centre was designated a WHO Collaborating Centre for AMR and is now the national focal point for the WHO’s Global Antimicrobial Resistance Surveillance System (GLASS). The Centre contributed to WHO guidelines for advanced HIV disease and cryptococcal meningitis, as well as national guidelines for hospital-acquired infections and Candida auris disease.
Ongoing syndromic surveillance for pneumonia and influenza-like illness (ILI) was conducted by the Centre for Respiratory Diseases and Meningitis (CRDM) at sentinel sites within South Africa. The Centre also implemented active surveillance for possible human cases of avian influenza A(H5N8), following widespread outbreaks in poultry in several areas of South Africa. Influenza virus isolates and/or original clinical specimens were shared with WHO collaborating centres for the important task of selecting annual vaccine strains. Laboratory-based national surveillance for causes of invasive bacterial disease and meningitis continued through the GERMS-SA platform.
In January 2018, the Centre for Vaccine and Immunology (CVI) identified a case of vaccine-derived polio virus (VDPV) serotype three in a South African child. Further investigation confirmed that the event was not due to circulating polio virus, but due to inherited primary immune deficiency in the affected infant. The detection of this case signifies a success for the acute flaccid paralysis (AFP) surveillance programme, which is an essential part of the global polio eradication initiative. CVI also investigated measles outbreaks in three provinces in primarily vaccine-hesitant communities. South Africa is in the pre-elimination phase of measles and supports the WHO AFRO elimination target of 2020.
The national pathology-based cancer incidence for 2013 and 2014 was published by the National Cancer Registry, reducing the reporting backlog. Data showed that cancer patterns have remained stable over the two years with breast, cervix, colorectal and lung cancers being the most commonly diagnosed malignancies in the country.
The NICD continues to train and build capacity for epidemiologists, scientists, technologists and pathologists within South Africa and on the continent. The NICD maintained its membership as part of the International Network of Public Health Institutes and actively participated in endorsing the Africa CDC strategy and implementation plan with technical support of the Regional Collaborating Centre in Zambia.
The NICD houses a number of WHO reference laboratories and maintained SANAS accreditation of all its laboratories. Several infrastructure projects were completed in the last year, including the refurbishing and relocating of laboratories and offices. There was also substantial upgrades of the information technology systems and software with improvements in bandwidth, which greatly enhanced efficiency.
The past year saw the departure of Professor Shabir Madhi from the Institute. We thank him for his contribution to establishing a foundational strategy for the NICD. I would personally also like to thank all the staff at the NICD for their commitment, hard work and creativity in combatting communicable diseases. It has been a year of change, but also one that presents great potential as we move towards the establishment of NAPHISA.
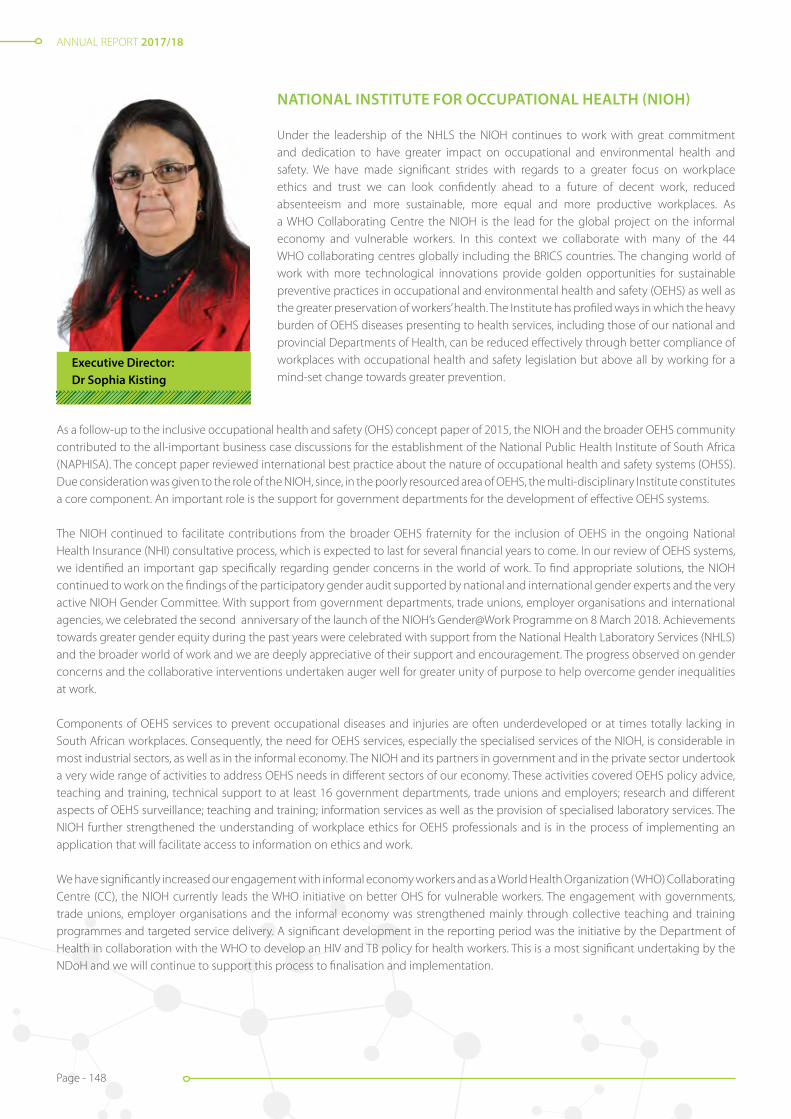
ANNUAL REPORT 2017/18
Page - 148
NATIONAL INSTITUTE FOR OCCUPATIONAL HEALTH (NIOH)
Under the leadership of the NHLS the NIOH continues to work with great commitment and dedication to have greater impact on occupational and environmental health and safety. We have made significant strides with regards to a greater focus on workplace ethics and trust we can look confidently ahead to a future of decent work, reduced absenteeism and more sustainable, more equal and more productive workplaces. As a WHO Collaborating Centre the NIOH is the lead for the global project on the informal economy and vulnerable workers. In this context we collaborate with many of the 44 WHO collaborating centres globally including the BRICS countries. The changing world of work with more technological innovations provide golden opportunities for sustainable preventive practices in occupational and environmental health and safety (OEHS) as well as the greater preservation of workers’ health. The Institute has profiled ways in which the heavy burden of OEHS diseases presenting to health services, including those of our national and provincial Departments of Health, can be reduced effectively through better compliance of workplaces with occupational health and safety legislation but above all by working for a mind-set change towards greater prevention.
Executive Director: Dr Sophia Kisting
As a follow-up to the inclusive occupational health and safety (OHS) concept paper of 2015, the NIOH and the broader OEHS community contributed to the all-important business case discussions for the establishment of the National Public Health Institute of South Africa (NAPHISA). The concept paper reviewed international best practice about the nature of occupational health and safety systems (OHSS). Due consideration was given to the role of the NIOH, since, in the poorly resourced area of OEHS, the multi-disciplinary Institute constitutes a core component. An important role is the support for government departments for the development of effective OEHS systems.
The NIOH continued to facilitate contributions from the broader OEHS fraternity for the inclusion of OEHS in the ongoing National Health Insurance (NHI) consultative process, which is expected to last for several financial years to come. In our review of OEHS systems, we identified an important gap specifically regarding gender concerns in the world of work. To find appropriate solutions, the NIOH continued to work on the findings of the participatory gender audit supported by national and international gender experts and the very active NIOH Gender Committee. With support from government departments, trade unions, employer organisations and international agencies, we celebrated the second anniversary of the launch of the NIOH’s Gender@Work Programme on 8 March 2018. Achievements towards greater gender equity during the past years were celebrated with support from the National Health Laboratory Services (NHLS) and the broader world of work and we are deeply appreciative of their support and encouragement. The progress observed on gender concerns and the collaborative interventions undertaken auger well for greater unity of purpose to help overcome gender inequalities at work.
Components of OEHS services to prevent occupational diseases and injuries are often underdeveloped or at times totally lacking in South African workplaces. Consequently, the need for OEHS services, especially the specialised services of the NIOH, is considerable in most industrial sectors, as well as in the informal economy. The NIOH and its partners in government and in the private sector undertook a very wide range of activities to address OEHS needs in different sectors of our economy. These activities covered OEHS policy advice, teaching and training, technical support to at least 16 government departments, trade unions and employers; research and different aspects of OEHS surveillance; teaching and training; information services as well as the provision of specialised laboratory services. The NIOH further strengthened the understanding of workplace ethics for OEHS professionals and is in the process of implementing an application that will facilitate access to information on ethics and work.
We have significantly increased our engagement with informal economy workers and as a World Health Organization (WHO) Collaborating Centre (CC), the NIOH currently leads the WHO initiative on better OHS for vulnerable workers. The engagement with governments, trade unions, employer organisations and the informal economy was strengthened mainly through collective teaching and training programmes and targeted service delivery. A significant development in the reporting period was the initiative by the Department of Health in collaboration with the WHO to develop an HIV and TB policy for health workers. This is a most significant undertaking by the NDoH and we will continue to support this process to finalisation and implementation.
ANNUAL REPORT 2017/18
Page - 149
The NIOH supports the Sustainable Development Goals (SDGs) adopted by the United Nations in September 2015. The SDGs include decent work, health, gender equity, youth employment, sustainable economies and sustainable environments. All of these are of great importance for healthier, productive, sustainable workplaces and the protection of the health of workers. The SDGs are intended to promote human rights, engender greater equity and peaceful and inclusive societies, create decent and sustainable jobs, and address the enormous environmental challenges of our time, including climate change. According to the WHO, environmental pollution (secondary to industrial and other workplace activities) contributes enormously to the burden of non-communicable diseases in many countries, including our own. This should further encourage all workplace stakeholders to greater compliance with OEHS legislation through effective and efficient preventive interventions at workplaces.
Research
The NIOH aims to continue to generate new knowledge through the rigour of good scientific research on key OEHS issues, especially those facing South Africa and the rest of the African continent. Collectively, the research projects of each division described in this Annual Report are testimony to the many OEHS issues requiring new knowledge, but also to the growing scope of the institute’s research efforts and the strategic and greater engagement of younger researchers. It is notable that the research focus of the NIOH has broadened to increasingly include aspects of environmental health, gender concerns and reproductive health, problems related to climate change, as well as important policy concerns. The scientific publications listed in the NIOH Annual Report demonstrate a focus on many of the priority OEHS issues facing our country. Among the topics covered were asbestos in schools and in homes; preventing tuberculosis in individuals with silicosis; tuberculosis prevention in healthcare workers; noise-induced hearing loss and hearing conservation; occupations and lung cancer; water quality in hospitals; health effects in populations living around gold mine tailings; pesticides; and nanoparticles and health.
Specialised and other services
The NIOH continues to provide discipline-specific information services to many industrial sectors and government departments. Its laboratory services include asbestos identification and counting; diagnostic lung pathology; analytical chemistry (e.g. for biological monitoring specimens); the identification of components of dusts (respirable crystalline silica in particular); microbial air sampling; allergy diagnostics; nanoparticles and in vitro risk assessments. Discipline-specific services include occupational medicine, occupational hygiene, occupational toxicology, immunology and microbiology, and occupational epidemiology. Information services are a core service of many national institutes of health around the world, due partly to scarcity of sources of information elsewhere, as is the case in South Africa. The extent and diversity of information services offered by the NIOH, many of them with limited availability elsewhere in the country, are obvious from this report. The unique national occupational health library continues to provide support and information well beyond the borders of South Africa.
The Biobank housed within the NIOH has grown significantly in the year under review, and is successfully housing thousands of specimens from different government departments. The HIV and TB Programme of the NIOH continues to make important contributions to both scientific research and service delivery, especially in the mining and health sectors, in close collaboration with the WHO and the International Labour Organization (ILO). The support for health workers has been most welcome as is the roll-out of training in different countries in Southern Africa on the WHO/ILO HealthWISE Programme. The Marketing and Communications Section has done particularly well in profiling the history of the Institute and in strengthening engagement with OEHS programmes nationally and internationally. The Finance and General Services Section has made us all proud by maintaining the historical nature of the old building and making it a special home to the NIOH. The strategic and careful upgrading of the building has continued, and it has become a pleasure to work in this nearly hundred year old building.
The Safety Health and Environment (SHE) and Information Technology (IT) Programmes made significant strides on the pioneering Occupational Health and Safety Information System (OHASIS). This user-friendly information system supports compliance with OEHS legislation, enables online training and provides information for research analysis. OHASIS is increasingly being rolled out to centres beyond the NHLS and NIOH as well as in neighbouring countries. This bodes extremely well for the much needed strengthening of OEHS information systems for research and evidence-informed workplace interventions. We are inspired by the roll-out in Namibia, the Gauteng Health Department and the current initiatives in Mpumalanga, the Western Cape Departments of Health and Lesotho Department of Health.
A special commendation must go to Mr Daniel Afrika in the Pathology Department who has in addition to all his tasks worked ceaselessly to improve health and safety training within the institute.
ANNUAL REPORT 2017/18
Page - 150
Looking to 2018 and beyond, the NIOH will continue to help reduce the decent work deficit in our country, support ongoing efforts to reduce workplace inequality and strengthen the protection of human rights. Given our heavy burden of disease, it is incumbent upon the Institute to help nurture a culture of greater prevention of OEHS diseases and injuries. Health challenges, such as hypertension, diabetes, TB and stress, which are very often exacerbated by poor conditions of work, will also be addressed. Important areas that will require more attention relate to OEHS gender concerns, and OEHS for migrant workers, subcontracted workers, young workers and workers with disabilities. We have constituted a Green Committee and look to greater emphasis on greener workplaces and green jobs. NIOH staff members and the City of Johannesburg made concerted efforts on a voluntary basis throughout the year to provide workers in the fields of security, cleaning and gardening services with training in skills ranging from fire-fighting and first aid competency, to basic computer training. However, more strategic efforts are needed to reach more workers in precarious work.
The greatly talented NIOH Choir has gone from strength to strength over the last year and has provided the most beautiful renditions of national, regional and international songs at our major public events. We are proud of the contribution of each and every member of the choir and trust that they will continue to grow and include more and more OEHS songs from across the globe in their repertoire.
Acknowledgments and appreciation
We wish to acknowledge the significant contribution of so many to the ongoing success of the OEHS interventions of the NIOH. We wish to acknowledge the significant and strategic support from the NHLS and from our government departments, in particular the departments of Health, Labour, Mineral Resources, Science and Technology, Environmental Affairs, Defence, Agriculture and Correctional Services. We wish to acknowledge all the employer organisations and the growing number of trade unions, which continue to challenge us for an on-going positive impact on workplaces and better worker health. The NIOH is the richer for these interventions.
Our appreciation goes to the many professional OEHS organisations including the South African Society of Occupational Medicine (SASOM), South African Society of Occupational Health Nursing Practitioners (SASOHN) and Southern African Institute for Occupational Hygiene (SAIOH), as well as international organisations, including the WHO, ILO, UN Women, FIOH, NIOSH, ICOH and OECD, for their collegial support and great collaboration. We are particularly appreciative of the collaborative support from our sister OEHS institutes in Africa and across the globe.
We owe a particular gratitude to current and former staff of the NIOH, both academic and non-academic, for making and maintaining the Institute as an internationally recognised, accessible centre of excellence in OEHS research, teaching and training, and service delivery.
Conclusion We invite the actors of the world of work and the broader South African public to join us on our journey of building on our collective strength to utilise the potential of all workplaces for better OEHS, for decent jobs and happier workplaces, and for the protection of human rights, greater productivity, greater equity and ultimately for sustainable economies.

ANNUAL REPORT 2017/18
Page - 151
Governance
PART C

ANNUAL REPORT 2017/18
Page - 152
GovernanceReport of the Accounting Authority
The Accounting Authority submits their report for the financial year that ended 31 March 2018.
Statement of commitment
The Accounting Authority is committed to business integrity, transparency and professionalism in all its activities. As part of this commitment, the Accounting Authority supports the highest standards of corporate governance and the ongoing development of best practice.
The mandate of the Board
The mandate of the NHLS Board is set out in the NHLS Act and is encapsulated in the NHLS Board Charter. The mandate of the Board as set out in the Board Charter is aligned to the requirements stipulated by the Protocol on Governance in Public Entities.
Independence of the Board
Board members are appointed by the Minister of Health. The Board considers submissions and recommendations made by management and makes independent decisions based on their fiduciary responsibilities and the strategic direction of the NHLS.
The various Board committees meet independently and then report back to the Board. Each committee has a formal charter that clearly defines its roles and responsibilities.
The Audit and Risk Committee regularly meets individually with the external and internal auditors as may be necessary. The Board, its committees and individual Board members may furthermore engage independent counsel and advisors upon request, and at the discretion of the Board.
Board composition
The Accounting Authority is a Unitary Board comprising of a majority of non-executive members. The members of the Board are appointed by the Minister in accordance with Section 7 of the NHLS Act.
in accordance with the NHLS Act No. 37 of 2000, the Board should comprise of twenty-two (22) members, including the Chief Executive Officer (CEO), Chairperson and Vice-Chairperson of the Board. In terms of Section 9 of the NHLS Act, the Minister of Health has accordingly appointed a Chairperson and a Vice-Chairperson.
The members of the entity during the year and to the date of this report are as follows:
Board composition
Name Representing Directorship Appointed RetiredChairmanship/ position in company
Prof Eric Buch (Chairperson) Minister of Health
Non-executive Board Member and Chairperson of the Board
30 April 2015 Board and Governance, Social and Ethics Committee
Mr. Ben Durham Department of Science and Technology
Non-executive Board Member
01 November 2014 (re-appointed 1 February 2018)
31 October 2017
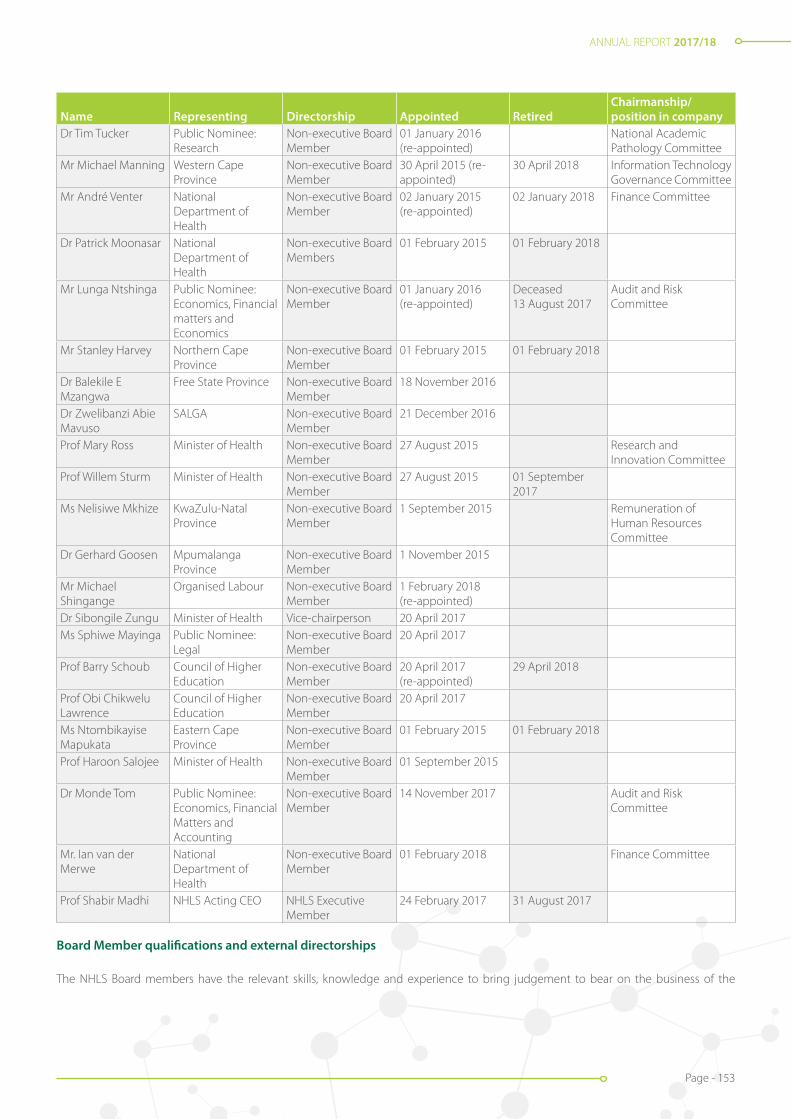
ANNUAL REPORT 2017/18
Page - 153
Name Representing Directorship Appointed RetiredChairmanship/ position in company
Dr Tim Tucker Public Nominee: Research
Non-executive Board Member
01 January 2016 (re-appointed)
National Academic Pathology Committee
Mr Michael Manning Western Cape Province
Non-executive Board Member
30 April 2015 (re-appointed)
30 April 2018 Information Technology Governance Committee
Mr André Venter National Department of Health
Non-executive Board Member
02 January 2015 (re-appointed)
02 January 2018 Finance Committee
Dr Patrick Moonasar National Department of Health
Non-executive Board Members
01 February 2015 01 February 2018
Mr Lunga Ntshinga Public Nominee: Economics, Financial matters and Economics
Non-executive Board Member
01 January 2016 (re-appointed)
Deceased 13 August 2017
Audit and Risk Committee
Mr Stanley Harvey Northern Cape Province
Non-executive Board Member
01 February 2015 01 February 2018
Dr Balekile E Mzangwa
Free State Province Non-executive Board Member
18 November 2016
Dr Zwelibanzi Abie Mavuso
SALGA Non-executive Board Member
21 December 2016
Prof Mary Ross Minister of Health Non-executive Board Member
27 August 2015 Research and Innovation Committee
Prof Willem Sturm Minister of Health Non-executive Board Member
27 August 2015 01 September 2017
Ms Nelisiwe Mkhize KwaZulu-Natal Province
Non-executive Board Member
1 September 2015 Remuneration of Human Resources Committee
Dr Gerhard Goosen Mpumalanga Province
Non-executive Board Member
1 November 2015
Mr Michael Shingange
Organised Labour Non-executive Board Member
1 February 2018 (re-appointed)
Dr Sibongile Zungu Minister of Health Vice-chairperson 20 April 2017Ms Sphiwe Mayinga Public Nominee:
LegalNon-executive Board Member
20 April 2017
Prof Barry Schoub Council of Higher Education
Non-executive Board Member
20 April 2017 (re-appointed)
29 April 2018
Prof Obi Chikwelu Lawrence
Council of Higher Education
Non-executive Board Member
20 April 2017
Ms Ntombikayise Mapukata
Eastern Cape Province
Non-executive Board Member
01 February 2015 01 February 2018
Prof Haroon Salojee Minister of Health Non-executive Board Member
01 September 2015
Dr Monde Tom Public Nominee: Economics, Financial Matters and Accounting
Non-executive Board Member
14 November 2017 Audit and Risk Committee
Mr. Ian van der Merwe
National Department of Health
Non-executive Board Member
01 February 2018 Finance Committee
Prof Shabir Madhi NHLS Acting CEO NHLS Executive Member
24 February 2017 31 August 2017
Board Member qualifications and external directorships
The NHLS Board members have the relevant skills, knowledge and experience to bring judgement to bear on the business of the
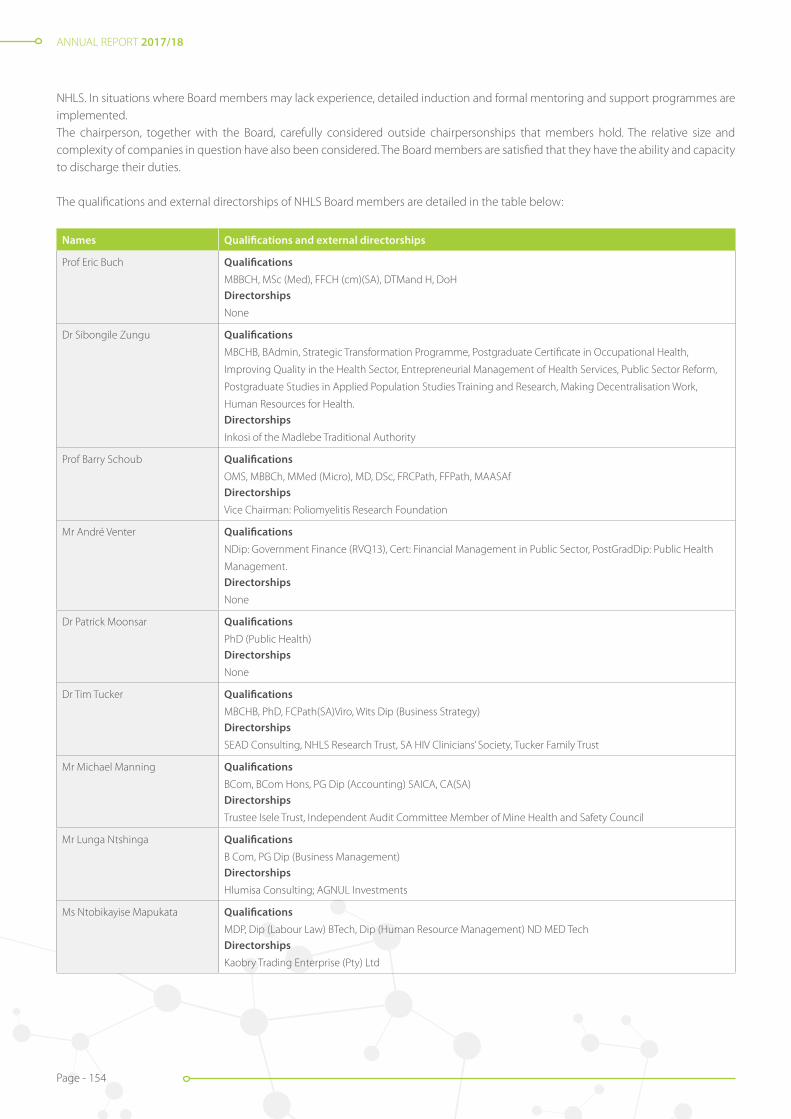
ANNUAL REPORT 2017/18
Page - 154
NHLS. In situations where Board members may lack experience, detailed induction and formal mentoring and support programmes are implemented.The chairperson, together with the Board, carefully considered outside chairpersonships that members hold. The relative size and complexity of companies in question have also been considered. The Board members are satisfied that they have the ability and capacity to discharge their duties.
The qualifications and external directorships of NHLS Board members are detailed in the table below:
Names Qualifications and external directorships
Prof Eric Buch Qualifications
MBBCH, MSc (Med), FFCH (cm)(SA), DTMand H, DoHDirectorships
None
Dr Sibongile Zungu Qualifications
MBCHB, BAdmin, Strategic Transformation Programme, Postgraduate Certificate in Occupational Health,
Improving Quality in the Health Sector, Entrepreneurial Management of Health Services, Public Sector Reform,
Postgraduate Studies in Applied Population Studies Training and Research, Making Decentralisation Work,
Human Resources for Health.Directorships
Inkosi of the Madlebe Traditional Authority
Prof Barry Schoub Qualifications
OMS, MBBCh, MMed (Micro), MD, DSc, FRCPath, FFPath, MAASAfDirectorships
Vice Chairman: Poliomyelitis Research Foundation
Mr André Venter Qualifications
NDip: Government Finance (RVQ13), Cert: Financial Management in Public Sector, PostGradDip: Public Health
Management.Directorships
None
Dr Patrick Moonsar Qualifications
PhD (Public Health)Directorships
None
Dr Tim Tucker Qualifications
MBCHB, PhD, FCPath(SA)Viro, Wits Dip (Business Strategy) Directorships
SEAD Consulting, NHLS Research Trust, SA HIV Clinicians’ Society, Tucker Family Trust
Mr Michael Manning Qualifications
BCom, BCom Hons, PG Dip (Accounting) SAICA, CA(SA)Directorships
Trustee Isele Trust, Independent Audit Committee Member of Mine Health and Safety Council
Mr Lunga Ntshinga Qualifications
B Com, PG Dip (Business Management)Directorships
Hlumisa Consulting; AGNUL Investments
Ms Ntobikayise Mapukata Qualifications
MDP, Dip (Labour Law) BTech, Dip (Human Resource Management) ND MED TechDirectorships
Kaobry Trading Enterprise (Pty) Ltd

ANNUAL REPORT 2017/18
Page - 155
Names Qualifications and external directorships
Prof Mary Ross Qualifications
BSc (Hons), MBCHB, Dip (Data metrics), Dip (Health Admin, DTM and H, DPH, DoH, FCPHM, FOM (UK), FPH(UK),
FFTM (RCP and S GLASGOW), FACTM(Australia)Directorships
None
Prof Willem Sturm Qualifications
MD, PhDDirectorships
None
Mr Stanley Harvey Qualifications
ND Med TechDirectorships
None
Mr Ben Durham Qualifications
MSc, BSc Hons, BSc, currently pursing PhD in Technology and Innovation ManagementDirectorships
None
Mr Michael Shingange Qualifications
Cert Negotiating Skills, Dip Trade Union Movement, Cert GovernanceDirectorships
1st Deputy President NEHAWU
Ms Nelisiwe Mkhize Qualifications
MBA, PG Dip (Business Mngt), Bsc; ND Med TechDirectorships
None
Prof Haroon Saloojee Qualifications
MBBCH, FCPaed (SA), MSc
Directorships
Soul City Institute; Starfish Greathearts
Dr Gerhardus Goosen Qualifications
MBCHB, Dip Obst (SA)Directorships
ALENTI 25 (Not for Profit)
Dr Zwelibanzi Abie Mavuso Qualifications
Dental Therapy, MBBCH, MBADirectorships
None
Dr Balekile E Mzangwa Qualifications
MBCHB, PG Dip (Health Management)Directorships
African Warriors FC (Pty) Ltd
Dr Monde Tom Qualifications
PhD, MSc: Financial Economics, Post Grad Dip: Economic Principles, BSc: Applied Maths, Nat Dip: Cost
Management.Directorships
IkweziLomso Investments, Vice-president: Alexander Country Club

ANNUAL REPORT 2017/18
Page - 156
Names Qualifications and external directorships
Mr. Ian van der Merwe Qualifications
BCom, BCom (Hons), MBADirectorships
None
Prof Shabir Madhi Qualifications
MBBCh (Wits), FCPaeds (SA), MMed (Wits), PhD (Wits)Directorships
None
Ms Sphiwe Mayinga Qualifications
BProc, LLB, LLM, MAP, SLDP, Advanced Banking Law, Corporate Governance, Compliance ManagementDirectorships
Tiyisela Construction, UNISA SBL (Member of Risk and Audit Committee and Chairperson of Remuneration and
Human Resources Committee), Member of Ekurhuleni Municipality Risk Committee of Council
Prof Obi Chikwelu Lawrence Qualifications
Bsc (Hons), MSc, PhDDirectorships
None
Dr Kamy Chetty Qualifications
MB.ChB, MSc URP, FFCH, MScDirectorships
None
Ms Joyce Mogale Qualifications
MBA, PG Dip (Public Health Management) BSc (Hons), ND Med Tech, HND Med TechDirectorships
Klein Karoo Akademie, Ububele Capital, Ruby Stone Boutique Hotel, Marubini Holding, Metso Mining and
Construction (SA), Ninator Thyssen Krupp Industrial Solutions (SA), Cynimart Investments, JL Properties, Limpopo
Gambling Board,Tirisano Trust, Ububele Trust, Umvuso Trust, Kamatsu Trust, TETMC Trust, Westvaal Trust.
Changes in Board membership
Upon the expiration of a committee member’s term of office as a member of the Accounting Authority, the member may be eligible for re-appointment for a further term of office provided that no committee member may be appointed for more than two consecutive terms to serve in the same committee. The table below indicates the changes to Board membership that took place during the financial year under review:
Name Constituency/ representing Date of appointment/ * reappointment
Date of resignation/ * retirement
Prof Barry Schoub Minister of Health 1 May 2015 Re-appointed 20 April 2017
29 April 2018
Mr. Michael Manning Western Cape Province 30 April 2015 30 April 2018
Ms. Ntombikayise Mapukata Eastern Cape Province 1 February 2015 1 February 2018
Mr. Stanley Harvey Northern Cape Province 1 February 2015 1 February 2018
Prof Willem Sturm KwaZulu-Natal Province 27 August 2015 1 September 2017
Mr. Lunga Ntshinga Public Nominee: Economics, Financial Matters and Accounting
01 January 2016 Deceased 13 August 2017
Mr. André Venter National Department of Health 02 January 2015 02 January 2018
Mr. Ben Durham National Department of Science and Technology
01 November 2014 Re-appointed 01 February 2018
01 November 2017
Mr. Michael Shingange Organised Labour 01 February 2015 Re-appointed 01 February 2018
01 February 2018
Prof Shabir Madhi Acting CEO - NHLS 24 February 2017 31 August 2017

ANNUAL REPORT 2017/18
Page - 157
Committees of the Board
The Board as the Accounting Authority takes full ownership of the overall decision making across the entity to ensure it retains proper direction and control of the NHLS. The Board has delegated certain powers to the CEO and to management, but has reserved certain powers exclusively for the Board and these are set out in the Board Charter.
The Board also appointed several committees to help meet these responsibilities. Delegating various functions and authorities to committees and management however does not absolve the Board and its directors of their duties and responsibilities.
The Board delegated certain functions without abdicating its own responsibilities to the following committees:
• Audit and Risk Committee (ARC);
• Remuneration and Human Resources Committee (RHRC);
• Information Technology Governance Committee (ITGC);
• Governance, Social and Ethics Committee; (GSEC);
• Finance Committee (FinCom);
• National Academic and Pathology Committee (NAPC);
• Research and Innovation Committee (RIC); and
• Executive Management Committee (EXCO).
The various Committees of the Board each have formal terms of reference (ToR) embodied in a charter which further defines the mandates, roles and responsibilities of each Committee. The charters are reviewed and updated on an annual basis, as and when required.
The NHLS Board is governed by the NHLS Act 2000 (Act No 37 of 2000) and the NHLS Rules made in terms of the Act supra. The Board complies with the PFMA. In addition, the NHLS Board subscribes to the terms of King III.
In the period under review, the Board complied with its ToR as detailed in the NHLS Rules. In addition, the Board provided strategic direction to the organisation as required by King III.
Minutes of meetings were recorded and entered in the minute book as a true and accurate representation of what transpired at the meetings.
The majority of the members of the Board attended the meetings for the year. Board resolutions were captured in the board resolution file.
Board meeting attendance
During the past 12 months, the Board convened seventeen (17) times (including special meetings). The NHLS Board is required to hold at least four (4) meetings per year. Only members of the Board voted at its meetings and all its decisions were arrived at by consensus. In each of those meetings, the quorum of the meeting was met. In each meeting, members were given the opportunity to declare any personal conflict of interest to be recused from the deliberation of the matter in which a member was involved.
The table below and accompanying legend illustrates meeting attendance of Board members for the financial year.

ANNUAL REPORT 2017/18
Page - 158
BOA
RD A
ND
CO
MM
ITTE
ES’ M
EETI
NG
ATT
END
AN
CE F
ROM
1 A
PRIL
201
7 –
31 M
ARC
H 2
018
Att
enda
nce
at th
e N
HLS
Boa
rd m
eetin
gs fo
r the
yea
r 1 A
pril
2017
to 3
1 M
arch
201
8Me
eting
Date
s
Name
s24
-May
20
1725
May
20
17
19 Ju
ly 20
17
Spec
ial
24 Ju
ly 20
17
Spec
ial26
July
2017
2 7 Ju
ly 20
1722
Aug
2017
23 Au
g 20
1717
Oct
2017
18 O
ct 20
17
06 N
ov
2017
Sp
ecial
29 N
ov
2017
3 0 N
ov
2017
16 Ja
n 20
18
S trate
gy
and R
isk
Work
shop
17 Ja
n 20
18
Strate
gy
and R
isk
Work
shop
27 Fe
b 20
182 8
Feb
2018
Total
Prof E
ric Bu
ch (C
hairp
erso
n of
the B
oard
)
17
Dr Si
bong
ile Zu
ngu
(Vice
-chair
perso
n)
A
A
A
A
AA
AA
AA
7
Prof S
habir
Mad
hi (A
cting
CEO)
A
AA
n/m
n/m
n/m
n/m
n/m
n/m
n/m
n/m
n/m
5
Dr Ka
my Ch
etty (
Actin
g CEO
)n/
mn/
mn/
mn/
mn/
mn/
mn/
m
10
Dr G
erhard
Goo
sen
A A
15
Dr Ti
m Tu
cker
AA
A
A
13
Dr Pa
tric M
oons
ar
A
A
A
AA
AA
AA
n/m
n/m
n/m
n/m
4
Dr Zw
eliba
nzi M
avus
o
AA
AA
A
A
AA
A
8
Dr Ba
lekile
Mza
ngwa
A
A
A
AA
A
AA
A
8
Mr An
dré V
enter
A
n/
mn/
mn/
mn/
m12
Mr M
ichae
l Man
ning
A
16
Mr Lu
nga N
thsin
ga
AA
n/
mn/
mn/
mn/
mn/
mn/
mn/
mn/
mn/
mn/
mn/
m4
Mr M
ichae
l Shin
gang
e
A
A
A
A
A
12
Mr St
anley
Harv
ey
n/
mn/
m15
Mr Be
n Dur
ham
A
A
AA
A
A
A
A
9
Ms N
elisiw
e Mkh
ize
A
16
Ms N
tom
bikay
ise M
apuk
ata
AA
n/m
n/m
13
Ms Sp
hiwe M
aying
a
A
AA
A
A
12
Prof M
ary Ro
ss
A
A
15
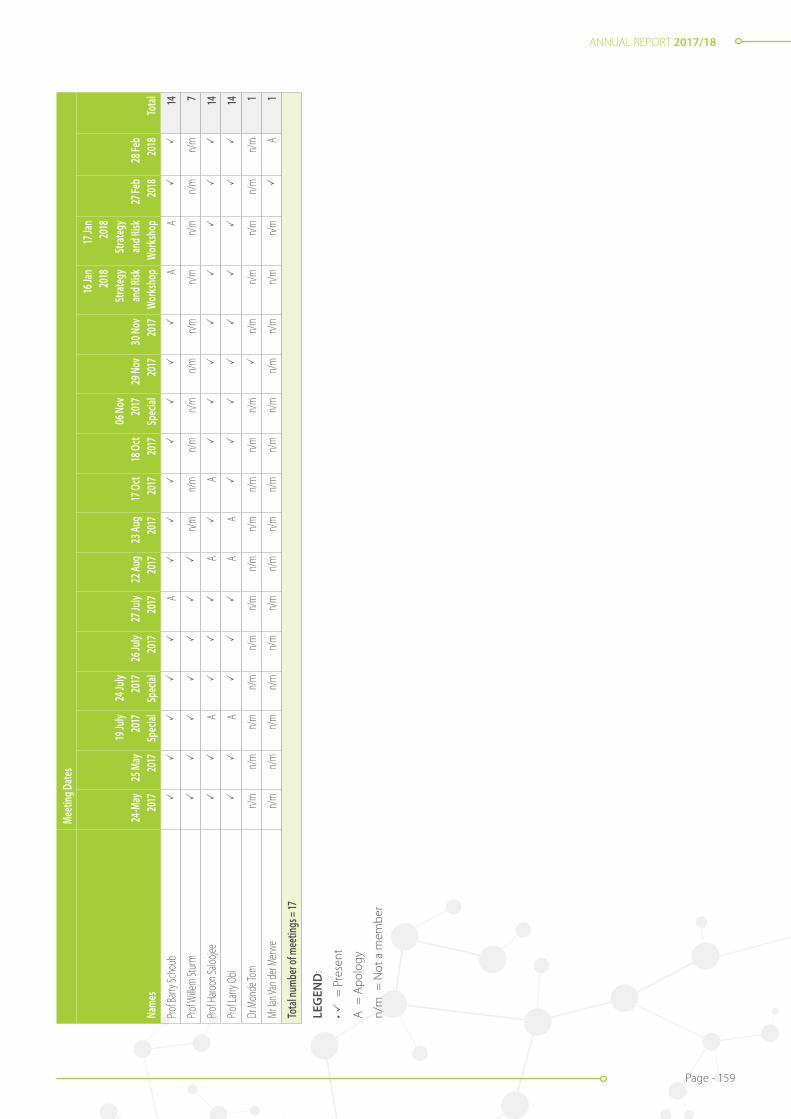
ANNUAL REPORT 2017/18
Page - 159
Meet
ing D
ates
Name
s24
-May
20
1725
May
20
17
19 Ju
ly 20
17
Spec
ial
24 Ju
ly 20
17
Spec
ial26
July
2017
2 7 Ju
ly 20
1722
Aug
2017
23 Au
g 20
1717
Oct
2017
18 O
ct 20
17
06 N
ov
2017
Sp
ecial
29 N
ov
2017
3 0 N
ov
2017
16 Ja
n 20
18
S trate
gy
and R
isk
Work
shop
17 Ja
n 20
18
S trate
gy
and R
isk
Work
shop
27 Fe
b 20
182 8
Feb
2018
Total
Prof B
arry S
chou
b
A
AA
14
Prof W
illem
Stur
m
n/m
n/m
n/m
n/m
n/m
n/m
n/m
n/m
n/m
n/m
7
Prof H
aroon
Saloo
jee
A
A
A
14
Prof L
arry O
bi
A
A
A
14
Dr M
onde
Tom
n/m
n/m
n/m
n/m
n/m
n/m
n/m
n/m
n/m
n/m
n/m
n/
mn/
mn/
mn/
mn/
m1
Mr Ia
n Van
der M
erwe
n/m
n/m
n/m
n/m
n/m
n/m
n/m
n/m
n/m
n/m
n/m
n/m
n/m
n/m
n/m
A
1
Total
numb
er of
mee
tings
= 17
LEG
END
:
• =
Pre
sent
A =
Apo
logy
n/m
= N
ot a
mem
ber
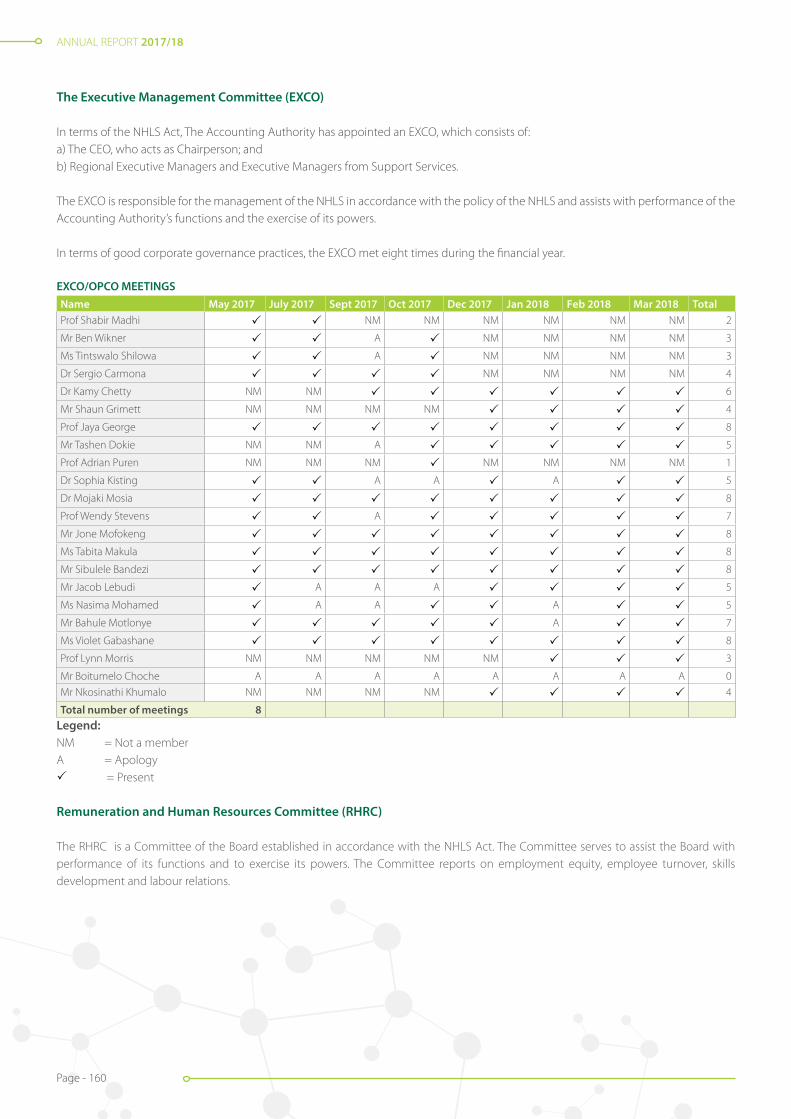
ANNUAL REPORT 2017/18
Page - 160
The Executive Management Committee (EXCO)
In terms of the NHLS Act, The Accounting Authority has appointed an EXCO, which consists of: a) The CEO, who acts as Chairperson; andb) Regional Executive Managers and Executive Managers from Support Services.
The EXCO is responsible for the management of the NHLS in accordance with the policy of the NHLS and assists with performance of the Accounting Authority’s functions and the exercise of its powers.
In terms of good corporate governance practices, the EXCO met eight times during the financial year.
EXCO/OPCO MEETINGS Name May 2017 July 2017 Sept 2017 Oct 2017 Dec 2017 Jan 2018 Feb 2018 Mar 2018 TotalProf Shabir Madhi NM NM NM NM NM NM 2
Mr Ben Wikner A NM NM NM NM 3
Ms Tintswalo Shilowa A NM NM NM NM 3
Dr Sergio Carmona NM NM NM NM 4
Dr Kamy Chetty NM NM 6
Mr Shaun Grimett NM NM NM NM 4
Prof Jaya George 8
Mr Tashen Dokie NM NM A 5
Prof Adrian Puren NM NM NM NM NM NM NM 1
Dr Sophia Kisting A A A 5
Dr Mojaki Mosia 8
Prof Wendy Stevens A 7
Mr Jone Mofokeng 8
Ms Tabita Makula 8
Mr Sibulele Bandezi 8
Mr Jacob Lebudi A A A 5
Ms Nasima Mohamed A A A 5
Mr Bahule Motlonye A 7
Ms Violet Gabashane 8
Prof Lynn Morris NM NM NM NM NM 3
Mr Boitumelo Choche A A A A A A A A 0
Mr Nkosinathi Khumalo NM NM NM NM 4
Total number of meetings 8Legend:NM = Not a memberA = Apology = Present Remuneration and Human Resources Committee (RHRC)
The RHRC is a Committee of the Board established in accordance with the NHLS Act. The Committee serves to assist the Board with performance of its functions and to exercise its powers. The Committee reports on employment equity, employee turnover, skills development and labour relations.
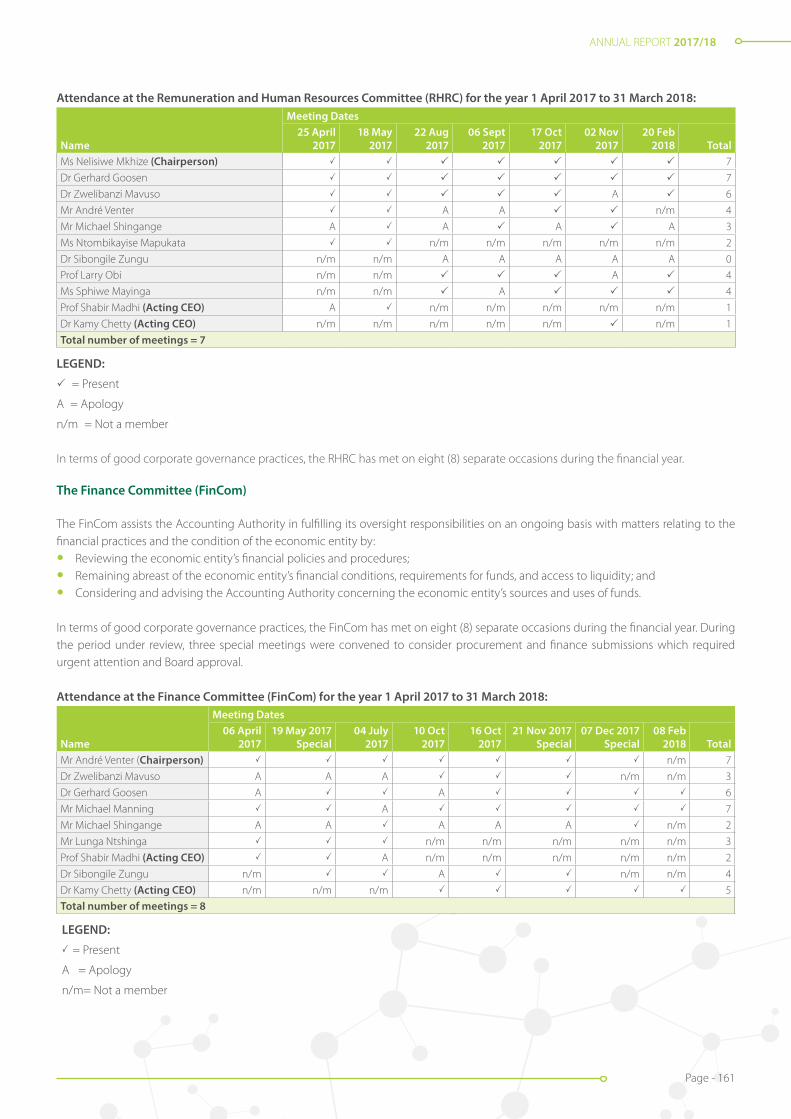
ANNUAL REPORT 2017/18
Page - 161
Attendance at the Remuneration and Human Resources Committee (RHRC) for the year 1 April 2017 to 31 March 2018:Meeting Dates
Name25 April
2017 18 May
2017 22 Aug
2017 06 Sept
2017 17 Oct
2017 02 Nov
2017 20 Feb
2018 Total Ms Nelisiwe Mkhize (Chairperson) 7
Dr Gerhard Goosen 7
Dr Zwelibanzi Mavuso A 6
Mr André Venter A A n/m 4
Mr Michael Shingange A A A A 3
Ms Ntombikayise Mapukata n/m n/m n/m n/m n/m 2
Dr Sibongile Zungu n/m n/m A A A A A 0
Prof Larry Obi n/m n/m A 4
Ms Sphiwe Mayinga n/m n/m A 4
Prof Shabir Madhi (Acting CEO) A n/m n/m n/m n/m n/m 1
Dr Kamy Chetty (Acting CEO) n/m n/m n/m n/m n/m n/m 1
Total number of meetings = 7
LEGEND:
= Present
A = Apology
n/m = Not a member
In terms of good corporate governance practices, the RHRC has met on eight (8) separate occasions during the financial year.
The Finance Committee (FinCom)
The FinCom assists the Accounting Authority in fulfilling its oversight responsibilities on an ongoing basis with matters relating to the financial practices and the condition of the economic entity by:
• Reviewing the economic entity’s financial policies and procedures;
• Remaining abreast of the economic entity’s financial conditions, requirements for funds, and access to liquidity; and
• Considering and advising the Accounting Authority concerning the economic entity’s sources and uses of funds.
In terms of good corporate governance practices, the FinCom has met on eight (8) separate occasions during the financial year. During the period under review, three special meetings were convened to consider procurement and finance submissions which required urgent attention and Board approval.
Attendance at the Finance Committee (FinCom) for the year 1 April 2017 to 31 March 2018:Meeting Dates
Name06 April
2017 19 May 2017
Special04 July
201710 Oct
201716 Oct
201721 Nov 2017
Special 07 Dec 2017
Special08 Feb
2018 TotalMr André Venter (Chairperson) n/m 7
Dr Zwelibanzi Mavuso A A A n/m n/m 3
Dr Gerhard Goosen A A 6
Mr Michael Manning A 7
Mr Michael Shingange A A A A A n/m 2
Mr Lunga Ntshinga n/m n/m n/m n/m n/m 3
Prof Shabir Madhi (Acting CEO) A n/m n/m n/m n/m n/m 2
Dr Sibongile Zungu n/m A n/m n/m 4
Dr Kamy Chetty (Acting CEO) n/m n/m n/m 5
Total number of meetings = 8
LEGEND:
= Present
A = Apology
n/m= Not a member

ANNUAL REPORT 2017/18
Page - 162
The Audit and Risk Committee (ARC)
In keeping with Treasury Regulation 27 of the PFMA, the Board appointed the ARC to assist in the discharge of its duties by reviewing and reporting on the governance responsibilities of the Board and the NHLS. The ToR of the ARC, its duties and functions, its composition and its modus operandi were approved by the Board. The Committee suffered a serious blow after the untimely passing of its Chairperson, Mr Lunga Ntshinga on 13 August 2017.
The Committee met four (4) times during the year under review.
Attendance at the Audit and Risk Committee (“ARC”) for the year 1 April 2017 to 31 March 2018:Names 17 May 2017 13 July 2017
Joint ARC & FinCom 15 November 2017 23 February 2018 TOTAL
Mr Lunga Ntshinga (Chairperson) n/m n/m 2
Dr Monde Tom (Chairperson) n/m n/m n/m 1
Dr Sibongile Zungu n/m n/m A 1
Dr Balekile Mzangwa A A 2
Prof Haroon Saloojee A 3
Mr Andre Venter 4
Mr Stanley Harvey A A 2
Mr Goolam Manack A A 2
Ms Sphiwe Mayinga n/m n/m A 1
Prof Shabir Madhi (Acting CEO) n/m n/m 3
Dr Kamy Chetty (Acting CEO) n/m n/m 2
Dr Zwelibanzi Mavuso f/m f/m f/m 1
Dr Gerhard Goosen f/m f/m f/m 1
Mr Michael Manning f/m f/m f/m 1
Total number of meetings = 4
LEGEND: = Present n/m = Not a memberA = Apology f/m = Finance Committe
The National Academic and Pathology Committee (NAPC)
The functions of the committee are to facilitate the formulation of policy with regard to:
a) The conduct of basic research in association or partnership with any tertiary educational institution;b) Cooperation with persons and institutions undertaking basic research in the Republic, and in other countries, by the exchange of
scientific knowledge and the provision of access to the resources and specimens available to the service;c) The participation in joint research operations with departments of state, universities, universities of technology, colleges, museums,
scientific institutions and other persons;d) Cooperation with educational authorities and scientific or technical societies or industrial institutions representing employers and
employees, respectively, for the promotion of the instruction and training of pathologists, technologists, technicians, scientists, researchers, technical experts and other supporting personnel in universities, universities of technology, and colleges; and
e) Any other matter as may be referred to the committee by the Board, from time to time.
As some of its duties, the committee must monitor and manage the agreements entered between the service and each tertiary education institution, including:
a) Development of policies and guidelines to determine the numbers of registrars for each discipline and the distribution of the registrar posts between the laboratories associated with each university health science faculty;
b) Development of policies and guidelines to determine the numbers of technologist training posts for each discipline and the distribution of the posts between the laboratories identified for this purpose;
c) Proposing guidelines relating to part-time, honorary and guest appointments of employees of the service by tertiary education institutions;
d) Monitoring of the guidelines for consultant appointments of personnel of tertiary education institutions in the service as determined by the agreement between the service and the universities;

ANNUAL REPORT 2017/18
Page - 163
e) Ensuring that the process of CPD programmes provided by tertiary education institutions in the service is used by service employees to comply with CPD requirements;
f ) Reviewing and managing arrangements for research being undertaken by tertiary education institutions in the laboratories of the service;
g) Advising executive management on matters relating to indemnity for employees of the service or a tertiary education institution working between the facilities of both partners;
h) Advising the EXCO on matters relating to discipline of personnel of the service or a tertiary education institution working between the facilities of both partners;
i) Advising the EXCO on financial matters, such as subsidies, bursaries and payment for academic related services;j) Monitoring, evaluating and managing service level agreements and performance measures;k) Advising, monitoring and evaluating the resolution of disputes if they should arise;l) Ensuring the integrity of the process of managing the partnerships;m) Ensuring that professional ethics are adhered to; andn) Making sure that the service complies with the requirements of the Health Professionals Council in respect of registration requirements,
ethics and conduct.
The NAPC have met on four (4) separate occasions during the financial year.Meeting Dates
Name11 May
2017 21 Aug
2017 14 Nov
2017 14 Feb
2018 Total
Dr Tim Tucker (Chairperson) 4
Prof Mary Ross 4
Ms Nelisiwe Mkhize 4
Mr Ben Durham A A n/m 1
Prof Willem Sturm n/m n/m 2
Prof Larry Obi n/m A A 1
LEGEND: = PresentA = Apologyn/m = Not a member
IT Governance Committee (ITGC)
The ITGC is established in terms of Section 12 of the NHLS Rules. The committee ensures that IT is a regular item on the Accounting Authority’s agenda and that it is addressed in a structured manner. In addition, the committee ensures that the Accounting Authority has the information it needs to make informed decisions that are essential to achieve the ultimate objectives of IT governance.These objectives are:
1) The alignment of IT and the business;2) The delivery of value by IT to the business;3) The sourcing and use of IT resources;4) The management of IT-related risks; and5) The tracking, monitoring and measurement of IT performance.
The committee offers expert insights into and timely advice and direction on topics such as: a) The relevance of the latest developments in IT from a business perspective;b) The alignment of IT with the business direction;c) The formulation and achievement of strategic IT objectives;d) The availability of suitable IT resources, skills and infrastructure to meet the strategic objectives;e) Optimisation of IT costs;f ) The role and the value delivery of external IT sourcing;g) Risk, return and competitive aspects of IT investments;h) Progress on major IT projects;i) The contribution of IT to the business (i.e. delivering the promised business value);j) Exposure to IT risks, including compliance risks; andk) Containment of risks of critical systems.
The ITGC met five (5) times this year. The Chairperson of the ITGC is appointed by the Accounting Authority from eligible board members.

ANNUAL REPORT 2017/18
Page - 164
The committee comprises a minimum of three (3) non-executive board members. The Chairperson of the NHLS Board, CFO and the IT Executive have a standing invitation to all committee meetings.
Attendance at the IT and Governance Committee (ITGC) for the year 1 April 2017 to 31 March 2018:Meeting dates
Name27 June
2017 28 June
201713 Sept
2017 23 Nov23 Febr
2018 Total
Mr Michael Manning (Chairperson) 5
Ms Ntombikayise Mapukat n/m 4
Dr Balekile Mzangwa A A A A n/m 0
Mr Stanley Harvey n/m 4
Dr Patrick Moonasar A A A A n/m 0
Prof Willem Sturm n/m n/m n/m 2
Total number of meetings = 5
LEGEND: = PresentA = Apologyn/m = Not a member
Governance and Social Ethics Committee (GSEC)
This committee was established to assist the Board with the oversight of corporate governance, social and ethical matters and in ensuring that the organisation is and remains a committed socially responsible corporate citizen. The commitment to sustainable development involves ensuring that the organisation conducts business in a manner that meets existing needs without knowingly compromising the ability of future generations to meet their needs. The committee’s primary role is to supplement, support, advise and provide guidance on the effectiveness or otherwise of management’s efforts in respect of governance, social and ethics and sustainable development related matters which, inter alia, include the following:
a) Safety;b) Health and wellness, including occupational hygiene;c) Environmental management;d) Climate change;e) Ethics management;f ) Corporate social investment;g) Mining community development;h) Stakeholder engagement; andi) The protection of company assets.
The committee must:
a) Review and approve the policy, strategy, structure to manage governance, social and ethics issues in the organisation;b) Oversee the monitoring, assessment and measurement of the organisation’s activities relating to social and economic development,
including the organisation’s standing in terms of the goals and purposes of:i. The 10 principles set out in the United Nations Global Compact Principles;ii. The OECD recommendations regarding corruption;iii. The Employment Equity Act; andiv. The Broad-Based Black Economic Empowerment Act.
c) Oversee the monitoring, assessment and measurement of the organisation’s activities relating to good corporate citizenship, including:i. The organisation’s promotion of equality;ii. Prevention of unfair discrimination;iii. Addressing of corruption;iv. Contribution to development of the communities in which its activities are predominantly conducted or within which its services
are predominantly marketed; and v. Recording of sponsorship, donations and charitable giving.

ANNUAL REPORT 2017/18
Page - 165
d) Overseeing the monitoring, assessment and measurement of the organisation’s activities relating to the environment, health and public safety, including the impact of the organisation’s activities and of its services;
e) Overseeing the monitoring, assessment and measurement of the organisation’s stakeholder relationships, including its advertising, public relations and compliance with consumer protection laws to ensure that the organisation adheres to its values;
f ) Overseeing the monitoring of the organisation’s labour and employment, including its standing in terms of the ILO Protocol on decent work and working conditions, the organisation’s employment relationships, and its contribution toward the educational development of its employees;
g) Reviewing the adequacy and effectiveness of the organisation’s engagement and interaction with its stakeholders;h) Considering substantive national and international regulatory developments, as well as best practice in the fields of social and ethics
management;i) Reviewing and approving the policy and strategy pertaining to the organisation’s programme of corporate social investment;j) Determining clearly articulated ethical standards (Code of Ethics) and ensuring that the organisation takes measures to achieve
adherence to these in all aspects of the business, thus achieving a sustainable ethical corporate culture within the organisation;k) Monitoring that management develops and implements programmes, guidelines and practices that are congruent with its social
and ethics policies;l) Reviewing the material risks and liabilities relating to the provisions of the Code of Ethics and ensuring that such risks are managed
as part of risk management programme;m) Obtaining external assurance of the organisation’s ethics performance on an annual basis, and facilitation of the inclusion in the
Integrated Report an assurance statement related to the ethics performance of the organisation; and n) Ensuring that management has allocated adequate resources to comply with social and ethics policies, codes of best practice and
regulatory requirements.
During the period under review the Committee met fourteen (14) times. There were a number of special meetings convened to among others, deal with matters relating to the disciplinary proceedings of the suspended CEO and CFO and the union’s demands, which form part of the annual salary increase negotiations.

ANNUAL REPORT 2017/18
Page - 166
GO
VERN
AN
CE, S
OCI
AL
AN
D E
THIC
S CO
MM
ITTE
E:
Att
enda
nce
at th
e G
over
nanc
e, S
ocia
l and
Eth
ics
Com
mitt
ee (“
GSE
C”) f
or th
e ye
ar 1
Apr
il 20
17 to
31
Mar
ch 2
018.
Nam
es
07 A
pril
2017
23 M
ay
2017
Spec
ial
12 Ju
ne
2017
Sp
ecia
l
14 Ju
ne
2017
Sp
ecia
l
21 Ju
ne
2017
Sp
ecia
l
22 Ju
ne
2017
Sp
ecia
l
12 Ju
ly
2017
Sp
ecia
l
14 Ju
ly
2017
Sp
ecia
l
17 Ju
ly
2017
Sp
ecia
l
20 Ju
ly
2017
Sp
ecia
l
17 A
ugus
t 20
17
Spec
ial
08
Sept
embe
r 20
17
Spec
ial
24
Oct
ober
20
17
21
Febr
uary
20
18
Tota
l m
eeti
ngs
Prof
Eric
Buc
h (C
hairp
erso
n)
14
Dr S
ibon
gile
Zu
ngu
n/m
A
A
A10
Mr A
ndre
Ve
nter
A
n/m
12
Prof
Mar
y Ro
ssA
A
A
11
Mr M
iche
l M
anni
ng
A
13
Dr T
im T
ucke
r
A
A
12
Ms
Nel
ly
Mkh
ize
A
AA
11
Mr L
unga
N
tshi
nga
A
A
n/m
n/m
n/m
n/m
8
Dr G
erha
rd
Goo
sen
n/m
n/m
n/m
n/
mn/
mn/
mn/
mn/
mn/
mn/
mn/
m3
Prof
Sha
bir
Mad
hi
(Act
ing
CEO
)
n/
mn/
mn/
m11
Dr K
amy
Che
tty
(Act
ing
CEO
)
n/m
n/m
n/m
n/m
n/m
n/m
n/m
n/m
n/m
n/m
n/m
n/m
2
Tota
l num
mbe
r of m
eeti
ngs
= 14
LEG
END
:
=
Pr
esen
tn/
m =
Not
a m
embe
rA
=
Apo
logy

ANNUAL REPORT 2017/18
Page - 167
Research and Innovation Committee (RIC)
This committee was established as a vehicle for ensuring that the NHLS research mandate receives attention at Board level. Members of the Research and Innovation Committee may be called on from time to time to interact with external stakeholders and funding agencies.The role of the Research and Innovation Committee is to advise the NHLS Board and the NAPC on research policies, strategies, initiatives and innovation that promote the research interests of the organisation and that nurture and enable high quality research.
The objectives of the Research and Innovation Committee are aligned with those stipulated in the South African Health Research Policy of 2001, the National Department of Health 10-point plan and the National Health Research Committee (NHRC).
At its meeting held on 27 February 2018, the Board approved the revised charter of the Committee. The revised charter provides for additional focus areas on innovation and broadens the scope of the Committee.
The Committee met four (4) times in the 2017/2018 financial year, as detailed in the table below:
Meeting dates
Name10 May
2017 18 Augt
2017 13 Nov
2017 13 Febr
2018 Total
Prof Mary Ross (Chairperson) 4
Mr Ben Durham A C 2
Dr Tim Tucker A 3
Dr Patrick Moonasar A A C 1
Prof Willem Sturm C C 2
Prof Haroon Saloojee A 3
Total number of meetings= 4
LEGEND:
= PresentA = ApologyC = Not a member
PORTFOLIO COMMITTEE
The Parliamentary Portfolio Committee on Health exercises oversight over service delivery performance of the public entities reporting to the Health Department. The NHLS appeared before the Parliamentary Portfolio Committee on health issues on the dates set out below:
Date Parliamentary Structure Activity/ Focus
3 May 2017 Portfolio Committee on Health Presentation of the Strategic Plan (2017/2021) and 2017/2018 APP
4 October 2017 Portfolio Committee on Health Presentation of the AFS and 2016/2017 AR
COMPANY SECRETARY
The Company Secretary plays a critical role in providing secretarial and advisory services to the Board and its Committees. Furthermore, the Company Secretary is a liaison officer between management and the Board, and between the Board and the Shareholder on issues relating to governance, thus giving effect to governance protocols.
The Company Secretary is the custodian of the register of Board and Committee decisions. The Company Secretary provides guidance to both the executive and non-executive members of the Board in the discharge of their fiduciary duties and ensures that Board proceedings are executed in accordance with the relevant legislative requirements.
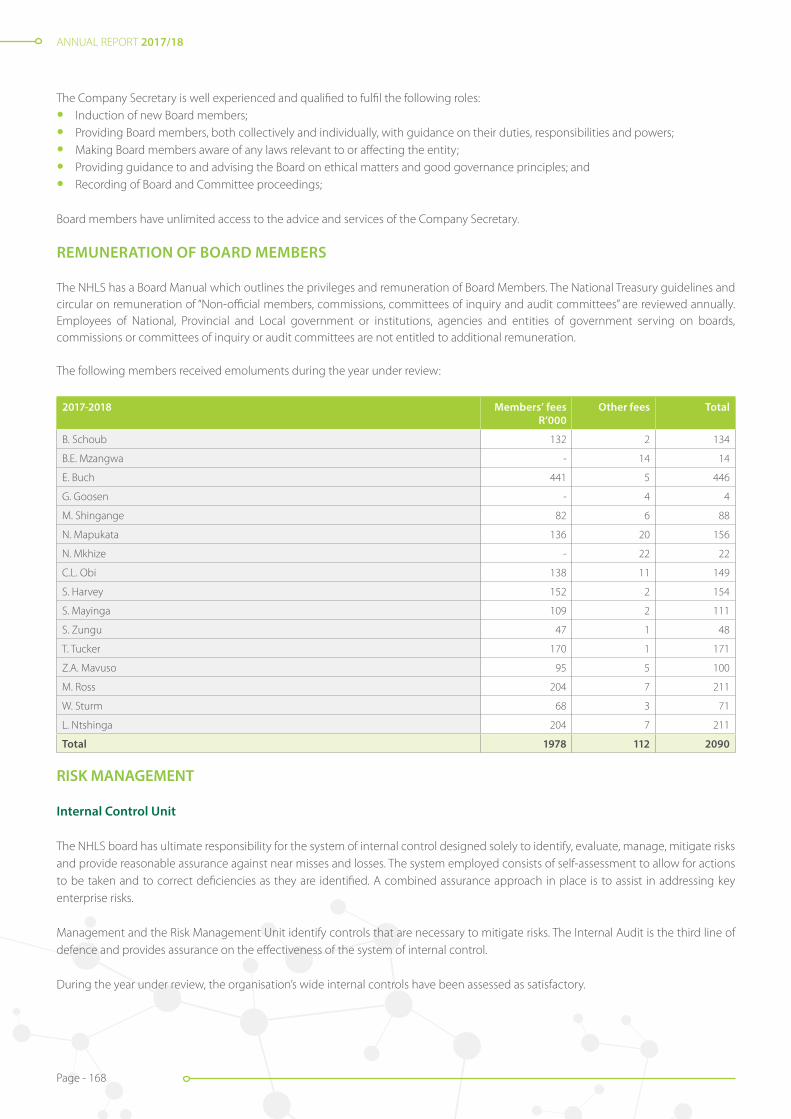
ANNUAL REPORT 2017/18
Page - 168
The Company Secretary is well experienced and qualified to fulfil the following roles:
• Induction of new Board members;
• Providing Board members, both collectively and individually, with guidance on their duties, responsibilities and powers;
• Making Board members aware of any laws relevant to or affecting the entity;
• Providing guidance to and advising the Board on ethical matters and good governance principles; and
• Recording of Board and Committee proceedings;
Board members have unlimited access to the advice and services of the Company Secretary.
REMUNERATION OF BOARD MEMBERS
The NHLS has a Board Manual which outlines the privileges and remuneration of Board Members. The National Treasury guidelines and circular on remuneration of “Non-official members, commissions, committees of inquiry and audit committees” are reviewed annually. Employees of National, Provincial and Local government or institutions, agencies and entities of government serving on boards, commissions or committees of inquiry or audit committees are not entitled to additional remuneration.
The following members received emoluments during the year under review:
2017-2018 Members’ feesR’000
Other fees Total
B. Schoub 132 2 134
B.E. Mzangwa - 14 14
E. Buch 441 5 446
G. Goosen - 4 4
M. Shingange 82 6 88
N. Mapukata 136 20 156
N. Mkhize - 22 22
C.L. Obi 138 11 149
S. Harvey 152 2 154
S. Mayinga 109 2 111
S. Zungu 47 1 48
T. Tucker 170 1 171
Z.A. Mavuso 95 5 100
M. Ross 204 7 211
W. Sturm 68 3 71
L. Ntshinga 204 7 211
Total 1978 112 2090
RISK MANAGEMENT
Internal Control Unit
The NHLS board has ultimate responsibility for the system of internal control designed solely to identify, evaluate, manage, mitigate risks and provide reasonable assurance against near misses and losses. The system employed consists of self-assessment to allow for actions to be taken and to correct deficiencies as they are identified. A combined assurance approach in place is to assist in addressing key enterprise risks.
Management and the Risk Management Unit identify controls that are necessary to mitigate risks. The Internal Audit is the third line of defence and provides assurance on the effectiveness of the system of internal control.
During the year under review, the organisation’s wide internal controls have been assessed as satisfactory.
ANNUAL REPORT 2017/18
Page - 169
Internal Audit and Risk Committee (ARC)
The NHLS has a co-sourced internal audit function to support the reviews of its operations. The ARC approves the following documents: the internal audit charter, the three-year rolling strategic audit plan, the one-year operational audit plan and the budget of internal audit. To ensure that the internal audit function maintains its independence, the function reports administratively to the NHLS CEO, and functionally to the Chairperson of the ARC.
The three-year strategic audit plan and one-year operational audit plan are based on the key risks of the organization and outcomes of an enterprise-wide risk assessment that was conducted, which also includes specific areas highlighted by internal audit and the ARC. Areas highlighted by internal controls are reviewed by the external auditors and are incorporated into the internal audit plan.
The one-year operational audit plan is flexible and ensures that it is responsive to changes in the business environment of the organization and emerging risks.
A comprehensive report on all internal audit findings is regularly presented to management, as well as on a quarterly basis to the ARC.
Compliance with Laws and Regulations
The nature of the NHLS’s business requires assessment of, and integration of legal, regulatory and public policy requirements into the strategy and operational processes of the organisation to meet its contractual, moral and corporate citizenship obligations. The laws that govern the company and its activities form the foundation for good corporate governance and demonstrate stewardship and responsibility to all stakeholders. During the period under review there were no material non-compliances with laws and regulations applicable in the business environment identified.
Fraud and Corruption
The NHLS implemented the Fraud Prevention and Response Plan to enhance integrity, reduce the risk of fraud, and provide staff with guidance in the reporting of fraud, corruption and other criminal offences that affect the organization. The plan is designed to protect public funds and assets as well as protect the integrity, security and reputation of the organisation; while maintaining a high level of services to the community that is consistent with the NHLS code of conduct objectives.
The NHLS keeps a consolidated record of all allegations of fraud and corruption received and report these including their resolutions to the Board, through the ARC. As a result, fraud and corruption risks are managed effectively and potential threats to the organization are given the necessary attention.
The NHLS also protects the rights of whistle blowers and prevent potential victimisation by fellow employees or managers in contravention of the Protected Disclosures Act 26 of 2000. Such victimisations could have severe negative implications for the organisation, for example, negative media publicity and create impression that the organisation does not appreciate the practice.
The NHLS uses the Fraud Hotline (Tip-Offs Anonymous), which is externally managed by an independent service provider.
Minimising Conflict of Interest
The NHLS Board has adopted a code of business conduct and ethics for its members. The code is intended to focus the Board and its members on ethical risk, provide guidance to directors in order to help them recognise and deal with ethical issues, provide mechanisms to report unethical conduct, and help foster a culture of honesty and accountability.
The code requires all Board members to avoid conflict of interest, and encourages members to promptly disclose any situation that involves, or may reasonably be expected to involve, a conflict of interest.
Some of the more common conflicts from which Board members must refrain include:
(a) Relationship of the organisation with third parties. “Directors may not engage in any conduct or activities that are inconsistent with the organisation’s best interest or that disrupt or impair the organisation’s relationship with any person or entity with which the organisation has or proposes to enter into a business or contractual relationship”.
ANNUAL REPORT 2017/18
Page - 170
(b) Compensation from other sources. “Directors may not accept compensation (in any form) for services performed for the organisation from any source other than the organisation”.
(c) Gifts. “Directors and members of their families may not accept gifts from persons or entities who deal with the organisation in those cases where any such gift is being made in order to influence the director’s action as a member of the Board, or where acceptance of the gifts could create the appearance of a conflict of interest. All members are requested to declare their interest in any matter included in the agenda before every meeting commences. Should any member declare any interest, he / she will be recused from the meeting when the matter is discussed.
Code of Conduct
The NHLS has a Code of Conduct, which refers to the philosophical study of values and the rules that all employees, executives and non- executives members of the Board must abide to it. The NHLS is committed to a policy of fair dealing and integrity in the conduct of its business.
This commitment is actively endorsed by the NHLS Board and executives, and is based on a fundamental belief that business should be conducted honestly, fairly and legally. All employees are expected to share this commitment to high moral, ethical and legal standards.
Health and Safety and Environment Issues
While the Governance, Ethics and Social Committee provides guidance on health, safety and environment, the NHLS has systems and processes in place that deal specifically with these issues. Health and safety issues are reported extensively in the National Institute for Occupational Health (NIOH) Annual Review 2017 / 18 published concurrently within this Annual Report.
Social Responsibility
The NHLS continued to partner with the South African National Blood Services (SANBS) to encourage NHLS employees to donate blood on a regular basis in order to save lives. Blood donor drives were hosted 6 times at the NHLS during the year under review, and a total of 264 units of blood were collected from participating employees. Through increased advocacy, these volumes are expected to increase as more employees are encouraged to donate blood in order to save lives.
The NHLS also participated in the Cell C Take a girl-child to work initiative on 25 May 2017, which was hosted under the theme “Dream, Believe and Achieve”. The initiative was aimed at Grade 10 to 12 learners from all walks of life, in an effort to afford them the chance to experience the world of work and culture in various organisations.
The NHLS selected 20 girls from Kwa-Bhekilanga Secondary School in Alexandra to participate in this educational campaign, in order to expose them to the various career possibilities that exist within the organisation.
During the period under review, various divisions in the NHLS continued to celebrate the legacy of Nelson Mandela by participating in the Nelson Mandela International Day on 18 July.
Risk governance
The governing body, the NHLS Board, governs risk in a way that supports the organisation in setting and achieving its strategic objectives.
The ARC is responsible for the oversight of enterprise-wide risk management practices and processes and to ensure that the entity’s risk management policy and strategy is implemented.
The Board treats risk as integral to the way it makes decisions and executes its duties. As a result, the enterprise-wide risk management is embedded in the daily operational activities and focuses on identifying, assessing, managing and monitoring all risks. These measures have been in place during the financial year under review. The Board has emphasized the need to receive periodic independent assurance on the effectiveness of risk management.

ANNUAL REPORT 2017/18
Page - 171
A well-designed and structured system of enterprise-wide risk management was implemented to provide assurance that the goals and objectives of the NHLS are achieved. The system considers that identified risks are often integrated and cannot be managed in isolation. The NHLS risk management framework was implemented to review aspects of economy, efficiency and effectiveness of the entity’s risk management processes. The accountability for managing risk is assigned at appropriate levels, to ensure proper responses.
The NHLS defined three broad risk categories, namely: strategic risks, operational and / or divisional risks and emerging risks.
Strategic risks
The NHLS implemented effective mechanisms for identifying and monitoring strategic risks that impact on the organization’s ability to deliver on its mandate and achieve its strategic goals and objectives.
During the period under review, a strategic risk assessment workshop was conducted, and thereafter a strategic risk register was developed that is being monitored and assessed on an ongoing basis. The register gets presented to the ARC and the Board on a quarterly basis and independently monitors the effectiveness of the organisation’s enterprise-wide risk management processes.
Operational and / or divisional risks
The NHLS manages operational risks by ensuring that there is relevant infrastructure for controls, systems and personnel. Key processes employed in the management of operational risks include a code of ethics, internal controls, segregation of compatible functions, delegation of authority, financial and management reporting; and monitoring of key performance indicators to highlight positive and negative performance across a broad range of key results areas. The organisation’s EXCO, area and business managers oversee operational matters. During the period under review, operational and / or divisional risk assessment workshops were conducted and subsequently a risk register was developed that is being monitored and assessed on an ongoing basis and regularly presented to EXCO.
Emerging risks
Emerging risks originate from macro-economic and national challenges pertaining to the environment that the NHLS’s operates within. During the year under review, the organisation identified emerging risks and were incorporated both into the strategic and operational risk registers of the entity.
ANNUAL REPORT 2017/18
Page - 172
REPORT OF THE AUDIT AND RISK COMMITTEE (ARC)
We are pleased to present our report for the financial year ended 31 March 2018.
Audit and Risk Committee responsibility
The Committee reports that appropriate formal terms of reference have been adopted in its charter, in line with the requirements of section 51(1)(a) (ii) of the Public Finance Management Act (PFMA) and Treasury Regulation 27. The Committee further reports that it has conducted its affairs in compliance with this charter.
The effectiveness of internal control
The Committee has reviewed various reports prepared by the internal and external auditors, on the adequacy and effectiveness of internal control systems as well as on the Group Annual Financial Statements. The Committee acknowledges the concerns and findings raised by auditors, and have received management assurance that the issues will be resolved to ensure improvement of the internal control environment. This will be monitored at every Audit and Risk Committee meeting going forward.
The Committee acknowledges that the content and quality of quarterly reports prepared and issued by management of NHLS during the year under review should be improved to address the gaps identified from external audit. The Committee is satisfied with the commitment from management to resolve this matter.
The responsibility for risk management resides with management at all levels. Risk management is embedded throughout the organisation, from members of the Board to all employees. The approach followed by NHLS is to ensure that significant risks are identified and managed.
The NHLS has a dedicated Risk Management and Internal Audit Department to co-ordinate the implementation of its risk management philosophy and strategy as approved by the Board. The Board continues to discharge this responsibility through its Audit and Risk Committee. A Strategic Risk Register was prepared for NHLS and reviewed by the Audit and Risk Committee.
Evaluation of Group Annual Financial Statements
The Committee has:
• Reviewed the audited Group Annual Financial Statements with SizweNtsalubaGobodo (SNG) and the Board.
• Reviewed SNG’s management report and management’s response thereto.
• Reviewed changes in accounting policies and practices.
• Reviewed the entity’s compliance with legal and regulatory provisions.
• Reviewed significant adjustments resulting from the audit.
The Committee concurs with and accepts the external auditors’ report on the Group Annual Financial Statements, and is of the opinion that the audited Group Annual Financial Statements should be accepted.
Competency of the Finance Department
In compliance with governance principles section 59(f ) of the King IV code of governance principles, the Committee acknowledges that there are inadequate resources and competency gaps in the Finance Department. Management has given the Committee commitment in resolving the issues to correct the identified gaps and strengthen the skills and competency of Finance Department.
ANNUAL REPORT 2017/18
Page - 173
Internal Audit
The Committee is satisfied that there is an internal audit function in the organisation, however accepts that it needs to be adequately capacitated and resourced to ensure it addresses the risks pertinent to NHLS and its audits. The Committee has reviewed internal audit reports and will ensure that reported items are addressed effectively by management. This included the following reports;
• Property, plant and equipment
• Trade and other payables
• Payroll and human resources
• Audit of performance information
• Software management review
• IT asset verification
• Project management governance review
• Oracle security administration
Conclusion
The Committee agrees that the adoption of the going concern premise is appropriate in preparing the Group Annual Financial Statement for the 2017/18 period. The Committee has therefore recommended the adoption of the Group Annual Financial Statements by the NHLS Accounting Authority at meeting held on 18 September 2018.
Dr Monde TomChairperson: Audit and Risk Committee
ANNUAL REPORT 2017/18
Page - 174
HumanResources
PART C

ANNUAL REPORT 2017/18
Page - 175
Executive Summary
Every organisation prides itself in value that its employees contributes to the society in which they exist. The total number of people employed at the NHLS is ±7000 with a total annual remuneration of over R3.2billion. Of this total annual remuneration about 69% is towards our junior management, skilled and semi-skilled employees at grades C and B. This cohort of employees is an integral part of the national healthcare system as they contribute directly to patient care, as such impacting the community positively.
The leadership instability in the organisation due to suspension of senior officials in the past financial year has had a negative impact on the organisation.
Despite these challenges, the commitment of our staff remains strong with our turnover at 6%, and their general engagement, motivation and fulfilment being rated at its highest, at a rate above 64% satisfaction in the recent climate-engagement survey, corrective actions are
Executive Manager: Dr Mojaki Mosia
Human Resources
in place to address the leadership challenges.
The NHLS continues to maintain a good reputation amongst the market of young professionals as independently confirmed by the Universum Student Survey of 2017. The opportunity exists to leverage this further through proper branding via the communication department. The NHLS is still the largest provider of training for registrars, scientists, technologists, technicians and laboratory assistants in the country.
The NHLS is having leadership challenge at junior and supervisory roles, which is manifested immediately upon appointment. What makes this challenge worse is the expectation that they must deliver greater results by managing performance effectively. The challenge was confirmed by the internal climate survey that was conducted during the period under review, in which the NHLS received a lower score of 49%. This lower score was in the area of providing meaningful and timely performance feedback. The other lower score of 48% was in the area of dealing with poor performance fairly and consistently.
Though our staff turnover is low, it is important to note that most of those who leave the organisation, leave because of retirement and are therefore usually the most experienced staff. There is currently a shortage of such experienced professionals in the market, which makes it difficult for the organisation to replenish its talent at senior levels, especially in technical roles.
The NHLS needs to optimise the opportunity to operationalise the newly updated, developed and approved people processes to enable the organisation to mitigate these skills challenges above and to establish a benchmark for our peers or within the sector.
The new financial year that commences in April 2018, will be characterised by the operationalisation of approved policies in the following areas:
• Recruitment and selection;
• Employment equity and diversity;
• Perfor mance management;
• Talent management; and
• Remuneration, rewards and performance pay progression.
In addition, the Board approved the implementation of the Proficiency Assessment Project for the four key health roles and migration into performance-based levels. This project will enable differentiation of employee by level and performance, while ensuring that the NHLS still upholds the principles of equal remuneration for work of equal value.
Our regional structures provide us with a broader leadership platform to improve the inclusion, involvement and participation of others in processes and decisions. This was further strengthened when Executive Management operationalised the Board-approved matrix structure that determines that the regional HR, finance and QA divisions must report directly to the area manager, while retaining functional dotted-line reporting to their respective disciplines at the centre.

ANNUAL REPORT 2017/18
Page - 176
The NHLS needs to mitigate against the threat of career stagnation, financial and leadership instability; as well as the rising cost of human capital which have a direct negative impact on its ability to attract and retain talent. Despite all remuneration adjustments in the 2015/2016 financial year, the continued annual adjustment of its pay scale and last year’s total employee expenditure of R2.6 billion which is now 37% over total revenue, the perception still exists that the NHLS’ total rewards do not fairly match the contribution of its employees. This perception is supported by the overall satisfaction score of only 39% in our recent employee survey.
Furthermore, an overall satisfaction score of only 44% was achieved for “career progression to date which matches the efforts and contribution of our staff”. This clearly demonstrates the need to improve the understanding of the total NHLS reward and its employment value proposition. A campaign to address this issue will be embarked on, in collaboration with the Communications department.
Table 1: Personnel cost Total expenditure
for the entity R’000
Personnel expenditure
R’000
Personnel expenditure as a % of total expenditure
(%)No. of
employees
Average personnel cost per employee
(R)Total remuneration cost 7 025 759 3 326 192 47% 7 615 436 795
The total annual salary bill/ personnel expenditure for the 2017/2018 financial year amounts to R3.3 billion, with a total number of 7 615 employees across all levels as detailed in the table to follow. This personnel expenditure constitutes 47% of the NHLS’s total expenditure.
The NHLS continues to fulfil its role in promoting and prioritising skills development through the analysis of its employees’ skills needs by implementing the WSP. Multiple learning programmes were offered through short learning programmes, in-service conferences and congresses, as well as CPD programmes to enable the organisation to comply with legislation, improve quality of services, ensure business continuity and assist in the mitigation of risks.
In the past year, the NHLS achieved 114% of the planned training target as compared to the legislated target of 60%. This statistic includes a total of 5 188 employees who attended technical and non-technical short learning programmes, workshops, seminars, on-the-job training and conferences in the 2017/2018 period.
In addition to the regular training for learnership and professional registrations, 100 scholarships were awarded to needy students across the country who are studying towards a National Diploma in Biomedical Technology and the Bachelor of Health Science, and 122 bursaries to the amount of R2,7 million were issued to approved NHLS staff members who wish to pursue their career development by way of formal qualifications.
Table 2: Employment and vacancies
Level2016/17No. of employees
2017/18Approved posts
2017/18No. of employees
2017/18Vacancies % of Vacancies
Top management 7 8 6 2 25%
Senior management 59 72 57 15 20.8%
Professional qualified 705 834 697 137 16.4%
Skilled 3 083 3314 3 053 261 7.9%
Semi-skilled 2 614 2 835 2 614 221 7.8%
Unskilled 315 728 700 28 3.8%
Interns (Learnerships) 582 491 488 3 0.6%
Total 7 365 8 282 7 615 667 8.1%
The above table shows a vacancy rate of 8.1%. Though several vacancies exist, the emphasis was placed on filling critical positions.

ANNUAL REPORT 2017/18
Page - 177
Table 3: Employment changesSalary Band Employment at
beginning of periodAppointments Terminations Employment at end of
the period
Top management 7 1 3 5
Senior management 59 1 4 56
Professional qualified 705 82 96 691
Skilled 3 083 203 253 3 033
Semi-skilled 2 614 100 134 2580
Unskilled 315 412 15 712
Interns – learnerships 582 247 494 335
Total 7 365 1 046 999 7 615
The highest number of appointments were due to insourcing of cleaners which constitutes 38% of the total appointments, followed by the intake of medical technology students at 22%. New entrants into the organisation equates to 14.7%.
Table 4: Reasons for staff leaving
Reason Number % of Total no. of staff leaving
Death 16 0.2%
Resignation 249 3.3%
Dismissal 22 2.9%
Repudiation 50 0.6%
Retirement 86 1.1%
Ill health 13 0.2%
Expiry of contract 562 7.4%
Contract not valid 1 0%
Total 999 13.1%
The above table reflects voluntary resignations of 3.4%, which constitutes over 40% of the total staff turnover when the category of “expiry of contracts’’ is excluded. The second highest turnover is under the retirement category at 1.2%.
A total number of fifty (50) employees left the NHLS without giving notice during the 2017/2018 financial year. The staff turnover rate for 2017/2018 equals to 6%, excluding fixed term contracts, as these contracts have end dates.
Table 5: Labour relations – misconduct and disciplinary actions
Nature of disciplinary action Number
Verbal warning 18
Written warning 24
Final written warning 29
Dismissal 22
Not guilty 5
Withdrawn 6
Resignation 3
Total 107
The above table depicts that about 1.4% of the total staff were subjected to formal disciplinary processes in the organisation. Only 0.29% of employees’ employment was terminated due to serious transgressions.
Most of the managers have now adopted a progressive approach towards discipline. In this reporting period about 71 employees were given a second chance to improve their conduct.
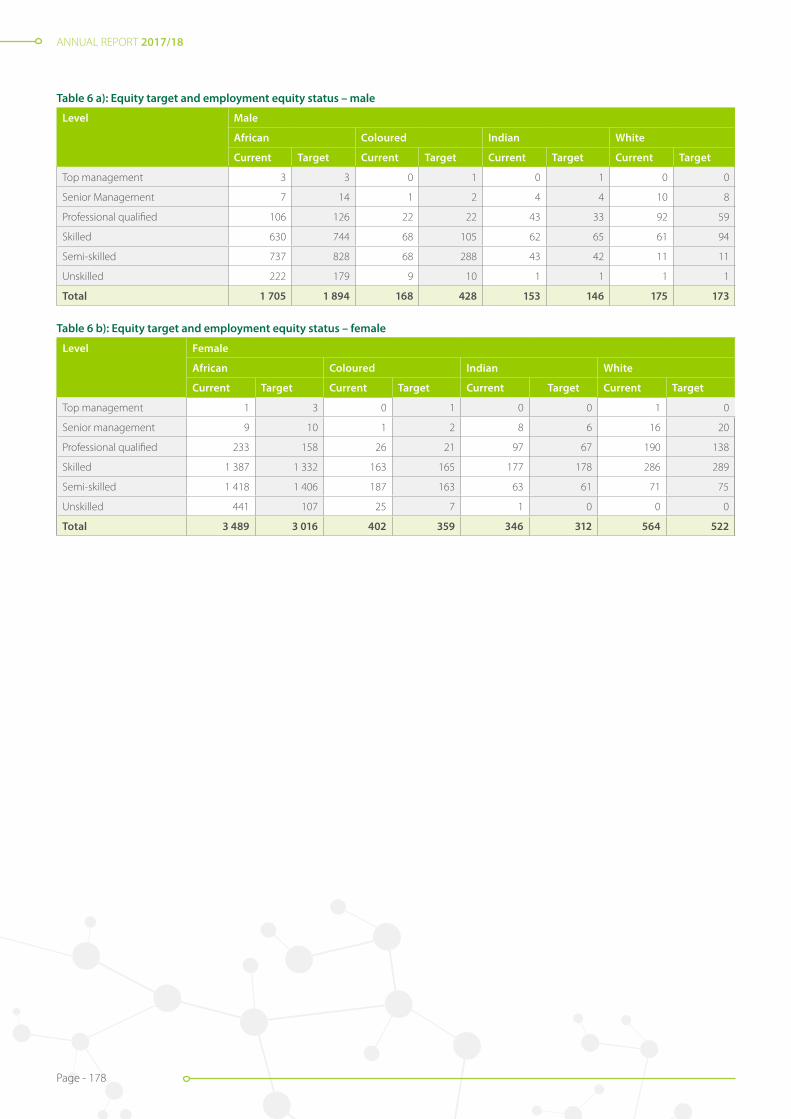
ANNUAL REPORT 2017/18
Page - 178
Table 6 a): Equity target and employment equity status – male
Level Male
African Coloured Indian White
Current Target Current Target Current Target Current Target
Top management 3 3 0 1 0 1 0 0
Senior Management 7 14 1 2 4 4 10 8
Professional qualified 106 126 22 22 43 33 92 59
Skilled 630 744 68 105 62 65 61 94
Semi-skilled 737 828 68 288 43 42 11 11
Unskilled 222 179 9 10 1 1 1 1
Total 1 705 1 894 168 428 153 146 175 173
Table 6 b): Equity target and employment equity status – female
Level Female
African Coloured Indian White
Current Target Current Target Current Target Current Target
Top management 1 3 0 1 0 0 1 0
Senior management 9 10 1 2 8 6 16 20
Professional qualified 233 158 26 21 97 67 190 138
Skilled 1 387 1 332 163 165 177 178 286 289
Semi-skilled 1 418 1 406 187 163 63 61 71 75
Unskilled 441 107 25 7 1 0 0 0
Total 3 489 3 016 402 359 346 312 564 522
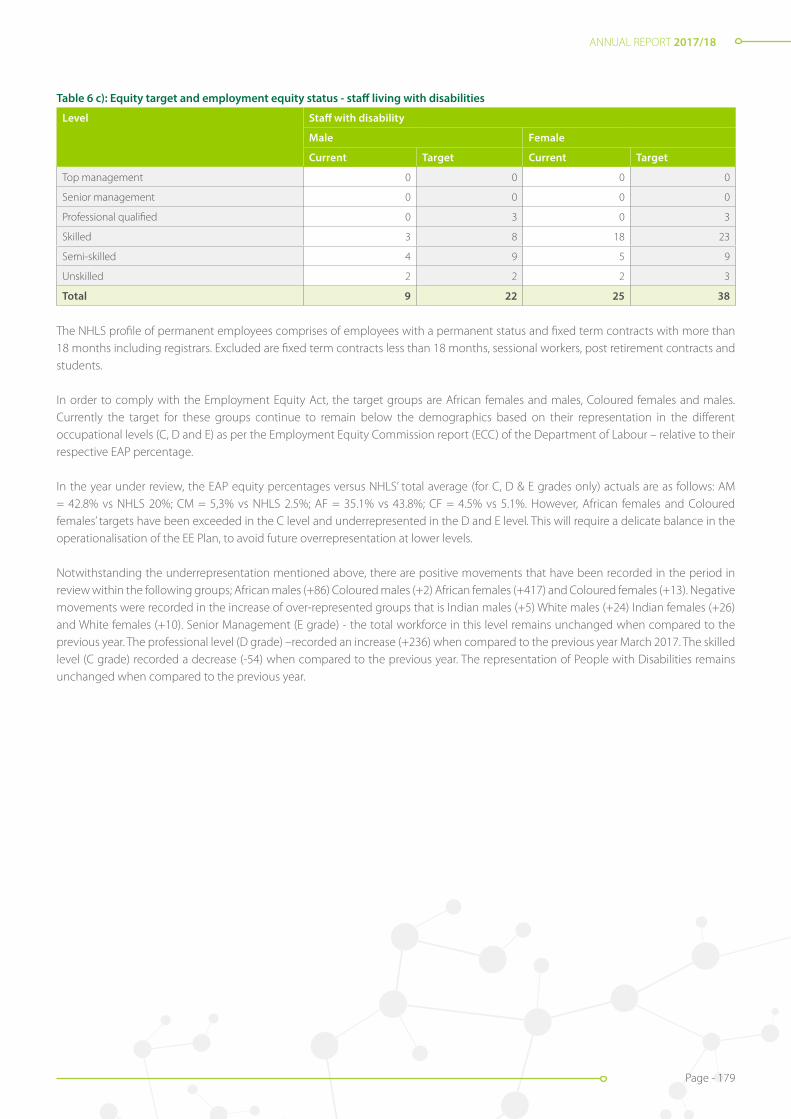
ANNUAL REPORT 2017/18
Page - 179
Table 6 c): Equity target and employment equity status - staff living with disabilities
Level Staff with disability
Male Female
Current Target Current Target
Top management 0 0 0 0
Senior management 0 0 0 0
Professional qualified 0 3 0 3
Skilled 3 8 18 23
Semi-skilled 4 9 5 9
Unskilled 2 2 2 3
Total 9 22 25 38
The NHLS profile of permanent employees comprises of employees with a permanent status and fixed term contracts with more than 18 months including registrars. Excluded are fixed term contracts less than 18 months, sessional workers, post retirement contracts and students.
In order to comply with the Employment Equity Act, the target groups are African females and males, Coloured females and males. Currently the target for these groups continue to remain below the demographics based on their representation in the different occupational levels (C, D and E) as per the Employment Equity Commission report (ECC) of the Department of Labour – relative to their respective EAP percentage.
In the year under review, the EAP equity percentages versus NHLS’ total average (for C, D & E grades only) actuals are as follows: AM = 42.8% vs NHLS 20%; CM = 5,3% vs NHLS 2.5%; AF = 35.1% vs 43.8%; CF = 4.5% vs 5.1%. However, African females and Coloured females’ targets have been exceeded in the C level and underrepresented in the D and E level. This will require a delicate balance in the operationalisation of the EE Plan, to avoid future overrepresentation at lower levels.
Notwithstanding the underrepresentation mentioned above, there are positive movements that have been recorded in the period in review within the following groups; African males (+86) Coloured males (+2) African females (+417) and Coloured females (+13). Negative movements were recorded in the increase of over-represented groups that is Indian males (+5) White males (+24) Indian females (+26) and White females (+10). Senior Management (E grade) - the total workforce in this level remains unchanged when compared to the previous year. The professional level (D grade) –recorded an increase (+236) when compared to the previous year March 2017. The skilled level (C grade) recorded a decrease (-54) when compared to the previous year. The representation of People with Disabilities remains unchanged when compared to the previous year.
ANNUAL REPORT 2017/18
Page - 180
Financial Information
PART E

ANNUAL REPORT 2017/18
Page - 181
ANNUAL REPORT 2017/18
Page - 181
Overview: Statement of Financial Performance
The financial performance of the NHLS for the 2017/18 fiscal year can be summarised as follows:
• The NHLS generated a surplus for the year, amounting to R1.3 billion compared to a restated R1.9 billion deficit in the previous financial year. The deficit for the previous year was largely attributed to the increased provision for bad debt for two provinces. The current year’s surplus is mainly attributed to the reversal of a portion of the provision for bad debt, due to the settlement agreement with the Gauteng DoH with regards to the historic debt.
• Revenue and other income grew from R7.3 billion to R8.2 billion. Revenue from provincial budgets amounted to 78% of the total revenue generated. The increase in revenue was largely due to the increases of viral load, creatinine automated, profile discrete analyser U and E, EXF Cytology (Gynae) 1st smear and HIV PCR laboratory tests.
• Production costs including direct labour and material grew from R5.8 billion to R6.2 billion. This equated to a 8% increase which was mainly due to increases in labour, volume, price increases and fluctuations in the exchange rate. Labour costs constituted 42% of the total revenue compared to 46% in the previous financial year.
• Operational costs decreased by 79%. This decrease in support costs was largely due to the reversal of the provision for doubtful debt.
Chief Financial Officer’s Report
Acting Chief Financial Officer: Michael Sass
Overview: Statement of Financial Position
The financial position for the 2017/2018 fiscal year can be summarised as follows:
• Assets increased from R3.4 billion to R4.9 billion which translates to a 42% increase, mainly due to a 41% (R717m) increase in Accounts Receivable, a 185% (R727m) increase in cash, as well as a 5% (R60m) increase in Fixed Assets. The closing bank balance ended
at R1 119 million compared to R392 million in the previous financial year, which indicates a net cash inflow of R727m for the NHLS.
• The current liability increases were mainly driven by increases in the leave provision and the utilities provision. NHLS provisions increased by 20% or R140m.
The NHLS continues to grow its business which is demonstrated by the 1% percentage increase in volumes and its revenue also increased by 12%. The NHLS collected R6.4 billion from provincial departments compared to R5.0 billion in the prior year. Despite the improvements shown in the provision of cost effective and efficient services, further savings can only be realised through better revenue management. This will be achieved by reducing the debtor collection period. NHLS will continue to engage the provinces with regard to timely payments of debt in arrears.
The NHLS’s financial viability has improved when compared to the prior year, with all liquidity ratios indicating positive movements. The solvency position of the NHLS also improved significantly thereby indicating sustainability of the entity in providing services to hospitals and clinics. The NHLS is in a better condition to deliver on its mandate.
Cash flow
During the current financial year, the NHLS received R8 billion (2016/2017: R6.7 billion) from operating activities. Of the R8 billion, R3.3 billion was utilised for personnel costs (2016/2017: R3.1 billion) and R3.7 billion (2016/2017: R3.7 billion) was utilised for goods and services. The long outstanding accounts payable balances from the procurement of goods and services significantly reduced, resulting in a reduction of creditor days from 75 days (equivalent to R655m) to 51 days (equivalent to R516m) year-on-year.

ANNUAL REPORT 2017/18
Page - 182
ANNUAL REPORT 2017/18
Page - 182
Budget variance analysis
The total revenue is 6.8% over budget (R560 million) due to an increase in the demand for diagnostic laboratory services and increases in transfer revenue during the current financial year. The positive variance is mainly attributable to the increase in priority tests as per alignment with the National DoH’s protocols.
Personnel costs are under budget by 12%, due to a moratorium on the filling of vacancies brought about by the poor cash flow position of the organisation. Material expenditure was 43% (2017: 44%) as a percentage of test revenue.
The NHLS continues to underspend on its budget in certain areas, specifically around filling of vacant/new posts and capital expenditure due to cash flow constraints.
Going concern
Given its significance in the public and private health sectors and its ability to deliver affordable pathology health services to the South African public, the NDoH has neither the intention, nor the need to liquidate or curtail the scale of the NHLS materially.Management considered a wide range of factors in determining whether the organisation is a going concern. These factors include its current and expected performance as a Schedule 3A public entity, its restructuring plans and the likelihood of future government funding.
Despite continued difficulty in receiving regular payments from all the provinces for debt owed for services rendered by the NHLS, it is anticipated that the settlement of disputes will be resolved. The Group’s Annual Financial Statements (AFS) were therefore prepared on the basis of accounting policies applicable to a going concern. In line with the applicable accounting standard, the basis presumes that funds will be available to finance future operations, and that the realisation of assets and liabilities, contingent obligations and commitments will occur in the ordinary course of business. This specifically assumes that the debt owed by all the provinces will be settled.
Outstanding debt owed by provinces
Collection of money from the provincial DoHs has been an ongoing issue for many years. As at 31 March 2018, DoH debt payable amounted to R5.4 billion. The majority of the debt is owed by KZN and Gauteng constitutes R4.5 billion or 84% of trade receivables. A settlement agreement was reached with the Gauteng DoH on debt in arrears and there are ongoing negotiations with KZN DoH regarding the settlement of overdue amounts owed to the NHLS.
Maintenance of financial control systems
The Board is ultimately responsible for systems of internal financial control within the NHLS and place considerable importance on maintaining a strong control environment. Based on assessments of internal and external audit, assurance is provided that the NHLS’s internal controls are effective.
Subsequent events
The Board and management are not aware of any other matters or circumstances arising since the end of the financial year, not otherwise dealt with in this report, that would affect its operations or the results thereof significantly.
Borrowing limitations
In terms of the NHLS rules, the Board may exercise all the powers of the economic entity to borrow money, in accordance with the PFMA, as they consider appropriate. During the current financial year, the entity did not borrow funds to finance its operations.
Michael SassActing Chief Financial Officer
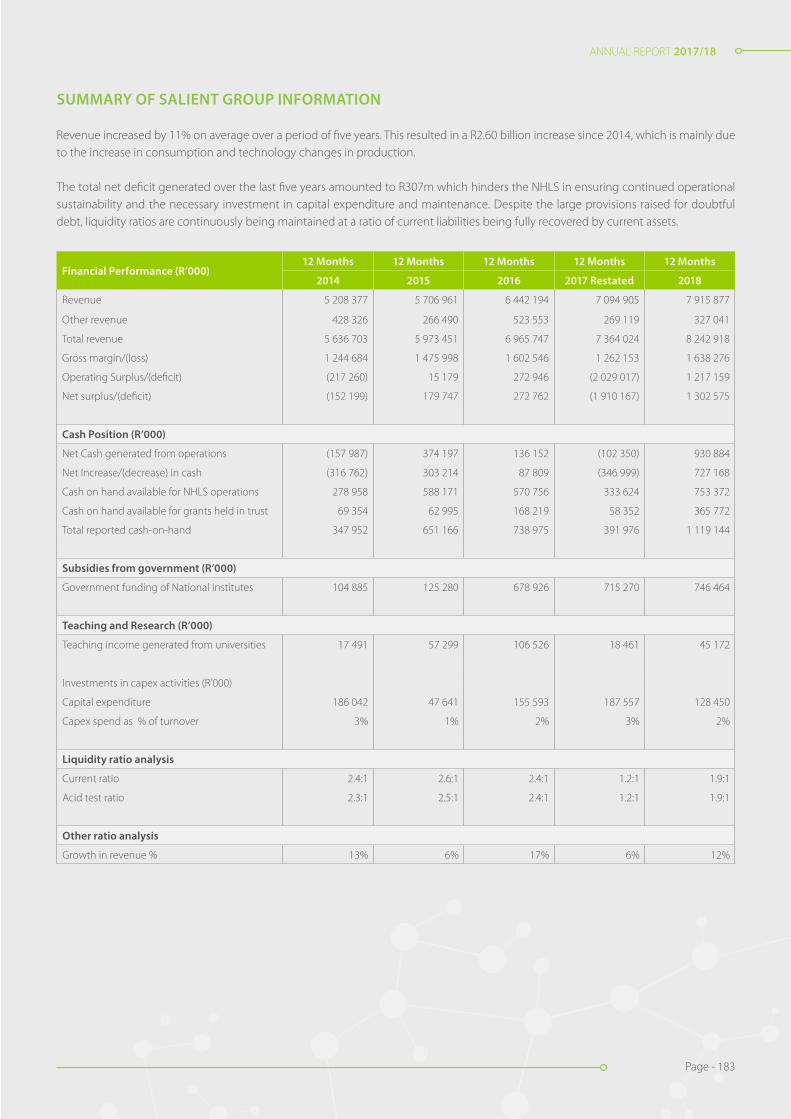
ANNUAL REPORT 2017/18
Page - 183
ANNUAL REPORT 2017/18
Page - 183
SUMMARY OF SALIENT GROUP INFORMATION
Revenue increased by 11% on average over a period of five years. This resulted in a R2.60 billion increase since 2014, which is mainly due to the increase in consumption and technology changes in production.
The total net deficit generated over the last five years amounted to R307m which hinders the NHLS in ensuring continued operational sustainability and the necessary investment in capital expenditure and maintenance. Despite the large provisions raised for doubtful debt, liquidity ratios are continuously being maintained at a ratio of current liabilities being fully recovered by current assets.
Financial Performance (R’000)12 Months 12 Months 12 Months 12 Months 12 Months
2014 2015 2016 2017 Restated 2018
Revenue 5 208 377 5 706 961 6 442 194 7 094 905 7 915 877
Other revenue 428 326 266 490 523 553 269 119 327 041
Total revenue 5 636 703 5 973 451 6 965 747 7 364 024 8 242 918
Gross margin/(loss) 1 244 684 1 475 998 1 602 546 1 262 153 1 638 276
Operating Surplus/(deficit) (217 260) 15 179 272 946 (2 029 017) 1 217 159
Net surplus/(deficit) (152 199) 179 747 272 762 (1 910 167) 1 302 575
Cash Position (R’000)
Net Cash generated from operations (157 987) 374 197 136 152 (102 350) 930 884
Net Increase/(decrease) in cash (316 762) 303 214 87 809 (346 999) 727 168
Cash on hand available for NHLS operations 278 958 588 171 570 756 333 624 753 372
Cash on hand available for grants held in trust 69 354 62 995 168 219 58 352 365 772
Total reported cash-on-hand 347 952 651 166 738 975 391 976 1 119 144
Subsidies from government (R’000)
Government funding of National Institutes 104 885 125 280 678 926 715 270 746 464
Teaching and Research (R’000)
Teaching income generated from universities 17 491 57 299 106 526 18 461 45 172
Investments in capex activities (R’000)
Capital expenditure 186 042 47 641 155 593 187 557 128 450
Capex spend as % of turnover 3% 1% 2% 3% 2%
Liquidity ratio analysis
Current ratio 2.4:1 2.6:1 2.4:1 1.2:1 1.9:1
Acid test ratio 2.3:1 2.5:1 2.4:1 1.2:1 1.9:1
Other ratio analysis
Growth in revenue % 13% 6% 17% 6% 12%
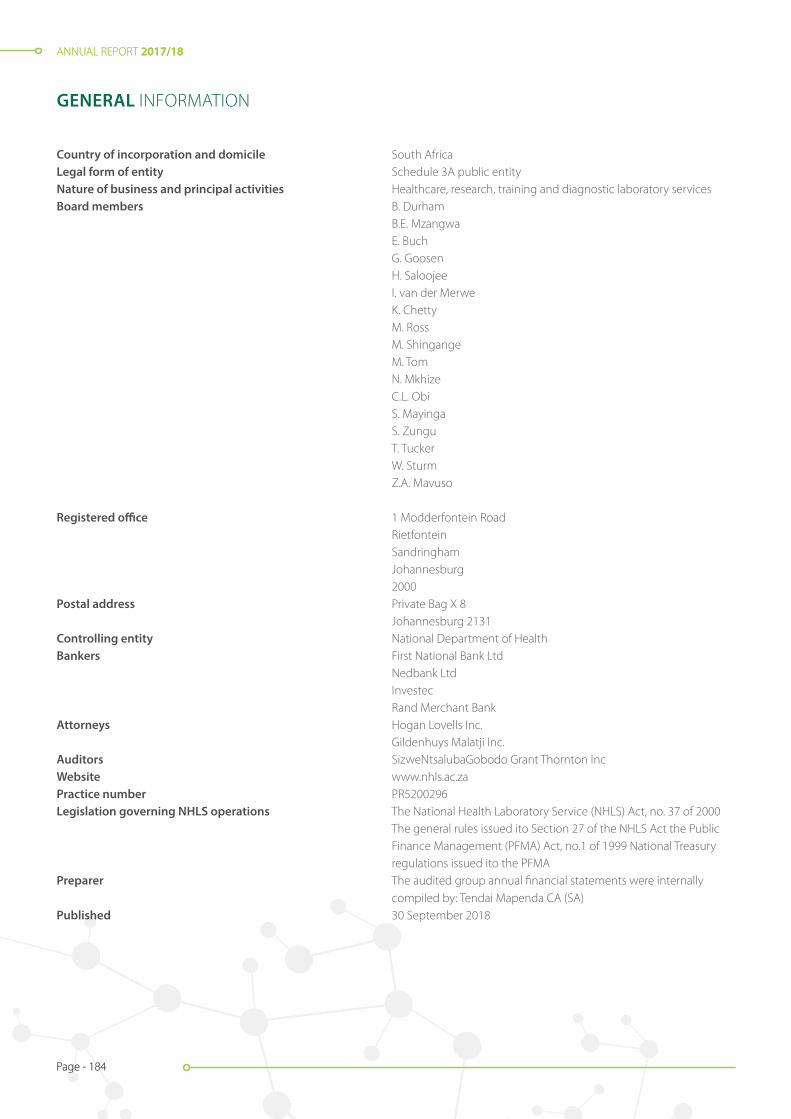
ANNUAL REPORT 2017/18
Page - 184
ANNUAL REPORT 2017/18
Page - 184
Country of incorporation and domicile South AfricaLegal form of entity Schedule 3A public entityNature of business and principal activities Healthcare, research, training and diagnostic laboratory servicesBoard members B. Durham B.E. Mzangwa E. Buch G. Goosen H. Saloojee I. van der Merwe K. Chetty M. Ross M. Shingange M. Tom N. Mkhize C.L. Obi S. Mayinga S. Zungu T. Tucker W. Sturm Z.A. Mavuso
Registered office 1 Modderfontein Road Rietfontein Sandringham Johannesburg 2000Postal address Private Bag X 8 Johannesburg 2131Controlling entity National Department of HealthBankers First National Bank Ltd Nedbank Ltd Investec Rand Merchant BankAttorneys Hogan Lovells Inc. Gildenhuys Malatji Inc.Auditors SizweNtsalubaGobodo Grant Thornton IncWebsite www.nhls.ac.zaPractice number PR5200296Legislation governing NHLS operations The National Health Laboratory Service (NHLS) Act, no. 37 of 2000 The general rules issued ito Section 27 of the NHLS Act the Public Finance Management (PFMA) Act, no.1 of 1999 National Treasury regulations issued ito the PFMAPreparer The audited group annual financial statements were internally compiled by: Tendai Mapenda CA (SA)Published 30 September 2018
GENERAL INFORMATION

ANNUAL REPORT 2017/18
Page - 185
ANNUAL REPORT 2017/18
Page - 185
The reports and statements set out below comprise the unaudited group annual financial statements presented to the parliament:
Page
Accounting Authority’s Responsibilities and Approval 186
Independent Auditor’s Report to Parliament on the National Health Laboratory Service 187
Statement of Financial Position 194
Statement of Financial Performance 195
Statement of Changes in Net Assets 196
Cash Flow Statement 197
Statement of Comparison of Budget and Actual Amounts 198
Accounting Policies 199
Notes to the Audited Group Annual Financial Statements 229
The following supplementary information does not form part of the audited group annual financial statements and is unaudited:
Detailed Statement of Financial Performance 282
INDEX
ANNUAL REPORT 2017/18
Page - 186
ANNUAL REPORT 2017/18
Page - 186
ACCOUNTING AUTHORITY’S RESPONSIBILITIES AND APPROVAL
The Accounting Authority is required by the Public Finance Management Act (Act 1 of 1999), to maintain adequate accounting records and is responsible for the content and integrity of the audited group annual financial statements and related financial information included in this report. It is the responsibility of the Accounting Authority to ensure that the audited group annual financial statements fairly present the state of affairs of the entity as at the end of the financial year and the results of its operations and cash flows for the period then ended. The external auditor is engaged to express an independent opinion on the audited group annual financial statements and was given unrestricted access to all financial records and related data.
The audited group annual financial statements have been prepared in accordance with Standards of Generally Recognised Accounting Practice (GRAP) including any interpretations, guidelines and directives issued by the Accounting Standards Board.
The audited group annual financial statements are based upon appropriate accounting policies consistently applied and supported by reasonable and prudent judgements and estimates.
The Accounting Authority acknowledges that it is ultimately responsible for the system of internal financial control established by the economic entity and place considerable importance on maintaining a strong control environment. To enable the Accounting Authority to meet these responsibilities, the entity sets standards for internal control aimed at reducing the risk of error or deficit in a cost effective manner. The standards include the proper delegation of responsibilities within a clearly defined framework, effective accounting procedures and adequate segregation of duties to ensure an acceptable level of risk. These controls are monitored throughout the economic entity and all employees are required to maintain the highest ethical standards in ensuring the economic entity’s business is conducted in a manner that in all reasonable circumstances is above reproach. The focus of risk management in the economic entity is on identifying, assessing, managing and monitoring all known forms of risk across the economic entity. While operating risk cannot be fully eliminated, the economic entity endeavours to minimise it by ensuring that appropriate infrastructure, controls, systems and ethical behaviour are applied and managed within predetermined procedures and constraints.
The Accounting Authority is of the opinion, based on the information and explanations given by management, that the system of internal control provides reasonable assurance that the financial records may be relied on for the preparation of the audited group annual financial statements. However, any system of internal financial control can provide only reasonable, and not absolute, assurance against material misstatement or error.
The Accounting Authority have reviewed the economic entity’s cash flow forecast for the year to 31 March 2019 and, in the light of this review and the current financial position, it is satisfied that the economic entity has or has access to adequate resources to continue in operational existence for the foreseeable future.
The entity is wholly dependent on all public healthcare providers for continued funding of operations. The audited group annual financial statements are prepared on the basis that the entity is a going concern and that the National Department of Health has neither the intention nor the need to liquidate or curtail materially the scale of the entity.
Although the Accounting Authority is primarily responsible for the financial affairs of the entity, they are supported by the economic entity’s internal auditors.
The audited group annual financial statements set out on pages 194 to 281, which have been prepared on the going concern basis, were approved by the Accounting Authority on 30 September 2018 and were signed on its behalf by:
............................................. .............................................
Dr. Kamy Chetty Prof. Eric BuchActing Chief Executive Officer Chairperson: Accounting Authority

ANNUAL REPORT 2017/18
Page - 187
ANNUAL REPORT 2017/18
Page - 187
Report on the audit of the consolidated and separate financial statements
Qualified opinion
1. We have audited the consolidated and separate financial statements of the National Health Laboratory Service and its subsidiaries (the group) set out on pages 194 to 281, which comprise the consolidated and separate statement of financial position as at 31 March 2018, the consolidated and separate statement of financial performance, statement of changes in net assets, cash flow statement and statement of comparison of budget and actual amounts for the year then ended, as well as the notes to the consolidated and separate financial statements, including a summary of significant accounting policies.
2. In our opinion, except for the possible effects of the matters described in the basis for qualified opinion section of this auditor’s report, the consolidated and separate financial statements present fairly, in all material respects, the consolidated and separate financial position of the National Health Laboratory Service as at 31 March 2018, and the group’s financial performance and its consolidated and separate cash flows for the year then ended in accordance with the Statement of Generally Recognised Accounting Practice (GRAP) and the requirements of the Public Finance Management Act of South Africa, 1999 (Act No. 1 of 1999) (PFMA) and the Companies Act of South Africa, 2008 (Act No. 71 of 2008) (the Companies Act).
Basis for qualified opinion
Commitments
3. We were unable to obtain sufficient appropriate audit evidence for commitments disclosure, as the entity did not keep accurate record of contracts entered into. Consequently, I was unable to determine whether any adjustment relating to commitments stated at R77 million in note 35 of the financial statements was necessary.
Irregular expenditure
4. Section 55(2)(b)(i) of the PFMA requires the entity to disclose in the consolidated financial statements particulars of all irregular expenditure incurred during the financial year. The entity did not have an adequate system for identifying and recognising all irregular expenditure and there were no satisfactory alternative procedures that we could perform to obtain reasonable assurance that all irregular expenditure had been properly recorded in note 40 of the consolidated financial statements. Consequently, we were unable to determine whether any adjustment was necessary to the irregular expenditure stated at R1 601 million (2017:R1 019 million) in the consolidated financial statements.
Accrued expenses
5. We were unable to obtain sufficient appropriate audit evidence for accrued expenses in note 14 of the financial statements, as the entity did not have proper processes to clear the opening balance of accruals from prior year. Consequently, I was unable to determine whether any adjustment relating to accrued expenses stated at R390 million in note 14 of the financial statements was necessary.
6. We conducted our audit in accordance with the International Standards on Auditing (ISAs). Our responsibilities under those standards are further described in the auditor’s responsibilities for the audit of the consolidated and separate financial statements section of this auditor’s report.
7. We are independent of the group in accordance with the Independent Regulatory Board for Auditors’ Code of professional conduct of registered auditors (IRBA code) and other independence requirements applicable to performing audits of the financial statements in South Africa. We have fulfilled our other ethical responsibilities in accordance with the IESBA code and in accordance other ethical requirements applicable to performing audits in South Africa. The IRBA code is consistent with the International Ethics Standards Board for Accountants’ Code of ethics for professional accountants (parts A and B).
8. We believe that the audit evidence we have obtained is sufficient and appropriate to provide a basis for our qualified opinion.
INDEPENDENT AUDITOR’S REPORT TO PARLIAMENT ON NATIONAL HEALTH LABORATORY SERVICE
ANNUAL REPORT 2017/18
Page - 188
ANNUAL REPORT 2017/18
Page - 188
Emphasis of matters
9. We draw attention to the matters below. Our opinion is not modified in respect of these matters. Restatement of corresponding figures
10. As disclosed in note 41 to the financial statements, the corresponding figures for 31 March 2017 have been restated as a result of an error in the financial statements of the entity for the year ended, 31 March 2018.
Material impairments – trade debtors
11. As disclosed in note 4 to the financial statements, material impairments to the amount of R3 355 380 000 were incurred as a result of doubt in recovering the amounts owed by these debtors.
Other matter
12. We draw attention to the matter below. Our opinion is not modified in respect of this matter.
Unaudited supplementary schedules
13. The supplementary information set out on pages 282 to 284 does not form part of the financial statements and is presented as additional information. I have not audited these schedules and, accordingly, I do not express an opinion thereon.
Responsibilities of accounting authority for the financial statements
14. The board of directors, which constitutes the accounting authority is responsible for the preparation and fair presentation of the consolidated and separate financial statements in accordance with GRAP and the requirements of the PFMA, and for such internal control as the accounting authority determines is necessary to enable the preparation of consolidated and separate financial statements that are free from material misstatement, whether due to fraud or error.
15. In preparing the consolidated and separate financial statements, the accounting authority is responsible for assessing the group’s ability to continue as a going concern, disclosing, as applicable, matters relating to going concern and using the going concern basis of accounting unless the accounting authority either intends to liquidate the group or to cease operations, or has no realistic alternative but to do so.
Auditor’s responsibilities for the audit of the consolidated and separate financial statements
16. Our objectives are to obtain reasonable assurance about whether the consolidated and separate financial statements as a whole are free from material misstatement, whether due to fraud or error, and to issue an auditor’s report that includes our opinion. Reasonable assurance is a high level of assurance, but is not a guarantee that an audit conducted in accordance with the ISAs will always detect a material misstatement when it exists. Misstatements can arise from fraud or error and are considered material if, individually or in aggregate, they could reasonably be expected to influence the economic decisions of users taken on the basis of these consolidated and separate financial statements.
17. A further description of our responsibilities for the audit of the consolidated and separate financial statements is included in the annexure to this auditor’s report.

ANNUAL REPORT 2017/18
Page - 189
ANNUAL REPORT 2017/18
Page - 189
Report on the audit of the annual performance report
Introduction and scope
18. In accordance with the Public Audit Act of South Africa, 2004 (Act No. 25 of 2004) (PAA) and the general notice issued in terms thereof, we have a responsibility to report material findings on the reported performance information against predetermined objectives for selected programmes presented in the annual performance report. We performed procedures to identify findings but not to gather evidence to express assurance.
19. Our procedures address the reported performance information, which must be based on the approved performance planning documents of the public entity. We have not evaluated the completeness and appropriateness of the performance indicators/ measures included in the planning documents. Our procedures also did not extend to any disclosures or assertions relating to planned performance strategies and information in respect of future periods that may be included as part of the reported performance information. Accordingly, our findings do not extend to these matters.
20. We evaluated the usefulness and reliability of the reported performance information in accordance with the criteria developed from the performance management and reporting framework, as defined in the general notice, for the following selected programmes presented in the annual performance report of the public entity for the year ended 31 March 2018:
ProgrammesPages in the annual performance
report
Programme 2 – Surveillance of Communicable Diseases 32 – 33
Programme 4 – Academic affairs, Research and Quality assurance objective 35 – 38
Programme 5 – Laboratory services 38 – 40
21. We performed procedures to determine whether the reported performance information was properly presented and whether performance was consistent with the approved performance planning documents. We performed further procedures to determine whether the indicators and related targets were measurable and relevant, and assessed the reliability of the reported performance information to determine whether it was valid, accurate and complete.
22. The material findings in respect of the usefulness and reliability of the selected programmes are as follows:
Programme: 4 – Academic affairs, Research and Quality assurance
Sub- programme: Quality Assurance
Indicator: Percentage compliance achieved by laboratories during annual quality compliance audits
23. The description and method of calculation of the achievement of the planned indicator was not well- defined as required by the FMPPI.
Sub- programme: Research
Indicator: Number of Registrars admitted per year
24. The description and method of calculation of the achievement of the planned indicator was not well- defined as required by the FMPPI.
ANNUAL REPORT 2017/18
Page - 190
ANNUAL REPORT 2017/18
Page - 190
Programme: 5 – Laboratory services
Sub-programme: Quality Service
Indicator: Percentage of Provincial Tertiary laboratories that are SANAS accredited
25. The description and method of calculation of the achievement of the planned indicator was not well- defined as required by the FMPPI as the indicator title gives the impression that the laboratories are SANAS accredited when in fact the method of calculating the percentage achievement included those that are recommended for SANAS accreditation.
Indicator: Percentage of Regional laboratories that are SANAS accredited
26. The description and method of calculation of the achievement of the planned indicator was not well- defined as the method of calculation makes reference the percentage of regional laboratories required by the FMPPI as the indicator title gives the impression that the laboratories are SANAS accredited when in fact the method of calculating the percentage achievement included those that are recommended for SANAS accreditation.
Indicator: Percentage of District laboratories that are SANAS accredited
27. The description and method of calculation of the achievement of the planned indicator was not well- defined as required by the FMPPI as the indicator title gives the impression that the laboratories are SANAS accredited when in fact the method of calculating the percentage achievement included those that are recommended for SANAS accreditation.
Indicator: Percentage of the National Central laboratories that are SANAS accredited
28. The description and method of calculation of the achievement of the planned indicator was not well- defined as required by the FMPPI as the indicator title gives the impression that the laboratories are SANAS accredited when in fact the method of calculating the percentage achievement included those that are recommended for SANAS accreditation.
Other matters
29. We draw attention to the matters below. Our opinions are not modified in respect of these matters.
Achievement of planned targets
30. Refer to the annual performance report on pages 28 to 40 for information on the achievement of planned targets for the year and explanations provided for the under/ over achievement of a significant number of targets. This information should be considered in the context of the material findings on the usefulness and reliability of the reported performance information in paragraphs 22 to 28 of this report.
Adjustment of material misstatements
31. We identified material misstatements in the annual performance report submitted for auditing. These material misstatements were on the reported performance information of Surveillance of Communicable Diseases, Academic affairs, Research and Quality assurance objective and Laboratory Services. As management subsequently corrected only some of the misstatements, we raised material findings on the usefulness and reliability of the reported performance information. Those that were not corrected are reported above.

ANNUAL REPORT 2017/18
Page - 191
ANNUAL REPORT 2017/18
Page - 191
Report on the audit of compliance with legislation
Introduction and scope
32. In accordance with the PAA and the general notice issued in terms thereof, we have a responsibility to report material findings on the compliance of the public entity with specific matters in key legislation. We performed procedures to identify findings but not to gather evidence to express assurance.
33. The material findings on compliance with specific matters in key legislations are as follows:
Annual financial statements
34. The financial statements submitted for auditing were not prepared in accordance with the prescribed financial reporting framework and/or supported by full and proper records as required by section 55(1) (a) and (b) of the PFMA. Material misstatements on grant income, receivables from non-exchange, unspent conditional grants and receipts and property plant and equipment identified by the auditors in the submitted financial statements were corrected, but the supporting records for commitments, irregular expenditure and accrued expenses could not be provided resulted in the financial statements receiving a qualified opinion.
Expenditure management
35. Effective steps were not taken to prevent irregular expenditure, amounting to R1 601 million as disclosed in note 40 of the AFS, as required by section 51(1)(b)(ii) of the PFMA. The full extent of the irregular expenditure could not be quantified as indicated in the basis for qualification paragraph. The majority of the irregular expenditure disclosed in the financial statements was caused by non-compliance with section 51(1)(a)(iii) of the PFMA and overspend on contracts. Approximately R115 200 000 of these relate to payments made during this financial period on contracts entered into by management during the previous financial period without the necessary board approval. These are currently the subject of an ongoing investigation.
Procurement and contract management
36. We were unable to obtain sufficient appropriate audit evidence that some goods, works and services were procured through a procurement process which is fair, equitable, transparent and competitive, as required by section 51(1)(a)(iii) of the PFMA.
37. Goods and services with a transaction value below R500 000 were procured without obtaining the required price quotations, as required by Treasury Regulation 16A6.1.
38. Quotations were awarded to bidders who did not submit a declaration on whether they are employed by the state or connected to any person employed by the state, which is prescribed in order to comply with Treasury Regulation 16A8.3.
39. Sufficient appropriate audit evidence could not be obtained that contracts and quotations were awarded to suppliers whose tax matters have been declared by the South African Revenue Services to be in order as required by Treasury Regulations 16A9.1(d) and the Preferential Procurement Regulations.
40. Goods and services of a transaction value above R500 000 were procured without inviting competitive bids, as required by Treasury Regulations 16A6.1. Deviations were approved by the accounting officer even though it was not impractical to invite competitive bids, in contravention of Treasury regulation 16A6.4.
41. Sufficient appropriate audit evidence could not be obtained that invitations for competitive bidding were advertised in the government tender bulletin, as required by Treasury Regulation 16A6.3(c).
42. Sufficient appropriate audit evidence could not be obtained that invitations for competitive bidding were advertised for a required minimum period, as required by Treasury Regulations 16A6.3(c).
43. Sufficient appropriate audit evidence could not be obtained that bid adjudication was done by committees which were composed in accordance with the policies of the (type of auditee), as required by Treasury Regulations 16A6.2 (a), (b) and (c).
44. Sufficient appropriate audit evidence could not be obtained that awards were only made to suppliers who submitted a declaration of past supply chain practices such as fraud, abuse of SCM system and non-performance, which is prescribed in order to comply with Treasury regulation 16A9.2.

ANNUAL REPORT 2017/18
Page - 192
ANNUAL REPORT 2017/18
Page - 192
45. Sufficient appropriate audit evidence could not be obtained that contracts were awarded only to bidders who submitted a declaration on whether they are employed by the state or connected to any person employed by the state, which is prescribed in order to comply with Treasury Regulation 16A8.3.
46. Sufficient appropriate audit evidence could not be obtained that contracts and quotations were awarded to bidders based on points given for criteria that were stipulated in the original invitation for bidding and quotations, as required by Treasury Regulations 16A6.3(a) and Preferential Procurement Regulations.
47. Sufficient appropriate audit evidence could not be obtained that the preference point system was applied in all procurement of goods and services above R30 000 as required by section 2(a) of the Preferential Procurement Policy Framework Act and Treasury Regulations 16A6.3(b).
48. Sufficient appropriate audit evidence could not be obtained that contracts and quotations were awarded to suppliers based on preference points that were allocated and calculated in accordance with the requirements of the Preferential Procurement Policy Framework Act and its regulations.
49. Sufficient appropriate audit evidence could not be obtained that contracts and quotations were awarded to bidders that scored the highest points in the evaluation process as required by section 2(1)(f ) of Preferential Procurement Policy Framework Act Preferential Procurement Regulations.
50. Sufficient appropriate audit evidence could not be obtained that contracts and quotations were awarded to bidders based on points given for criteria that were stipulated in the original invitation for bidding, in contravention of Preferential Procurement Regulation 4 the 2017 preferential procurement regulation 4(1) and 4(2).
51. Sufficient appropriate audit evidence could not be obtained that all extension or modification to contracts were approved by a properly delegated official as required by Treasury Regulation 8.1 and 8.2.
52. Some goods, works or service were not procured through a procurement process which is fair, equitable, transparent and competitive, as required by section 51(1)(a)(iii) of the PFMA.
53. Sufficient appropriate audit evidence could not be obtained that construction contracts were awarded to contractors that were registered with the Construction Industry Development Board (CIDB) in accordance with section 18(1) of the CIDB Act and CIDB regulations 17 and 25(7A).
54. Bid documentation for procurement of commodities designated for local content and production, did not stipulate the minimum threshold for local production and content as required by Preferential Procurement Regulation 9(1).
Other information
55. The accounting authority is responsible for the other information. The other information comprises the information included in the annual report, which includes the directors’ report, the audit committee’s report and the company secretary’s certificate as required by the Companies Act of South Africa, 2008 (Act No. 71 of 2008) (Companies Act). The other information does not include the consolidated and separate financial statements, the auditor’s report and those selected programmes presented in the annual performance report that have been specifically reported in this auditor’s report.
56. Our opinion on the financial statements and findings on the reported performance information and compliance with legislation do not cover the other information and we do not express an audit opinion or any form of assurance conclusion thereon.
57. In connection with our audit, our responsibility is to read the other information and, in doing so, consider whether the other information is materially inconsistent with the consolidated and separate financial statements and the selected programmes presented in the annual performance report, or our knowledge obtained in the audit, or otherwise appears to be materially misstated.
58. We did not receive the other information prior to the date of this auditor’s report. After we receive and read this information, and if we conclude that there is a material misstatement, we are required to communicate the matter to those charged with governance and request that the other information be corrected. If the other information is not corrected, we may have to retract this auditor’s report and re-issue an amended report as appropriate. However, if it is corrected this will not be necessary.
Internal control deficiencies
59. We considered internal control relevant to our audit of the consolidated and separate financial statements, reported performance information and compliance with applicable legislation; however, our objective was not to express any form of assurance on it. The matters reported below are limited to the significant internal control deficiencies that resulted in the basis for the qualified opinion, the findings on the annual performance report and the findings on compliance with legislation included in this report.
ANNUAL REPORT 2017/18
Page - 193
ANNUAL REPORT 2017/18
Page - 193
Financial and performance management 60. Management did not implement proper record keeping in a timely manner to ensure that complete, relevant and accurate
information is accessible and available to support financial and performance reporting.61. Management did not prepare regular, accurate and complete financial and performance reports that are supported and evidenced
by reliable information.62. Management did not review and monitor compliance with applicable laws and regulations
Other reports
63. I draw attention to the following engagements conducted by various parties that had, or could have, an impact on the matters reported in the public entity’s financial statements, reported performance information, compliance with applicable legislation and other related matters. Their related reports did not form part of our opinion on the financial statements or our findings on the reported performance information or compliance with legislation.
Investigations of the alleged procurement irregularities and misconduct.
64. Management has instituted an investigation on the alleged procurement irregularities and other acts of misconduct. Deloitte has been appointed to conduct the investigations and give a report on the findings. As at the reporting date, the investigations were still ongoing.
Auditor tenure
65. In terms of the IRBA rule published in Government Gazette Number 39475 dated 4 December 2015, we report that SNG Grant Thornton has been the auditor of National Health Laboratory Service for 10 years.
...................................................................................................Auditor’s signatureNeridha Moodley Director Registered Auditor 20 September 2018 20 Morris Street East , Woodmead, 2191

ANNUAL REPORT 2017/18
Page - 194
ANNUAL REPORT 2017/18
Page - 194
Economic entity Controlling entity
Notes2018R ‘000
2017Restated*
R ‘0002018R ‘000
2017Restated*
R ‘000
Assets
Current Assets
Inventories 3 124,412 116,843 118,172 112,557
Receivables from exchange transactions 4 2,219,090 1,639,650 2,217,101 1,636,923
Receivables from non-exchange transactions 6 234,348 97,253 234,348 97,253
Cash and cash equivalents 7 1,119,144 391,976 1,114,456 389,919
3,696,994 2,245,722 3,684,077 2,236,652
Non-Current Assets
Property, plant and equipment 8 1,222,649 1,162,393 1,182,095 1,124,134
Intangible assets 9 34,582 78,009 34,582 78,009
1,257,231 1,240,402 1,216,677 1,202,143
Total Assets 4,954,225 3,486,124 4,900,754 3,438,795
Liabilities
Current Liabilities
Other financial liabilities 12 23,306 45,747 23,306 45,747
Current tax payable 821 475 - -
Finance lease obligation 13 15,197 13,310 15,197 13,310
Payables from exchange transactions 14 1,007,731 961,893 1,005,944 960,529
Employee benefit obligation 15 26,480 23,556 26,480 23,556
Unspent conditional grants and receipts 16 20,316 12,252 20,316 12,252
Provisions 17 853,841 713,946 853,841 713,946
1,947,692 1,771,179 1,945,084 1,769,340
Non-Current Liabilities
Other financial liabilities 12 13,940 40,083 13,940 40,083
Finance lease obligation 13 55,124 68,241 55,124 68,241
Employee benefit obligation 15 973,554 999,123 973,554 999,123
Deferred tax 18 10,914 10,234 - -
1,053,532 1,117,681 1,042,618 1,107,447
Total Liabilities 3,001,224 2,888,860 2,987,702 2,876,787
Net Assets 1,953,001 597,264 1,913,052 562,008
Contributed capital 19 332 332 332 332
Reserves
Revaluation reserve 20 688,071 597,297 648,326 560,947
Accumulated surplus / (deficit) 1,264,598 (365) 1,264,394 729
Total Net Assets 1,953,001 597,264 1,913,052 562,008
STATEMENT OF FINANCIAL POSITION AS AT 31 MARCH 2018

ANNUAL REPORT 2017/18
Page - 195
ANNUAL REPORT 2017/18
Page - 195
Notes
Economic entity Controlling entity
2018R’000
2017Restated*
R’0002018R’000
2017Restated*
R’000
Revenue 21 7, 915,877 7,094,905 7,894,314 7,072,370
Cost of sales 22 (6,277,601) (5,832,752) (6,258,775) (5,813,624)
Gross surplus 1,638,276 1,262,153 1,635,539 1,258,746
Other income 23 327,041 269,119 327,040 269,117
Operating expenses (by function) (748,158) (3,560,289) (747,921) (3,557,202)
Operating surplus (deficit) 24 1,217,159 (2,029,017) 1,214,658 (2,029,339)
Investment income 25 102 936 153 866 102 595 153 649
Fair value adjustments 22 – – –
Finance costs 26 (16,098) (23,764) (15,973) (23,764)
Surplus (deficit) before taxation 1,304,019 (1,898,915) 1,301,280 (1,899,454)
Taxation 27 (1,444) (11,252) – –
Surplus (deficit) for the year 1,302,575 (1,910,167) 1,301,280 (1,899,454)
STATEMENT OF FINANCIAL PERFORMANCE

ANNUAL REPORT 2017/18
Page - 196
ANNUAL REPORT 2017/18
Page - 196
Contributed capitalR’000
RevaluationreserveR’000
Accumulatedsurplus (deficit)
R’000
Total netassetsR’000
Economic entity
Opening balance as previously reportedAdjustmentsPrior year adjustments
332
-
-
-
1,869,822
39,980
1,870,154
39,980
Balance at 1 April 2016 as restated*Changes in net assetsRevaluation of land and buildings
332
-
-
597,297
1,909,802
-
1,910,134
597,297
Net income (losses) recognised directly in net assets - 597,297 - 597,297
Deficit for the year - - (1,910,167) (1,910,167)
Total recognised income and expenses for the year - 597,297 (1,910,167) (1,312,870)
Total changes - 597,297 (1,910,167) (1,312,870)
Opening balance as previously reportedAdjustmentsCorrection of errors
332
-
597,297
-
(365)
(37,612)
597,264
(37,612)
Restated* Balance at 1 April 2017 as restated*Changes in net assets Revaluation of land and buildings
332
-
597,297
90,774
(37,977)
-
559,652
90,774
Net income (losses) recognised directly in net assets - 90,774 - 90,774
Surplus for the year - - 1,302,575 1,302,575
Total recognised income and expenses for the year - 90,774 1,302,575 1,393,349
Total changes - 90,774 1,302,575 1,393,349
Balance at 31 March 2018 332 688,071 1,264,598 1,953,001
Notes 19 20
Controlling entity
Opening balance as previously reportedAdjustmentsPrior year adjustments
332
-
-
-
1,860,172
40,011
1,860,504
40,011
Balance at 1 April 2016 as restated*Changes in net assets Revaluation of land and buildings
332
-
-
560,947
1,900,183
-
1,900,515
560,947
Net income (losses) recognised directly in net assets - 560,947 - 560,947
Deficit for the year - - (1,899,454) (1,899,454)
Total recognised income and expenses for the year - 560,947 (1,899,454) (1,338,507)
Total changes - 560,947 (1,899,454) (1,338,507)
Opening balance as previously reportedAdjustmentsCorrection of errors
332
-
560,947
-
729
(37,615)
562,008
(37,615)
Restated* Balance at 1 April 2017 as restated*Changes in net assetsRevaluation of land and buildings
332
-
560,947
87,379
(36,886)
-
524,393
87,379
Net income (losses) recognised directly in net assets - 87,379 - 87,379
Surplus for the year - - 1,313,631 1,313,631
Total recognised income and expenses for the year - 87,379 1,301,280 1,388,659
Total changes - 87,379 1,301,280 1,388,659
Balance at 31 March 2018 332 648,326 1,264,394 1,913,052
Notes 19 20
STATEMENT OF CHANGES IN NET ASSETS FOR THE YEAR ENDED 31 MARCH 2018
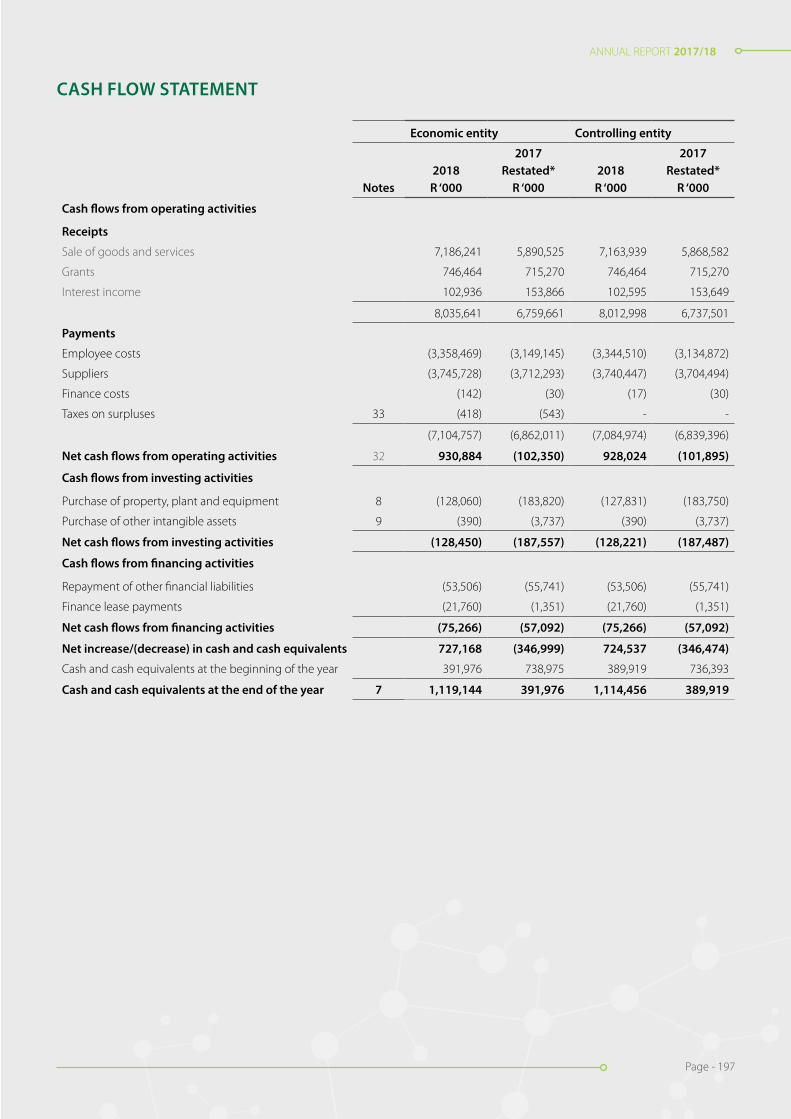
ANNUAL REPORT 2017/18
Page - 197
ANNUAL REPORT 2017/18
Page - 197
Economic entity Controlling entity
Notes2018R ‘000
2017Restated*
R ‘0002018R ‘000
2017Restated*
R ‘000
Cash flows from operating activities
Receipts
Sale of goods and services 7,186,241 5,890,525 7,163,939 5,868,582
Grants 746,464 715,270 746,464 715,270
Interest income 102,936 153,866 102,595 153,649
8,035,641 6,759,661 8,012,998 6,737,501
Payments
Employee costs (3,358,469) (3,149,145) (3,344,510) (3,134,872)
Suppliers (3,745,728) (3,712,293) (3,740,447) (3,704,494)
Finance costs (142) (30) (17) (30)
Taxes on surpluses 33 (418) (543) - -
(7,104,757) (6,862,011) (7,084,974) (6,839,396)
Net cash flows from operating activities 32 930,884 (102,350) 928,024 (101,895)
Cash flows from investing activities
Purchase of property, plant and equipment 8 (128,060) (183,820) (127,831) (183,750)
Purchase of other intangible assets 9 (390) (3,737) (390) (3,737)
Net cash flows from investing activities (128,450) (187,557) (128,221) (187,487)
Cash flows from financing activities
Repayment of other financial liabilities (53,506) (55,741) (53,506) (55,741)
Finance lease payments (21,760) (1,351) (21,760) (1,351)
Net cash flows from financing activities (75,266) (57,092) (75,266) (57,092)
Net increase/(decrease) in cash and cash equivalents 727,168 (346,999) 724,537 (346,474)
Cash and cash equivalents at the beginning of the year 391,976 738,975 389,919 736,393
Cash and cash equivalents at the end of the year 7 1,119,144 391,976 1,114,456 389,919
CASH FLOW STATEMENT

ANNUAL REPORT 2017/18
Page - 198
ANNUAL REPORT 2017/18
Page - 198
Budget on Accrual Basis
Approved budgetR ‘000
Adjustments R ‘000
Final BudgetR ‘000
Actual amounts on comparable
basisR ‘000
Difference between final
budget and actualR ‘000 Reference
Economic entity
Statement of Financial Performance
Revenue
Revenue from exchange transactionsSale of goods 22,185 - 22,185 21,563 (622)
Rendering of services 6,847,266 - 6,847,266 7,076,656 229,390 45.1
Miscellaneous other revenue 6,166 - 6,166 71,194 65,028 45.2
Grant income recognised - - - 264,554 264,554 45.3
Royalties received 389 - 389 408 19
Discount received 1,507 - 1,507 1,134 (373)
Recoveries 4,948 - 4,948 11,707 6,759 45.4
Teaching Income 53,251 - 53,251 45,172 (8,079) 45.5
Sundry income 21,563 - 21,563 690 (20,873) 45.6
Interest received 89,400 - 89,400 102,936 13,536 45.7
Total revenue from exchangetransactions 7,046,675 - 7,046,675 7,596,014 549,339
Revenue from non-exchange transactions
Transfer revenueGovernment grants & subsidies 748,803 - 748,803 746,464 (2,339)
Total revenue 7,795,478 - 7,795,478 8,354,829 559,351
ExpenditurePersonnel (3,867,561) - (3,867,561) (3,326,192) 541,369 45.8
Depreciation and amortisation (111,994) - (111,994) (192,769) (80,775) 45.9
Finance costs (1) - (1) (16,098) (16,097) 45.10
Lease rentals on operating lease (48,569) - (48,569) (60,266) (11,697) 45.11
Debt Impairment (31,393) - (31,393) 270,688 302,081 45.12
General Expenses (3,463,231) - (3,463,231) (3,710,641) (247,410) 45.13
Total expenditure (7,522,749) - (7,522,749) (7,035,153) 487,471
Operating surplus 272,729 - 272,729 1,307,200 1,034,471
Loss on disposal of assets and (206) - (206) (6,579) (6,373) 45.14
liabilitiesGain on foreign exchange - - - 3,376 3,376 45.15
Fair value adjustments - - - 22 22
(206) - (206) (3,181) (2,975)
Surplus before taxation 272,523 - 272,523 1,304,019 1,031,496
Taxation - - - 1,444 1,444
Actual Amount on ComparableBasis as Presented in theBudget and Actual Comparative Statement 272,523 - 272,523 1,302,575 1,030,052
STATEMENT OF COMPARISON OF BUDGET AND ACTUAL AMOUNTS

ANNUAL REPORT 2017/18
Page - 199
ANNUAL REPORT 2017/18
Page - 199
ACCOUNTING POLICIES
1. Presentation of Audited Group Annual Financial Statements
The audited group annual financial statements have been prepared in accordance with the Standards of Generally Recognised Account-ing Practice (GRAP), issued by the Accounting Standards Board in accordance with Section 91(1) of the Public Finance Management Act (Act 1 of 1999).
These audited group annual financial statements have been prepared on an accrual basis of accounting and are in accordance with historical cost convention as the basis of measurement, unless specified otherwise. They are presented in South African Rand.
A summary of the significant accounting policies, which have been consistently applied in the preparation of these audited group annual financial statements, are disclosed below.
These accounting policies are consistent with the previous period, except for the changes set out in the Changes in account-ing policy note.
1.1 Presentation currency
These audited group annual financial statements are presented in South African Rand, which is the functional currency of the economic entity and all values are rounded to the nearest thousand (R000), except when otherwise indicated.
1.2 Going concern assumption
These audited group annual financial statements have been prepared based on the expectation that the economic entity will continue to operate as a going concern for at least the next 12 months.
1.3 Consolidation
Basis of consolidation
Consolidated audited group annual financial statements are the audited group annual financial statements of the economic entity pre-sented as those of a single entity.
The consolidated audited group annual financial statements incorporate the audited separate annual financial statements of the National Health Laboratory Service (NHLS) as the controlling entity and those of controlled entity, the South African Vaccine Producers (Pty) Ltd (SAVP).
Consolidated audited group annual financial statements are prepared using uniform accounting policies for like transactions and other events in similar circumstances.
Control exists when the controlling entity has the power to govern the financial and operating policies of another entity so as to obtain benefits from its activities.
The revenue and expenses of the SAVP are included in the consolidated audited group annual financial statements from the transfer date or acquisition date as defined in the Standards of GRAP on Transfer of functions between entities under common control. The revenue and expenses of the SAVP are based on the values of the assets and liabilities recognised in the controlling entity’s audited group annual financial statements at the acquisition date.
The separate annual financial statements of the NHLS and those of the SAVP used in the preparation of the consolidated audited group annual financial statements are prepared as of the same date.
All intra-entity transactions, balances, revenues and expenses are eliminated in full on consolidation.
ANNUAL REPORT 2017/18
Page - 200
ANNUAL REPORT 2017/18
Page - 200
1.4 Significant judgements and sources of estimation uncertainty
In preparing the audited group annual financial statements, management is required to make estimates and assumptions that affect the amounts represented in the audited group annual financial statements and related disclosures. Use of available information and the application of judgement is inherent in the formation of estimates. Actual results in the future could differ from these estimateswhich may be material to the audited group annual financial statements. Significant Judgements include:
Trade and other receivables
The economic entity assesses its trade and other receivables for impairment at the end of each reporting period. In determining whether an impairment loss should be recorded in surplus or deficit, the economic entity makes Judgements as to whether there is observable data indicating a measurable decrease in the estimated future cash flows from a financial asset.
The impairment for trade and other receivables is calculated on a individual basis for major customers (others are grouped on a portfolio basis), based on historical loss ratios, adjusted for national and industry-specific economic conditions and other indicators present at the reporting date that correlate with defaults on the customer. These annual loss ratios are applied to loan balance of the customer or the portfolio and scaled to the estimated loss emergence period.
The impairment is measured as the difference between the debtors carrying amount and the present value of estimated future cash flows discounted at the effective interest rate, computed at initial recognition.
Allowance for slow moving, damaged and obsolete stock
An allowance for stock to write stock down to the lower of cost or net realisable value. Management have made estimates of the selling price and direct cost to sell on certain inventory items. The write down is included in the operation surplus note.
Impairment testing
The recoverable amounts of cash-generating units and individual assets are determined based on the higher of value-in-use calculations and fair values less costs to sell. These calculations require the use of estimates and assumptions. It is reasonably possible that the key assumptions may change which may then impact our estimations and may then require a material adjustment to the carrying value of tangible assets.
The economic entity reviews and tests the carrying value of assets when events or changes in circumstances suggest that the carrying amount may not be recoverable. Assets are grouped at the lowest level for which identifiable cash flows are largely independent of cash flows of other assets and liabilities. If there are indications that impairment may have occurred, estimates are prepared of expected fu-ture cash flows for each group of assets. Expected future cash flows used to determine the value in use of tangible assets are inherently uncertain and could materially change over time. They are significantly affected by a number of factors including including production estimates, together with economic factors such as exchange rates, inflation rates and interest rates.
Provisions
Provisions were raised and management determined an estimate based on the information available. Additional disclosure of these estimates of provisions is included in note 17 - Provisions.
Useful lives of property, plant and equipment
The economic entity’s management determines the estimated useful lives and related depreciation charges for property, plant and equipment. This estimate is based on industry norm. Management will increase the depreciation charge where useful lives are less than previously estimated useful lives.
ACCOUNTING POLICIES

ANNUAL REPORT 2017/18
Page - 201
ANNUAL REPORT 2017/18
Page - 201
1.4 Significant judgements and sources of estimation uncertainty (continued)
Post-retirement benefits
The present value of the post retirement obligation depends on a number of factors that are determined on an actuarial basis using a number of assumptions. The assumptions used in determining the net cost (income) include the discount rate, healthcare cost inflation, expected retirement age and withdrawal rate. Any changes in these assumptions will impact on the carrying amount of post retirement obligations.
The economic entity determines the appropriate discount rate at the end of each year. This is the interest rate that should be used to determine the present value of estimated future cash outflows expected to be required to settle the medical obligations. In determining the appropriate discount rate, the economic entity considers the interest rates of high-quality government bonds that are denominated in the currency in which the benefits will be paid, and that have terms to maturity approximating the terms of the related medical liability.
Other key assumptions for medical obligations are based on current market conditions. Additional information is disclosed in Note 15.
1.5 Property, plant and equipment
Property, plant and equipment are tangible non-current assets (including infrastructure assets) that are held for use in the production or supply of goods or services, rental to others, or for administrative purposes, and are expected to be used during more than one period.
The cost of an item of property, plant and equipment is recognised as an asset when:
• it is probable that future economic benefits or service potential associated with the item will flow to the economic entity; and• the cost of the item can be measured reliably.
Property, plant and equipment is initially measured at cost.
The cost of an item of property, plant and equipment is the purchase price and other costs attributable to bring the asset to the location and condition necessary for it to be capable of operating in the manner intended by management. Trade discounts and rebates are deducted in arriving at the cost.
Where an asset is acquired through a non-exchange transaction, its cost is its fair value as at date of acquisition.
Where an item of property, plant and equipment is acquired in exchange for a non-monetary asset or monetary assets, or a combination of monetary and non-monetary assets, the asset acquired is initially measured at fair value (the cost). If the acquired item’s fair value was not determinable, it’s deemed cost is the carrying amount of the asset(s) given up.
When significant components of an item of property, plant and equipment have different useful lives, they are accounted for as separate items (major components) of property, plant and equipment.
Costs include costs incurred initially to acquire an item of property, plant and equipment and costs incurred subsequently to add to, replace part of, or service it. If a replacement cost is recognised in the carrying amount of an item of property, plant and equipment, the carrying amount of the replaced part is derecognised.
Recognition of costs in the carrying amount of an item of property, plant and equipment ceases when the item is in the location and condition necessary for it to be capable of operating in the manner intended by management.
Items such as spare parts, standby equipment and servicing equipment are recognised when they meet the definition of property, plant and equipment.
ACCOUNTING POLICIES
ANNUAL REPORT 2017/18
Page - 202
ANNUAL REPORT 2017/18
Page - 202
Major inspection costs which are a condition of continuing use of an item of property, plant and equipment and which meet the recog-nition criteria above are included as a replacement in the cost of the item of property, plant and equipment. Any remaining inspection costs from the previous inspection are derecognised.
Property, plant and equipment is subsequently carried at cost less accumulated depreciation and any impairment losses except for land and buildings. Buildings are carried at revalued amount being the fair value at the date of revaluation less any subsequent accumulated depreciation and subsequent accumulated impairment losses. Land is not depreciated but carried at revalued amount less accumulated impairment losses.
Revaluations are made with sufficient regularity such that the carrying amount does not differ materially from that which would be determined using fair value at the end of the reporting period.
When an item of property, plant and equipment is revalued, any accumulated depreciation at the date of the revaluation is eliminated against the gross carrying amount of the asset and the net amount restated to the revalued amount of the asset.
Any increase in an asset’s carrying amount, as a result of a revaluation, is credited directly to a revaluation surplus. The increase is recognised in surplus or deficit to the extent that it reverses a revaluation decrease of the same asset previously recognised in surplus or deficit.
Any decrease in an asset’s carrying amount, as a result of a revaluation, is recognised in surplus or deficit in the current period. The decrease is debited directly to a revaluation surplus to the extent of any credit balance existing in the revaluation surplus in respect of that asset.
The revaluation surplus in equity related to a specific item of property, plant and equipment is transferred directly to retained earnings when the asset is derecognised.
Property, plant and equipment are depreciated on the straight line basis over their expected useful lives to their estimated residual value.
Sheep and horses that are used for research purposes are initially measured at cost and subsequently carried at cost less any accumulat-ed depreciation and any accumulated impairment losses.
The useful lives of items of property, plant and equipment have been assessed as follows:
Item Depreciation method Average useful life
Buildings Straight line 30 - 52 years
Laboratory equipment Straight line 4 - 10 years
Plant and machinery Straight line 5 years
Furniture and fixtures Straight line 10 – 20 years
Motor vehicles Straight line 5 years
Office equipment Straight line 3 – 10 years
Computer equipment Straight line 3 - 5 years
Leasehold improvements Straight line 5 - 8 years
Mobile units Straight line 6 – 10 years
Buildings - air systems Straight line 5 years
Sheep Straight line 5 years
Horses Straight line 15 years
ACCOUNTING POLICIES
1.5 Property, plant and equipment (continued)
ANNUAL REPORT 2017/18
Page - 203
ANNUAL REPORT 2017/18
Page - 203
The depreciable amount of an asset is allocated on a systematic basis over its useful life.
Each part of an item of property, plant and equipment with a cost that is significant in relation to the total cost of the item is depreciated separately.
The depreciation method used reflects the pattern in which the asset’s future economic benefits or service potential are expected to be consumed by the economic entity. The depreciation method applied to an asset is reviewed at least at each reporting date and, if there has been a significant change in the expected pattern of consumption of the future economic benefits or service potential embodied in the asset, the method is changed to reflect the changed pattern. Such a change is accounted for as a change in an accounting estimate.
The economic entity assesses at each reporting date whether there is any indication that the economic entity expectations about the residual value and the useful life of an asset have changed since the preceding reporting date. If any such indication exists, the economic entity revises the expected useful life and/or residual value accordingly. The change is accounted for as a change in an accounting estimate.
The depreciation charge for each period is recognised in surplus or deficit unless it is included in the carrying amount of inventory.
Items of property, plant and equipment are derecognised when the asset is disposed of or when there are no further economic benefits or service potential expected from the use of the asset.
The gain or loss arising from the derecognition of an item of property, plant and equipment is included in surplus or deficit when the item is derecognised. The gain or loss arising from the derecognition of an item of property, plant and equipment is determined as the difference between the net disposal proceeds, if any, and the carrying amount of the item.
The economic entity separately discloses expenditure to repair and maintain property, plant and equipment in the notes to the financial statements (see note 8).
1.6 Intangible assets
An intangible asset is identifiable if it either:
• is separable, i.e. is capable of being separated or divided from an entity and sold, transferred, licensed, rented or exchanged, either individually or together with a related contract, identifiable assets or liability, regardless of whether the entity intends to do so; or
• arises from binding arrangements (including rights from contracts), regardless of whether those rights are transferable or separable from the economic entity or from other rights and obligations.
A binding arrangement describes an arrangement that confers similar rights and obligations on the parties to it as if it were in the form of a contract.
An intangible asset is recognised when:
• it is probable that the expected future economic benefits or service potential that are attributable to the asset will flow to the economic entity; and
• the cost or fair value of the asset can be measured reliably.
The economic entity assesses the probability of expected future economic benefits or service potential using reasonable and supportable assumptions that represent management’s best estimate of the set of economic conditions that will exist over the useful life of the asset.
ACCOUNTING POLICIES
1.5 Property, plant and equipment (continued)
ANNUAL REPORT 2017/18
Page - 204
ANNUAL REPORT 2017/18
Page - 204
Where an intangible asset is acquired through a non-exchange transaction, its initial cost at the date of acquisition is measured at its fair value as at that date.
Intangible assets are carried at cost less any accumulated amortisation and any impairment losses.
The amortisation period and the amortisation method for intangible assets are reviewed at each reporting date. Amortisation is provided to write down the intangible assets, on a straight line basis, to their residual values as follows:
Item Depreciation method Average useful life
Patents Straight line 20 years
Computer software Straight line 5 - 10 years
Intangible assets are derecognised:
• on disposal; or• when no future economic benefits or service potential are expected from its use or disposal.
The gain or loss arising from the derecognition of intangible assets is included in surplus or deficit when the asset is derecognised.
1.7 Investments in controlled entities
Economic entity audited group annual financial statementsInvestments in controlled entities are consolidated in the economic entity audited group annual financial statements. Refer to the accounting policy on Consolidations (Note 1.3).
Controlling entity audited group annual financial statementsIn the controlling entity’s separate audited group annual financial statements, investments in investments in controlled entities are carried at cost.
1.8 Financial instruments
A financial instrument is any contract that gives rise to a financial asset of one entity and a financial liability or a residual interest of another entity.
The amortised cost of a financial asset or financial liability is the amount at which the financial asset or financial liability is measured at initial recognition minus principal repayments, plus or minus the cumulative amortisation using the effective interest method of any difference between that initial amount and the maturity amount, and minus any reduction (directly or through the use of an allowance account) for impairment or uncollectibility.
Credit risk is the risk that one party to a financial instrument will cause a financial loss for the other party by failing to discharge an obligation.
Currency risk is the risk that the fair value or future cash flows of a financial instrument will fluctuate because of changes in foreign exchange rates.
ACCOUNTING POLICIES
1.5 Property, plant and equipment (continued)
ANNUAL REPORT 2017/18
Page - 205
ANNUAL REPORT 2017/18
Page - 205
Derecognition is the removal of a previously recognised financial asset or financial liability from an entity’s statement of financial position.
The effective interest method is a method of calculating the amortised cost of a financial asset or a financial liability (or group of financial assets or financial liabilities) and of allocating the interest income or interest expense over the relevant period. The effective interest rate is the rate that exactly discounts estimated future cash payments or receipts through the expected life of the financial instrument or, when appropriate, a shorter period to the net carrying amount of the financial asset or financial liability. When calculating the effective interest rate, an entity estimates cash flows considering all contractual terms of the financial instrument but does not consider future credit losses. The calculation includes all fees and points paid or received between parties to the contract that are an integral part of the effective interest rate, transaction costs, and all other premiums or discounts. In cases when it is not possible to reliably estimate the cash flows or the expected life of a financial instrument (or group of financial instruments), the entity uses the contractual cash flows over the full contractual term of the financial instrument (or group of financial instruments).
Fair value is the amount for which an asset could be exchanged, or a liability settled, between knowledgeable willing parties in an arm’s length transaction.
A financial asset is:
• cash;• a residual interest of another entity; or• a contractual right to:
» receive cash or another financial asset from another entity; or » exchange financial assets or financial liabilities with another entity under conditions that are potentially favourable to the entity.
A financial liability is any liability that is a contractual obligation to:
• deliver cash or another financial asset to another entity; or• exchange financial assets or financial liabilities under conditions that are potentially unfavourable to the entity.
Interest rate risk is the risk that the fair value or future cash flows of a financial instrument will fluctuate because of changes in market interest rates.
Liquidity risk is the risk encountered by an entity in the event of difficulty in meeting obligations associated with financial liabilities that are settled by delivering cash or another financial asset.
Loans payable are financial liabilities, other than short-term payables on normal credit terms.
Market risk is the risk that the fair value or future cash flows of a financial instrument will fluctuate because of changes in market prices. Market risk comprises three types of risk: currency risk, interest rate risk and other price risk.
Other price risk is the risk that the fair value or future cash flows of a financial instrument will fluctuate because of changes in market prices (other than those arising from interest rate risk or currency risk), whether those changes are caused by factors specific to the individual financial instrument or its issuer, or factors affecting all similar financial instruments traded in the market.
A financial asset is past due when a counterparty has failed to make a payment when contractually due.
Transaction costs are incremental costs that are directly attributable to the acquisition, issue or disposal of a financial asset or financial liability. An incremental cost is one that would not have been incurred if the entity had not acquired, issued or disposed of the financial instrument.
ACCOUNTING POLICIES
1.6 Intangible assets (continued)
ANNUAL REPORT 2017/18
Page - 206
ANNUAL REPORT 2017/18
Page - 206
Financial instruments at amortised cost are non-derivative financial assets or non-derivative financial liabilities that have fixed or determinable payments, excluding those instruments that:
• the entity designates at fair value at initial recognition; or• are held for trading.
Financial instruments at cost are investments in residual interests that do not have a quoted market price in an active market, and whose fair value cannot be reliably measured.
Classification
The economic entity has the following types of financial assets (classes and category) as reflected on the face of the statement of financial position or in the notes thereto:
Class Category
Trade and other receivables Financial asset measured at amortised cost
Cash and cash equivalents Financial asset measured at amortised cost
The economic entity has the following types of financial liabilities (classes and category) as reflected on the face of the state-ment of financial position or in the notes thereto:
Class Category
Trade and other payables Financial liability measured at amortised cost
Finance lease obligation Financial liability measured at amortised cost
Other financial liabilities Financial liability measured at amortised cost
Initial recognition
The economic entity recognises a financial asset or a financial liability in its statement of financial position when the it becomes a party to the contractual provisions of the instrument.
The economic entity recognises financial assets using trade date accounting.
Initial measurement of financial assets and financial liabilities
The economic entity measures a financial asset and financial liability initially at its fair value plus transaction costs that are directly attributable to the acquisition or issue of the financial asset or financial liability.
Subsequent measurement of financial assets and financial liabilities
The economic entity measures all financial assets and financial liabilities after initial recognition using the following categories:
• Financial instruments at amortised cost.• Financial instruments at cost.
All financial assets measured at amortised cost, or cost, are subject to an impairment review.
ACCOUNTING POLICIES
1.8 Financial instruments (continued)
ANNUAL REPORT 2017/18
Page - 207
ANNUAL REPORT 2017/18
Page - 207
Gains and losses
For financial assets and financial liabilities measured at amortised cost or cost, a gain or loss is recognised in surplus or deficit when the financial asset or financial liability is derecognised or impaired, or through the amortisation process.
Impairment and uncollectibility of financial assets
The economic entity assesses at the end of each reporting period whether there is any objective evidence that a financial asset or group of financial assets is impaired.
Financial assets measured at amortised cost:
If there is objective evidence that an impairment loss on financial assets measured at amortised cost has been incurred, the amount of the loss is measured as the difference between the asset’s carrying amount and the present value of estimated future cash flows (ex-cluding future credit losses that have not been incurred) discounted at the financial asset’s original effective interest rate. The carrying amount of the asset is reduced through the use of an allowance account. The amount of the loss is recognised in surplus or deficit.
If, in a subsequent period, the amount of the impairment loss decreases and the decrease can be related objectively to an event occur-ring after the impairment was recognised, the previously recognised impairment loss is reversed by adjusting an allowance account. The reversal does not result in a carrying amount of the financial asset that exceeds what the amortised cost would have been had the impairment not been recognised at the date the impairment is reversed. The amount of the reversal is recognised in surplus or deficit.
Financial assets measured at cost:
If there is objective evidence that an impairment loss has been incurred on an investment in a residual interest that is not measured at fair value because its fair value cannot be measured reliably, the amount of the impairment loss is measured as the difference between the carrying amount of the financial asset and the present value of estimated future cash flows discounted at the current market rate of return for a similar financial asset. Such impairment losses are not reversed.
Derecognition
Financial assets
The economic entity derecognises financial assets using trade date accounting.
The economic entity derecognises a financial asset only when:
• the contractual rights to the cash flows from the financial asset expire, are settled or waived;• the economic entity transfers to another party substantially all of the risks and rewards of ownership of the financial asset; or• the economic entity, despite having retained some significant risks and rewards of ownership of the financial asset, has transferred
control of the asset to another party and the other party has the practical ability to sell the asset in its entirety to an unrelated third party, and is able to exercise that ability unilaterally and without needing to impose additional restrictions on the transfer. In this case, the economic entity: » derecognise the asset; and » recognise separately any rights and obligations created or retained in the transfer.
The carrying amounts of the transferred asset are allocated between the rights or obligations retained and those transferred on the basis of their relative fair values at the transfer date. Newly created rights and obligations are measured at their fair values at that date. Any difference between the consideration received and the amounts recognised and derecognised is recognised in surplus or deficit in the period of the transfer.
ACCOUNTING POLICIES
1.8 Financial instruments (continued)
ANNUAL REPORT 2017/18
Page - 208
ANNUAL REPORT 2017/18
Page - 208
If the economic entity transfers a financial asset in a transfer that qualifies for derecognition in its entirety and retains the right to service the financial asset for a fee, it recognise either a servicing asset or a servicing liability for that servicing contract. If the fee to be received is not expected to compensate the entity adequately for performing the servicing, a servicing liability for the servicing obligation is rec-ognised at its fair value. If the fee to be received is expected to be more than adequate compensation for the servicing, a servicing asset is recognised for the servicing right at an amount determined on the basis of an allocation of the carrying amount of the larger financial asset.
If, as a result of a transfer, a financial asset is derecognised in its entirety but the transfer results in the entity obtaining a new financial asset or assuming a new financial liability, or a servicing liability, the entity recognise the new financial asset, financial liability or servicing liability at fair value.
On derecognition of a financial asset in its entirety, the difference between the carrying amount and the sum of the consideration re-ceived is recognised in surplus or deficit.
If the transferred asset is part of a larger financial asset and the part transferred qualifies for derecognition in its entirety, the previ-ous carrying amount of the larger financial asset is allocated between the part that continues to be recognised and the part that is derecognised, based on the relative fair values of those parts, on the date of the transfer. For this purpose, a retained servicing asset is treated as a part that continues to be recognised. The difference between the carrying amount allocated to the part derecognised and the sum of the consideration received for the part derecognised is recognised in surplus or deficit.
If a transfer does not result in derecognition because the economic entity has retained substantially all the risks and rewards of ownership of the transferred asset, the economic entity continues to recognise the transferred asset in its entirety and recognise a financial liability for the consideration received. In subsequent periods, the economic entity recognises any revenue on the transferred asset and any expense incurred on the financial liability. Neither the asset, and the associated liability nor the revenue, and the associated expenses are offset.
Financial liabilities
The economic entity removes a financial liability (or a part of a financial liability) from its statement of financial position when it is extin-guished — i.e. when the obligation specified in the contract is discharged, cancelled, expires or waived.
An exchange between an existing borrower and lender of debt instruments with substantially different terms is accounted for as having extinguished the original financial liability and a new financial liability is recognised. Similarly, a substantial modifi-cation of the terms of an existing financial liability or a part of it is accounted for as having extinguished the original financial liability and having recognised a new financial liability.
The difference between the carrying amount of a financial liability (or part of a financial liability) extinguished or transferred to another party and the consideration paid, including any non-cash assets transferred or liabilities assumed, is recognised in surplus or deficit. Any liabilities that are waived, forgiven or assumed by another entity by way of a non-exchange transaction are accounted for in accordance with the Standard of GRAP on Revenue from Non-exchange Transactions (Taxes and Transfers).
Presentation
Interest relating to a financial instrument or a component that is a financial liability is recognised as revenue or expense in surplus or deficit.
Losses and gains relating to a financial instrument or a component that is a financial liability is recognised as revenue or expense in surplus or deficit.
ACCOUNTING POLICIES
1.8 Financial instruments (continued)

ANNUAL REPORT 2017/18
Page - 209
ANNUAL REPORT 2017/18
Page - 209
A financial asset and a financial liability are only offset and the net amount presented in the statement of financial position when the economic entity currently has a legally enforceable right to set off the recognised amounts and intends either to settle on a net basis, or to realise the asset and settle the liability simultaneously.
In accounting for a transfer of a financial asset that does not qualify for derecognition, the economic entity does not offset the transferred asset and the associated liability.
Loans from economic entities
These include loans to and from controlling entities and controlled entity, are recognised initially at fair value plus direct transaction costs.
Loans from economic entities are classified as financial liabilities measured at amortised cost.
Receivables from exchange transactions
Trade receivables are measured at initially measured at fair value plus or minus transaction costs, and are subsequently measured at amortised cost using the effective interest rate method. Appropriate allowances for debt for estimated irrecoverable amounts are recognised in surplus or deficit when there is objective evidence that the asset is impaired. Significant financial difficulties of the debtor, probability that the debtor will enter bankruptcy or financial reorganisation, and default or delinquency in payments (more than 30 days overdue) are considered indicators that the trade receivable is impaired. The allowance recognised is measured as the difference between the asset’s carrying amount and the present value of estimated future cash flows discounted at the effective interest rate computed at initial recognition.
The carrying amount of the asset is reduced through the use of an allowance account, and the amount of the deficit is recognised in surplus or deficit within operating expenses. When a trade receivable is uncollectible, it is written off against the allowance account for trade receivables. Subsequent recoveries of amounts previously written off are credited against operating expenses in surplus or deficit.
Payables from exchange transactions
Trade payables are initially measured at fair value added to or subtracted from transaction costs, and are subsequently measured at amortised cost, using the effective interest rate method.
Cash and cash equivalents
Cash and cash equivalents comprise cash on hand and demand deposits, and other short-term highly liquid investments that are readily convertible to a known amount of cash and are subject to an insignificant risk of changes in value. These are initially measured at fair value and subsequently recognised at amortised cost.
Other financial liabilities and finance lease obligations
Financial liabilities are measured at initial recognition at fair value, and are subsequently measured at amortised cost using the effective interest rate method.
ACCOUNTING POLICIES
1.8 Financial instruments (continued)
ANNUAL REPORT 2017/18
Page - 210
ANNUAL REPORT 2017/18
Page - 210
1.9 Tax
Current tax assets and liabilities
Current tax for current and prior periods is, to the extent unpaid, recognised as a liability. If the amount already paid in respect of cur-rent and prior periods exceeds the amount due for those periods, the excess is recognised as an asset.
Current tax liabilities (assets) for the current and prior periods are measured at the amount expected to be paid to (recovered from) the tax authorities, using the tax rates (and tax laws) that have been enacted or substantively enacted by the end of the reporting period.
Deferred tax assets and liabilities
A deferred tax liability is recognised for all taxable temporary differences, except to the extent that the deferred tax liability arises from the initial recognition of an asset or liability in a transaction which at the time of the transaction, affects neither accounting surplus nor taxable profit (tax loss).
A deferred tax asset is recognised for all deductible temporary differences to the extent that it is probable that taxable surplus will be available against which the deductible temporary difference can be utilised. A deferred tax asset is not recognised when it arises from the initial recognition of an asset or liability in a transaction at the time of the transaction, affects neither accounting surplus nor taxable profit (tax loss).
A deferred tax asset is recognised for the carry forward of unused tax losses and unused STC credits to the extent that it is prob-able that future taxable surplus will be available against which the unused tax losses and unused STC credits can be utilised.
Deferred tax assets and liabilities are measured at the tax rates that are expected to apply to the period when the asset is realised or the liability is settled, based on tax rates (and tax laws) that have been enacted or substantively enacted by the end of the reporting period.
Tax expenses
Current and deferred taxes are recognised as income or an expense and included in surplus or deficit for the period, except to the extent that the tax arises from:
• a transaction or event which is recognised, in the same or a different period, to net assets; or• a business combination.
Current tax and deferred taxes are charged or credited to net assets if the tax relates to items that are credited or charged, in the same or a different period, to net assets.
1.10 Leases
A lease is classified as a finance lease if it transfers substantially all the risks and rewards incidental to ownership. A lease is clas-sified as an operating lease if it does not transfer substantially all the risks and rewards incidental to ownership.
When a lease includes both land and buildings elements, the entity assesses the classification of each element separately.
Finance leases - lessee
Finance leases are recognised as assets and liabilities in the statement of financial position at amounts equal to the fair value of the leased property or, if lower, the present value of the minimum lease payments. The corresponding liability to the lessor is included in the statement of financial position as a finance lease obligation.
ACCOUNTING POLICIES
ANNUAL REPORT 2017/18
Page - 211
ANNUAL REPORT 2017/18
Page - 211
The discount rate used in calculating the present value of the minimum lease payments is the interest rate implicit in the lease.
Minimum lease payments are apportioned between the finance charge and reduction of the outstanding liability. The finance charge is allocated to each period during the lease term so as to produce a constant periodic rate of on the remaining balance of the liability.
Any contingent rents are expensed in the period in which they are incurred.
Operating leases - lessee
Operating lease payments are recognised as an expense on a straight-line basis over the lease term. The difference between the amounts recognised as an expense and the contractual payments are recognised as an operating lease asset or liability.
1.11 Inventories
Inventories comprise of raw materials, work in progress, finished goods and consumable stores. These are initially measured at cost except where inventories are acquired through a non-exchange transaction, then their costs are their fair value as at the date of acquisition.
Subsequently inventories are measured at the lower of cost and net realisable value.
Net realisable value is the estimated selling price in the ordinary course of operations less the estimated costs of completion and the estimated costs necessary to make the sale, exchange or distribution.
The cost of inventories comprises of all costs of purchase, costs of conversion and other costs incurred in bringing the inventories to their present location and condition.
The cost of inventories is assigned using the weighted average cost formula. The same cost formula is used for all inventories having a similar nature and use to the economic entity.
When inventories are sold, the carrying amounts of those inventories are recognised as an expense in the period in which the related revenue is recognised. If there is no related revenue, the expenses are recognised when the goods are distributed, or related services are rendered. The amount of any write-down of inventories to net realisable value or current replacement cost and all losses of inventories are recognised as an expense in the period the write-down or loss occurs. The amount of any reversal of any write-down of inventories, arising from an increase in net realisable value or current replacement cost, are recognised as a reduction in the amount of inventories recognised as an expense in the period in which the reversal occurs.
1.12 Impairment of cash-generating assets
Cash-generating assets are assets used with the objective of generating a commercial return. Commercial return means that positive cash flows are expected to be significantly higher than the cost of the asset.
Impairment is a loss in the future economic benefits or service potential of an asset, over and above the systematic recognition of the loss of the asset’s future economic benefits or service potential through depreciation (amortisation).
Carrying amount is the amount at which an asset is recognised in the statement of financial position after deducting any accumulated depreciation and accumulated impairment losses thereon.
A cash-generating unit is the smallest identifiable group of assets used with the objective of generating a commercial return that generates cash inflows from continuing use that are largely independent of the cash inflows from other assets or groups of assets.Costs of disposal are incremental costs directly attributable to the disposal of an asset, excluding finance costs and income tax expense.
Depreciation (Amortisation) is the systematic allocation of the depreciable amount of an asset over its useful life.
ACCOUNTING POLICIES
ANNUAL REPORT 2017/18
Page - 212
ANNUAL REPORT 2017/18
Page - 212
Fair value less costs to sell is the amount obtainable from the sale of an asset in an arm’s length transaction between knowledgeable, willing parties, less the costs of disposal.
Recoverable amount of an asset or a cash-generating unit is the higher its fair value less costs to sell and its value in use.
Useful life is either:
• the period of time over which an asset is expected to be used by the economic entity; or• the number of production or similar units expected to be obtained from the asset by the economic entity.
Judgements made by management in applying the criteria to designate assets as cash-generating assets or non-cash- generating assets, are as follows:
Designation
At initial recognition, the economic entity designates an asset as non-cash-generating, or an asset or cash-generating unit as cash-gen-erating. The designation is made on the basis of an economic entity’s objective of using the asset.
The economic entity designates an asset or a cash-generating unit as cash-generating when:
• its objective is to use the asset or a cash-generating unit in a manner that generates a commercial return; such that• the asset or cash-generating unit will generate positive cash flows, from continuing use and its ultimate disposal, that are expected
to be significantly higher than the cost of the asset.
An asset used with the objective of generating a commercial return and service delivery, is designated either as a cash- generating asset or non-cash-generating asset based on whether the economic entity expects to use that asset to generate a commercial return. When it is not clear whether the objective is to use the asset to generate commercial return, the economic entity designates the asset as a non-cash-generating asset and applies the accounting policy on Impairment of Non-cash- generating assets, rather than this accounting policy.
Identification
When the carrying amount of a cash-generating asset exceeds its recoverable amount, it is impaired.
The economic entity assesses at each reporting date whether there is any indication that a cash-generating asset may be impaired. If any such indication exists, the economic entity estimates the recoverable amount of the asset.
Value in use
Value in use of a cash-generating asset is the present value of the estimated future cash flows expected to be derived from the con-tinuing use of an asset and from its disposal at the end of its useful life.
When estimating the value in use of an asset, the economic entity estimates the future cash inflows and outflows to be derived from continuing use of the asset and from its ultimate disposal and the economic entity applies the appropriate discount rate to those future cash flows.
ACCOUNTING POLICIES
1.12 Impairment of cash-generating assets (continued)

ANNUAL REPORT 2017/18
Page - 213
ANNUAL REPORT 2017/18
Page - 213
Basis for estimates of future cash flows
In measuring value in use the economic entity:
• base cash flow projections on reasonable and supportable assumptions that represent management’s best estimate of the range of economic conditions that will exist over the remaining useful life of the asset. Greater weight is given to external evidence;
• base cash flow projections on the most recent approved financial budgets, but excludes any estimated future cash inflows or outflows expected to arise from future restructuring’s or from improving or enhancing the asset’s performance. Projections based on these budgets covers a maximum period of five years; and
• estimate cash flow projections beyond the period covered by the most recent budgets by extrapolating the projections based on the budgets using a steady growth rate for subsequent years. This growth rate does not exceed the long-term average growth rate for the products, industries in which the NHLS operates, or for the market in which the asset is used.
Composition of estimates of future cash flows
Estimates of future cash flows include:
• projections of cash inflows from the continuing use of the asset;• projections of cash outflows that are necessarily incurred to generate the cash inflows from continuing use of the asset (including
cash outflows to prepare the asset for use) and can be directly attributed, or allocated on a reasonable and consistent basis, to the asset; and
• net cash flows, if any, to be received (or paid) for the disposal of the asset at the end of its useful life.
Estimates of future cash flows exclude:
• cash inflows or outflows from financing activities; and• income tax receipts or payments.
The estimate of net cash flows to be received (or paid) for the disposal of an asset at the end of its useful life is the amount that the economic entity expects to obtain from the disposal of the asset in an arm’s length transaction between knowledgeable, willing par-ties, after deducting the estimated costs of disposal.
Discount rate
The discount rate is a pre-tax rate that reflects current market assessments of the time value of money, represented by the current risk-free rate of interest and the risks specific to the asset for which the future cash flow estimates have not been adjusted.
Recognition and measurement (individual asset)
If the recoverable amount of a cash-generating asset is less than its carrying amount, the carrying amount of the asset is reduced to its recoverable amount. This reduction is an impairment loss.
An impairment loss is recognised immediately in surplus or deficit.
Any impairment loss of a revalued cash-generating asset is treated as a revaluation decrease.
ACCOUNTING POLICIES
1.12 Impairment of cash-generating assets (continued)
ANNUAL REPORT 2017/18
Page - 214
ANNUAL REPORT 2017/18
Page - 214
When the amount estimated for an impairment loss is greater than the carrying amount of the cash-generating asset to which it relates, the economic entity recognises a liability only to the extent that is a requirement in the Standard of GRAP.
After the recognition of an impairment loss, the depreciation (amortisation) charge for the cash-generating asset is adjusted in future periods to allocate the cash-generating asset’s revised carrying amount, less its residual value (if any), on a systematic basis over its remaining useful life.
Cash-generating units
If there is any indication that an asset may be impaired, the recoverable amount is estimated for the individual asset. If it is not possible to estimate the recoverable amount of the individual asset, the economic entity determines the recoverable amount of the cash-gen-erating unit to which the asset belongs (the asset’s cash-generating unit).
If an active market exists for the output produced by an asset or group of assets, that asset or group of assets is identified as a cash-generating unit, even if some or all of the output is used internally. If the cash inflows generated by any asset or cash- generat-ing unit are affected by internal transfer pricing, the economic entity use management’s best estimate of future price(s) that could be achieved in arm’s length transactions in estimating:
• the future cash inflows used to determine the asset’s or cash-generating unit’s value in use; and• the future cash outflows used to determine the value in use of any other assets or cash-generating units that are affected by the
internal transfer pricing.
Cash-generating units are identified consistently from period to period for the same asset or types of assets, unless a change is justi-fied.
The carrying amount of a cash-generating unit is determined on a basis consistent with the way the recoverable amount of the cash-generating unit is determined.
An impairment loss is recognised for a cash-generating unit if the recoverable amount of the unit is less than the carrying amount of the unit. The impairment is allocated to reduce the carrying amount of the cash-generating assets of the unit on a pro rata basis, based on the carrying amount of each asset in the unit. These reductions in carrying amounts are treated as impairment losses on individual assets.
In allocating an impairment loss, the entity does not reduce the carrying amount of an asset below the highest of:
• its fair value less costs to sell (if determinable);• its value in use (if determinable); and• zero.
The amount of the impairment loss that would otherwise have been allocated to the asset is allocated pro rata to the other cash-generating assets of the unit.
Where a non-cash-generating asset contributes to a cash-generating unit, a proportion of the carrying amount of that non- cash-generating asset is allocated to the carrying amount of the cash-generating unit prior to estimation of the recoverable amount of the cash-generating unit.
ACCOUNTING POLICIES
1.12 Impairment of cash-generating assets (continued)

ANNUAL REPORT 2017/18
Page - 215
ANNUAL REPORT 2017/18
Page - 215
Reversal of impairment loss
The economic entity assesses at each reporting date whether there is any indication that an impairment loss recognised in prior periods for a cash-generating asset may no longer exist or may have decreased. If any such indication exists, the entity estimates the recoverable amount of that asset.
An impairment loss recognised in prior periods for a cash-generating asset is reversed if there has been a change in the estimates used to determine the asset’s recoverable amount since the last impairment loss was recognised. The carrying amount of the asset is increased to its recoverable amount. The increase is a reversal of an impairment loss. The increased carrying amount of an asset attributable to a reversal of an impairment loss does not exceed the carrying amount that would have been determined (net of depreciation or amortisation) had no impairment loss been recognised for the asset in prior periods.
A reversal of an impairment loss for a cash-generating asset is recognised immediately in surplus or deficit.
Any reversal of an impairment loss of a revalued cash-generating asset is treated as a revaluation increase.
After a reversal of an impairment loss is recognised, the depreciation (amortisation) charge for the cash-generating asset is adjusted in future periods to allocate the cash-generating asset’s revised carrying amount, less its residual value (if any), on a systematic basis over its remaining useful life.
A reversal of an impairment loss for a cash-generating unit is allocated to the cash-generating assets of the unit pro rata with the carrying amounts of those assets. These increases in carrying amounts are treated as reversals of impairment losses for individual assets. No part of the amount of such a reversal is allocated to a non-cash-generating asset contributing service potential to a cash-generating unit.
In allocating a reversal of an impairment loss for a cash-generating unit, the carrying amount of an asset is not increased above the lower of:
• its recoverable amount (if determinable); and• the carrying amount that would have been determined (net of amortisation or depreciation) had no impairment loss been
recognised for the asset in prior periods.
The amount of the reversal of the impairment loss that would otherwise have been allocated to the asset is allocated pro rata to the other assets of the unit.
Redesignation
The redesignation of assets from a cash-generating asset to a non-cash-generating asset or from a non-cash-generating asset to a cash-generating asset only occur when there is clear evidence that such a redesignation is appropriate.
1.13 Contributed capital
Contributed capital is the initial funding received from the shareholder upon establishment of the National Health Laboratory Service.
Contributed capital is stated at par value.
ACCOUNTING POLICIES
1.12 Impairment of cash-generating assets (continued)

ANNUAL REPORT 2017/18
Page - 216
ANNUAL REPORT 2017/18
Page - 216
1.14 Employee benefits
Employee benefits are all forms of consideration given by an entity in exchange for service rendered by employees.
A qualifying insurance policy is an insurance policy issued by an insurer that is not a related party (as defined in the Standard of GRAP on Related Party Disclosures) of the reporting entity, if the proceeds of the policy can be used only to pay or fund employee benefits under a defined benefit plan and are not available to the reporting entity’s own creditors (even in liquidation) and cannot be paid to the reporting entity, unless either:
• the proceeds represent surplus assets that are not needed for the policy to meet all the related employee benefit obligations; or• the proceeds are returned to the reporting entity to reimburse it for employee benefits already paid.
Termination benefits are employee benefits payable as a result of either:
• an entity’s decision to terminate an employee’s employment before the normal retirement date; or• an employee’s decision to accept voluntary redundancy in exchange for those benefits.
Other long-term employee benefits are employee benefits (other than post-employment benefits and termination benefits) that are not due to be settled within twelve months after the end of the period in which the employees render the related service.
Vested employee benefits are employee benefits that are not conditional on future employment.
A constructive obligation is an obligation that derives from an entity’s actions where by an established pattern of past practice, published policies or a sufficiently specific current statement, the entity has indicated to other parties that it will accept certain responsibilities and as a result, the entity has created a valid expectation on the part of those other parties that it will discharge those responsibilities.
Short-term employee benefits
Short-term employee benefits are employee benefits (other than termination benefits) that are due to be settled within twelve months after the end of the period in which the employees render the related service.
Short-term employee benefits include items such as:
• wages, salaries and social security contributions;• short-term compensated absences (such as paid annual leave and paid sick leave) where the compensation for the absences is
due to be settled within twelve months after the end of the reporting period in which the employees render the related employee service;
• bonus, incentive and performance related payments payable within twelve months after the end of the reporting period in which the employees render the related service; and
• non-monetary benefits (for example, medical care, and free or subsidised goods or services such as housing, cars and cellphones) for current employees.
When an employee has rendered service to the entity during a reporting period, the entity recognise the undiscounted amount of short-term employee benefits expected to be paid in exchange for that service:
• as a liability (accrued expense), after deducting any amount already paid. If the amount already paid exceeds the undiscounted amount of the benefits, the entity recognise that excess as an asset (prepaid expense) to the extent that the prepayment will lead to, for example, a reduction in future payments or a cash refund; and
• as an expense, unless another Standard requires or permits the inclusion of the benefits in the cost of an asset.
ACCOUNTING POLICIES

ANNUAL REPORT 2017/18
Page - 217
ANNUAL REPORT 2017/18
Page - 217
The expected cost of compensated absences is recognised as an expense as the employees render services that increase their entitlement or, in the case of non-accumulating absences, when the absence occurs. The entity measures the expected cost of accumulating compensated absences as the additional amount that the entity expects to pay as a result of the unused entitlement that has accumulated at the reporting date.
The entity recognise the expected cost of bonus, incentive and performance related payments when the entity has a present legal or constructive obligation to make such payments as a result of past events and a reliable estimate of the obligation can be made. A present obligation exists when the entity has no realistic alternative but to make the payments.
Post-employment benefits
Post-employment benefits are employee benefits (other than termination benefits) which are payable after the completion of employment.
Post-employment benefit plans are formal or informal arrangements under which an entity provides post-employment benefits for one or more employees.
Multi-employer plans are defined contribution plans (other than state plans and composite social security programmes) or defined benefit plans (other than state plans) that pool the assets contributed by various entities that are not under common control and use those assets to provide benefits to employees of more than one entity, on the basis that contribution and benefit levels are determined without regard to the identity of the entity that employs the employees concerned.
Multi-employer plans and/or State plans
Where a plan is a defined contribution plan, the economic entity accounts for in the same way as for any other defined contribution plan.
Post-employment benefits: Defined contribution plans
Defined contribution plans are post-employment benefit plans under which an entity pays fixed contributions into a separate entity (a fund) and will have no legal or constructive obligation to pay further contributions if the fund does not hold sufficient assets to pay all employee benefits relating to employee service in the current and prior periods.
When an employee has rendered service to the economic entity during a reporting period, the economic entity recognise the contribution payable to a defined contribution plan in exchange for that service:
• as a liability (accrued expense), after deducting any contribution already paid. If the contribution already paid exceeds the contribution due for service before the reporting date, the economic entity recognise that excess as an asset (prepaid expense) to the extent that the prepayment will lead to, for example, a reduction in future payments or a cash refund; and
• as an expense, unless another Standard requires or permits the inclusion of the contribution in the cost of an asset.
Where contributions to a defined contribution plan do not fall due wholly within twelve months after the end of the reporting period in which the employees render the related service, they are discounted. The rate used to discount reflects the time value of money. The currency and term of the financial instrument selected to reflect the time value of money is consistent with the currency and estimated term of the obligation.
ACCOUNTING POLICIES
1.14 Employee benefits (continued)
ANNUAL REPORT 2017/18
Page - 218
ANNUAL REPORT 2017/18
Page - 218
Post-employment benefits: Defined benefit plans
Defined benefit plans are post-employment benefit plans other than defined contribution plans.Actuarial gains and losses comprise experience adjustments (the effects of differences between the previous actuarial assumptions and what has actually occurred) and the effects of changes in actuarial assumptions. In measuring its defined benefit liability, the economic entity recognise actuarial gains and losses in surplus or deficit in the reporting period in which they occur.
Current service cost is the increase in the present value of the defined benefit obligation resulting from employee service in the current period.
Interest cost is the increase during a period in the present value of a defined benefit obligation which arises because the benefits are one period closer to settlement.
Past service cost is the change in the present value of the defined benefit obligation for employee service in prior periods, resulting in the current period from the introduction of, or changes to, post-employment benefits or other long-term employee benefits. Past service cost may be either positive (when benefits are introduced or changed so that the present value of the defined benefit obligation increases) or negative (when existing benefits are changed so that the present value of the defined benefit obligation decreases). In measuring its defined benefit liability, the entity recognise past service cost as an expense in the reporting period in which the plan is amended.The present value of a defined benefit obligation is the present value of expected future payments required to settle the obligation resulting from employee service in the current and prior periods.
The economic entity account not only for its legal obligation under the formal terms of a defined benefit plan, but also for any constructive obligation that arises from the economic entity’s informal practices. Informal practices give rise to a constructive obligation where the economic entity has no realistic alternative but to pay employee benefits. An example of a constructive obligation is where a change in the economic entity’s informal practices would cause unacceptable damage to its relationship with employees.
The amount recognised as a defined benefit liability is the net total of the following amounts:
• the present value of the defined benefit obligation at the reporting date;• plus any liability that may arise as a result of a minimum funding requirement
The economic entity determines the present value of defined benefit obligations with sufficient regularity such that the amounts recognised in the audited group annual financial statements do not differ materially from the amounts that would be determined at the reporting date.
The entity recognises the net total of the following amounts in surplus or deficit, except to the extent that another Standard requires or permits their inclusion in the cost of an asset:
• current service cost;• interest cost;• actuarial gains and losses;• past service cost;• the effect of any curtailments or settlements; and• the effect of applying the limit on a defined benefit asset (negative defined benefit liability).
The economic entity uses the Projected Unit Credit Method to determine the present value of its defined benefit obligations and the related current service cost and, where applicable, past service cost. The Projected Unit Credit Method (sometimes known as the accrued benefit method pro-rated on service or as the benefit/years of service method) sees each period of service as giving rise to an additional unit of benefit entitlement and measures each unit separately to build up the final obligation.
ACCOUNTING POLICIES
1.14 Employee benefits (continued)

ANNUAL REPORT 2017/18
Page - 219
ANNUAL REPORT 2017/18
Page - 219
In determining the present value of its defined benefit obligations and the related current service cost and, where applicable, past service cost, economic entity attributes benefit to periods of service under the plan’s benefit formula. However, if an employee’s service in later years will lead to a materially higher level of benefit than in earlier years, an economic entity attributes benefit on a straight-line basis from:
• the date when service by the employee first leads to benefits under the plan (whether or not the benefits are conditional on further service); until
• the date when further service by the employee will lead to no material amount of further benefits under the plan, other than from further salary increases.
Actuarial valuations are conducted on an annual basis by independent actuaries separately for each plan. The results of the valuation are updated for any material transactions and other material changes in circumstances (including changes in market prices and interest rates) up to the reporting date.
The economic entity recognises gains or losses on the curtailment or settlement of a defined benefit plan when the curtailment or settlement occurs. The gain or loss on a curtailment or settlement comprises of any resulting change in the present value of the defined benefit obligation.Before determining the effect of a curtailment or settlement, the economic entity re-measure the obligation (and the related plan assets, if any) using current actuarial assumptions (including current market interest rates and other current market prices).
The economic entity offsets an asset relating to one plan against a liability relating to another plan when the economic entity has a legally enforceable right to use a surplus in one plan to settle obligations under the other plan and intends either to settle the obligations on a net basis, or to realise the surplus in one plan and settle its obligation under the other plan simultaneously.
Actuarial assumptions
Actuarial assumptions are unbiased and mutually compatible.
Financial assumptions are based on market expectations, at the reporting date, for the period over which the obligations are to be settled.
The rate used to discount post-employment benefit obligations reflect the time value of money. The currency and term of the financial instrument selected to reflect the time value of money is consistent with the currency and estimated term of the post- employment benefit obligations.
Post-employment benefit obligations are measured on a basis that reflects:
• estimated future salary increases;• the benefits set out in the terms of the plan (or resulting from any constructive obligation that goes beyond those terms) at the
reporting date; and• estimated future changes in the level of any state benefits that affect the benefits payable under a defined benefit plan, if, and only
if, either:• those changes were enacted before the reporting date; or• past history, or other reliable evidence, indicates that those state benefits will change in some predictable manner, for example, in
line with future changes in general price levels or general salary levels.
Assumptions about medical costs take account of estimated future changes in the cost of medical services, resulting from both inflation and specific changes in medical costs.
ACCOUNTING POLICIES
1.14 Employee benefits (continued)
ANNUAL REPORT 2017/18
Page - 220
ANNUAL REPORT 2017/18
Page - 220
Termination benefits
The economic entity recognises termination benefits as a liability and an expense when the entity is demonstrably committed to either:
• terminate the employment of an employee or group of employees before the normal retirement date; or• provide termination benefits as a result of an offer made in order to encourage voluntary redundancy.
The economic entity is demonstrably committed to a termination when the entity has a detailed formal plan for the termination and is without realistic possibility of withdrawal. The detailed plan includes [as a minimum]:
• the location, function, and approximate number of employees whose services are to be terminated;• the termination benefits for each job classification or function; and• the time at which the plan will be implemented.
Implementation begins as soon as possible and the period of time to complete implementation is such that material changes to the plan are not likely.
Where termination benefits fall due more than 12 months after the reporting date, they are discounted using an appropriate discount rate. The rate used to discount the benefit reflects the time value of money. The currency and term of the financial instrument selected to reflect the time value of money is consistent with the currency and estimated term of the benefit.In the case of an offer made to encourage voluntary redundancy, the measurement of termination benefits shall be based on the number of employees expected to accept the offer.
1.15 Provisions and contingencies
Provisions are recognised when:
• the economic entity has a present obligation as a result of a past event;• it is probable that an outflow of resources embodying economic benefits or service potential will be required to settle the obligation;
and• a reliable estimate can be made of the obligation.
The amount of a provision is the best estimate of the expenditure expected to be required to settle the present obligation at the reporting date.
Where the effect of time value of money is material, the amount of a provision is the present value of the expenditures expected to be required to settle the obligation.
The discount rate is a pre-tax rate that reflects current market assessments of the time value of money and the risks specific to the liability.
Where some or all of the expenditure required to settle a provision is expected to be reimbursed by another party, the reimbursement is recognised when, and only when, it is virtually certain that reimbursement will be received if the economic entity settles the obligation. The reimbursement is treated as a separate asset. The amount recognised for the reimbursement does not exceed the amount of the provision.
Provisions are reviewed at each reporting date and adjusted to reflect the current best estimate. Provisions are reversed if it is no longer probable that an outflow of resources embodying economic benefits or service potential will be required, to settle the obligation.
Where discounting is used, the carrying amount of a provision increases in each period to reflect the passage of time. This increase is recognised as an interest expense.
ACCOUNTING POLICIES
1.14 Employee benefits (continued)
ANNUAL REPORT 2017/18
Page - 221
ANNUAL REPORT 2017/18
Page - 221
A provision is used only for expenditures for which the provision was originally recognised. Provisions are not recognised for future operating write offs.
For onerous contracts, the economic entity recognises and measures the present obligation (net of recoveries) under the contract as a provision.
Contingent assets and contingent liabilities are not recognised. Contingencies are disclosed in note 36.
1.16 Commitments
Items are classified as commitments when the economic entity has committed itself to future transactions that will normally result in the outflow of cash.
Disclosures are provided for unrecognised contractual commitments.
Commitments for which disclosure is necessary to achieve a fair presentation are disclosed in a note to the financial statements, if both the following criteria are met:
• Contracts are non-cancellable or only cancellable at significant cost; and• Contracts relate to something other than the routine, steady, state business of the entity – therefore salary commitments relating to
employment contracts or social security benefit commitments are excluded.
1.17 Revenue from exchange transactions
Revenue is the gross inflow of economic benefits or service potential during the reporting period when those inflows result in an increase in net assets, other than increases relating to contributions from owners.
An exchange transaction is one in which the economic entity receives assets or services, or has liabilities extinguished, and directly gives approximately equal value (primarily in the form of goods, services or use of assets) to the other party in exchange.
Fair value is the amount for which an asset could be exchanged, or a liability settled, between knowledgeable, willing parties in an arm’s length transaction.
Measurement
Revenue is measured at the fair value of the consideration received or receivable, net of trade discounts and volume rebates.
Sale of goods
Revenue from the sale of goods is recognised when all the following conditions have been satisfied:
• the economic entity has transferred to the purchaser the significant risks and rewards of ownership of the goods;• the economic entity retains neither continuing managerial involvement to the degree usually associated with ownership nor
effective control over the goods sold;• the amount of revenue can be measured reliably;• it is probable that the economic benefits or service potential associated with the transaction will flow to the economic entity; and• the costs incurred or to be incurred in respect of the transaction can be measured reliably.
ACCOUNTING POLICIES
1.14 Employee benefits (continued)
ANNUAL REPORT 2017/18
Page - 222
ANNUAL REPORT 2017/18
Page - 222
Rendering of services
When the outcome of a transaction involving the rendering of services can be estimated reliably, revenue associated with the transaction is recognised by reference to the stage of completion of the transaction at the reporting date. The outcome of a transaction can be estimated reliably when all the following conditions are satisfied:
• the amount of revenue can be measured reliably;• it is probable that the economic benefits or service potential associated with the transaction will flow to the economic entity;• the stage of completion of the transaction at the reporting date can be measured reliably; and• the costs incurred for the transaction and the costs to complete the transaction can be measured reliably.
When services are performed by an indeterminate number of acts over a specified time frame, revenue is recognised on a straight line basis over the specified time frame unless there is evidence that some other method better represents the stage of completion. When a specific act is much more significant than any other acts, the recognition of revenue is postponed until the significant act is executed.
When the outcome of the transaction involving the rendering of services cannot be estimated reliably, revenue is recognised only to the extent of the expenses recognised that are recoverable.
Service revenue is recognised by reference to the stage of completion of the transaction at the reporting date. Stage of completion is determined by services performed to date as a percentage of total services to be performed.
Interest and royalties
Revenue arising from the use by others of entity assets yielding interest is recognised when:
• It is probable that the economic benefits or service potential associated with the transaction will flow to the economic entity, and• The amount of the revenue can be measured reliably.
Interest is recognised, in surplus or deficit, using the effective interest rate method.
Royalties are recognised as they are earned in accordance with the substance of the relevant agreements.
1.18 Revenue from non-exchange transactions
Revenue comprises gross inflows of economic benefits or service potential received and receivable by an entity, which represents an increase in net assets, other than increases relating to contributions from owners.
Conditions on transferred assets are stipulations that specify that the future economic benefits or service potential embodied in the asset is required to be consumed by the recipient as specified or future economic benefits or service potential must be returned to the transferor.
Control of an asset arise when the entity can use or otherwise benefit from the asset in pursuit of its objectives and can exclude or otherwise regulate the access of others to that benefit.
Exchange transactions are transactions in which one entity receives assets or services, or has liabilities extinguished, and directly gives approximately equal value (primarily in the form of cash, goods, services, or use of assets) to another entity in exchange.
ACCOUNTING POLICIES
1.17 Revenue from exchange transactions (continued)
ANNUAL REPORT 2017/18
Page - 223
ANNUAL REPORT 2017/18
Page - 223
Non-exchange transactions are transactions that are not exchange transactions. In a non-exchange transaction, an entity either receives value from another entity without directly giving approximately equal value in exchange, or gives value to another entity without directly receiving approximately equal value in exchange.
Restrictions on transferred assets are stipulations that limit or direct the purposes for which a transferred asset may be used, but do not specify that future economic benefits or service potential is required to be returned to the transferor if not deployed as specified.
Stipulations on transferred assets are terms in laws or regulation, or a binding arrangement, imposed upon the use of a transferred asset by entities external to the reporting entity.
Transfers are inflows of future economic benefits or service potential from non-exchange transactions, other than taxes.
Recognition
An inflow of resources from a non-exchange transaction recognised as an asset is recognised as revenue, except to the extent that a liability is also recognised in respect of the same inflow.
As the economic entity satisfies a present obligation recognised as a liability in respect of an inflow of resources from a non- exchange transaction recognised as an asset, it reduces the carrying amount of the liability recognised and recognises an amount of revenue equal to that reduction.
Measurement
Revenue from a non-exchange transaction is measured at the amount of the increase in net assets recognised by the economic entity.
When, as a result of a non-exchange transaction, the economic entity recognises an asset, it also recognises revenue equivalent to the amount of the asset measured at its fair value as at the date of acquisition, unless it is also required to recognise a liability. Where a liability is required to be recognised it will be measured as the best estimate of the amount required to settle the obligation at the reporting date, and the amount of the increase in net assets, if any, recognised as revenue. When a liability is subsequently reduced, because the taxable event occurs or a condition is satisfied, the amount of the reduction in the liability is recognised as revenue.
Transfers
Apart from Services in kind, which are not recognised, the economic entity recognises an asset in respect of transfers when the transferred resources meet the definition of an asset and satisfy the criteria for recognition as an asset.
The economic entity recognises an asset in respect of transfers when the transferred resources meet the definition of an asset and satisfy the criteria for recognition as an asset.
Transferred assets are measured at their fair value as at the date of acquisition.
1.19 Turnover
Turnover comprises of sales to customers and service rendered to customers. Turnover is stated at the invoice amount and is exclusive of value added taxation.
ACCOUNTING POLICIES
1.18 Revenue from non-exchange transactions (continued)
ANNUAL REPORT 2017/18
Page - 224
ANNUAL REPORT 2017/18
Page - 224
1.20 Cost of sales
When inventories are sold, the carrying amount of those inventories is recognised as an expense in the period in which the related revenue is recognised. The amount of any write-down of inventories to net realisable value and all write offs of inventories are recognised as an expense in the period the write-down or loss occurs. The amount of any reversal of any write- down of inventories, arising from an increase in net realisable value, is recognised as a reduction in the amount of inventories recognised as an expense in the period in which the reversal occurs.
The related cost of providing services recognised as revenue in the current period is included in cost of sales.
1.21 Investment income
Investment income is recognised on a time-proportion basis using the effective interest method.
1.22 Borrowing costs
Borrowing costs are interest and other expenses incurred by an entity in connection with the borrowing of funds.
Borrowing costs are recognised as an expense in the period in which they are incurred.
1.23 Translation of foreign currencies
Foreign currency transactions
A foreign currency transaction is recorded, on initial recognition in Rands, by applying to the foreign currency amount the spot exchange rate between the functional currency and the foreign currency at the date of the transaction.
At each reporting date:
• foreign currency monetary items are translated using the closing rate;• non-monetary items that are measured in terms of historical cost in a foreign currency are translated using the exchange rate at the
date of the transaction; and• non-monetary items that are measured at fair value in a foreign currency are translated using the exchange rates at the date when
the fair value was determined.
Exchange differences arising on the settlement of monetary items or on translating monetary items at rates different from those at which they were translated on initial recognition during the period or in previous audited group annual financial statements are recognised in surplus or deficit in the period in which they arise.
Cash flows arising from transactions in a foreign currency are recorded in Rands by applying to the foreign currency amount the exchange rate between the Rand and the foreign currency at the date of the cash flow.
1.24 Comparative figures
Where necessary, comparative figures have been reclassified to conform to changes in presentation in the current year.
ACCOUNTING POLICIES
ANNUAL REPORT 2017/18
Page - 225
ANNUAL REPORT 2017/18
Page - 225
1.25 Fruitless and wasteful expenditure
Fruitless expenditure means expenditure which was made in vain and would have been avoided had reasonable care been exercised.
All expenditure relating to fruitless and wasteful expenditure is recognised as an expense in the statement of financial performance in the year that the expenditure was incurred. The expenditure is classified in accordance with the nature of the expense, and where recovered, it is subsequently accounted for as revenue in the statement of financial performance.
1.26 Irregular expenditure
Irregular expenditure as defined in section 1 of the PFMA is expenditure other than unauthorised expenditure, incurred in contravention of or that is not in accordance with a requirement of any applicable legislation, including -
a. this Act; orb. the State Tender Board Act, 1968 (Act No. 86 of 1968), or any regulations made in terms of the Act; orc. any provincial legislation providing for procurement procedures in that provincial government.
National Treasury practice note no. 4 of 2008/2009 which was issued in terms of sections 76(1) to 76(4) of the PFMA requires the following (effective from 1 April 2008):
Irregular expenditure that was incurred and identified during the current financial and which was condoned before year end and/or before finalisation of the financial statements must also be recorded appropriately in the irregular expenditure register. In such an instance, no further action is also required with the exception of updating the note to the financial statements.
Irregular expenditure that was incurred and identified during the current financial year and for which condonement is being awaited at year end must be recorded in the irregular expenditure register. No further action is required with the exception of updating the note to the financial statements.
Where irregular expenditure was incurred in the previous financial year and is only condoned in the following financial year, the register and the disclosure note to the financial statements must be updated with the amount condoned.
Irregular expenditure that was incurred and identified during the current financial year and which was not condoned by the National Treasury or the relevant authority must be recorded appropriately in the irregular expenditure register. If liability for the irregular expenditure can be attributed to a person, a debt account must be created if such a person is liable in law. Immediate steps must thereafter be taken to recover the amount from the person concerned. If recovery is not possible, the accounting officer or Accounting Authority may write off the amount as debt impairment and disclose such in the relevant note to the financial statements. The irregular expenditure register must also be updated accordingly. If the irregular expenditure has not been condoned and no person is liable in law, the expenditure related thereto must remain against the relevant programme/expenditure item, be disclosed as such in the note to the financial statements and updated accordingly in the irregular expenditure register.
1.27 Segment information
A segment is an activity of an entity:
• that generates economic benefits or service potential (including economic benefits or service potential relating to transactions between activities of the same entity);
• whose results are regularly reviewed by management to make decisions about resources to be allocated to that activity and in assessing its performance; and
• for which separate financial information is available.
ACCOUNTING POLICIES
ANNUAL REPORT 2017/18
Page - 226
ANNUAL REPORT 2017/18
Page - 226
Reportable segments are the actual segments which are reported on in the segment report. They are the segments identified above or alternatively an aggregation of two or more of those segments where the aggregation criteria are met.
Measurement
The amount of each segment item reported is the measure reported to management for the purposes of making decisions about allocating resources to the segment and assessing its performance. Adjustments and eliminations made in preparing the entity’s financial statements and allocations of revenues and expenses are included in determining reported segment surplus or deficit only if they are included in the measure of the segment’s surplus or deficit that is used by management. Similarly, only those assets and liabilities that are included in the measures of the segment’s assets and segment’s liabilities that are used by management are reported for that segment. If amounts are allocated to reported segment surplus or deficit, assets or liabilities, those amounts are allocated on a reasonable basis.
If management uses only one measure of a segment’s surplus or deficit, the segment’s assets or the segment’s liabilities in assessing segment performance and deciding how to allocate resources, segment surplus or deficit, assets and liabilities are reported in terms of that measure. If management uses more than one measure of a segment’s surplus or deficit, the segment’s assets or the segment’s liabilities, the reported measures are those that management believes are determined in accordance with the measurement principles most consistent with those used in measuring the corresponding amounts in the entity’s financial statements.
1.28 Research and development expenditure
Expenditure on research is recognised as an expense when it is incurred. An asset arising from development is recognised when:
• it is technically feasible to complete the asset so that it will be available for use or sale.• there is an intention to complete and use or sell it.• there is an ability to use or sell it.• it will generate probable future economic benefits or service potential.• there are available technical, financial and other resources to complete the development and to use or sell the asset.• the expenditure attributable to the asset during its development can be measured reliably.
1.29 Budget information
The economic Entity is typically subject to budgetary limits in the form of appropriations or budget authorisations (or equivalent), which is given effect through authorising legislation, appropriation or similar.
General purpose financial reporting by economic entity provides information on whether resources were obtained and used in accordance with the legally adopted budget.
The approved budget is prepared on an accrual basis and presented by functional classification. The approved budget covers the fiscal period from 01/04/2017 to 31/03/2018.
The budget for the economic entity includes all the entities approved budgets under its control.
The audited group annual financial statements and the budget are on the same basis of accounting therefore a comparison with the budgeted amounts for the reporting period have been included in the Statement of comparison of budget and actual amounts.
ACCOUNTING POLICIES
1.27 Segment information (continued)
ANNUAL REPORT 2017/18
Page - 227
ANNUAL REPORT 2017/18
Page - 227
1.30 Related parties
A related party is a person or an entity with the ability to control or jointly control the other party, or exercise significant influence over the other party, or vice versa, or an entity that is subject to common control, or joint control.
Control is the power to govern the financial and operating policies of an entity so as to obtain benefits from its activities.
Joint control is the agreed sharing of control over an activity by a binding arrangement, and exists only when the strategic financial and operating decisions relating to the activity require the unanimous consent of the parties sharing control (the venturers).
Related party transaction is a transfer of resources, services or obligations between the reporting entity and a related party, regardless of whether a price is charged.
Significant influence is the power to participate in the financial and operating policy decisions of an entity, but is not control over those policies.
Management are those persons responsible for planning, directing and controlling the activities of the economic entity, including those charged with the governance of the economic entity in accordance with legislation, in instances where they are required to perform such functions.
Close members of the family of a person are considered to be those family members who may be expected to influence, or be influenced by, that management in their dealings with the economic entity.
The economic entity is exempt from disclosure requirements in relation to related party transactions if that transaction occurs within normal supplier and/or client/recipient relationships on terms and conditions no more or less favourable than those which it is reasonable to expect the economic entity to have adopted if dealing with that individual entity or person in the same circumstances and terms and conditions are within the normal operating parameters established by that reporting entity’s legal mandate.
Where the economic entity is exempt from the disclosures in accordance with the above, the economic entity discloses narrative information about the nature of the transactions and the related outstanding balances, to enable users of the entity’s financial statements to understand the effect of related party transactions on its audited group annual financial statements.
1.31 Events after reporting date
Events after reporting date are those events, both favourable and unfavourable, that occur between the reporting date and the date when the financial statements are authorised for issue. Two types of events can be identified:
• those that provide evidence of conditions that existed at the reporting date (adjusting events after the reporting date); and• those that are indicative of conditions that arose after the reporting date (non-adjusting events after the reporting date).
The economic entity adjusts the amount recognised in the financial statements to reflect adjusting events after the reporting date once the event occurred.
The economic entity discloses the nature of the event and an estimate of its financial effect or a statement that such estimate cannot be made in respect of all material non-adjusting events, where non-disclosure could influence the economic decisions of users taken on the basis of the financial statements.
ACCOUNTING POLICIES
ANNUAL REPORT 2017/18
Page - 228
ANNUAL REPORT 2017/18
Page - 228
1.32 Sundry income
Teaching income
Teaching Income is recognised on the accrual basis. This policy decision is attributable to the uncertainty associated with the flow of economic benefits arising from teaching-related transactions to the entity. The management decision taken complies with the requirements of the statement on revenue recognition.
Miscellaneous income
Miscellaneous sales are generated when the NHLS recovers funds for rental lease agreements, hosts conferences and other charges which need to be recovered from the use of its own facilities such as those used by Contract Laboratory Services.
ACCOUNTING POLICIES

ANNUAL REPORT 2017/18
Page - 229
ANNUAL REPORT 2017/18
Page - 229
NOTES TO THE AUDITED GROUP ANNUAL FINANCIAL STATEMENTS
2. New standards and interpretations
2.1 Standards and interpretations issued, but not yet effective
The economic entity has not applied the following standards and interpretations, which have been published and are mandatory for the economic entity’s accounting periods beginning on or after 1 April 2018 or later periods:
GRAP 34: Separate Financial Statements
The objective of this Standard is to prescribe the accounting and disclosure requirements for investments in controlled entities, joint ventures and associates when an entity prepares separate financial statements.
It furthermore covers Definitions, Preparation of separate financial statements, Disclosure, Transitional provisions and Effective date.
The effective date of the standard is not yet set by the Minister of Finance.
The economic entity expects to adopt the standard for the first time when the Minister sets the effective date for the standard.
It is unlikely that the standard will have a material impact on the economic entity’s audited group annual financial statements.
GRAP 35: Consolidated Financial Statements
The objective of this Standard is to establish principles for the presentation and preparation of consolidated financial statements when an entity controls one or more other entities.
To meet this objective, the Standard:
• requires an entity (the controlling entity) that controls one or more other entities (controlled entities) to present consolidated financial statements;
• defines the principle of control, and establishes control as the basis for consolidation;• sets out how to apply the principle of control to identify whether an entity controls another entity and therefore must consolidate
that entity;• sets out the accounting requirements for the preparation of consolidated financial statements; and• defines an investment entity and sets out an exception to consolidating particular controlled entities of an investment entity.
It furthermore covers Definitions, Control, Accounting requirements, Investment entities: Fair value requirement, Transitional provisions and Effective date.
The effective date of the standard is not yet set by the Minister of Finance.
The economic entity expects to adopt the standard for the first time when the Minister sets the effective date for the standard.
It is unlikely that the standard will have a material impact on the economic entity’s audited group annual financial statements.

ANNUAL REPORT 2017/18
Page - 230
ANNUAL REPORT 2017/18
Page - 230
NOTES TO THE AUDITED GROUP ANNUAL FINANCIAL STATEMENTS
GRAP 110: Living and Non-living Resources
The objective of this Standard is to prescribe the:
• recognition, measurement, presentation and disclosure requirements for living resources; and• disclosure requirements for non-living resources
It furthermore covers Definitions, Recognition, Measurement, Depreciation, Impairment, Compensation for impairment, Transfers, Derecognition, Disclosure, Transitional provisions and Effective date.
The effective date of the standard is not yet set by the Minister of Finance.
The economic entity expects to adopt the standard for the first time when the Minister sets the effective date for the standard.
It is unlikely that the standard will have a material impact on the economic entity’s audited group annual financial statements.
GRAP 110 (as amended 2016): Living and Non-living Resources
Amendments to the Standard of GRAP on Living and Non-living Resources resulted from editorial changes to the original text and inconsistencies in measurement requirements in GRAP 23 and other asset-related Standards of GRAP in relation to the treatment of transaction costs. Other changes resulted from changes made to IPSAS 17 on Property, Plant and Equipment (IPSAS 17) as a result of the IPSASB’s Improvements to IPSASs 2014 issued in January 2015 and Improvements to IPSASs 2015 issued in March 2016.
The most significant changes to the Standard are:
• General improvements: To clarify the treatment of transaction costs and other costs incurred on assets acquired in non-exchange transactions to be in line with the principle in GRAP 23; and to clarify the measurement principle when assets may be acquired in exchange for a non-monetary asset or assets, or a combination of monetary and non-monetary assets
• IPSASB amendments: To clarify the revaluation methodology of the carrying amount and accumulated depreciation when a living resource is revalued; To clarify acceptable methods of depreciating assets; and to define a bearer plant and include bearer plants within the scope of GRAP 17 or GRAP 110, while the produce growing on bearer plants will remain within the scope of GRAP 27
The effective date of the amendment is for years beginning on or after 1 April 2020.
The economic entity expects to adopt the amendment for the first time in the 2021 audited group annual financial statements.
It is unlikely that the amendment will have a material impact on the economic entity’s audited group annual financial statements.
GRAP 6 (as revised 2010): Consolidated and Separate Financial Statements
The definition of ‘minority interest’ has been amended to ‘non-controlling interest’, and paragraph .60 was added by the Improvements to the Standards of GRAP issued in November 2010. An entity shall apply these amendments prospectively for annual financial periods beginning on or after the effective date [in conjunction with the effective date to be determined by the Minister of Finance for GRAP 105, 106 and 107]. If an entity elects to apply these amendments earlier, it shall disclose this fact.
Paragraph .59 was amended by Improvements to the Standards of GRAP issued in November 2010. An entity shall apply these amendments prospectively for annual financial periods beginning on or after the effective date [in conjunction with the effective date to be determined by the Minister of Finance for GRAP 105, 106 and 107] from the date at which it first applied the Standard of GRAP on Non-current Assets Held for Sale and Discontinued Operations. If an entity elects to apply these amendments earlier, it shall disclose this fact.
2. New standards and interpretations (continued)

ANNUAL REPORT 2017/18
Page - 231
ANNUAL REPORT 2017/18
Page - 231
The Standards of GRAP on Transfer of Functions Between Entities Under Common Control, Transfer of Functions Between Entities Not Under Common Control and Mergers amended paragraphs .03, .39, .47 to .50 and added paragraphs .51 to .58 and .61 to .62. An entity shall apply these amendments when it applies the Standards of GRAP on Transfer of Functions Between Entities Under Common Con-trol, Transfer of Functions Between Entities Not Under Common Control and Mergers.
An entity shall apply this amendment for audited group annual financial statements covering periods beginning on or after the effec-tive date [in conjunction with the effective date to be determined by the Minister of Finance for GRAP 105, 106 and 107].
The economic entity expects to adopt the amendment for the first time in the 2020 audited group annual financial statements.
It is unlikely that the amendment will have a material impact on the economic entity’s audited group annual financial statements.
GRAP 18 (as amended 2016): Segment Reporting
Amendments to the Standard of GRAP on Segment Reporting resulted from editorial and other changes to the original text have been made to ensure consistency with other Standards of GRAP.
The most significant changes to the Standard are:
• General improvements: An appendix with illustrative segment disclosures has been deleted from the Standard as the National Treasury has issued complete examples as part of its implementation guidance.
The effective date of the amendment is for years beginning on or after 1 April 2019
The economic entity expects to adopt the amendment for the first time when the Minister sets the effective date for the amendment.
It is unlikely that the amendment will have a material impact on the economic entity’s audited group annual financial statements.
GRAP 20: Related parties
The objective of this standard is to ensure that a reporting entity’s audited group annual financial statements contain the disclosures necessary to draw attention to the possibility that its financial position and surplus or deficit may have been affected by the existence of related parties and by transactions and outstanding balances with such parties.
An entity that prepares and presents financial statements under the accrual basis of accounting (in this standard referred to as the reporting entity) shall apply this standard in:
• identifying related party relationships and transactions;• identifying outstanding balances, including commitments, between an entity and its related parties;• identifying the circumstances in which disclosure of the items in (a) and (b) is required; and• determining the disclosures to be made about those items.
This standard requires disclosure of related party relationships, transactions and outstanding balances, including commitments, in the consolidated and separate financial statements of the reporting entity in accordance with the Standard of GRAP on Consolidated and Separate Financial Statements. This standard also applies to individual audited group annual financial statements.
Disclosure of related party transactions, outstanding balances, including commitments, and relationships with related parties may affect users’ assessments of the financial position and performance of the reporting entity and its ability to deliver agreed services, in-cluding assessments of the risks and opportunities facing the entity. This disclosure also ensures that the reporting entity is transparent about its dealings with related parties.
NOTES TO THE AUDITED GROUP ANNUAL FINANCIAL STATEMENTS
2. New standards and interpretations (continued)

ANNUAL REPORT 2017/18
Page - 232
ANNUAL REPORT 2017/18
Page - 232
The standard states that a related party is a person or an entity with the ability to control or jointly control the other party, or exercise significant influence over the other party, or vice versa, or an entity that is subject to common control, or joint control. As a minimum, the following are regarded as related parties of the reporting entity:
• A person or a close member of that person’s family is related to the reporting entity if that person: » has control or joint control over the reporting entity; » has significant influence over the reporting entity; » is a member of the management of the entity or its controlling entity.
• An entity is related to the reporting entity if any of the following conditions apply: » the entity is a member of the same economic entity (which means that each controlling entity, controlled entity and fellow
controlled entity is related to the others); » one entity is an associate or joint venture of the other entity (or an associate or joint venture of a member of an economic entity
of which the other entity is a member); » both entities are joint ventures of the same third party; » one entity is a joint venture of a third entity and the other entity is an associate of the third entity; » the entity is a post-employment benefit plan for the benefit of employees of either the entity or an entity related to the entity.
If the reporting entity is itself such a plan, the sponsoring employers are related to the entity; » the entity is controlled or jointly controlled by a person identified in (a); and » a person identified in (a)(i) has significant influence over that entity or is a member of the management of that entity (or its
controlling entity).
The standard furthermore states that related party transaction is a transfer of resources, services or obligations between the reporting entity and a related party, regardless of whether a price is charged.
The standard elaborates on the definitions and identification of:
• Close member of the family of a person;• Management;• Related parties;• Remuneration; and• Significant influence
The standard sets out the requirements, inter alia, for the disclosure of:
• Control;• Related party transactions; and• Remuneration of management
The effective date of the standard is not yet set by the Minister of Finance.
The economic entity expects to adopt the standard for the first time when the Minister sets the effective date for the standard.
It is unlikely that the standard will have a material impact on the economic entity’s audited group annual financial statements.
NOTES TO THE AUDITED GROUP ANNUAL FINANCIAL STATEMENTS
2. New standards and interpretations (continued)
ANNUAL REPORT 2017/18
Page - 233
ANNUAL REPORT 2017/18
Page - 233
GRAP 12 (as amended 2016): Inventories
Amendments to the Standard of GRAP on Inventories resulted from inconsistencies in measurement requirements in GRAP 23 and other asset-related Standards of GRAP in relation to the treatment of transaction costs. Other changes resulted from changes made to IPSAS 12 on Inventories (IPSAS 12) as a result of the IPSASB’s Improvements to IPSASs 2015 issued in March 2016.
The most significant changes to the Standard are:
• General improvements: To clarify the treatment of transaction costs and other costs incurred on assets acquired in non-exchange transactions to be in line with the principle in GRAP 23 (paragraph .12)
• IPSASB amendments: To align terminology in GRAP 12 with that in IPSAS 12. The term “ammunition” in IPSAS 12 was replaced with the term “military inventories” and provides a description of what it comprises in accordance with Government Finance Statistics terminology
The effective date of the amendment is for years beginning on or after 1 April 2018.
The economic entity expects to adopt the amendment for the first time in the 2019 audited group annual financial statements.
It is unlikely that the amendment will have a material impact on the economic entity’s audited group annual financial statements.
GRAP 17 (as amended 2016): Property, Plant and Equipment
Amendments to the Standard of GRAP on Property, Plant and Equipment resulted from editorial changes to the original text and inconsistencies in measurement requirements in GRAP 23 and other asset-related Standards of GRAP in relation to the treatment of transaction costs. Other changes resulted from changes made to IPSAS 17 on Property, Plant and Equipment (IPSAS 17) as a result of the IPSASB’s Improvements to IPSASs 2014 issued in January 2015 and Improvements to IPSASs 2015 issued in March 2016.
The most significant changes to the Standard are:
• General improvements: To clarify the treatment of transaction costs and other costs incurred on assets acquired in non-exchange transactions to be in line with the principle in GRAP 23 (paragraph .12); and to clarify the measurement principle when assets may be acquired in exchange for a non-monetary asset or assets, or a combination of monetary and non-monetary assets.
• IPSASB amendments: To clarify the revaluation methodology of the carrying amount and accumulated depreciation when an item of property, plant, and equipment is revalued; To clarify acceptable methods of depreciating assets; To align terminology in GRAP 17 with that in IPSAS 17. The term “specialist military equipment” in IPSAS 17 was replaced with the term “weapon systems” and provides a description of what it comprises in accordance with Government Finance Statistics terminology; and to define a bearer plant and include bearer plants within the scope of GRAP 17, while the produce growing on bearer plants will remain within the scope of GRAP 27.
The effective date of the amendment is for years beginning on or after 1 April 2018.
The economic entity expects to adopt the amendment for the first time in the 2019 audited group annual financial statements.
It is unlikely that the amendment will have a material impact on the economic entity’s audited group annual financial statements.
NOTES TO THE AUDITED GROUP ANNUAL FINANCIAL STATEMENTS
2. New standards and interpretations (continued)
ANNUAL REPORT 2017/18
Page - 234
ANNUAL REPORT 2017/18
Page - 234
GRAP 26 (as amended 2016): Impairment of cash-generating assets
Amendments Changes to the Standard of GRAP on Impairment of Cash Generating Assets resulted from changes made to IPSAS 26 on Impairment of Cash-Generating Assets (IPSAS 26) as a result of the IPSASB’s Impairment of Revalued Assets issued in March 2016.
The most significant changes to the Standard are:
• IPSASB amendments: To update the Basis of conclusions and Comparison with IPSASs to reflect the IPSASB’s recent decision on the impairment of revalued assets.
The effective date of the amendment is for years beginning on or after 1 April 2018.
The economic entity expects to adopt the amendment for the first time in the 2019 audited group annual financial statements.
It is unlikely that the amendment will have a material impact on the economic entity’s audited group annual financial statements.
GRAP 31 (as amended 2016): Intangible Assets
Amendments to the Standard of GRAP on Intangible Assets resulted from inconsistencies in measurement requirements in GRAP 23 and other asset-related Standards of GRAP in relation to the treatment of transaction costs. Other changes resulted from changes made to IPSAS 31 on Intangible Assets (IPSAS 31) as a result of the IPSASB’s Improvements to IPSASs 2014 issued in January 2015.
The most significant changes to the Standard are:
• General improvements: To add the treatment of transaction costs and other costs incurred on assets acquired in non-exchange transactions to be in line with the principle in GRAP 23 (paragraph .12); and to clarify the measurement principle when assets may be acquired in exchange for a non-monetary asset or assets, or a combination of monetary and non-monetary assets
• IPSASB amendments: To clarify the revaluation methodology of the carrying amount and accumulated depreciation when an item of intangible assets is revalued; and to clarify acceptable methods of depreciating assets
The effective date of the amendment is for years beginning on or after 1 April 2018.
The economic entity expects to adopt the amendment for the first time in the 2019 audited group annual financial statements.
It is unlikely that the amendment will have a material impact on the economic entity’s audited group annual financial statements.
NOTES TO THE AUDITED GROUP ANNUAL FINANCIAL STATEMENTS
2. New standards and interpretations (continued)

ANNUAL REPORT 2017/18
Page - 235
ANNUAL REPORT 2017/18
Page - 235
Economic entity Controlling entity
2018R ‘000
2017R ‘000
2018R ‘000
2017R ‘000
Raw materials, components 300 71 - -
Work in progress 5,468 3,092 - -
Finished goods 863 1,127 387 -
Consumable stores 117,781 112,553 117,785 112,557
124,412 116,843 118,172 112,557
It is the economic entity’s policy to make inventory write-downs for obsolete and expired stock. During the current year, the assessment of inventory for impairment did not result in any write downs.
4. Receivables from exchange transactions
Trade debtors 5,460,026 6,226,033 5,458,056 6,223,306
Prepayments 74 898 74 898
Other receivables 10,745 17,197 10,726 17,197
Less: Allowance for impairment on trade receivables*
(3,355,380) (4,682,645) (3,355,380) (4,682,645)
Interest receivable 5,632 - 5,632 -
Teaching Services 97,993 78,167 97,993 78,167
2,219,090 1,639,650 2,217,101 1,636,923
* The economic entity raises a doubtful debt provision on private debtors (Medical Aid debtors and individual patients who are cov-ered by Medical Aid).
Outstanding debt from KwaZulu-Natal Department of Health
Included in the receivables above is R2.952bn (2017: R3.170bn) owed by the KwaZulu-Natal Department of Health of which R2.639bn (2017: R2.752bn) has been impaired. For the receivables of R2.952bn, the Accountant General performed an audit of R2.8bn relating to pathology services rendered to KZN DoH which was queried for the period from 01 March 2010 to 31 March 2014. It was confirmed that R1.8bn is payable to the NHLS. This amount remains unpaid and negotiations regarding payment arrangements are ongoing.
Outstanding debt from Gauteng Department of Health
The Gauteng Department of Health owes the economic entity R1.595bn (2017: R2.329bn) of which R452m (2017: R1.844bn) has been impaired. During the year, the NHLS signed a settlement arrangement with the Gauteng Department of Heath for payment of all the debt that is not impaired as well as current consumption.
Trade and other receivables past due but not impaired
Trade and other receivables which are less than 3 months past due are not considered to be impaired. At 31 March 2018, R 1,395,004 (2017: R 1,543,848) were past due but not impaired.
NOTES TO THE AUDITED GROUP ANNUAL FINANCIAL STATEMENTS
3. Inventories

ANNUAL REPORT 2017/18
Page - 236
ANNUAL REPORT 2017/18
Page - 236
Economic entity Controlling entity
2018R ‘000
2017R ‘000
2018R ‘000
2017R ‘000
NOTES TO THE AUDITED GROUP ANNUAL FINANCIAL STATEMENTS
4. Receivables from exchange transactions (continued)
The ageing of amounts past due but not impaired is as follows:
1 month past due 667,149 619,134 667,149 619,134
2 months past due 393,382 503,325 393,382 503,325
3 months past due 334,473 421,389 334,473 421,389
1,395,004 1,543,848 1,395,004 1,543,848
Trade and other receivables impaired
As of 31 March 2018, trade and other receivables of R 3,355,380 (2017: R 4,682,645) were provided for impairment.
The ageing of these loans is as follows:
Over 3 months 3,355,380 4,682,645 3,355,380 4,682,645
Reconciliation of provision for impairment of trade and other receivables
Opening balance 4,682,645 2,474,735 4,682,645 2,474,735
Provision for impairment (272,603) 2,370,014 (272,603) 2,370,014
Amounts written off as uncollectible (1,054,662) (307,201) (1,054,662) (307,201)
Provision for debtors interest - 145,166 - 145,166
Provision for credit notes - (69) - (69)
3,355,380 4,682,645 3,355,380 4,682,645
The creation and release of provision for impaired receivables have been included in operating expenses in surplus or deficit. Amounts charged to the allowance account are generally written off when there is no expectation of recovering additional cash.
5. Debt impairment
Contributions to debt impairment provision [1] (1,325,350) 2,492,575 (1,324,281) 2,491,125
Bad debts written off [2] 1,054,662 22,606 1,054,662 22,606
(270,688) 2,515,181 (269,619) 2,513,731
[1] Contributions to debt impairment provision consists of provision for doubtful debt and provision for the loss in the controlled entity, SAVP.
[2] Debt written off consists of stale medical aid claims due to late billing as well as write offs due to data-capturing errors, debt that is uneconomical to pursue, death of patients, uncontactable patients, uncollectable debt and debt which falls over the prescribed period.

ANNUAL REPORT 2017/18
Page - 237
ANNUAL REPORT 2017/18
Page - 237
Economic entity Controlling entity
2018R ‘000
2017R ‘000
2018R ‘000
2017R ‘000
6. Receivables from non-exchange transactions
NOTES TO THE AUDITED GROUP ANNUAL FINANCIAL STATEMENTS
Other receivables from non-exchange revenue 234,348 97,253 234,348 97,253
7. Cash and cash equivalents
Cash and cash equivalents consist of:
Cash on hand 526 446 515 431
Bank balances 36,719 32,239 36,328 32,107
Short-term deposits 1,081,899 359,291 1,077,613 357,381
1,119,144 391,976 1,114,456 389,919
Cash and cash equivalents held by the NHLS that are not available for use by the economic entity - Grant donor funds
365,772 58,352 365,772 56,310
Credit quality of cash at bank and short term deposits, excluding cash on hand
The interest earned on cash at bank and short term deposits ranged from 8.45% to 9.85% (2017 - 6.69% per annum) and these deposits had an average maturity of 30 days.

ANNUAL REPORT 2017/18
Page - 238
ANNUAL REPORT 2017/18
Page - 238
Figu
res
in R
and
thou
sand
8.
Pro
pert
y, p
lant
and
equ
ipm
ent
Econ
omic
ent
ity
2018
2017
Cost
/ Va
luat
ion
Acc
umul
ated
de
prec
iatio
n an
d ac
cum
ulat
ed
impa
irm
ent
Carr
ying
va
lue
Cost
/Va
luat
ion
Acc
umul
ated
de
prec
iatio
n an
d ac
cum
ulat
ed
impa
irm
ent
Carr
ying
va
lue
Build
ings
710,
474
-71
0,47
463
9,124
-63
9,124
Build
ings
- ai
r sys
tem
s7,1
65(6
,302
)86
318
,240
(14,
136)
4,10
4
Com
pute
r equ
ipm
ent
337,1
07(2
27,7
38)
109,
369
322,
403
(198
,950
)12
3,45
3
Furn
iture
and
fixt
ures
10,2
28(6
,853
)3,
375
11,7
55(7
,987
)3,
768
Labo
rato
ry e
quip
men
t69
0,14
2(5
33,8
81)
156,
261
646,
672
(512
,284
)13
4,38
8
Land
95,5
52-
95,5
5295
,552
-95
,552
Leas
ehol
d im
prov
emen
ts11
2,81
2(5
7,043
)55
,769
109,
649
(45,
403)
64,2
46
Mob
ile u
nits
37,3
81(2
5,42
8)11
,953
32,9
43(2
2,59
2)10
,351
Mot
or v
ehic
les
96,5
51(3
0,41
5)66
,136
93,4
73(1
4,18
1)79
,292
Offi
ce e
quip
men
t32
,026
(20,
648)
11,3
7834
,738
(26,
724)
8,01
4
Plan
t and
mac
hine
ry7,2
92(5
,795
)1,
497
5,73
7(5
,636
)10
1
Shee
p an
d ho
rses
22-
22-
--
Tota
l2,
136,
752
(914
,103
)1,
222,
649
2,01
0,28
6(8
47,8
93)
1,16
2,39
3
NO
TES
TO T
HE
AU
DIT
ED G
ROU
P A
NN
UA
L FI
NA
NCI
AL
STAT
EMEN
TS
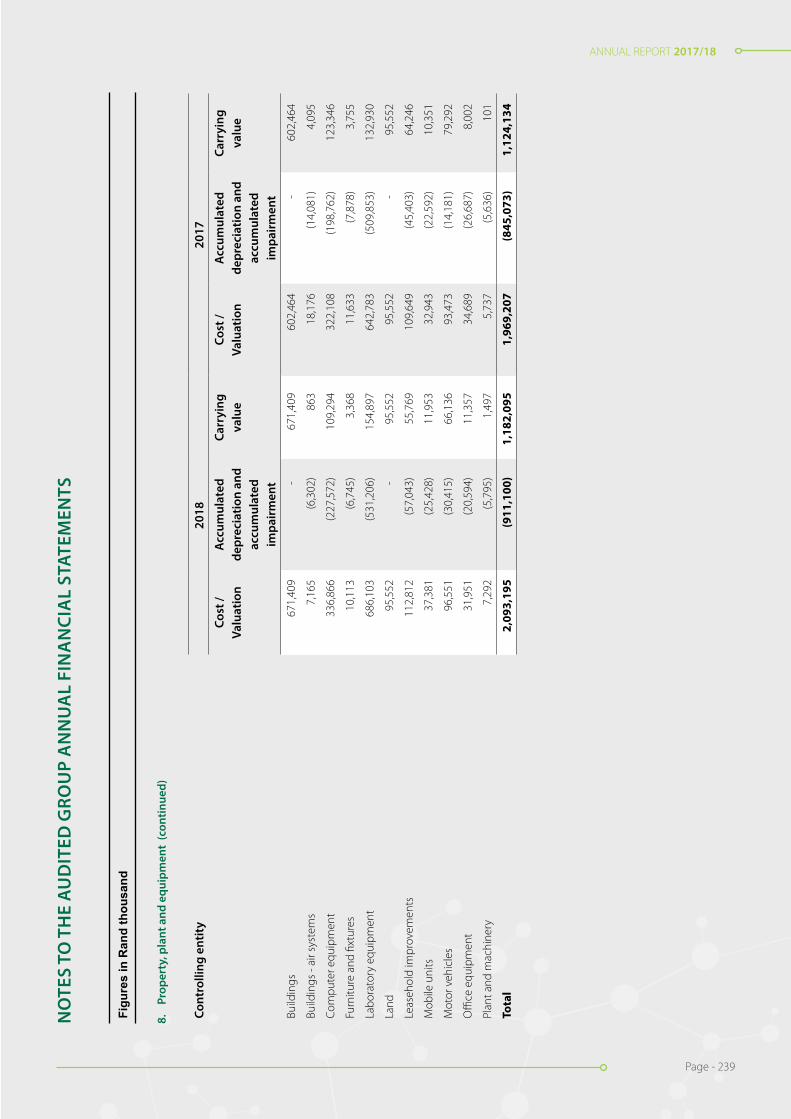
ANNUAL REPORT 2017/18
Page - 239
ANNUAL REPORT 2017/18
Page - 239
Figu
res
in R
and
thou
sand
8.
Pro
pert
y, p
lant
and
equ
ipm
ent
Econ
omic
ent
ity
2018
2017
Cost
/ Va
luat
ion
Acc
umul
ated
de
prec
iatio
n an
d ac
cum
ulat
ed
impa
irm
ent
Carr
ying
va
lue
Cost
/Va
luat
ion
Acc
umul
ated
de
prec
iatio
n an
d ac
cum
ulat
ed
impa
irm
ent
Carr
ying
va
lue
Build
ings
710,
474
-71
0,47
463
9,124
-63
9,124
Build
ings
- ai
r sys
tem
s7,1
65(6
,302
)86
318
,240
(14,
136)
4,10
4
Com
pute
r equ
ipm
ent
337,1
07(2
27,7
38)
109,
369
322,
403
(198
,950
)12
3,45
3
Furn
iture
and
fixt
ures
10,2
28(6
,853
)3,
375
11,7
55(7
,987
)3,
768
Labo
rato
ry e
quip
men
t69
0,14
2(5
33,8
81)
156,
261
646,
672
(512
,284
)13
4,38
8
Land
95,5
52-
95,5
5295
,552
-95
,552
Leas
ehol
d im
prov
emen
ts11
2,81
2(5
7,043
)55
,769
109,
649
(45,
403)
64,2
46
Mob
ile u
nits
37,3
81(2
5,42
8)11
,953
32,9
43(2
2,59
2)10
,351
Mot
or v
ehic
les
96,5
51(3
0,41
5)66
,136
93,4
73(1
4,18
1)79
,292
Offi
ce e
quip
men
t32
,026
(20,
648)
11,3
7834
,738
(26,
724)
8,01
4
Plan
t and
mac
hine
ry7,2
92(5
,795
)1,
497
5,73
7(5
,636
)10
1
Shee
p an
d ho
rses
22-
22-
--
Tota
l2,
136,
752
(914
,103
)1,
222,
649
2,01
0,28
6(8
47,8
93)
1,16
2,39
3
Figu
res
in R
and
thou
sand
8.
Pro
pert
y, p
lant
and
equ
ipm
ent
(con
tinue
d)
Cont
rolli
ng e
ntit
y20
1820
17
Cost
/ Va
luat
ion
Acc
umul
ated
de
prec
iatio
n an
d ac
cum
ulat
ed
impa
irm
ent
Carr
ying
va
lue
Cost
/Va
luat
ion
Acc
umul
ated
de
prec
iatio
n an
d ac
cum
ulat
ed
impa
irm
ent
Carr
ying
va
lue
Build
ings
671,
409
-67
1,40
960
2,46
4-
602,
464
Build
ings
- ai
r sys
tem
s7,
165
(6,3
02)
863
18,1
76(1
4,08
1)4,
095
Com
pute
r equ
ipm
ent
336,
866
(227
,572
)10
9,29
432
2,10
8(1
98,7
62)
123,
346
Furn
iture
and
fixt
ures
10,1
13(6
,745
)3,
368
11,6
33(7
,878
)3,
755
Labo
rato
ry e
quip
men
t68
6,10
3(5
31,2
06)
154,
897
642,
783
(509
,853
)13
2,93
0
Land
95,5
52-
95,5
5295
,552
-95
,552
Leas
ehol
d im
prov
emen
ts11
2,81
2(5
7,04
3)55
,769
109,
649
(45,
403)
64,2
46
Mob
ile u
nits
37,3
81(2
5,42
8)11
,953
32,9
43(2
2,59
2)10
,351
Mot
or v
ehic
les
96,5
51(3
0,41
5)66
,136
93,4
73(1
4,18
1)79
,292
Offi
ce e
quip
men
t31
,951
(20,
594)
11,3
5734
,689
(26,
687)
8,00
2
Plan
t and
mac
hine
ry7,
292
(5,7
95)
1,49
75,
737
(5,6
36)
101
Tota
l2,
093,
195
(911
,100
)1,
182,
095
1,96
9,20
7(8
45,0
73)
1,12
4,13
4
NO
TES
TO T
HE
AU
DIT
ED G
ROU
P A
NN
UA
L FI
NA
NCI
AL
STAT
EMEN
TS
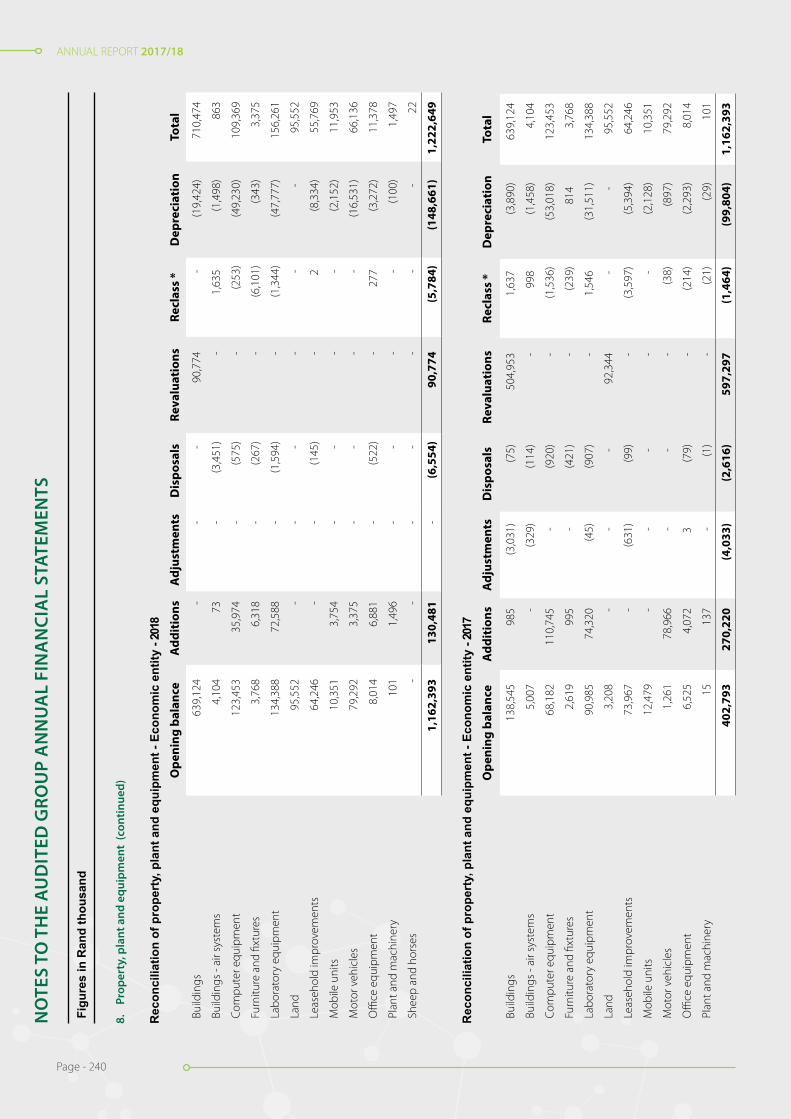
ANNUAL REPORT 2017/18
Page - 240
ANNUAL REPORT 2017/18
Page - 240
Figu
res
in R
and
thou
sand
8.
Pro
pert
y, p
lant
and
equ
ipm
ent
(con
tinue
d)
Rec
onci
liatio
n of
pro
pert
y, p
lant
and
equ
ipm
ent -
Eco
nom
ic e
ntity
- 20
18O
peni
ng b
alan
ceA
ddit
ions
Adj
ustm
ents
Dis
posa
lsRe
valu
atio
nsRe
clas
s *
Dep
reci
atio
nTo
tal
Build
ings
639,
124
--
-90
,774
-(1
9,42
4)71
0,47
4
Build
ings
- ai
r sys
tem
s4,
104
73-
(3,4
51)
-1,
635
(1,4
98)
863
Com
pute
r equ
ipm
ent
123,
453
35,9
74-
(575
)-
(253
)(4
9,23
0)10
9,36
9
Furn
iture
and
fixt
ures
3,76
86,
318
-(2
67)
-(6
,101
)(3
43)
3,37
5
Labo
rato
ry e
quip
men
t13
4,38
872
,588
-(1
,594
)-
(1,3
44)
(47,
777)
156,
261
Land
95,5
52-
--
--
-95
,552
Leas
ehol
d im
prov
emen
ts64
,246
--
(145
)-
2(8
,334
)55
,769
Mob
ile u
nits
10,3
513,
754
--
--
(2,1
52)
11,9
53
Mot
or v
ehic
les
79,2
923,
375
--
--
(16,
531)
66,1
36
Offi
ce e
quip
men
t8,
014
6,88
1-
(522
)-
277
(3,2
72)
11,3
78
Plan
t and
mac
hine
ry10
11,
496
--
--
(100
)1,
497
Shee
p an
d ho
rses
--
--
--
-22
1,16
2,39
313
0,48
1-
(6,5
54)
90,7
74(5
,784
)(1
48,6
61)
1,22
2,64
9
Rec
onci
liatio
n of
pro
pert
y, p
lant
and
equ
ipm
ent -
Eco
nom
ic e
ntity
- 20
17O
peni
ng b
alan
ceA
ddit
ions
Adj
ustm
ents
Dis
posa
lsRe
valu
atio
nsRe
clas
s *
Dep
reci
atio
nTo
tal
Build
ings
138,
545
985
(3,0
31)
(75)
504,
953
1,63
7(3
,890
)63
9,12
4
Build
ings
- ai
r sys
tem
s5,
007
-(3
29)
(114
)-
998
(1,4
58)
4,10
4
Com
pute
r equ
ipm
ent
68,1
8211
0,74
5-
(920
)-
(1,5
36)
(53,
018)
123,
453
Furn
iture
and
fixt
ures
2,61
999
5-
(421
)-
(239
)81
43,
768
Labo
rato
ry e
quip
men
t90
,985
74,3
20(4
5)(9
07)
-1,
546
(31,
511)
134,
388
Land
3,20
8-
--
92,3
44-
-95
,552
Leas
ehol
d im
prov
emen
ts73
,967
-(6
31)
(99)
-(3
,597
)(5
,394
)64
,246
Mob
ile u
nits
12,4
79-
--
--
(2,1
28)
10,3
51
Mot
or v
ehic
les
1,26
178
,966
--
-(3
8)(8
97)
79,2
92
Offi
ce e
quip
men
t6,
525
4,07
23
(79)
-(2
14)
(2,2
93)
8,01
4
Plan
t and
mac
hine
ry15
137
-(1
)-
(21)
(29)
101
402,
793
270,
220
(4,0
33)
(2,6
16)
597,
297
(1,4
64)
(99,
804)
1,16
2,39
3
NO
TES
TO T
HE
AU
DIT
ED G
ROU
P A
NN
UA
L FI
NA
NCI
AL
STAT
EMEN
TS

ANNUAL REPORT 2017/18
Page - 241
ANNUAL REPORT 2017/18
Page - 241
Figu
res
in R
and
thou
sand
8.
Pro
pert
y, p
lant
and
equ
ipm
ent
(con
tinue
d)
Rec
onci
liatio
n of
pro
pert
y, p
lant
and
equ
ipm
ent -
Con
trol
ling
entit
y - 2
018
Ope
ning
bal
ance
Add
itio
nsA
djus
tmen
tsD
ispo
sals
Reva
luat
ions
Recl
ass
*D
epre
ciat
ion
Tota
l
Build
ings
602,
464
--
-87
,379
-(1
8,43
4)67
1,40
9
Build
ings
- ai
r sys
tem
s4,
095
73-
(3,4
35)
-1,
627
(1,4
97)
863
Com
pute
r equ
ipm
ent
123,
346
35,9
59-
(575
)-
(253
)(4
9,18
3)10
9,29
4
Furn
iture
and
fixt
ures
3,75
56,
318
-(2
67)
-(6
,101
)(3
37)
3,36
8
Labo
rato
ry e
quip
men
t13
2,93
072
,374
-(1
,593
)-
(1,3
25)
(47,
489)
154,
897
Land
95,5
52-
--
--
-95
,552
Leas
ehol
d im
prov
emen
ts64
,246
--
(145
)-
2(8
,334
)55
,769
Mob
ile u
nits
10,3
513,
754
--
--
(2,1
52)
11,9
53
Mot
or v
ehic
les
79,2
923,
375
--
--
(16,
531)
66,1
36
Offi
ce e
quip
men
t8,
002
6,88
1-
(522
)-
266
(3,2
70)
11,3
57
Plan
t and
mac
hine
ry10
11,
496
--
--
(100
)1,
497
1,12
4,13
413
0,23
0-
(6,5
37)
87,3
79(5
,784
)(1
47,3
27)
1,18
2,09
5
Rec
onci
liatio
n of
pro
pert
y, p
lant
and
equ
ipm
ent -
Con
trol
ling
entit
y - 2
017
Ope
ning
bal
-an
ceA
ddit
ions
Adj
ustm
ents
Dis
posa
lsRe
valu
atio
nsRe
clas
s *
Dep
reci
atio
nTo
tal
Build
ings
138,
235
975
(3,0
31)
(74)
468,
604
1,63
7(3
,882
)60
2,46
4
Build
ings
- ai
r sys
tem
s4,
994
-(3
29)
(114
)-
998
(1,4
54)
4,09
5
Com
pute
r equ
ipm
ent
68,0
7411
0,70
0-
(919
)-
(1,5
36)
(52,
973)
123,
346
Furn
iture
and
fixt
ures
2,58
699
5-
(421
)-
(239
)83
43,
755
Labo
rato
ry e
quip
men
t89
,223
74,3
11(4
5)(9
06)
-1,
551
(31,
204)
132,
930
Land
3,20
8-
--
92,3
44-
-95
,552
Leas
ehol
d im
prov
emen
ts73
,967
-(6
31)
(99)
-(3
,597
)(5
,394
)64
,246
Mob
ile u
nits
12,4
79-
--
--
(2,1
28)
10,3
51
Mot
or v
ehic
les
1,26
178
,966
--
-(3
8)(8
97)
79,2
92
Offi
ce e
quip
men
t6,
525
4,06
54
(80)
-(2
19)
(2,2
93)
8,00
2
Plan
t and
mac
hine
ry15
137
-(1
)-
(21)
(29)
101
400,
567
270,
149
(4,0
32)
(2,6
14)
560,
948
(1,4
64)
(99,
420)
1,12
4,13
4
NO
TES
TO T
HE
AU
DIT
ED G
ROU
P A
NN
UA
L FI
NA
NCI
AL
STAT
EMEN
TS

ANNUAL REPORT 2017/18
Page - 242
ANNUAL REPORT 2017/18
Page - 242
Economic entity Controlling entity
2018R ‘000
2017R ‘000
2018R ‘000
2017R ‘000
8. Property, plant and equipment (continued)
Reclasses represent corrections made in current year of assets incorrectly classified.
Assets subject to finance lease (Net carrying amount)
Included in property, plant and equipment above are the following finance leased assets.
Laboratory equipment 2,475 3,218 2,475 3,218
Motor vehicles 64,396 78,079 64,396 78,079
66,871 81,297 66,871 81,297
Revaluations
The effective date of the revaluations was 31 March 2018. Revaluations were performed by independent valuers, T. Mokhuwa (Professional Associated
Valuer) and R.A. Rakau (Professional Valuer), of Black Dot Property Consultants (Pty) Ltd. Mokhuwa and Rakau are not connected to the economic entity.
Land and buildings are re-valued independently every year.
The valuation was performed using the Depreciated Replacement Cost Method, and the following assumptions were used:
• Effective Age: - Effective age is the age indicated by the condition and utility of a building and was based on a valuer’s Judgement and interpretation of market perceptions. Actual age is the number of years that have elapsed since building construction was completed. Actual age is the initial element analysed in the estimation of effective age.
• Remaining Economic Life: - This is the estimated period over which existing improvements / buildings are expected to continue to contribute to property value. The remaining economic life extends from the date of the opinion of value to the end of the improvement’s economic life.
• Depreciation Percentages: - The improvements were assumed to be depreciated by an amount regarded as applicable to that improvement, based on current condition and expected remaining lifespan. Where buildings / improvements are well maintained, the buildings were basically being regarded to have a 50 year remaining lifespan.
These assumptions were based on current market conditions.
Had land and buildings been carried at their historical cost, the carrying amounts would have been:
Category
Land 3,208 3,208 3,208 3,208
Buildings 130,280 134,170 129,978 133,860
133,488 137,378 133,186 137,068
NOTES TO THE AUDITED GROUP ANNUAL FINANCIAL STATEMENTS
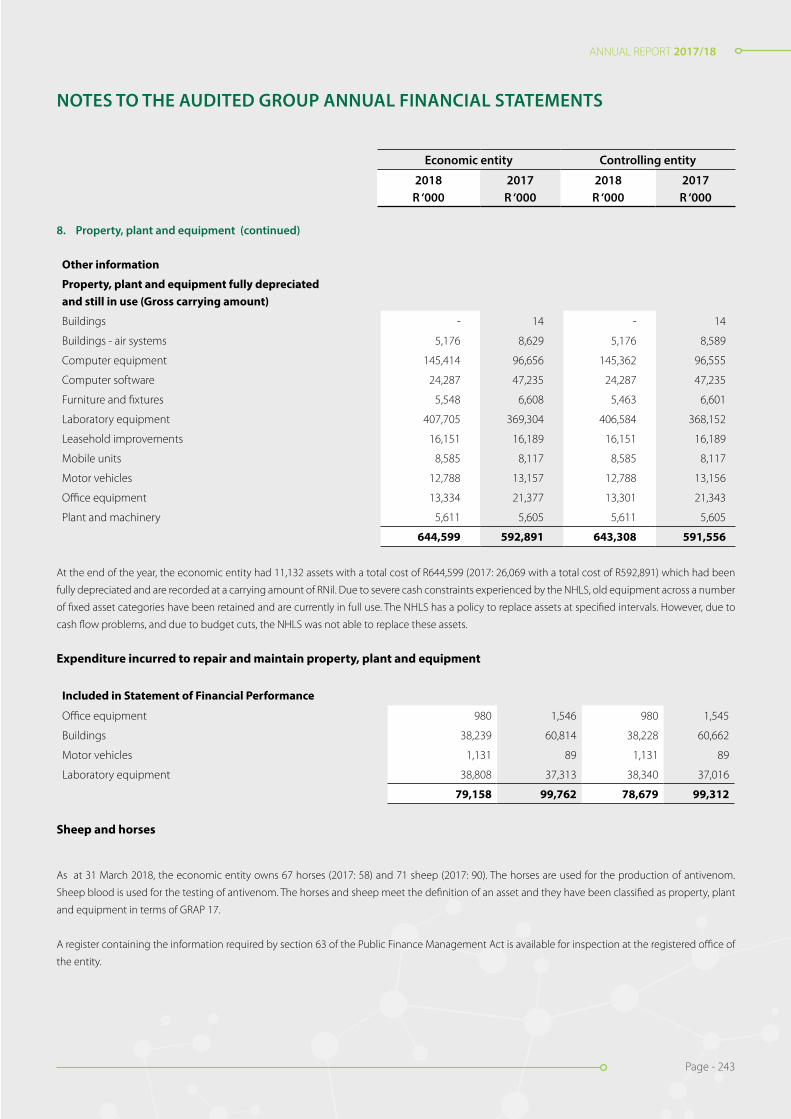
ANNUAL REPORT 2017/18
Page - 243
ANNUAL REPORT 2017/18
Page - 243
Economic entity Controlling entity
2018R ‘000
2017R ‘000
2018R ‘000
2017R ‘000
8. Property, plant and equipment (continued)
Other information
Property, plant and equipment fully depreciated and still in use (Gross carrying amount)
Buildings - 14 - 14
Buildings - air systems 5,176 8,629 5,176 8,589
Computer equipment 145,414 96,656 145,362 96,555
Computer software 24,287 47,235 24,287 47,235
Furniture and fixtures 5,548 6,608 5,463 6,601
Laboratory equipment 407,705 369,304 406,584 368,152
Leasehold improvements 16,151 16,189 16,151 16,189
Mobile units 8,585 8,117 8,585 8,117
Motor vehicles 12,788 13,157 12,788 13,156
Office equipment 13,334 21,377 13,301 21,343
Plant and machinery 5,611 5,605 5,611 5,605
644,599 592,891 643,308 591,556
At the end of the year, the economic entity had 11,132 assets with a total cost of R644,599 (2017: 26,069 with a total cost of R592,891) which had been
fully depreciated and are recorded at a carrying amount of RNil. Due to severe cash constraints experienced by the NHLS, old equipment across a number
of fixed asset categories have been retained and are currently in full use. The NHLS has a policy to replace assets at specified intervals. However, due to
cash flow problems, and due to budget cuts, the NHLS was not able to replace these assets.
Expenditure incurred to repair and maintain property, plant and equipment
Included in Statement of Financial Performance
Office equipment 980 1,546 980 1,545
Buildings 38,239 60,814 38,228 60,662
Motor vehicles 1,131 89 1,131 89
Laboratory equipment 38,808 37,313 38,340 37,016
79,158 99,762 78,679 99,312
Sheep and horses
As at 31 March 2018, the economic entity owns 67 horses (2017: 58) and 71 sheep (2017: 90). The horses are used for the production of antivenom.
Sheep blood is used for the testing of antivenom. The horses and sheep meet the definition of an asset and they have been classified as property, plant
and equipment in terms of GRAP 17.
A register containing the information required by section 63 of the Public Finance Management Act is available for inspection at the registered office of
the entity.
NOTES TO THE AUDITED GROUP ANNUAL FINANCIAL STATEMENTS

ANNUAL REPORT 2017/18
Page - 244
ANNUAL REPORT 2017/18
Page - 244
NOTES TO THE AUDITED GROUP ANNUAL FINANCIAL STATEMENTS
9. Intangible assets
Economic entity 2018 2017
Cost Accumulated amortisation and
accumulated impairment
Carrying value
Cost Accumulated amortisation and
accumulated impairment
Carrying value
Computer software 148,870 (114,318) 34,552 166,893 (88,917) 77,976
Patents 60 (30) 30 60 (27) 33
Total 148,930 (114,348) 34,582 166,953 (88,944) 78,009
Controlling entity 2018 2017
Cost Accumulated amortisation
and accumulat-ed impairment
Carrying value
Cost Accumulated amortisation
and accumulated impairment
Carrying value
Computer software 148,870 (114,318) 34,552 166,893 (88,917) 77,976
Patents 60 (30) 30 60 (27) 33
Total 148,930 (114,348) 34,582 166,953 (88,944) 78,009
Reconciliation of intangible assets - Economic entity - 2018
Opening balance
Additions Disposals Reclass * Amortisation Total
Computer software 77,976 390 (12) 307 (44,109) 34,552
Patents 33 - - - (3) 30
78,009 390 (12) 307 (44,112) 34,582
Reconciliation of intangible assets - Economic entity - 2017
Opening balance
Additions Disposals Reclass * Amortisation Total
Computer software 113,501 3,737 - 1,465 (40,727) 77,976
Patents 36 - - - (3) 33
113,537 3,737 - 1,465 (40,730) 78,009
Reconciliation of intangible assets - Controlling entity - 2018
Opening balance
Additions Disposals Reclass * Amortisation Total
Computer software 77,976 390 (12) 307 (44,109) 34,552
Patents 33 - - - (3) 30
78,009 390 (12) 307 (44,112) 34,582

ANNUAL REPORT 2017/18
Page - 245
ANNUAL REPORT 2017/18
Page - 245
NOTES TO THE AUDITED GROUP ANNUAL FINANCIAL STATEMENTS
9. Intangible assets (continued)
Controlling entity 2018 2017
Reconciliation of intangible assets - Controlling entity - 2017
Opening balance
Additions Disposals Reclass * Amortisation Total
Computer software 113,501 3,737 - 1,465 (40,727) 77,976
Patents 36 - - - (3) 33
113,537 3,737 - 1,465 (40,730) 78,009
Reclasses represent corrections made in current year of intangible assets incorrectly classified as property, plant and equipment.

ANNUAL REPORT 2017/18
Page - 246
ANNUAL REPORT 2017/18
Page - 246
Economic entity Controlling entity
2018R ‘000
2017R ‘000
2018R ‘000
2017R ‘000
10. Investments in controlled entities
Name of company Held by % holding 2018
% holding 2017
Carrying amount 2018
Carrying amount 2017
South African Vaccine Producers (Pty) Limited
National Health Laboratory Service
100.00 % 100.00 % 10 10
10 10
Impairment of investment in controlled entities
100.00 % 100.00 % (10) (10)
- -
The carrying amounts of controlled entities are shown net of impairment losses.
11. Loans to economic entities
Controlled entitiesSouth African Vaccine Producers (Pty) Ltd - - 36,382 35,314
- - 36,382 35,314
Impairment of loans to controlled entities - - (36,382) (35,314)
- - - -
The Controlling entity has subordinated its rights to claim payments of debts of R36,382m (2017: R35,314m) owing to it by South African Vaccine Pro-
ducers (Pty) Limited until the assets of the subsidiary, fairly valued, exceeds its liabilities. The report of the Accounting Authority contains further details
of the subsidiary.
Loan to SAVP impaired
As of 31 March 2018, loans to economic entities of R 36,382 (2017: R 35,314) were provided for impairment.
The ageing of these loans is as follows:
Over 6 months - - 36,382 35,314
NOTES TO THE AUDITED GROUP ANNUAL FINANCIAL STATEMENTS
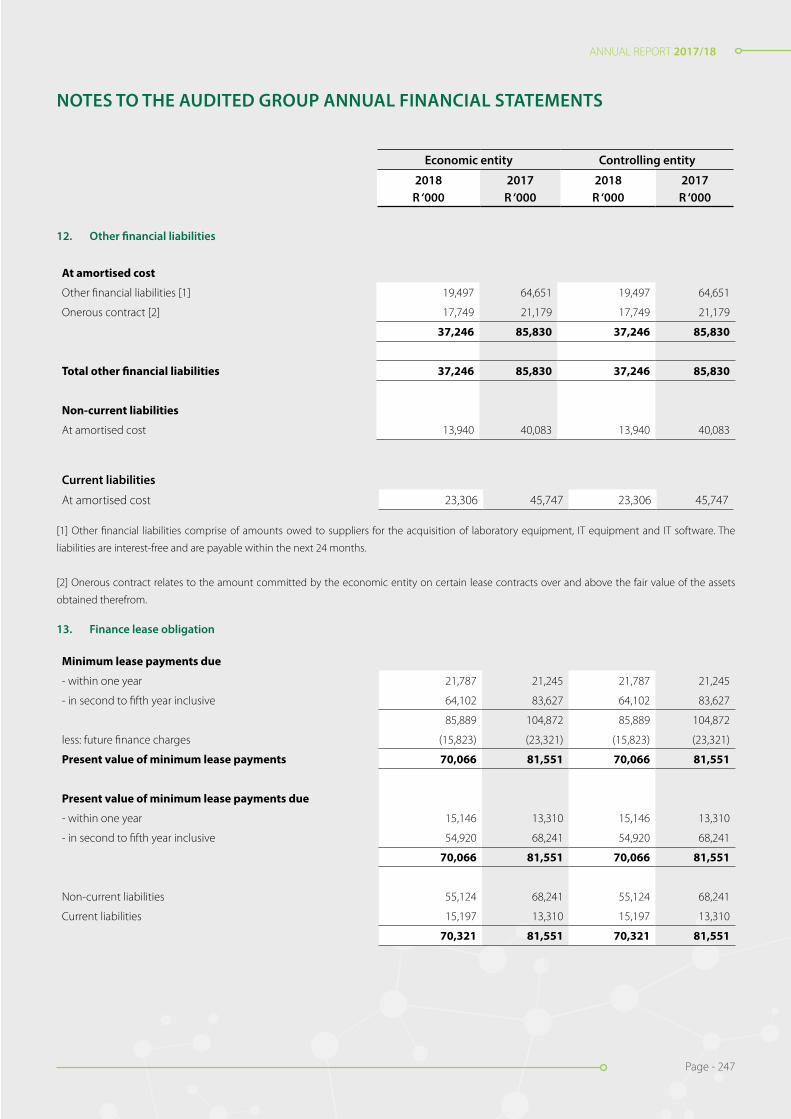
ANNUAL REPORT 2017/18
Page - 247
ANNUAL REPORT 2017/18
Page - 247
NOTES TO THE AUDITED GROUP ANNUAL FINANCIAL STATEMENTS
Economic entity Controlling entity
2018R ‘000
2017R ‘000
2018R ‘000
2017R ‘000
12. Other financial liabilities
At amortised cost
Other financial liabilities [1] 19,497 64,651 19,497 64,651
Onerous contract [2] 17,749 21,179 17,749 21,179
37,246 85,830 37,246 85,830
Total other financial liabilities 37,246 85,830 37,246 85,830
Non-current liabilities
At amortised cost 13,940 40,083 13,940 40,083
Current liabilities
At amortised cost 23,306 45,747 23,306 45,747
[1] Other financial liabilities comprise of amounts owed to suppliers for the acquisition of laboratory equipment, IT equipment and IT software. The
liabilities are interest-free and are payable within the next 24 months.
[2] Onerous contract relates to the amount committed by the economic entity on certain lease contracts over and above the fair value of the assets
obtained therefrom.
13. Finance lease obligation
Minimum lease payments due
- within one year 21,787 21,245 21,787 21,245
- in second to fifth year inclusive 64,102 83,627 64,102 83,627
85,889 104,872 85,889 104,872
less: future finance charges (15,823) (23,321) (15,823) (23,321)
Present value of minimum lease payments 70,066 81,551 70,066 81,551
Present value of minimum lease payments due
- within one year 15,146 13,310 15,146 13,310
- in second to fifth year inclusive 54,920 68,241 54,920 68,241
70,066 81,551 70,066 81,551
Non-current liabilities 55,124 68,241 55,124 68,241
Current liabilities 15,197 13,310 15,197 13,310
70,321 81,551 70,321 81,551

ANNUAL REPORT 2017/18
Page - 248
ANNUAL REPORT 2017/18
Page - 248
Economic entity Controlling entity
2018R ‘000
2017R ‘000
2018R ‘000
2017R ‘000
13. Finance lease obligation (continued)
It is economic entity’s policy to lease certain motor vehicles and equipment under finance leases.
The average lease term was 5 years and the average effective borrowing rate was 10.50% (2017:10.5%).
Interest rates are fixed at the contract date. All leases have fixed repayments and no arrangements have been entered into for contingent rent.
The economic entity’s obligations under finance leases are secured by the lessor’s charge over the leased assets. Refer note 7.
14. Payables from exchange transactions
Trade payables * 516,790 655,061 516,436 654,856
Accrued expenses 391,857 204,372 390,610 203,433
Other payables ** 99,085 102,460 98,897 102,240
1,007,731 961,893 1,005,944 960,529
* Trade payables are non-interest bearing and are normally settled on 30-day payment terms. Payments amounting to R390m (2016: R467.1m) were not
made within the NHLS’ terms and conditions agreed with its suppliers.
** Other payables are made up of employee cost related liabilities, debtors with credit balances and other sundry payables.
15. Employee benefit obligations
Defined benefit plan
The plan is a post-employment medical benefit plan.
Post-retirement medical aid plan
NHLS provides post-employment healthcare benefits. Members who joined NHLS before 1 January 2003, and KZN members who joined NHLS before 1
October 2006 are eligible for a subsidy of medical scheme contributions in retirement.
The amounts recognised in the statement of financial position are as follows:
Carrying value
Present value of the defined benefit obligation-wholly (1,000,034) (1,022,679) (1,000,034) (1,022,679)
unfunded
Non-current liabilities (973,554) (999,123) (973,554) (999,123)
Current liabilities (26,480) (23,556) (26,480) (23,556)
(1,000,034) (1,022,679) (1,000,034) (1,022,679)
NOTES TO THE AUDITED GROUP ANNUAL FINANCIAL STATEMENTS
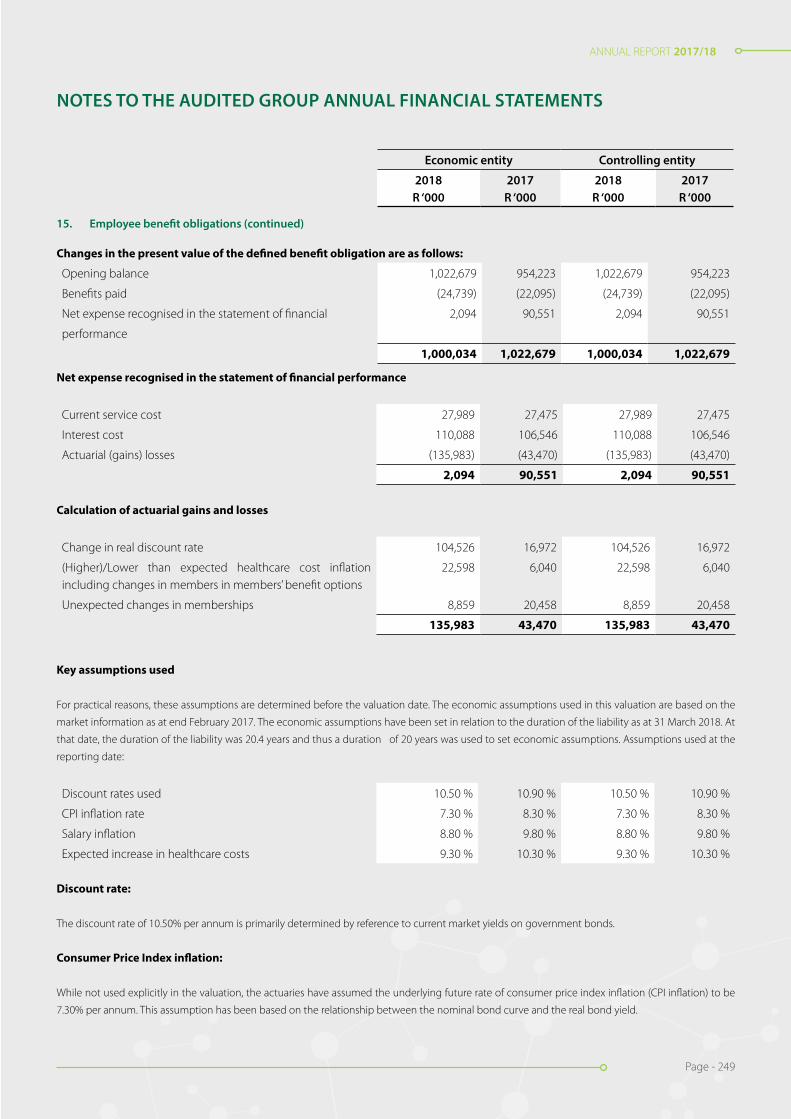
ANNUAL REPORT 2017/18
Page - 249
ANNUAL REPORT 2017/18
Page - 249
NOTES TO THE AUDITED GROUP ANNUAL FINANCIAL STATEMENTS
Economic entity Controlling entity
2018R ‘000
2017R ‘000
2018R ‘000
2017R ‘000
15. Employee benefit obligations (continued)
Changes in the present value of the defined benefit obligation are as follows:
Opening balance 1,022,679 954,223 1,022,679 954,223
Benefits paid (24,739) (22,095) (24,739) (22,095)
Net expense recognised in the statement of financial 2,094 90,551 2,094 90,551
performance
1,000,034 1,022,679 1,000,034 1,022,679
Net expense recognised in the statement of financial performance
Current service cost 27,989 27,475 27,989 27,475
Interest cost 110,088 106,546 110,088 106,546
Actuarial (gains) losses (135,983) (43,470) (135,983) (43,470)
2,094 90,551 2,094 90,551
Calculation of actuarial gains and losses
Change in real discount rate 104,526 16,972 104,526 16,972
(Higher)/Lower than expected healthcare cost inflation including changes in members in members’ benefit options
22,598 6,040 22,598 6,040
Unexpected changes in memberships 8,859 20,458 8,859 20,458
135,983 43,470 135,983 43,470
Key assumptions used
For practical reasons, these assumptions are determined before the valuation date. The economic assumptions used in this valuation are based on the
market information as at end February 2017. The economic assumptions have been set in relation to the duration of the liability as at 31 March 2018. At
that date, the duration of the liability was 20.4 years and thus a duration of 20 years was used to set economic assumptions. Assumptions used at the
reporting date:
Discount rates used 10.50 % 10.90 % 10.50 % 10.90 %
CPI inflation rate 7.30 % 8.30 % 7.30 % 8.30 %
Salary inflation 8.80 % 9.80 % 8.80 % 9.80 %
Expected increase in healthcare costs 9.30 % 10.30 % 9.30 % 10.30 %
Discount rate:
The discount rate of 10.50% per annum is primarily determined by reference to current market yields on government bonds.
Consumer Price Index inflation:
While not used explicitly in the valuation, the actuaries have assumed the underlying future rate of consumer price index inflation (CPI inflation) to be
7.30% per annum. This assumption has been based on the relationship between the nominal bond curve and the real bond yield.

ANNUAL REPORT 2017/18
Page - 250
ANNUAL REPORT 2017/18
Page - 250
NOTES TO THE AUDITED GROUP ANNUAL FINANCIAL STATEMENTS
Economic entity Controlling entity
2018R ‘000
2017R ‘000
2018R ‘000
2017R ‘000
15. Employee benefit obligations (continued)
Income at Retirement:
Income at retirement is relevant to the extent that the contribution tables are based on income. The actuaries have assumed that an individual member’s
income would increase by 8.80% per annum, based on the underlying assumption that individual remuneration increase including merit and promotional
increases would exceed CPI inflation by an average of 1.5% per annum over the long term. The actuarial assumption is that income at retirement would
be 65% of final salary.
Healthcare cost inflation:
The current contribution tables of the medical schemes would continue to apply in the future, with allowances of inflationary increases of 9.30% per
annum. In consultation with the NHLS, assumptions made by the actuaries state that healthcare cost inflation exceed CPI inflation by an average of 2.00%
per annum over the long term.
Sensitivity analysis
Assumed healthcare cost trends rates have a significant effect on the amounts recognised in surplus or deficit. A one percentage point change in
assumed healthcare cost trends rates would have the following effects:
2018 2018 2017 2017
One percentage
One percentage
One percentage
One percentage
point increase point decrease
point increase point decrease
Effect on the aggregate of the service cost and interest cost 25,337 (20,028) 28,778 (22,577)
Effect on defined benefit obligation 182,610 (145,542) 197,972 (156,706)
Amounts for the current and previous four years are as follows:
2018 2017 2016 2015 2014
R ‘000 R ‘000 R ‘000 R ‘000 R ‘000
Defined benefit obligation 1,000,034 1,022,679 954,223 876,457 737,155
Defined contribution plan
It is the policy of the economic entity to provide retirement benefits to all its employees. A number of defined contribution provident funds, all of which
are subject to the Pensions Fund Act exist for this purpose.
The economic entity is under no obligation to cover any unfunded benefits.

ANNUAL REPORT 2017/18
Page - 251
ANNUAL REPORT 2017/18
Page - 251
NOTES TO THE AUDITED GROUP ANNUAL FINANCIAL STATEMENTS
Economic entity Controlling entity
2018R ‘000
2017R ‘000
2018R ‘000
2017R ‘000
15. Employee benefit obligations (continued)
The total economic entity contribution to such schemes
Recognised as cost of sales 188,609 180,001 187,627 179,097
Recognised as general expenses 30,100 116,347 30,100 116,319
218,709 296,348 217,727 295,416
16. Unspent conditional grants and receipts
Conditional grant funds are recognised only when grant conditions are met.
Unspent conditional grants and receipts comprises of:
Unspent conditional grants and receipts
Research grants 20,316 12,252 20,316 12,252
Movement during the year
Balance at the beginning of the year 12,252 4,137 12,252 4,137
Additions during the year 19,290 28,301 19,290 28,301
Income recognition during the year (11,226) (20,186) (11,226) (20,186)
20,316 12,252 20,316 12,252
17. Provisions Reconciliation of provisions - Economic entity - 2018
Opening Balance
Additions Utilised during the
year
Reversed during the
year
Total
Bonus provision [1] 544 126,415 (126,467) - 492
DoH utility charges provision [2] 405,357 113,038 (13,118) - 505,277
Leave pay provision [3] 185,789 30,048 (13,352) - 202,485
Salaries provision [4] 116,197 22,890 - - 139,087
Student bursary provision [5] 6,059 2,750 - (2,309) 6,500
713,946 295,141 (152,937) (2,309) 853,841 Reconciliation of provisions - Economic entity - 2017
Opening Balance
Additions Utilised during the
year
Reversed during the
year
Total
Bonus provision [1] 5,196 121,907 (126,559) - 544
DoH utility charges provision [2] 387,757 59,169 (41,569) - 405,357
Leave pay provision [3] 140,654 62,027 (14,058) (2,834) 185,789
Salaries provision [4] 150,481 21,314 (18,632) (36,966) 116,197
Student bursary provision [5] 3,975 6,059 (3,975) - 6,059
688,063 270,476 (204,793) (39,800) 713,946

ANNUAL REPORT 2017/18
Page - 252
ANNUAL REPORT 2017/18
Page - 252
NOTES TO THE AUDITED GROUP ANNUAL FINANCIAL STATEMENTS
Economic entity Controlling entity
2018R ‘000
2017R ‘000
2018R ‘000
2017R ‘000
17. Provisions (continued)
Reconciliation of provisions - Controlling entity - 2018
Opening Balance
Additions Utilised during the
year
Reversed during the
year
Total
Bonus provision [1] 544 126,415 (126,467) - 492
DoH utility charges provision [2] 405,357 113,038 (13,118) - 505,277
Leave pay provision [3] 185,789 30,048 (13,352) - 202,485
Salaries provision [4] 116,197 22,890 - - 139,087
Student bursary provision [5] 6,059 2,750 - (2,309) 6,500
713,946 295,141 (152,937) (2,309) 853,841
Reconciliation of provisions - Controlling entity - 2017
Opening Balance
Addi-tions
Utilised during the
year
Reversed during the
year
Total
Bonus provision [1] 5,196 121,907 (126,559) - 544
DoH utility charges provision [2] 387,757 59,169 (41,569) - 405,357
Leave pay provision [3] 140,654 62,027 (14,058) (2,834) 185,789
Salaries provision [4] 150,481 21,314 (18,632) (36,966) 116,197
Student bursary provision [5] 3,975 6,059 (3,975) - 6,059
688,063 270,476 (204,793) (39,800) 713,946
[1] The bonus provision is made up of the following:
• Certain employees in bands D and above who are on the cost to company package and elect to structure part of their package as a 13th cheque. The provision is utilised when employees become entitled to and are paid for their services to the entity. The bonus payable is determined by applying a specific formula based on the employees’ total cost to company; and
• A 13th cheque for employees in bands A to C which is payable in December each year.
[2] The DoH utility charges provision relates to utilities and maintenance fees owing to the DoH for various provincial hospital facilities around the
country. Significant adjustments to the provision pertain to changes in the rate charged per square meter as well as the reversal of the utilities provision
relating to Eastern Cape Province.
[3] The leave pay provision relates to vesting leave pay to which employees may become entitled upon leaving the employment of the economic
entity. The provision arises as employees render a service that increases their entitlement to future compensated leave and is calculated based on an
employee’s total cost of employment. The provision is utilised when employees become entitled to and are paid for the accumulated leave pay or utilise
compensated leave due to them.
[4] The economic entity has an agreement with Walter Sisulu University wherein the NHLS is required to pay part of the salaries for pathological academic
staff. The amount has been estimated in the absence of actual figures and invoices. moved from its previous leased premises.
[5] Student bursary provisions relate to contractual commitments made by the economic entity by year end to fund student education for which the
amount cannot yet be determined. The economic entity makes a provision based of the number of students awarded bursaries and amounts estimated
using historical experiences.

ANNUAL REPORT 2017/18
Page - 253
ANNUAL REPORT 2017/18
Page - 253
NOTES TO THE AUDITED GROUP ANNUAL FINANCIAL STATEMENTS
Economic entity Controlling entity
2018R ‘000
2017R ‘000
2018R ‘000
2017R ‘000
18. Deferred tax
Deferred tax liability
Property, plant and equipment (10,914) (10,234) - -
Reconciliation of deferred tax liability
At beginning of year (10,234) - - -
Taxable temporary difference movement on tangible fixed assets (680) (10,234) - -
(10,914) (10,234) - -
19. Contributed capital
Initial capital contribution 332 332 332 332
The economic entity’s sole shareholder is the South African government. There have been no shares issued since the incorporation of NHLS.
20. Revaluation reserve
Opening balance 597,297 - 560,947 -
Change during the year 90,774 597,297 87,379 560,947
688,071 597,297 648,326 560,947
Revaluation surplus relating to property, plant and equip-ment
Revaluation surplus beginning of period 597,297 - 560,947 -
Movements in the reserve for the year 90,774 597,297 87,379 560,947
688,071 597,297 648,326 560,947
21. Revenue
Sale of goods 21,563 22,535 - -
Rendering of services 7,076,656 6,356,448 7,076,656 6,356,448
Miscellaneous other revenue * 71,194 652 71,194 652
Government grants & subsidies 746,464 715,270 746,464 715,270
7,915,877 7,094,905 7,894,314 7,072,370
The amount included in revenue arising from exchanges of goods or services are as follows:
Sale of goods 21,563 22,535 - -
Rendering of services 7,076,656 6,356,448 7,076,656 6,356,448
Miscellaneous other revenue 71,194 652 71,194 652
7,169,413 6,379,635 7,147,850 6,357,100

ANNUAL REPORT 2017/18
Page - 254
ANNUAL REPORT 2017/18
Page - 254
NOTES TO THE AUDITED GROUP ANNUAL FINANCIAL STATEMENTS
Economic entity Controlling entity
2018R ‘000
2017R ‘000
2018R ‘000
2017R ‘000
21. Revenue (continued)
* Miscellaneous other revenue constitutes other income from other activities of the NHLS. The increase in this amount was due to conferences hosted
by the NHLS during the year.
The amount included in revenue arising from non- exchange transactions is as follows:
Transfer revenue
Government grants & subsidies 746,464 715,270 746,464 715,270
22. Cost of sales
Direct employee costs 3,078,817 2,903,889 3,064,860 2,890,028
Direct depreciation and impairments 172,387 118,970 171,109 118,633
Direct material expenses 3,026,397 2,809,893 3,022,806 2,804,963
6,277,601 5,832,752 6,258,775 5,813,624
23. Other income
Bad debts recovered 671 2,209 671 2,209
Discount received 1,134 1,380 1,133 1,378
Exchange gains 3,376 10,619 3,376 10,619
Fair value adjustments: Notional interest - 60,560 - 60,560
Grant income recognised 264,554 149,376 264,554 149,376
Internal recoveries 11,036 8,453 11,036 8,453
Royalties received 408 253 408 253
Sundry income 690 17,808 690 17,808
Teaching income 45,172 18,461 45,172 18,461
327,041 269,119 327,040 269,117
24. Operating surplus (deficit)
Operating surplus (deficit) for the year is stated after accounting for the following:
Operating lease charges
Premises
• Straight-lined 3,624 3,298 3,624 3,298
Motor vehicles
• Straight-lined - 391 - 391
Equipment
• Straight-lined 64,796 62,339 64,657 62,207
68,420 66,028 68,281 65,896

ANNUAL REPORT 2017/18
Page - 255
ANNUAL REPORT 2017/18
Page - 255
NOTES TO THE AUDITED GROUP ANNUAL FINANCIAL STATEMENTS
Economic entity Controlling entity
2018R ‘000
2017R ‘000
2018R ‘000
2017R ‘000
24. Operating surplus (deficit) (continued)
Loss on sale of property, plant and equipment (6,579) (14,326) (6,562) (14,324)
Amortisation on intangible assets 4,254 2,188 4,254 2,188
Depreciation on property, plant and equipment 188,515 138,378 187,180 137,993
Employee costs 3,326,192 3,239,156 3,312,233 3,224,885
25. Investment income
Interest revenue
Bank 87,850 62,182 87,509 61,965
Interest received - debtors 15,085 91,684 15,085 91,684
Loans to directors managers and employees 1 - 1 -
102,936 153,866 102,595 153,649
26. Finance costs
Amortisation of liabilities [1] 7,824 11,510 7,824 11,510
Bank 2 30 2 30
Finance leases 8,132 612 8,132 612
Late payment of tax 140 - 15 -
Other interest paid [2] - 11,612 - 11,612
16,098 23,764 15,973 23,764
[1] Finance costs relate mainly to the amortisation charges of onerous contract liability, Microsoft and Tech Mahindra liabilities whose payments are
deferred over 24 to 60 months.
[2] Other interest relates mainly to notional interest on creditors.

ANNUAL REPORT 2017/18
Page - 256
ANNUAL REPORT 2017/18
Page - 256
NOTES TO THE AUDITED GROUP ANNUAL FINANCIAL STATEMENTS
Economic entity Controlling entity
2018R ‘000
2017R ‘000
2018R ‘000
2017R ‘000
27. Taxation
Major components of the tax expense
Current
Local income tax - current period 774 455 - -
Local income tax - recognised in current tax for prior periods (10) 563 - -
764 1,018 - -
Deferred
Originating and reversing temporary differences 680 10,234 - -
1,444 11,252 - -
Reconciliation of the tax expense
Reconciliation between applicable tax rate and average effec-tive tax rate.
Applicable tax rate 28.00 % 28.00 % - % - %
Exempt income 52.90 % 537.80 % - % - %
80.90 % 565.80 % - % - %
28. Employee related costs
Basic 2,434,252 2,276,346 2,424,072 2,266,580
Bonus 127,359 122,186 126,639 121,469
Defined contribution plans 218,709 296,348 217,727 295,416
External bursaries 9,406 7,133 9,406 7,133
Leave pay provision charge 29,956 59,192 29,949 58,255
Long-term benefits - incentive scheme 3,159 3,575 3,117 3,529
Medical aid - company contributions 186,266 170,597 185,312 169,748
Other allowances 166,634 162,654 166,634 162,654
Other short term costs 104,906 97,226 104,224 96,610
SDL 26,619 21,799 26,497 21,682
Training 171 225 27 53
UIF 12,098 11,985 12,029 11,918
WCA 6,657 9,890 6,600 9,838
3,326,192 3,239,156 3,312,233 3,224,885

ANNUAL REPORT 2017/18
Page - 257
ANNUAL REPORT 2017/18
Page - 257
NOTES TO THE AUDITED GROUP ANNUAL FINANCIAL STATEMENTS
Economic entity Controlling entity
2018R ‘000
2017R ‘000
2018R ‘000
2017R ‘000
28. Employee related costs (continued)
Employee costs are split into cost of sales and general expens-es as follows:
Cost of sales - employee costs 3,078,817 2,903,889 3,064,860 2,890,028
General expenses - employee costs 247,375 335,267 247,373 334,857
3,326,192 3,239,156 3,312,233 3,224,885
29. General expenses (by function)
Advertising 777 1,277 777 1,277
Archiving and Storage 7,974 6,844 7,974 6,844
Auditors remuneration 8,096 6,627 7,770 6,357
Bad debts written off 1,054,662 22,606 1,054,662 22,606
Bank charges 4,062 1,278 4,028 1,254
Cleaning 36,238 33,735 36,131 33,611
Computer expenses 747 1,450 747 1,450
Conferences and seminars 494 583 440 572
Consulting and professional fees 52,844 61,101 52,663 60,976
Consumables 14,205 13,008 14,174 12,930
Contributions to debt impairment provision (1,325,350) 2,492,575 (1,324,281) 2,491,125
Debt collection 1,670 1,109 1,670 1,109
Delivery expenses 1,728 749 1,727 749
Depreciation, amortisation and impairments 20,382 21,596 20,325 21,548
Discount allowed 10,967 16,455 10,967 16,455
Employee costs 247,375 335,267 247,373 334,857
Entertainment 116 70 116 70
Loss on disposal of assets and liabilities 6,579 14,326 6,562 14,324
Insurance 4,706 985 4,706 985
Lease rentals on operating lease 60,266 58,337 60,140 58,337
Legal expenses 7,697 4,873 7,672 4,849
Medical expenses 45 9,076 45 9,076
Minor assets 3,534 4,181 3,498 4,168
Motor vehicle expenses 4,000 907 4,000 907
Other contract expenses - 21,295 - 21,295
Other expenses 11,367 205 11,367 205
Packaging 7,845 7,833 7,790 7,765
Petrol and oil 5,197 4,971 5,197 4,971
Postage and courier 189 213 188 213
Printing and stationery 37,598 36,813 37,493 36,721

ANNUAL REPORT 2017/18
Page - 258
ANNUAL REPORT 2017/18
Page - 258
Economic entity Controlling entity
2018R ‘000
2017R ‘000
2018R ‘000
2017R ‘000
29. General expenses (by function) (continued)
Project Management expenses 1,269 2 1,269 2
Promotions 365 663 365 663
Promotions and sponsorships 2 200 2 200
Repairs and maintenance 40,350 62,449 40,339 62,296
Research Trust - 49 - 49
Security 15,413 12,900 15,413 12,900
Software development expenses 7,635 25,455 7,635 25,455
Software expenses 93,364 67,775 93,364 67,775
Staff welfare 9,302 8,780 9,253 8,722
Subscriptions and membership fees 6,674 5,208 6,674 5,181
Telephone and fax 83,497 46,883 83,409 46,773
Training 16,011 13,819 16,011 13,819
Travel - local 48,741 52,671 48,741 52,671
Travel - overseas 124 751 124 751
Utilities 139,401 82,339 139,401 82,339
748,158 3,560,289 747,921 3,557,202
30. Auditors’ remuneration
Audit Fees - current year 6,751 5,689 6,401 5,389
Adjustment for previous year (24) 36 - 66
Fees for other services 1,153 214 1,153 214
Expenses 216 688 216 688
8,096 6,627 7,770 6,357
Auditors’ remuneration consists of external and internal audit remuneration. Internal audit services are co-sourced.
31. Depreciation and amortisation
Depreciation and amortisation - Cost of sales 172,387 118,970 171,109 118,633
Depreciation and amortisation - General expenses 20,382 21,596 20,325 21,548
192,769 140,566 191,434 140,181
32. Cash generated from (used in) operations
Surplus (deficit) for the year 1,315,051 (1,910,167) 1,313,631 (1,899,454)
Adjustments for:
Depreciation and amortisation 192,769 140,566 191,434 140,181
NOTES TO THE AUDITED GROUP ANNUAL FINANCIAL STATEMENTS

ANNUAL REPORT 2017/18
Page - 259
ANNUAL REPORT 2017/18
Page - 259
NOTES TO THE AUDITED GROUP ANNUAL FINANCIAL STATEMENTS
Economic entity Controlling entity
2018R ‘000
2017R ‘000
2018R ‘000
2017R ‘000
32. Cash generated from (used in) operations (continued)
Gain on sale of assets and liabilities 6,579 14,326 6,562 14,324
Gain on foreign exchange (3,376) (10,619) (3,376) (10,619)
Fair value adjustments (22) - - -
Finance costs 15,973 23,764 15,973 23,764
Debt impairment (270,688) 2,515,181 (269,619) 2,513,731
Movements in retirement benefit assets and liabilities (22,645) 68,456 (22,645) 68,456
Movements in provisions 139,895 25,883 139,895 25,883
Movement in tax receivable and payable 221 475 - -
Annual charge for deferred tax 680 10,234 - -
Prior period adjustments (37,615) 39,980 (37,615) 40,011
Onerous contract costs - 21,295 - 21,295
Other non-cash items 5,925 5,442 5,925 5,410
Notional interest - (60,560) - (60,560)
Changes in working capital:
Inventories (7,569) (12,625) (5,615) (12,251)
Receivables from exchange transactions (308,752) (971,715) (310,559) (969,671)
Other receivables from non-exchange transactions (137,095) (96,126) (137,095) (96,127)
Payables from exchange transactions 45,839 98,945 45,414 98,817
Other receivables from non-exchange transactions - (13,200) - (13,200)
Unspent conditional grants and receipts (4,286) 8,115 (4,286) 8,115
930,884 (102,350) 928,024 (101,895)
33. Tax paid
Balance at beginning of the year (475) - - -
Current tax for the year recognised in surplus or deficit (764) (1,018) - -
Balance at end of the year 821 475 - -
(418) (543) - -

ANNUAL REPORT 2017/18
Page - 260
ANNUAL REPORT 2017/18
Page - 260
NOTES TO THE AUDITED GROUP ANNUAL FINANCIAL STATEMENTS
Economic entity Controlling entity
2018R ‘000
2017R ‘000
2018R ‘000
2017R ‘000
34. Financial instruments disclosure Categories of financial instruments Economic entity - 2018 Financial assets
At amortised cost Total
Receivables from exchange transactions 2,219,016 2,219,016
Other receivables from non-exchange transactions 234,348 234,348
Cash and cash equivalents 1,119,144 1,119,144
3,572,508 3,572,508
Financial liabilities
Other financial liabilities At amortised cost Total
37,246 37,246
Payables from exchange transactions 1,007,731 1,007,731
Finance lease liability 70,321 70,321
1,115,298 1,115,298
Economic entity - 2017 Financial assets
At amortised cost Total
Receivables from exchange transactions 1,638,752 1,638,752
Other receivables from non-exchange transactions 97,253 97,253
Cash and cash equivalents 391,976 391,976
2,127,981 2,127,981
Financial liabilities
At amortised cost Total
Other financial liabilities 85,830 85,830
Payables from exchange transactions 961,893 961,893
Finance lease liability 81,551 81,551
1,129,274 1,129,274
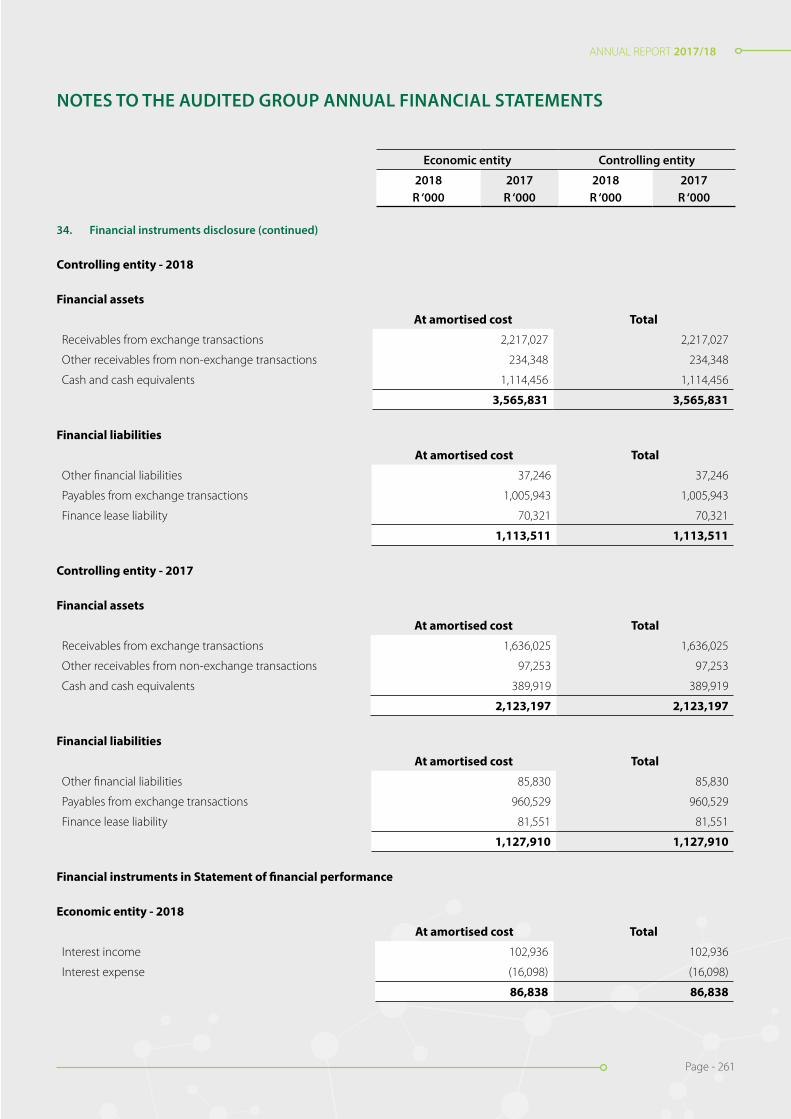
ANNUAL REPORT 2017/18
Page - 261
ANNUAL REPORT 2017/18
Page - 261
NOTES TO THE AUDITED GROUP ANNUAL FINANCIAL STATEMENTS
Economic entity Controlling entity
2018R ‘000
2017R ‘000
2018R ‘000
2017R ‘000
34. Financial instruments disclosure (continued)
Controlling entity - 2018 Financial assets
At amortised cost Total
Receivables from exchange transactions 2,217,027 2,217,027
Other receivables from non-exchange transactions 234,348 234,348
Cash and cash equivalents 1,114,456 1,114,456
3,565,831 3,565,831 Financial liabilities
At amortised cost Total
Other financial liabilities 37,246 37,246
Payables from exchange transactions 1,005,943 1,005,943
Finance lease liability 70,321 70,321
1,113,511 1,113,511
Controlling entity - 2017 Financial assets
At amortised cost Total
Receivables from exchange transactions 1,636,025 1,636,025
Other receivables from non-exchange transactions 97,253 97,253
Cash and cash equivalents 389,919 389,919
2,123,197 2,123,197
Financial liabilities
At amortised cost Total
Other financial liabilities 85,830 85,830
Payables from exchange transactions 960,529 960,529
Finance lease liability 81,551 81,551
1,127,910 1,127,910
Financial instruments in Statement of financial performance Economic entity - 2018
At amortised cost Total
Interest income 102,936 102,936
Interest expense (16,098) (16,098)
86,838 86,838
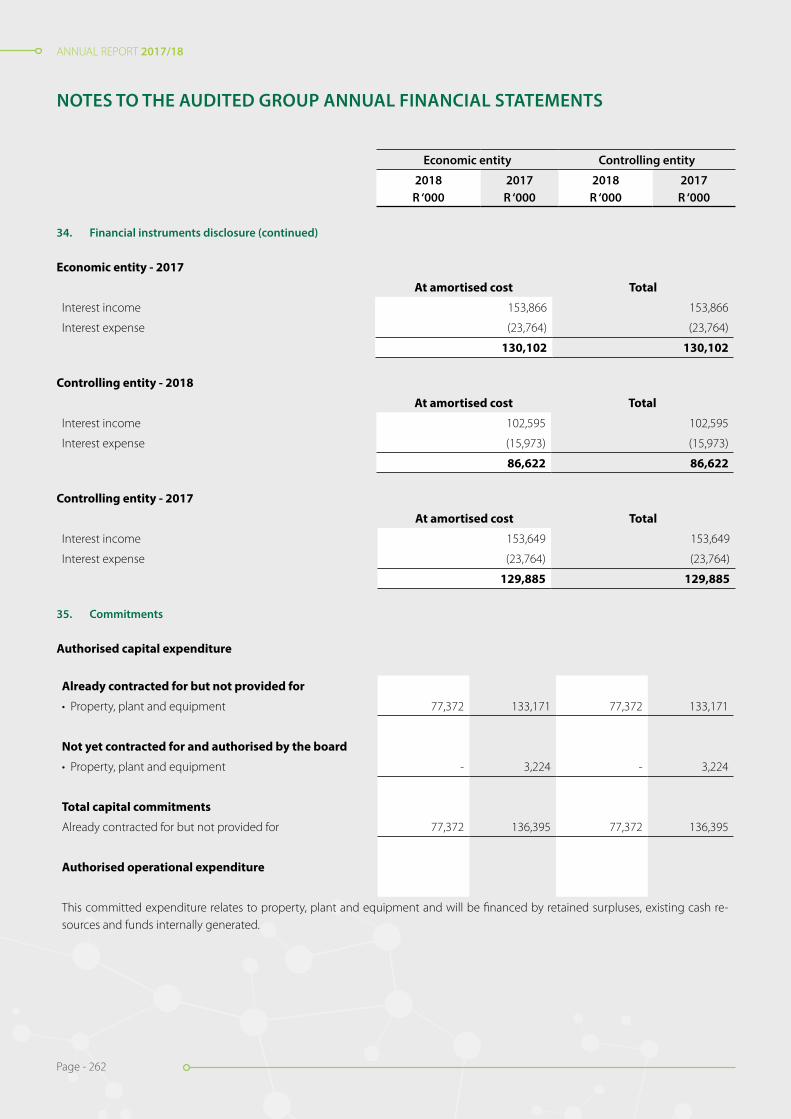
ANNUAL REPORT 2017/18
Page - 262
ANNUAL REPORT 2017/18
Page - 262
NOTES TO THE AUDITED GROUP ANNUAL FINANCIAL STATEMENTS
Economic entity Controlling entity
2018R ‘000
2017R ‘000
2018R ‘000
2017R ‘000
34. Financial instruments disclosure (continued)
Economic entity - 2017
At amortised cost Total
Interest income 153,866 153,866
Interest expense (23,764) (23,764)
130,102 130,102
Controlling entity - 2018
At amortised cost Total
Interest income 102,595 102,595
Interest expense (15,973) (15,973)
86,622 86,622
Controlling entity - 2017
At amortised cost Total
Interest income 153,649 153,649
Interest expense (23,764) (23,764)
129,885 129,885
35. Commitments
Authorised capital expenditure
Already contracted for but not provided for
• Property, plant and equipment 77,372 133,171 77,372 133,171
Not yet contracted for and authorised by the board
• Property, plant and equipment - 3,224 - 3,224
Total capital commitments
Already contracted for but not provided for 77,372 136,395 77,372 136,395
Authorised operational expenditure
This committed expenditure relates to property, plant and equipment and will be financed by retained surpluses, existing cash re-sources and funds internally generated.

ANNUAL REPORT 2017/18
Page - 263
ANNUAL REPORT 2017/18
Page - 263
NOTES TO THE AUDITED GROUP ANNUAL FINANCIAL STATEMENTS
Economic entity Controlling entity
2018R ‘000
2017R ‘000
2018R ‘000
2017R ‘000
35. Commitments (continued)
Operating leases - as lessee (expense)
Minimum lease payments due
- within one year 16,532 7,962 16,532 7,962
- in second to fifth year inclusive 35,221 18,138 35,221 18,138
51,753 26,100 51,753 26,100
Operating lease payments represent rentals payable by the economic entity for certain of its office equipment. Leases are negotiated for an average term of five years and rentals are fixed for an average of three years. No contingent rent is payable. 36. Contingencies
The WSU has claimed that the salaries of HODs, Medical Scientists and Technologists are owed by the NHLS for the period 2007 - 2013. The amount is disputed by the NHLS as the staff for which the claim is being made are not the employees of the NHLS.
The intention of the NHLS is to defend all other cases and the legal opinion is of the view that the NHLS is in a favourable legal position to succeed.
The economic entity is facing litigation from former employees citing unfair termination of employment contracts. The economic entity’s lawyers consider the likelihood of the action against the entity being successful as unlikely.
Claims lodged for damages:
Legal fees on ex-employee cases - 2,523 - 2,523
WSU salaries dispute 15,309 15,309 15,309 15,309
Supplier claims - 100 - 100
15,309 17,932 15,309 17,932
Contingent assets
An employee and a vendor are alleged to have committed fraud and/or theft against the NHLS for a period of about 13 years from 2002 until June 2013. The NHLS conducted a disciplinary process and the employee was dismissed. The matter was reported to the Commer-cial Crimes Unit and a civil process has been instituted against the employee and the vendor.
Amount claimed 18,290 18,290 18,290 18,290
NHLS is in the process of registering all its foreign donor funded projects for VAT in order to be able to claim VAT input, which is not recoverable from donors. Once registrations have been finalised and the VAT input is determined this will result in the assets being recognised by NHLS.
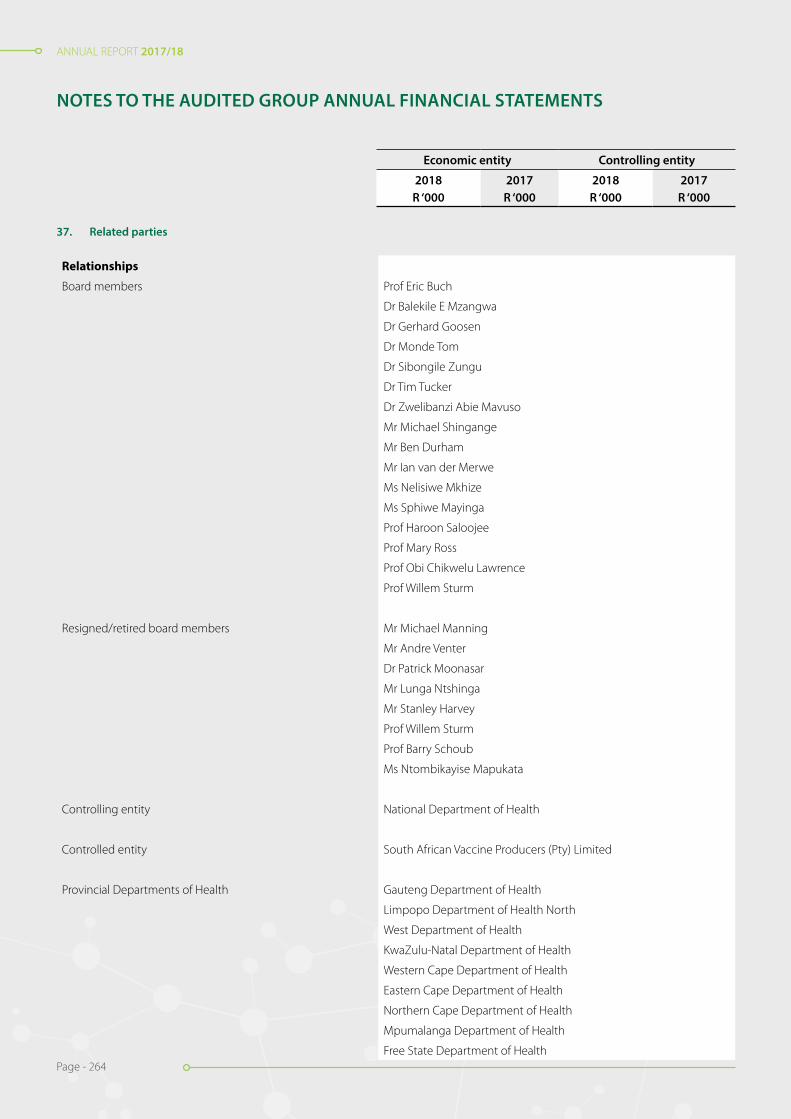
ANNUAL REPORT 2017/18
Page - 264
ANNUAL REPORT 2017/18
Page - 264
NOTES TO THE AUDITED GROUP ANNUAL FINANCIAL STATEMENTS
Economic entity Controlling entity
2018R ‘000
2017R ‘000
2018R ‘000
2017R ‘000
Relationships
Board members Prof Eric Buch
Dr Balekile E Mzangwa
Dr Gerhard Goosen
Dr Monde Tom
Dr Sibongile Zungu
Dr Tim Tucker
Dr Zwelibanzi Abie Mavuso
Mr Michael Shingange
Mr Ben Durham
Mr Ian van der Merwe
Ms Nelisiwe Mkhize
Ms Sphiwe Mayinga
Prof Haroon Saloojee
Prof Mary Ross
Prof Obi Chikwelu Lawrence
Prof Willem Sturm
Resigned/retired board members Mr Michael Manning
Mr Andre Venter
Dr Patrick Moonasar
Mr Lunga Ntshinga
Mr Stanley Harvey
Prof Willem Sturm
Prof Barry Schoub
Ms Ntombikayise Mapukata
Controlling entity National Department of Health
Controlled entity South African Vaccine Producers (Pty) Limited
Provincial Departments of Health Gauteng Department of Health
Limpopo Department of Health North
West Department of Health
KwaZulu-Natal Department of Health
Western Cape Department of Health
Eastern Cape Department of Health
Northern Cape Department of Health
Mpumalanga Department of Health
Free State Department of Health
37. Related parties
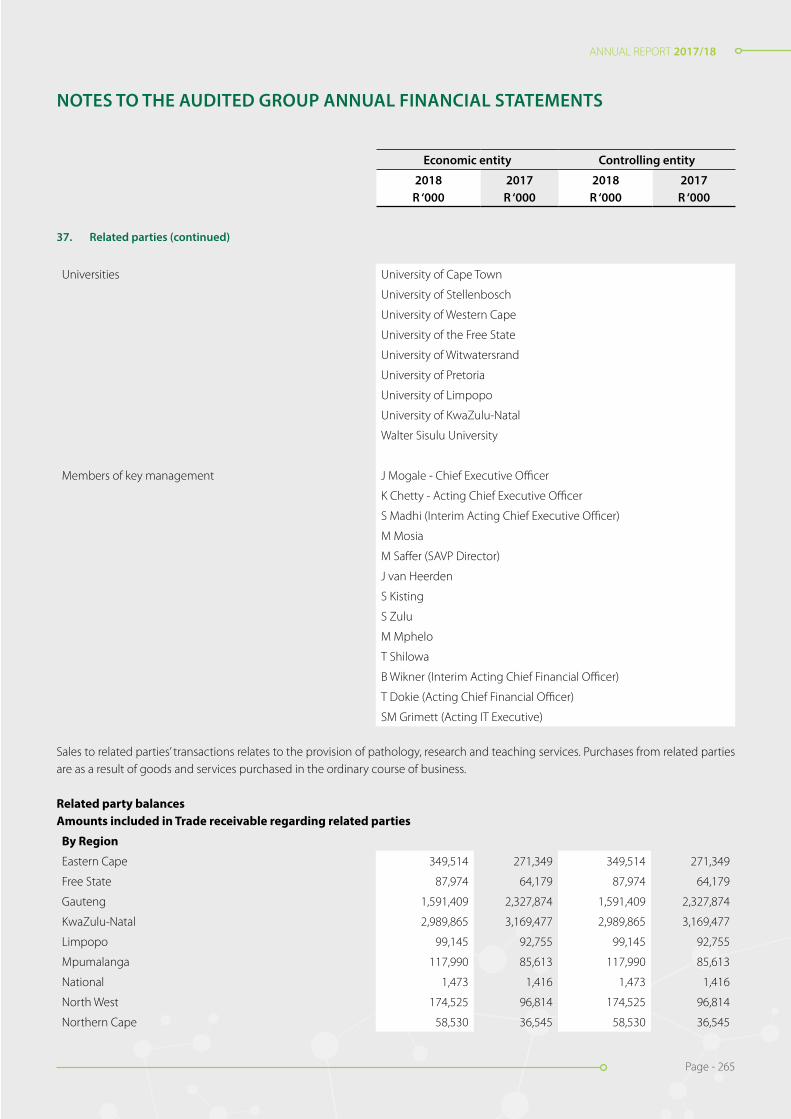
ANNUAL REPORT 2017/18
Page - 265
ANNUAL REPORT 2017/18
Page - 265
NOTES TO THE AUDITED GROUP ANNUAL FINANCIAL STATEMENTS
Economic entity Controlling entity
2018R ‘000
2017R ‘000
2018R ‘000
2017R ‘000
37. Related parties (continued)
Universities University of Cape Town
University of Stellenbosch
University of Western Cape
University of the Free State
University of Witwatersrand
University of Pretoria
University of Limpopo
University of KwaZulu-Natal
Walter Sisulu University
Members of key management J Mogale - Chief Executive Officer
K Chetty - Acting Chief Executive Officer
S Madhi (Interim Acting Chief Executive Officer)
M Mosia
M Saffer (SAVP Director)
J van Heerden
S Kisting
S Zulu
M Mphelo
T Shilowa
B Wikner (Interim Acting Chief Financial Officer)
T Dokie (Acting Chief Financial Officer)
SM Grimett (Acting IT Executive)
Sales to related parties’ transactions relates to the provision of pathology, research and teaching services. Purchases from related parties are as a result of goods and services purchased in the ordinary course of business.
Related party balancesAmounts included in Trade receivable regarding related parties
By Region
Eastern Cape 349,514 271,349 349,514 271,349
Free State 87,974 64,179 87,974 64,179
Gauteng 1,591,409 2,327,874 1,591,409 2,327,874
KwaZulu-Natal 2,989,865 3,169,477 2,989,865 3,169,477
Limpopo 99,145 92,755 99,145 92,755
Mpumalanga 117,990 85,613 117,990 85,613
National 1,473 1,416 1,473 1,416
North West 174,525 96,814 174,525 96,814
Northern Cape 58,530 36,545 58,530 36,545
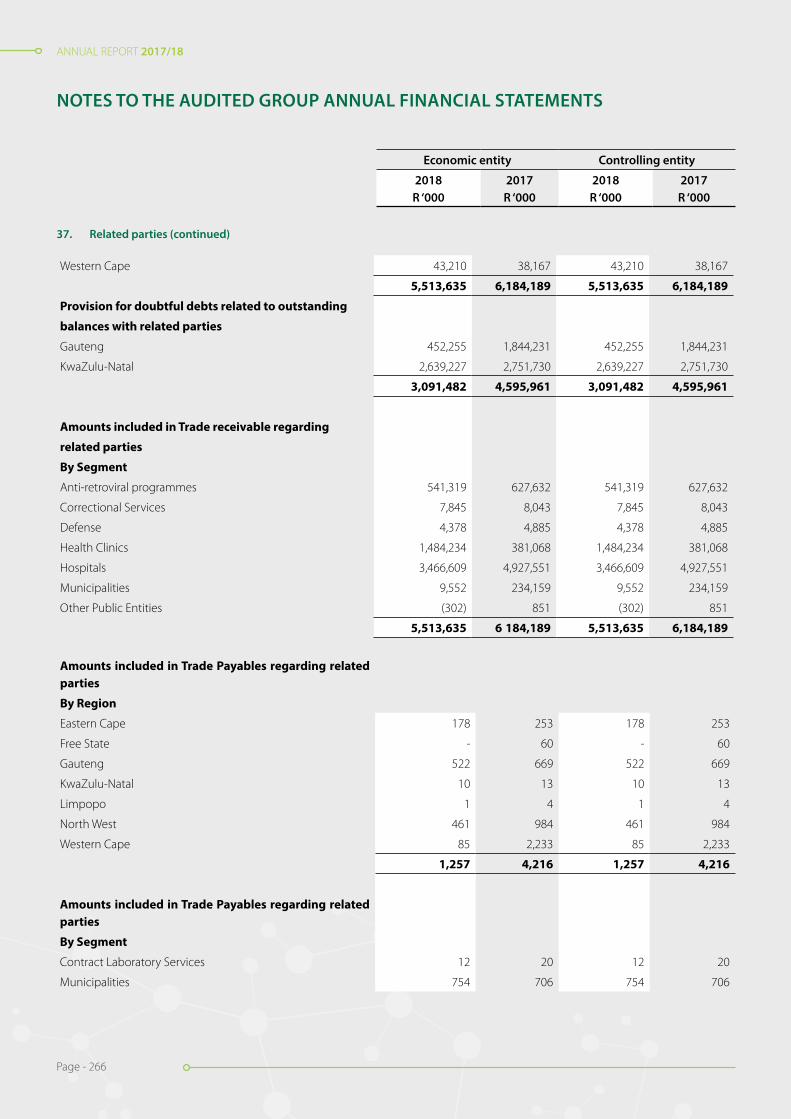
ANNUAL REPORT 2017/18
Page - 266
ANNUAL REPORT 2017/18
Page - 266
NOTES TO THE AUDITED GROUP ANNUAL FINANCIAL STATEMENTS
Economic entity Controlling entity
2018R ‘000
2017R ‘000
2018R ‘000
2017R ‘000
37. Related parties (continued)
Western Cape 43,210 38,167 43,210 38,167
5,513,635 6,184,189 5,513,635 6,184,189
Provision for doubtful debts related to outstanding
balances with related parties
Gauteng 452,255 1,844,231 452,255 1,844,231
KwaZulu-Natal 2,639,227 2,751,730 2,639,227 2,751,730
3,091,482 4,595,961 3,091,482 4,595,961
Amounts included in Trade receivable regarding
related parties
By Segment
Anti-retroviral programmes 541,319 627,632 541,319 627,632
Correctional Services 7,845 8,043 7,845 8,043
Defense 4,378 4,885 4,378 4,885
Health Clinics 1,484,234 381,068 1,484,234 381,068
Hospitals 3,466,609 4,927,551 3,466,609 4,927,551
Municipalities 9,552 234,159 9,552 234,159
Other Public Entities (302) 851 (302) 851
5,513,635 6 184,189 5,513,635 6,184,189
Amounts included in Trade Payables regarding related parties
By Region
Eastern Cape 178 253 178 253
Free State - 60 - 60
Gauteng 522 669 522 669
KwaZulu-Natal 10 13 10 13
Limpopo 1 4 1 4
North West 461 984 461 984
Western Cape 85 2,233 85 2,233
1,257 4,216 1,257 4,216
Amounts included in Trade Payables regarding related parties
By Segment
Contract Laboratory Services 12 20 12 20
Municipalities 754 706 754 706
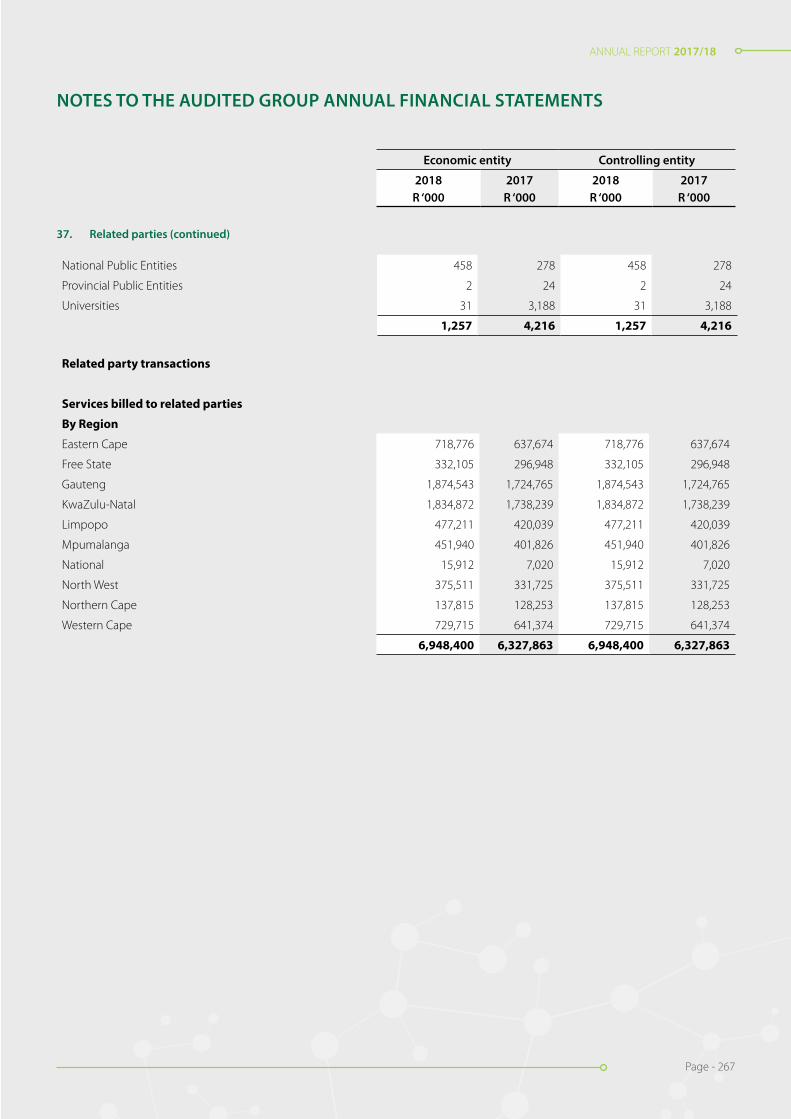
ANNUAL REPORT 2017/18
Page - 267
ANNUAL REPORT 2017/18
Page - 267
37. Related parties (continued)
NOTES TO THE AUDITED GROUP ANNUAL FINANCIAL STATEMENTS
Economic entity Controlling entity
2018R ‘000
2017R ‘000
2018R ‘000
2017R ‘000
National Public Entities 458 278 458 278
Provincial Public Entities 2 24 2 24
Universities 31 3,188 31 3,188
1,257 4,216 1,257 4,216
Related party transactions
Services billed to related parties
By Region
Eastern Cape 718,776 637,674 718,776 637,674
Free State 332,105 296,948 332,105 296,948
Gauteng 1,874,543 1,724,765 1,874,543 1,724,765
KwaZulu-Natal 1,834,872 1,738,239 1,834,872 1,738,239
Limpopo 477,211 420,039 477,211 420,039
Mpumalanga 451,940 401,826 451,940 401,826
National 15,912 7,020 15,912 7,020
North West 375,511 331,725 375,511 331,725
Northern Cape 137,815 128,253 137,815 128,253
Western Cape 729,715 641,374 729,715 641,374
6,948,400 6,327,863 6,948,400 6,327,863
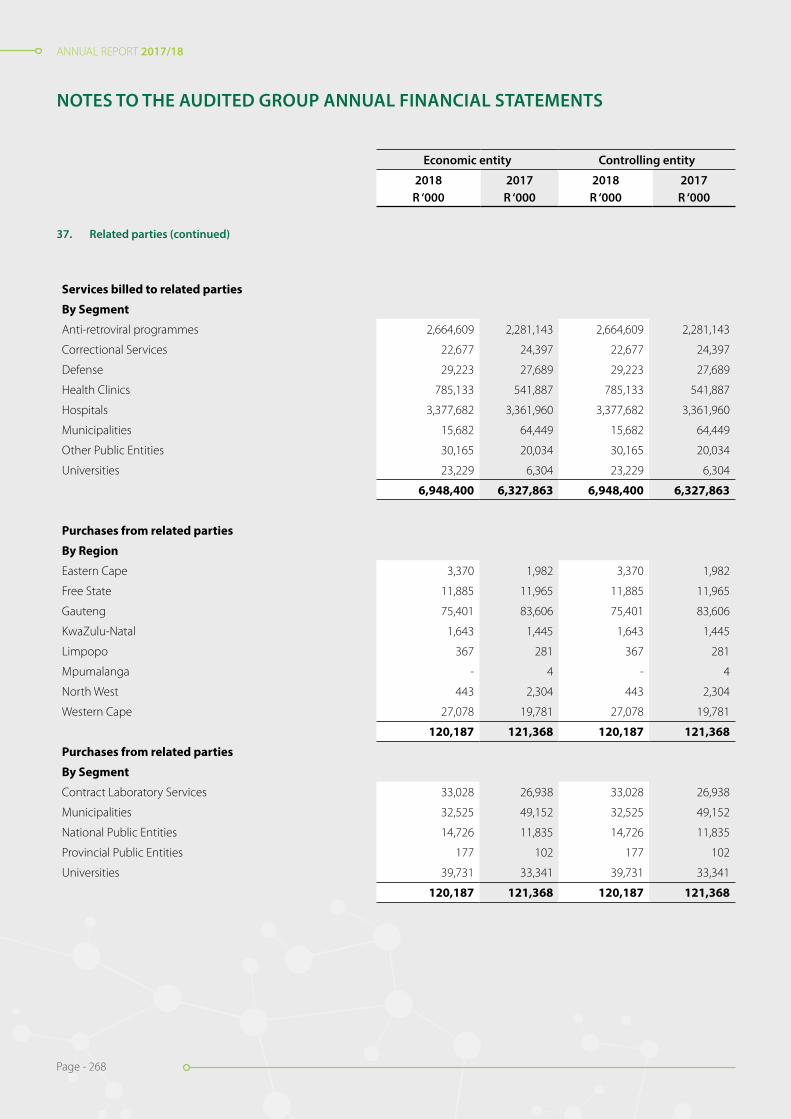
ANNUAL REPORT 2017/18
Page - 268
ANNUAL REPORT 2017/18
Page - 268
NOTES TO THE AUDITED GROUP ANNUAL FINANCIAL STATEMENTS
Economic entity Controlling entity
2018R ‘000
2017R ‘000
2018R ‘000
2017R ‘000
Services billed to related parties
By Segment
Anti-retroviral programmes 2,664,609 2,281,143 2,664,609 2,281,143
Correctional Services 22,677 24,397 22,677 24,397
Defense 29,223 27,689 29,223 27,689
Health Clinics 785,133 541,887 785,133 541,887
Hospitals 3,377,682 3,361,960 3,377,682 3,361,960
Municipalities 15,682 64,449 15,682 64,449
Other Public Entities 30,165 20,034 30,165 20,034
Universities 23,229 6,304 23,229 6,304
6,948,400 6,327,863 6,948,400 6,327,863
Purchases from related parties
By Region
Eastern Cape 3,370 1,982 3,370 1,982
Free State 11,885 11,965 11,885 11,965
Gauteng 75,401 83,606 75,401 83,606
KwaZulu-Natal 1,643 1,445 1,643 1,445
Limpopo 367 281 367 281
Mpumalanga - 4 - 4
North West 443 2,304 443 2,304
Western Cape 27,078 19,781 27,078 19,781
120,187 121,368 120,187 121,368
Purchases from related parties
By Segment
Contract Laboratory Services 33,028 26,938 33,028 26,938
Municipalities 32,525 49,152 32,525 49,152
National Public Entities 14,726 11,835 14,726 11,835
Provincial Public Entities 177 102 177 102
Universities 39,731 33,341 39,731 33,341
120,187 121,368 120,187 121,368
37. Related parties (continued)

ANNUAL REPORT 2017/18
Page - 269
ANNUAL REPORT 2017/18
Page - 269
NO
TES
TO T
HE
AU
DIT
ED G
ROU
P A
NN
UA
L FI
NA
NCI
AL
STAT
EMEN
TS
Figu
res
in R
and
thou
sand
38.
P
resc
ribe
d O
ffice
rs a
nd B
oard
mem
bers
’ em
olum
ents
- R’
000s
Emol
umen
ts w
ere
paid
to th
e bo
ard
mem
bers
or a
ny in
divi
dual
s ho
ldin
g a
pres
crib
ed o
ffice
dur
ing
the
year
.
Pres
crib
ed O
ffice
rs
2018
Sala
ries
Reti
rem
ent
cont
ribu
tion
Med
ical
co
ntri
buti
onEx
pens
e al
low
ance
Oth
er *
*Bo
nus
Leav
e pa
id
out
Tota
l
J. M
ogal
e (C
hief
Exe
cutiv
e O
ffice
r)2,
366
207
--
25-
-2,
598
S.A
. Mad
hi (A
ctin
g C
hief
Exe
cutiv
e O
ffice
r up
to 3
1 O
ctob
er 2
017)
958
-42
613
-19
81,
217
M.S
. Mos
ia1,
560
149
6060
18-
-1,
847
M S
affer
(SAV
P D
irect
or)
719
64-
109
--
802
S.K.
Kis
ting
434
--
-16
--
450
S.S.
Zul
u (C
hief
Fin
anci
al O
ffice
r)1,
844
--
1120
--
1,87
5
M.M
. Mph
elo
1,69
514
9-
1118
--
1,87
3
T.N
. Shi
low
a96
810
072
4513
-10
41,
302
B. W
ikne
r (A
ctin
g C
hief
Fin
anci
al O
ffice
r up
to 2
4 A
ugus
t 201
7 *)
438
3214
55
--
494
T. D
okie
(Act
ing
Chi
ef F
inan
cial
Offi
cer f
rom
1 O
ctob
er 2
017
*)51
040
-30
1018
-60
8
S.M
. Grim
ett (
Act
ing
IT E
xecu
tive)
969
8658
1114
--
1,13
8
S.C
.S. C
arm
ona
(Act
ing
AA
RQA
Exe
cutiv
e)2,
228
151
8511
035
--
2,60
9
L. M
orris
1,29
115
032
125
13-
1,51
2
J.A. G
eorg
e (A
ctin
g A
ARQ
A E
xecu
tive)
1,76
013
492
132
22-
-2,
140
17,7
401,
262
455
432
243
3130
220
,465

ANNUAL REPORT 2017/18
Page - 270
ANNUAL REPORT 2017/18
Page - 270
NO
TES
TO T
HE
AU
DIT
ED G
ROU
P A
NN
UA
L FI
NA
NCI
AL
STAT
EMEN
TS
Figu
res
in R
and
thou
sand
38.
P
resc
ribe
d O
ffice
rs a
nd B
oard
mem
bers
’ em
olum
ents
- R’
000s
(con
tinue
d)
2017
Sala
ries
Reti
rem
ent
cont
ribu
tion
Med
ical
co
ntri
buti
onEx
pens
e al
low
ance
Oth
er *
*Bo
nus
Leav
e pa
id
out
Tota
l
J. M
ogal
e (C
hief
Exe
cutiv
e O
ffice
r)2,
092
163
-31
165
--
2,45
1
S. M
adhi
(Act
ing
Chi
ef E
xecu
tive
Offi
cer)
1,82
8-
7811
169
--
2,08
6
M. M
osia
1,55
212
752
2215
4-
-1,
907
M. S
affer
(SAV
P D
irect
or)
675
55-
2811
2-
-87
0
J. va
n H
eerd
en1,
591
88-
3311
8-
-1,
830
S. K
istin
g1,
769
--
1953
--
1,84
1
S. Z
ulu
(Chi
ef F
inan
cial
Offi
cer)
1,75
8-
-12
120
--
1,89
0
M. M
phel
o1,
615
129
-11
101
--
1,85
6
T. S
hilo
wa
1,40
712
698
5470
--
1,75
5
B. W
ikne
r (A
ctin
g C
hief
Fin
anci
al O
ffice
r *)
141
125
245
--
205
14,4
2870
023
322
31,
107
--
16,6
91
* A
mou
nts
disc
lose
d ab
ove
only
rela
tes
to th
e pe
riod
of a
ctin
g
** O
ther
pay
men
ts in
clud
e co
mpa
ny c
ontr
ibut
ions
for s
kills
dev
elop
men
t, U
IF, e
xpen
se re
cove
ries
and
long
ser
vice
aw
ards
.
Serv
ice
cont
ract
s
Pres
crib
ed O
ffice
rs a
re s
ubje
ct to
writ
ten
empl
oym
ent a
gree
men
ts. T
he e
mpl
oym
ent a
gree
men
ts re
gula
te d
utie
s, re
mun
erat
ion,
allo
wan
ces,
rest
rain
ts, l
eave
and
not
ice
perio
ds o
f the
se
exec
utiv
es. N
one
of th
ese
serv
ice
cont
ract
s ex
ceed
5 y
ears
.

ANNUAL REPORT 2017/18
Page - 271
ANNUAL REPORT 2017/18
Page - 271
NOTES TO THE AUDITED GROUP ANNUAL FINANCIAL STATEMENTS
38. Prescribed Officers and Board members’ emoluments - R’000s (continued)
Non-executive board members
2018
Members’ fees
Other fees * Total
B. Schoub 132 2 134
B.E. Mzangwa - 14 14
Prof. Eric Buch 441 5 446
G. Goosen - 4 4
L. Ntshinga 63 12 75
M. Ross 204 7 211
M. Shingange 82 6 88
N. Mapukata 136 20 156
N. Mkhize - 22 22
C.L. Obi 138 11 149
S. Harvey 152 2 154
S. Mayinga 109 2 111
S. Zungu 47 1 48
T. Tucker 170 1 171
W. Sturm 68 3 71
Z.A. Mavuso 95 5 100
1,837 117 1,954
2017
Members’ fees
Other fees * Total
B. Schoub - 1 1
T. Stander 208 13 221
I. van der Merwe 147 3 150
M. Manning 205 49 254
M. Shingange 68 4 72
M. Tom 133 2 135
T. Mhlongo 48 64 112
G. Hussey 126 3 129
C.L. Obi - 23 23
P. Moonasar 164 31 195
S. Mayinga 200 4 204
S. Zungu 179 2 181
W. Sturm 121 4 125
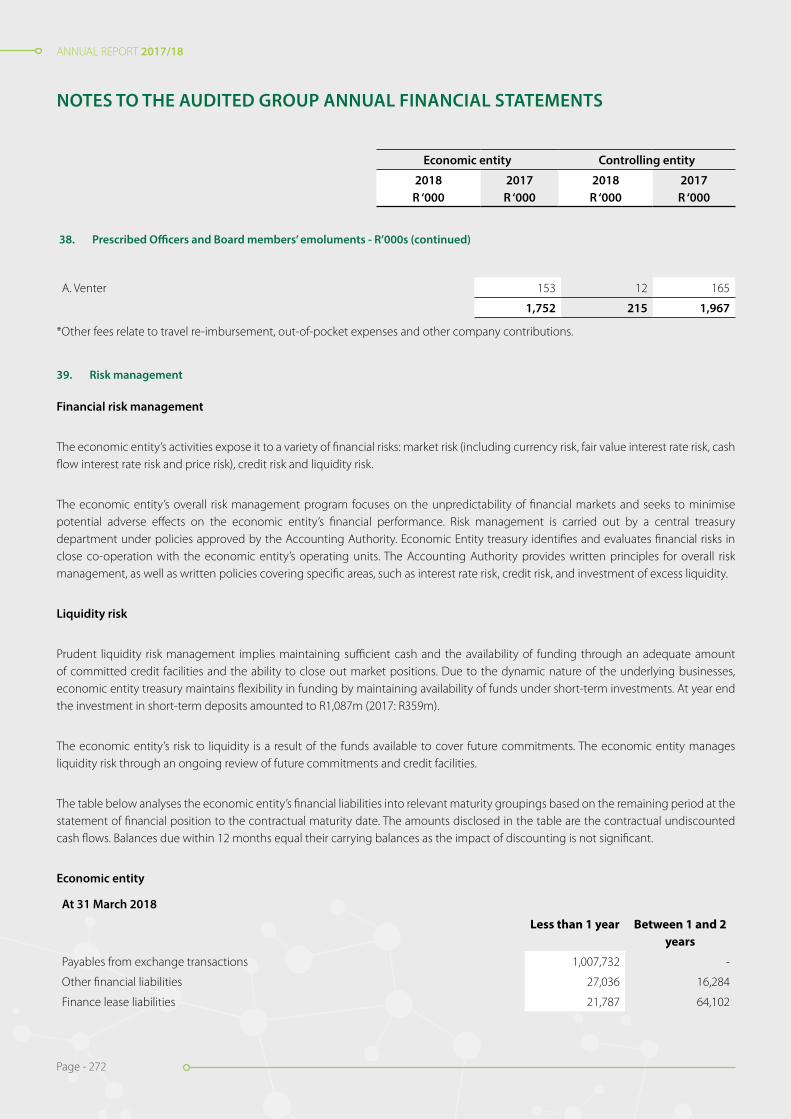
ANNUAL REPORT 2017/18
Page - 272
ANNUAL REPORT 2017/18
Page - 272
NOTES TO THE AUDITED GROUP ANNUAL FINANCIAL STATEMENTS
Economic entity Controlling entity
2018R ‘000
2017R ‘000
2018R ‘000
2017R ‘000
38. Prescribed Officers and Board members’ emoluments - R’000s (continued)
A. Venter 153 12 165
1,752 215 1,967
*Other fees relate to travel re-imbursement, out-of-pocket expenses and other company contributions.
39. Risk management
Financial risk management
The economic entity’s activities expose it to a variety of financial risks: market risk (including currency risk, fair value interest rate risk, cash flow interest rate risk and price risk), credit risk and liquidity risk.
The economic entity’s overall risk management program focuses on the unpredictability of financial markets and seeks to minimise potential adverse effects on the economic entity’s financial performance. Risk management is carried out by a central treasury department under policies approved by the Accounting Authority. Economic Entity treasury identifies and evaluates financial risks in close co-operation with the economic entity’s operating units. The Accounting Authority provides written principles for overall risk management, as well as written policies covering specific areas, such as interest rate risk, credit risk, and investment of excess liquidity.
Liquidity risk
Prudent liquidity risk management implies maintaining sufficient cash and the availability of funding through an adequate amount of committed credit facilities and the ability to close out market positions. Due to the dynamic nature of the underlying businesses, economic entity treasury maintains flexibility in funding by maintaining availability of funds under short-term investments. At year end the investment in short-term deposits amounted to R1,087m (2017: R359m).
The economic entity’s risk to liquidity is a result of the funds available to cover future commitments. The economic entity manages liquidity risk through an ongoing review of future commitments and credit facilities.
The table below analyses the economic entity’s financial liabilities into relevant maturity groupings based on the remaining period at the statement of financial position to the contractual maturity date. The amounts disclosed in the table are the contractual undiscounted cash flows. Balances due within 12 months equal their carrying balances as the impact of discounting is not significant.
Economic entity
At 31 March 2018
Less than 1 year Between 1 and 2 years
Payables from exchange transactions 1,007,732 -
Other financial liabilities 27,036 16,284
Finance lease liabilities 21,787 64,102

ANNUAL REPORT 2017/18
Page - 273
ANNUAL REPORT 2017/18
Page - 273
NOTES TO THE AUDITED GROUP ANNUAL FINANCIAL STATEMENTS
Economic entity Controlling entity
2018R ‘000
2017R ‘000
2018R ‘000
2017R ‘000
39. Risk management (continued)
At 31 March 2017
Less than 1 year Between 1 and 2 years
Payables from exchange transactions 961,893 -
Other financial liabilities 53,506 43,321
Finance lease liabilities 21,245 63,340
Controlling entity
At 31 March 2018
Less than 1 year Between 1 and 2 years
Payables from exchange transactions 1,005,943 -
Other financial liabilities 27,036 16,284
Finance lease liabilities 21,787 64,102
At 31 March 2017
Less than 1 year Between 1 and 2 years
Payables from exchange transactions 960,529 -
Other financial liabilities 53,506 43,321
Finance lease liabilities 21,245 63,340
Credit risk
Credit risk consists mainly of cash deposits, cash equivalents, and trade debtors. The economic entity only deposits cash with major banks with high quality credit standing and limits exposure to any one counter-party.
Concentrations of credit risk with respect to trade receivables are limited due to the majority of receivables being owned by government departments. However, due to the current payment disputes with the KZN Provincial Department of Health and Gauteng Department of Health, a total doubtful debt allowance of R3.091bn (2017: R4.596bn) has been raised. Trade receivables are interest bearing and are generally on 30-day payment terms. All interest on overdue debt has been provided for in full due to various communications received from the relevant government departments indicating they will not be in a position to honour the additional interest owed to NHLS.
Market risk
Interest rate risk
As the economic entity has no significant interest-bearing assets, the economic entity’s income and operating cash flows are substantially independent of changes in market interest rates.
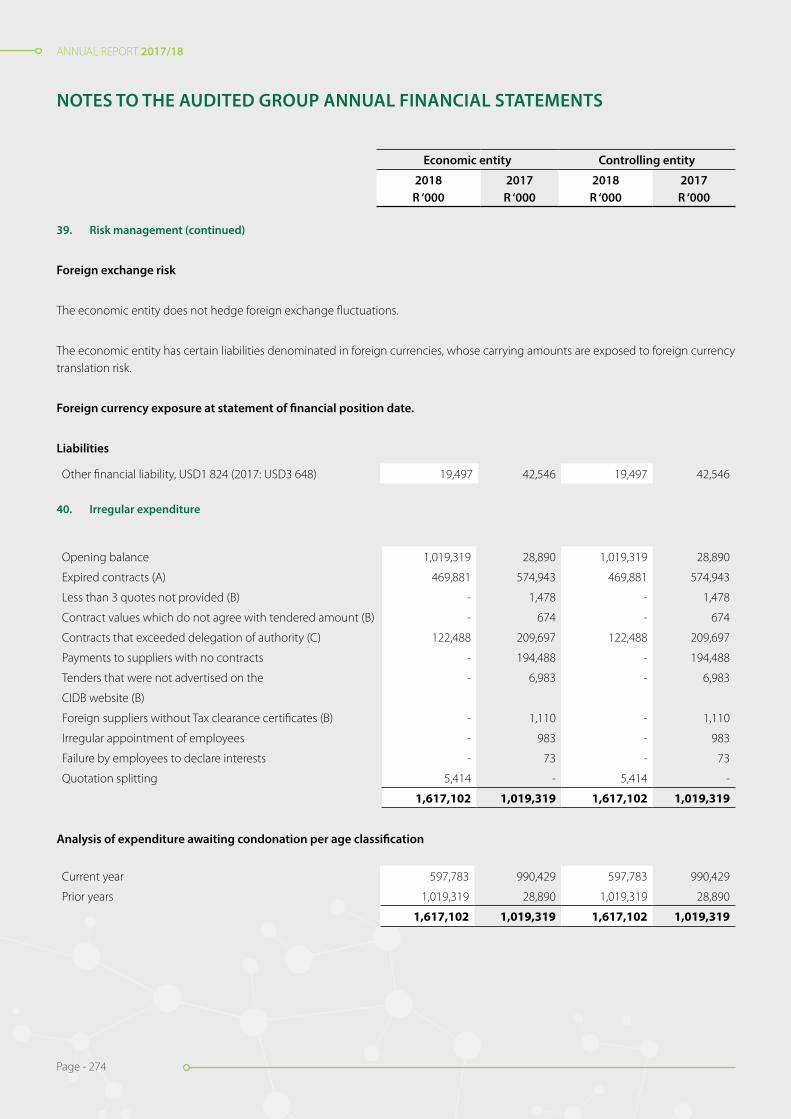
ANNUAL REPORT 2017/18
Page - 274
ANNUAL REPORT 2017/18
Page - 274
NOTES TO THE AUDITED GROUP ANNUAL FINANCIAL STATEMENTS
39. Risk management (continued)
Foreign exchange risk
The economic entity does not hedge foreign exchange fluctuations.
The economic entity has certain liabilities denominated in foreign currencies, whose carrying amounts are exposed to foreign currency translation risk.
Foreign currency exposure at statement of financial position date.
Liabilities
Other financial liability, USD1 824 (2017: USD3 648) 19,497 42,546 19,497 42,546
40. Irregular expenditure
Opening balance 1,019,319 28,890 1,019,319 28,890
Expired contracts (A) 469,881 574,943 469,881 574,943
Less than 3 quotes not provided (B) - 1,478 - 1,478
Contract values which do not agree with tendered amount (B) - 674 - 674
Contracts that exceeded delegation of authority (C) 122,488 209,697 122,488 209,697
Payments to suppliers with no contracts - 194,488 - 194,488
Tenders that were not advertised on the - 6,983 - 6,983
CIDB website (B)
Foreign suppliers without Tax clearance certificates (B) - 1,110 - 1,110
Irregular appointment of employees - 983 - 983
Failure by employees to declare interests - 73 - 73
Quotation splitting 5,414 - 5,414 -
1,617,102 1,019,319 1,617,102 1,019,319
Analysis of expenditure awaiting condonation per age classification
Current year 597,783 990,429 597,783 990,429
Prior years 1,019,319 28,890 1,019,319 28,890
1,617,102 1,019,319 1,617,102 1,019,319
Economic entity Controlling entity
2018R ‘000
2017R ‘000
2018R ‘000
2017R ‘000
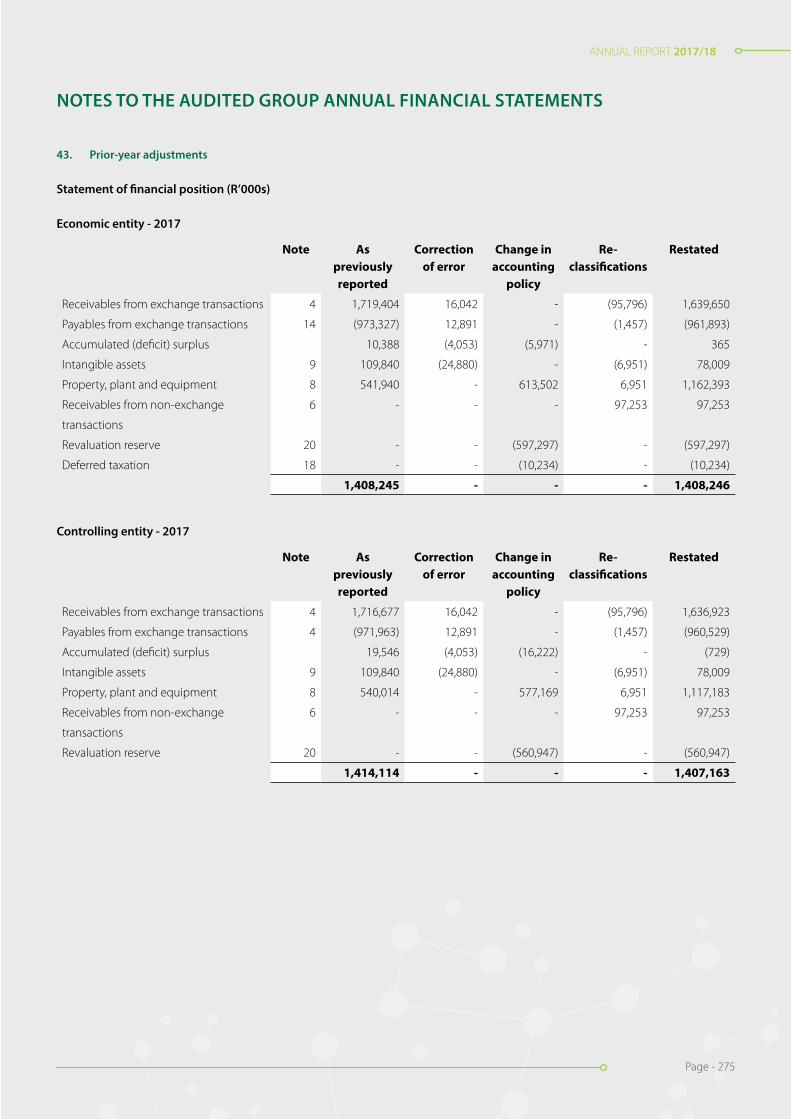
ANNUAL REPORT 2017/18
Page - 275
ANNUAL REPORT 2017/18
Page - 275
NOTES TO THE AUDITED GROUP ANNUAL FINANCIAL STATEMENTS
43. Prior-year adjustments
Statement of financial position (R’000s)
Economic entity - 2017
Note As previously reported
Correction of error
Change in accounting
policy
Re- classifications
Restated
Receivables from exchange transactions 4 1,719,404 16,042 - (95,796) 1,639,650
Payables from exchange transactions 14 (973,327) 12,891 - (1,457) (961,893)
Accumulated (deficit) surplus 10,388 (4,053) (5,971) - 365
Intangible assets 9 109,840 (24,880) - (6,951) 78,009
Property, plant and equipment 8 541,940 - 613,502 6,951 1,162,393
Receivables from non-exchange 6 - - - 97,253 97,253
transactions
Revaluation reserve 20 - - (597,297) - (597,297)
Deferred taxation 18 - - (10,234) - (10,234)
1,408,245 - - - 1,408,246
Controlling entity - 2017
Note As previously reported
Correction of error
Change in accounting
policy
Re- classifications
Restated
Receivables from exchange transactions 4 1,716,677 16,042 - (95,796) 1,636,923
Payables from exchange transactions 4 (971,963) 12,891 - (1,457) (960,529)
Accumulated (deficit) surplus 19,546 (4,053) (16,222) - (729)
Intangible assets 9 109,840 (24,880) - (6,951) 78,009
Property, plant and equipment 8 540,014 - 577,169 6,951 1,117,183
Receivables from non-exchange 6 - - - 97,253 97,253
transactions
Revaluation reserve 20 - - (560,947) - (560,947)
1,414,114 - - - 1,407,163
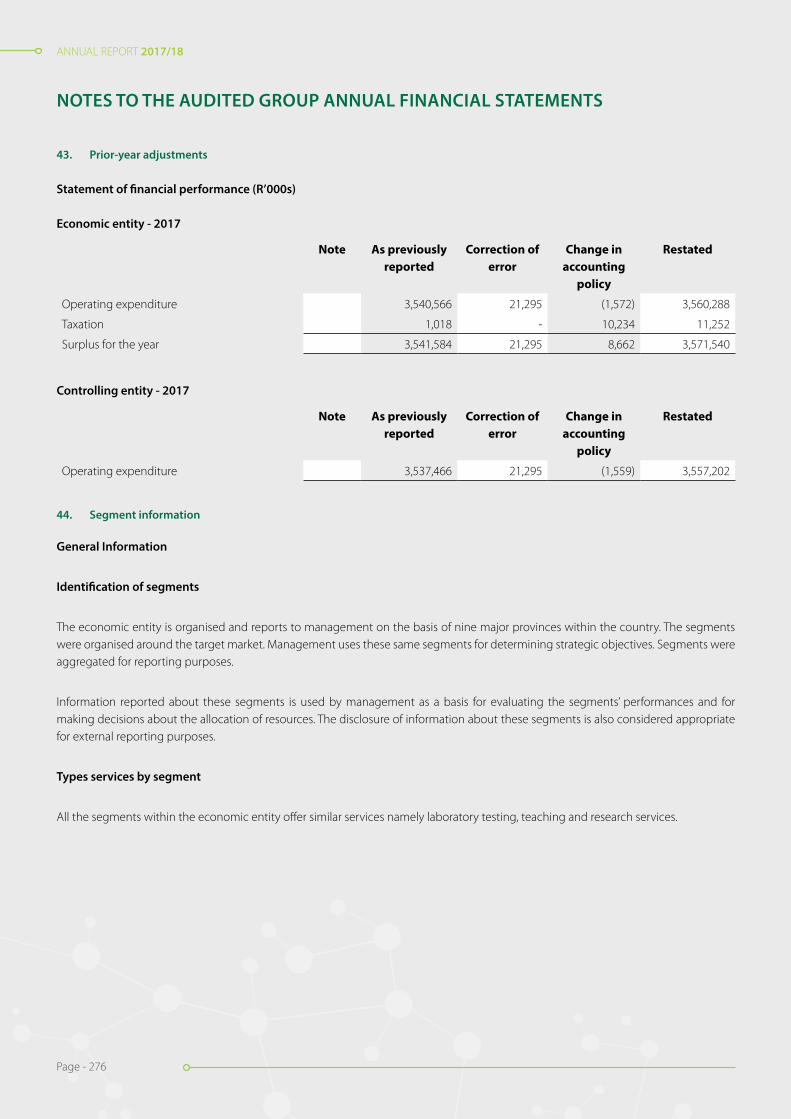
ANNUAL REPORT 2017/18
Page - 276
ANNUAL REPORT 2017/18
Page - 276
NOTES TO THE AUDITED GROUP ANNUAL FINANCIAL STATEMENTS
43. Prior-year adjustments
Statement of financial performance (R’000s)
Economic entity - 2017
Note As previously reported
Correction of error
Change in accounting
policy
Restated
Operating expenditure 3,540,566 21,295 (1,572) 3,560,288
Taxation 1,018 - 10,234 11,252
Surplus for the year 3,541,584 21,295 8,662 3,571,540
Controlling entity - 2017
Note As previously reported
Correction of error
Change in accounting
policy
Restated
Operating expenditure 3,537,466 21,295 (1,559) 3,557,202
44. Segment information
General Information
Identification of segments
The economic entity is organised and reports to management on the basis of nine major provinces within the country. The segments were organised around the target market. Management uses these same segments for determining strategic objectives. Segments were aggregated for reporting purposes.
Information reported about these segments is used by management as a basis for evaluating the segments’ performances and for making decisions about the allocation of resources. The disclosure of information about these segments is also considered appropriate for external reporting purposes.
Types services by segment
All the segments within the economic entity offer similar services namely laboratory testing, teaching and research services.

ANNUAL REPORT 2017/18
Page - 277
ANNUAL REPORT 2017/18
Page - 277
NO
TES
TO T
HE
AU
DIT
ED G
ROU
P A
NN
UA
L FI
NA
NCI
AL
STAT
EMEN
TS
Figu
res
in R
and
thou
sand
44.
S
egm
ent i
nfor
mat
ion
(con
tinue
d)
Segm
ent s
urpl
us o
r defi
cit,
asse
ts a
nd li
abili
ties
Cont
rolli
ng e
ntit
y - 2
018
Rev
enue
Gau
teng
Free
Sta
te -
Nor
th W
est
Lim
popo
- M
pum
alan
ga
Wes
tern
C
ape
- N
orth
ern
Cap
e
East
ern
Cape
kwaZ
ulu-
Nat
alN
IOH
NIC
DG
rant
sTo
tal
Reve
nue
from
non
-ex
chan
ge tr
ansa
ctio
ns-
--
--
-10
,910
24,8
1422
1,57
125
7,29
5
Reve
nue
from
exc
hang
e2,
107,
603
639,
757
820,
444
935,
531
696,
926
1,83
9,03
2-
--
7,03
9,29
3
tran
sact
ions
Inte
r-se
gmen
t tra
nsfe
rs(3
6,94
5)11
,322
19,7
442,
798
2,41
11,
616
(907
)(3
9)-
-
Oth
er in
com
e20
0,41
118
,335
1,88
579
,857
3,09
438
,631
105,
019
343,
681
-79
0,91
3
Inte
rest
rece
ived
--
--
--
4,03
619
,376
-23
,412
Tota
l seg
men
t rev
enue
2,27
1,06
966
9,41
484
2,07
31,
018,
186
702,
431
1,87
9,27
911
9,05
838
7,83
222
1,57
18,
110,
913
Inte
rest
rece
ived
74,2
78
Oth
er u
nallo
cate
d re
venu
e89
,517
Tota
l rev
enue
reco
ncili
ng
item
s16
3,79
5
Entit
y’s
reve
nue
8,27
4,70
8
Expe
nditu
reCo
st o
f sal
es1,
685,
296
540,
526
554,
913
905,
892
606,
318
1,33
4,24
996
,211
288,
487
127,
858
6,13
9,75
0
Ope
ratin
g ex
pens
es73
,730
29,6
5131
,978
37,8
5633
,153
78,0
0818
,661
44,2
0693
,618
440,
861
Tota
l seg
men
t ex
pend
iture
1,75
9,02
657
0,17
758
6,89
194
3,74
863
9,47
11,
412,
257
114,
872
332,
693
221,
476
6,58
0,61
1
Tota
l seg
men
tal s
urpl
us1,
530,
302

ANNUAL REPORT 2017/18
Page - 278
ANNUAL REPORT 2017/18
Page - 278
NO
TES
TO T
HE
AU
DIT
ED G
ROU
P A
NN
UA
L FI
NA
NCI
AL
STAT
EMEN
TS
Figu
res
in R
and
thou
sand
44.
S
egm
ent i
nfor
mat
ion
(con
tinue
d)
Gau
teng
Free
s St
ate-
N
orth
Wes
tLi
mpo
po -
Mpu
mal
anga
Wes
tern
C
ape
- Nor
ther
nC
ape
Eas
tern
C
ape
Kw
aZul
u-
Nat
alN
IOH
NIC
DG
rant
sTo
tal
Tota
l rev
enue
reco
ncili
ng16
3,79
5
item
sIn
tere
st e
xpen
se(5
,799
)
Una
lloca
ted
expe
nses
(374
,667
)
Entit
y’s
surp
lus
for t
he
peri
od1,
313,
631
Una
lloca
ted
asse
ts4,
900,
754
Tota
l ass
ets
as p
er
Stat
emen
t of fi
nanc
ial
Posi
tion
4,90
0,75
4
Una
lloca
ted
liabi
litie
s2,
975,
351
Tota
l lia
bilit
ies
as p
er
Stat
emen
t of fi
nanc
ial
Posi
tion
2,97
5,35
1
Con
trol
ling
entit
y - 2
017
Rev
enue
Gau
teng
Free
s St
ate-
N
orth
Wes
t
Lim
popo
- M
pum
alan
ga
Wes
tern
C
ape
- Nor
ther
nC
ape
East
ern
Cap
eK
waZ
ulu-
N
atal
NIO
HN
ICD
Gra
nts
Tota
l
Reve
nue
from
non
-ex
chan
ge tr
ansa
ctio
ns-
--
--
-5,
638
16,6
7321
8,96
624
1,27
7
Reve
nue
from
exc
hang
e1,
875,
458
576,
150
733,
396
852,
781
614,
052
1,73
8,94
8-
--
6,39
0,78
5
tran
sact
ions
Inte
r-se
gmen
t tra
nsfe
rs(3
4,55
7)9,
851
17,7
331,
036
4,70
31,
257
(3)
(20)
--
Oth
er in
com
e17
3,59
17,
282
2,67
274
,726
2,42
836
,704
100,
400
331,
667
-72
9,47
0
Inte
rest
rece
ived
--
--
--
3,20
311
,102
1114
,316
Tota
l seg
men
t rev
enue
2,01
4,49
259
3,28
375
3,80
192
8,54
362
1,18
31,
776,
909
109,
238
359,
422
218,
977
7,37
5,84
8
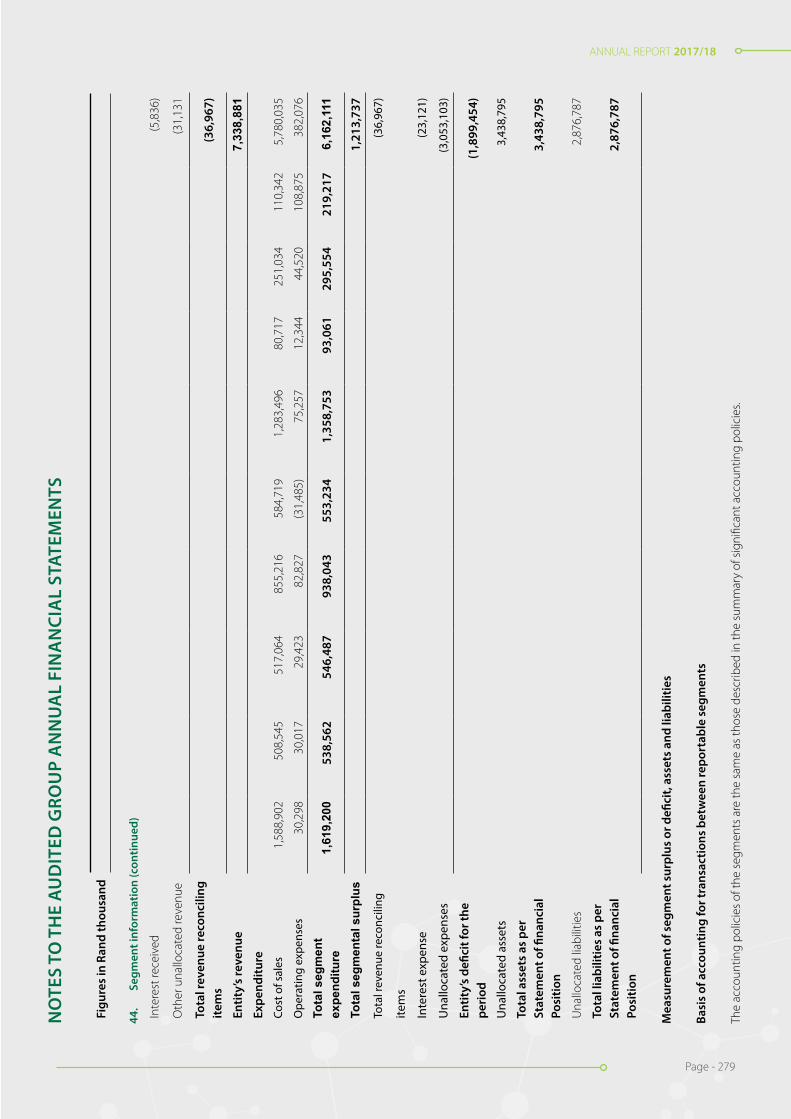
ANNUAL REPORT 2017/18
Page - 279
ANNUAL REPORT 2017/18
Page - 279
Figu
res
in R
and
thou
sand
44.
S
egm
ent i
nfor
mat
ion
(con
tinue
d)
Inte
rest
rece
ived
(5,8
36)
Oth
er u
nallo
cate
d re
venu
e(3
1,13
1
Tota
l rev
enue
reco
ncili
ng
item
s(3
6,96
7)
Entit
y’s
reve
nue
7,33
8,88
1Ex
pend
iture
Cost
of s
ales
1,58
8,90
250
8,54
551
7,06
485
5,21
658
4,71
91,
283,
496
80,7
1725
1,03
411
0,34
25,
780,
035
Ope
ratin
g ex
pens
es30
,298
30,0
1729
,423
82,8
27(3
1,48
5)75
,257
12,3
4444
,520
108,
875
382,
076
Tota
l seg
men
t ex
pend
iture
1,61
9,20
053
8,56
254
6,48
793
8,04
355
3,23
41,
358,
753
93,0
6129
5,55
421
9,21
76,
162,
111
Tota
l seg
men
tal s
urpl
us1,
213,
737
Tota
l rev
enue
reco
ncili
ng(3
6,96
7)
item
s
Inte
rest
exp
ense
(23,
121)
Una
lloca
ted
expe
nses
(3,0
53,1
03)
Entit
y’s
defic
it fo
r the
pe
riod
(1,8
99,4
54)
Una
lloca
ted
asse
ts3,
438,
795
Tota
l ass
ets
as p
er
Stat
emen
t of fi
nanc
ial
Posi
tion
3,43
8,79
5
Una
lloca
ted
liabi
litie
s2,
876,
787
Tota
l lia
bilit
ies
as p
er
Stat
emen
t of fi
nanc
ial
Posi
tion
2,87
6,78
7
Mea
sure
men
t of s
egm
ent s
urpl
us o
r defi
cit,
asse
ts a
nd li
abili
ties
Basi
s of
acc
ount
ing
for t
rans
actio
ns b
etw
een
repo
rtab
le s
egm
ents
The
acco
untin
g po
licie
s of
the
segm
ents
are
the
sam
e as
thos
e de
scrib
ed in
the
sum
mar
y of
sig
nific
ant a
ccou
ntin
g po
licie
s.
NO
TES
TO T
HE
AU
DIT
ED G
ROU
P A
NN
UA
L FI
NA
NCI
AL
STAT
EMEN
TS

ANNUAL REPORT 2017/18
Page - 280
ANNUAL REPORT 2017/18
Page - 280
44. Segment information (continued)
The nature of differences between the measurements of the reportable segments’ surplus or deficit and the entity’s surplus or deficit and discontinued operations
Inter-segment transfers: segment revenue and segment expense include revenue and expense arising from transfers between seg-ments. Such transfers are usually accounted for at cost and are eliminated on consolidation.
45. Budget differences
Material differences between budget and actual amounts
The budget was prepared on an accruals basis covering the financial year ended 31 March 2018. The variances between budget and actual which are numerically 10% (R100m) above or below budget are explained below:
45.1 Rendering of services
The variance is caused by increase in test volumes beyond the levels anticipated during the budget period.
45.2 Miscellaneous other revenue
The increase was caused by once off conference revenue organised by the economic entity. This was not budgeted for.
45.3 Grant income
No amounts were budgeted for grants income.
45.4 Recoveries
The increase was caused by recoveries from pensioners’ medical contributions beyond the amount budgeted.
45.5 Teaching Income
Teaching income budget was higher than the actual amount due to the fact that the number of students completing their studies was less than the number estimated.
45.6 Sundry income
Sundry income budgeted could not be realised.
45.7 Interest received
The variance was caused by higher interest rates realised on cash balances as well as more cash received from customers which was invested temporarily before being utilised.
NOTES TO THE AUDITED GROUP ANNUAL FINANCIAL STATEMENTS

ANNUAL REPORT 2017/18
Page - 281
ANNUAL REPORT 2017/18
Page - 281
45.8 Personnel
Personnel costs are under-budget by 12% due to a moratorium on the filling of vacancies brought on by poor cash-flows. Year on year personnel costs increased by 3% from R3.3 billion to R3.2 billion.
45.9 Depreciation and amortisation
Actual amount of depreciation and amortisation expense is more than budgeted for due to asset acquisitions and revaluation of buildings.
45.10 Finance costs
No finance costs were budgeted for. The economic entity incurred finance costs from finance lease liabilities, other financial liabilities and onerous contract obligations.
45.11 Lease rentals on operating lease
The variances were caused by increase in the number of equipment leased as well as the expenditure on leased vehicles.
45.12 Debt Impairment
The variance was caused by the reduction in impairment for Gauteng following settlement agreements.
45.13 General Expenses
The main drivers are research consumables for grants, external testing expenses, freight and courier as well as consumables all of which are related to the increase in volumes of tests performed. This resulted in more expenditure being incurred than budgeted for.
45.14 Loss on disposal of assets and liabilities
The amount budgeted was less than actual due to the fact that the economic entity discovered more assets for scrapping during the year’s physical verification than initially anticipated.
45.15 Gain on foreign exchange
No amount was budgeted. In current year the economic entity realised the gain on settling its foreign currency denominated obliga-tions.
NOTES TO THE AUDITED GROUP ANNUAL FINANCIAL STATEMENTS

ANNUAL REPORT 2017/18
Page - 282
ANNUAL REPORT 2017/18
Page - 282
Economic entity Controlling entity
2018 2017Restated
2018 2017Restated
Notes R ‘000 R ‘000 R ‘000 R ‘000
Revenue
Sale of goods 21,563 22,535 - -
Rendering of services 7,076,656 6,356,448 7,076,656 6,356,448
Miscellaneous other revenue 71,194 652 71,194 652
Government grants & subsidies 746,464 715,270 746,464 715,270
7,915,877 7,094,905 7,894,314 7,072,370
Cost of sales 22 (6,277,601) (5,832,752) (6,258,775) (5,813,624)
Gross surplus 1,638,276 1,262,153 1,635,539 1,258,746
Other income
Discount received 1,134 1,380 1,133 1,378
Fair value adjustments 22 - - -
Fair value adjustments: Notional interest - 60,560 - 60,560
Grant income recognised 264,554 149,376 264,554 149,376
Interest received 25 102,936 153,866 102,595 153,649
Exchange gains 3,376 10,619 3,376 10,619
Recoveries 11,707 10,662 11,707 10,662
Royalties received 408 253 408 253
Sundry Income 690 17,808 690 17,808
Teaching Income 45,172 18,461 45,172 18,461
429,999 422,985 429,635 422,766
Expenses (Refer to page 88) (748,158) (3,560,289) (747,921) (3,557,202)
Operating surplus (deficit) 24 1,320,117 (1,875,151) 1,317,253 (1,875,690)
Finance costs 26 (16,098) (23,764) (15,973) (23,764)
Surplus (deficit) before taxation 1,304,019 (1,898,915) 1,301,280 (1,899,454)
Taxation 27 1,444 11,252 - -
Surplus (deficit) for the year 1,302,575 (1,910,167) 1,301,280 (1,899,454)
DETAILED STATEMENT OF FINANCIAL PERFORMANCE
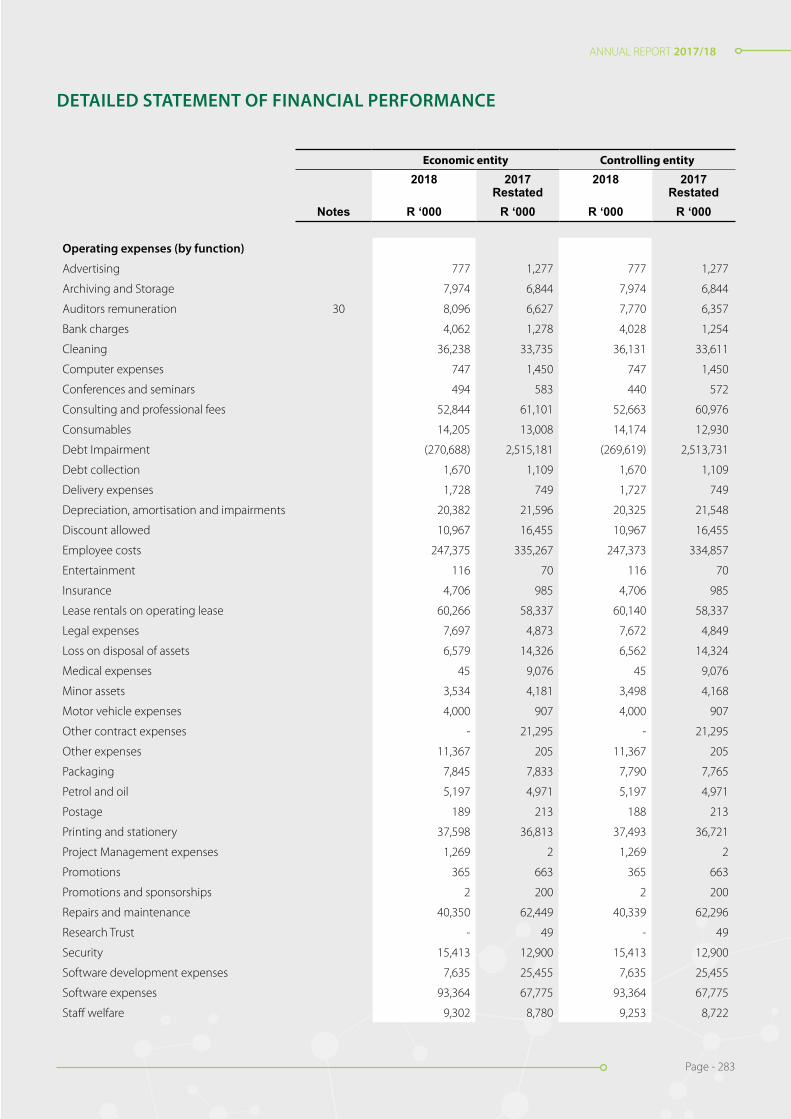
ANNUAL REPORT 2017/18
Page - 283
ANNUAL REPORT 2017/18
Page - 283
Economic entity Controlling entity
2018 2017Restated
2018 2017Restated
Notes R ‘000 R ‘000 R ‘000 R ‘000
Operating expenses (by function)
Advertising 777 1,277 777 1,277
Archiving and Storage 7,974 6,844 7,974 6,844
Auditors remuneration 30 8,096 6,627 7,770 6,357
Bank charges 4,062 1,278 4,028 1,254
Cleaning 36,238 33,735 36,131 33,611
Computer expenses 747 1,450 747 1,450
Conferences and seminars 494 583 440 572
Consulting and professional fees 52,844 61,101 52,663 60,976
Consumables 14,205 13,008 14,174 12,930
Debt Impairment (270,688) 2,515,181 (269,619) 2,513,731
Debt collection 1,670 1,109 1,670 1,109
Delivery expenses 1,728 749 1,727 749
Depreciation, amortisation and impairments 20,382 21,596 20,325 21,548
Discount allowed 10,967 16,455 10,967 16,455
Employee costs 247,375 335,267 247,373 334,857
Entertainment 116 70 116 70
Insurance 4,706 985 4,706 985
Lease rentals on operating lease 60,266 58,337 60,140 58,337
Legal expenses 7,697 4,873 7,672 4,849
Loss on disposal of assets 6,579 14,326 6,562 14,324
Medical expenses 45 9,076 45 9,076
Minor assets 3,534 4,181 3,498 4,168
Motor vehicle expenses 4,000 907 4,000 907
Other contract expenses - 21,295 - 21,295
Other expenses 11,367 205 11,367 205
Packaging 7,845 7,833 7,790 7,765
Petrol and oil 5,197 4,971 5,197 4,971
Postage 189 213 188 213
Printing and stationery 37,598 36,813 37,493 36,721
Project Management expenses 1,269 2 1,269 2
Promotions 365 663 365 663
Promotions and sponsorships 2 200 2 200
Repairs and maintenance 40,350 62,449 40,339 62,296
Research Trust - 49 - 49
Security 15,413 12,900 15,413 12,900
Software development expenses 7,635 25,455 7,635 25,455
Software expenses 93,364 67,775 93,364 67,775
Staff welfare 9,302 8,780 9,253 8,722
DETAILED STATEMENT OF FINANCIAL PERFORMANCE
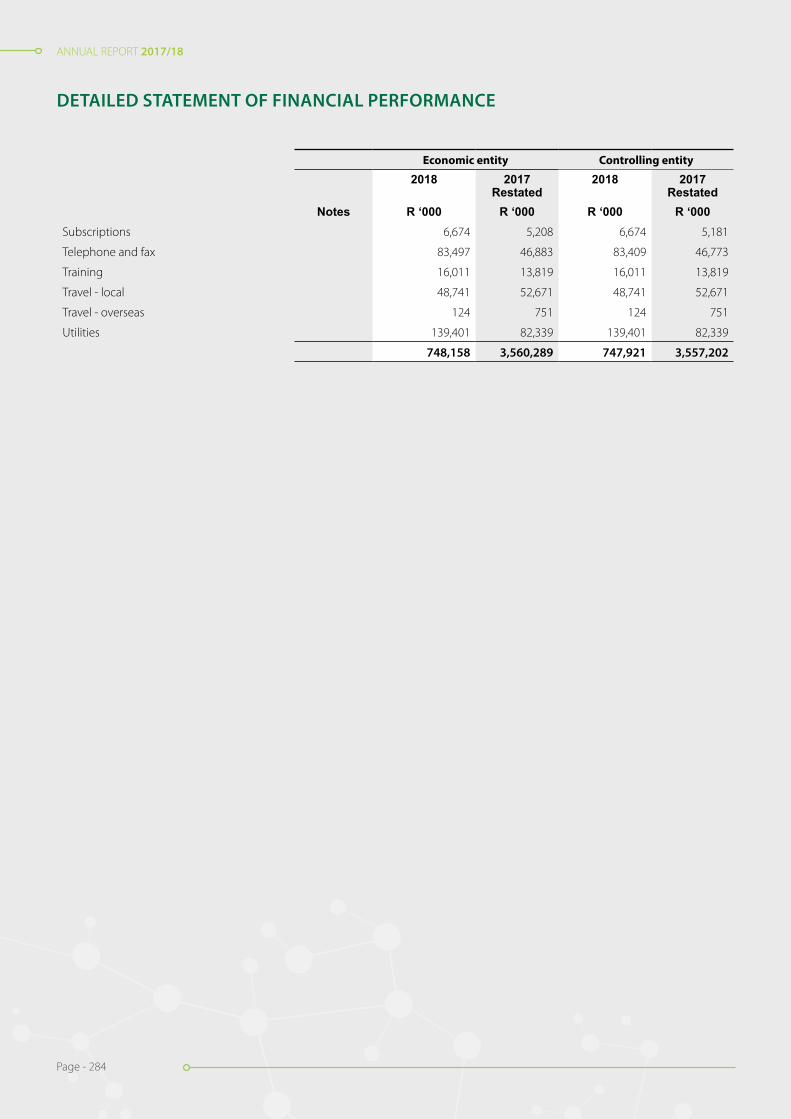
ANNUAL REPORT 2017/18
Page - 284
ANNUAL REPORT 2017/18
Page - 284
Economic entity Controlling entity
2018 2017Restated
2018 2017Restated
Notes R ‘000 R ‘000 R ‘000 R ‘000Subscriptions 6,674 5,208 6,674 5,181
Telephone and fax 83,497 46,883 83,409 46,773
Training 16,011 13,819 16,011 13,819
Travel - local 48,741 52,671 48,741 52,671
Travel - overseas 124 751 124 751
Utilities 139,401 82,339 139,401 82,339
748,158 3,560,289 747,921 3,557,202
DETAILED STATEMENT OF FINANCIAL PERFORMANCE


Modderfontein RoadSandringhamJohannesburgSouth Africa(GPS co-ordinates:S26°07.892E028°07.106)Private Bag X8, Sandringham 2131Johannesburg, South Africa
Tel: (011) 386-6000Fax: (011) 386-6620www.nhls.ac.za
RP252/2018ISBN: 978-0-621-45701-8