20170220 pielke-sr-climate-combined
107
A NEW PARADIGM FOR ASSESSING THE ROLE OF HUMANITY IN THE CLIMATE SYSTEM AND IN CLIMATE CHANGE Weiqing Han’s Class Feb 20, 2017 University of Colorado at Boulder
-
Upload
fabius-maximus -
Category
Science
-
view
2.683 -
download
0
Transcript of 20170220 pielke-sr-climate-combined

A NEW PARADIGM FOR ASSESSING THE ROLE OF
HUMANITY IN THE CLIMATESYSTEM AND IN CLIMATE
CHANGE
Weiqing Han’s ClassFeb 20, 2017
University of Colorado at Boulder
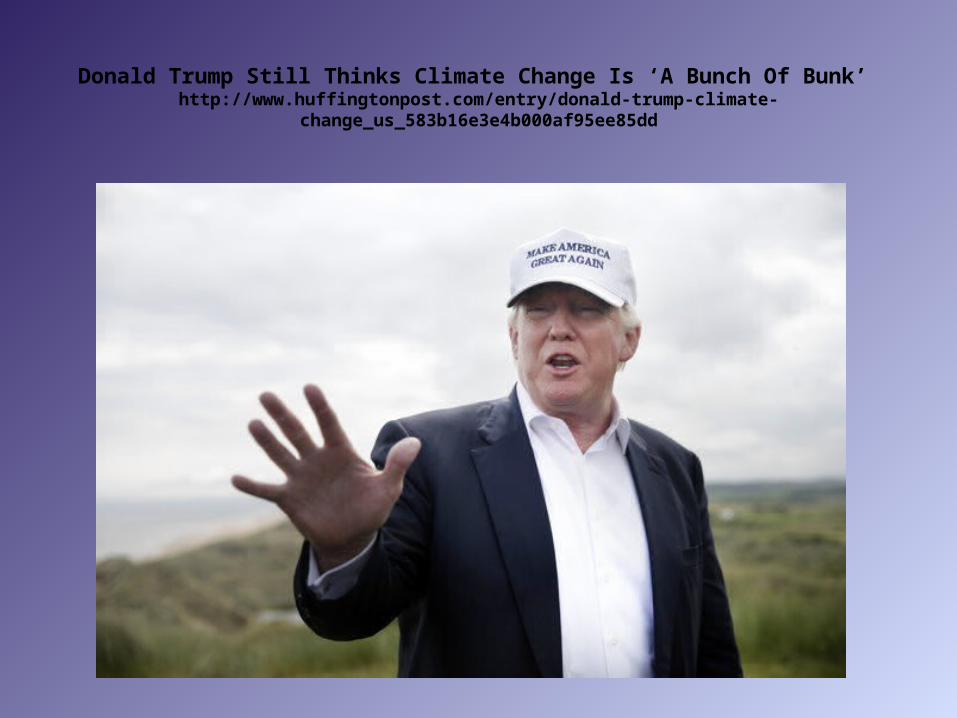
Donald Trump Still Thinks Climate Change Is ‘A Bunch Of Bunk’ http://www.huffingtonpost.com/entry/donald-trump-climate-
change_us_583b16e3e4b000af95ee85dd
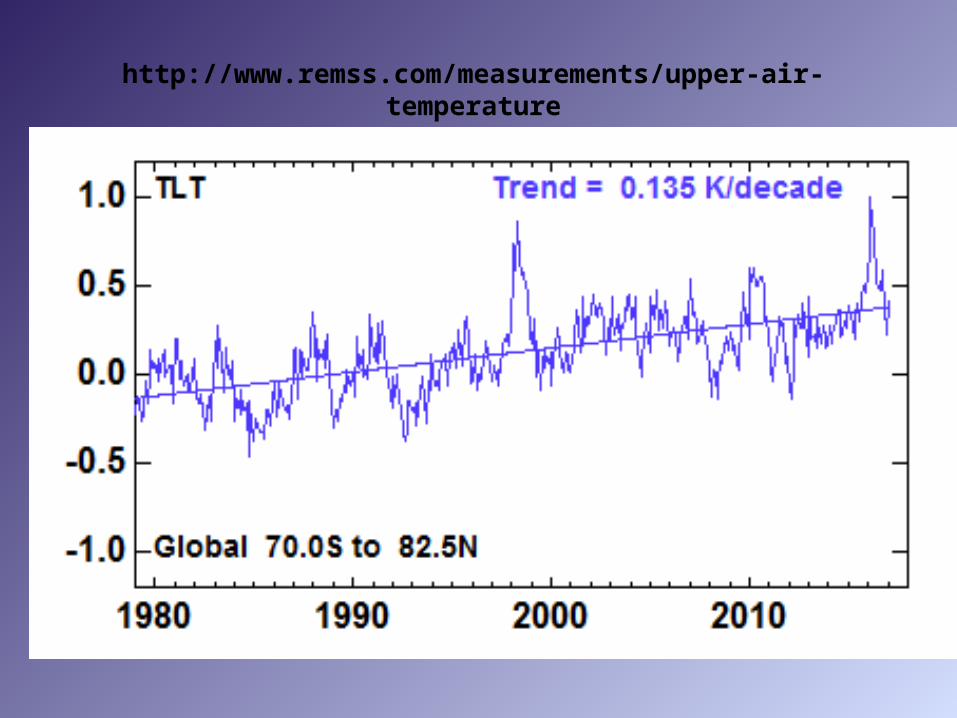
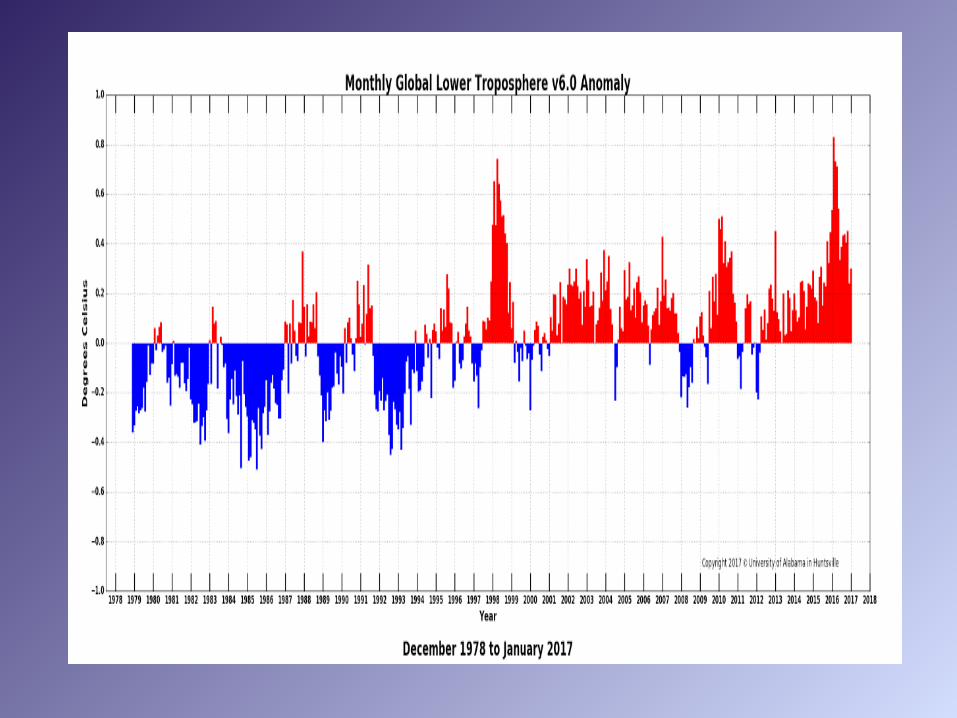
http://www.remss.com/measurements/upper-air-temperature
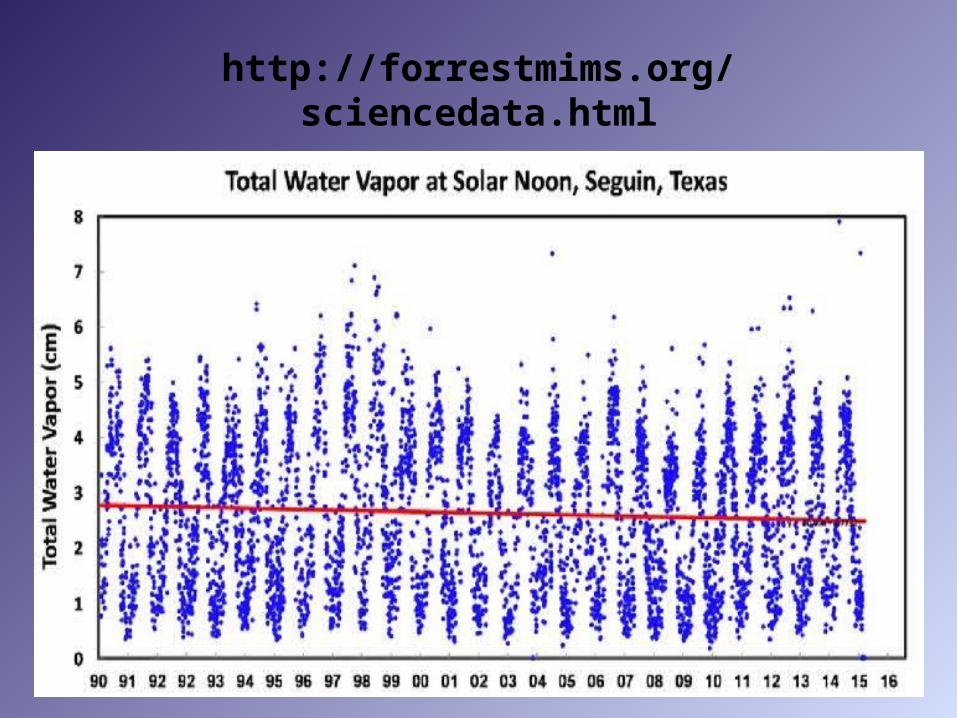
http://forrestmims.org/sciencedata.html
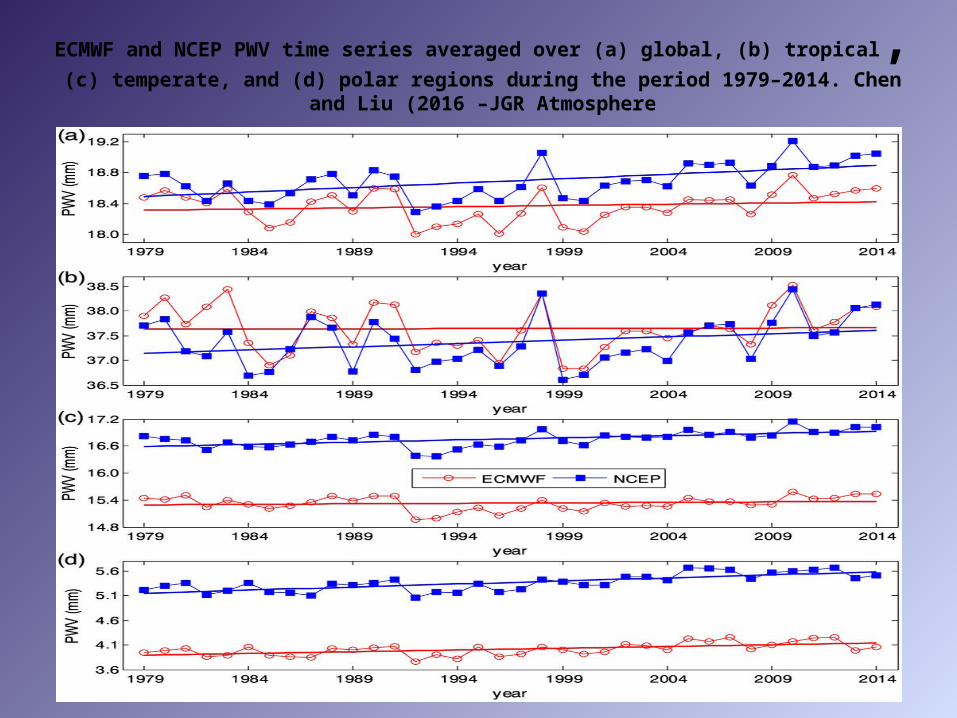
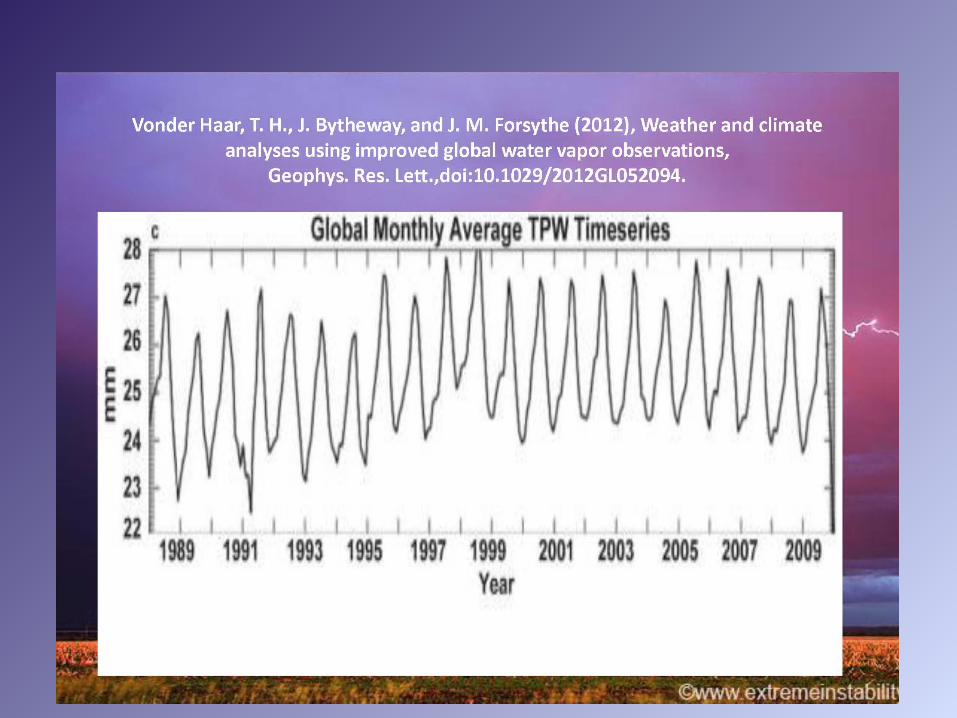
ECMWF and NCEP PWV time series averaged over (a) global, (b) tropical, (c) temperate, and (d) polar regions during the period 1979–2014. Chen and
Liu (2016 –JGR Atmosphere
http://onlinelibrary.wiley.com/doi/10.1002/2016JD024917/abstract
Global water vapor variability and trend from the latest 36 year (1979 to 2014) data of ECMWF and NCEP reanalyses, radiosonde, GPS, and microwave satellite Chen and Liu, 2016 JGR-Atmosphere
Positive global PWV trends, defined as percentage normalized by annual average, of 0.61 ± 0.33% decade−1, 0.57 ± 0.28% decade−1, and 0.17 ± 0.35% decade−1, have been derived from the NCEP, radiosonde, and ECMWF, respectively, for the period 1979–2014.
1992–2014 and 2000–2014. The linear relationship between PWV and surface temperature is positive over most oceans and the polar region.
Based on the 36 year (1979–2014) ERA-Interim reanalysis data set, the simulation of Clausius-Clapeyron relation shows that global PWV should increase in the range of 6%–13% K−1 accordingly with air temperature increase… Global PWV-temperature regression slopes of 2.4 ± 1.7% K−1 and 4.5 ± 1.4% K−1 are obtained for the period 1979–2014 from ECMWF and NCEP, respectively.
The regression slopes grow rapidly in the recent years 2000–2014, and slopes of 10.1 ± 2.7% K−1 and 11.4 ± 2.9% K−1 are yielded from the ECMWF and NCEP, respectively.
Like the PWV, surface temperature trends estimated from NCEP are larger than those derived from ECMWF. However, the surface temperature trends derived from both reanalyses indicate global surface warming slowdown in the recent period 2000–2014.

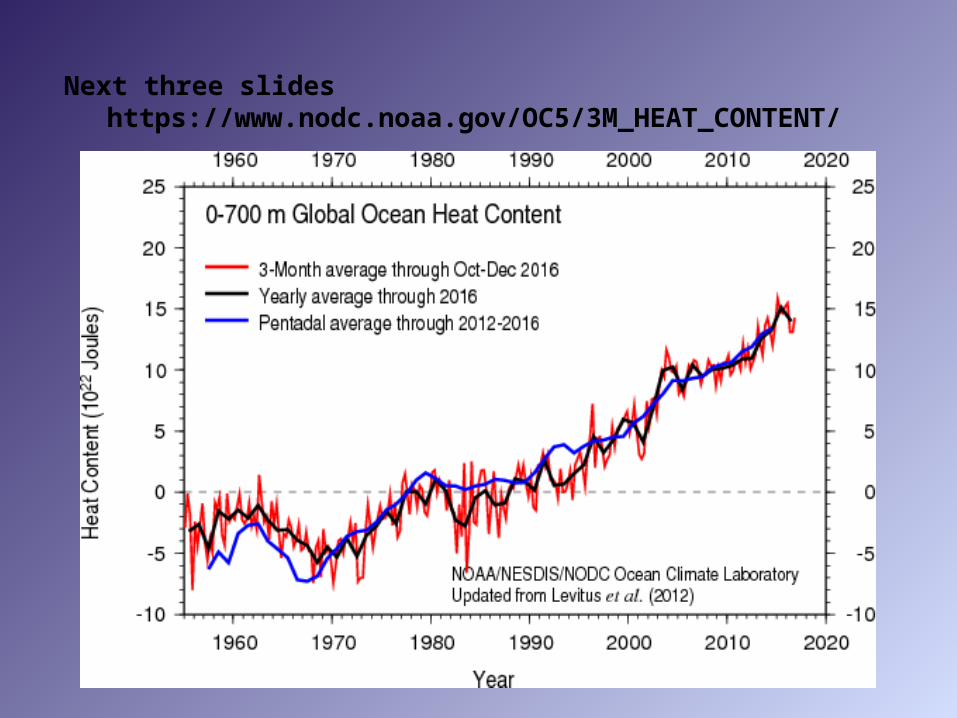
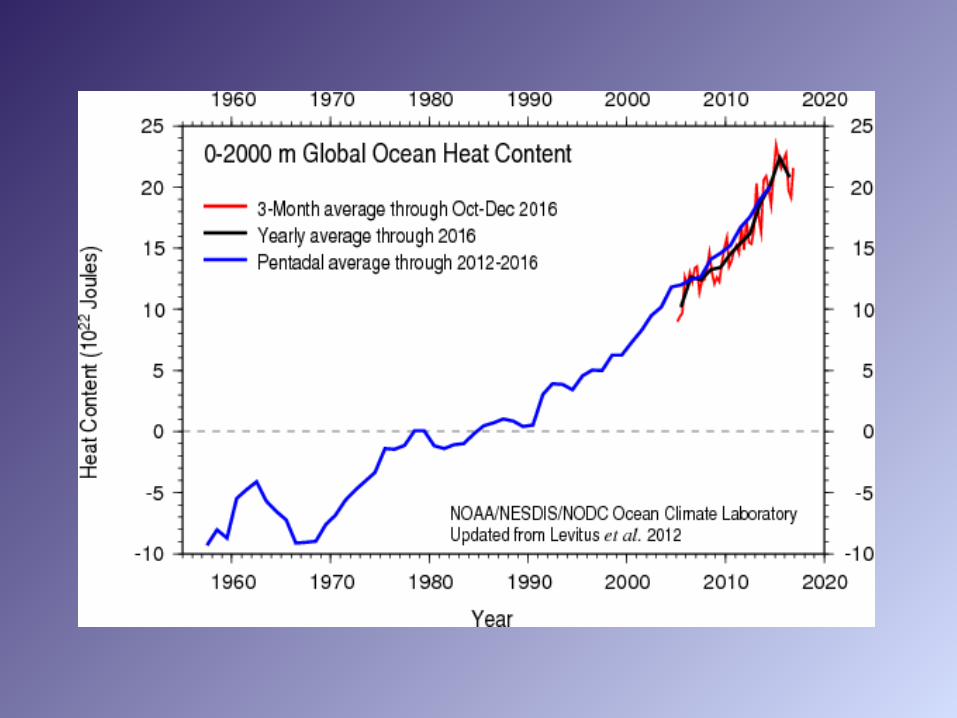
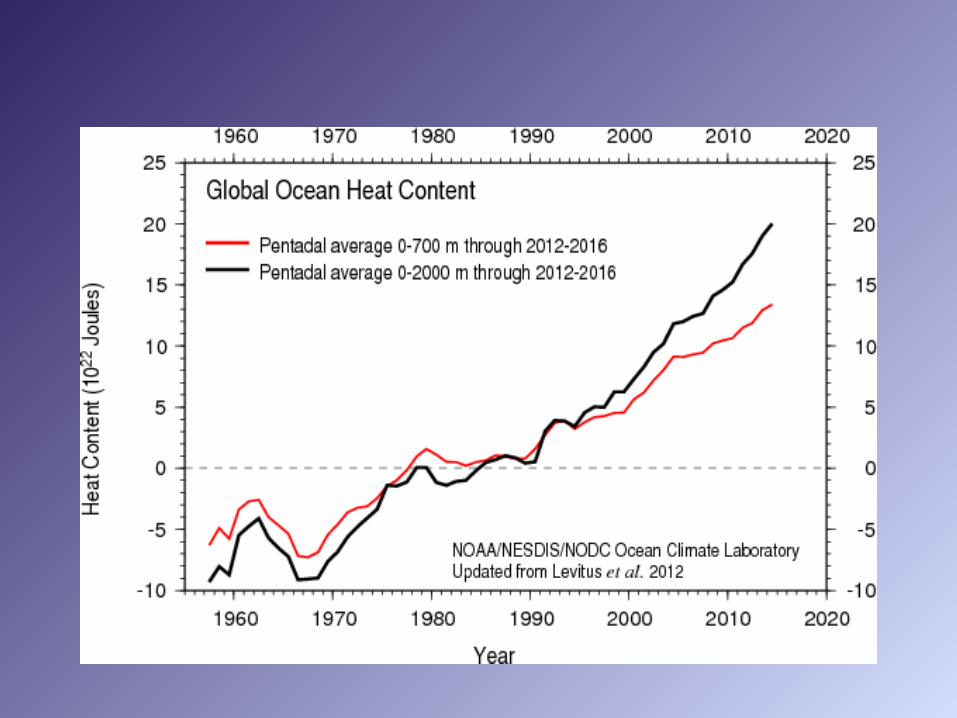
Next three slides https://www.nodc.noaa.gov/OC5/3M_HEAT_CONTENT/

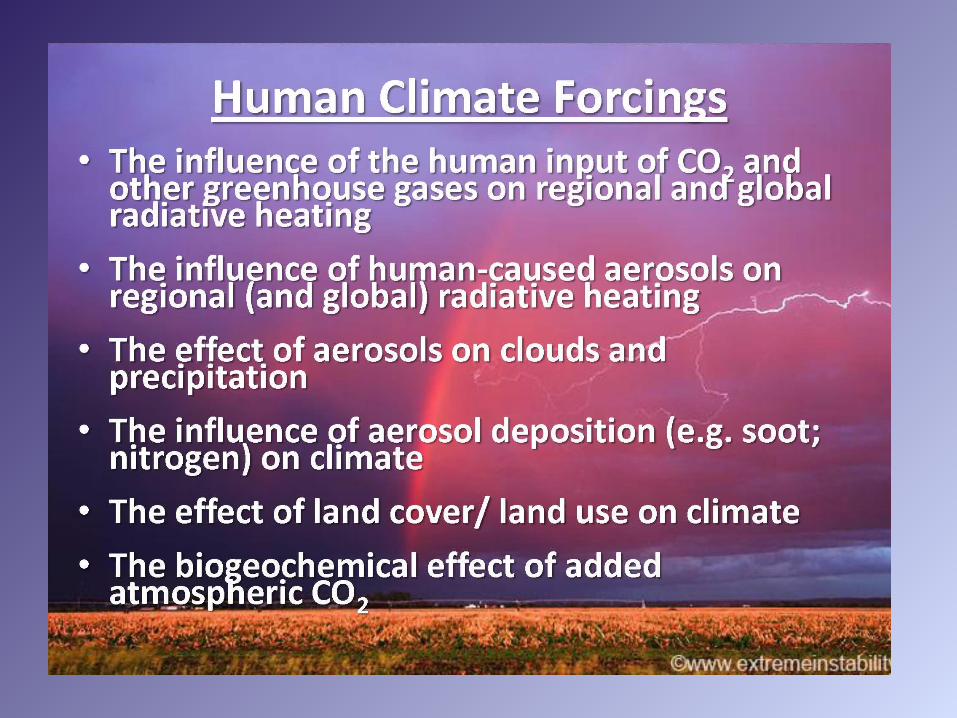
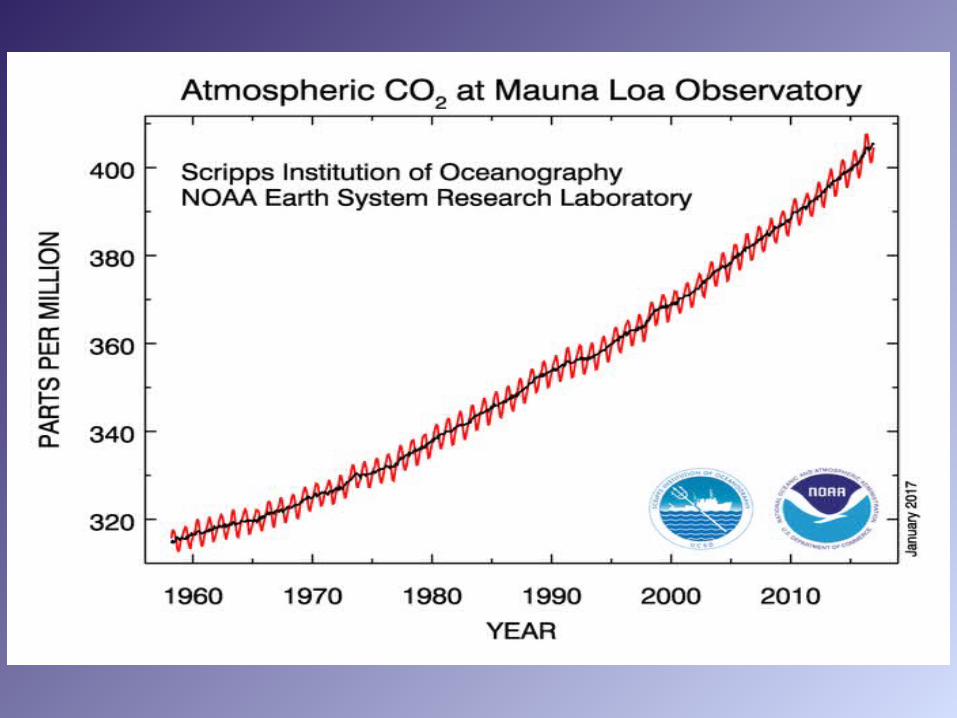
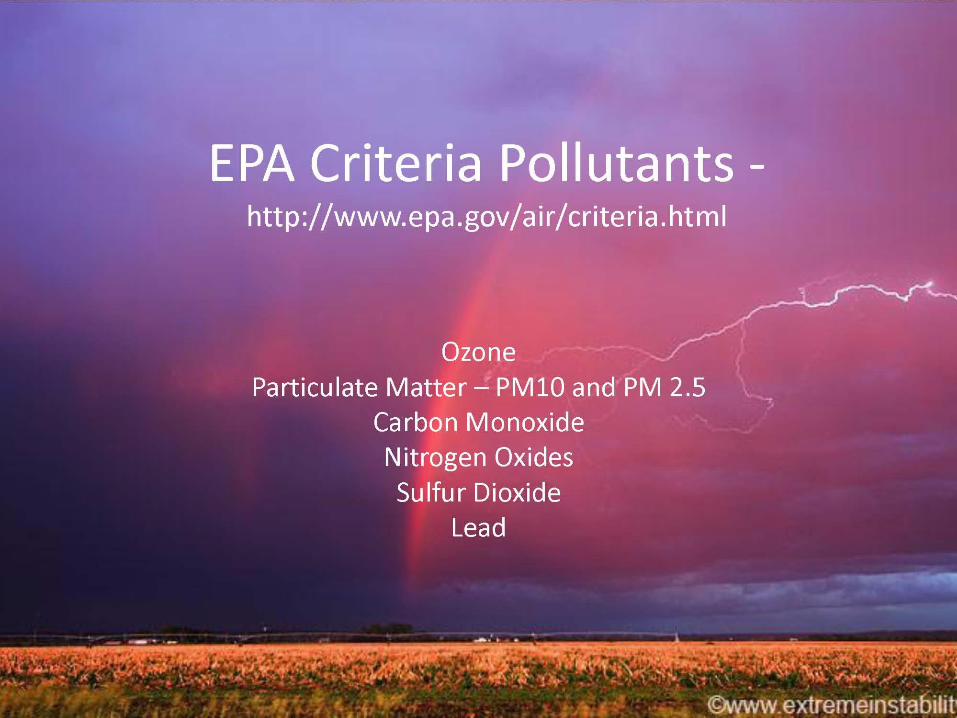
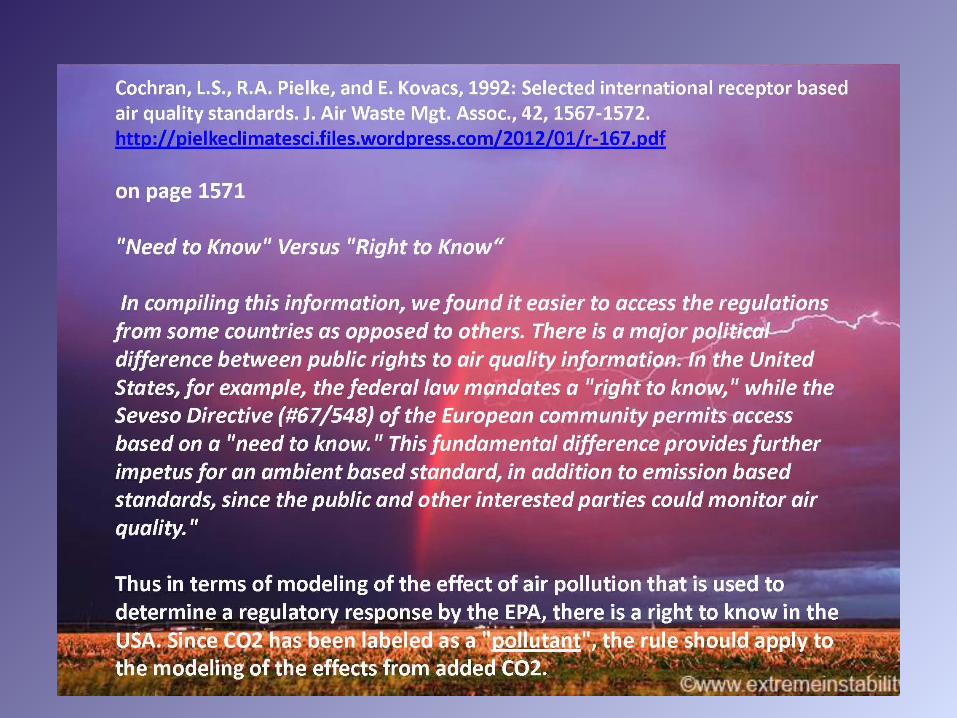
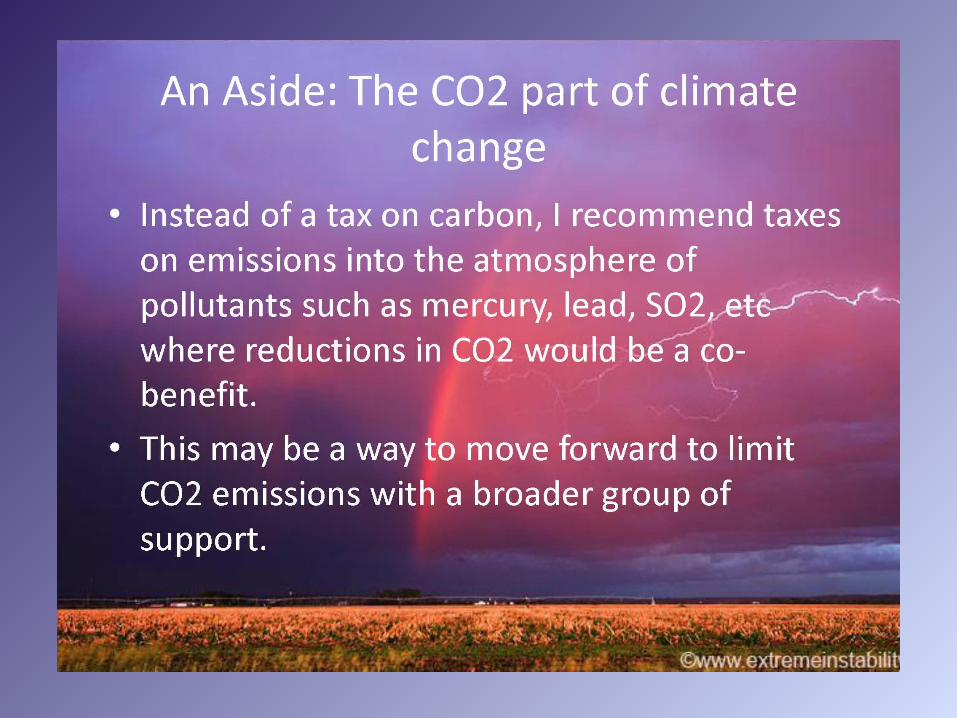
There are no benefits for these criteria pollutants at EPA standards levels. CO2 does at levels being discussed to limit to in the atmosphere. Not all are positive but some are (some plants like enriched CO2).
Thus, calling added CO2 a pollutant rather than a climate forcing is scientifically misleading even though politicians use the label.
CO2 is not an air pollutant. It is a climate forcing.