
ELECTRICAL TRANSMISSION & SUBSTATION STRUCTURES CONFERENCE ...

2017 Transmission and
Substation ReportYear in Review and Short Term OutlookAugust 2018

your
logo
Table of Contents
Overview: 3
2012-2020 Market Trends: 5-8
2017 Transmission & Substation Review: 9-17
2017 Transmission & Substation RFPs: 18-20
2018-2020 Transmission & Substation Review: 21-28
Contact Info: 29-30

your
logo
Overview
page
3
This report has been assembled using data from the Energy Acuity Grid Database, which includes a combination of state regulatory, independent system
operator, news and public solicitation data. It highlights 2017 transmission and substation development and how it compares to forecasted expansion
between 2018-2020, and in some cases historical data.
2017 saw a slight increase in the number of transmission line projects that went operating compared to 2016, but due to the scope of these projects 2017
saw the lowest amount of investment between 2012 and projected 2018 & 2019 expenditures. Of the transmission projects that went operating in 2017,
most consisted of either new lines or line rebuild projects with voltages ranging between 69 and 230 kV. Top developers were investor-owned utilities that
proportionally brought more projects online in the spring and summer months.
The surge of new and upgraded substations that went operational in 2016 continued in 2017. Substation project size based on voltage was more evenly
dispersed than transmission line development but still trended more towards the completion of lower voltage projects. Geographic region and utility
developer types were also more diverse than transmission line projects in 2017.
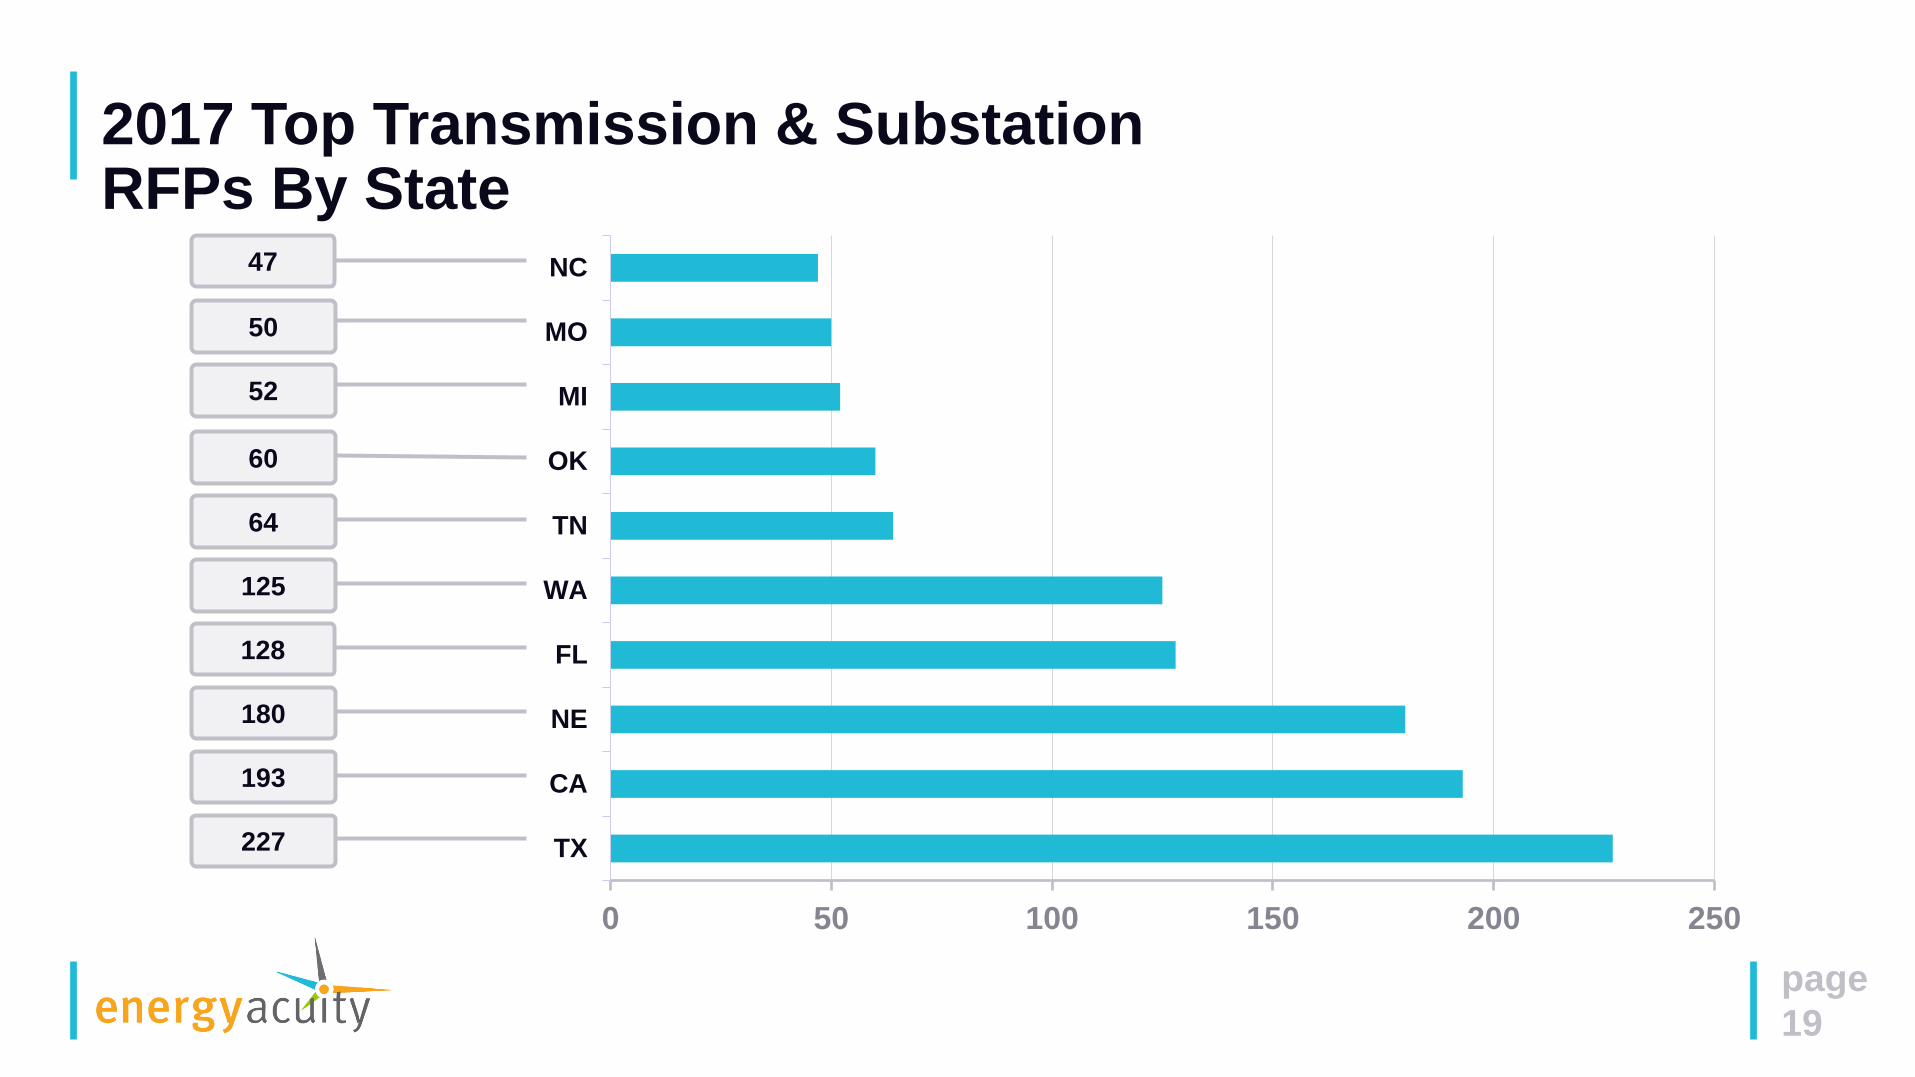
Of the transmission and substation RFPs tracked in 2017, many were released in Western or Southern States. Utilities releasing RFP were comprised of
midsized to large municipal utilities and co-ops, a reflection of how these utilities are more willing to make their procurement process publicly available.
Our short-term outlook indicates notable growth in both project and investment size in 2018, with a large project pool but smaller expenditures in 2019.
Looking further, 2020 is currently forecasted to have a significantly lower market size, this projection will increase as more information becomes available
in the coming months and years.
As in years past, projects scheduled for completion between 2018-2020 are nearly evenly split between new build versus the rebuilding of existing
transmission infrastructure. Of these projects, a vast majority will be built above ground using steel poles. Leading project developers are almost
exclusively IOUs with multi-state operations, however, a few federal government transmission organizations have a large pipeline of projects scheduled to
be built in the next three years.
.
2017 Review and
Short Term
Outlook Through
2020

your
logo
Transmission Projects Operating and Investment by Year
page
5
$14,428,040,000.00
$20,688,860,000.00
$17,184,570,000.00
$19,034,550,000.00
$14,516,210,000.00
$9,287,000,000.00
$16,708,980,000.00
$9,389,020,000.00
$6,554,930,000.00
144
197
176
236
208218
212
299
134
0
50
100
150
200
250
300
350
$-
$5,000,000,000.00
$10,000,000,000.00
$15,000,000,000.00
$20,000,000,000.00
$25,000,000,000.00
2012 2013 2014 2015 2016 2017 2018 2019 2020
Op
era
tin
g P
roje
cts
by Y
ea
r
Pro
jec
t In
ve
stm
en
t b
y Y
ea
r
your
logo
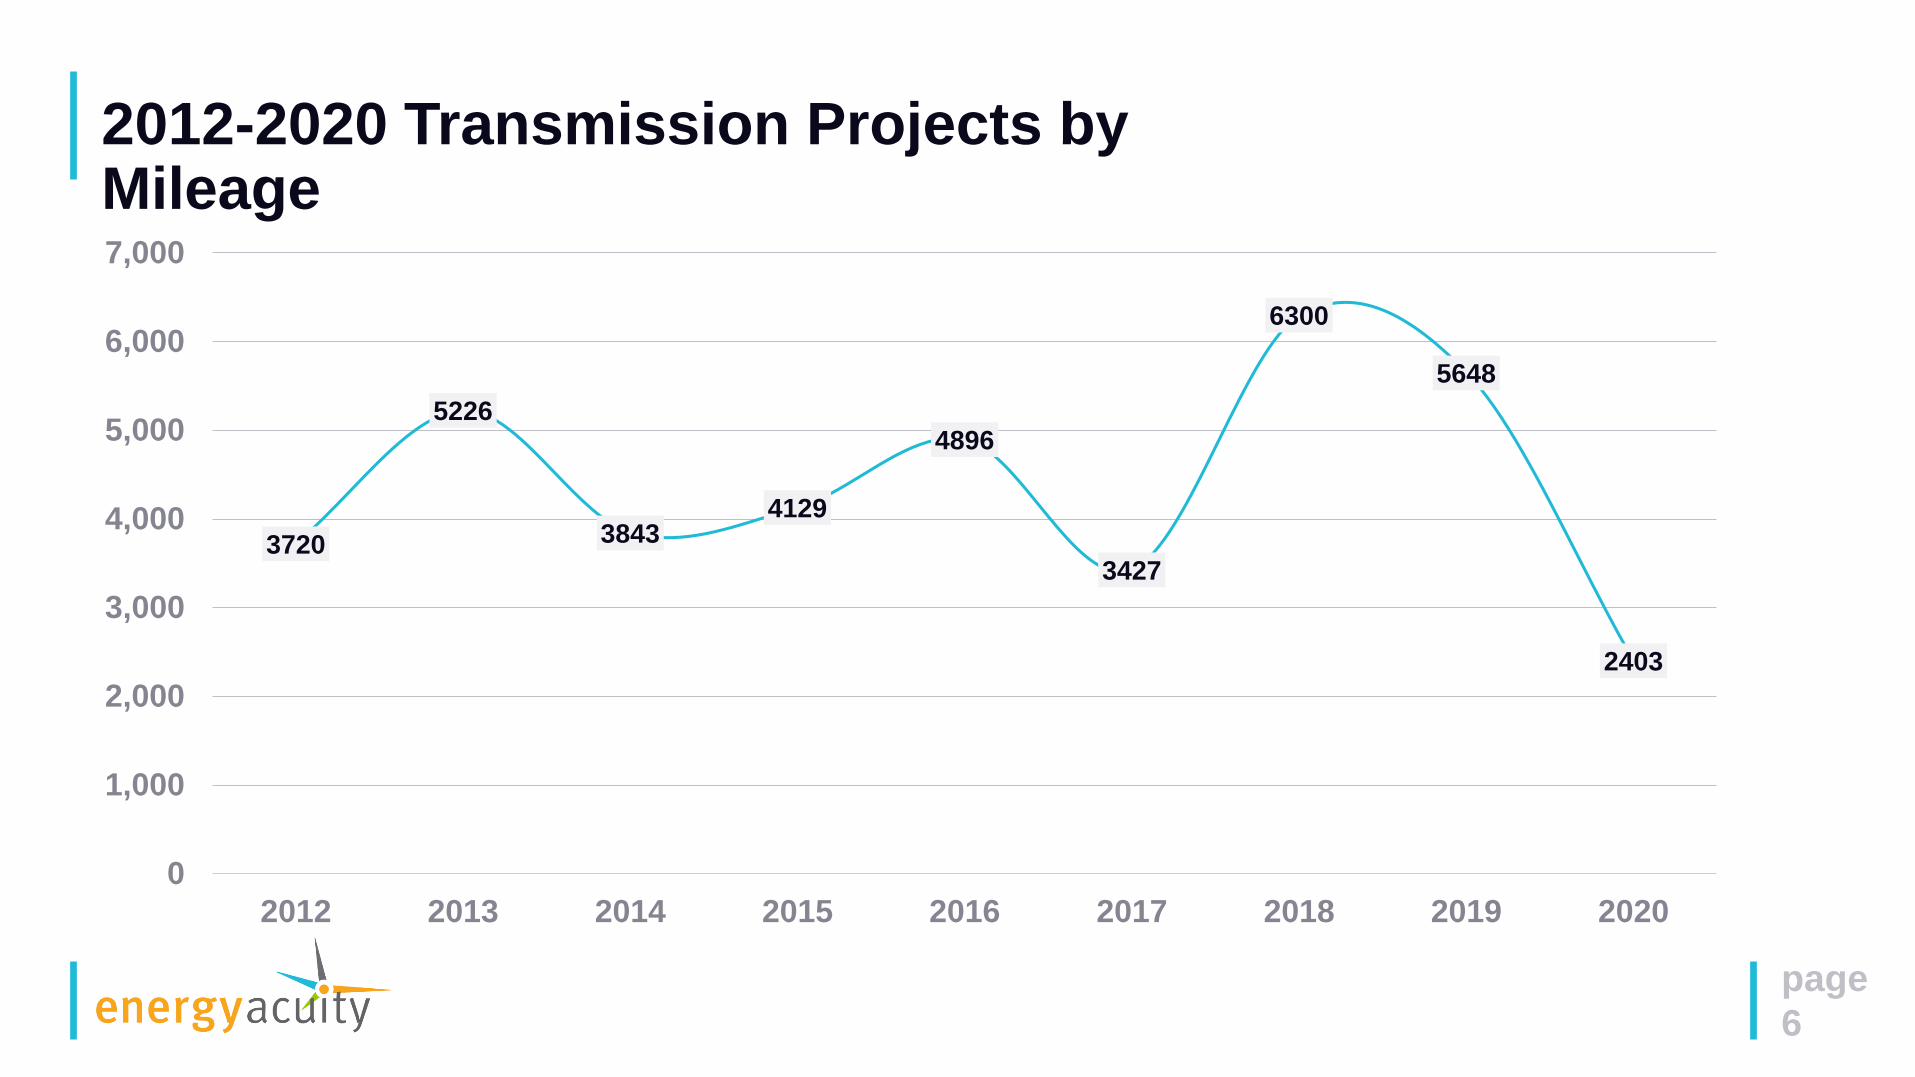
2012-2020 Transmission Projects by Mileage
page
6
3720
5226
38434129
4896
3427
6300
5648
2403
0
1,000
2,000
3,000
4,000
5,000
6,000
7,000
2012 2013 2014 2015 2016 2017 2018 2019 2020

your
logo
2012-2020 Transmission Project Types
page
7
1028
804
8041
107
30
286
New Build Rebuild Reconductor Merchant RenewableInterconnection
TraditionalInterconnection
Multivalue*
*Multivalue is a combination or two or more of an individual project type

your
logo
page
8
224
284270 263
465497
579
286
172
0
100
200
300
400
500
600
700
2012 2013 2014 2015 2016 2017 2018 2019 2020
Substation Projects Operating by Year

your
logo
2017 Operating Transmission Projects by State
page
9

your
logo
Operating Transmission Projects by Quarter
page
10
quarter 1
year Projects
Online
2015 39
2016 36
2017 31
quarter 2
quarter 3
quarter 4year Projects
Online
2015 87
2016 48
2017 75
year Projects
Online
2015 71
2016 71
2017 58
year Projects
Online
2015 74
2016 113
2017 27
39
87
65
3736
49
68
51
37
93
57
31
Q1 Q2 Q3 Q4
2015 2016 2017

your
logo
page
9
Operating Transmission Projects by Size
pag
69
82
72
29
18
113
83
57
28
8
105
77
28
102
69-137 kV 138-229 kV 230-344 kV 345-499 kV 500-765 kV
2015 2016 2017

your
logo
2017 Top Transmission Developers by Operating Projects
page
12
6
6
6
7
7
7
7
11
14
36
0 5 10 15 20 25 30 35 40
AEP
Entergy
Xcel Energy
AltaLink
Lower Colorado River Authority
Puget Sound Energy
ITC Holdings Corp
Hydro-Quebec
PPL Electric Utilities
Exelon
Number of Projects

your
logo
2017 Top Transmission EPC Companies
page
13
13
12
19
19
19
23
31
32
36
47
0 10 20 30 40 50
Burns & McDonnell
POWER Engineers
Black & Veatch
Quanta Services
ABB
Sargent & Lundy
PAR Electrical Contractors
HDR Engineering, Inc.
TRC Companies, Inc.
L.E. Myers Co.

your
logo
page
14
2017 Operating Substation Projects by State

your
logo
page
15
Operating Substation Projects by Quarter
quarter 1
year Projects
Online
2015 33
2016 47
2017 50
quarter 2
quarter 3
quarter 4year Projects
Online
2015 64
2016 53
2017 93
year Projects
Online
2015 61
2016 104
2017 144
year Projects
Online
2015 105
2016 264
2017 210
33
64 61
105
47 53
104
264
50
93
144
210
Q1 Q2 Q3 Q4
2015 2016 2017

your
logo
page
16
page
Operating Substation Projects by Size
pag
6475
60
37
19
169
132
79
55
20
210
119
94
4024
69-137 kV 138-229 kV 230-344 kV 345-499 kV 500-765 kV
2015 2016 2017

your
logo
page
17
2017 Top Substation Developers by Operating Projects
7
7
8
8
9
10
10
17
19
37
0 5 10 15 20 25 30 35 40
American Electric Power
Western Area Power Administration
Nebraska Public Power District (NPPD)
Hydro-Quebec
Entergy
BC Hydro
AltaLink
Snohomish County PUD
Dominion
National Grid
Number of Projects

your
logo
page
18
2017 Transmission & Substation RFPs by State
your
logo
2017 Top Transmission & Substation RFPs By State
page
19
50
47
52
60
64
125
128
180
193
227
0 50 100 150 200 250
TX
CA
NE
FL
WA
TN
OK
MI
MO
NC

your
logo
2017 Top Transmission & Substation RFPs By Utility
page
20
32
31
34
34
35
37
47
48
85
87
0 20 40 60 80 100
Nebraska Public Power District (NPPD)
Western Area Power Administration
Sacramento Municipal Utility District(SMUD)
Lincoln Electric System (LES)
Garland Power & Light
Bryan Texas Utilities
Snohomish County PUD
Lansing Board of Water & Light
CPS Energy
Grand River Dam Authority

your
logo
2018-2020 Under Development Transmission Projects
page
21
417
191
66
212
299
134
2018 2019 2020
Under Construction Operating

your
logo
2018-2020 Under Development Transmission Projects by Size
page
22
273
186
82 76
10
220
142
77
26 25
51
74
4023
12
69-137 kV 138-229 kV 230-344 kV 345-499 kV 500-765 kV
2018 2019 2020

your
logo
2018-2020 Under Development Transmission Projects by Pole Type
page
23
1
31
5
3553
314
ConcretePoles
Wooden Poles H-Frame(Wood)
H-Frame(Steel)
Lattice Tower Steel Poles

your
logo
2018-2020 Under Development Transmission Projects by Line Location
page
24
48
886
12
Underground Above Ground Multiple Locations

your
logo
page
25
2018-2020 Top Transmission Developers by Under Constructions & Operating Projects
0 50 100 150 200 250
American Electric Power
Xcel
Dominion
San Diego Gas & Electric
Pacific Gas & Electric (PG&E)
American Transmission Company
Entergy
PPL Electric Utilities
Western Area Power Administration
Tennessee Valley Authority (TVA)
21
20
23
24
28
31
31
32
64
205

your
logo
2018-2020 Under Development Substation Projects
page
26
232
286
42
586
78
172
2018 2019 2020
Under Construction Operating

your
logo
page
27
page
2018-2020 Under Development Substation Projects by Size
pag
260
206
149
84
51
77
116
67 61
2836 39
74
26 33
69-137 kV 138-229 kV 230-344 kV 345-499 kV 500-765 kV
2018 2019 2020

your
logo
page
28
2018-2020 Top Substation Developers by Under Construction & Operating Projects
12
12
13
13
15
19
20
25
28
56
0 10 20 30 40 50 60
American Electric Power
Xcel Energy
Hydro-Quebec
Nebraska Public Power District (NPPD)
Duke Energy
Entergy
Public Service Electric and Gas Company
Dominion
Lower Colorado River Authority (LCRA)
BC Hydro

your
logo
Thank You for Downloading our Report!
page
29
All transmission and substations charts and figures were built
with data from the Energy Acuity Grid Database. If you have any
questions about the report, or where to find this data, please
reach out to our client relations team at
Click here to continue on to the database: Energy Acuity Log In
your
logo
page
30
address
1623 Blake St.
Denver, CO, 80202
Phone: 720.235.1296
online
www.energyacuity.com
Contacts

![July 2012 Buchanan Creek Substation Transmission Project Creek... · Buchanan Creek Substation Transmission Project 1 ... new substation and approximately 150 metres of new ... (kV)],](https://static.fdocuments.net/doc/165x107/5ae59a7b7f8b9ae1578c809f/july-2012-buchanan-creek-substation-transmission-creekbuchanan-creek-substation.jpg)


