2017 survey of women's experiences of maternity care · PDF fileNHS patient survey programme ....
67
NHS patient survey programme 2017 survey of women’s experiences of maternity care Statistical release Published January 2018 Independent data analysis
Transcript of 2017 survey of women's experiences of maternity care · PDF fileNHS patient survey programme ....

NHS patient survey programme
2017 survey of women’s experiences of maternity care
Statistical release Published January 2018 Independent data analysis
2017 Survey of women’s experiences of maternity care: Statistical release 2
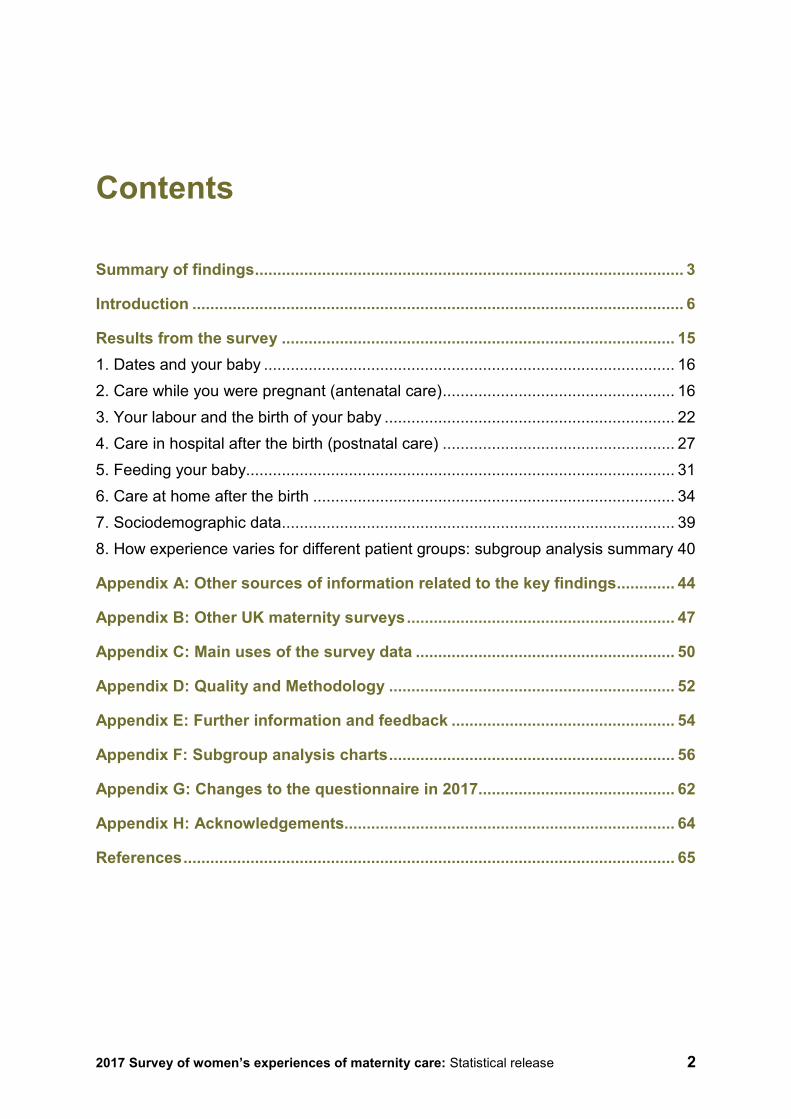
Contents
Summary of findings ................................................................................................ 3
Introduction .............................................................................................................. 6
Results from the survey ........................................................................................ 15
1. Dates and your baby ............................................................................................ 16
2. Care while you were pregnant (antenatal care) .................................................... 16
3. Your labour and the birth of your baby ................................................................. 22
4. Care in hospital after the birth (postnatal care) .................................................... 27
5. Feeding your baby................................................................................................ 31
6. Care at home after the birth ................................................................................. 34
7. Sociodemographic data ........................................................................................ 39
8. How experience varies for different patient groups: subgroup analysis summary 40
Appendix A: Other sources of information related to the key findings ............. 44
Appendix B: Other UK maternity surveys ............................................................ 47
Appendix C: Main uses of the survey data .......................................................... 50
Appendix D: Quality and Methodology ................................................................ 52
Appendix E: Further information and feedback .................................................. 54
Appendix F: Subgroup analysis charts ................................................................ 56
Appendix G: Changes to the questionnaire in 2017 ............................................ 62
Appendix H: Acknowledgements.......................................................................... 64
References .............................................................................................................. 65
2017 Survey of women’s experiences of maternity care: Statistical release 3
Summary of findings Maternity services support women and their families through a milestone moment in their lives. The quality of the care women receive during this life-changing period will influence not only the health of mother and child, but also their interactions with health services throughout the rest of their lives. This maternity survey received responses from 18,426 women who gave birth during February 2017 (as well as January 2017 if trusts had smaller numbers of births during February). We asked women about their experiences of care during labour and birth, as well as the quality of antenatal and postnatal support received. Overall, women reported positive experiences of maternity care in 2017. Compared with previous maternity surveys, we can see small incremental improvements in results across almost every question that women were asked in the questionnaire. The most striking improvements in results are within the area of postnatal care, where results have historically been the most negative. However, results for questions on postnatal care, either in the hospital or once they returned home, continue to remain less positive than other aspects of the maternity pathway. Improvements over time There have been very small improvements across most questions from the 2013 survey results onwards. Notable improvements include consistent upward trends in women’s perceptions of being offered choices, and having the information to make choices, during their antenatal care. For example, women’s responses regarding choices around where to have their baby have improved, as more women in 2017 said they were offered the choice of giving birth in a midwife-led unit or birth centre than in 2013 (42% compared with 35%). There were also positive shifts in some aspects of care that have historically had more negative results, for example, being left alone during labour or birth and being worried by this. In 2017, 77% of respondents said they were never left alone if they were worried, compared with 74% in 2013. This survey also showed an improvement in women’s experiences of the continuity of their care. For example, 38% of women in 2017 saw the same midwife throughout antenatal check-ups, compared with 34% in 2013. But, despite this increase, the majority of women did not see the same midwife for all their antenatal appointments (61%). Seventy-two per cent did not see the same midwife when receiving postnatal care after leaving hospital. Across the survey, by far the largest improvements were evident for questions asking women about their postnatal care. In 2017 almost six in 10 women said they could ‘always’ get help from a member of staff within a ‘reasonable’ time when they were still in hospital after giving birth (59%), an improvement of five percentage points since 2015. Most women (74%) said they were ‘always’ treated with kindness and understanding when in hospital after the birth, compared with 65% in 2013. Also, 66% of women felt they were ‘always’ given the information or explanations they
2017 Survey of women’s experiences of maternity care: Statistical release 4
needed after birth, compared with 58% in the 2013 survey. The majority of women (69%) said that if their partner or someone else was involved in their care, they were able to stay with them as much as they wanted after the birth, a positive increase from 63% in the last survey in 2015. Women were asked a number of questions about their access to emotional support once they were home. The most substantial improvement was seen for the question asking whether they were told who to contact if they experienced any emotional changes. Seventy-eight per cent of women said they received this contact information compared with 74% in 2015. In addition, 59% of women felt they had ‘definitely’ received enough information about emotional changes that might occur, up from 56% in 2013. Since 2015, more women also felt they were asked about their emotional state during antenatal check-ups (64% up from 57% in 2015). Deterioration over time There was almost no deterioration in results across this year’s survey. The only areas where positive results decreased included a significant decrease in the proportion of women who said that they were given information about contraception once home, (89% compared with 91% in 2015). Although 96% of women had a telephone number to contact a midwife or midwifery team after leaving hospital, this proportion has fallen by one percentage point since both the 2013 and 2015 surveys. The proportion of women who said they gave birth while lying with their legs in stirrups has increased by one percentage point since 2015, as 36% of women in 2017 told us they gave birth in this way. Eighty-nine per cent of women who had an ‘assisted delivery’ (meaning their baby was born with the assistance of a ventouse or forceps) reported that they used stirrups, while 22% of those who had a ‘normal vaginal’ delivery said they also used them. Areas remaining positive As results for most questions improved in 2017, the questions with the most substantial positive shifts are noted above. Areas that women continued to rate consistently well in 2017 included the quality of communication during antenatal care and during labour and birth. Nearly nine in 10 women (88%) said antenatal midwives ‘always’ spoke to them in a way they could understand. This proportion was 89% when asked the same question about the way they were spoken to during labour and birth (up from 86% in 2013). A similar proportion (88%) said they were ‘always’ treated with dignity and respect during labour and birth (up from 85% in 2013). Areas for improvement Despite improvements in choice around where to receive antenatal care since the 2013 survey, 69% of women reported that they were not given a choice about where their antenatal care would be delivered. Fifteen per cent of women said they were not offered any choices about where to have their babies. Over a quarter of women (28%) felt they were given information about where to have their babies ‘to some extent’, while 13% of women reported that they were not given ‘enough’ information.
2017 Survey of women’s experiences of maternity care: Statistical release 5
While half of women felt their antenatal midwives were ‘always’ aware of their medical history, over a third felt they were aware only ‘sometimes’ (36%), and 14% did not consider their midwives to be aware of this at all. Almost one in 10 women (9%) said that during their pregnancy, they did not receive relevant information about feeding their baby from midwives. When women changed their planned method of pain relief during labour and birth, most did so because of medical reasons (28%). A small minority (3%) were told they could not use their planned method because of a shortage of staff. Of women who raised a concern during labour and birth, 19% felt that it was not taken seriously by healthcare professionals in charge of their care. Differences in women’s experiences Analysis of the experiences of different groups of women showed few differences between the groups. However, ‘continuity of care’ appears to have an impact on women’s experiences of ‘compassionate’ care. Women who said they did not see the same midwife throughout their antenatal care, and then did not see a consistent midwife during their postnatal care, felt their care was less compassionate than care for other women. Whereas women who had continuity of care during both stages (they had the same midwife throughout their antenatal care and then saw a consistent midwife throughout their postnatal care) were more positive when answering questions on whether they were treated with compassion. Perhaps unsurprisingly, women whose baby was born by an emergency caesarean section reported poorer ‘involvement’ in their own care.
2017 Survey of women’s experiences of maternity care: Statistical release 6
Introduction
Maternity services The importance of a positive patient experience is increasingly recognised both within the NHS and government health policy for all patients.1 However, women using maternity services are a distinct patient group meriting particular focus, given they are predominately healthy, and pregnancy is a natural event that does not always require doctor-led intervention. The quality of services provided to mothers across the maternity pathway has a direct effect not only on women and their babies, but also on the lives of the rest of the family. This potential impact can determine many aspects of a household’s wellbeing and the financial cost of their healthcare for the NHS. Consequences of poor care can even affect care needs of future generations as they are associated with wider social inequalities.2 Maternity services are a key area of focus for the NHS. In March 2015, NHS England announced a major review of national maternity services as part of the NHS Five Year Forward View. In 2016, NHS England published the national Maternity Review report Better Births, which assesses current maternity care provision and considers how services should be developed to meet the changing needs of women and babies. We present more information about the policy transformation programme and main goals proposed in Better Births in the Policy context section. At the same time, the Secretary of State for Health has set an ambition and strategy3 to reduce the number of stillbirths, neonatal deaths, maternal deaths and serious brain injuries during birth. Stillbirth and neonatal mortality rates in England have decreased in the last 10 years. In 2017, the NHS Resolution annual report showed that, although litigation childbirth claims represented only 10% of claims, they accounted for 50% of total claims in terms of value; an increase from 43% the previous year (figure 1).4 Concerns have been raised about cases in which children suffered brain damage at birth and have to live the rest of their lives with complex care needs. The report also asserts that in order to address these needs, the value of lifelong care for the NHS could reach £20million or more for each child.

2017 Survey of women’s experiences of maternity care: Statistical release 7
Figure 1: The value of clinical negligence claims received in 2016/17 by specialty
Source: Five years of cerebral palsy claims. A thematic review of NHS Resolution data, NHS Resolution, 2017.
This survey The maternity survey is part of a wider programme of NHS patient surveys, which covers a range of topics including adult inpatient care, children’s inpatient and day-case services, emergency departments (including accident and emergency (A&E)) and community mental health services. To see the results from previous maternity surveys see: http://www.nhssurveys.org/surveys/299. The 2017 maternity survey involved 130 NHS trusts in England and questionnaires were sent to 50,008 women. Responses were received from 18,426 women, an adjusted response rate of 37.4% (see Appendix D). Women who gave birth between 1 and 28 February 2017 (and January if a trust did not have a minimum of 300 eligible births in February) were invited to take part in the survey, with the following exceptions: • women aged under 16 at the date their baby was delivered
• women whose baby had died during or since delivery
• any women who had a stillbirth, including where it occurred during a multiple delivery
• women who were in hospital, or whose baby was in hospital, at the time the sample was drawn from the trusts’ records
• women who had a concealed pregnancy (where it was possible to identify from trust records)
2017 Survey of women’s experiences of maternity care: Statistical release 8
• women whose baby was taken into care (foster care or adopted), where this was known by the trust
• women who gave birth in a maternity unit managed by another provider
• women who gave birth in a private maternity unit or wing
• women known to have requested that their details should not be used for any purpose other than their clinical care
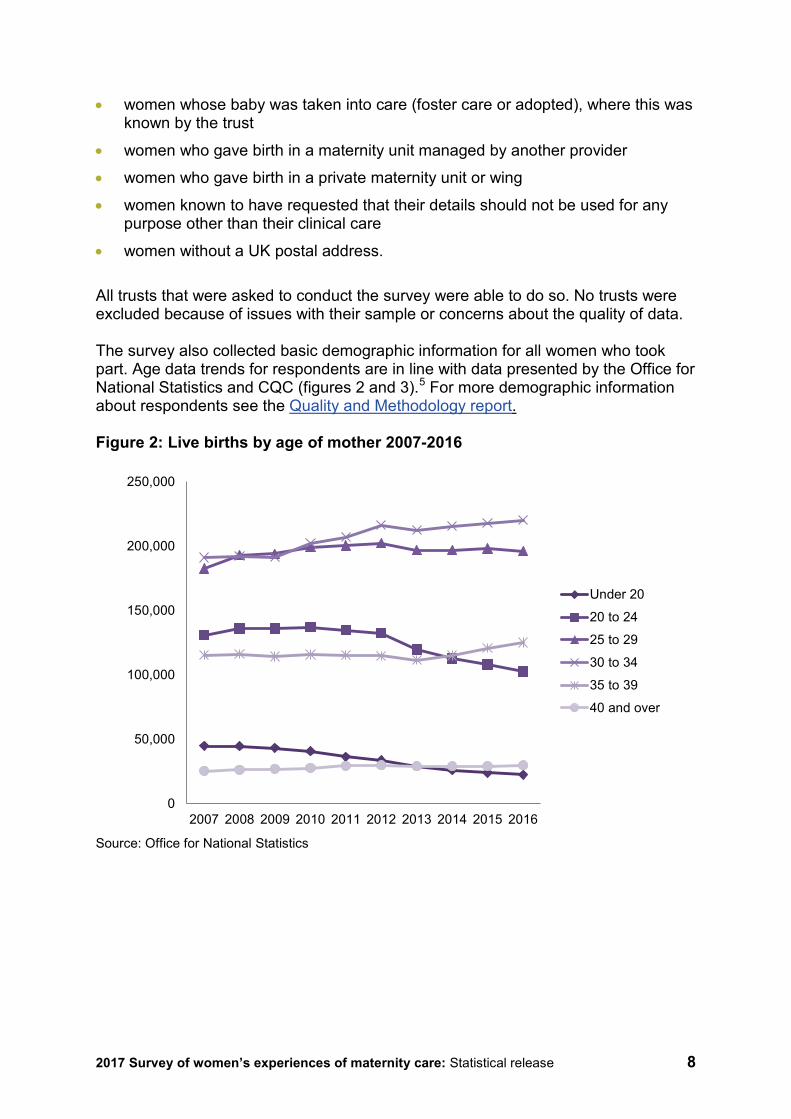
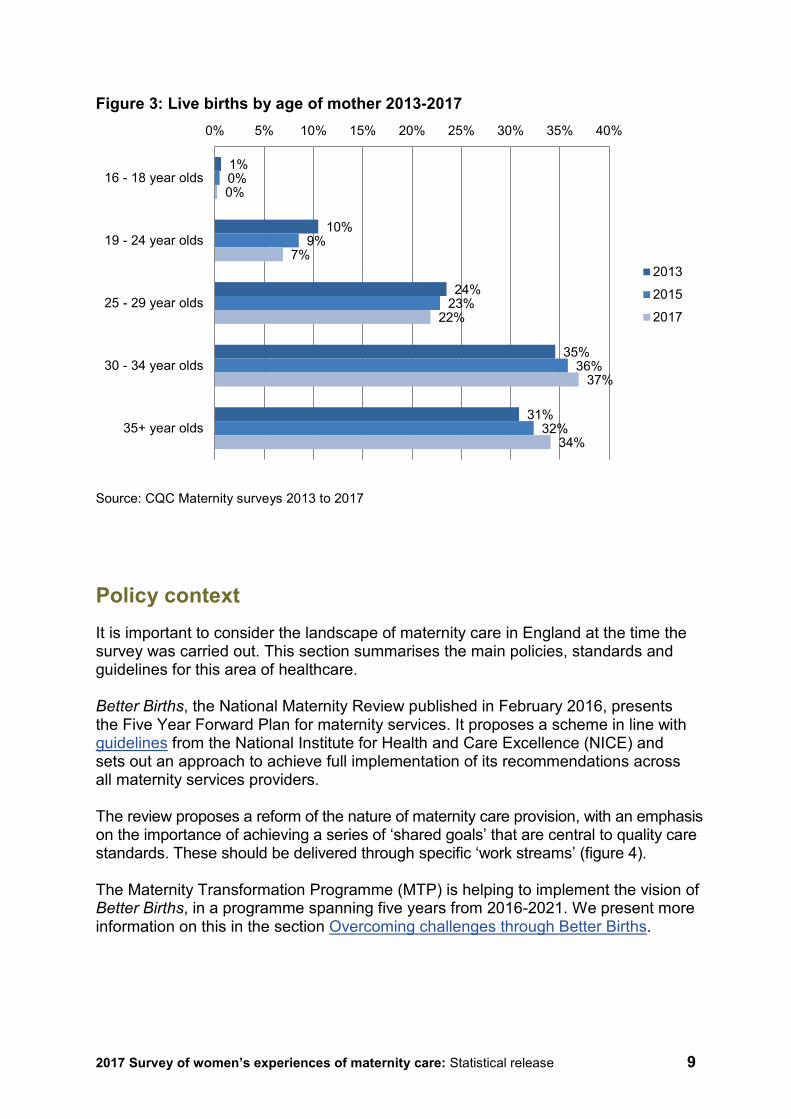
• women without a UK postal address. All trusts that were asked to conduct the survey were able to do so. No trusts were excluded because of issues with their sample or concerns about the quality of data. The survey also collected basic demographic information for all women who took part. Age data trends for respondents are in line with data presented by the Office for National Statistics and CQC (figures 2 and 3).5 For more demographic information about respondents see the Quality and Methodology report. Figure 2: Live births by age of mother 2007-2016
Source: Office for National Statistics
0
50,000
100,000
150,000
200,000
250,000
2007 2008 2009 2010 2011 2012 2013 2014 2015 2016
Under 20
20 to 24
25 to 29
30 to 34
35 to 39
40 and over
2017 Survey of women’s experiences of maternity care: Statistical release 9
Figure 3: Live births by age of mother 2013-2017
Source: CQC Maternity surveys 2013 to 2017
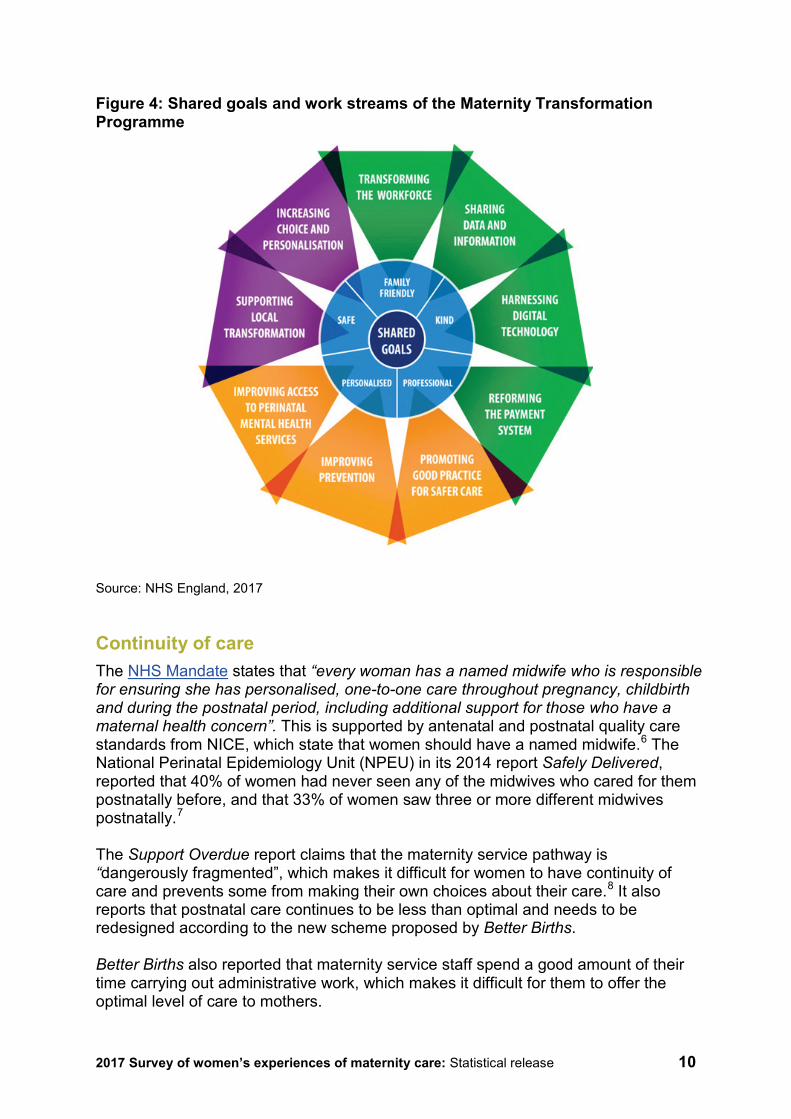
Policy context It is important to consider the landscape of maternity care in England at the time the survey was carried out. This section summarises the main policies, standards and guidelines for this area of healthcare. Better Births, the National Maternity Review published in February 2016, presents the Five Year Forward Plan for maternity services. It proposes a scheme in line with guidelines from the National Institute for Health and Care Excellence (NICE) and sets out an approach to achieve full implementation of its recommendations across all maternity services providers. The review proposes a reform of the nature of maternity care provision, with an emphasis on the importance of achieving a series of ‘shared goals’ that are central to quality care standards. These should be delivered through specific ‘work streams’ (figure 4). The Maternity Transformation Programme (MTP) is helping to implement the vision of Better Births, in a programme spanning five years from 2016-2021. We present more information on this in the section Overcoming challenges through Better Births.
1%
10%
24%
35%
31%
0%
9%
23%
36%
32%
0%
7%
22%
37%
34%
0% 5% 10% 15% 20% 25% 30% 35% 40%
16 - 18 year olds
19 - 24 year olds
25 - 29 year olds
30 - 34 year olds
35+ year olds
2013
2015
2017
2017 Survey of women’s experiences of maternity care: Statistical release 10
Figure 4: Shared goals and work streams of the Maternity Transformation Programme
Source: NHS England, 2017 Continuity of care The NHS Mandate states that “every woman has a named midwife who is responsible for ensuring she has personalised, one-to-one care throughout pregnancy, childbirth and during the postnatal period, including additional support for those who have a maternal health concern”. This is supported by antenatal and postnatal quality care standards from NICE, which state that women should have a named midwife.6 The National Perinatal Epidemiology Unit (NPEU) in its 2014 report Safely Delivered, reported that 40% of women had never seen any of the midwives who cared for them postnatally before, and that 33% of women saw three or more different midwives postnatally.7 The Support Overdue report claims that the maternity service pathway is “dangerously fragmented”, which makes it difficult for women to have continuity of care and prevents some from making their own choices about their care.8 It also reports that postnatal care continues to be less than optimal and needs to be redesigned according to the new scheme proposed by Better Births. Better Births also reported that maternity service staff spend a good amount of their time carrying out administrative work, which makes it difficult for them to offer the optimal level of care to mothers.
2017 Survey of women’s experiences of maternity care: Statistical release 11
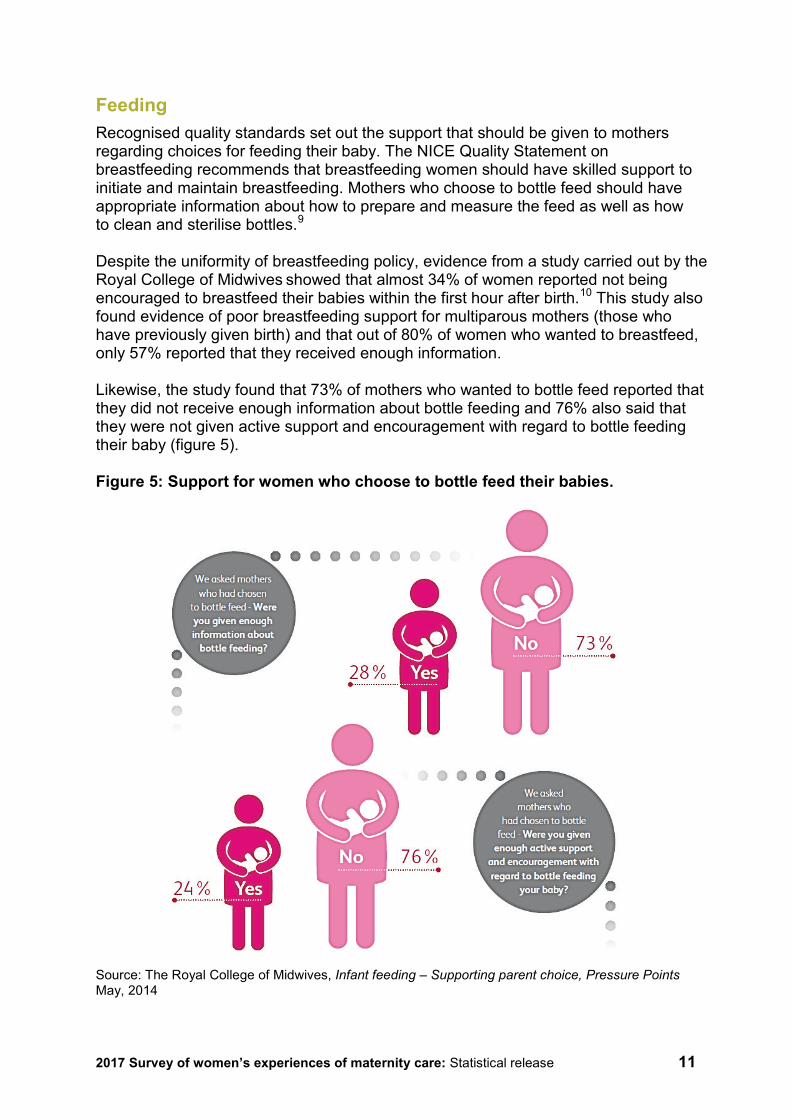
Feeding Recognised quality standards set out the support that should be given to mothers regarding choices for feeding their baby. The NICE Quality Statement on breastfeeding recommends that breastfeeding women should have skilled support to initiate and maintain breastfeeding. Mothers who choose to bottle feed should have appropriate information about how to prepare and measure the feed as well as how to clean and sterilise bottles.9 Despite the uniformity of breastfeeding policy, evidence from a study carried out by the Royal College of Midwives showed that almost 34% of women reported not being encouraged to breastfeed their babies within the first hour after birth.10 This study also found evidence of poor breastfeeding support for multiparous mothers (those who have previously given birth) and that out of 80% of women who wanted to breastfeed, only 57% reported that they received enough information. Likewise, the study found that 73% of mothers who wanted to bottle feed reported that they did not receive enough information about bottle feeding and 76% also said that they were not given active support and encouragement with regard to bottle feeding their baby (figure 5). Figure 5: Support for women who choose to bottle feed their babies.
Source: The Royal College of Midwives, Infant feeding – Supporting parent choice, Pressure Points May, 2014
2017 Survey of women’s experiences of maternity care: Statistical release 12
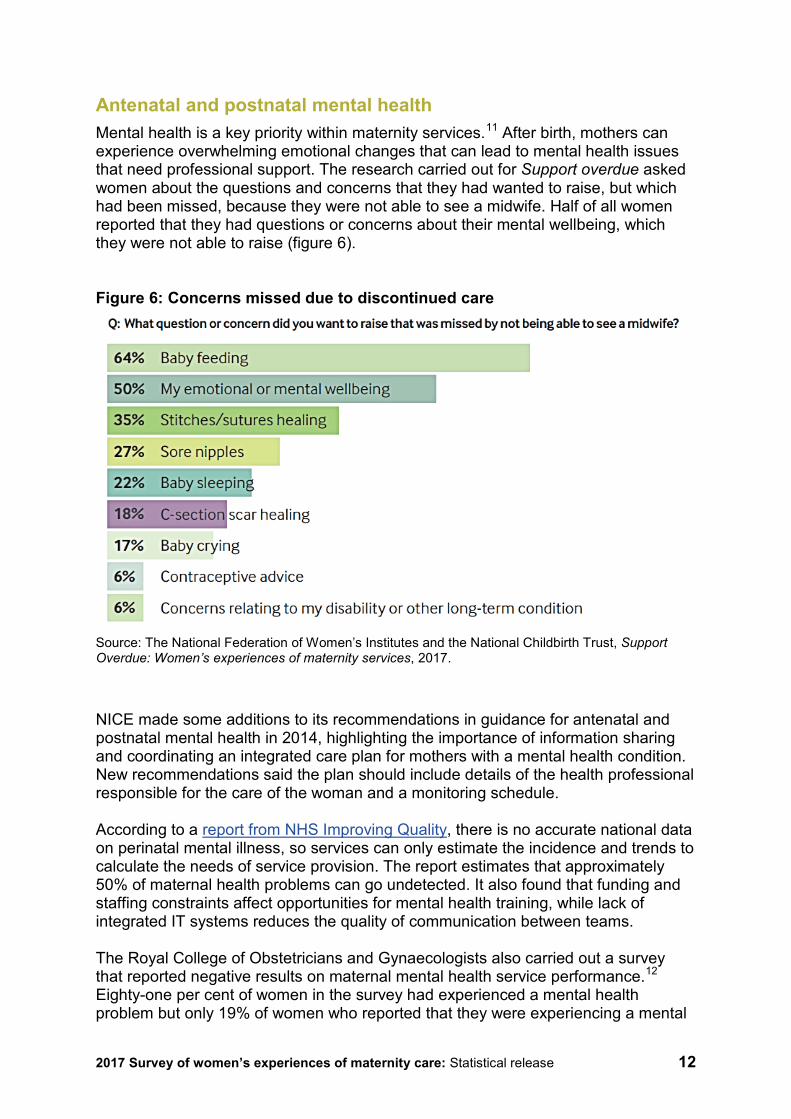
Antenatal and postnatal mental health Mental health is a key priority within maternity services.11 After birth, mothers can experience overwhelming emotional changes that can lead to mental health issues that need professional support. The research carried out for Support overdue asked women about the questions and concerns that they had wanted to raise, but which had been missed, because they were not able to see a midwife. Half of all women reported that they had questions or concerns about their mental wellbeing, which they were not able to raise (figure 6). Figure 6: Concerns missed due to discontinued care
Source: The National Federation of Women’s Institutes and the National Childbirth Trust, Support Overdue: Women’s experiences of maternity services, 2017.
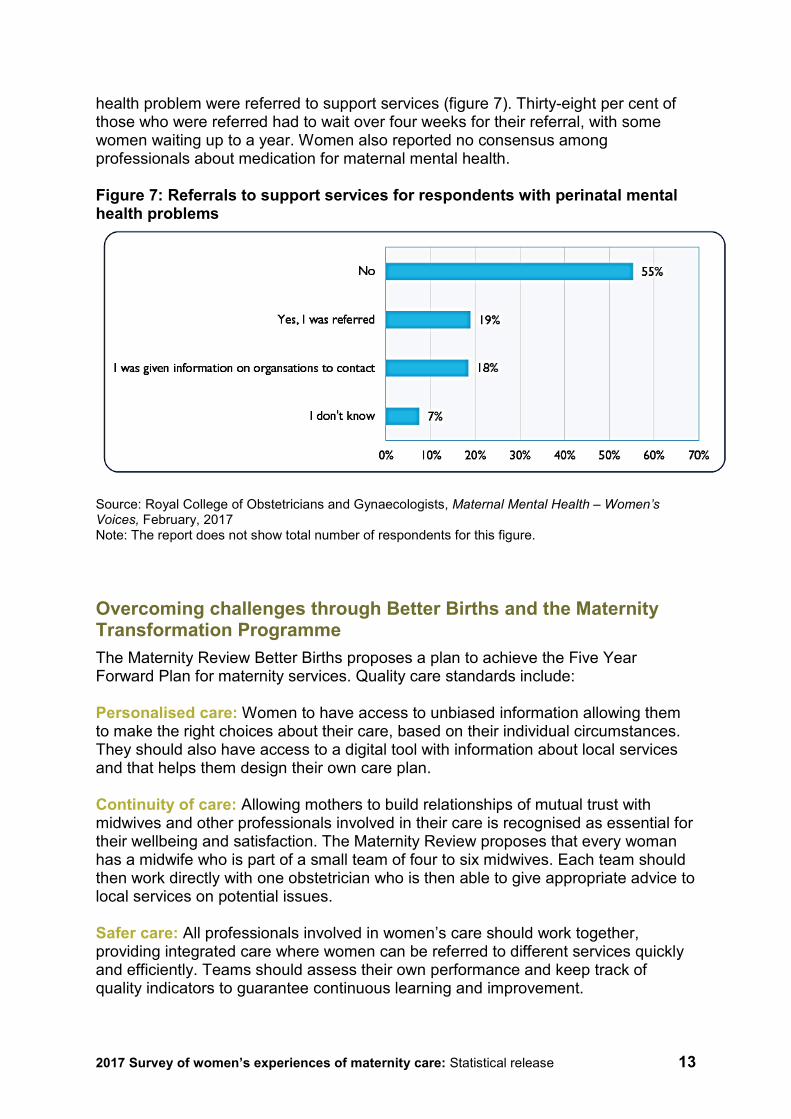
NICE made some additions to its recommendations in guidance for antenatal and postnatal mental health in 2014, highlighting the importance of information sharing and coordinating an integrated care plan for mothers with a mental health condition. New recommendations said the plan should include details of the health professional responsible for the care of the woman and a monitoring schedule. According to a report from NHS Improving Quality, there is no accurate national data on perinatal mental illness, so services can only estimate the incidence and trends to calculate the needs of service provision. The report estimates that approximately 50% of maternal health problems can go undetected. It also found that funding and staffing constraints affect opportunities for mental health training, while lack of integrated IT systems reduces the quality of communication between teams. The Royal College of Obstetricians and Gynaecologists also carried out a survey that reported negative results on maternal mental health service performance.12 Eighty-one per cent of women in the survey had experienced a mental health problem but only 19% of women who reported that they were experiencing a mental
2017 Survey of women’s experiences of maternity care: Statistical release 13
health problem were referred to support services (figure 7). Thirty-eight per cent of those who were referred had to wait over four weeks for their referral, with some women waiting up to a year. Women also reported no consensus among professionals about medication for maternal mental health. Figure 7: Referrals to support services for respondents with perinatal mental health problems
Source: Royal College of Obstetricians and Gynaecologists, Maternal Mental Health – Women’s Voices, February, 2017 Note: The report does not show total number of respondents for this figure. Overcoming challenges through Better Births and the Maternity Transformation Programme The Maternity Review Better Births proposes a plan to achieve the Five Year Forward Plan for maternity services. Quality care standards include: Personalised care: Women to have access to unbiased information allowing them to make the right choices about their care, based on their individual circumstances. They should also have access to a digital tool with information about local services and that helps them design their own care plan. Continuity of care: Allowing mothers to build relationships of mutual trust with midwives and other professionals involved in their care is recognised as essential for their wellbeing and satisfaction. The Maternity Review proposes that every woman has a midwife who is part of a small team of four to six midwives. Each team should then work directly with one obstetrician who is then able to give appropriate advice to local services on potential issues. Safer care: All professionals involved in women’s care should work together, providing integrated care where women can be referred to different services quickly and efficiently. Teams should assess their own performance and keep track of quality indicators to guarantee continuous learning and improvement.
2017 Survey of women’s experiences of maternity care: Statistical release 14
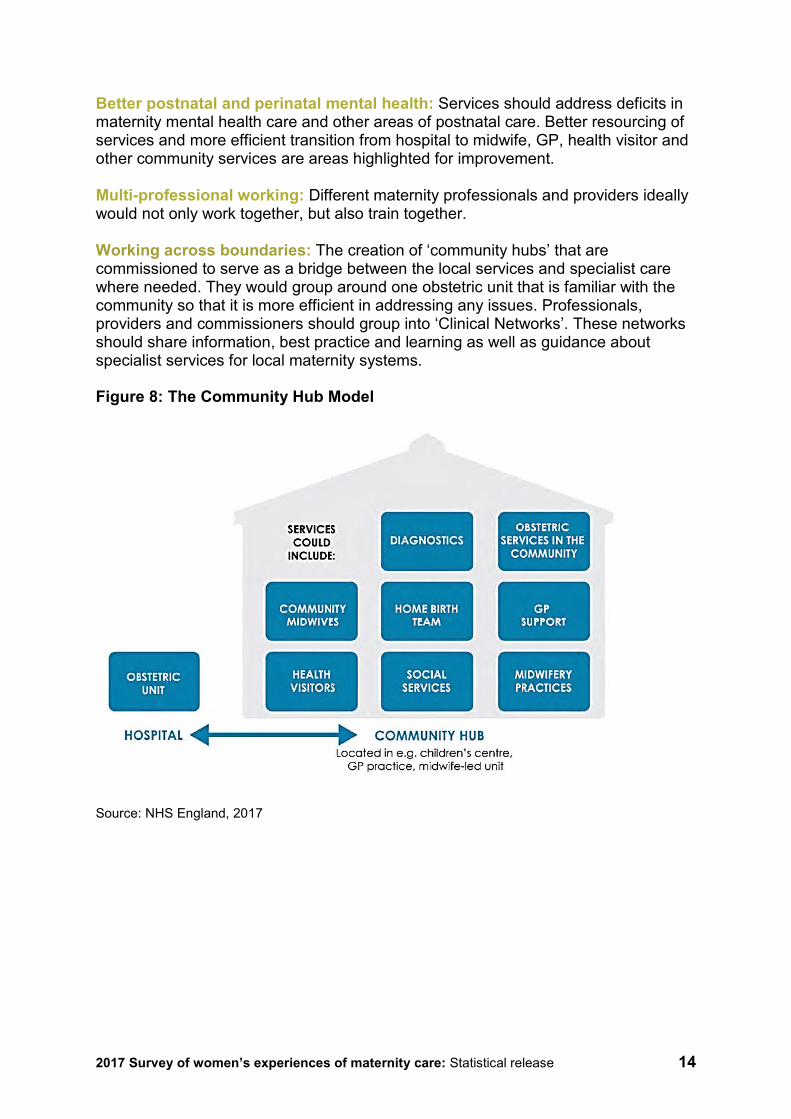
Better postnatal and perinatal mental health: Services should address deficits in maternity mental health care and other areas of postnatal care. Better resourcing of services and more efficient transition from hospital to midwife, GP, health visitor and other community services are areas highlighted for improvement. Multi-professional working: Different maternity professionals and providers ideally would not only work together, but also train together. Working across boundaries: The creation of ‘community hubs’ that are commissioned to serve as a bridge between the local services and specialist care where needed. They would group around one obstetric unit that is familiar with the community so that it is more efficient in addressing any issues. Professionals, providers and commissioners should group into ‘Clinical Networks’. These networks should share information, best practice and learning as well as guidance about specialist services for local maternity systems. Figure 8: The Community Hub Model
Source: NHS England, 2017
2017 Survey of women’s experiences of maternity care: Statistical release 15
Results from the survey This section presents the results for England across all questions in the 2017 survey. It is structured around the following sections from the questionnaire: 1. Dates and your baby 2. Care while you were pregnant (antenatal care) 3. Labour and the birth of your baby 4. Care in hospital after birth (postnatal care) 5. Feeding your baby 6. Care at home after the birth 7. Sociodemographic data The figures shown are the evaluative responses to a question. Responses such as ‘don't know’ or ‘can’t remember’ are not included in the percentages. We included these options in the set of responses to allow someone to respond to the question if they could not remember or did not have an opinion, to distinguish those reasons from all others and to avoid people making a ‘best guess’. Other non- evaluative responses such as ‘I did not see a midwife’ are also excluded. Please note that comparisons with previous survey results are only presented in the text when a change was statistically significant. Statistically significant differences are those where any change in the results is very unlikely to have occurred by chance. Very small significant differences are not always reported, but are available in the survey ‘Open Data’. We applied two weights to the survey results data: a trust weight to ensure that each trust contributes equally to the England average, and a population weight, to make sure that each trust’s results are representative of their own sample and do not over-represent groups such as older respondents. For more information see the Quality and Methodology report. Also included is analysis looking at the experiences of different groups of women using maternity services. The Equality Act 2010 requires that public bodies have due regard to the need to eliminate discrimination and to advance equality of opportunity and foster good relations between people who share certain protected characteristics and those who do not. The protected characteristics are: age, disability, gender reassignment, pregnancy and maternity, race, religion or belief, sex and sexual orientation. The Act provides an important legal framework, which should improve the experience of all patients using NHS services. To compare the experiences of different women, the analysis modelled the mean scores of different subgroups:
2017 Survey of women’s experiences of maternity care: Statistical release 16
• age group • religion • sexual orientation • ethnicity • long-term health conditions • parity • type of delivery • stirrups usage • named midwife status (inferred from responses to two questions: B8 for
antenatal care and F5 for postnatal care). The experiences of these different groups of women were analysed over a set of composite questions aligned with the NHS Patient Experience Framework. Mean scores were calculated for each subgroup and compared with the overall mean score. We present these findings throughout the report, and provide a full summary of results in the Subgroup Analysis section. Appendix F presents charts.
1. Dates and your baby
The reported occurrence of ‘single births’ (women giving birth to one baby at a time), ‘twin births’ and ‘triplets/quads or more’ births has remained the same since 2013. Ninety-nine per cent of women said they had single births, 1% had twin births and less than 1% reported that they had a ‘triplet/quads or more’ birth. The time of the day at which babies were born showed minimal variation between 2013 and 2017, with most births (27%) happening during the morning (6:01am to 12 noon). When women were asked how many weeks pregnant they were when they gave birth, results showed that the proportion of groups that gave birth before they were 37 weeks pregnant (7%) and after 37 weeks of pregnancy (93%) continues to be the same as in 2013 and 2015.
2. Care while you were pregnant (antenatal care)
Policy highlights the importance of women’s first contact with a healthcare professional after finding out they are pregnant as the moment in which they receive essential information for a healthy pregnancy. Information includes folic acid supplementation, food hygiene, lifestyle advice and all antenatal screenings.13 The survey asked respondents who was the first health professional they saw after thinking they were pregnant. Results show that women are still most likely to first see a GP or family doctor when they think they are pregnant (52%). However, GPs were significantly less likely to be the first contacted than they were in 2013 and 2015. There has been an increase in the proportion of women who now see a midwife first over this period.

2017 Survey of women’s experiences of maternity care: Statistical release 17
B1: Who was the first health professional you saw when you thought you were pregnant?
Number of respondents: 22,624 (2013), 19,653 (2015), 18,315 (2017)
Also, the week of pregnancy in which women first saw a health professional showed a significant change between 2013 and 2017, and 2015 and 2017. More women are seeing health professionals when they are seven to 12 weeks pregnant (48%) compared with 2015 (45%) and 2013 (43%). The proportion of women seeing a health professional when they are six weeks pregnant or less has decreased by five percentage points since 2013.
B2: Roughly how many weeks pregnant were you when you first saw this health professional about your pregnancy care?
Number of respondents: 22,332 (2013), 19,347 (2015), 18,013 (2017) Note: figures exclude respondents who stated 'don't know/can't remember'
0%
10%
20%
30%
40%
50%
60%
70%
2013 2015 2017
Response percentage
Year
GP/ familydoctor
Other
Midwife
0%
10%
20%
30%
40%
50%
60%
2013 2015 2017
Response percentage
Year
0 to 6 weeks pregnant
7 to 12 weeks pregnant
13 or more weeks pregnant

2017 Survey of women’s experiences of maternity care: Statistical release 18
Women have the first appointment with a health professional and then should have a further ‘booking appointment’ to receive their pregnancy notes, ideally by 10 weeks of pregnancy, as recommended by NICE guidelines for antenatal care. Results show that most women continue to have their booking appointment when they are eight or nine weeks pregnant (44%), a significant increase from 42% in 2013 and 41% in 2015.
B3: Roughly how many weeks pregnant were you when you had your ‘booking’ appointment?
Number of respondents: 21,301 (2013), 18,404 (2015), 17,073 (2017). Note: figures exclude respondents who stated 'don't know/can't remember’ Choice As discussed, choice is a key aspect of personalised care in maternity services. In the survey, women were asked if they were given choices about where to have their baby, and whether they were offered a full range of options including: choice of hospital, midwife-led unit or birth centre, consultant-led unit or home. Sixty-one per cent said they were offered a choice of hospitals. The proportion of women who were given the choice of giving birth in a midwife-led unit or birth centre significantly increased from 35% in 2013 to 42% in 2017. Thirty-eight per cent of women said that they were given the choice to give birth at home. The likelihood of women not being offered any choices has significantly decreased from 18% (2013) to 15% (2017).
18%
42%
22%
11%
8%
18%
41%
22%
11%
9%
17%
44%
21%
10%
8%
0% 10% 20% 30% 40% 50%
When I was 0 to 7 weekspregnant
When I was 8 or 9 weekspregnant
When I was 10 or 11 weekspregnant
When I was 12 weeks pregnant
When I was 13 or more weekspregnant
Response percentage
2013 2015 2017

2017 Survey of women’s experiences of maternity care: Statistical release 19
B4: Were you offered any of the following choices about where to have your baby?
Number of respondents: 19,692 (2013), 17,052 (2015), 15,858 (2017). Note: figures exclude respondents who stated 'don't know' or 'I had no choices due to medical reasons'. This is a multiple response question, so percentages may not add up to 100.
Respondents were asked if they got enough information from either a midwife or a doctor to help them decide where to have their babies. The group of women who answered ‘Yes, definitely’ (59%) has significantly increased since both 2013 (55%) and 2015 (57%). Following the same trend, the likelihood of women perceiving that they did not receive enough information significantly decreased between 2013 (17%) and 2017 (13%).
60%
35%
15%
38%
18%
60%
41%
17%
38%
16%
61%
42%
18%
38%
15%
0% 20% 40% 60% 80%
I was offered a choice of hospitals
I was offered a choice of giving birth ina midwife led unit or birth centre
I was offered a choice of giving birth ina consultant led unit
I was offered a choice of giving birth athome
I was not offered any choices
Response percentage
2013 2015 2017
2017 Survey of women’s experiences of maternity care: Statistical release 20
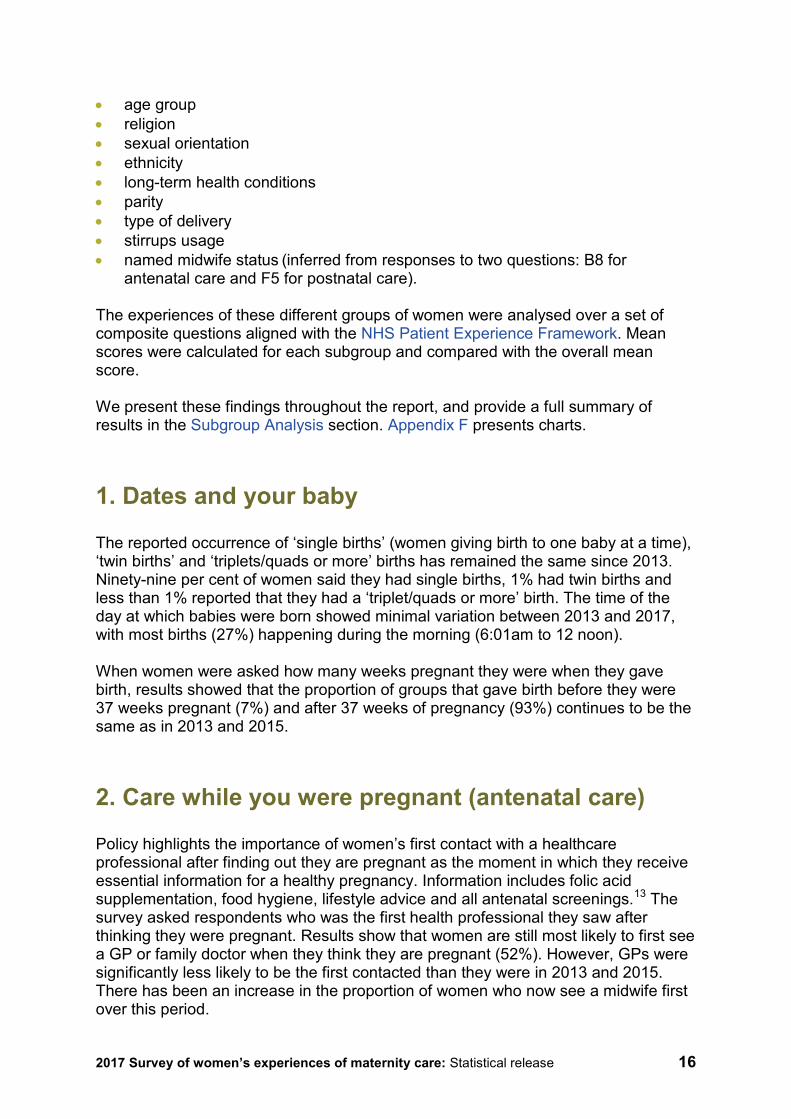
B6: Did you get enough information from either a midwife or doctor to help you decide where to have your baby?
Number of respondents: 17,531 (2013), 15,426 (2015), 14,516 (2017). Note: figures exclude respondents who stated 'don't know/can't remember' or 'No, but I did not need this information'.
There was also a significant change for the question asking women if they had been given a choice about where to have their antenatal checks. Between 2013 and 2017, the group of women that responded ‘Yes’ increased from 29% (2013) to 31% (2017). However, a large proportion of women (69%) said they were not offered a choice. Continuity of care NICE antenatal care recommendations state that “Pregnant women are cared for by a named midwife throughout their pregnancy”. A named midwife is “a named registered midwife who is responsible for providing all or most of a woman’s antenatal and postnatal care and coordinate care should they not be available”. Policy in the National Maternity Review recommends continuity of care as it allows women to develop a relationship of trust and confidence with their midwife.14 As part of measuring the continuity of care, women were asked if they saw the same midwife every time for their antenatal check-ups. Thirty-eight per cent of women said they had seen the same midwife during their antenatal check-ups, a significant increase from 34% in 2013, and 36% in 2015. Sixty-one per cent of women said they did not have the same midwife for every antenatal appointment.
0%10%20%30%40%50%60%70%
2013 2015 2017
Response percentage
Year
Yes, definitely
Yes, to some extent
No
2017 Survey of women’s experiences of maternity care: Statistical release 21
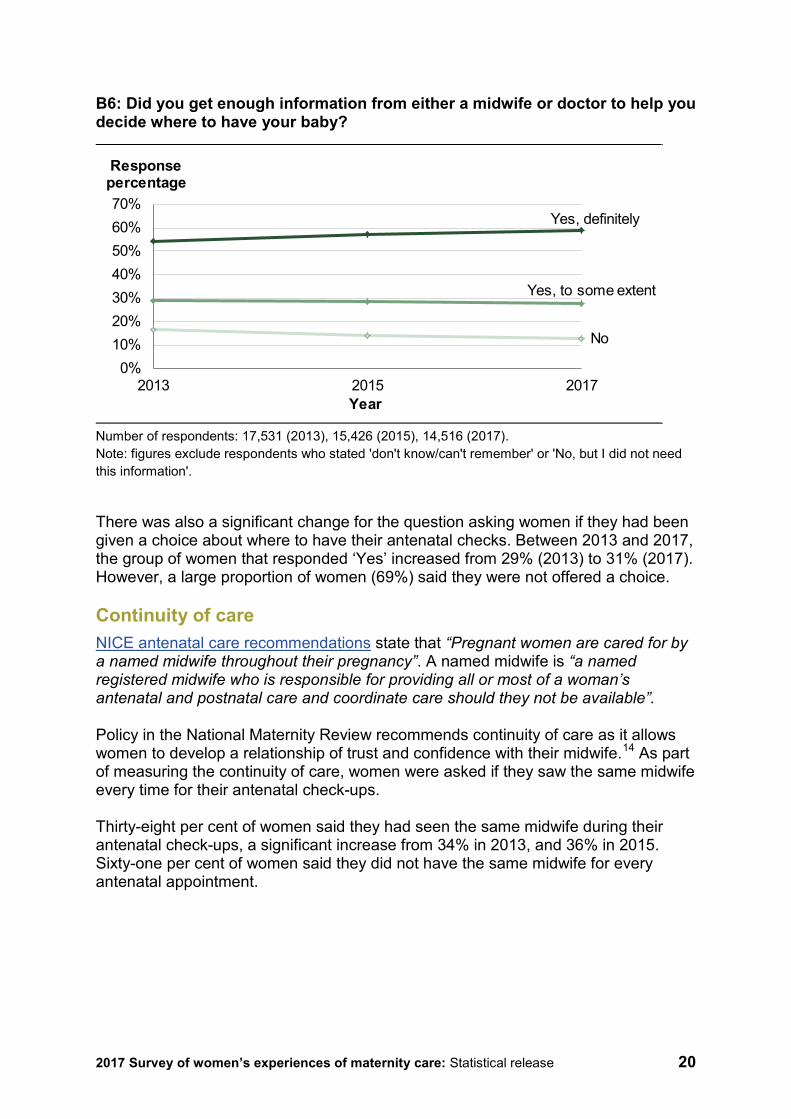
B8: If you saw a midwife for your antenatal check-ups, did you see the same one every time?
Number of respondents: 22,045 (2013), 19,216 (2015), 17,970 (2017) Note: figures exclude respondents who stated 'don't know/can't remember' or 'I did not see a midwife' or 'I only saw a midwife once'. The Maternity Review also highlights the importance of integrated care and different professionals working together efficiently. If a woman does not see the same professional every time, she needs to be confident that the person caring for her will be fully aware of her medical history and circumstances. When women were asked whether midwives appeared to be aware of their medical history during their antenatal checks-ups, half of all women responded ‘Yes, always’. Thirty-six per cent of women said ‘Yes, sometimes’ and 14% reported that midwives did not seem to be aware of their medical history. Involvement Better Births, Maternity Matters and NICE guidance state that women should be involved in their care plan and its development, therefore professionals need to listen to them and answer any questions.15, 16 When asked whether they were given enough time to ask questions or discuss their pregnancy during antenatal check-ups, 77% of women responded ‘Yes, always’, a significant increase since 2013 and 2015; while only 3% reported not being given enough time. A similar trend was reported when women were asked if their antenatal midwives listened to them, with 82% of women choosing ‘Yes, always’ and only 1% of them feeling that they were not listened to.
34%
1%
28%
36%
36%
1%
28%
35%
38%
1%
27%
34%
0% 10% 20% 30% 40% 50%
Yes
Yes, but would have preferred not to
No, but I wanted to
No, but I did not mind
Response percentage
2013 2015 2017
2017 Survey of women’s experiences of maternity care: Statistical release 22
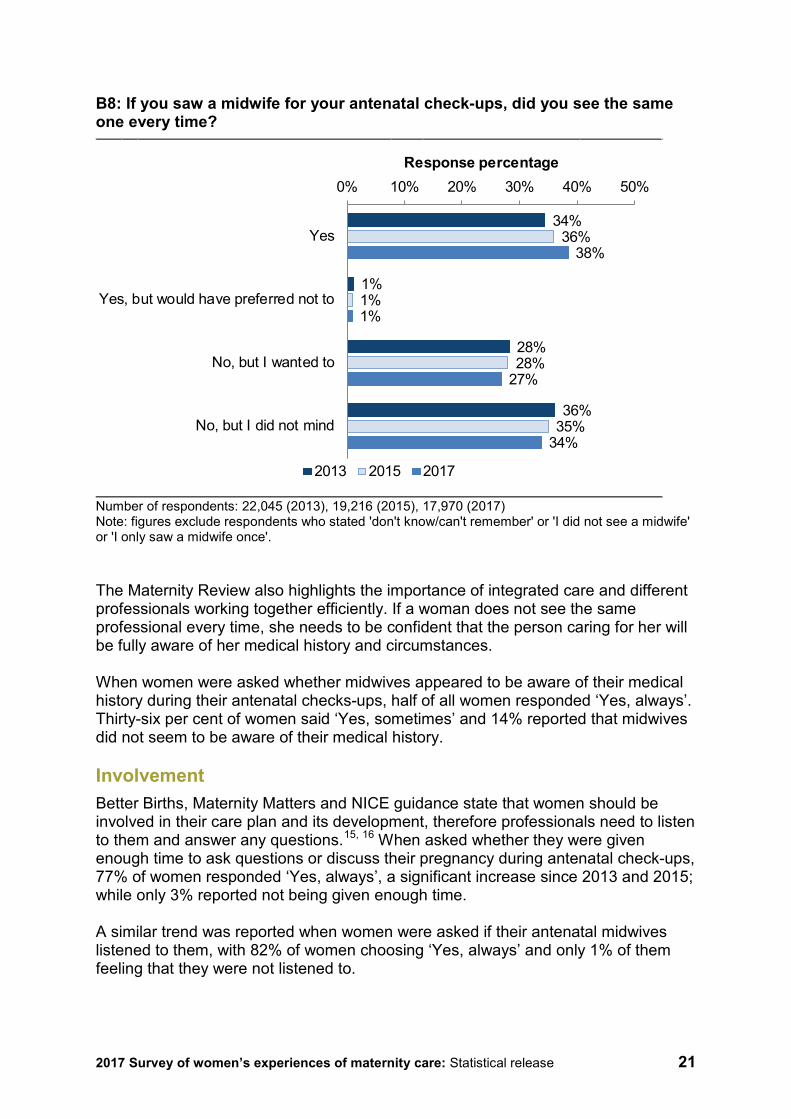
Maternity policy recommends that healthcare professionals should ask women how they are feeling emotionally throughout all stages of their pregnancy and monitor if they show any symptoms of a mental health condition.17 For antenatal care, results show that 64% of women were ‘definitely’ asked how they were feeling emotionally; while 26% thought they were asked ‘to some extent’. Although showing a significant decrease of three percentage points since 2015, 10% of respondents still reported not being asked about their emotions at all during their antenatal stage.
B12: During your antenatal check-ups, did a midwife ask you how you were feeling emotionally?
Number of respondents: 19,078 (2015), 17,980 (2017) Note: figures exclude respondents who stated 'don't know/can't remember'.
In regard to contacting midwives during the antenatal period, most women (97%) had a telephone number to contact a midwife or midwifery team, and 74% were always given the help they needed when they contacted a midwife for help. Eighty-eight per cent of women reported always being spoken to in a way they could understand during their antenatal care. In addition, the majority of women (80%) thought they were involved enough in decisions about their own care, up from 77% in 2013 and 2015.
3. Your labour and the birth of your baby
The start of labour is an exciting but stressful moment when mothers especially need appropriate advice and support.18 This survey found that 87% of women thought they received appropriate advice and support at the very start of their labour (when they first contacted a midwife or the hospital), a significant increase from 85% in 2013.
57%
30%
13%
64%
26%
10%
0% 10% 20% 30% 40% 50% 60% 70%
Yes, definitely
Yes, to some extent
No
Response percentage
2015 2017
2017 Survey of women’s experiences of maternity care: Statistical release 23
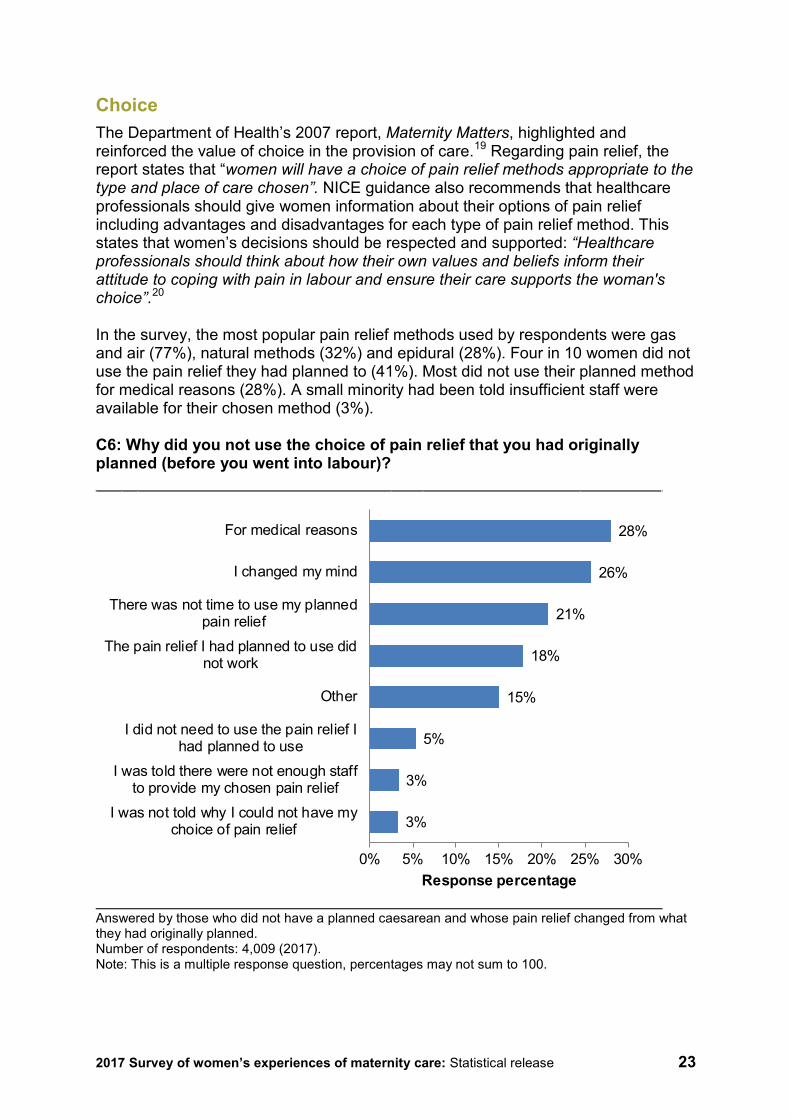
Choice The Department of Health’s 2007 report, Maternity Matters, highlighted and reinforced the value of choice in the provision of care.19 Regarding pain relief, the report states that “women will have a choice of pain relief methods appropriate to the type and place of care chosen”. NICE guidance also recommends that healthcare professionals should give women information about their options of pain relief including advantages and disadvantages for each type of pain relief method. This states that women’s decisions should be respected and supported: “Healthcare professionals should think about how their own values and beliefs inform their attitude to coping with pain in labour and ensure their care supports the woman's choice”.20 In the survey, the most popular pain relief methods used by respondents were gas and air (77%), natural methods (32%) and epidural (28%). Four in 10 women did not use the pain relief they had planned to (41%). Most did not use their planned method for medical reasons (28%). A small minority had been told insufficient staff were available for their chosen method (3%). C6: Why did you not use the choice of pain relief that you had originally planned (before you went into labour)?
Answered by those who did not have a planned caesarean and whose pain relief changed from what they had originally planned. Number of respondents: 4,009 (2017). Note: This is a multiple response question, percentages may not sum to 100.
3%
3%
5%
15%
18%
21%
26%
28%
0% 5% 10% 15% 20% 25% 30%
I was not told why I could not have mychoice of pain relief
I was told there were not enough staffto provide my chosen pain relief
I did not need to use the pain relief Ihad planned to use
Other
The pain relief I had planned to use didnot work
There was not time to use my plannedpain relief
I changed my mind
For medical reasons
Response percentage
2017 Survey of women’s experiences of maternity care: Statistical release 24
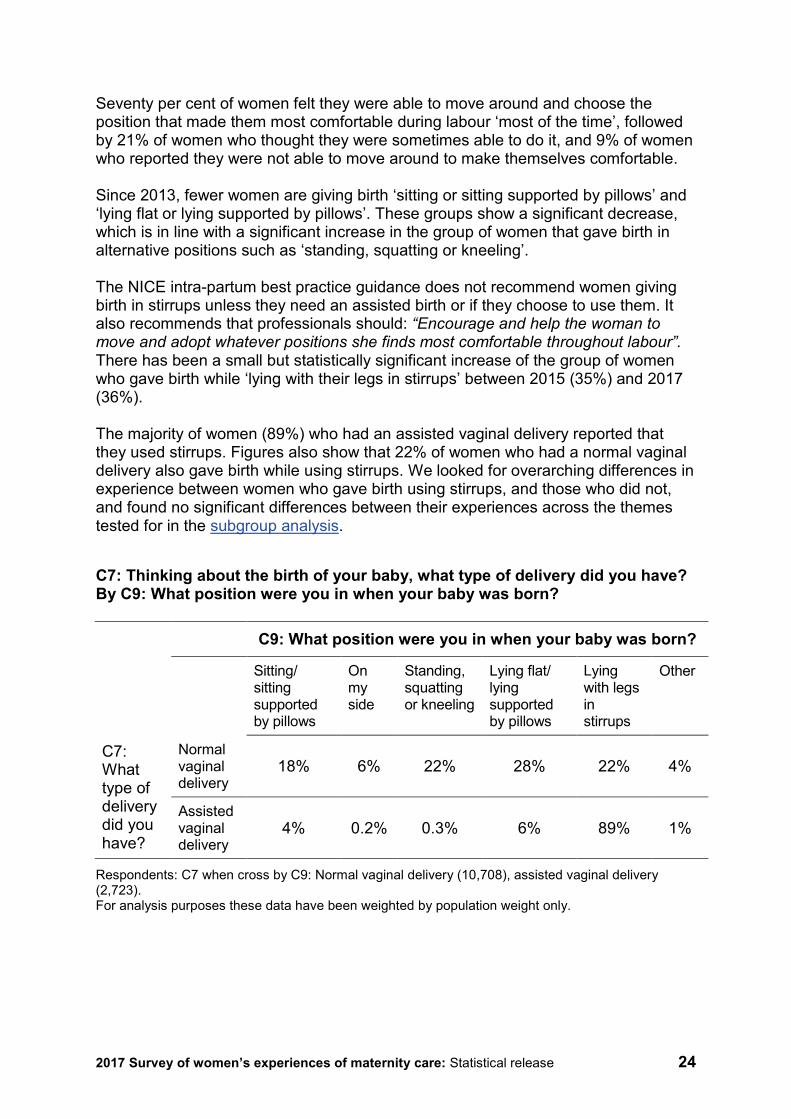
Seventy per cent of women felt they were able to move around and choose the position that made them most comfortable during labour ‘most of the time’, followed by 21% of women who thought they were sometimes able to do it, and 9% of women who reported they were not able to move around to make themselves comfortable. Since 2013, fewer women are giving birth ‘sitting or sitting supported by pillows’ and ‘lying flat or lying supported by pillows’. These groups show a significant decrease, which is in line with a significant increase in the group of women that gave birth in alternative positions such as ‘standing, squatting or kneeling’. The NICE intra-partum best practice guidance does not recommend women giving birth in stirrups unless they need an assisted birth or if they choose to use them. It also recommends that professionals should: “Encourage and help the woman to move and adopt whatever positions she finds most comfortable throughout labour”. There has been a small but statistically significant increase of the group of women who gave birth while ‘lying with their legs in stirrups’ between 2015 (35%) and 2017 (36%). The majority of women (89%) who had an assisted vaginal delivery reported that they used stirrups. Figures also show that 22% of women who had a normal vaginal delivery also gave birth while using stirrups. We looked for overarching differences in experience between women who gave birth using stirrups, and those who did not, and found no significant differences between their experiences across the themes tested for in the subgroup analysis.
C7: Thinking about the birth of your baby, what type of delivery did you have? By C9: What position were you in when your baby was born? C9: What position were you in when your baby was born?
Sitting/ sitting supported by pillows
On my side
Standing, squatting or kneeling
Lying flat/ lying supported by pillows
Lying with legs in stirrups
Other
C7: What type of delivery did you have?
Normal vaginal delivery
18% 6% 22% 28% 22% 4%
Assisted vaginal delivery
4% 0.2% 0.3% 6% 89% 1%
Respondents: C7 when cross by C9: Normal vaginal delivery (10,708), assisted vaginal delivery (2,723). For analysis purposes these data have been weighted by population weight only.
2017 Survey of women’s experiences of maternity care: Statistical release 25
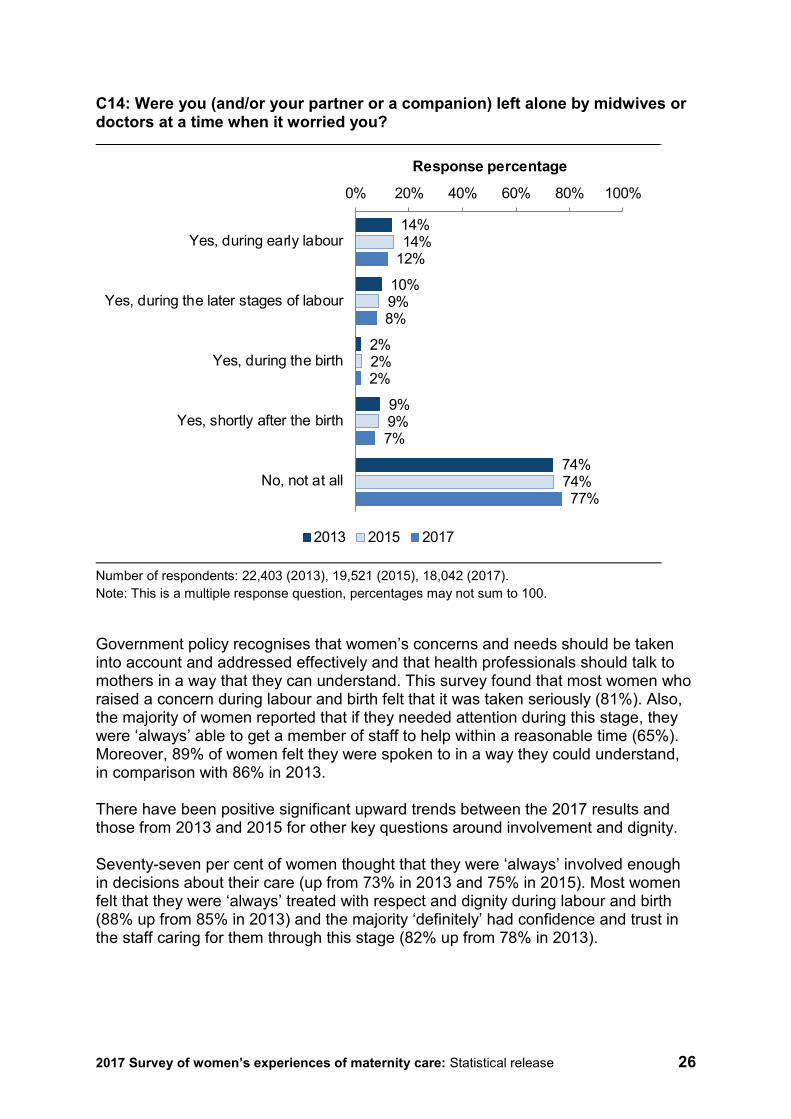
The subgroup analysis also showed that women who had an emergency caesarean delivery reported poorer involvement in their care. For more details see subgroup analysis charts in Appendix F. Continuity of care NICE guidance for maternity care supports and recommends continuity in the care provided by midwives.21 To monitor the practice of this policy, this survey asked women if any midwives who cared for them during labour and birth had been involved in their antenatal care. Only a small group of women reported that their midwife had also been involved in their antenatal care (15%). Involvement and dignity The Department of Health’s Maternity Matters states that involvement and dignity are central values of good quality care. This survey found statistically significant improvements in regard to women’s involvement and dignity during labour and birth. Women are now more likely to have skin-to-skin contact shortly after the birth of their baby, with results showing a significant increase from 89% in 2013 and 90% in 2015 to 92% in 2017. Also, more women thought their partner or companion was involved in their care during labour and birth as much as they wanted (96%). Similarly, results showed that significantly more women reported that all the staff treating and examining them introduced themselves (86%) compared with previous surveys (82% in 2013 and 83% in 2015). Another relevant question designed to assess the quality of women’s care is whether they (and/or their partner or companion) were left alone by midwives or doctors at a time when it worried them. Seventy-seven per cent of women reported that they had not been left alone when it worried them, a significant increase from 74% in 2013 and 2015. Results show that women are more likely to report being worried about being left alone during early labour (12%) followed by later stages of labour (8%) and shortly after the birth (7%). However, all these groups have significantly decreased since both the 2013 and 2015 surveys.
2017 Survey of women’s experiences of maternity care: Statistical release 26
C14: Were you (and/or your partner or a companion) left alone by midwives or doctors at a time when it worried you?
Number of respondents: 22,403 (2013), 19,521 (2015), 18,042 (2017). Note: This is a multiple response question, percentages may not sum to 100.
Government policy recognises that women’s concerns and needs should be taken into account and addressed effectively and that health professionals should talk to mothers in a way that they can understand. This survey found that most women who raised a concern during labour and birth felt that it was taken seriously (81%). Also, the majority of women reported that if they needed attention during this stage, they were ‘always’ able to get a member of staff to help within a reasonable time (65%). Moreover, 89% of women felt they were spoken to in a way they could understand, in comparison with 86% in 2013. There have been positive significant upward trends between the 2017 results and those from 2013 and 2015 for other key questions around involvement and dignity. Seventy-seven per cent of women thought that they were ‘always’ involved enough in decisions about their care (up from 73% in 2013 and 75% in 2015). Most women felt that they were ‘always’ treated with respect and dignity during labour and birth (88% up from 85% in 2013) and the majority ‘definitely’ had confidence and trust in the staff caring for them through this stage (82% up from 78% in 2013).
14%
10%
2%
9%
74%
14%
9%
2%
9%
74%
12%
8%
2%
7%
77%
0% 20% 40% 60% 80% 100%
Yes, during early labour
Yes, during the later stages of labour
Yes, during the birth
Yes, shortly after the birth
No, not at all
Response percentage
2013 2015 2017
2017 Survey of women’s experiences of maternity care: Statistical release 27
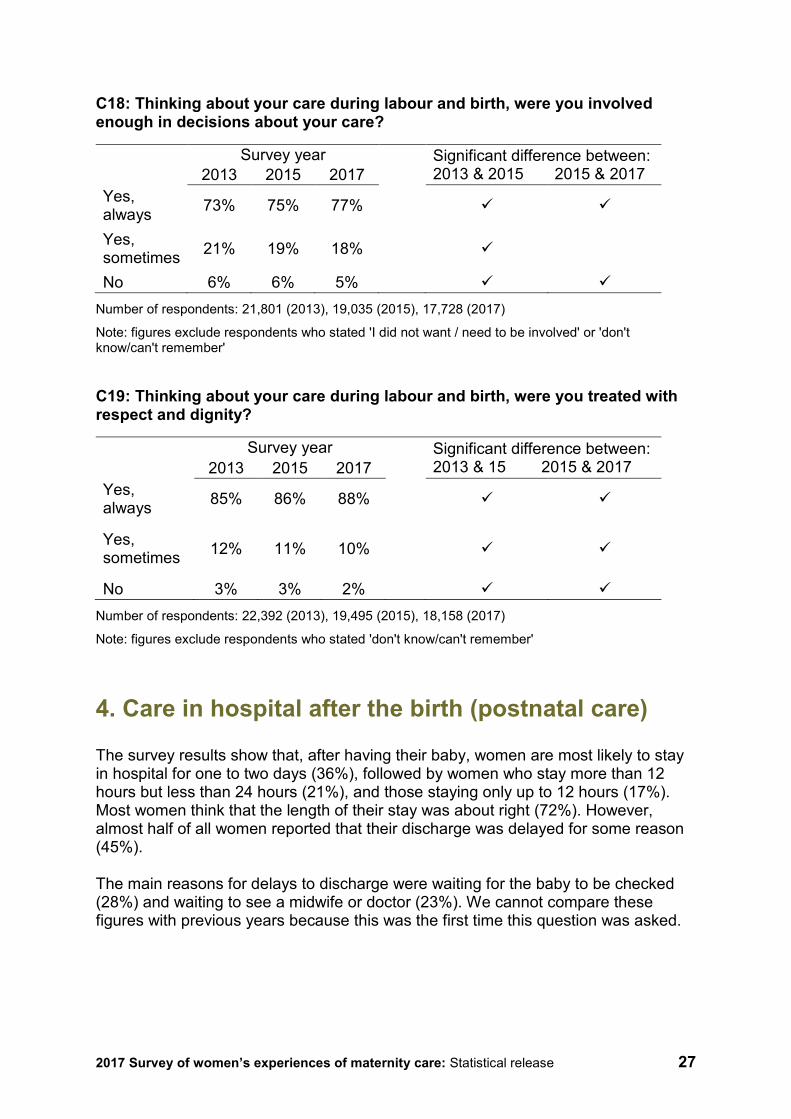
C18: Thinking about your care during labour and birth, were you involved enough in decisions about your care?
Survey year Significant difference between: 2013 & 2015 2015 & 2017 2013 2015 2017
Yes, always 73% 75% 77%
Yes, sometimes 21% 19% 18%
No 6% 6% 5%
Number of respondents: 21,801 (2013), 19,035 (2015), 17,728 (2017)
Note: figures exclude respondents who stated 'I did not want / need to be involved' or 'don't know/can't remember'
C19: Thinking about your care during labour and birth, were you treated with respect and dignity?
Survey year Significant difference between: 2013 & 15 2015 & 2017 2013 2015 2017
Yes, always 85% 86% 88%
Yes, sometimes 12% 11% 10%
No 3% 3% 2%
Number of respondents: 22,392 (2013), 19,495 (2015), 18,158 (2017)
Note: figures exclude respondents who stated 'don't know/can't remember'
4. Care in hospital after the birth (postnatal care)
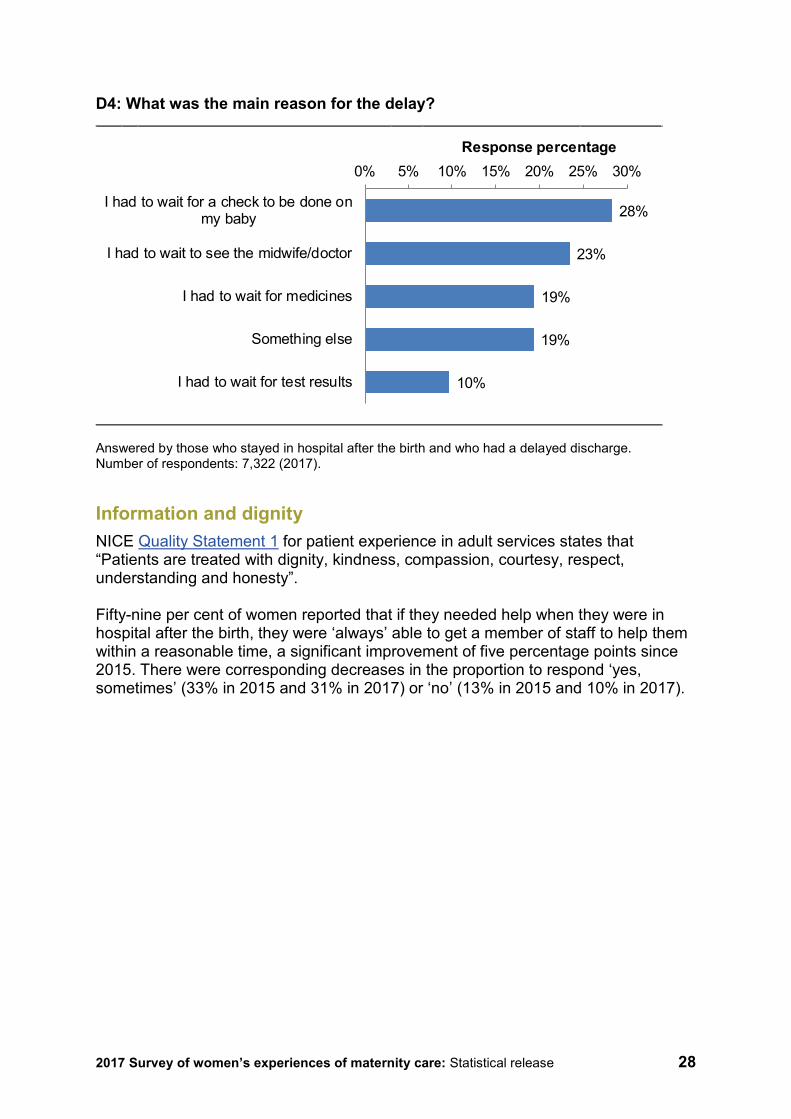
The survey results show that, after having their baby, women are most likely to stay in hospital for one to two days (36%), followed by women who stay more than 12 hours but less than 24 hours (21%), and those staying only up to 12 hours (17%). Most women think that the length of their stay was about right (72%). However, almost half of all women reported that their discharge was delayed for some reason (45%). The main reasons for delays to discharge were waiting for the baby to be checked (28%) and waiting to see a midwife or doctor (23%). We cannot compare these figures with previous years because this was the first time this question was asked.
2017 Survey of women’s experiences of maternity care: Statistical release 28
D4: What was the main reason for the delay?
Answered by those who stayed in hospital after the birth and who had a delayed discharge. Number of respondents: 7,322 (2017).
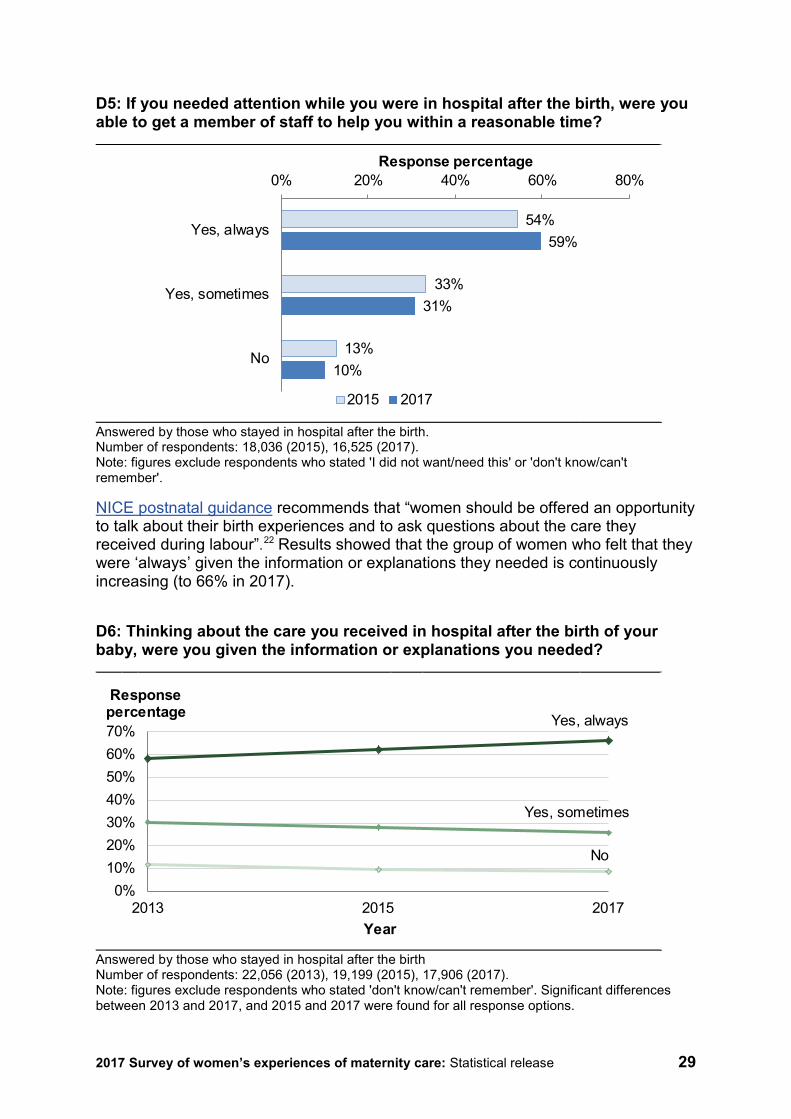
Information and dignity NICE Quality Statement 1 for patient experience in adult services states that “Patients are treated with dignity, kindness, compassion, courtesy, respect, understanding and honesty”. Fifty-nine per cent of women reported that if they needed help when they were in hospital after the birth, they were ‘always’ able to get a member of staff to help them within a reasonable time, a significant improvement of five percentage points since 2015. There were corresponding decreases in the proportion to respond ‘yes, sometimes’ (33% in 2015 and 31% in 2017) or ‘no’ (13% in 2015 and 10% in 2017).
28%
23%
19%
19%
10%
I had to wait for a check to be done onmy baby
I had to wait to see the midwife/doctor
I had to wait for medicines
Something else
I had to wait for test results
0% 5% 10% 15% 20% 25% 30%Response percentage
2017 Survey of women’s experiences of maternity care: Statistical release 29
D5: If you needed attention while you were in hospital after the birth, were you able to get a member of staff to help you within a reasonable time?
Answered by those who stayed in hospital after the birth. Number of respondents: 18,036 (2015), 16,525 (2017). Note: figures exclude respondents who stated 'I did not want/need this' or 'don't know/can't remember'.
NICE postnatal guidance recommends that “women should be offered an opportunity to talk about their birth experiences and to ask questions about the care they received during labour”.22 Results showed that the group of women who felt that they were ‘always’ given the information or explanations they needed is continuously increasing (to 66% in 2017).
D6: Thinking about the care you received in hospital after the birth of your baby, were you given the information or explanations you needed?
Answered by those who stayed in hospital after the birth Number of respondents: 22,056 (2013), 19,199 (2015), 17,906 (2017). Note: figures exclude respondents who stated 'don't know/can't remember'. Significant differences between 2013 and 2017, and 2015 and 2017 were found for all response options.
54%
33%
13%
59%
31%
10%
0% 20% 40% 60% 80%
Yes, always
Yes, sometimes
No
Response percentage
2015 2017
0%10%20%30%40%50%60%70%
2013 2015 2017
Response percentage
Year
Yes, always
Yes, sometimes
No
2017 Survey of women’s experiences of maternity care: Statistical release 30
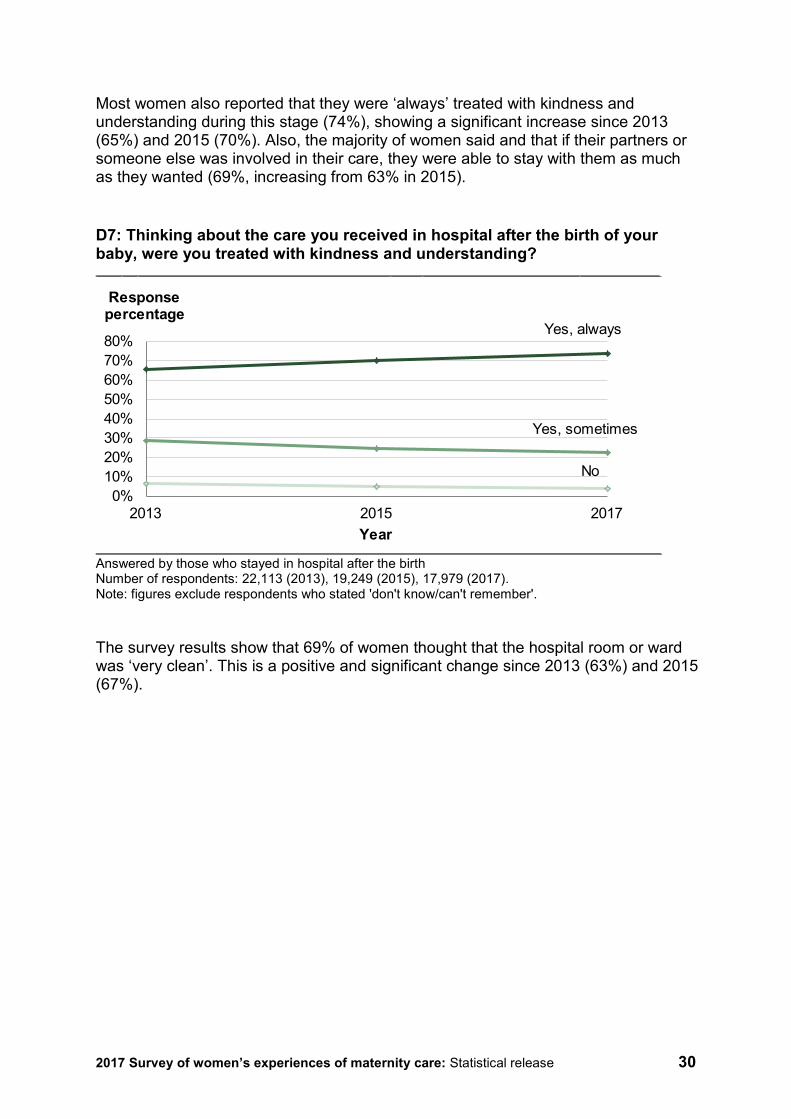
Most women also reported that they were ‘always’ treated with kindness and understanding during this stage (74%), showing a significant increase since 2013 (65%) and 2015 (70%). Also, the majority of women said and that if their partners or someone else was involved in their care, they were able to stay with them as much as they wanted (69%, increasing from 63% in 2015). D7: Thinking about the care you received in hospital after the birth of your baby, were you treated with kindness and understanding?
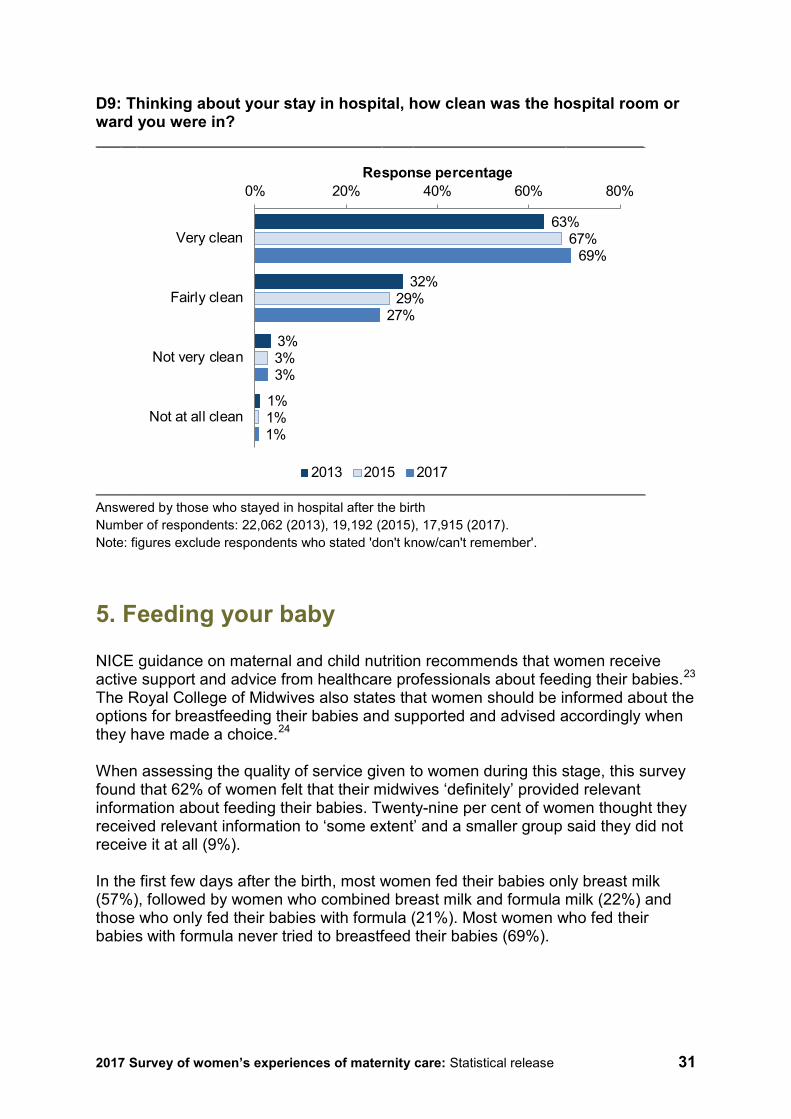
Answered by those who stayed in hospital after the birth Number of respondents: 22,113 (2013), 19,249 (2015), 17,979 (2017). Note: figures exclude respondents who stated 'don't know/can't remember'. The survey results show that 69% of women thought that the hospital room or ward was ‘very clean’. This is a positive and significant change since 2013 (63%) and 2015 (67%).
0%10%20%30%40%50%60%70%80%
2013 2015 2017
Response percentage
Year
Yes, always
Yes, sometimes
No
2017 Survey of women’s experiences of maternity care: Statistical release 31
D9: Thinking about your stay in hospital, how clean was the hospital room or ward you were in?
Answered by those who stayed in hospital after the birth Number of respondents: 22,062 (2013), 19,192 (2015), 17,915 (2017). Note: figures exclude respondents who stated 'don't know/can't remember'.
5. Feeding your baby
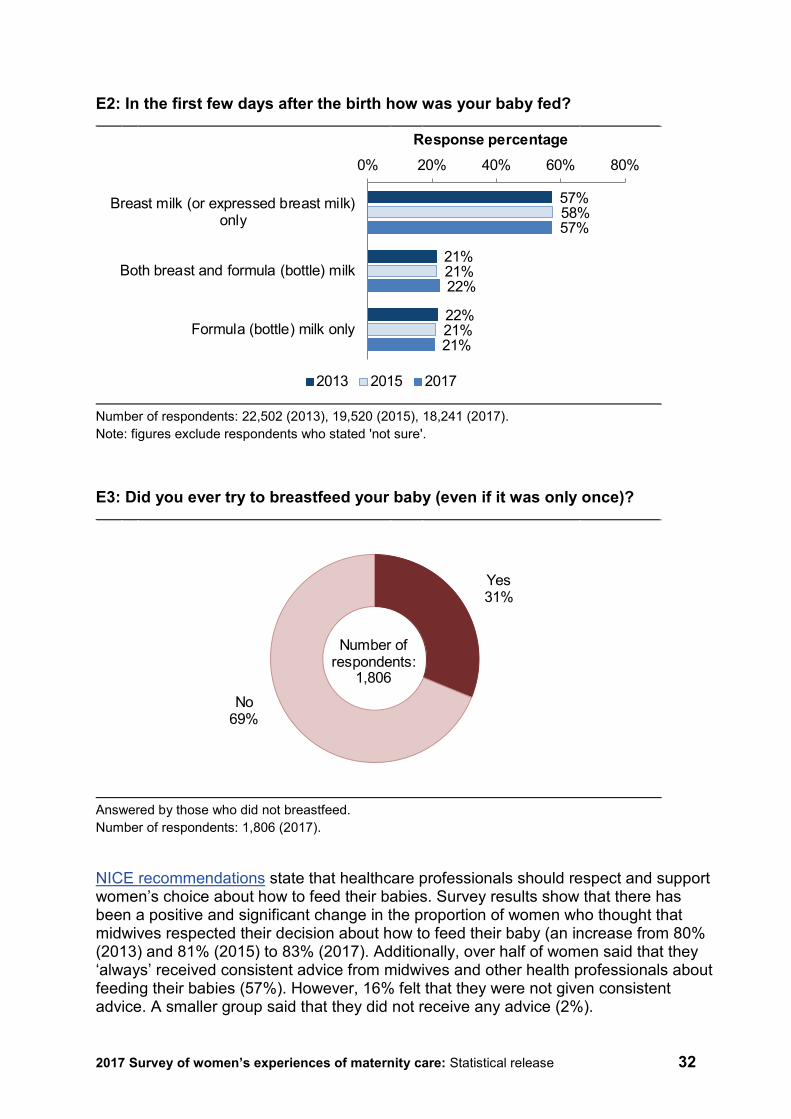
NICE guidance on maternal and child nutrition recommends that women receive active support and advice from healthcare professionals about feeding their babies.23 The Royal College of Midwives also states that women should be informed about the options for breastfeeding their babies and supported and advised accordingly when they have made a choice.24 When assessing the quality of service given to women during this stage, this survey found that 62% of women felt that their midwives ‘definitely’ provided relevant information about feeding their babies. Twenty-nine per cent of women thought they received relevant information to ‘some extent’ and a smaller group said they did not receive it at all (9%). In the first few days after the birth, most women fed their babies only breast milk (57%), followed by women who combined breast milk and formula milk (22%) and those who only fed their babies with formula (21%). Most women who fed their babies with formula never tried to breastfeed their babies (69%).
63%
32%
3%
1%
67%
29%
3%
1%
69%
27%
3%
1%
0% 20% 40% 60% 80%
Very clean
Fairly clean
Not very clean
Not at all clean
Response percentage
2013 2015 2017
2017 Survey of women’s experiences of maternity care: Statistical release 32
E2: In the first few days after the birth how was your baby fed?
Number of respondents: 22,502 (2013), 19,520 (2015), 18,241 (2017). Note: figures exclude respondents who stated 'not sure'.
E3: Did you ever try to breastfeed your baby (even if it was only once)?
Answered by those who did not breastfeed. Number of respondents: 1,806 (2017).
NICE recommendations state that healthcare professionals should respect and support women’s choice about how to feed their babies. Survey results show that there has been a positive and significant change in the proportion of women who thought that midwives respected their decision about how to feed their baby (an increase from 80% (2013) and 81% (2015) to 83% (2017). Additionally, over half of women said that they ‘always’ received consistent advice from midwives and other health professionals about feeding their babies (57%). However, 16% felt that they were not given consistent advice. A smaller group said that they did not receive any advice (2%).
57%
21%
22%
58%
21%
21%
57%
22%
21%
0% 20% 40% 60% 80%
Breast milk (or expressed breast milk)only
Both breast and formula (bottle) milk
Formula (bottle) milk only
Response percentage
2013 2015 2017
Yes31%
No69%
Number of respondents:
1,806

2017 Survey of women’s experiences of maternity care: Statistical release 33
E5: Did you feel that midwives and other health professionals gave you consistent advice about feeding your baby?
Number of respondents: 20,990 (2013), 18,350 (2015), 17,121 (2017). Note: figures exclude respondents who stated 'I did not want or need any advice' or 'don't know/can't remember'.
The perception of women about whether midwives and other health professionals gave them support and encouragement about feeding their babies has also improved significantly. Sixty-four per cent of women said they ‘always’ received encouragement and support, although 25% of women felt they were supported and encouraged ‘sometimes’, while others thought that they did not receive active support and encouragement about feeding their babies (10%). E6: Did you feel that midwives and other health professionals gave you active support and encouragement about feeding your baby?
Survey year Significant difference between: 2013 & 15 2015 & 2017 2013 2015 2017
Yes, always 61% 62% 64%
Yes, sometimes 28% 27% 25%
No 11% 11% 10% Number of respondents: 21,084 (2013), 18,440 (2015), 17,195 (2017). Note: figures exclude respondents who stated 'I did not want/need this' or 'don't know/can't remember'.
54%
27%
17%
2%
55%
26%
17%
2%
57%
25%
16%
2%
0% 10% 20% 30% 40% 50% 60%
Yes, always
Yes, sometimes
No
I did not receive any advice
Response percentage
2013 2015 2017
2017 Survey of women’s experiences of maternity care: Statistical release 34
6. Care at home after the birth
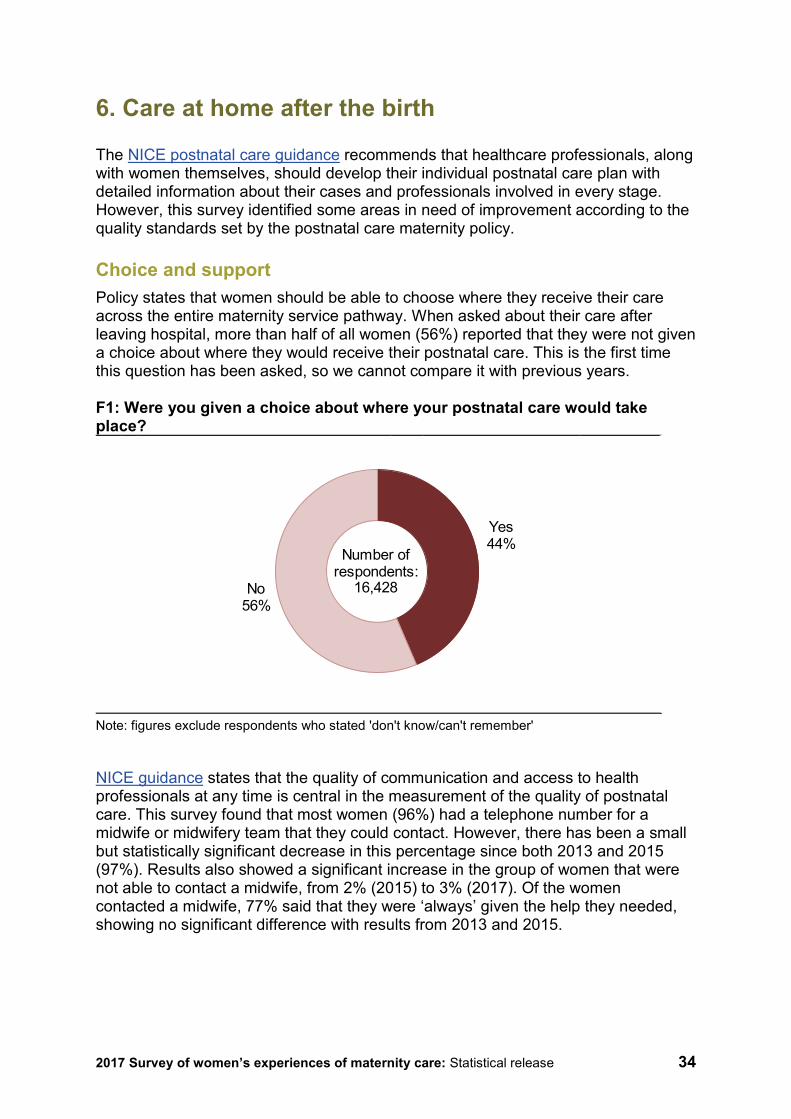
The NICE postnatal care guidance recommends that healthcare professionals, along with women themselves, should develop their individual postnatal care plan with detailed information about their cases and professionals involved in every stage. However, this survey identified some areas in need of improvement according to the quality standards set by the postnatal care maternity policy. Choice and support Policy states that women should be able to choose where they receive their care across the entire maternity service pathway. When asked about their care after leaving hospital, more than half of all women (56%) reported that they were not given a choice about where they would receive their postnatal care. This is the first time this question has been asked, so we cannot compare it with previous years. F1: Were you given a choice about where your postnatal care would take place?
Note: figures exclude respondents who stated 'don't know/can't remember'
NICE guidance states that the quality of communication and access to health professionals at any time is central in the measurement of the quality of postnatal care. This survey found that most women (96%) had a telephone number for a midwife or midwifery team that they could contact. However, there has been a small but statistically significant decrease in this percentage since both 2013 and 2015 (97%). Results also showed a significant increase in the group of women that were not able to contact a midwife, from 2% (2015) to 3% (2017). Of the women contacted a midwife, 77% said that they were ‘always’ given the help they needed, showing no significant difference with results from 2013 and 2015.
Yes44%
No56%
Number of respondents:
16,428
2017 Survey of women’s experiences of maternity care: Statistical release 35
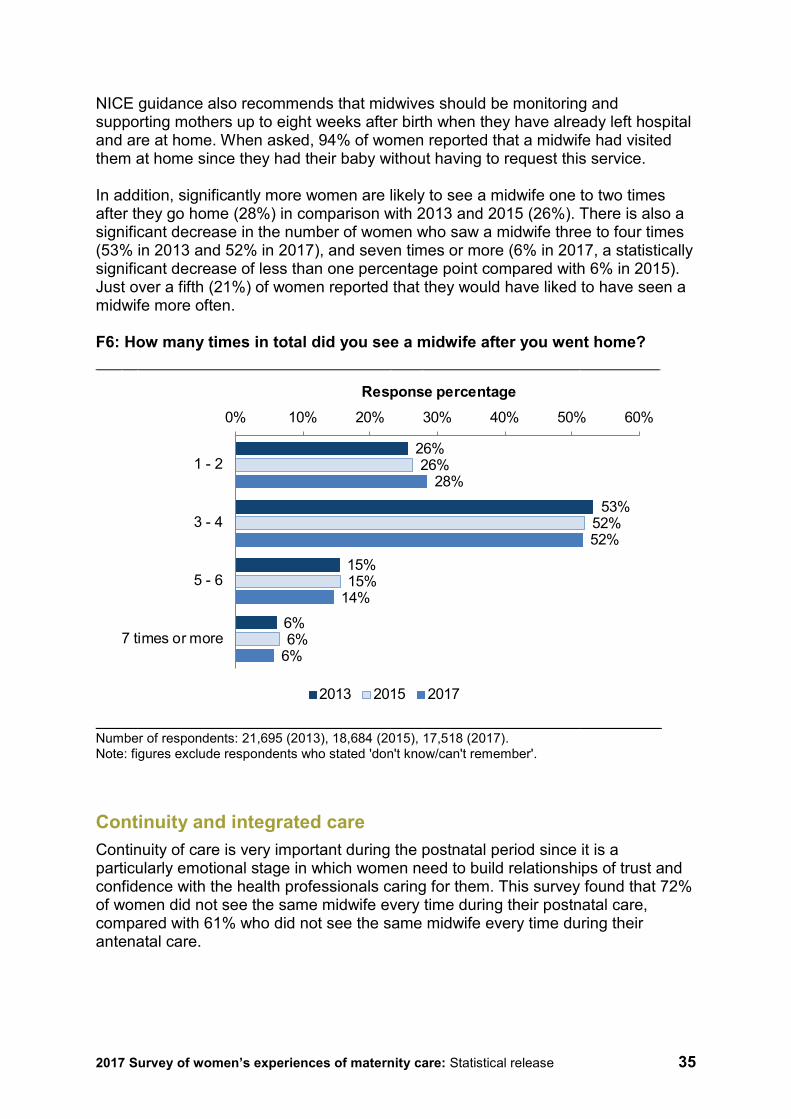
NICE guidance also recommends that midwives should be monitoring and supporting mothers up to eight weeks after birth when they have already left hospital and are at home. When asked, 94% of women reported that a midwife had visited them at home since they had their baby without having to request this service. In addition, significantly more women are likely to see a midwife one to two times after they go home (28%) in comparison with 2013 and 2015 (26%). There is also a significant decrease in the number of women who saw a midwife three to four times (53% in 2013 and 52% in 2017), and seven times or more (6% in 2017, a statistically significant decrease of less than one percentage point compared with 6% in 2015). Just over a fifth (21%) of women reported that they would have liked to have seen a midwife more often. F6: How many times in total did you see a midwife after you went home?
Number of respondents: 21,695 (2013), 18,684 (2015), 17,518 (2017). Note: figures exclude respondents who stated 'don't know/can't remember'.
Continuity and integrated care Continuity of care is very important during the postnatal period since it is a particularly emotional stage in which women need to build relationships of trust and confidence with the health professionals caring for them. This survey found that 72% of women did not see the same midwife every time during their postnatal care, compared with 61% who did not see the same midwife every time during their antenatal care.
26%
53%
15%
6%
26%
52%
15%
6%
28%
52%
14%
6%
0% 10% 20% 30% 40% 50% 60%
1 - 2
3 - 4
5 - 6
7 times or more
Response percentage
2013 2015 2017
2017 Survey of women’s experiences of maternity care: Statistical release 36
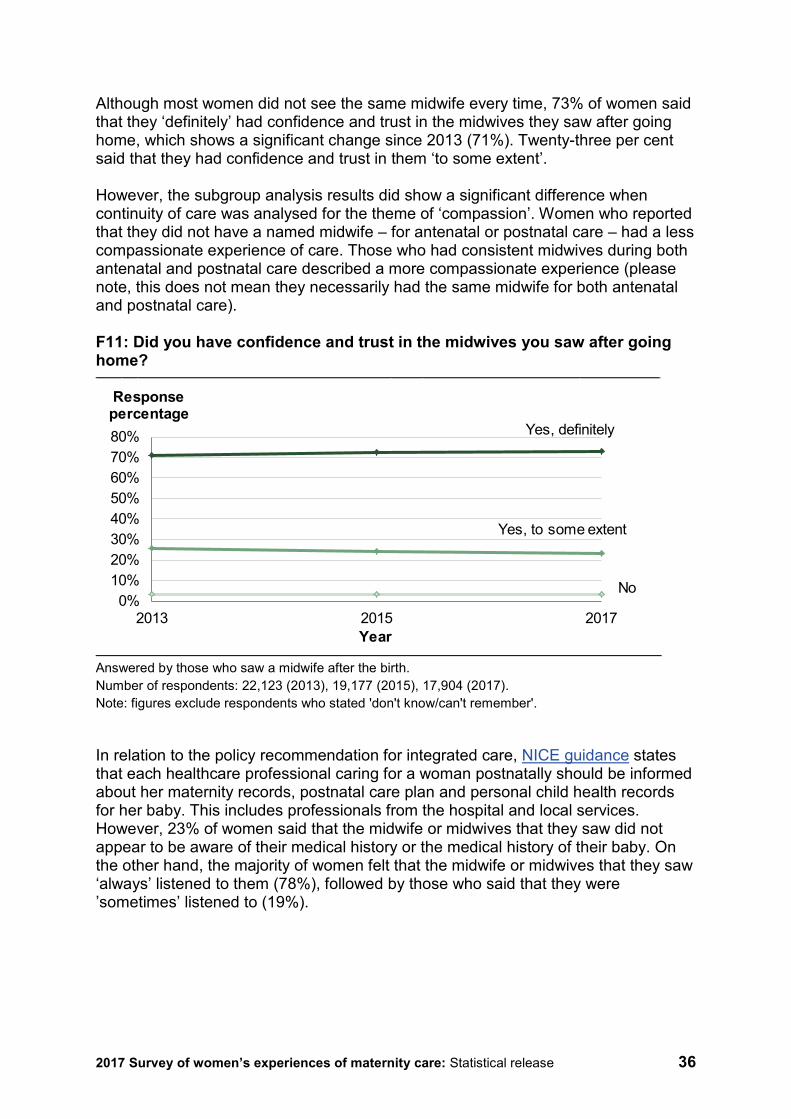
Although most women did not see the same midwife every time, 73% of women said that they ‘definitely’ had confidence and trust in the midwives they saw after going home, which shows a significant change since 2013 (71%). Twenty-three per cent said that they had confidence and trust in them ‘to some extent’. However, the subgroup analysis results did show a significant difference when continuity of care was analysed for the theme of ‘compassion’. Women who reported that they did not have a named midwife – for antenatal or postnatal care – had a less compassionate experience of care. Those who had consistent midwives during both antenatal and postnatal care described a more compassionate experience (please note, this does not mean they necessarily had the same midwife for both antenatal and postnatal care). F11: Did you have confidence and trust in the midwives you saw after going home?
Answered by those who saw a midwife after the birth. Number of respondents: 22,123 (2013), 19,177 (2015), 17,904 (2017). Note: figures exclude respondents who stated 'don't know/can't remember'.
In relation to the policy recommendation for integrated care, NICE guidance states that each healthcare professional caring for a woman postnatally should be informed about her maternity records, postnatal care plan and personal child health records for her baby. This includes professionals from the hospital and local services. However, 23% of women said that the midwife or midwives that they saw did not appear to be aware of their medical history or the medical history of their baby. On the other hand, the majority of women felt that the midwife or midwives that they saw ‘always’ listened to them (78%), followed by those who said that they were ’sometimes’ listened to (19%).
0%10%20%30%40%50%60%70%80%
2013 2015 2017
Response percentage
Year
Yes, definitely
Yes, to some extent
No
2017 Survey of women’s experiences of maternity care: Statistical release 37
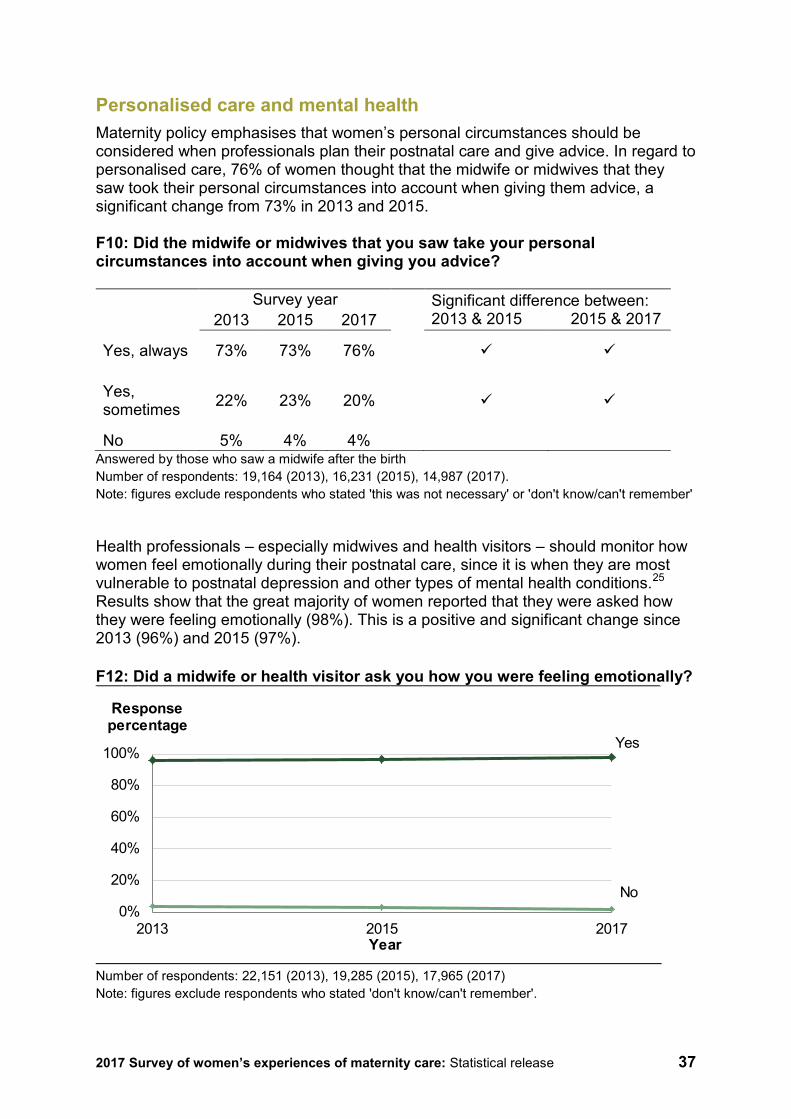
Personalised care and mental health Maternity policy emphasises that women’s personal circumstances should be considered when professionals plan their postnatal care and give advice. In regard to personalised care, 76% of women thought that the midwife or midwives that they saw took their personal circumstances into account when giving them advice, a significant change from 73% in 2013 and 2015. F10: Did the midwife or midwives that you saw take your personal circumstances into account when giving you advice?
Survey year Significant difference between: 2013 & 2015 2015 & 2017 2013 2015 2017
Yes, always 73% 73% 76%
Yes, sometimes 22% 23% 20%
No 5% 4% 4% Answered by those who saw a midwife after the birth Number of respondents: 19,164 (2013), 16,231 (2015), 14,987 (2017). Note: figures exclude respondents who stated 'this was not necessary' or 'don't know/can't remember'
Health professionals – especially midwives and health visitors – should monitor how women feel emotionally during their postnatal care, since it is when they are most vulnerable to postnatal depression and other types of mental health conditions.25 Results show that the great majority of women reported that they were asked how they were feeling emotionally (98%). This is a positive and significant change since 2013 (96%) and 2015 (97%). F12: Did a midwife or health visitor ask you how you were feeling emotionally?
Number of respondents: 22,151 (2013), 19,285 (2015), 17,965 (2017) Note: figures exclude respondents who stated 'don't know/can't remember'.
0%
20%
40%
60%
80%
100%
2013 2015 2017
Response percentage
Year
Yes
No

2017 Survey of women’s experiences of maternity care: Statistical release 38
In addition, there has been a positive and significant change in the group of women who said they were told who they could contact if they experienced any emotional changes after the birth. Seventy-eight per cent of women said they received this contact information compared with 74% in 2015. However, fewer women reported that they received ‘enough’ information about emotional changes after giving birth. Although the number of women who said that they were ‘definitely’ given enough information (59%) has significantly increased since 2013 (56%) and 2015 (57%), it is still a smaller group than women who reported that they were asked how they were feeling emotionally (98%). F17: Were you given enough information about any emotional changes you might experience after the birth?
Survey year Significant difference between: 2013 & 2015 2015 & 2017 2013 2015 2017
Yes, definitely 56% 57% 59%
Yes, to some extent 30% 30% 29%
No 14% 12% 12% Number of respondents: 21,005 (2013), 18,253 (2015), 17,018 (2017). Note: figures exclude respondents who stated 'no, but I did not need this information' or 'don't know/can't remember'.
Information NICE guidelines on postnatal care recommend that healthcare professionals give relevant and timely information to women so they can look after their own and their babies’ health and wellbeing. Respondents were asked whether they had received help and advice from health professionals about their baby’s health and progress in the first six weeks after the birth. Results showed that significantly more women reported that they ‘definitely’ received help and advice from health professionals about their baby’s health and progress (71%) compared with 2013 (70%). When asked, the great majority of women said that a midwife told them that they would need to arrange a postnatal check-up for their own health with their GP (92%). However, there was a statistically significant decrease in the proportion of women who said that they were given information about contraception (89%) compared with 2015 (91%).
2017 Survey of women’s experiences of maternity care: Statistical release 39
F19: Were you given information or offered advice from a health professional about contraception?
Number of respondents: 22,061 (2013), 19,090 (2015), 17,739 (2017). Note: figures exclude respondents who stated 'don't know/can't remember'.
7. Sociodemographic data
The sociodemographic profile of respondents provides important context in which to review findings. We found changes in the age profile of mothers, and also found that significantly fewer women reported that they did not have a long-term condition compared with 2013 and 2015. There were also very slight changes in terms of the proportion of women who defined their sexual orientation as gay or lesbian, and in terms of some ethnic groups. This survey found age data trends that match trends presented by the Office for National Statistics. Results show that age bands representing older women (ages 30+) are significantly increasing, while age bands for younger women (16-29) are decreasing. However, when women’s age was analysed in the multilevel subgroup analysis, results show no significant differences in the experiences of the different age groups across any of the themes included in the analysis. Research from the US Department of Health shows that existing health conditions are one of the factors that can put a pregnancy at risk. This survey listed the most relevant long-standing conditions for the maternity study and asked women whether they had any of them. Slightly more women reported having a long-standing mental health condition in 2017 (4%), compared with 2013 and 2015 (3%).There was an extremely small, but significant change between 2013 and 2017 in the proportion of women who said that they had a long-standing illness such as cancer, HIV, diabetes, chronic heart disease, or epilepsy. These groups accounted for 2% of all respondents in 2017.
0%
20%
40%
60%
80%
100%
2013 2015 2017
Response percentage
Year
Yes
No
2017 Survey of women’s experiences of maternity care: Statistical release 40
In regard to sexual orientation, women were asked to choose which option best described how they thought of themselves. Results showed a significant increase in the number of women who identified as gay or lesbian, though the proportion of women selecting this option remains less than 0.5% of respondents. Eighty-five per cent of women were White (a very small but significant increase from 2015). Asian or Asian British was the ethnic description chosen by 9% of women. There were no significant changes in the proportion of primiparous and multiparous women compared with previous surveys in 2013 and 2015.
8. How experience varies for different patient groups: subgroup analysis summary
We carried out an analysis by patient subgroup with data from this survey. The subgroup analysis compares the mean scores for a subset of questions by different groups and allows us to explore the relationships between patients’ characteristics and their experiences. The patient subgroups used in the analysis were: age group, religion, sexual orientation, ethnicity, long-term health conditions, parity (whether women have had a previous baby: ‘multiparous’, or not: ‘primiparous’), type of delivery, use of stirrups and named midwife status (this is inferred from responses to two questions: B8 for antenatal care and F5 for postnatal care). There are four categories for the named midwife subgroup: Not seeing the same midwife for any stage, seeing the same midwife for antenatal care, seeing the same midwife for postnatal care, and finally seeing the same midwife for antenatal care AND then having access to one midwife for their postnatal care. Themes The themes used within the analysis are: Choice, Information sharing, Involvement, Compassionate care and Feeding support. Below are the specific questions used for each theme, plus the dignity question that is analysed individually. Choice: B4. Were you offered any of the following choices about where to have your baby? B7. During your pregnancy were you given a choice about where your antenatal check-ups would take place? F1. Were you given a choice about where your postnatal care would take place? Information sharing: B6. Did you get enough information from either a midwife or doctor to help you decide where to have your baby?
2017 Survey of women’s experiences of maternity care: Statistical release 41
C1. At the very start of your labour, did you feel that you were given appropriate advice and support when you contacted a midwife or the hospital? C17. Thinking about your care during labour and birth, were you spoken to in a way you could understand? D6. Thinking about the care you received in hospital after the birth of your baby, were you given the information or explanations you needed? F13. Were you given enough information about your own physical recovery after the birth? F16. In the six weeks after the birth of your baby did you receive help and advice from health professionals about your baby’s health and progress? Involvement: B16. Thinking about your antenatal care, were you involved enough in decisions about your care? C11. If your partner or someone else close to you was involved in your care during labour and birth, were they able to be involved as much as they wanted? C18. Thinking about your care during labour and birth, were you involved enough in decisions about your care? Compassionate care: B12. During your antenatal check-ups, did a midwife ask you how you were feeling emotionally? F12. Did a midwife or health visitor ask you how you were feeling emotionally? F9. Did you feel that the midwife or midwives that you saw always listened to you? D7. Thinking about the care you received in hospital after the birth of your baby, were you treated with kindness and understanding? F17. Were you given enough information about any emotional changes you might experience after the birth? Feeding support: E1.During your pregnancy did midwives provide relevant information about feeding your baby? E4. Were your decisions about how you wanted to feed your baby respected by midwives? E5. Did you feel that midwives and other health professionals gave you consistent advice about feeding your baby? E6. Did you feel that midwives and other health professionals gave you active support and encouragement about feeding your baby?
2017 Survey of women’s experiences of maternity care: Statistical release 42
Dignity: C19. Thinking about your care during labour and birth, were you treated with respect and dignity? See Appendix F for charts and more detailed information. Subgroup analysis results Age group There were no differences between women according to their age for any theme analysed. Religion Women who described their religion as Buddhist reported more positive experiences regarding ‘choice’ than non-Buddhist women. Please note this group represented less than 0.5% of all respondents. Also, the group of women who preferred not so say what their religion was, reported worse experiences of ‘information provision’. There were no other differences between ‘religion’ subgroups for the rest of the themes analysed. Sexual orientation There were no differences between women’s maternity experiences according to ‘sexual orientation’. Ethnicity White women reported a poorer experience when analysed in the theme ‘choice’. There were no other differences between ‘ethnicity subgroup’ categories for the rest of the themes analysed. Long-term health conditions There were no differences between ‘long-term conditions’ subgroup categories for any theme analysed. Parity There were no differences between ‘parity’ subgroup categories for any theme analysed. Type of delivery The group of women who had an emergency caesarean delivery reported a poorer experience when analysed in the theme ‘involvement’.
2017 Survey of women’s experiences of maternity care: Statistical release 43
There were no other differences between ‘type of delivery’ subgroup categories for the rest of the themes analysed. Use of stirrups There were no differences between ‘use of stirrups’ subgroup categories for any theme analysed. Named midwife status Women who did not see the same midwife for either their antenatal or postnatal care reported a poorer experience when analysed in the theme ‘compassion’. Women who had the same midwife during their antenatal care and then saw a consistent midwife during their postnatal care reported a more positive experience. Please note, this does not mean these women saw the same midwife for both antenatal and postnatal care, though they might have done. There were no other differences between ‘named midwife status’ subgroup categories for the rest of the themes analysed.

2017 Survey of women’s experiences of maternity care: Statistical release 44
Appendix A: Other sources of information related to the key findings
National Institute for Health and Care Excellence (NICE) NICE quality standards are statements designed to drive measurable quality improvements within a particular area of health or care. They are derived from the best available evidence such as NICE guidance and other evidence sources accredited by NICE. They make evidence-based recommendations on a range of topics, which should be used by staff as appropriate, with the aim of promoting individualised and integrated care. In this statistical release, we feature the following guidelines: • QS22 - Quality standard for antenatal care
https://www.nice.org.uk/guidance/qs22
• CG62 - Antenatal care for uncomplicated pregnancies https://www.nice.org.uk/guidance/cg62/
• CG190 - Intrapartum care for healthy women and babies https://www.nice.org.uk/guidance/cg190
• CG55 - Intrapartum care: Care of healthy women and their babies during childbirth https://www.nice.org.uk/guidance/cg55
• CG37 - Postnatal care up to 8 weeks after birth https://www.nice.org.uk/guidance/cg37
• PH11 - Maternal and child nutrition https://www.nice.org.uk/guidance/ph11
Maternity Matters: Choice, access and continuity of care in a safe service This report was published by the Department of Health in April 2007. It set out the need for flexible services with a focus on the needs of the individual, especially those who are more vulnerable or disadvantaged. It also emphasised the need for all women to be supported and encouraged to have as normal a pregnancy and birth as possible. It made four national ‘choice guarantees’: 1. Choice of how to access maternity care. 2. Choice of type of antenatal care. 3. Choice of place of birth – depending on their circumstances, women and their
partners will be able to choose between three different options. These are: a. a home birth b. birth in a local facility, including a hospital, under the care of a midwife
2017 Survey of women’s experiences of maternity care: Statistical release 45
c. birth in a hospital supported by a local maternity care team including midwives, anaesthetists and consultant obstetricians. For some women this will be the safest option.
4. Choice of place of postnatal care.
Midwifery 2020: Delivering expectations The Midwifery 2020 programme was commissioned in 2008 by the Chief Nursing Officers for England, Wales, Northern Ireland and Scotland. The programme aims at reviewing the role of UK midwives in the improvement plans for the maternity healthcare system quality care. It also addresses the state of the education and training offered to midwives and the means to better support them and keep them in practice. It uses national and international evidence to propose a direction for midwifery services across the UK. See: https://www.gov.uk/government/publications/midwifery-2020-delivering-expectations. Pressure Points: Infant Feeding The Royal College of Midwives carried out this study between September and November 2013. The report presents the experiences of midwifes, maternity support workers and student midwife members with the maternity services across the UK. In addition, the study asked mothers about the support they received on their baby feeding choice and about the quality of the information and advice they were given. The report also focuses on the main challenges faced by midwifery staff regarding time and resources. See: https://www.rcm.org.uk/sites/default/files/Pressure%20Points%20-%20Infant%20Feeding%20-%20Final_0_0.pdf Better Births: Improving outcomes for maternity services in England – A Five Year Forward view for maternity care The National Maternity Review, Better Births, was published in 2016 and presents the Five Year Forward Plan for maternity services. It proposes a strategy to achieve NICE recommendations by maternity healthcare providers. The central vision of Better Births is that maternity services across England can become safer, more personalised, kinder, professional and more family friendly; highlighting the importance of choice, involvement and support. It also introduces a new approach to coordinate local and specialist services. See: https://www.england.nhs.uk/wp-content/uploads/2016/02/national-maternity-review-report.pdf
2017 Survey of women’s experiences of maternity care: Statistical release 46
Support Overdue: Women’s experiences of maternity services The National Federation of Women’s Institutes (NFWI) and the National Childbirth Trust NCT produced this report in 2017 presenting a picture of the main challenges faced by the maternity services. The document addresses the quality of care regarding systemic staff shortages and current hurdles affecting mother’s choices, information provision and involvement in care plan, and safety. See: https://www.nct.org.uk/sites/default/files/related_documents/Support_Overdue_2017.pdf
2017 Survey of women’s experiences of maternity care: Statistical release 47
Appendix B: Other UK maternity surveys Other surveys carried out in the UK also aim to measure and understand the experience of women who use maternity services. Data from these surveys may yield different results than this 2017 maternity survey, owing to different methodologies and contexts. Therefore, data users should be cautious before drawing conclusions from different survey data about patient experience with maternity services. Scotland The Maternity Care survey carried out by the Scottish government is very similar to the CQC Maternity survey. They both aim to measure and understand how women experience the service across the different stages of the maternity pathway. The Scottish Maternity Survey was first rolled out in 2013 using the same questionnaire from CQC’s Maternity Survey in 2013, with only a few changes. The organisation and monitoring mechanisms of the maternity services in Scotland differ in some ways from those in England. However, the quality standards for maternity healthcare remain the same: a personalised and safe care for all women where they can choose and be involved in their own care plan. The latest Scottish Maternity Survey was published in 2015 and the next publication is planned for 2018. See: http://www.gov.scot/Topics/Statistics/Browse/Health/maternitysurvey See the website for more information: http://www.gov.scot/Topics/Statistics/Browse/Health/maternitysurvey/2015Results Wales The first Maternity Survey for Wales was published in October 2017. The survey was completed by 3,968 mothers from all over Wales. It aimed to understand the perception of women about the quality of antenatal care and the capacity of the service to prepare women for labour, birth and also parenting. The Welsh survey, like the English and Scottish surveys, was orientated towards quality standards of personalised care, dignity and continuity of care. In a publication from October 2017, the Royal College of Midwives stated that results from the survey showed how important it is for Welsh women to build stronger relationships with their midwives. In line with results from our survey, the Welsh survey found that maternity services in Wales also face challenges related to continuity of care.
2017 Survey of women’s experiences of maternity care: Statistical release 48
Also, Welsh women want to be given more information on their options about where to give birth and ask that healthcare professionals respect their choices regardless of where they decide to give birth. For more information see: http://gov.wales/newsroom/health-and-social-services/2017/maternity/?lang=en Northern Ireland The National Perinatal Epidemiology Unit (NPEU) and the School of Nursing and Midwifery at Queen’s University published the first Maternity Survey report for Northern Ireland in May 2016. The survey used a format similar to the one used by the NPEU for their maternity survey in 2014. As with other maternity surveys carried out in the UK, the questionnaire was divided into the different stages of the maternity service pathway and included additional questions about health and wellbeing and partner involvement. The Northern Ireland maternity survey had a sample of 6,123 women and achieved a 45% response rate. Results from the survey show that maternity services in Northern Ireland also face challenges regarding continuity of care. However, half of all women did say that they did have a ‘named midwife’ who provided all or most of their care during pregnancy. Just over half of all women (57%) said that they felt they had received enough information about their options of where to give birth. Similarly to results in England, the great majority of women reported that they were asked about their emotions and mental health and that they we treated with dignity and respect by staff. For more information see: http://www.qub.ac.uk/schools/SchoolofNursingandMidwifery/FileStore/Filetoupload,670193,en.pdf?platform=hootsuite The National Perinatal Epidemiology Unit (NPEU) The NPEU has conducted a survey of women’s experiences of maternity care in 2006, 2010 and 2014. The survey used a random sample of 10,000 women and achieved a response rate of 47%. It used both postal and online modes. The structure of the NPEU survey is very similar to CQC’s survey, covering themes such as antenatal care, number of check-ups, location of birth, method of birth, feeding assistance, and staff care. However, it uses a longer questionnaire with different sections including antenatal screening with testing for Down’s syndrome, babies needing specialist care, involvement of fathers and partners and more questions on maternal mental health/emotional wellbeing. Results from this survey have been very useful as a source of benchmarking information for other maternity survey programmes in the UK.

2017 Survey of women’s experiences of maternity care: Statistical release 49
The final phase of the most recent NPEU Maternity Survey is taking place in the spring of 2018. This survey is being developed in the same way as previous iterations in 2006, 2010, and 2014 with ONS using birth registration data to draw the sample. More information is available at www.npeu.ox.ac.uk
2017 Survey of women’s experiences of maternity care: Statistical release 50
Appendix C: Main uses of the survey data This appendix lists known users of data from the maternity survey and how they use the data. CQC is currently reviewing the use of all survey data to identify who uses it. We will focus on patient and carer groups to better understand how those groups use data and to identify whether any further measures can be taken to support their use. NHS trusts and commissioners Trusts, and those who commission services, use the results to identify and make the changes they need to improve the experience of people who use their services. Patients, their supporters and representative groups CQC publishes the survey data online for each participating NHS trust, which appears on the trust’s profile page. This is found by searching for the name of the organisation. The data is presented in an accessible format to enable the public to examine how services are performing, alongside their inspection results. The search tool is available from the CQC home page: http://www.cqc.org.uk/. Care Quality Commission (CQC) The Care Quality Commission uses the results from the survey in the regulation, monitoring and inspection of acute trusts in England. Survey data will be used in the CQC Insight system, which provides inspectors with an assessment of risk in areas of care within an NHS trust that need to be followed up. The survey data will also be included in the data packs produced for inspections. Results will form a key source of evidence to support the judgements and ratings published for trusts. NHS England From maternity survey data NHS England produces two indicators in the CCG Improvement and Assessment Framework. The indicators form part of an overall assessment of CCGs and the results are published on MyNHS (more information is available at https://www.england.nhs.uk/commissioning/ccg-assess/). The Maternity Transformation Programme has recently developed a set of National Maternity Indicators, which will feature as part of upcoming maternity data viewer to help maternity providers identify unwarranted variation. From April 2018, results of select questions from the maternity survey will be reported to the Maternity Transformation Programme Board. These questions include the new question (C13) that was added in 2017 on continuity of care to enable the board to monitor the rollout of continuity of care.
2017 Survey of women’s experiences of maternity care: Statistical release 51
Department of Health and Social Care The government’s strategy sets out a commitment to measure progress on improving people’s experiences through Domain 4 of the NHS Outcomes Framework ‘ensuring people have a positive experience of care’, which includes results from the maternity survey, among other data sources. The Framework sets out the outcomes and corresponding indicators that the Department of Health and Social Care uses to hold NHS England to account for improvements in health outcomes, as part of the government’s Mandate to NHS England. The Outcomes Framework survey indicators are based on the standardised, scored trust level data from the survey (similar to that included in the CQC benchmark reports), rather than the England level percentage of respondents data that is contained within this report. For more information see www.gov.uk/government/publications/nhs-outcomes-framework-2015-to-2016. NHS Improvement NHS Improvement will use the results to inform quality and governance activities as part of its Oversight Model for NHS Trusts. See http://www.ntda.nhs.uk/.
2017 Survey of women’s experiences of maternity care: Statistical release 52
Appendix D: Quality and Methodology This survey had 18,426 respondents from a sample of 50,008 mothers, which yields an adjusted response rate of 37.4%. The adjusted base is calculated by subtracting the number of questionnaires returned as undeliverable or if someone had died, from the total number of questionnaires sent out. The adjusted response rate is then calculated by dividing the number of returned useable questionnaires by the adjusted base. Sample Women aged 16 and over at the time of delivery were eligible to complete the survey if they had a live birth during the month of February 2017. Trusts with samples smaller than 300 were required to include women who gave birth during January 2017 also, starting with deliveries on 31 January and working back across the month until the sample size of 300 was achieved. Only women receiving care from an NHS trust were eligible. All NHS trusts providing maternity services and that had a sufficient number of births were eligible to take part in the survey. No trusts were excluded from analysis on the basis of sampling errors. Attribution We asked trusts to identify which of the women in their sample were likely to have also received their antenatal and postnatal care from the same trust at which they gave birth. This attribution exercise was completed for the first time in the 2013 survey. For 2017, 125 trusts that took part in the survey were able to do this for antenatal care and 126 for postnatal care. The aim is to improve the accuracy with which survey responses are attributed to the care provider and allow trusts to gain better insight to improve services. Analysis Two weights were applied to the survey results data: a trust weight to ensure that each trust contributes equally to the England average, and a population weight, to make sure that each trust’s results are representative of their own sample and do not over-represent groups such as older respondents. For more information see the Quality and Methodology report. The 2017 questionnaire is similar to the 2015 version; historical comparisons have been made for all questions that remain the same as 2015. In addition, trend analysis has been run on comparable questions across previous maternity surveys. All detail on data limitations can be found in the Quality and Methodology document, available at http://www.cqc.org.uk/maternitysurvey
2017 Survey of women’s experiences of maternity care: Statistical release 53
Revisions and corrections CQC publishes a Revisions and Corrections Policy relating to these statistics. Maternity Survey data is not subject to any scheduled revisions as it captures the views of women about their experiences of care at a specific point in time. All new survey results are therefore published on CQC’s website and NHS Surveys, as appropriate, and previously published results for the same survey are not revised. This policy sets out how CQC will respond if an error is identified within any survey and it becomes necessary to correct published data and/or reports.
2017 Survey of women’s experiences of maternity care: Statistical release 54
Appendix E: Further information and feedback
Further information Results for NHS trusts can be found on CQC’s website. You can also find a ‘technical document’ here, which describes the methodology for producing trust level results, and a ‘quality and methodology’ document, which provides information about survey methodology. The national results from previous maternity surveys that took place in 2007, 2010, 2013 and 2015 are available at http://www.nhssurveys.org/surveys/299. The survey questionnaire went under a major redevelopment in 2013 so results are only comparable for 2013, 2015 and 2017 iterations. The trust results from previous maternity surveys that took place in 2007, 2010, 2013 and 2015 are available at: 2007: http://www.nhssurveys.org/surveys/312 2010: http://www.nhssurveys.org/surveys/574 2013: http://www.nhssurveys.org/surveys/734 2015: http://www.nhssurveys.org/surveys/876 Full details of the methodology for the survey, including questionnaires, letters sent to women, instructions on how to carry out the survey and the survey development report, are available at http://www.nhssurveys.org/surveys/1055 More information on the patient survey programme, including results from other surveys and a programme of current and forthcoming surveys can be found at www.cqc.org.uk/surveys. Further questions or feedback This summary has been produced by CQC’s Survey Team and reflects the findings of the maternity survey 2017. The guidance above should help answer any questions about the programme and you are advised to review that information carefully. However, if you wish to contact the team directly, please contact Paul Williamson, User Voice Development Manager, [email protected].

2017 Survey of women’s experiences of maternity care: Statistical release 55
We welcome all feedback on the survey findings and the way we have reported the results, particularly from people using services, their representatives, and those providing services. If you have any views, comments or suggestions on how this publication could be improved, please contact [email protected]. CQC will review your feedback and use it as appropriate to improve the statistics that we publish across the NHS Patient Survey Programme. If you would like to be involved in consultations or receive updates on the NHS Patient Survey Programme, please subscribe here: http://www.cqc.org.uk/ surveys.
2017 Survey of women’s experiences of maternity care: Statistical release 56
Appendix F: Subgroup analysis charts
Choice
KEY: Yellow bars indicate scores for a sub-group are lower than the mean score for a theme
Green bars indicate scores are higher than the mean
2017 Survey of women’s experiences of maternity care: Statistical release 57
Information
2017 Survey of women’s experiences of maternity care: Statistical release 58
Involvement
2017 Survey of women’s experiences of maternity care: Statistical release 59
Compassion
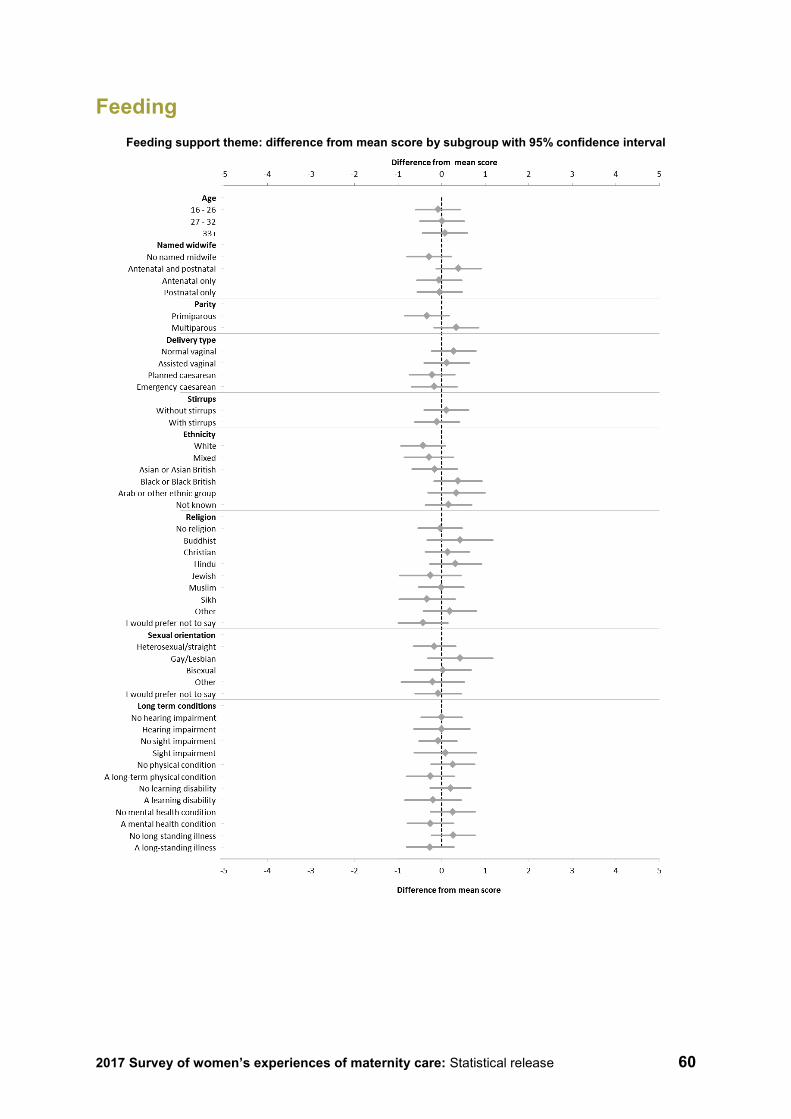
2017 Survey of women’s experiences of maternity care: Statistical release 60
Feeding Feeding support theme: difference from mean score by subgroup with 95% confidence interval
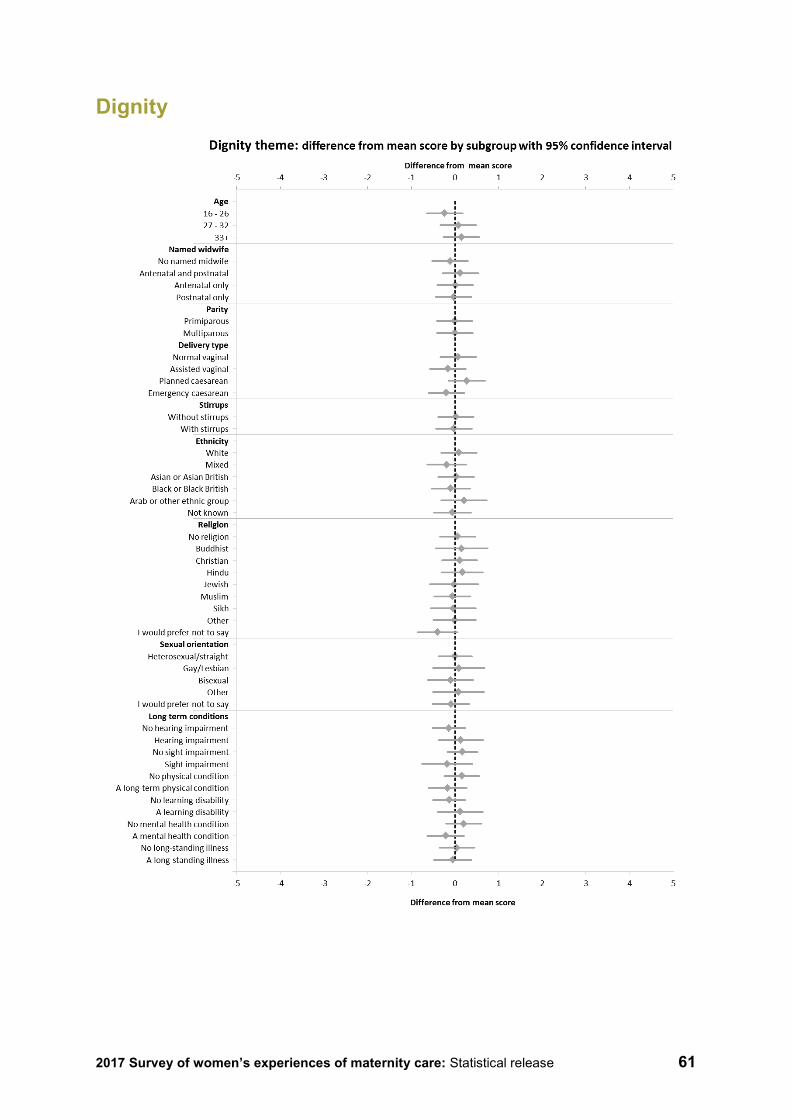
2017 Survey of women’s experiences of maternity care: Statistical release 61
Dignity
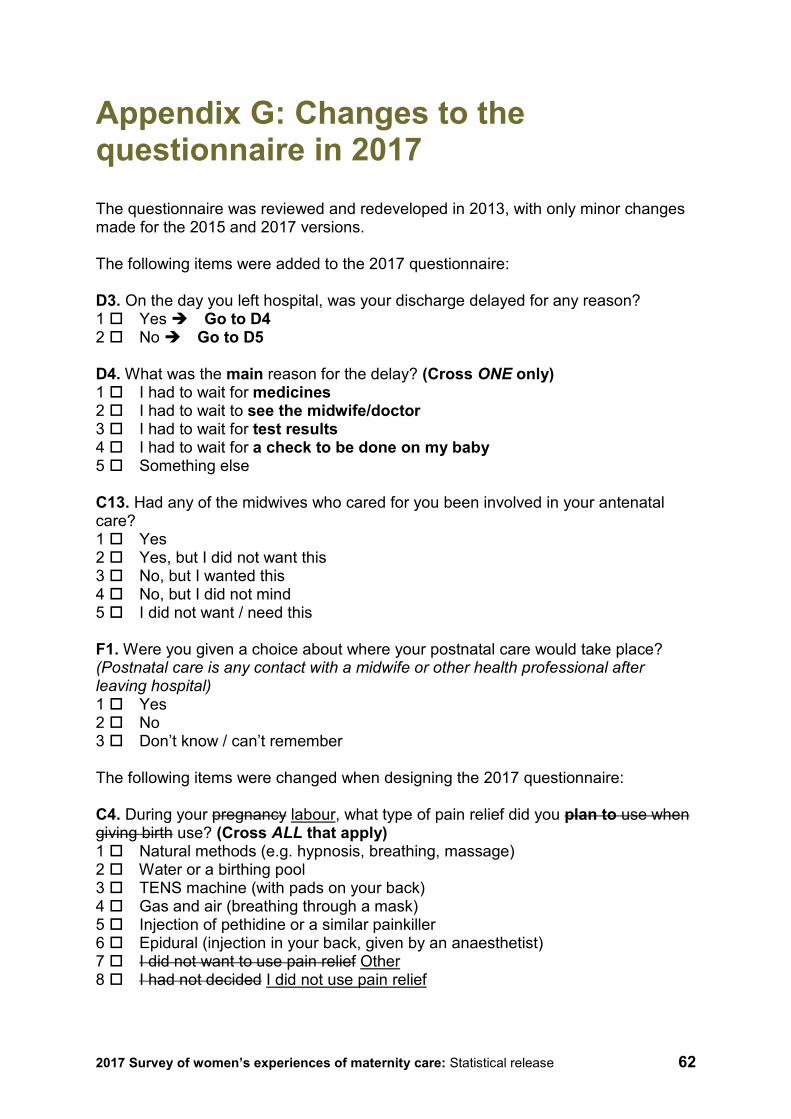
2017 Survey of women’s experiences of maternity care: Statistical release 62
Appendix G: Changes to the questionnaire in 2017 The questionnaire was reviewed and redeveloped in 2013, with only minor changes made for the 2015 and 2017 versions. The following items were added to the 2017 questionnaire: D3. On the day you left hospital, was your discharge delayed for any reason? 1 Yes Go to D4 2 No Go to D5 D4. What was the main reason for the delay? (Cross ONE only) 1 I had to wait for medicines 2 I had to wait to see the midwife/doctor 3 I had to wait for test results 4 I had to wait for a check to be done on my baby 5 Something else C13. Had any of the midwives who cared for you been involved in your antenatal care? 1 Yes 2 Yes, but I did not want this 3 No, but I wanted this 4 No, but I did not mind 5 I did not want / need this F1. Were you given a choice about where your postnatal care would take place? (Postnatal care is any contact with a midwife or other health professional after leaving hospital) 1 Yes 2 No 3 Don’t know / can’t remember The following items were changed when designing the 2017 questionnaire: C4. During your pregnancy labour, what type of pain relief did you plan to use when giving birth use? (Cross ALL that apply) 1 Natural methods (e.g. hypnosis, breathing, massage) 2 Water or a birthing pool 3 TENS machine (with pads on your back) 4 Gas and air (breathing through a mask) 5 Injection of pethidine or a similar painkiller 6 Epidural (injection in your back, given by an anaesthetist) 7 I did not want to use pain relief Other 8 I had not decided I did not use pain relief

2017 Survey of women’s experiences of maternity care: Statistical release 63
C5. Did the pain relief you used change from what you had originally planned (before you went into labour)? C6. Why did you not use the choice of pain relief that you had originally planned to (before you went into labour)? (Cross ALL that apply) F20. Did a midwife tell you that you would need to arrange a postnatal check-up of your own health with your GP? (Around 4-8 6-8 weeks after the birth) G1. In what year were you born? The year prefix ‘19’ was removed from the response boxes in this question because younger mothers may now have been born in the 21st century. The example birth year was also changed from 1975 to 1985 to make it more centralised within the likely birth year range for new mothers. The following items were removed when designing the 2017 questionnaire: B8. Which of the following health professionals did you see for your antenatal check-ups? (Cross ALL that apply) 1 Midwife 2 GP (family doctor) 3 Hospital doctor (e.g. a consultant) 4 Other D8. Thinking about your stay in hospital, how clean were the toilets and bathrooms you used? 1 Very clean 2 Fairly clean 3 Not very clean 4 Not at all clean 5 Don’t know / can’t remember 6 I did not use the toilet/bathroom Find more details behind the changes to this year’s questionnaire in our Development report for the Maternity Survey 2017 on the NHS Surveys website: http://nhssurveys.org/survey/1922
2017 Survey of women’s experiences of maternity care: Statistical release 64
Appendix H: Acknowledgements CQC would like to thank the stakeholders who have helped us redevelop the maternity survey. We particularly appreciate the support given by the Survey Advisory Group, which included representatives from: NHS England, NHS Improvement, Department of Health and Social Care, National Perinatal Epidemiology Unit, National Childbirth Trust, University Hospitals Bristol NHS Foundation Trust and Kings College Hospital.
We are grateful to all the thousands of mothers who took the time to provide feedback on their experiences of maternity care.
2017 Survey of women’s experiences of maternity care: Statistical release 65
References 1. Doyle and others, User feedback in maternity services, The King’s Fund, October 2016 https://www.kingsfund.org.uk/publications/user-feedback-maternity-services
2. The National Maternity Review 2016, Better Births - Improving outcomes of maternity services in England: A Five Year Forward View for maternity care https://www.england.nhs.uk/mat-transformation/mat-review/ 3 Department of Health and Social Care 2017, Safer maternity care: progress and next steps https://www.gov.uk/government/publications/safer-maternity-care-progress-and-next-steps
4. NHS Resolution, Five years of cerebral palsy claims; A thematic review of NHS Resolution data, September 2017 https://resolution.nhs.uk/five-years-of-cerebral-palsy-claims/
5. Office for National Statistics Birth Summary Tables Release, 2016 https://www.ons.gov.uk/peoplepopulationandcommunity/birthsdeathsandmarriages/livebirths/datasets/birthsummarytables
6. National Institute for Health and Care Excellence, Postnatal care up to 8 weeks after birth CG37 https://www.nice.org.uk/guidance/cg37
7. National Perinatal Epidemiology Unit, Safely Delivered: a national survey of women’s experience of maternity care, 2014 https://www.npeu.ox.ac.uk/downloads/files/reports/Safely%20delivered%20NMS%202014.pdf
8. The National Federation of Women’s Institutes and National Childbirth Trust, Support Overdue: Women’s experiences of maternity services, 2017 https://www.nct.org.uk/sites/default/files/related_documents/Support_Overdue_2017.pdf
9. National Institute for Health and Care Excellence, Maternal and child nutrition PH11 https://www.nice.org.uk/guidance/ph11
10. The Royal College of Midwives, Infant feeding – Supporting parent choice, in Pressure Points, May, 2014, https://www.rcm.org.uk/get-involved/campaigns/pressure-points
11. NHS Improving Quality, Improving access to Perinatal Mental Health Services in England – A Review, 2015 http://www.maternalmentalhealth.org.uk/wp-content/uploads/2015/09/NHSIQ-Improving-access-to-perinatal-mental-health-services-in-England-0915.pdf
12. Royal College of Obstetricians & Gynaecologists, Maternal Mental Health – Women’s Voices, February, 2017 https://www.rcog.org.uk/en/patients/maternal-mental-health---womens-voices/
2017 Survey of women’s experiences of maternity care: Statistical release 66
13. National Institute for Health and Care Excellence, Antenatal care for uncomplicated pregnancies CG62 https://www.nice.org.uk/guidance/cg62/
14. The National Maternity Review 2016, Better Births - Improving outcomes of maternity services in England: A Five Year Forward View for maternity care https://www.england.nhs.uk/mat-transformation/mat-review/
15. Department of Health, Maternity Matters: Choice, access and continuity of care in a safe service, April 2007 http://webarchive.nationalarchives.gov.uk/20130103035958/http://www.dh.gov.uk/prod_consum_dh/groups/dh_digitalassets/@dh/@en/documents/digitalasset/dh_074199.pdf
16. National Institute for Health and Care Excellence, Intrapartum care for healthy women and babies CG190 https://www.nice.org.uk/guidance/cg190
17. National Institute for Health and Care Excellence, Postnatal care up to 8 weeks after birth CG37 https://www.nice.org.uk/guidance/cg37
18. National Institute for Health and Care Excellence, Intrapartum care for healthy women and babies CG190 https://www.nice.org.uk/guidance/cg190
19. Department of Health, Maternity Matters: Choice, access and continuity of care in a safe service, April 2007 http://webarchive.nationalarchives.gov.uk/20130103035958/http://www.dh.gov.uk/prod_consum_dh/groups/dh_digitalassets/@dh/@en/documents/digitalasset/dh_074199.pdf
20. National Institute for Health and Care Excellence, Intrapartum care for healthy women and babies CG190 https://www.nice.org.uk/guidance/cg190
21. National Institute for Health and Care Excellence, Antenatal care for uncomplicated pregnancies CG62, https://www.nice.org.uk/guidance/cg62/
22. National Institute for Health and Care Excellence, Postnatal care up to 8 weeks after birth CG37 https://www.nice.org.uk/guidance/cg37
23. National Institute for Health and Care Excellence, Maternal and child nutrition PH11 https://www.nice.org.uk/guidance/ph11
24. The Royal College of Midwives, Infant feeding – Supporting parent choice, in Pressure Points, May, 2014, https://www.rcm.org.uk/get-involved/campaigns/pressure-points
25. National Institute for Health and Care Excellence, Postnatal care up to 8 weeks after birth CG37 https://www.nice.org.uk/guidance/cg37

How to contact us Call us on: 03000 616161 Email us at: [email protected] Look at our website: www.cqc.org.uk Write to us at: Care Quality Commission Citygate Gallowgate Newcastle upon Tyne NE1 4PA
Follow us on Twitter: @CareQualityComm
Please contact us if you would like a summary of this document in another language or format.