Chairrman Presentation Abertis' Shareholders General Meeting 2014
Upload
thermal-energy-international-incCategory
view
360download
2
Annual General Meeting of Shareholders
TSX-V: TMG | November 28, 2017

Forward-looking statements
This presentation includes “forward-looking information”. For example, statements about the opportunities for repeat business; thepossibility or expectation of additional orders; growth in existing markets; entry into new markets; order backlog; introduction of newproducts and services; establishment and growth of new distribution channels; growth opportunities and strategies; conversion ofexisting orders into revenues; are all forward looking information. Such forward looking information reflects Thermal EnergyInternational’s (“TEI”) current expectations with respect to future events and are based on information currently available tomanagement. Forward-looking information involves significant known and unknown risks, uncertainties and assumptions. For example,existing and new customers may not place orders for any number of reasons; fulfilment of orders, installation of product and activation ofproduct could all be delayed for a number of reasons, some of which are outside of TEI’s control, which would result in anticipatedrevenues from such projects being delayed or in the most serious cases eliminated; TEI may not be successful in identifying anddeveloping new products and our new or existing products may not result in new orders or gain acceptance in new geographical orindustrial markets; we may not be successful in establishing new distribution channels or such new channels may not be successful; ourgrowth strategies may not be successful or result in the anticipated growth and orders received by TEI may not turn into revenue in thetime frame anticipated, or at all, due to many factors, some of which are outside of TEI’s control, including but not limited to TEI’s abilityto deliver products on time and in accordance with specifications and the continuing financial viability of the customer. Readers are alsoreferred to the risk factors outlined in our management’s discussion and analysis available at www.SEDAR.com. Should one or more ofthese risks or uncertainties materialize, or should assumptions underlying the forward-looking information prove incorrect, actual results,performance or achievements could vary materially from those expressed or implied by the forward-looking informationcontained in this presentation.
Readers should not place undue reliance on forward-looking information. The forward-looking information is made as of the date of thispresentation and TEI does not assume any obligation to update or revise it to reflect new events or circumstances, except as required bylaw.
The term “EBITDAS” as used in this presentation is not a recognized measure under IFRS, does not have a standardized meaningprescribed by IFRS and is therefore unlikely to be comparable to similar measures presented by other companies. This measure isprovided as additional information to complement IFRS measures by providing further understanding of the Company’s results ofoperations from management’s perspective and should not be considered in isolation nor as a substitute for analysis of our financialinformation reported under IFRS. Please refer to our management’s discussion and analysis for the applicable period for a reconciliationof EBITDAS to Net income (loss), the closest IFRS measure.
Year end financial results
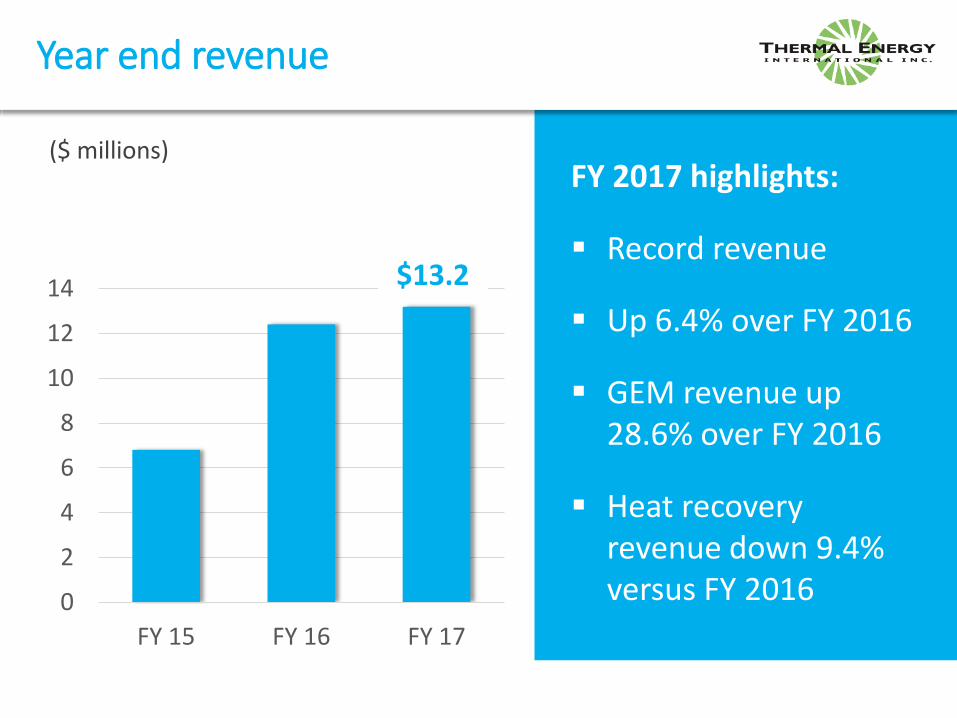
Year end revenue
($ millions)
0
2
4
6
8
10
12
14
FY 15 FY 16 FY 17
$13.2
FY 2017 highlights:
Record revenue
Up 6.4% over FY 2016
GEM revenue up 28.6% over FY 2016
Heat recovery revenue down 9.4% versus FY 2016
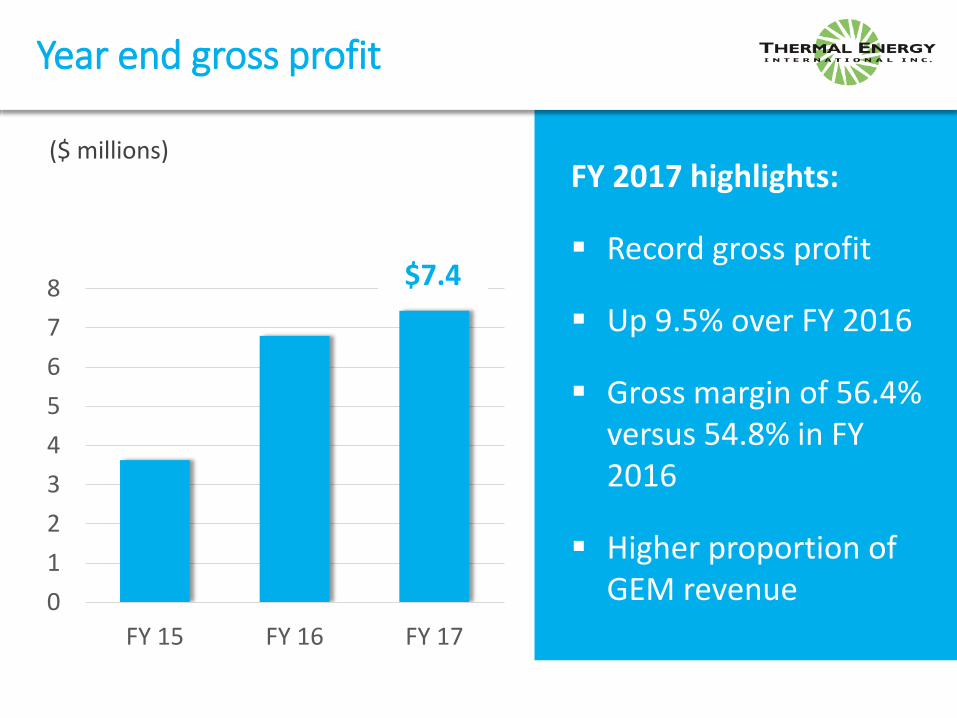
Year end gross profit
($ millions)
0
1
2
3
4
5
6
7
8
FY 15 FY 16 FY 17
$7.4
FY 2017 highlights:
Record gross profit
Up 9.5% over FY 2016
Gross margin of 56.4% versus 54.8% in FY 2016
Higher proportion of GEM revenue

Year end operating expenses
($ millions)
0
1
2
3
4
5
6
7
FY 15 FY 16 FY 17
FY 2017 highlights:
Operating expenses as a percent of revenue were flat despite additional staff and increased marketing activities
88.3% 52.1% 52.0%
Percentage of revenue

-2500
-2000
-1500
-1000
-500
0
500
1000
EBITDAS Net loss
($ thousands)
FY 15 FY 16 FY 17
Year end EBITDAS and net income
FY 2017 highlights:
EBITDAS increased 33% to $750K
Net income was up 52% to $393K
First quarter financial results
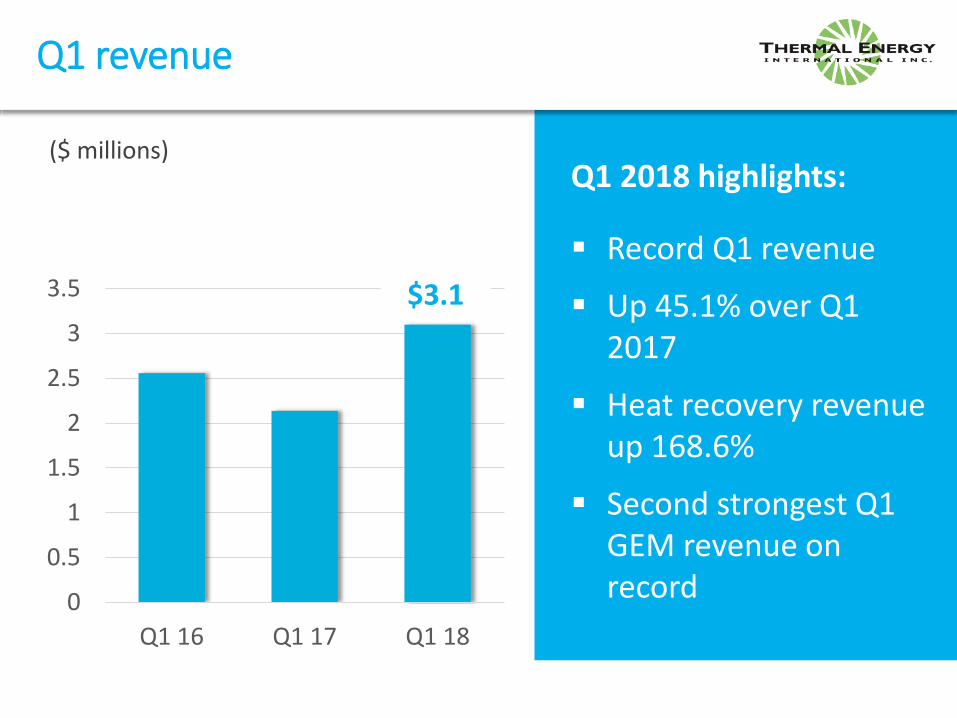
Q1 revenue
($ millions)
0
0.5
1
1.5
2
2.5
3
3.5
Q1 16 Q1 17 Q1 18
$3.1
Q1 2018 highlights:
Record Q1 revenue
Up 45.1% over Q1 2017
Heat recovery revenue up 168.6%
Second strongest Q1 GEM revenue on record

Q1 gross profit
($ millions)
0
0.2
0.4
0.6
0.8
1
1.2
1.4
1.6
Q1 16 Q1 17 Q1 18
$1.5
Q1 2018 highlights:
Record Q1 gross profit
Up 4.3% over Q1 2017
Gross margin of 49.0% vs 68.2% in Q1 2017
Much higher proportion of heat recovery revenue
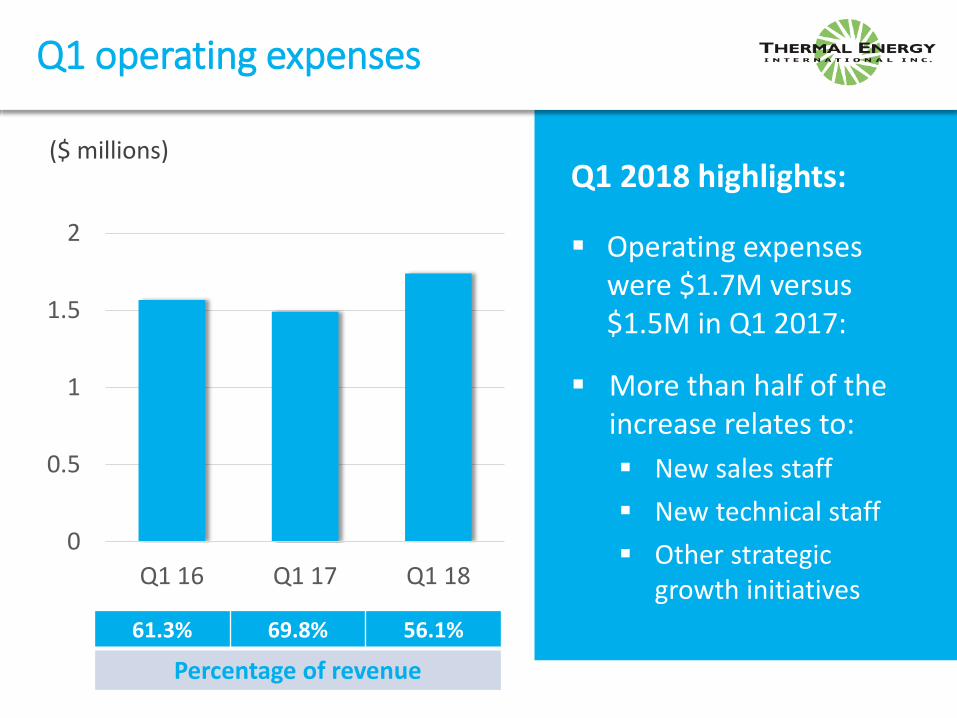
Q1 operating expenses
($ millions)
0
0.5
1
1.5
2
Q1 16 Q1 17 Q1 18
Q1 2018 highlights:
Operating expenses were $1.7M versus $1.5M in Q1 2017:
More than half of the increase relates to:
New sales staff
New technical staff
Other strategic growth initiatives
61.3% 69.8% 56.1%
Percentage of revenue

-500
-400
-300
-200
-100
0
100
EBITDAS Net loss
Q1 EBITDAS and net income
($ thousands)
Q1 16 Q1 17 Q1 18
Q1 2018 highlights:
Our second best Q1 EBITDAS in the past 5 years
EBITDAS lower mainly as a result of change in product mix and growth expenditures

Financial summary
Record revenue and gross profit for FY 2017 followed by record Q1 revenue and gross profit
L4Q revenue of $14.2 million compared to previous 4 quarters revenue of $12.0 million
Cash balance of $1.3 million
No debt

Order backlog & recent orders

Order backlog remains strong
At the time of first quarter reporting in October of each year
($ millions)
0
1
2
3
4
5
6
7
8
9
Q1 16 Q1 17 Q1 18
$7.8
Order backlog: The value of projects in respect of which purchase orders have been received but have not yet been reflected as revenue in the Company’s published quarterly financial statements.
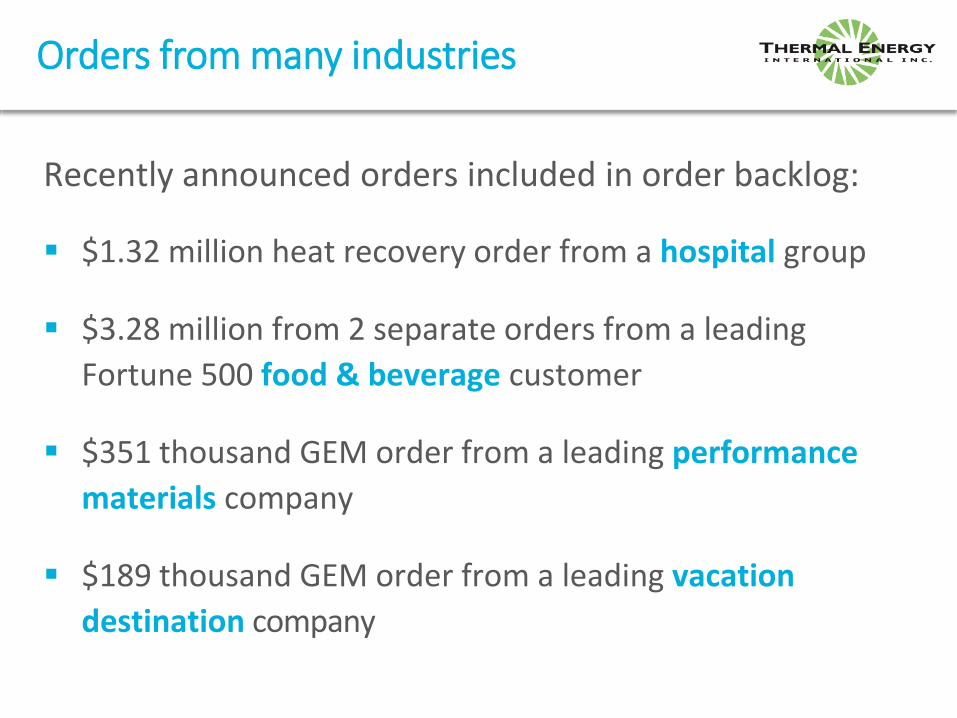
Recently announced orders included in order backlog:
$1.32 million heat recovery order from a hospital group
$3.28 million from 2 separate orders from a leading
Fortune 500 food & beverage customer
$351 thousand GEM order from a leading performance
materials company
$189 thousand GEM order from a leading vacation
destination company
Orders from many industries

Growth strategy & outlook
Corporate accounts
Sales tools & support
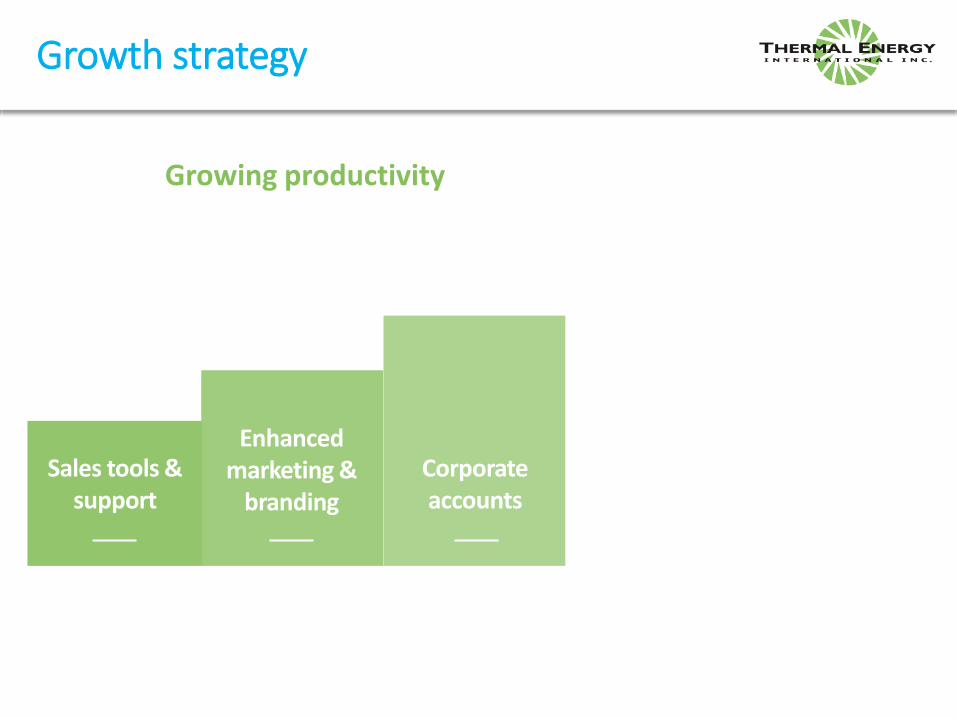
Growth strategy
Growing productivity
Grow organically and through accretive acquisitions
Enhanced marketing &
branding

Corporate accounts
New products
Sales tools & support
Growth strategy
Growing productivity Expanding the business
Grow organically and through accretive acquisitions
Growing our team & global
presence
Enhanced marketing &
branding

Corporate accounts
Growing our team & global
presenceNew
productsSales tools &
support
Growth strategy
Growing productivity Expanding the business
Grow organically and through accretive acquisitions
Enhanced marketing &
branding

Sales tools & support
Heat Recovery Analysis & Proposal Generator
Increases analysis and response speed
Screen out poor opportunities quicker
GEM data sizing data base
Online library of sales support resources, case studies, slide decks, product animations, technical FAQ
On-going and regular training
Fully open internal training program
Upgrading and enhancing CRM system

Sales tools & support – incentive funding
Creates compelling event, provides 3rd party validation, improves customer ROI
UK SALIX
NHS Efficiency fund
Wisconsin - Focus on Energy
California - PG&E
Quebec - BEIE
EU funding in Poland
Germany: KfW 294
OCE target GHG program.
UK Heat Recovery Fund
Canadian Clean Growth Program

Enhanced marketing and branding
Added a Sales & Marketing Coordinator (Ottawa) in May 2017
Hiring a Sales & Marketing Coordinator (UK) IN Jan/Feb 2018
New internal and new external newsletters a
Updated product brochures and case studies
Launched German website in October 2017
Goal: Better communications, better content, shared knowledge and a stronger brand internally and externally.
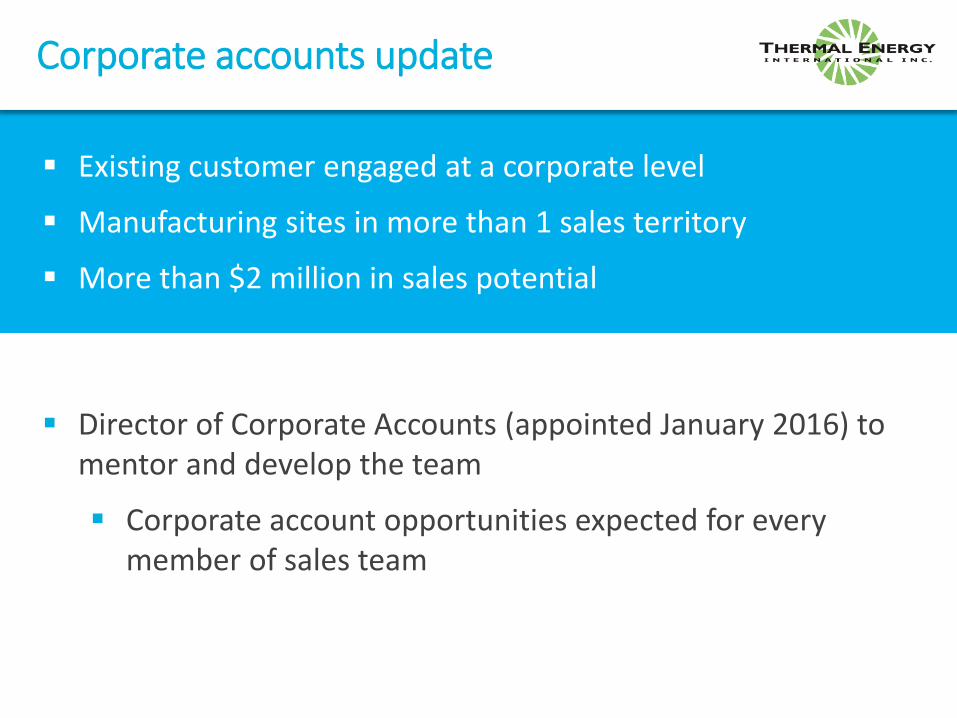
Corporate accounts update
Director of Corporate Accounts (appointed January 2016) to mentor and develop the team
Corporate account opportunities expected for every member of sales team
Existing customer engaged at a corporate level
Manufacturing sites in more than 1 sales territory
More than $2 million in sales potential

Corporate accounts update
Fortune 500 food &
beverage leader
Major hospital group #1
Leading performance materials co.
Major hospital group #2
Multinational agribusiness
company
Leading travel destination company
Global beer company
Leading food ingredients
business
Large pulp & paper customer
Fortune 500 life sciences company
Global building materials company
Multinational mining &
resources co.

Quebec (2014)
Midwest US (2014)
Southeast UK (2014)
Latin America (2016)
Ontario / CoGen (2016)
Germany (2017)
EU Sales Director (2017)
Engineering / CoGen (2016)
Senior engineering (2017)
Junior engineering X2 (2017)
Added:
Growing our team & global presence
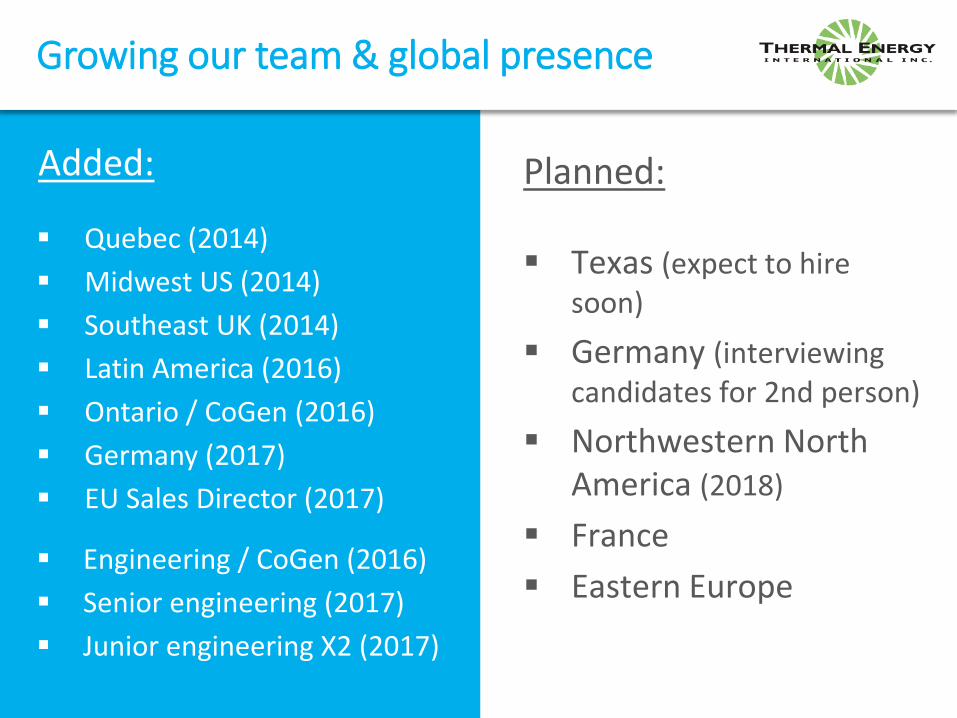
Quebec (2014)
Midwest US (2014)
Southeast UK (2014)
Latin America (2016)
Ontario / CoGen (2016)
Germany (2017)
EU Sales Director (2017)
Engineering / CoGen (2016)
Senior engineering (2017)
Junior engineering X2 (2017)
Added:
Growing our team & global presence
Texas (expect to hire soon)
Germany (interviewing candidates for 2nd person)
Northwestern North America (2018)
France
Eastern Europe
Planned:

Growing our team & global presence
Hired a European Sales Director in July 2017
20+ years of international sales experience (capital goods & services)
+10 years of sales management
Speaks 5 languages
Hired a Senior Project Engineer in October 2017
Former CTO at SofameTechnologies Inc.
Strengthens our engineering & product development capabilities
Experience with new products we are targeting

Support agents/distributors in secondary markets
Increase penetration in key strategic markets
Corporate / Sales Office EU Sales Director
Growing our team & global presence
* Company has engineering offices in Ottawa and Bristol (U.K.)
New Sales People / Territory
Agent / Distributor

Strategic territory expansion
Germany – Large industrial market with strong market fundamentals
High fuel costs
Aggressive carbon reduction targets
Attractive incentives
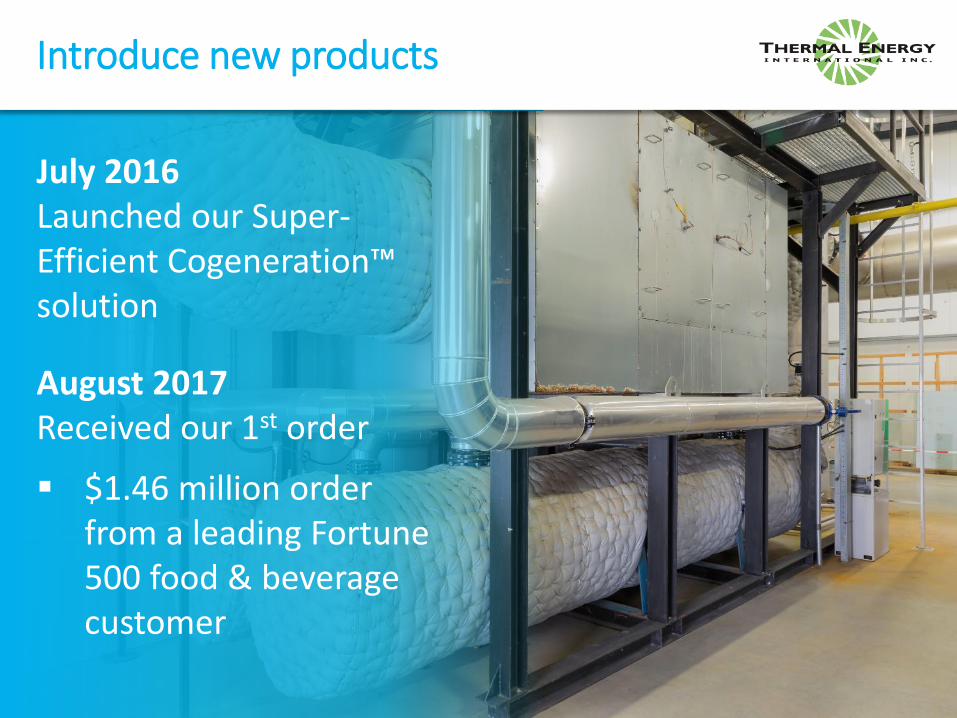
July 2016Launched our Super-Efficient Cogeneration™ solution
Introduce new products
August 2017Received our 1st order
$1.46 million order from a leading Fortune 500 food & beverage customer

Co-gen
First order received
Dry-Rex low-temp. biomass drying
Working with local customer to relocate BC based decommissioned Dry-Rex
Indirect heat recovery
Direct fired water heater (Percomax – Sofame)
Combined direct contact water heater and direct contact heat recovery (Hybrid Percomtherm – Sofame)
Wastewater heat recovery system (Launrec RBT – Sofame)
Combustion humidification unit to reduce NOx (Steam Pump – Sofame)
Introduce new products
Our long term track record

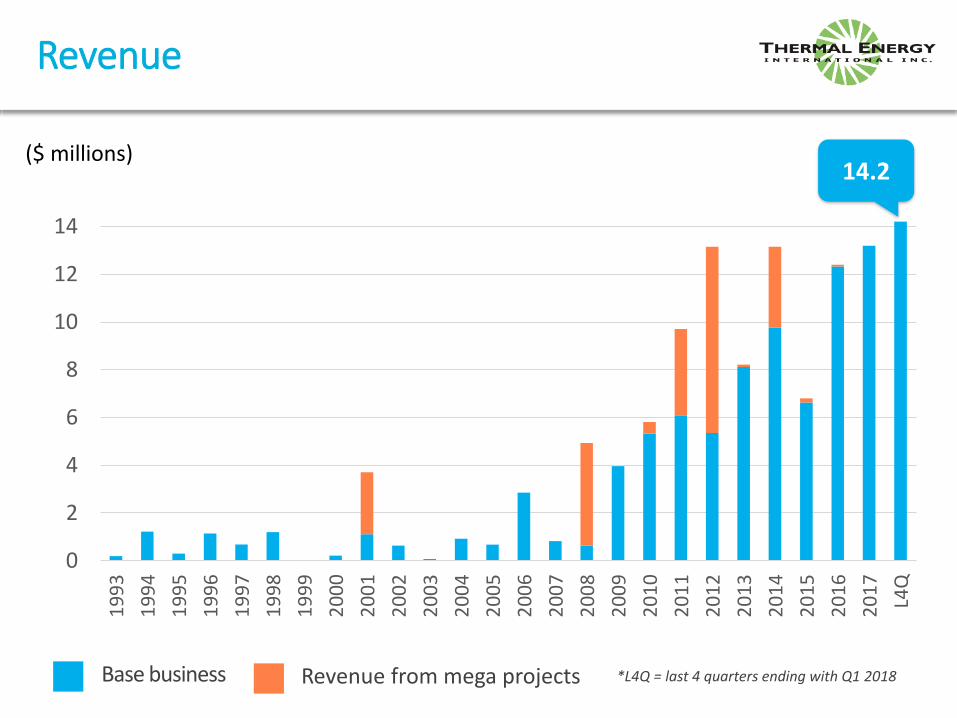
Base business Revenue from mega projects
($ millions)
0
2
4
6
8
10
12
14
19
93
19
94
19
95
19
96
19
97
19
98
19
99
20
00
20
01
20
02
20
03
20
04
20
05
20
06
20
07
20
08
20
09
20
10
20
11
20
12
20
13
20
14
20
15
20
16
20
17
L4Q
Revenue
Base business Revenue from mega projects
($ millions)
0
2
4
6
8
10
12
14
19
93
19
94
19
95
19
96
19
97
19
98
19
99
20
00
20
01
20
02
20
03
20
04
20
05
20
06
20
07
20
08
20
09
20
10
20
11
20
12
20
13
20
14
20
15
20
16
20
17
L4Q
*L4Q = last 4 quarters ending with Q1 2018
Revenue
14.2

Revenue –base business
0
2
4
6
8
10
12
14
2009 2010 2011 2012 2013 2014 2015 2016 2017 L4Q
($ m
illio
ns)
CAGR 20%CAGR 11%
CAGR 17%

Revenue
1993 – 2009
(17 years)
$23.5M
2010 – 2017
(8 years)
$82.4M
$105.9million
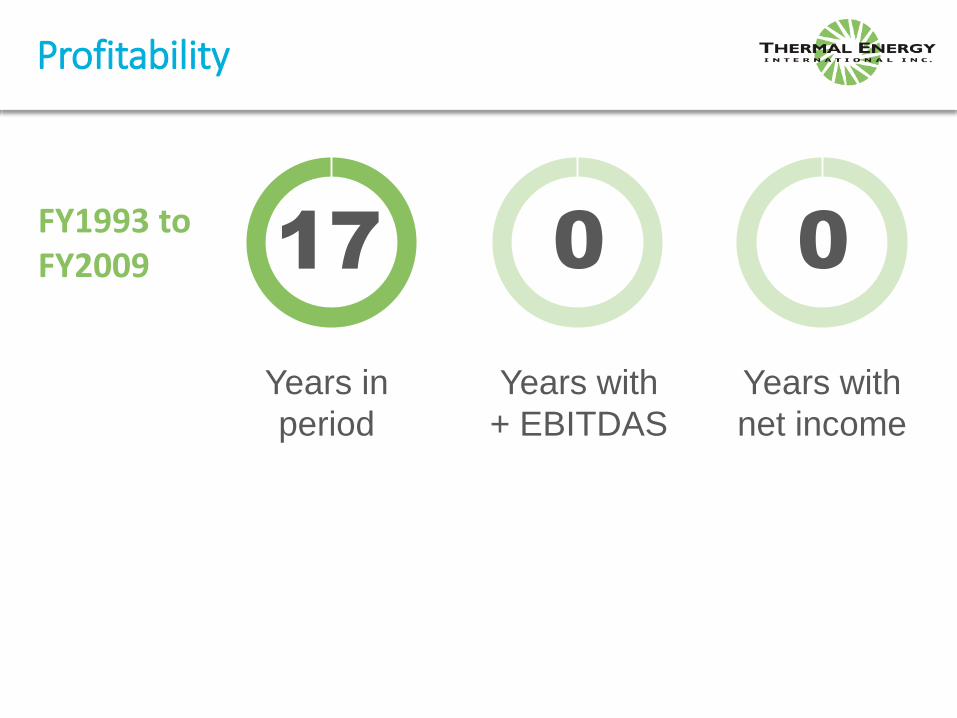
Profitability
Years in
period
Years with
net income
Years with
+ EBITDAS
17 00FY1993 to FY2009

Profitability
Years in
period
Years with
net income
Years with
+ EBITDAS
8 45
17 00FY1993 to FY2009
FY2010 to FY2017
Growing productivity
Sales tools & support
Enhanced marketing & branding
Corporate accounts
Expanding the business
Growing our team & global presence
New products
Grow organically
and/or through
accretive
acquisitions
Growth strategy summary
Strong market fundamentals, enormous growth potential

Like @GoThermalEnergy on Facebook
Follow @GoThermalEnergy on Twitter
Visit our website at www.thermalenergy.com

Falling natural gas prices
(USD/mmBTU)
Nov. 2017
June 2008