Financial Structures, Bank Lending Rates and Transmission Mechanism
Report on financial structures
October 2017

Report on financial structures, October 2017 1
Contents
Executive summary 2
1 The euro area financial sector – overview and interconnectedness 6
1.1 Structure of the euro area financial sector 6
1.2 The role of the euro area financial sector in financing non-financial corporations 9
1.3 Interconnectedness in the euro area financial sector 12
2 The euro area banking system 22
2.1 Structure of the euro area banking system 23
2.2 Structural developments in banking activity 32
3 Insurance corporations and pension funds 45
3.1 Structure of the insurance corporations and pension funds sector 45
Box 1 New quantitative information on insurance corporations and pension funds 49
3.2 Asset and liability structure 49
4 Other euro area non-bank financial entities 56
4.1 Developments in main aggregates 56
4.2 Asset and liability structure of other non-bank financial entities 59
Statistical annex 66
Abbreviations 86
Report on financial structures, October 2017 2
Executive summary
The ECB Report on financial structures (RFS) in the euro area reviews the main structural features of and developments in the broader euro area financial sector. The RFS has a clear structural focus, serving as a complement to the semi-annual ECB Financial Stability Review (FSR), which focuses more on cyclical factors.1
The RFS covers the banking sector (monetary financial institutions, or MFIs), insurance corporations and pension funds (ICPFs) and other financial intermediaries (OFIs). Parts of the OFI sector have grown substantially over the past decade and sometimes perform bank-like functions. This calls for a more holistic approach to the structure of the euro area financial sector going forward.2
Chapter 1 presents the evolution of the overall structure and composition of the financial sector. It also discusses its role in financing non-financial corporations (NFCs) and analyses interconnectedness across different parts of the financial sector in order to assess possible structural risks to financial stability.
The analysis shows that the size of the euro area financial sector relative to GDP increased between 2008 and 2016 (from 5.3 to about 6.4 times GDP), although the ratio remained broadly unchanged in 2016 compared with the previous year. It also highlights that the relative importance of non-banks (ICPFs, MMFs and OFIs) in the euro area financial sector has grown steadily since the onset of the financial crisis, in particular on the back of the significant expansion of the OFI sector, but this trend appears to have paused recently. In terms of total assets, the share of the non-bank financial sector increased from 43% in 2008 to 55% in early 2017. A corresponding decline initially took place in the share of monetary financial institutions (MFIs), but that trend came to a halt recently, with the share of MFI total assets (excluding MMFs) remaining broadly unchanged, at around 45%, in 2016 and early 2017.
Turning to interconnectedness, Chapter 1 also looks at direct exposures between various parts of the euro area financial sector by instrument type. MFIs remain the largest lenders, followed by OFIs. MFIs are also the largest borrower sector. Meanwhile, for debt securities issued by financial institutions, MFIs are both the largest holders and the largest issuers. Looking at investment fund shares, ICPFs and OFIs are the largest holders, while OFIs are the major issuers of this instrument.
As regards the largest cross-border exposures of MFIs, euro area MFIs are mostly exposed to counterparty MFIs located in Germany, France and – outside the euro area – the United Kingdom. Looking at common exposures, MFIs in the largest economies are particularly exposed to long-term debt, often issued domestically. In
1 The RFS focuses on euro area/Single Supervisory Mechanism (SSM) countries. However, the report
may contain occasional references to the financial sectors of other EU countries. 2 The period covered in the report is not uniform. As regards MFIs, the period covered is 2008-16, with
special attention being paid to changes that have occurred since 2015. As regards ICPFs and OFIs, the availability of data is more heterogeneous and generally more limited than for the banking sector.
Report on financial structures, October 2017 3
countries with a significant OFI sector, the largest exposures are concentrated mainly in domestic investment fund shares.
Chapter 2 of the report presents structural developments in the euro area banking sector, providing a wide set of structural information from both a cross-sectional perspective (i.e. different banking types, business models, etc.) and a time perspective.
Section 2.1 reviews developments in the market structure of the euro area banking system, i.e. the capacity, consolidation and concentration of the banking sector over time. In 2016 the euro area banking sector continued its rationalisation process, driven by continued pressure to restructure and to contain costs. This process resulted in a further reduction in the total number of credit institutions in the euro area to 5,073 in 2016 (down from 5,474 in 2015 and 6,768 in 2008). The concentration of banking markets continued to decrease from its historical high reached at the end of 2014, with the share of total assets held by the five largest credit institutions standing at 47.7% in 2016 compared with 48.4% in 2014. The trend varied across individual countries, as concentration increased in countries undergoing deep banking sector restructuring and in some smaller economies. The rationalisation and resizing process within the euro area banking system suggests that the overall efficiency of the system continues to improve. The trend in mergers and acquisitions (M&A) activity has been declining in recent years, both in terms of the number and the total value of transactions. In 2016, total transaction value was the lowest since 2000. However, in the first half of 2017 the value of M&A activity picked up.
Section 2.2 reviews changes in the balance sheet structure, financial performance, capital position and leverage of the euro area banking sector during the period from 2008 to 2016. The total consolidated assets of euro area domestic banks stood at €24.2 trillion at the end of 2016, a decline of 14% compared with 2008. Lending by the euro area banking system as a whole grew at a moderate pace in 2016, although there was a high degree of heterogeneity across jurisdictions. On the liabilities side, the trend towards greater reliance on deposit funding gained traction in 2016, as the median share of customer deposits increased by 7 percentage points to 52%. By contrast, the trend in wholesale funding, which had been declining since the financial crisis, levelled off in 2016. Central bank funding, while remaining stable in the median, decreased significantly in the banking sectors that were most reliant on it.
Meanwhile, in 2016 the regulatory capital ratios of euro area banks continued to increase, mainly on account of capital increases. More specifically, the median Tier 1 ratio stood at 16.1% in 2016, while the median phased-in Common Equity Tier 1 (CET1) ratio was 15.4%. In addition, the euro area banking sector continued to reduce its leverage. Taken together, these developments indicate a continuing trend towards a more traditional banking business model for euro area banks. The legacy of the crisis is still visible in structural deficiencies. Although the median non-performing loan (NPL) ratio continued to decline in 2016, NPLs remain persistently high in a number of countries and have increased further in some cases. This highlights the need to further address the problem in order to free up bank capital, facilitate credit growth and support economic recovery.
Report on financial structures, October 2017 4
The profitability of the euro area banking sector remained relatively low in 2016 as structural inefficiencies continued to hamper profitability in many countries. The median cost/income ratio remained relatively stable at 58% in 2016, indicating only limited progress in the effort to improve cost efficiency. Although high cost/income ratios in some of the largest countries can be explained in part by the presence of banks that are particularly active in trading and capital markets, they are also related to the relatively high level of fragmentation of individual countries’ banking sectors. Efficiency indicators deteriorated the most for medium-sized banks, for which the cost/income ratio increased to 65% in 2016 from 61% in the previous year.
Chapter 3 discusses structural developments in euro area insurance corporations and pension funds. In 2016 the assets of euro area ICPFs continued to grow, reaching €10.2 trillion at the end of the year. The sector remained strongly concentrated in a relatively small number of countries. France and Germany each account for more than a quarter of the euro area ICPF sector, followed by the Netherlands (18%) and Italy (10%).
In the current low-yield environment, ICPFs in some jurisdictions have been shifting their portfolios towards higher-yielding assets to boost investment income. For instance, the share of currency and deposits in the ICPF portfolio declined in 2016 at the fastest pace since 2008 – from 8.3% at the end of 2015 to 7.2% at the end of 2016. In addition, life insurance business has gradually shifted away from policies with guaranteed rates of return (non-unit-linked policies) towards unit-linked policies. The profitability of the insurance sector, and in particular the life insurance sector, has been constrained in recent years by the low-yield environment despite the more supportive recent macroeconomic and financial developments. However, the solvency position of the insurance sector is well above the requirements of the EU’s supervisory regime for insurance companies (Solvency II). At end-2016, the median Solvency Capital Requirement (SCR) ratio stood at about 188% for the insurance groups in our sample.
Chapter 4 reviews the structural features of the euro area non-bank financial sector, including all other financial intermediaries except ICPFs. Structural features of different parts of the non-bank financial sector are outlined in more detail, namely for non-money market investment funds (non-MMFs), money market funds (MMFs) and financial vehicle corporations (FVCs).
The non-bank financial sector (excluding ICPFs) expanded in 2016, following a period of stagnation in 2015. In March 2017, this sector comprised €32.4 trillion of total assets. Since December 2008 – when it comprised €17.7 trillion of assets – the sector has expanded by more than 80%. Growth in the (non-MMF) investment fund sector, underpinning much of the expansion of the non-bank financial sector since the global financial crisis, continued its secular growth trend in 2016, which was mainly driven by net inflows and rising asset valuations. Total assets in the investment fund sector went up by 7% in 2016 and have thus increased by approximately 160% since 2008. Despite the low returns offered in money markets, euro area MMFs have been able to attract net inflows from both domestic and foreign investors and have now expanded for three years in a row. Total assets in the MMF sector have increased by an average of 15% per year since the end of 2013,

Report on financial structures, October 2017 5
when they reached a trough. Total assets held by euro area FVCs continued to decline slightly throughout most of 2016 owing to protracted weak securitisation activity by euro area credit institutions. In the last quarter of 2016, securitisation picked up, albeit moderately. Total assets of the remaining non-bank financial sector, for which a breakdown by type of entity is not available, also expanded moderately in 2016. This sector comprises more than 50% of the assets held by financial institutions in the euro area, which are often linked to funding activities of non-financial corporations. The sector is concentrated in a few euro area countries.

Report on financial structures, October 2017 6
1 The euro area financial sector – overview and interconnectedness
This chapter presents the evolution of the overall structure of the euro area financial sector, discusses its role in financing non-financial corporations and analyses interconnectedness across different parts of the financial sector to assess possible structural risks to financial stability. Given the limitations in data availability, the chapter focuses mainly on developments since 2014. Whenever possible, it also looks at developments since 2008.
Since the global financial crisis, the main development in the overall structure of the euro area financial sector has been the growth in the relative importance of the non-bank financial sector (ICPFs, MMFs and OFIs), particularly on the back of the significant expansion of the OFI sector. The share of non-banks’ total assets increased from 43% in 2008 to 55% in early 2017. There was also a corresponding decline in the share of MFIs, but that trend came to a halt recently, with the share of MFI total assets (excluding MMFs) remaining broadly unchanged, at around 45%, in 2016 and early 2017. As regards financing provided to NFCs by the euro area financial sector, in 2016 MFIs provided 71% of the loans, while ICPFs and IFs held 40% and 35% of debt securities respectively.
Looking at direct exposures between various parts of the euro area financial sector, MFIs continue to be the largest provider of loans, followed by OFIs, while MFIs also represent the largest borrower sector. For debt securities, MFIs are both the largest holder sector and the largest issuer sector. The analysis of cross-border exposures reveals that euro area MFIs are mostly exposed to MFIs located in Germany, France and the United Kingdom. Meanwhile, looking at common exposures, the figures show that domestic long-term debt represents the most significant exposure of banks in the largest economies.
1.1 Structure of the euro area financial sector
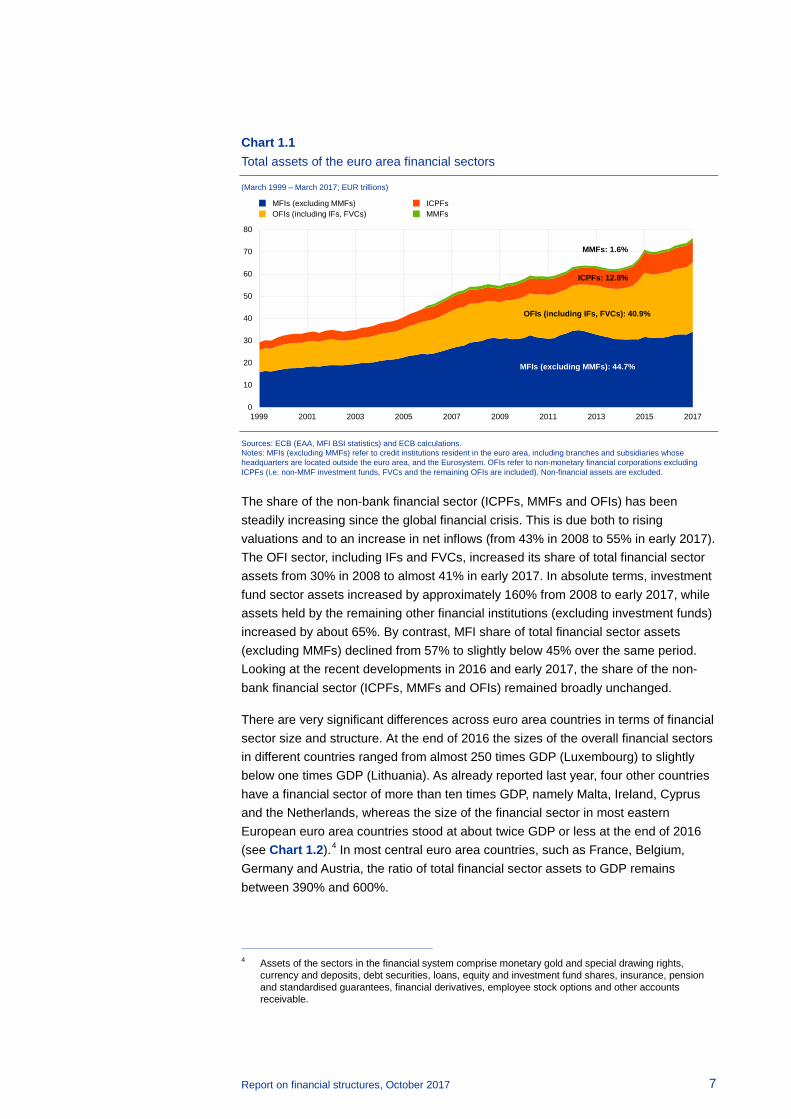
In March 2017, the size of the overall euro area financial sector (financial assets held by MFIs, MMFs, ICPFs and OFIs) stood at about €76.2 trillion, compared with €70.8 trillion in December 2015 and €55.0 trillion in December 2008 (see Chart 1.1).3 The largest share of assets was held by MFIs (44.7% of the total), followed by OFIs (40.9%). Among OFIs, IFs and the remaining other financial institutions continued to hold the bulk of total financial sector assets (14.1% and 24.4% respectively), whereas FVCs held a comparatively small share (2.4%).
3 The OFI sector in this subsection comprises non-MMF IFs, FVCs and the remaining other financial
institutions for which a detailed statistical breakdown is not readily available. See the discussion in Chapter 4 for more details regarding the different definitions of the non-bank sector. Data revisions may result in slightly different figures compared with last year’s report.
Report on financial structures, October 2017 7
Chart 1.1 Total assets of the euro area financial sectors
(March 1999 – March 2017; EUR trillions)
Sources: ECB (EAA, MFI BSI statistics) and ECB calculations. Notes: MFIs (excluding MMFs) refer to credit institutions resident in the euro area, including branches and subsidiaries whose headquarters are located outside the euro area, and the Eurosystem. OFIs refer to non-monetary financial corporations excluding ICPFs (i.e. non-MMF investment funds, FVCs and the remaining OFIs are included). Non-financial assets are excluded.
The share of the non-bank financial sector (ICPFs, MMFs and OFIs) has been steadily increasing since the global financial crisis. This is due both to rising valuations and to an increase in net inflows (from 43% in 2008 to 55% in early 2017). The OFI sector, including IFs and FVCs, increased its share of total financial sector assets from 30% in 2008 to almost 41% in early 2017. In absolute terms, investment fund sector assets increased by approximately 160% from 2008 to early 2017, while assets held by the remaining other financial institutions (excluding investment funds) increased by about 65%. By contrast, MFI share of total financial sector assets (excluding MMFs) declined from 57% to slightly below 45% over the same period. Looking at the recent developments in 2016 and early 2017, the share of the non-bank financial sector (ICPFs, MMFs and OFIs) remained broadly unchanged.
There are very significant differences across euro area countries in terms of financial sector size and structure. At the end of 2016 the sizes of the overall financial sectors in different countries ranged from almost 250 times GDP (Luxembourg) to slightly below one times GDP (Lithuania). As already reported last year, four other countries have a financial sector of more than ten times GDP, namely Malta, Ireland, Cyprus and the Netherlands, whereas the size of the financial sector in most eastern European euro area countries stood at about twice GDP or less at the end of 2016 (see Chart 1.2).4 In most central euro area countries, such as France, Belgium, Germany and Austria, the ratio of total financial sector assets to GDP remains between 390% and 600%.
4 Assets of the sectors in the financial system comprise monetary gold and special drawing rights,
currency and deposits, debt securities, loans, equity and investment fund shares, insurance, pension and standardised guarantees, financial derivatives, employee stock options and other accounts receivable.
0
10
20
30
40
50
60
70
80
1999 2001 2003 2005 2007 2009 2011 2013 2015 2017
OFIs (including IFs, FVCs): 40.9%
ICPFs: 12.8%
MMFs: 1.6%
MFIs (excluding MMFs): 44.7%
MFIs (excluding MMFs)OFIs (including IFs, FVCs)
ICPFsMMFs
Report on financial structures, October 2017 8
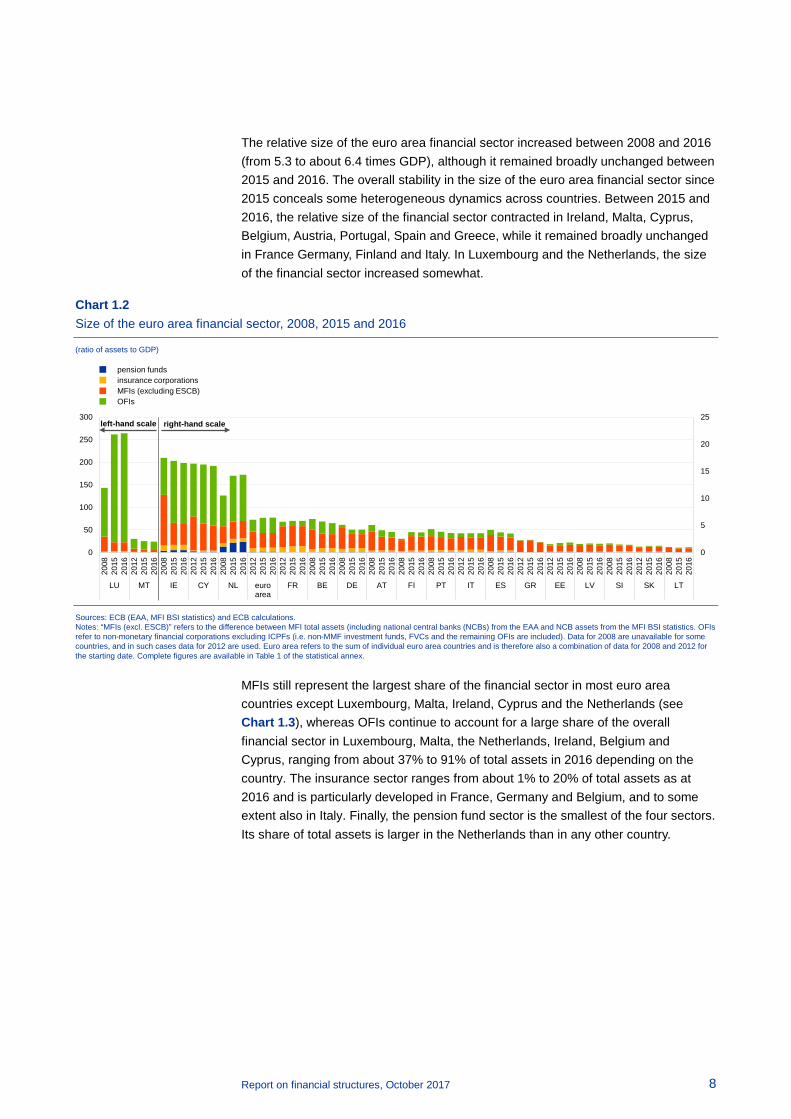
The relative size of the euro area financial sector increased between 2008 and 2016 (from 5.3 to about 6.4 times GDP), although it remained broadly unchanged between 2015 and 2016. The overall stability in the size of the euro area financial sector since 2015 conceals some heterogeneous dynamics across countries. Between 2015 and 2016, the relative size of the financial sector contracted in Ireland, Malta, Cyprus, Belgium, Austria, Portugal, Spain and Greece, while it remained broadly unchanged in France Germany, Finland and Italy. In Luxembourg and the Netherlands, the size of the financial sector increased somewhat.
Chart 1.2 Size of the euro area financial sector, 2008, 2015 and 2016
(ratio of assets to GDP)
Sources: ECB (EAA, MFI BSI statistics) and ECB calculations. Notes: “MFIs (excl. ESCB)” refers to the difference between MFI total assets (including national central banks (NCBs) from the EAA and NCB assets from the MFI BSI statistics. OFIs refer to non-monetary financial corporations excluding ICPFs (i.e. non-MMF investment funds, FVCs and the remaining OFIs are included). Data for 2008 are unavailable for some countries, and in such cases data for 2012 are used. Euro area refers to the sum of individual euro area countries and is therefore also a combination of data for 2008 and 2012 for the starting date. Complete figures are available in Table 1 of the statistical annex.
MFIs still represent the largest share of the financial sector in most euro area countries except Luxembourg, Malta, Ireland, Cyprus and the Netherlands (see Chart 1.3), whereas OFIs continue to account for a large share of the overall financial sector in Luxembourg, Malta, the Netherlands, Ireland, Belgium and Cyprus, ranging from about 37% to 91% of total assets in 2016 depending on the country. The insurance sector ranges from about 1% to 20% of total assets as at 2016 and is particularly developed in France, Germany and Belgium, and to some extent also in Italy. Finally, the pension fund sector is the smallest of the four sectors. Its share of total assets is larger in the Netherlands than in any other country.
0
5
10
15
20
25
0
50
100
150
200
250
300
2008
2015
2016
2012
2015
2016
2008
2015
2016
2012
2015
2016
2008
2015
2016
2012
2015
2016
2012
2015
2016
2008
2015
2016
2008
2015
2016
2008
2015
2016
2008
2015
2016
2008
2015
2016
2012
2015
2016
2008
2015
2016
2012
2015
2016
2012
2015
2016
2008
2015
2016
2008
2015
2016
2012
2015
2016
2008
2015
2016
LU MT IE CY NL euroarea
FR BE DE AT FI PT IT ES GR EE LV SI SK LT
right-hand scaleleft-hand scale
pension fundsinsurance corporationsMFIs (excluding ESCB)OFIs

Report on financial structures, October 2017 9
Chart 1.3 Composition of the euro area financial sector, 2008, 2015 and 2016
(percentage of total assets of the financial sector)
Sources: ECB (EAA, MFI BSI statistics) and ECB calculations. Notes: “MFIs (excl. ESCB)” refers to the difference between MFI total assets (including NCBs) from the EAA and NCB assets from the MFI BSI statistics. OFIs refer to non-monetary financial corporations excluding ICPFs (i.e. non-MMF investment funds, FVCs and the remaining OFIs are included). Data for 2008 are unavailable for some countries. In such cases data for 2012 are used instead. Euro area refers to the sum of individual euro area countries and is therefore also a combination of data for 2008 and 2012 for the starting date.
At the euro area level, the share of MFIs fell in favour of OFIs between 2008 and 2016. This change in composition was particularly marked in the case of Luxembourg and also in the case of Ireland. The composition of the overall euro area financial sector remained fairly stable between 2015 and 2016.
1.2 The role of the euro area financial sector in financing non-financial corporations
This section looks at the financing of non-financial corporations (NFCs) by different segments of the overall euro area financial system, both for the euro area as a whole and across euro area countries.
Chart 1.4 shows the flows of total external financing to euro area NFCs and its components over time. MFI loans accounted for about half of the external financing provided to euro area NFCs before the crisis, with the rest stemming mainly from the issuance of unlisted shares but also from loans by non-MFIs and trade credit. During and in the aftermath of the crisis, the net flow of loans provided by MFIs to NFCs tended to contract and turned negative in some years. In 2016 the net flow of MFI loans to NFCs turned positive again. The flow of finance from other sources (issuance of listed and unlisted shares and debt securities) remained positive throughout the crisis period and afterwards. The provision of other forms of funding helped to finance the euro area economy during this period.
0%
10%
20%
30%
40%
50%
60%
70%
80%
90%
100%
2008
2015
2016
2008
2015
2016
2012
2015
2016
2008
2015
2016
2012
2015
2016
2008
2015
2016
2008
2015
2016
2012
2015
2016
2012
2015
2016
2008
2015
2016
2012
2015
2016
2008
2015
2016
2008
2015
2016
2008
2015
2016
2012
2015
2016
2008
2015
2016
2008
2015
2016
2008
2015
2016
2012
2015
2016
2012
2015
2016
AT BE CY DE EE ES FI FR GR IE IT LT LU LV MT NL PT SI SK euroarea
pension fundsinsurance corporations
MFIs (excluding ESCB)OFIs

Report on financial structures, October 2017 10
Chart 1.4 Sources of external financing provided to euro area NFCs by component
(annual flows; EUR billions)
Sources: ECB (EAA) and ECB calculations.
Chart 1.5 shows the structure of financing provided by the overall euro area financial sector to NFCs for three instruments (loans, debt securities and listed shares), their share relative to GDP and the share of these instruments with respect to the total stocks outstanding.
Chart 1.5 Financing provided by the overall euro area financial sector to NFCs by instrument
(percentage based on stocks at the end of the period)
Sources: ECB (EAA) and ECB calculations. Notes: Total financing received by NFCs includes inter-company loans and holdings of debt securities and listed shares. OFIs refer to non-monetary financial corporations excluding ICPFs and non-MMF investment funds (i.e. FVCs and the remaining OFIs are included).
First, the chart shows that financing provided by the overall euro area financial sector in 2016 accounted for slightly more than 70% of the stock of debt securities issued by NFCs and that this share has increased slightly in recent years. The shares for
-600
-400
-200
0
200
400
600
800
1,000
1,200
1,400
1,600
2007 2008 2009 2010 2011 2012 2013 2014 2015 2016
total external financingMFI loansdebt securitieslisted sharesloans from non-MFIs
loans from rest of the worldunlisted shares and other equitytrade creditother
0%
10%
20%
30%
40%
50%
60%
70%
80%
90%
100%
2013 2014 2015 2016 2013 2014 2015 2016 2013 2014 2015 2016
loans debt securities listed shares
MFIsOFIs excluding non-MMF IFsICPFsIFspercentage share of total financing received by NFCs by instrumentpercentage of nominal GDP by instrument
Report on financial structures, October 2017 11
loans and listed shares stood at about 56% and 27% respectively in 2016, with a slight downward trend for loans.5 6
Second, loans are the most important instrument provided by the overall financial sector, accounting for about 52% of euro area GDP in 2016 with few changes over time. Listed shares accounted for about 13% of GDP and have slowly increased since 2013, while securities represented about 9% in 2016, also with some increase over time.
Third, most of the loans provided in 2016 by the overall financial sector were provided by MFIs (about 71%), although this share is slowly declining, followed by OFIs excluding non-MMF investment funds (slowly increasing to about 28% in 2016). ICPFs held around 40% of debt securities, followed by investment funds (IFs), which held around 35%. MFIs held about 20% of debt securities. Changes in the composition over time are relatively minor. IFs held the largest part of listed shares in 2016 (about 60%), followed by OFIs excluding non-MMF investment funds (about 18%). Since 2013, the percentages of listed shares held by IFs and OFIs have varied somewhat, and there has been a decline in the percentage held by MFIs.
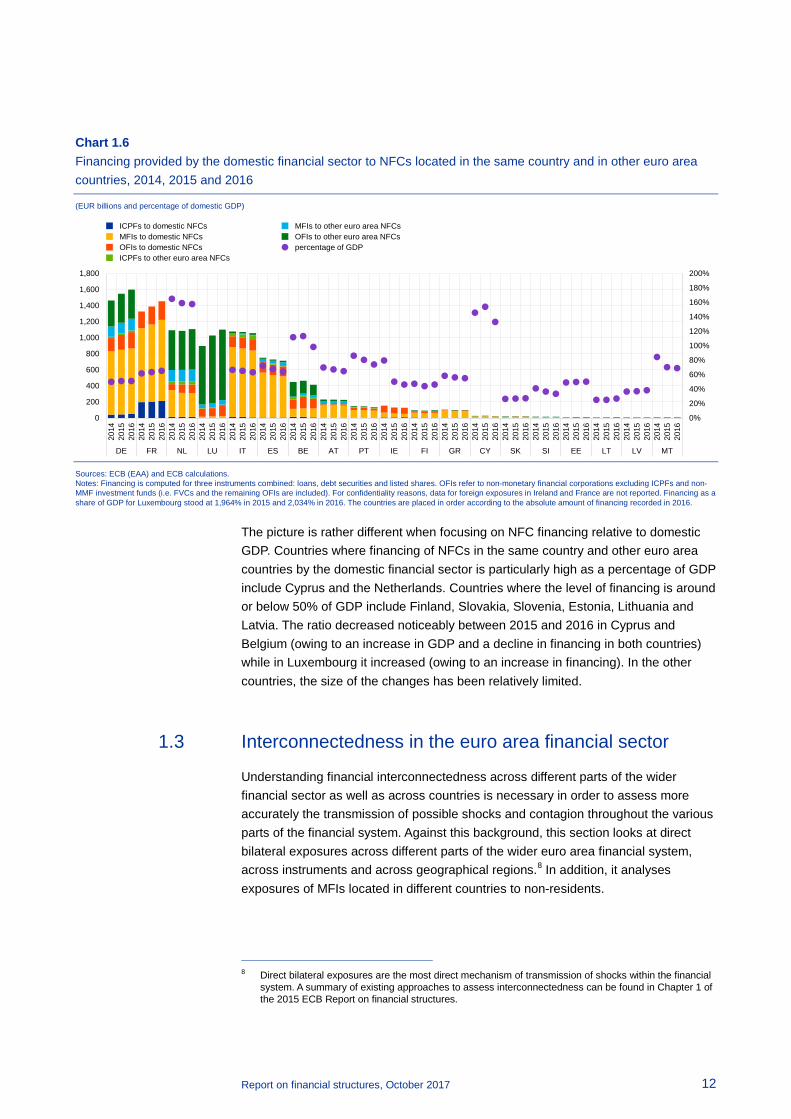
Taking a cross-country perspective, Chart 1.6 reports the total financing provided by the domestic financial sector to NFCs located in the same country and in other euro area countries.7 Reflecting the absolute size of their economies and financial sectors, the largest absolute amounts are recorded in France, Germany, Luxembourg, Italy, the Netherlands and Spain, with noticeable increases observed between 2015 and 2016 in France, Germany, Luxembourg and the Netherlands (increases ranging between about 3.5% and 7.5%). Small decreases were observed in Spain and Italy (-2% and -0.8% respectively).
In most euro area countries, the largest share of NFC financing is provided to domestic NFCs, mainly by MFIs, although domestic OFIs play an important role in Belgium, Ireland and Luxembourg (between 47% and 86% of the financing provided to domestic NFCs in 2016). Countries where the domestic financial sector is active in financing NFCs located in other euro area countries include Luxembourg, the Netherlands and Belgium (accounting for between 44% and 85% of the total financing provided to NFCs). In these cases, most of the financing to foreign NFCs is provided by OFIs.
5 Total financing received by NFCs includes inter-company loans and holdings of debt securities and
listed shares. 6 “Who-to-whom” data for debt securities and listed shares are unavailable before 2013. 7 Data on the financing provided by the domestic financial sector to NFCs located in the same country
and in other euro area countries are not available for the period before 2014.
Report on financial structures, October 2017 12
Chart 1.6 Financing provided by the domestic financial sector to NFCs located in the same country and in other euro area countries, 2014, 2015 and 2016
(EUR billions and percentage of domestic GDP)
Sources: ECB (EAA) and ECB calculations. Notes: Financing is computed for three instruments combined: loans, debt securities and listed shares. OFIs refer to non-monetary financial corporations excluding ICPFs and non-MMF investment funds (i.e. FVCs and the remaining OFIs are included). For confidentiality reasons, data for foreign exposures in Ireland and France are not reported. Financing as a share of GDP for Luxembourg stood at 1,964% in 2015 and 2,034% in 2016. The countries are placed in order according to the absolute amount of financing recorded in 2016.
The picture is rather different when focusing on NFC financing relative to domestic GDP. Countries where financing of NFCs in the same country and other euro area countries by the domestic financial sector is particularly high as a percentage of GDP include Cyprus and the Netherlands. Countries where the level of financing is around or below 50% of GDP include Finland, Slovakia, Slovenia, Estonia, Lithuania and Latvia. The ratio decreased noticeably between 2015 and 2016 in Cyprus and Belgium (owing to an increase in GDP and a decline in financing in both countries) while in Luxembourg it increased (owing to an increase in financing). In the other countries, the size of the changes has been relatively limited.
1.3 Interconnectedness in the euro area financial sector
Understanding financial interconnectedness across different parts of the wider financial sector as well as across countries is necessary in order to assess more accurately the transmission of possible shocks and contagion throughout the various parts of the financial system. Against this background, this section looks at direct bilateral exposures across different parts of the wider euro area financial system, across instruments and across geographical regions.8 In addition, it analyses exposures of MFIs located in different countries to non-residents.
8 Direct bilateral exposures are the most direct mechanism of transmission of shocks within the financial
system. A summary of existing approaches to assess interconnectedness can be found in Chapter 1 of the 2015 ECB Report on financial structures.
0%
20%
40%
60%
80%
100%
120%
140%
160%
180%
200%
0
200
400
600
800
1,000
1,200
1,400
1,600
1,800
2014
2015
2016
2014
2015
2016
2014
2015
2016
2014
2015
2016
2014
2015
2016
2014
2015
2016
2014
2015
2016
2014
2015
2016
2014
2015
2016
2014
2015
2016
2014
2015
2016
2014
2015
2016
2014
2015
2016
2014
2015
2016
2014
2015
2016
2014
2015
2016
2014
2015
2016
2014
2015
2016
2014
2015
2016
DE FR NL LU IT ES BE AT PT IE FI GR CY SK SI EE LT LV MT
ICPFs to domestic NFCsMFIs to domestic NFCsOFIs to domestic NFCsICPFs to other euro area NFCs
MFIs to other euro area NFCsOFIs to other euro area NFCspercentage of GDP
Report on financial structures, October 2017 13
1.3.1 Interconnectedness among sectors of the wider financial system
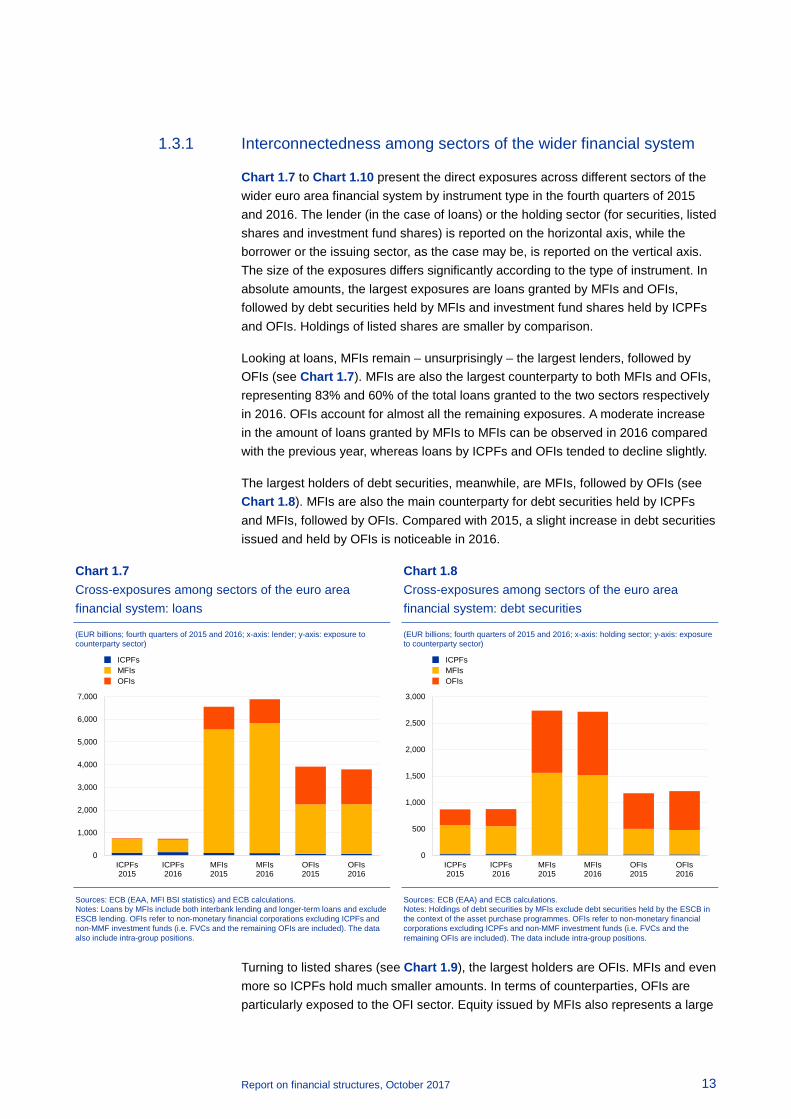
Chart 1.7 to Chart 1.10 present the direct exposures across different sectors of the wider euro area financial system by instrument type in the fourth quarters of 2015 and 2016. The lender (in the case of loans) or the holding sector (for securities, listed shares and investment fund shares) is reported on the horizontal axis, while the borrower or the issuing sector, as the case may be, is reported on the vertical axis. The size of the exposures differs significantly according to the type of instrument. In absolute amounts, the largest exposures are loans granted by MFIs and OFIs, followed by debt securities held by MFIs and investment fund shares held by ICPFs and OFIs. Holdings of listed shares are smaller by comparison.
Looking at loans, MFIs remain – unsurprisingly – the largest lenders, followed by OFIs (see Chart 1.7). MFIs are also the largest counterparty to both MFIs and OFIs, representing 83% and 60% of the total loans granted to the two sectors respectively in 2016. OFIs account for almost all the remaining exposures. A moderate increase in the amount of loans granted by MFIs to MFIs can be observed in 2016 compared with the previous year, whereas loans by ICPFs and OFIs tended to decline slightly.
The largest holders of debt securities, meanwhile, are MFIs, followed by OFIs (see Chart 1.8). MFIs are also the main counterparty for debt securities held by ICPFs and MFIs, followed by OFIs. Compared with 2015, a slight increase in debt securities issued and held by OFIs is noticeable in 2016.
Chart 1.8 Cross-exposures among sectors of the euro area financial system: debt securities
(EUR billions; fourth quarters of 2015 and 2016; x-axis: holding sector; y-axis: exposure to counterparty sector)
Sources: ECB (EAA) and ECB calculations. Notes: Holdings of debt securities by MFIs exclude debt securities held by the ESCB in the context of the asset purchase programmes. OFIs refer to non-monetary financial corporations excluding ICPFs and non-MMF investment funds (i.e. FVCs and the remaining OFIs are included). The data include intra-group positions.
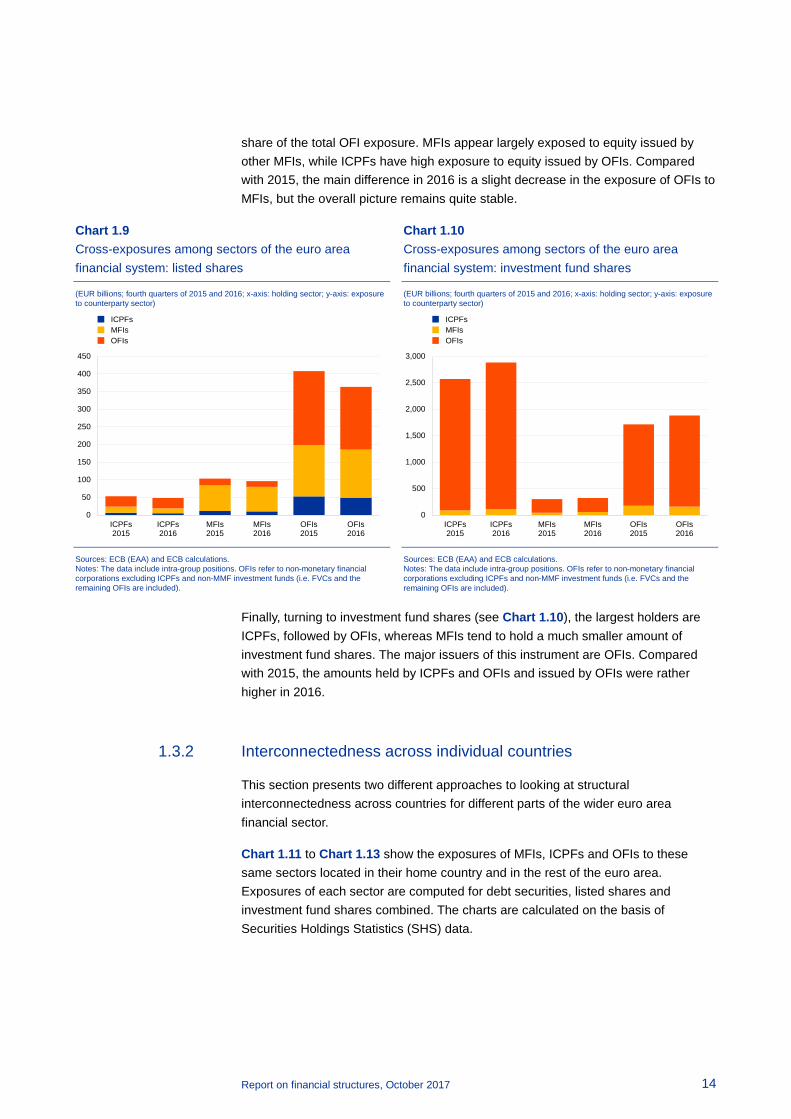
Turning to listed shares (see Chart 1.9), the largest holders are OFIs. MFIs and even more so ICPFs hold much smaller amounts. In terms of counterparties, OFIs are particularly exposed to the OFI sector. Equity issued by MFIs also represents a large
0
500
1,000
1,500
2,000
2,500
3,000
ICPFs2015
ICPFs2016
MFIs2015
MFIs2016
OFIs2015
OFIs2016
ICPFsMFIsOFIs
Chart 1.7 Cross-exposures among sectors of the euro area financial system: loans
(EUR billions; fourth quarters of 2015 and 2016; x-axis: lender; y-axis: exposure to counterparty sector)
Sources: ECB (EAA, MFI BSI statistics) and ECB calculations. Notes: Loans by MFIs include both interbank lending and longer-term loans and exclude ESCB lending. OFIs refer to non-monetary financial corporations excluding ICPFs and non-MMF investment funds (i.e. FVCs and the remaining OFIs are included). The data also include intra-group positions.
0
1,000
2,000
3,000
4,000
5,000
6,000
7,000
ICPFs2015
ICPFs2016
MFIs2015
MFIs2016
OFIs2015
OFIs2016
ICPFsMFIsOFIs
Report on financial structures, October 2017 14
share of the total OFI exposure. MFIs appear largely exposed to equity issued by other MFIs, while ICPFs have high exposure to equity issued by OFIs. Compared with 2015, the main difference in 2016 is a slight decrease in the exposure of OFIs to MFIs, but the overall picture remains quite stable.
Chart 1.10 Cross-exposures among sectors of the euro area financial system: investment fund shares
(EUR billions; fourth quarters of 2015 and 2016; x-axis: holding sector; y-axis: exposure to counterparty sector)
Sources: ECB (EAA) and ECB calculations. Notes: The data include intra-group positions. OFIs refer to non-monetary financial corporations excluding ICPFs and non-MMF investment funds (i.e. FVCs and the remaining OFIs are included).
Finally, turning to investment fund shares (see Chart 1.10), the largest holders are ICPFs, followed by OFIs, whereas MFIs tend to hold a much smaller amount of investment fund shares. The major issuers of this instrument are OFIs. Compared with 2015, the amounts held by ICPFs and OFIs and issued by OFIs were rather higher in 2016.
1.3.2 Interconnectedness across individual countries
This section presents two different approaches to looking at structural interconnectedness across countries for different parts of the wider euro area financial sector.
Chart 1.11 to Chart 1.13 show the exposures of MFIs, ICPFs and OFIs to these same sectors located in their home country and in the rest of the euro area. Exposures of each sector are computed for debt securities, listed shares and investment fund shares combined. The charts are calculated on the basis of Securities Holdings Statistics (SHS) data.
0
500
1,000
1,500
2,000
2,500
3,000
ICPFs2015
ICPFs2016
MFIs2015
MFIs2016
OFIs2015
OFIs2016
ICPFsMFIsOFIs
Chart 1.9 Cross-exposures among sectors of the euro area financial system: listed shares
(EUR billions; fourth quarters of 2015 and 2016; x-axis: holding sector; y-axis: exposure to counterparty sector)
Sources: ECB (EAA) and ECB calculations. Notes: The data include intra-group positions. OFIs refer to non-monetary financial corporations excluding ICPFs and non-MMF investment funds (i.e. FVCs and the remaining OFIs are included).
0
50
100
150
200
250
300
350
400
450
ICPFs2015
ICPFs2016
MFIs2015
MFIs2016
OFIs2015
OFIs2016
ICPFsMFIsOFIs

Report on financial structures, October 2017 15
Chart 1.11 Exposure of MFIs to financial sectors located in the same country and in other euro area countries
(EUR billions; fourth quarters of 2014, 2015 and 2016)
Sources: ECB (SHSS) and ECB calculations. Notes: Exposures of each sector are computed for three instruments combined: debt securities, listed shares and investment fund shares. For confidentiality reasons, the data for Austria, Luxembourg and Malta are reported together, although the developments in these countries are very diverse. The data include intra-group positions. Data for 2016 include direct reporting from investors for insurance corporations for the first time. OFIs refer to non-monetary financial corporations excluding ICPFs (i.e. non-MMF investment funds, FVCs and remaining OFIs are included).
Reflecting in part the absolute size of their banking systems, exposures of MFIs remain particularly high in the four largest economies of the euro area (Germany, France, Italy and Spain) (see Chart 1.11). In Italy, Germany and France, most MFI exposures are to MFIs in the same country, but there are also sizeable exposures to other euro area countries in the latter two. MFI exposure to OFIs (in the same country or in other euro area countries) is particularly large in Spain and the Netherlands, and is also significant in Germany, France and Italy.9 By contrast, MFIs in Ireland, and in Austria, Luxembourg and Malta combined, tend to be exposed mainly to sectors located in other euro area countries.
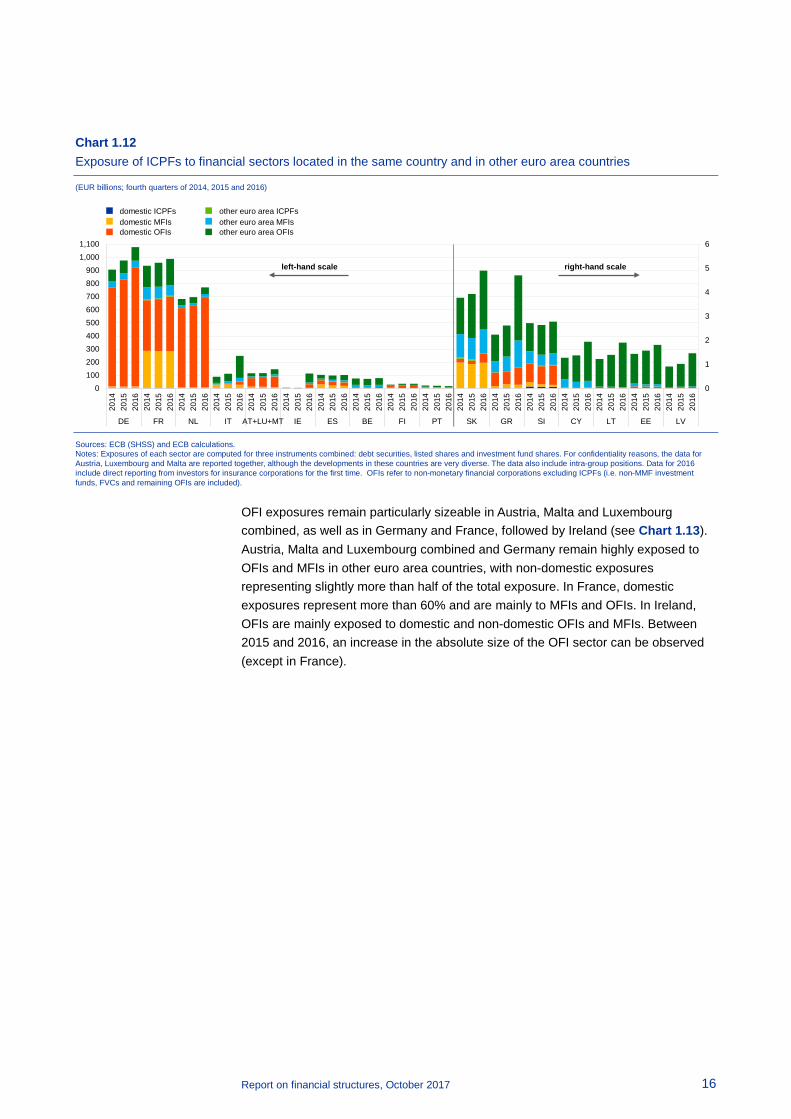
Chart 1.12 shows that the ICPF sector remains rather small in most euro area countries, except for France, Germany and the Netherlands, where a further increase was recorded last year, mainly driven by a rise in exposures to OFIs. In France, the ICPF sector is exposed to French MFIs and OFIs in particular, but also to other parts of the euro area. In Germany and the Netherlands, the ICPF sector is mainly exposed to the domestic OFI sector.
9 In the case of Spain at least, the large exposure of domestic MFIs to domestic OFIs reflects retained
securitisations for collateral purposes, without implications for risk or contagion.
0.0
0.5
1.0
1.5
2.0
2.5
3.0
3.5
4.0
4.5
0
100
200
300
400
500
600
700
800
2014
2015
2016
2014
2015
2016
2014
2015
2016
2014
2015
2016
2014
2015
2016
2014
2015
2016
2014
2015
2016
2014
2015
2016
2014
2015
2016
2014
2015
2016
2014
2015
2016
2014
2015
2016
2014
2015
2016
2014
2015
2016
2014
2015
2016
2014
2015
2016
2014
2015
2016
DE FR IT ES NL IE AT+LU+MT BE PT GR FI LV SK SI CY EE LT
domestic ICPFsdomestic MFIsdomestic OFIs
other euro area ICPFsother euro area MFIsother euro area OFIs
left-hand scale right-hand scale
Report on financial structures, October 2017 16
Chart 1.12 Exposure of ICPFs to financial sectors located in the same country and in other euro area countries
(EUR billions; fourth quarters of 2014, 2015 and 2016)
Sources: ECB (SHSS) and ECB calculations. Notes: Exposures of each sector are computed for three instruments combined: debt securities, listed shares and investment fund shares. For confidentiality reasons, the data for Austria, Luxembourg and Malta are reported together, although the developments in these countries are very diverse. The data also include intra-group positions. Data for 2016 include direct reporting from investors for insurance corporations for the first time. OFIs refer to non-monetary financial corporations excluding ICPFs (i.e. non-MMF investment funds, FVCs and remaining OFIs are included).
OFI exposures remain particularly sizeable in Austria, Malta and Luxembourg combined, as well as in Germany and France, followed by Ireland (see Chart 1.13). Austria, Malta and Luxembourg combined and Germany remain highly exposed to OFIs and MFIs in other euro area countries, with non-domestic exposures representing slightly more than half of the total exposure. In France, domestic exposures represent more than 60% and are mainly to MFIs and OFIs. In Ireland, OFIs are mainly exposed to domestic and non-domestic OFIs and MFIs. Between 2015 and 2016, an increase in the absolute size of the OFI sector can be observed (except in France).
0
1
2
3
4
5
6
0100200300400500600700800900
1,0001,100
2014
2015
2016
2014
2015
2016
2014
2015
2016
2014
2015
2016
2014
2015
2016
2014
2015
2016
2014
2015
2016
2014
2015
2016
2014
2015
2016
2014
2015
2016
2014
2015
2016
2014
2015
2016
2014
2015
2016
2014
2015
2016
2014
2015
2016
2014
2015
2016
2014
2015
2016
DE FR NL IT AT+LU+MT IE ES BE FI PT SK GR SI CY LT EE LV
domestic ICPFsdomestic MFIsdomestic OFIs
other euro area ICPFsother euro area MFIsother euro area OFIs
left-hand scale right-hand scale
Report on financial structures, October 2017 17
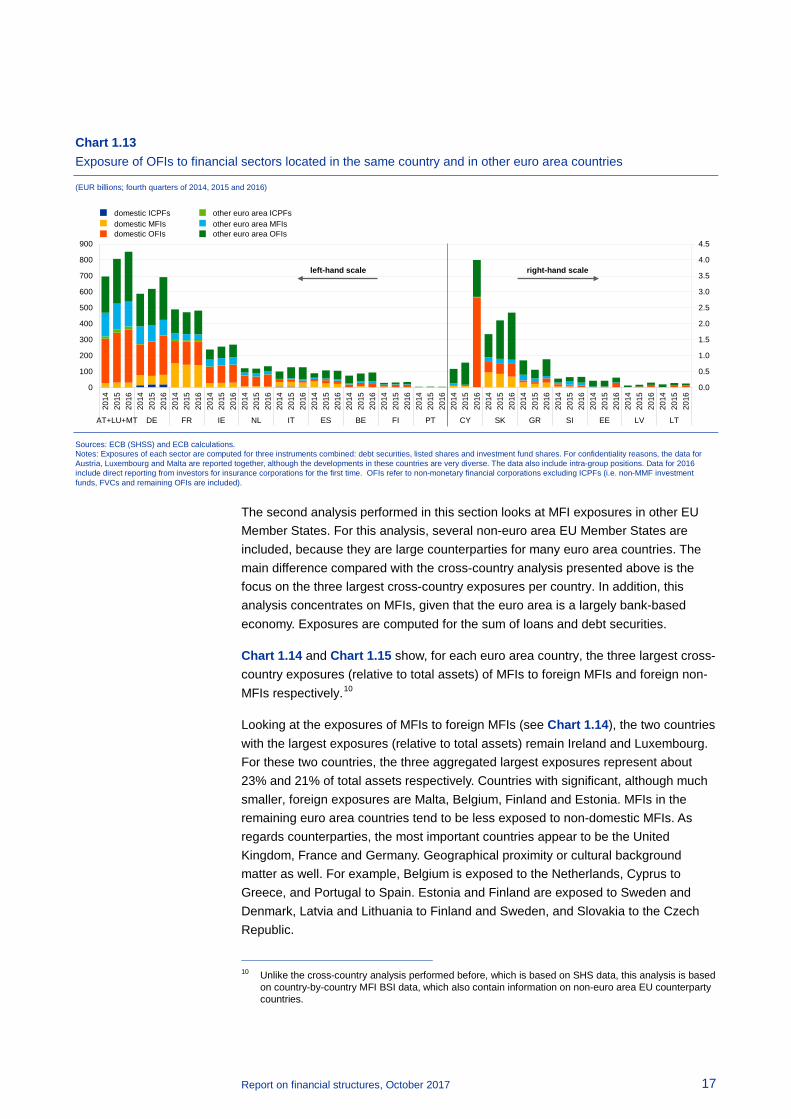
Chart 1.13 Exposure of OFIs to financial sectors located in the same country and in other euro area countries
(EUR billions; fourth quarters of 2014, 2015 and 2016)
Sources: ECB (SHSS) and ECB calculations. Notes: Exposures of each sector are computed for three instruments combined: debt securities, listed shares and investment fund shares. For confidentiality reasons, the data for Austria, Luxembourg and Malta are reported together, although the developments in these countries are very diverse. The data also include intra-group positions. Data for 2016 include direct reporting from investors for insurance corporations for the first time. OFIs refer to non-monetary financial corporations excluding ICPFs (i.e. non-MMF investment funds, FVCs and remaining OFIs are included).
The second analysis performed in this section looks at MFI exposures in other EU Member States. For this analysis, several non-euro area EU Member States are included, because they are large counterparties for many euro area countries. The main difference compared with the cross-country analysis presented above is the focus on the three largest cross-country exposures per country. In addition, this analysis concentrates on MFIs, given that the euro area is a largely bank-based economy. Exposures are computed for the sum of loans and debt securities.
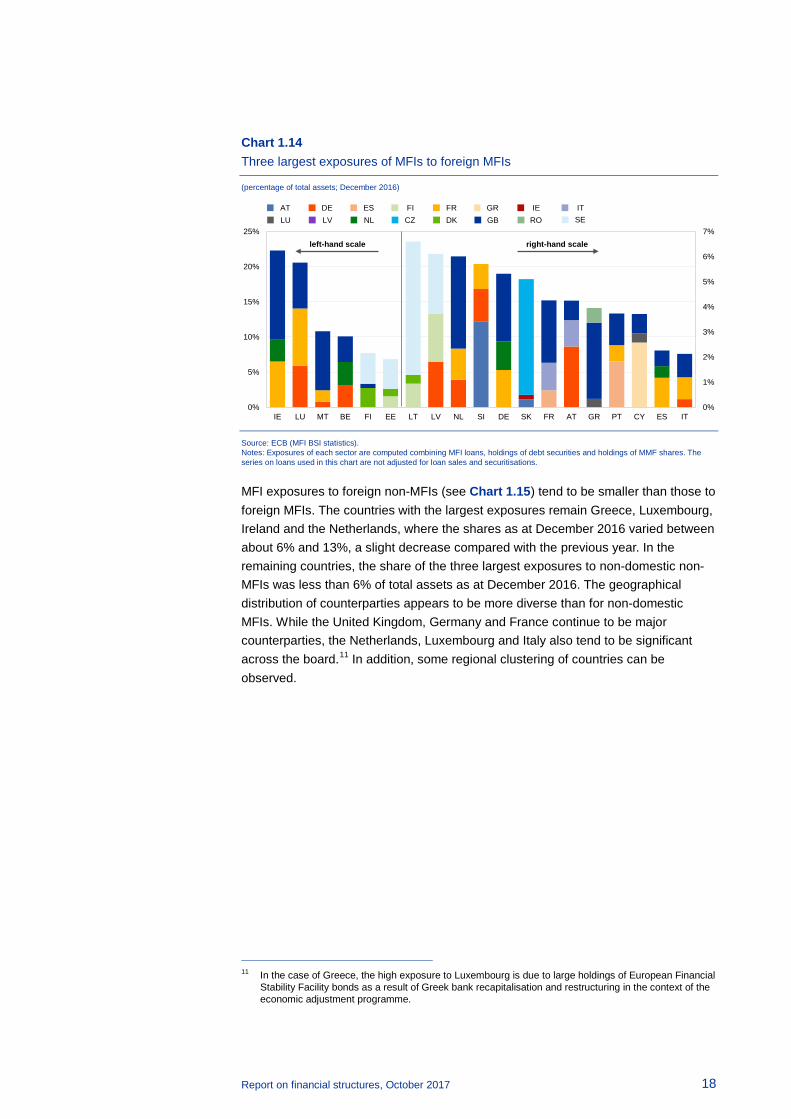
Chart 1.14 and Chart 1.15 show, for each euro area country, the three largest cross-country exposures (relative to total assets) of MFIs to foreign MFIs and foreign non-MFIs respectively.10
Looking at the exposures of MFIs to foreign MFIs (see Chart 1.14), the two countries with the largest exposures (relative to total assets) remain Ireland and Luxembourg. For these two countries, the three aggregated largest exposures represent about 23% and 21% of total assets respectively. Countries with significant, although much smaller, foreign exposures are Malta, Belgium, Finland and Estonia. MFIs in the remaining euro area countries tend to be less exposed to non-domestic MFIs. As regards counterparties, the most important countries appear to be the United Kingdom, France and Germany. Geographical proximity or cultural background matter as well. For example, Belgium is exposed to the Netherlands, Cyprus to Greece, and Portugal to Spain. Estonia and Finland are exposed to Sweden and Denmark, Latvia and Lithuania to Finland and Sweden, and Slovakia to the Czech Republic.
10 Unlike the cross-country analysis performed before, which is based on SHS data, this analysis is based
on country-by-country MFI BSI data, which also contain information on non-euro area EU counterparty countries.
0.0
0.5
1.0
1.5
2.0
2.5
3.0
3.5
4.0
4.5
0
100
200
300
400
500
600
700
800
900
2014
2015
2016
2014
2015
2016
2014
2015
2016
2014
2015
2016
2014
2015
2016
2014
2015
2016
2014
2015
2016
2014
2015
2016
2014
2015
2016
2014
2015
2016
2014
2015
2016
2014
2015
2016
2014
2015
2016
2014
2015
2016
2014
2015
2016
2014
2015
2016
2014
2015
2016
AT+LU+MT DE FR IE NL IT ES BE FI PT CY SK GR SI EE LV LT
domestic ICPFsdomestic MFIsdomestic OFIs
other euro area ICPFsother euro area MFIsother euro area OFIs
left-hand scale right-hand scale
Report on financial structures, October 2017 18
Chart 1.14 Three largest exposures of MFIs to foreign MFIs
(percentage of total assets; December 2016)
Source: ECB (MFI BSI statistics). Notes: Exposures of each sector are computed combining MFI loans, holdings of debt securities and holdings of MMF shares. The series on loans used in this chart are not adjusted for loan sales and securitisations.
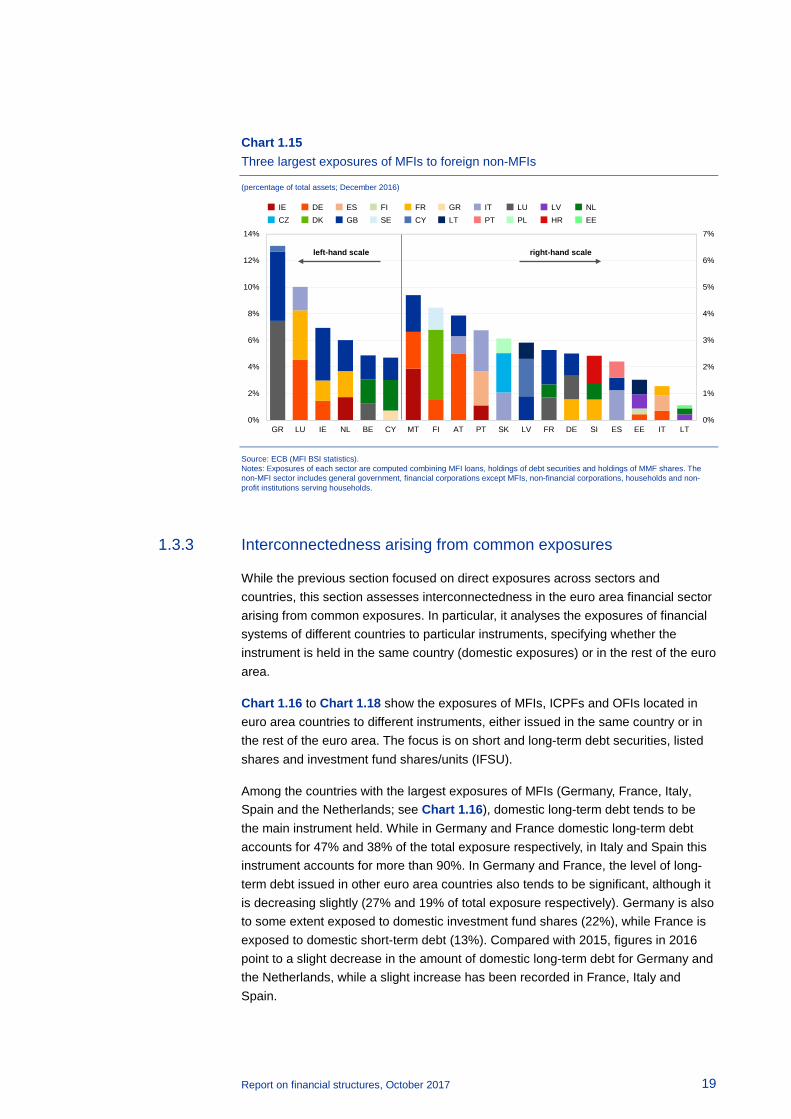
MFI exposures to foreign non-MFIs (see Chart 1.15) tend to be smaller than those to foreign MFIs. The countries with the largest exposures remain Greece, Luxembourg, Ireland and the Netherlands, where the shares as at December 2016 varied between about 6% and 13%, a slight decrease compared with the previous year. In the remaining countries, the share of the three largest exposures to non-domestic non-MFIs was less than 6% of total assets as at December 2016. The geographical distribution of counterparties appears to be more diverse than for non-domestic MFIs. While the United Kingdom, Germany and France continue to be major counterparties, the Netherlands, Luxembourg and Italy also tend to be significant across the board.11 In addition, some regional clustering of countries can be observed.
11 In the case of Greece, the high exposure to Luxembourg is due to large holdings of European Financial
Stability Facility bonds as a result of Greek bank recapitalisation and restructuring in the context of the economic adjustment programme.
0%
1%
2%
3%
4%
5%
6%
7%
0%
5%
10%
15%
20%
25%
IE LU MT BE FI EE LT LV NL SI DE SK FR AT GR PT CY ES IT
left-hand scale right-hand scale
AT DE ES FI FR GR IE ITLU LV NL CZ DK GB RO SE
Report on financial structures, October 2017 19
Chart 1.15 Three largest exposures of MFIs to foreign non-MFIs
(percentage of total assets; December 2016)
Source: ECB (MFI BSI statistics). Notes: Exposures of each sector are computed combining MFI loans, holdings of debt securities and holdings of MMF shares. The non-MFI sector includes general government, financial corporations except MFIs, non-financial corporations, households and non-profit institutions serving households.
1.3.3 Interconnectedness arising from common exposures
While the previous section focused on direct exposures across sectors and countries, this section assesses interconnectedness in the euro area financial sector arising from common exposures. In particular, it analyses the exposures of financial systems of different countries to particular instruments, specifying whether the instrument is held in the same country (domestic exposures) or in the rest of the euro area.
Chart 1.16 to Chart 1.18 show the exposures of MFIs, ICPFs and OFIs located in euro area countries to different instruments, either issued in the same country or in the rest of the euro area. The focus is on short and long-term debt securities, listed shares and investment fund shares/units (IFSU).
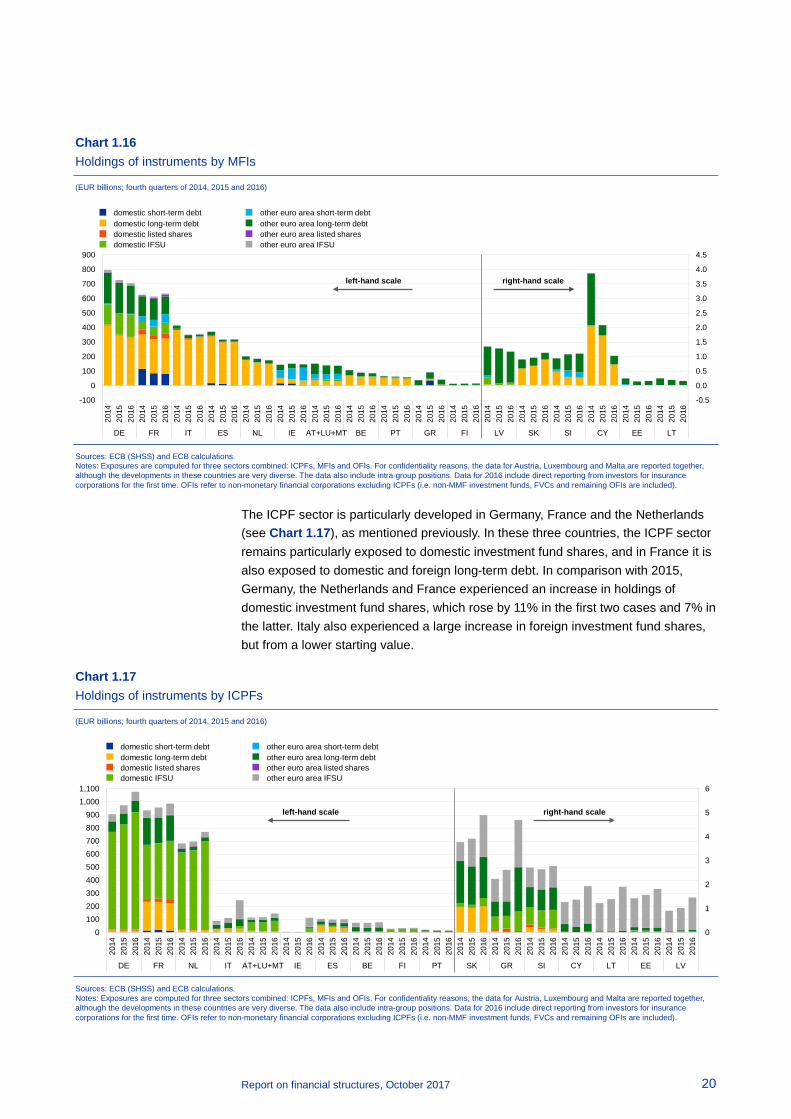
Among the countries with the largest exposures of MFIs (Germany, France, Italy, Spain and the Netherlands; see Chart 1.16), domestic long-term debt tends to be the main instrument held. While in Germany and France domestic long-term debt accounts for 47% and 38% of the total exposure respectively, in Italy and Spain this instrument accounts for more than 90%. In Germany and France, the level of long-term debt issued in other euro area countries also tends to be significant, although it is decreasing slightly (27% and 19% of total exposure respectively). Germany is also to some extent exposed to domestic investment fund shares (22%), while France is exposed to domestic short-term debt (13%). Compared with 2015, figures in 2016 point to a slight decrease in the amount of domestic long-term debt for Germany and the Netherlands, while a slight increase has been recorded in France, Italy and Spain.
0%
1%
2%
3%
4%
5%
6%
7%
0%
2%
4%
6%
8%
10%
12%
14%
GR LU IE NL BE CY MT FI AT PT SK LV FR DE SI ES EE IT LT
left-hand scale right-hand scale
IE DE ES FI FR GR IT LU LV NLCZ DK GB SE CY LT PT PL EEHR
Report on financial structures, October 2017 20
Chart 1.16 Holdings of instruments by MFIs
(EUR billions; fourth quarters of 2014, 2015 and 2016)
Sources: ECB (SHSS) and ECB calculations. Notes: Exposures are computed for three sectors combined: ICPFs, MFIs and OFIs. For confidentiality reasons, the data for Austria, Luxembourg and Malta are reported together, although the developments in these countries are very diverse. The data also include intra-group positions. Data for 2016 include direct reporting from investors for insurance corporations for the first time. OFIs refer to non-monetary financial corporations excluding ICPFs (i.e. non-MMF investment funds, FVCs and remaining OFIs are included).
The ICPF sector is particularly developed in Germany, France and the Netherlands (see Chart 1.17), as mentioned previously. In these three countries, the ICPF sector remains particularly exposed to domestic investment fund shares, and in France it is also exposed to domestic and foreign long-term debt. In comparison with 2015, Germany, the Netherlands and France experienced an increase in holdings of domestic investment fund shares, which rose by 11% in the first two cases and 7% in the latter. Italy also experienced a large increase in foreign investment fund shares, but from a lower starting value.
Chart 1.17 Holdings of instruments by ICPFs
(EUR billions; fourth quarters of 2014, 2015 and 2016)
Sources: ECB (SHSS) and ECB calculations. Notes: Exposures are computed for three sectors combined: ICPFs, MFIs and OFIs. For confidentiality reasons, the data for Austria, Luxembourg and Malta are reported together, although the developments in these countries are very diverse. The data also include intra-group positions. Data for 2016 include direct reporting from investors for insurance corporations for the first time. OFIs refer to non-monetary financial corporations excluding ICPFs (i.e. non-MMF investment funds, FVCs and remaining OFIs are included).
-0.5
0.0
0.5
1.0
1.5
2.0
2.5
3.0
3.5
4.0
4.5
-100
0
100
200
300
400
500
600
700
800
900
2014
2015
2016
2014
2015
2016
2014
2015
2016
2014
2015
2016
2014
2015
2016
2014
2015
2016
2014
2015
2016
2014
2015
2016
2014
2015
2016
2014
2015
2016
2014
2015
2016
2014
2015
2016
2014
2015
2016
2014
2015
2016
2014
2015
2016
2014
2015
2016
2014
2015
2016
DE FR IT ES NL IE AT+LU+MT BE PT GR FI LV SK SI CY EE LT
domestic short-term debtdomestic long-term debtdomestic listed sharesdomestic IFSU
other euro area short-term debtother euro area long-term debtother euro area listed sharesother euro area IFSU
left-hand scale right-hand scale
0
1
2
3
4
5
6
0100200300400500600700800900
1,0001,100
2014
2015
2016
2014
2015
2016
2014
2015
2016
2014
2015
2016
2014
2015
2016
2014
2015
2016
2014
2015
2016
2014
2015
2016
2014
2015
2016
2014
2015
2016
2014
2015
2016
2014
2015
2016
2014
2015
2016
2014
2015
2016
2014
2015
2016
2014
2015
2016
2014
2015
2016
DE FR NL IT AT+LU+MT IE ES BE FI PT SK GR SI CY LT EE LV
domestic short-term debtdomestic long-term debtdomestic listed sharesdomestic IFSU
other euro area short-term debtother euro area long-term debtother euro area listed sharesother euro area IFSU
left-hand scale right-hand scale
Report on financial structures, October 2017 21
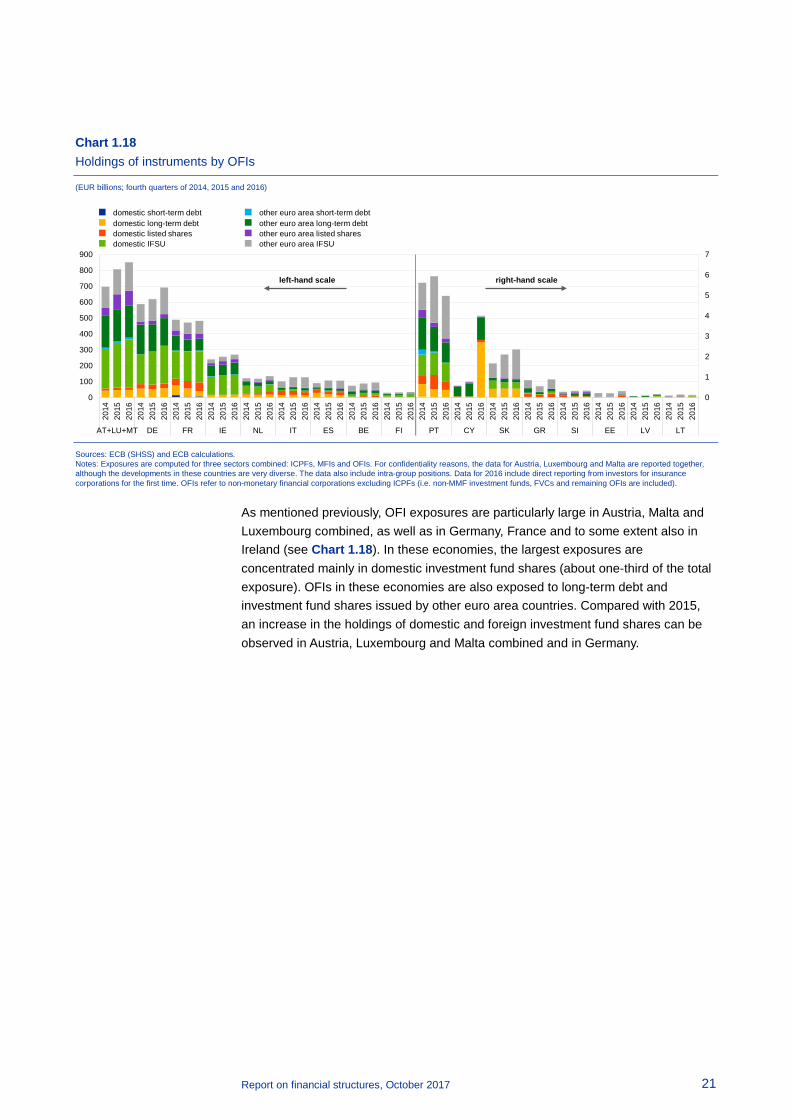
Chart 1.18 Holdings of instruments by OFIs
(EUR billions; fourth quarters of 2014, 2015 and 2016)
Sources: ECB (SHSS) and ECB calculations. Notes: Exposures are computed for three sectors combined: ICPFs, MFIs and OFIs. For confidentiality reasons, the data for Austria, Luxembourg and Malta are reported together, although the developments in these countries are very diverse. The data also include intra-group positions. Data for 2016 include direct reporting from investors for insurance corporations for the first time. OFIs refer to non-monetary financial corporations excluding ICPFs (i.e. non-MMF investment funds, FVCs and remaining OFIs are included).
As mentioned previously, OFI exposures are particularly large in Austria, Malta and Luxembourg combined, as well as in Germany, France and to some extent also in Ireland (see Chart 1.18). In these economies, the largest exposures are concentrated mainly in domestic investment fund shares (about one-third of the total exposure). OFIs in these economies are also exposed to long-term debt and investment fund shares issued by other euro area countries. Compared with 2015, an increase in the holdings of domestic and foreign investment fund shares can be observed in Austria, Luxembourg and Malta combined and in Germany.
0
1
2
3
4
5
6
7
0
100
200
300
400
500
600
700
800
900
2014
2015
2016
2014
2015
2016
2014
2015
2016
2014
2015
2016
2014
2015
2016
2014
2015
2016
2014
2015
2016
2014
2015
2016
2014
2015
2016
2014
2015
2016
2014
2015
2016
2014
2015
2016
2014
2015
2016
2014
2015
2016
2014
2015
2016
2014
2015
2016
2014
2015
2016
AT+LU+MT DE FR IE NL IT ES BE FI PT CY SK GR SI EE LV LT
domestic short-term debtdomestic long-term debtdomestic listed sharesdomestic IFSU
other euro area short-term debtother euro area long-term debtother euro area listed sharesother euro area IFSU
left-hand scale right-hand scale
Report on financial structures, October 2017 22
2 The euro area banking system
This chapter provides an overview of the structure of bank intermediation in the euro area. Section 2.1 reviews overall banking sector capacity and the level of consolidation and concentration by country using unconsolidated data.12 It highlights the main trends from 2008 until end-2016 as well as relevant developments since the publication of the last ECB Report on financial structures.
In 2016 the euro area banking sector continued its rationalisation process, driven by continued pressure to restructure and to contain costs. While the total number of credit institutions decreased, the share of foreign branches increased. The ratio of banking sector assets to GDP had been falling since 2008, although this trend came to a halt in 2016.
The number of bank branches declined steadily from 2008 to 2016, while market concentration decreased, continuing a trend that began in 2015. The decline in M&A activity persisted in 2016, both in terms of the number and the value of transactions. However, data for the first half of 2017 indicate an increase in the value of M&A activity.
Section 2.2 reviews structural changes in the balance sheet, financial performance, capital and leverage of the euro area banking sector during the period between 2008 and 2016, with a focus on developments during the last year of that period. Differently from the first part of Chapter 2, which mainly discusses unconsolidated banking data, the analysis here is based on consolidated, domestic banking sector data.13
A trend towards retail banking business in the euro area banking system continued in 2016, as indicated for instance by an increased reliance on deposit funding.14 The median level of non-performing loans (NPLs) declined in 2016 as efforts to clean up bank balance sheets continued. However, the persistently high levels of NPLs in a number of countries highlight the need to continue efforts to address the problem. Overall, aggregate banking system profitability remained relatively low in 2016, with developments at country level largely dependent on the levels of impairments and provisions. Structural inefficiencies continued to hamper profitability in some individual euro area banking sectors, as indicated by the mostly stable, or in some cases even increasing, cost/income ratios.
12 More specifically, the analysis is based mainly on the ECB datasets on the annual structural financial
indicators (SFIs) and the MFI balance sheet indicators. 13 The domestic banking sector comprises the consolidated accounts of banks that have their
headquarters in a given country or economic area, including their foreign branches and subsidiaries abroad.
14 For an analysis, see the special feature entitled “Recent trends in euro area banks’ business models and implications for banking sector stability”, Financial Stability Review, ECB, May 2016.

Report on financial structures, October 2017 23
2.1 Structure of the euro area banking system
2.1.1 Banking sector capacity
Since the start of the financial crisis in 2008, the euro area banking sector has undergone a rationalisation process resulting in a downward adjustment of the overall number of credit institutions.
On an unconsolidated basis, the number of credit institutions in the euro area declined to 5,073 at the end of 2016, from 5,474 at the end of 2015 and 6,768 at the end of 2008 (see Chart 2.1).15 This amounts to a 25% decrease over the period from 2008 to 2016.16
Chart 2.1 Number of credit institutions and foreign branches in 2008 and 2016
Source: ECB (MFI statistics). Note: Figures include credit unions for Latvia and savings and loan associations for Estonia, starting from 2013.
Looking at recent dynamics in individual countries, all euro area countries experienced a decrease in the number of credit institutions between 2015 and 2016. The countries that experienced the strongest absolute declines were the Netherlands (-112), Germany (-71) and Austria (-64). Taking a longer-term perspective, the Netherlands, Greece, Cyprus and Spain have recorded the largest relative decreases in the number of credit institutions since 2008, but there have also been declines of more than 20% in Finland, France, Italy and Ireland.
Reflecting both the size and structural features of their countries, Austrian, French, German and Italian credit institutions accounted for around 67% of the total number
15 The figures reported in Chart 2.1 include all countries that had adopted the euro by 1 January 2016. 16 MFI statistics are residence-based and compiled on an individual (as opposed to a consolidated) basis.
Chart 2.1 thus refers to all credit institutions legally incorporated in euro area countries, which includes foreign subsidiaries and branches. Credit institutions account for the bulk of MFIs as defined in Regulation EU No 1071/2013 of the European Central Bank of 24 September 2013 concerning the balance sheet of the monetary financial institutions sector (recast) (ECB/2013/33) (OJ L 297, 7.11.2013, p.1).
0
20
40
60
80
100
120
140
160
180
200
0
200
400
600
800
1,000
1,200
1,400
1,600
1,800
2,000
2008
2016
2008
2016
2008
2016
2008
2016
2008
2016
2008
2016
2008
2016
2008
2016
2008
2016
2008
2016
2008
2016
2008
2016
2008
2016
2008
2016
2008
2016
2008
2016
2008
2016
2008
2016
2008
2016
DE IT AT FR IE FI ES NL PT LU CY BE LT GR LV EE SK MT SI
left-hand scale right-hand scale
MFI credit institutionsMFI foreign branches

Report on financial structures, October 2017 24
of euro area credit institutions at the end of 2016, compared with 65% in 2008 and 66% in 2015. By comparison, the share of Spanish credit institutions in the total number of euro area credit institutions is relatively small (2.9%).
On a consolidated basis, the total number of credit institutions in the euro area amounted to 2,290 (domestic banking groups and stand-alone banks) at the end of 2016, down from 2,904 in 2008 and 2,379 at the end of 2015.17
The share of foreign branches in the total number of euro area credit institutions increased from about 10% in 2008 to about 14% in 2016, mainly owing to the decline in the number of credit institutions incorporated in the euro area. The number of foreign branches declined slightly, from 706 in 2008 to 688 in 2016.
Total assets of the euro area domestic banks stood at €24.2 trillion on a consolidated basis at the end of 2016, an increase of 0.5% compared with 2015, but a decline of about 14% compared with 2008. Including foreign branches and subsidiaries, the largest increases in the value of assets between 2015 and 2016 were observed in Lithuania (9.9%), Estonia (6.3%), Belgium (5.3%), Luxembourg (4.3%), France (4%) and Germany (1.9%). By contrast, the biggest declines in assets between 2015 and 2016 were recorded in Greece (-13.9%), Austria (-10.5%), Ireland (-8.9%), Cyprus (-8%), Latvia (-7.9%) and Portugal (-5.3%).18 The largest relative reductions in the value of total assets since 2008 were recorded in Ireland, Cyprus and Greece (72.9%, 46.4% and 34.2% respectively), whereas Finland in particular but also Slovakia, Malta and, to a much smaller degree, France recorded an increase in the total value of banking assets.19
At the end of 2016, France and Germany continued to have the largest banking sectors in the euro area, with total asset values slightly above €7 trillion in both cases. The banking sectors in Spain and Italy are much smaller (€3.6 trillion and €2.7 trillion respectively). At the other end of the spectrum, the assets of the Estonian and Lithuanian banking sectors amounted to about €25 billion.
Looking at banking sectors in relation to GDP (see Chart 2.2), Luxembourg stands out with assets representing 1,561% of GDP, followed by Malta, Cyprus and the Netherlands (469%, 376% and 360% of GDP respectively). In the vast majority of euro area countries these ratios have been on a decreasing path since 2008. This process continued in 2016 at the euro area level.
In Luxembourg, Malta, Finland, Slovakia and some of the Baltic countries, the vast majority of banking assets are held by foreign-controlled subsidiaries and branches, whose assets relative to GDP tended to decrease between 2015 and 2016.
17 This figure refers to the number of credit institutions covered by ECB consolidated banking data. 18 The decline in total banking assets in Austria was driven by the restructuring UniCredit Bank Austria, in
which the central, eastern and south-eastern European subsidiaries of the bank were transferred to the Italian UniCredit Group.
19 The large reduction in the relative value of assets in Estonia was mainly driven by the restructuring of the ownership of a foreign banking group in 2011.

Report on financial structures, October 2017 25
Chart 2.2 Total assets of domestic banking groups and foreign-controlled subsidiaries and branches in relation to GDP in euro area countries in 2008, 2015 and 2016
Sources: ECB (CBD) and ECB calculations. Notes: Data for domestic banking groups and foreign subsidiaries and branches are consolidated, and hence include branches and subsidiaries that can be classified as OFIs, except insurance companies.
Banking sectors across euro area countries differ substantially when it comes to the relative weight of foreign bank branches or subsidiaries (see Chart 2.3). Whereas the domestic banking sector plays a dominant role in the largest economies in the euro area as well as in Greece and Cyprus, foreign-owned credit institutions have a significant share of the market in smaller and some intermediate economies. Looking at medium-term dynamics over the period from 2009 to 2016, the relative weight of domestic banking assets increased mainly in countries that were or still are subject to EU/IMF financial assistance programmes, such as Cyprus, Latvia and Greece, as well as in Finland, Malta and Estonia (from a lower starting value).
Chart 2.3 The composition of banking sector assets in euro area countries by type of credit institution in 2009, 2015 and 2016
Sources: ECB (MFI and SFI statistics), Latvijas Banka, Eesti Pank and ECB calculations. Notes: Data for 2009 are not available for Lithuania. For confidentiality reasons, data for Malta combine branches of credit institutions from EU countries and branches and subsidiaries of credit institutions from the rest of the world. Data for Malta are consolidated.
0
150
300
450
600
750
900
0
500
1,000
1,500
2,000
2,500
3,000
2008
2015
2016
2008
2015
2016
2008
2015
2016
2008
2015
2016
2008
2015
2016
2008
2015
2016
2008
2015
2016
2008
2015
2016
2008
2015
2016
2008
2015
2016
2008
2015
2016
2008
2015
2016
2008
2015
2016
2008
2015
2016
2008
2015
2016
2008
2015
2016
2008
2015
2016
2008
2015
2016
2008
2015
2016
2008
2015
2016
LU IE MT CY NL FR ES AT euroarea
FI BE DE PT GR IT LV EE SI SK LT
left-hand scale right-hand scale
domestic banking groupsforeign subsidiaries and branches
0%
10%
20%
30%
40%
50%
60%
70%
80%
90%
100%
2009
2015
2016
2009
2015
2016
2009
2015
2016
2009
2015
2016
2009
2015
2016
2009
2015
2016
2009
2015
2016
2009
2015
2016
2009
2015
2016
2009
2015
2016
2009
2015
2016
2009
2015
2016
2009
2015
2016
2009
2015
2016
2009
2015
2016
2010
2014
2015
2009
2015
2016
2009
2015
2016
2009
2015
2016
NL DE ES FR IT AT GR PT SI CY IE BE FI LV MT LT LU SK EE
subsidiaries RoWbranches EUbranches RoW
subsidiaries EUtotal assets of domestic CIs

Report on financial structures, October 2017 26
In terms of the composition of foreign banks, subsidiaries (of EU Member States and of the rest of the world) tended to prevail over branches in most countries with a relatively large presence of foreign banks. However, foreign branches were more prevalent than subsidiaries in a few countries such as the Netherlands, Spain and Italy.
The rationalisation and – at least until recently – downsizing of the euro area banking system suggest that the overall efficiency of the system was enhanced over the period from 2008 to 2016. During this period, the number of local bank units (i.e. branches) in the euro area declined by about 20% or 36,902 branches, 6,939 of which between 2015 and 2016. Almost half of the decrease since 2008 is accounted for by Spain, but other big economies, such as Germany, Italy, the Netherlands and France, also contributed significantly to the decrease. As regards the smaller countries, there was a strong decline in the number of local units in Greece.
The decline in the number of bank units in the euro area was reflected in the increase in two key banking system capacity indicators between 2008 and 2016 in most euro area countries: population per local branch and population per banking employee (see Chart 2.4 and Chart 2.5). Compared with 2015, the increase in population per branch was particularly noticeable in Estonia, the Netherlands, Latvia and Lithuania. As regards the population per banking employee, the relative increase between 2015 and 2016 was particularly marked in Portugal, Latvia, Greece and the Netherlands. In other countries, the increase was more moderate. By contrast, a decrease in the population per banking employee was recorded in Lithuania, Slovakia and Malta.
Chart 2.4 Population per local branch in euro area countries in 2008, 2015 and 2016
Sources: ECB (SFI statistics), Eurostat and ECB calculations. Note: Branches refer to the local units of credit institutions. Figures include savings and loan associations for Estonia, starting from 2013.
0
2,000
4,000
6,000
8,000
10,000
12,000
14,000
EE NL LV LT FI GR IE SK MT SI BE DE LU AT PT IT FR ES CY
200820152016

Report on financial structures, October 2017 27
Chart 2.5 Population per banking employee in euro area countries in 2008, 2015 and 2016
Sources: ECB (SFI statistics), Eurostat and ECB calculations.
Table 2.1 displays additional capacity indicators for the euro area and individual countries at the end of 2016. In particular, the table shows increases in the ratios between population and the number of credit institutions, local branches, bank employees, and assets per bank employee between 2015 and 2016 in the euro area as a whole. Assets per bank employee trended upwards in the euro area between 2008 and 2016, mainly owing to the consolidation process mentioned before and the resulting substantial fall in the number of bank employees.
Looking at developments since 2008, these indicators suggest an increasingly efficient use of resources in the euro area banking sectors, although this has not yet resulted in a decrease in cost/income ratios in 2016 in the largest countries, as discussed in the next section.
0
50
100
150
200
250
300
350
400
LT SK EE GR FI ES LV PT BE SI IT NL IE FR DE AT MT CY LU
200820152016
Report on financial structures, October 2017 28
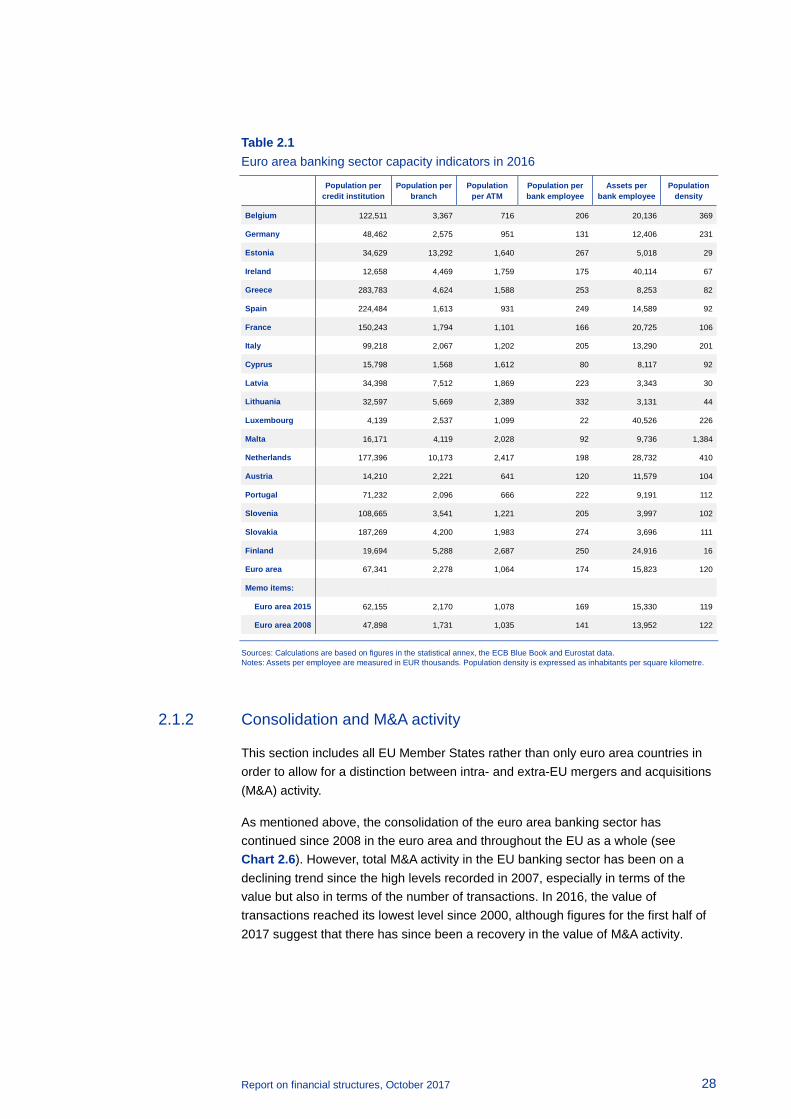
Table 2.1 Euro area banking sector capacity indicators in 2016
Population per
credit institution Population per
branch Population
per ATM Population per bank employee
Assets per bank employee
Population density
Belgium 122,511 3,367 716 206 20,136 369
Germany 48,462 2,575 951 131 12,406 231
Estonia 34,629 13,292 1,640 267 5,018 29
Ireland 12,658 4,469 1,759 175 40,114 67
Greece 283,783 4,624 1,588 253 8,253 82
Spain 224,484 1,613 931 249 14,589 92
France 150,243 1,794 1,101 166 20,725 106
Italy 99,218 2,067 1,202 205 13,290 201
Cyprus 15,798 1,568 1,612 80 8,117 92
Latvia 34,398 7,512 1,869 223 3,343 30
Lithuania 32,597 5,669 2,389 332 3,131 44
Luxembourg 4,139 2,537 1,099 22 40,526 226
Malta 16,171 4,119 2,028 92 9,736 1,384
Netherlands 177,396 10,173 2,417 198 28,732 410
Austria 14,210 2,221 641 120 11,579 104
Portugal 71,232 2,096 666 222 9,191 112
Slovenia 108,665 3,541 1,221 205 3,997 102
Slovakia 187,269 4,200 1,983 274 3,696 111
Finland 19,694 5,288 2,687 250 24,916 16
Euro area 67,341 2,278 1,064 174 15,823 120
Memo items:
Euro area 2015 62,155 2,170 1,078 169 15,330 119
Euro area 2008 47,898 1,731 1,035 141 13,952 122
Sources: Calculations are based on figures in the statistical annex, the ECB Blue Book and Eurostat data. Notes: Assets per employee are measured in EUR thousands. Population density is expressed as inhabitants per square kilometre.
2.1.2 Consolidation and M&A activity
This section includes all EU Member States rather than only euro area countries in order to allow for a distinction between intra- and extra-EU mergers and acquisitions (M&A) activity.
As mentioned above, the consolidation of the euro area banking sector has continued since 2008 in the euro area and throughout the EU as a whole (see Chart 2.6). However, total M&A activity in the EU banking sector has been on a declining trend since the high levels recorded in 2007, especially in terms of the value but also in terms of the number of transactions. In 2016, the value of transactions reached its lowest level since 2000, although figures for the first half of 2017 suggest that there has since been a recovery in the value of M&A activity.

Report on financial structures, October 2017 29
Chart 2.6 Number of credit institutions
Source: ECB (MFI statistics).
The number of M&A transactions in the euro area banking sector has been falling almost continuously since 2000, amid some volatility in recent years and rebounds in 2010 and 2013. From the start of the crisis in 2008, the number of domestic transactions20 remained broadly unchanged until 2013, reflecting ongoing consolidation in the banking system, including intra-group transactions in Italy and Germany, and the restructuring of the banking sector in EU/IMF programme countries.21 As a result, the relative share of domestic M&As increased until 2013 before fluctuating in more recent years (see Chart 2.7).
Chart 2.7 Bank M&As – number of transactions
Source: Dealogic M&A. Notes: M&As include both controlling and minority stakes. The value of some of the transactions is not reported. “Cross-border” M&As refer to intra-euro area transactions involving a non-domestic acquirer. “Inward” refers to M&As by non-EU or non-euro area EU banks in the euro area, while “outward” indicates M&As carried out by euro area banks outside the euro area.
20 “Domestic transactions” denote transactions that take place within national borders. In this report,
transactions within the euro area are referred to as “cross-border M&As”. 21 The data assessed in this section do not cover participation by governments or special legal entities in
the restructuring or resolution of credit institutions.
0
1,000
2,000
3,000
4,000
5,000
6,000
7,000
8,000
9,000
10,000
2005 2006 2007 2008 2009 2010 2011 2012 2013 2014 2015 2016
euro areaEU
0
20
40
60
80
100
120
140
2000 2001 2002 2003 2004 2005 2006 2007 2008 2009 2010 2011 2012 2013 2014 2015 2016 2017H1
domesticcross-borderoutward EU
inward EUoutward non-EUinward non-EU
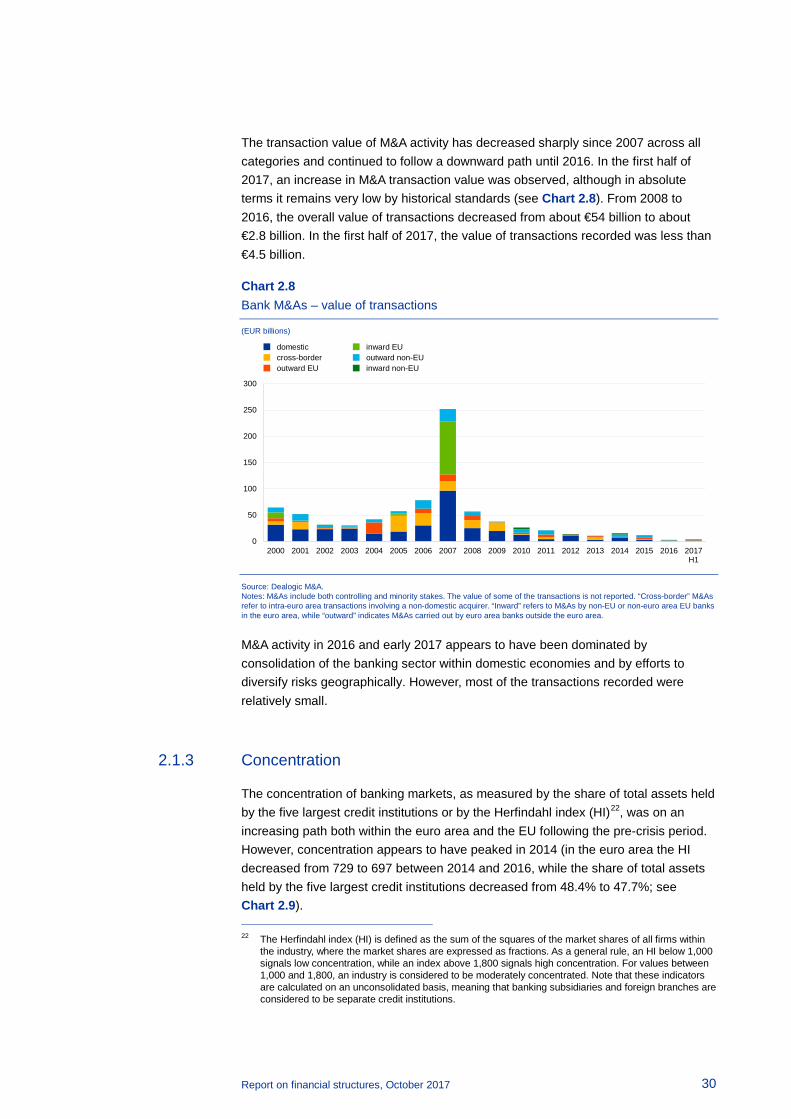
Report on financial structures, October 2017 30
The transaction value of M&A activity has decreased sharply since 2007 across all categories and continued to follow a downward path until 2016. In the first half of 2017, an increase in M&A transaction value was observed, although in absolute terms it remains very low by historical standards (see Chart 2.8). From 2008 to 2016, the overall value of transactions decreased from about €54 billion to about €2.8 billion. In the first half of 2017, the value of transactions recorded was less than €4.5 billion.
Chart 2.8 Bank M&As – value of transactions
(EUR billions)
Source: Dealogic M&A. Notes: M&As include both controlling and minority stakes. The value of some of the transactions is not reported. “Cross-border” M&As refer to intra-euro area transactions involving a non-domestic acquirer. “Inward” refers to M&As by non-EU or non-euro area EU banks in the euro area, while “outward” indicates M&As carried out by euro area banks outside the euro area.
M&A activity in 2016 and early 2017 appears to have been dominated by consolidation of the banking sector within domestic economies and by efforts to diversify risks geographically. However, most of the transactions recorded were relatively small.
2.1.3 Concentration
The concentration of banking markets, as measured by the share of total assets held by the five largest credit institutions or by the Herfindahl index (HI)22, was on an increasing path both within the euro area and the EU following the pre-crisis period. However, concentration appears to have peaked in 2014 (in the euro area the HI decreased from 729 to 697 between 2014 and 2016, while the share of total assets held by the five largest credit institutions decreased from 48.4% to 47.7%; see Chart 2.9). 22 The Herfindahl index (HI) is defined as the sum of the squares of the market shares of all firms within
the industry, where the market shares are expressed as fractions. As a general rule, an HI below 1,000 signals low concentration, while an index above 1,800 signals high concentration. For values between 1,000 and 1,800, an industry is considered to be moderately concentrated. Note that these indicators are calculated on an unconsolidated basis, meaning that banking subsidiaries and foreign branches are considered to be separate credit institutions.
0
50
100
150
200
250
300
2000 2001 2002 2003 2004 2005 2006 2007 2008 2009 2010 2011 2012 2013 2014 2015 2016 2017H1
domesticcross-borderoutward EU
inward EUoutward non-EUinward non-EU
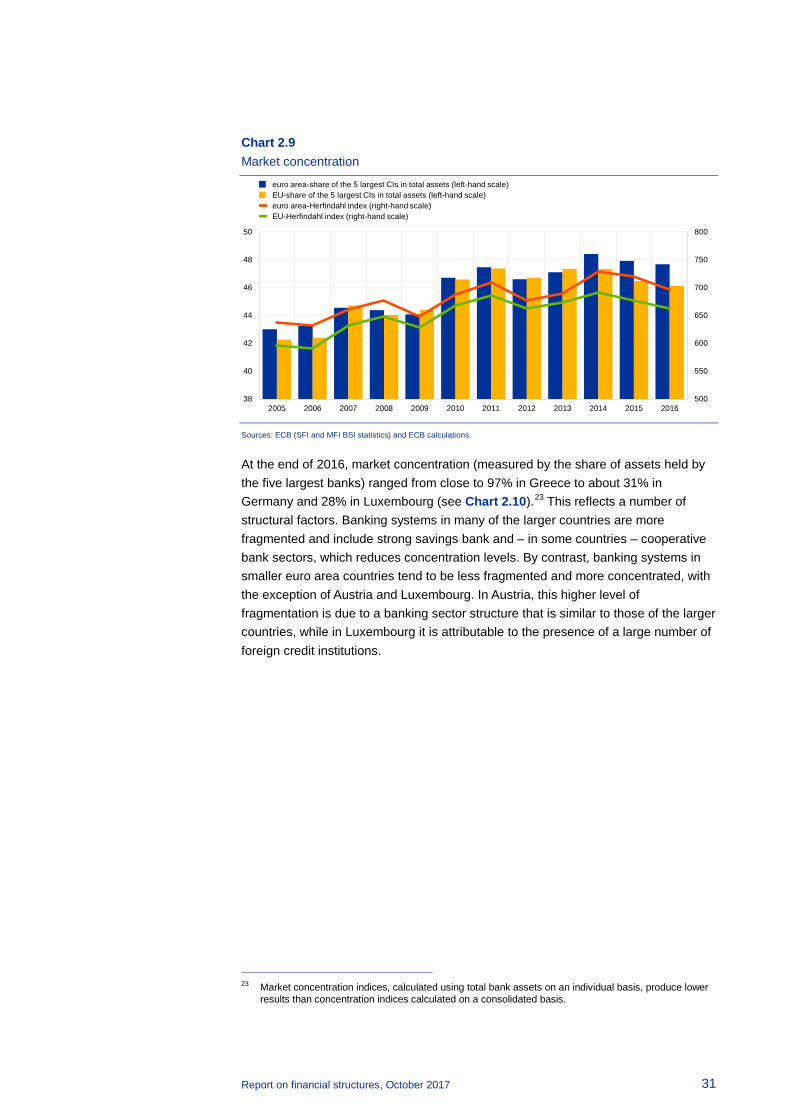
Report on financial structures, October 2017 31
Chart 2.9 Market concentration
Sources: ECB (SFI and MFI BSI statistics) and ECB calculations.
At the end of 2016, market concentration (measured by the share of assets held by the five largest banks) ranged from close to 97% in Greece to about 31% in Germany and 28% in Luxembourg (see Chart 2.10).23 This reflects a number of structural factors. Banking systems in many of the larger countries are more fragmented and include strong savings bank and – in some countries – cooperative bank sectors, which reduces concentration levels. By contrast, banking systems in smaller euro area countries tend to be less fragmented and more concentrated, with the exception of Austria and Luxembourg. In Austria, this higher level of fragmentation is due to a banking sector structure that is similar to those of the larger countries, while in Luxembourg it is attributable to the presence of a large number of foreign credit institutions.
23 Market concentration indices, calculated using total bank assets on an individual basis, produce lower
results than concentration indices calculated on a consolidated basis.
500
550
600
650
700
750
800
38
40
42
44
46
48
50
2005 2006 2007 2008 2009 2010 2011 2012 2013 2014 2015 2016
euro area-share of the 5 largest CIs in total assets (left-hand scale)EU-share of the 5 largest CIs in total assets (left-hand scale)euro area-Herfindahl index (right-hand scale)EU-Herfindahl index (right-hand scale)

Report on financial structures, October 2017 32
Chart 2.10 Share of the five largest credit institutions in total assets
Sources: ECB (SFI statistics) and ECB calculations. Note: Figures are reported on an unconsolidated basis.
Developments in the share of assets held by the five largest banks in the period from 2008 to 2016 are diverse. The banking sector tended to become more concentrated in countries undergoing deep banking sector restructuring processes, such as Greece and Spain, but also in some smaller economies, such as Malta and Lithuania. Concentration in larger economies, such as Germany and Italy, also increased over the period up to and including in 2016. Conversely, concentration in Belgium, Finland, Estonia, Latvia, Ireland and France decreased over the period in question.
2.2 Structural developments in banking activity
2.2.1 Balance sheet structure
The total assets of domestic euro area banks stood at €24.2 trillion on a consolidated basis at the end of 2016, reflecting a decline of 14% versus 2008. Compared with 2015, total assets increased marginally by 0.5%. Asset growth displayed significant cross-country heterogeneity. Whereas banks in Estonia, Malta and Slovakia experienced double-digit growth, the banking sectors in Cyprus, Greece, Ireland, Portugal and Slovenia continued their deleveraging paths.
0
10
20
30
40
50
60
70
80
90
100
GR EE LT NL MT FI PT SK CY BE LV ES SI euroarea
FR IE IT AT LU DE
200820152016

Report on financial structures, October 2017 33
Total lending by domestic euro area banks likewise grew at the moderate pace of 1% in 2016. The median share of loans in total assets decreased marginally (see Chart 2.11). Looking at the large countries, banks in France and the Netherlands expanded the size of their loan portfolios in absolute terms, while for banks in Germany, Spain and Italy a modest decline can be observed.24 Regarding the smaller countries, double-digit growth was recorded in the Maltese, Estonian and Slovakian banking sectors. 25 By contrast, the strong growth in total loans and advances by Cypriot banks in the previous year reversed, while lending in the Slovenian banking sector also declined significantly.
The share of debt securities in total banking sector assets continued to decline in 2016, reflecting declining holdings of domestic government bonds in many of the countries in the aftermath of the financial crisis and the ECB’s ongoing expanded asset purchase programme (see Chart 2.12). The decline was broad-based, with the exception of banks domiciled in Finland, Luxembourg and Portugal.
Chart 2.12 Share of debt securities in total assets of euro area banking sectors
(all domestic banks; percentage of total assets)
Sources: ECB (CBD) and ECB calculations.
24 It should be emphasised that these figures reflect credit developments of national banking groups on a
consolidated basis and across national borders, so they may not always be aligned with credit developments within the country of origin of a particular national banking system.
25 In the case of Estonia, it is important to note that lending by domestic banks only accounts for 5% of total lending because of the very high share of foreign subsidiaries and branches. If one includes the latter, lending growth was 8% in 2016.
0
5
10
15
20
25
30
35
40
LV LU MT LT SI SK PT IT BE GR IE AT DE ES FI FR NL CY EE euroarea
200820152016
2008 median2015 median2016 median
Chart 2.11 Share of total loans and advances in total assets of euro area banking sectors
(all domestic banks; percentages; maximum, minimum, interquartile range and median across national banking sectors)
Sources: ECB (CBD) and ECB calculations. Note: Total loans include both interbank loans and loans to non-banks.
30
40
50
60
70
80
90
2008 2009 2010 2011 2012 2013 2014 2015 2016
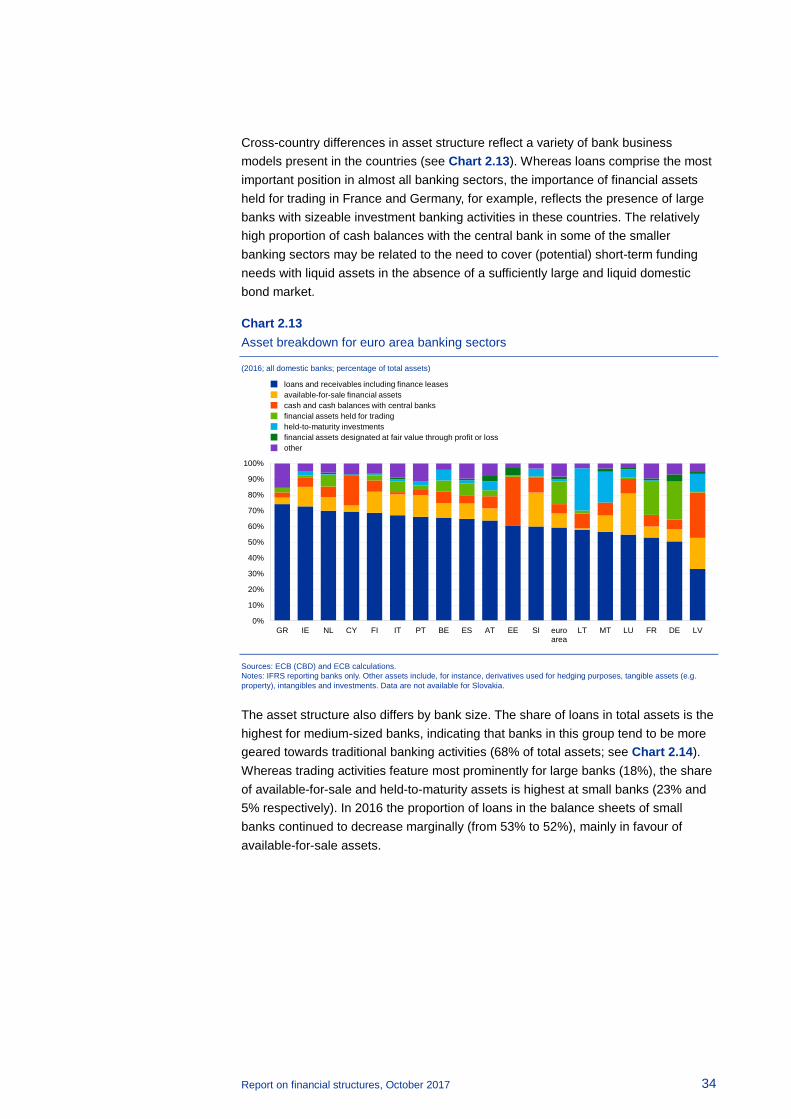
Report on financial structures, October 2017 34
Cross-country differences in asset structure reflect a variety of bank business models present in the countries (see Chart 2.13). Whereas loans comprise the most important position in almost all banking sectors, the importance of financial assets held for trading in France and Germany, for example, reflects the presence of large banks with sizeable investment banking activities in these countries. The relatively high proportion of cash balances with the central bank in some of the smaller banking sectors may be related to the need to cover (potential) short-term funding needs with liquid assets in the absence of a sufficiently large and liquid domestic bond market.
Chart 2.13 Asset breakdown for euro area banking sectors
(2016; all domestic banks; percentage of total assets)
Sources: ECB (CBD) and ECB calculations. Notes: IFRS reporting banks only. Other assets include, for instance, derivatives used for hedging purposes, tangible assets (e.g. property), intangibles and investments. Data are not available for Slovakia.
The asset structure also differs by bank size. The share of loans in total assets is the highest for medium-sized banks, indicating that banks in this group tend to be more geared towards traditional banking activities (68% of total assets; see Chart 2.14). Whereas trading activities feature most prominently for large banks (18%), the share of available-for-sale and held-to-maturity assets is highest at small banks (23% and 5% respectively). In 2016 the proportion of loans in the balance sheets of small banks continued to decrease marginally (from 53% to 52%), mainly in favour of available-for-sale assets.
0%
10%
20%
30%
40%
50%
60%
70%
80%
90%
100%
GR IE NL CY FI IT PT BE ES AT EE SI euroarea
LT MT LU FR DE LV
loans and receivables including finance leases available-for-sale financial assets cash and cash balances with central banks financial assets held for trading held-to-maturity investments financial assets designated at fair value through profit or loss other

Report on financial structures, October 2017 35
Chart 2.14 Asset breakdown for euro area banks in different size groups
(2016; all domestic banks; percentage of total assets)
Sources: ECB (CBD) and ECB calculations. Notes: IFRS reporting banks only. Other assets include, for instance, derivatives used for hedging purposes, tangible assets (e.g. property), intangibles and investments.
As regards banks’ liabilities, the increase in deposit funding continued, with the median share of deposits in total liabilities exceeding 50% in 2016 (see Chart 2.15). The increase was broad-based, with notable declines only in the Belgian banking sector and in those of the Baltic countries. By contrast, the declining trend in the use of wholesale market funding since the financial crisis stopped in 2016 (see Chart 2.16). The share of wholesale market funding increased in particular in Luxembourg and Finland, the banking sectors of which already featured at the higher end of the distribution. It also increased in the Greek banking system and this had a significant impact at the bottom of the distribution. The cross-country dispersion remained large, however, with wholesale market funding accounting for around 40% of bank liabilities in Luxembourg, but less than 10% for Estonian and Greek banks. In most countries, the use of wholesale market funding remained below the levels seen before the financial crisis.
0%
10%
20%
30%
40%
50%
60%
70%
80%
90%
100%
all domestic banks large domestic banks medium-sized domestic banks small domestic banks
loans and receivables (including finance leases)available-for-sale financial assetsheld-to-maturity investmentscash and cash balances with central banksfinancial assets held for tradingfinancial assets designated at fair value through profit or lossother

Report on financial structures, October 2017 36
Chart 2.16 Share of wholesale market funding in total liabilities of euro area banking sectors
(all banks; percentages; maximum, minimum, interquartile range and median across national banking sectors)
Sources: ECB (CBD) and ECB calculations. Note: Wholesale market funding includes interbank liabilities and debt securities.
The increased reliance on retail deposit funding, together with the stable share of lending in total assets on the aggregate, led to a decline in the median euro area loan-to-deposit ratio to around 110% in the first quarter of 2017, down from 112% a year before and 138% in 2008 (see Chart 2.17). The reliance on central bank funding remained stable and low in most banking sectors in 2016 (see Chart 2.18). The Cypriot and Greek banking sectors experienced significant declines, which in the latter case offset the large increase experienced during the first half of 2015.
Chart 2.18 Share of central bank funding in total liabilities of euro area banking sectors
(all banks; percentages; maximum, minimum, interquartile range and median across national banking sectors)
Sources: ECB (BSI statistics), IMF (IFS) and ECB calculations.
0
10
20
30
40
50
60
2008 2009 2010 2011 2012 2013 2014 2015 2016
0
5
10
15
20
25
30
35
40
2008 2009 2010 2011 2012 2013 2014 2015 2016
Chart 2.15 Share of household and corporate deposits in total liabilities of euro area banking sectors
(all banks; percentages; maximum, minimum, interquartile range and median across national banking sectors)
Source: ECB (BSI statistics).
Chart 2.17 Loan-to-deposit ratios of euro area banking sectors
(all banks; percentages; maximum, minimum, interquartile range and median across national banking sectors; quarterly data)
Sources: ECB (MFI statistics) and ECB calculations.
0
10
20
30
40
50
60
70
80
90
2008 2009 2010 2011 2012 2013 2014 2015 2016
50
75
100
125
150
175
200
225
2008 2009 2010 2011 2012 2013 2014 2015 2016 2017

Report on financial structures, October 2017 37
Looking at the classification of liabilities, the share of financial liabilities measured at amortised costs – largely consisting of deposits – has been continuously increasing post-crisis and constituted the most important category for bank liabilities across the euro area in 2016, ranging from 89% in Malta to 65% in France (see Chart 2.19). The second-largest position consists of financial liabilities held for trading. The share of trading liabilities was the largest for banks in Germany and France, mirroring the importance of investment banking activities on the assets side in these countries.
Chart 2.19 Liability breakdown for euro area banking sectors
(2016; all domestic banks; percentage of total assets)
Sources: ECB (CBD) and ECB calculations. Notes: IFRS reporting banks only. Data are not available for Slovakia. Other liabilities include, for instance, deposits from central banks, financial liabilities associated with transferred financial assets, and tax liabilities. Owing to non-availability of data, the following positions are also included in other liabilities: derivatives and financial liabilities at fair value for Estonia, and derivatives and provisions for Lithuania.
2.2.2 Financial performance and cost structure
The profitability of the euro area banking sector, as measured by the median ROA and ROE, remained stable in 2016 compared with the previous year (see Chart 2.20 and Chart 2.21). However, the distribution of these indicators shifted upwards. The biggest increases in profit ratios took place in comparatively small banking systems (Cyprus, Greece, Finland, Slovenia and the Baltic countries). By contrast, the profitability of the Italian and Portuguese banking systems decreased from the already relatively low levels in the previous year.
0%
10%
20%
30%
40%
50%
60%
70%
80%
90%
100%
MT LT LV CY SI PT FI IE ES EE BE NL GR LU IT AT DE FR
financial liabilities measured at amortised cost financial liabilities held for trading financial liabilities designated at fair value through profit or loss derivatives (hedge accounting) provisions other

Report on financial structures, October 2017 38
Chart 2.21 Return on equity of euro area banking sectors
(all domestic banks; percentages; maximum, minimum, interquartile range and median across national banking sectors)
Sources: ECB (CBD) and ECB calculations.
Bank profitability indicators were largely influenced by the continued decline in median provisions and impairments in 2016 (see Chart 2.22). In particular, the Cypriot and Greek banking sectors, which previously featured at the top end of the distribution, reduced provisions and impairments markedly in 2016, which also significantly improved the return on bank assets in these countries (see Chart 2.23). By contrast, the Italian and the Portuguese banking sectors were faced with significant increases in provisions and impairments, indicating increased efforts in restoring balance sheet soundness.
Chart 2.23 Net income and provisions and impairments of euro area banking sectors
(all domestic banks; percentage of total assets)
Sources: ECB (CBD) and ECB calculations. Notes: IFRS reporting banks only. Data on provisions and impairments are not available for Estonia, Lithuania and Slovakia.
-130
-120
-110
-100
-90
-80
-70
-60
-50
-40
-30
-20
-10
0
10
20
2008 2009 2010 2011 2012 2013 2014 2015 2016
-165% -146%-165%
CY SI
GR
IT
PT
-1
0
1
2
3
4
5
-3 -2 -1 0 1 2 3
Prov
isio
ns a
nd im
pairm
ents
Return on assets
2015 2016
Chart 2.20 Return on assets of euro area banking sectors
(all domestic banks; percentages; maximum, minimum, interquartile range and median across national banking sectors)
Sources: ECB (CBD) and ECB calculations.
Chart 2.22 Provisions and impairments of euro area banking sectors
(all domestic banks; percentage of total assets; maximum, minimum, interquartile range and median across national banking sectors)
Sources: ECB (CBD) and ECB calculations. Notes: IFRS reporting banks only. For confidentiality reasons, data may not be available for all euro area countries for all the years.
-12
-10
-8
-6
-4
-2
0
2
4
2008 2009 2010 2011 2012 2013 2014 2015 2016
0
2
4
6
8
10
12
14
2008 2009 2010 2011 2012 2013 2014 2015 2016

Report on financial structures, October 2017 39
Most of the impairment charges during 2016 were attributable to losses on loans and receivables (see Chart 2.24). In some countries, sizeable impairments were also incurred on available-for-sale financial assets and on non-financial assets. Portuguese banks again reported the largest relative share of impairments related to available-for-sale financial assets in 2016.
Chart 2.24 Impairment charge breakdown for euro area banking sectors
(2016; all domestic banks; percentage of total impairments)
Sources: ECB (CBD) and ECB calculations. Notes: IFRS reporting banks only. Data are not available for Estonia, Finland, Lithuania, Malta and Slovakia.
The median NPL ratio continued to decrease in 2016 (see Chart 2.25). Significant declines took place in the Estonian, Irish, Lithuanian, Maltese and Slovenian banking systems. However, the persistence of high NPL ratios in several euro area countries underlines the need to continue the efforts to tackle this problem in order to free up bank capital and facilitate credit growth.
The median coverage ratio for euro area banking systems increased to 50% in 2016 from 47% the previous year (see Chart 2.26). The most significant increases took place in Estonia, Lithuania, Luxembourg and Slovakia. Notably, the coverage ratios also improved in some countries with high levels of NPLs, such as Cyprus, Italy and Portugal. By contrast, coverage ratios declined in Spain, Ireland, Finland and the Netherlands, and marginally in Greece. While low coverage ratios may partly reflect the higher collateralisation of loans and NPLs, they can also contribute to wide pricing gaps between potential buyers and sellers of NPLs and thereby impede
-10%
0%
10%
20%
30%
40%
50%
60%
70%
80%
90%
100%
IE LU BE CY GR LV IT FR ES NL SI PT AT DE
loans and receivablesfinancial assets measured at costavailable-for-sale financial assets
held-to-maturity investmentsimpairments on non-financial assets
Chart 2.25 Gross total doubtful and non-performing loans of euro area banking sectors
(all domestic banks; percentage of debt instruments and total loans and advances; maximum, minimum, interquartile range and median across national banking sectors)
Sources: ECB (CBD) and ECB calculations. Notes: Data are available from 2012 onwards for Ireland and from 2014 onwards for Luxembourg and Slovenia. Data are not fully comparable across countries owing to different definitions of NPLs across countries and over time.
0
5
10
15
20
25
30
35
40
45
50
2008 2009 2010 2011 2012 2013 2014 2015 2016
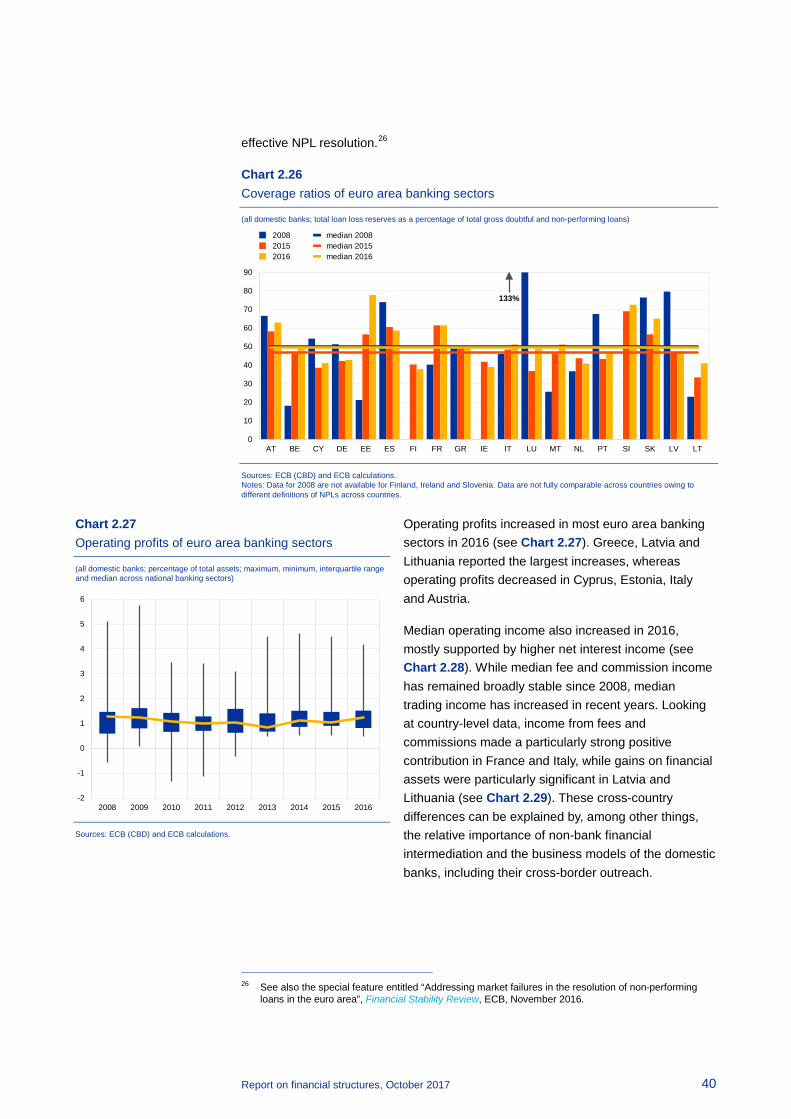
Report on financial structures, October 2017 40
effective NPL resolution.26
Chart 2.26 Coverage ratios of euro area banking sectors
(all domestic banks; total loan loss reserves as a percentage of total gross doubtful and non-performing loans)
Sources: ECB (CBD) and ECB calculations. Notes: Data for 2008 are not available for Finland, Ireland and Slovenia. Data are not fully comparable across countries owing to different definitions of NPLs across countries.
Operating profits increased in most euro area banking sectors in 2016 (see Chart 2.27). Greece, Latvia and Lithuania reported the largest increases, whereas operating profits decreased in Cyprus, Estonia, Italy and Austria.
Median operating income also increased in 2016, mostly supported by higher net interest income (see Chart 2.28). While median fee and commission income has remained broadly stable since 2008, median trading income has increased in recent years. Looking at country-level data, income from fees and commissions made a particularly strong positive contribution in France and Italy, while gains on financial assets were particularly significant in Latvia and Lithuania (see Chart 2.29). These cross-country differences can be explained by, among other things, the relative importance of non-bank financial intermediation and the business models of the domestic banks, including their cross-border outreach.
26 See also the special feature entitled “Addressing market failures in the resolution of non-performing
loans in the euro area”, Financial Stability Review, ECB, November 2016.
0
10
20
30
40
50
60
70
80
90
AT BE CY DE EE ES FI FR GR IE IT LU MT NL PT SI SK LV LT
133%
200820152016
median 2008median 2015median 2016
Chart 2.27 Operating profits of euro area banking sectors
(all domestic banks; percentage of total assets; maximum, minimum, interquartile range and median across national banking sectors)
Sources: ECB (CBD) and ECB calculations.
-2
-1
0
1
2
3
4
5
6
2008 2009 2010 2011 2012 2013 2014 2015 2016
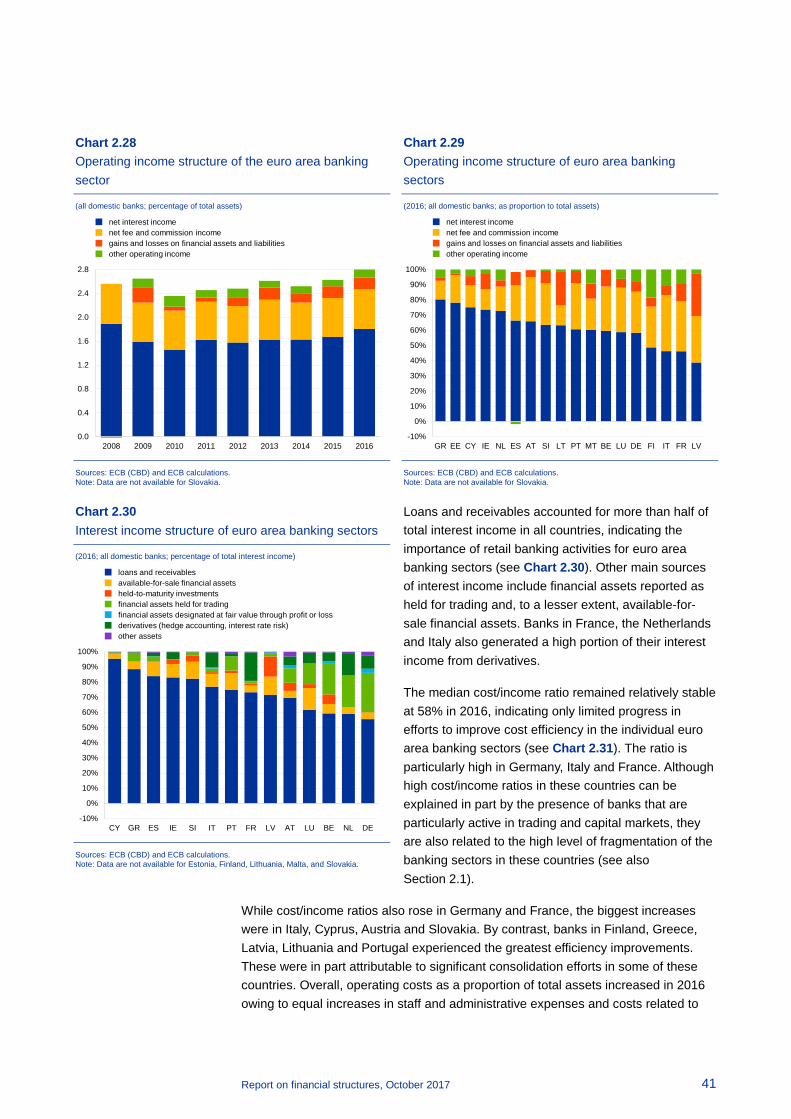
Report on financial structures, October 2017 41
Chart 2.29 Operating income structure of euro area banking sectors
(2016; all domestic banks; as proportion to total assets)
Sources: ECB (CBD) and ECB calculations. Note: Data are not available for Slovakia.
Loans and receivables accounted for more than half of total interest income in all countries, indicating the importance of retail banking activities for euro area banking sectors (see Chart 2.30). Other main sources of interest income include financial assets reported as held for trading and, to a lesser extent, available-for-sale financial assets. Banks in France, the Netherlands and Italy also generated a high portion of their interest income from derivatives.
The median cost/income ratio remained relatively stable at 58% in 2016, indicating only limited progress in efforts to improve cost efficiency in the individual euro area banking sectors (see Chart 2.31). The ratio is particularly high in Germany, Italy and France. Although high cost/income ratios in these countries can be explained in part by the presence of banks that are particularly active in trading and capital markets, they are also related to the high level of fragmentation of the banking sectors in these countries (see also Section 2.1).
While cost/income ratios also rose in Germany and France, the biggest increases were in Italy, Cyprus, Austria and Slovakia. By contrast, banks in Finland, Greece, Latvia, Lithuania and Portugal experienced the greatest efficiency improvements. These were in part attributable to significant consolidation efforts in some of these countries. Overall, operating costs as a proportion of total assets increased in 2016 owing to equal increases in staff and administrative expenses and costs related to
-10%
0%
10%
20%
30%
40%
50%
60%
70%
80%
90%
100%
GR EE CY IE NL ES AT SI LT PT MT BE LU DE FI IT FR LV
net interest income net fee and commission incomegains and losses on financial assets and liabilities other operating income
Chart 2.28 Operating income structure of the euro area banking sector
(all domestic banks; percentage of total assets)
Sources: ECB (CBD) and ECB calculations. Note: Data are not available for Slovakia.
Chart 2.30 Interest income structure of euro area banking sectors
(2016; all domestic banks; percentage of total interest income)
Sources: ECB (CBD) and ECB calculations. Note: Data are not available for Estonia, Finland, Lithuania, Malta, and Slovakia.
0.0
0.4
0.8
1.2
1.6
2.0
2.4
2.8
2008 2009 2010 2011 2012 2013 2014 2015 2016
net interest incomenet fee and commission incomegains and losses on financial assets and liabilitiesother operating income
-10%
0%
10%
20%
30%
40%
50%
60%
70%
80%
90%
100%
CY GR ES IE SI IT PT FR LV AT LU BE NL DE
loans and receivablesavailable-for-sale financial assets held-to-maturity investments financial assets held for trading financial assets designated at fair value through profit or loss derivatives (hedge accounting, interest rate risk) other assets
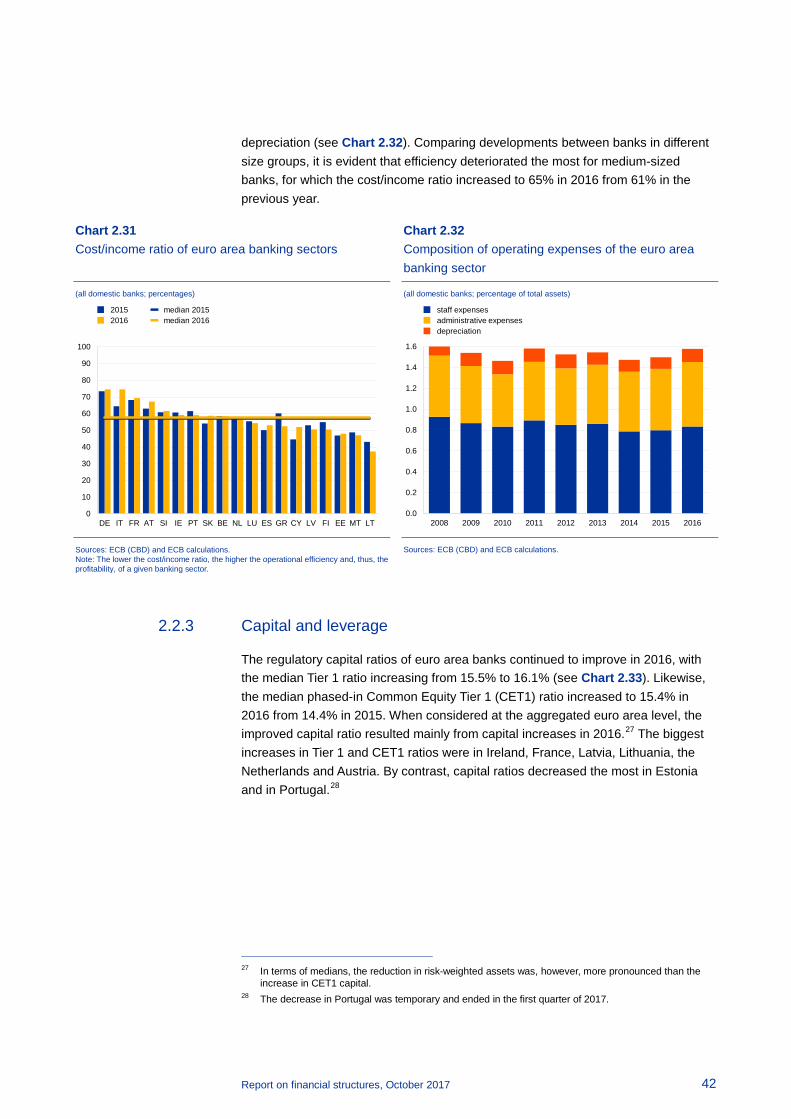
Report on financial structures, October 2017 42
depreciation (see Chart 2.32). Comparing developments between banks in different size groups, it is evident that efficiency deteriorated the most for medium-sized banks, for which the cost/income ratio increased to 65% in 2016 from 61% in the previous year.
Chart 2.32 Composition of operating expenses of the euro area banking sector
(all domestic banks; percentage of total assets)
Sources: ECB (CBD) and ECB calculations.
2.2.3 Capital and leverage
The regulatory capital ratios of euro area banks continued to improve in 2016, with the median Tier 1 ratio increasing from 15.5% to 16.1% (see Chart 2.33). Likewise, the median phased-in Common Equity Tier 1 (CET1) ratio increased to 15.4% in 2016 from 14.4% in 2015. When considered at the aggregated euro area level, the improved capital ratio resulted mainly from capital increases in 2016.27 The biggest increases in Tier 1 and CET1 ratios were in Ireland, France, Latvia, Lithuania, the Netherlands and Austria. By contrast, capital ratios decreased the most in Estonia and in Portugal.28
27 In terms of medians, the reduction in risk-weighted assets was, however, more pronounced than the
increase in CET1 capital. 28 The decrease in Portugal was temporary and ended in the first quarter of 2017.
0.0
0.2
0.4
0.6
0.8
1.0
1.2
1.4
1.6
2008 2009 2010 2011 2012 2013 2014 2015 2016
staff expensesadministrative expensesdepreciation
Chart 2.31 Cost/income ratio of euro area banking sectors
(all domestic banks; percentages)
Sources: ECB (CBD) and ECB calculations. Note: The lower the cost/income ratio, the higher the operational efficiency and, thus, the profitability, of a given banking sector.
0
10
20
30
40
50
60
70
80
90
100
DE IT FR AT SI IE PT SK BE NL LU ES GR CY LV FI EE MT LT
20152016
median 2015median 2016
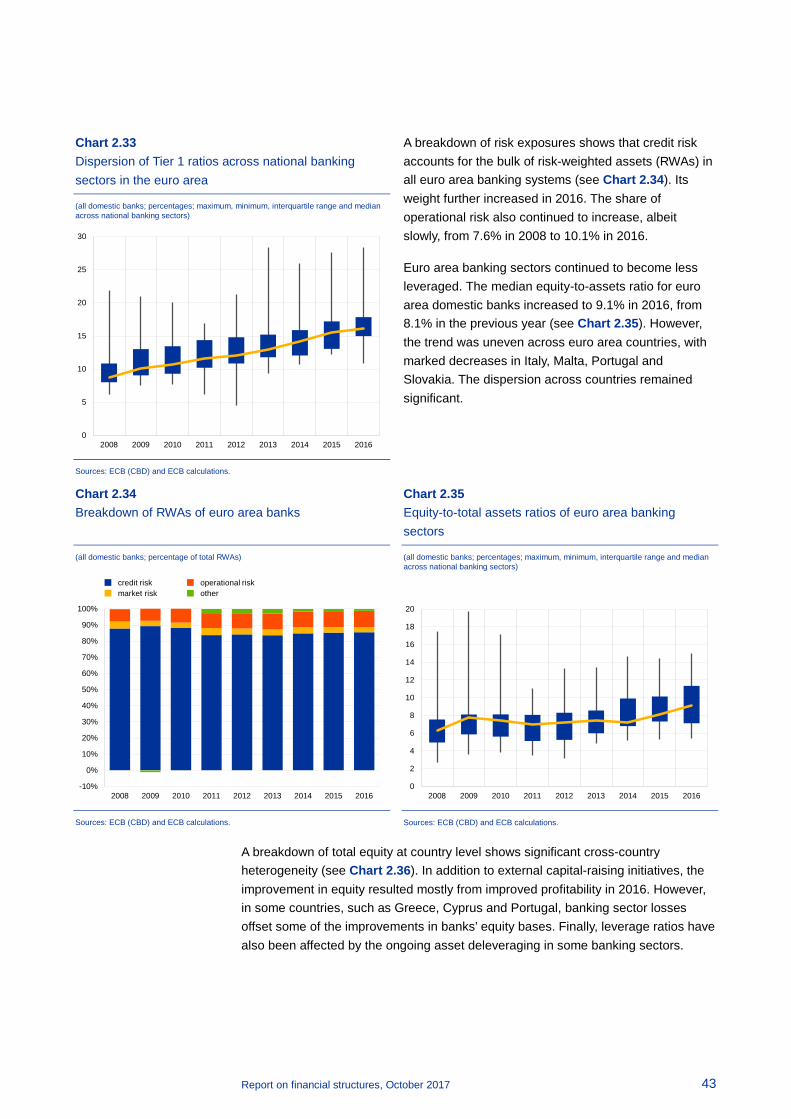
Report on financial structures, October 2017 43
A breakdown of risk exposures shows that credit risk accounts for the bulk of risk-weighted assets (RWAs) in all euro area banking systems (see Chart 2.34). Its weight further increased in 2016. The share of operational risk also continued to increase, albeit slowly, from 7.6% in 2008 to 10.1% in 2016.
Euro area banking sectors continued to become less leveraged. The median equity-to-assets ratio for euro area domestic banks increased to 9.1% in 2016, from 8.1% in the previous year (see Chart 2.35). However, the trend was uneven across euro area countries, with marked decreases in Italy, Malta, Portugal and Slovakia. The dispersion across countries remained significant.
Chart 2.35 Equity-to-total assets ratios of euro area banking sectors
(all domestic banks; percentages; maximum, minimum, interquartile range and median across national banking sectors)
Sources: ECB (CBD) and ECB calculations.
A breakdown of total equity at country level shows significant cross-country heterogeneity (see Chart 2.36). In addition to external capital-raising initiatives, the improvement in equity resulted mostly from improved profitability in 2016. However, in some countries, such as Greece, Cyprus and Portugal, banking sector losses offset some of the improvements in banks’ equity bases. Finally, leverage ratios have also been affected by the ongoing asset deleveraging in some banking sectors.
0
2
4
6
8
10
12
14
16
18
20
2008 2009 2010 2011 2012 2013 2014 2015 2016
Chart 2.33 Dispersion of Tier 1 ratios across national banking sectors in the euro area
(all domestic banks; percentages; maximum, minimum, interquartile range and median across national banking sectors)
Sources: ECB (CBD) and ECB calculations.
Chart 2.34 Breakdown of RWAs of euro area banks
(all domestic banks; percentage of total RWAs)
Sources: ECB (CBD) and ECB calculations.
0
5
10
15
20
25
30
2008 2009 2010 2011 2012 2013 2014 2015 2016
-10%
0%
10%
20%
30%
40%
50%
60%
70%
80%
90%
100%
2008 2009 2010 2011 2012 2013 2014 2015 2016
credit riskmarket risk
operational riskother

Report on financial structures, October 2017 44
Chart 2.36 Main components of total equity of euro area banks by country
(2016; all domestic banks; percentage of total assets)
Sources: ECB (CBD) and ECB calculations. Notes: The category “other” includes, among other things, share premia, equity instruments issued other than capital, and accumulated other comprehensive income. Owing to non-availability of data, the following positions are included in “other”: minority interests for Lithuania and Slovakia, and revaluation reserves for Estonia, Slovenia and Slovakia.
-15
-10
-5
0
5
10
15
20
25
EE LU SI SK GR IE LV CY LT MT AT ES FI PT IT FR BE NL DE
issued capital revaluation reserves and other valuation differences retained earningsincome from current year
minority interestsothertotal equity
Report on financial structures, October 2017 45
3 Insurance corporations and pension funds
This chapter discusses recent structural developments in the euro area insurance and pension fund sectors. It focuses on the general market structure, on developments in key sector-wide balance sheet items and on changes in profitability and solvency. The chapter mainly relies on publicly available data from the new and enhanced ECB statistics on the balance sheets of euro area insurance corporations and pension funds (ICPFs) but also uses data from the European Insurance and Occupational Pensions Authority (EIOPA).29
In 2016, the assets of euro area ICPFs continued to grow, reaching €10.2 trillion at the end of the year. The sector remains strongly concentrated in a relatively small number of countries. In particular, France and Germany each account for more than a quarter of the euro area ICPF sector, followed by the Netherlands (18%) and Italy (10%). In the current low-yield environment, ICPFs in some jurisdictions have been shifting their portfolios towards higher-yielding assets to boost their income. For instance, the share of currency and deposits in the overall ICPF portfolio declined in 2016 at the fastest pace since 2008 – from 8.3% at the end of 2015 to 7.2% at the end of 2016. In addition, life insurance business has been gradually shifting away from policies with guaranteed rates of return (non-unit-linked policies) towards unit-linked policies. The profitability of the insurance sector, and in particular the life insurance sector, has been constrained in recent years by the low-yield environment despite the more supportive recent macroeconomic and financial developments. However, the solvency position of the insurance sector is well above the requirements of the EU’s supervisory regime for insurance companies (Solvency II). At end-2016, the median SCR ratio stood at about 188% for the insurance groups in our sample.
3.1 Structure of the insurance corporations and pension funds sector
According to the ECB’s new statistics on euro area insurance corporations (ICs) and pension funds (PFs), total assets of the ICPF sector stood at €10.2 trillion at the end of 2016 (Chart 3.1). The new and enhanced statistics for the sector (see Box 1 for more details) introduced a structural break between 2015 and 2016 which prevents a direct comparison of developments over the last year of the period under review. According to the previously applied statistical concept, however, total assets of the
29 In general, publicly available data for insurance corporations and pension funds are more limited than
for the banking sector. The new reporting under the Solvency II regime, which came into force on 1 January 2016, has improved the situation for insurance companies. However, in the initial stage, the structural changes related to the new regime make the assessment of the medium-term structural changes more complex, in particular as regards the dynamics of companies’ solvency positions.

Report on financial structures, October 2017 46
sector stood at €9.3 trillion at the end of 2015. Considering that the structural break amounts to around 5% (€0.4 trillion), more than half of the increase between 2015 and 2016 (€0.5 trillion) can be attributed to the growth of the sector.
The ICPF sector remains strongly concentrated in a couple of large euro area countries (Chart 3.2). In particular, more than 80% of the sector’s assets are concentrated in four countries only. France and Germany each account for more than a quarter of the euro area ICPF sector, followed by the Netherlands (18%) and Italy (10%).
Chart 3.2 Assets of ICPFs in euro area countries
(2016; EUR trillions)
Source: ECB (IC and PF balance sheet data).
Relative to GDP, the largest ICPF sectors are found in Luxembourg, the Netherlands, Ireland and France (Chart 3.3). In all these countries, ICPF assets exceed the country’s GDP. However, the main ICPF activity differs across these countries. Luxembourg is the principal European hub for captive reinsurers.30 The French market is dominated by the bancassurance business model, whereby insurance is located within financial conglomerates. The Netherlands and, to a lesser extent, Ireland stand out for the large size of their occupational pension funds, which account for 196% and 40% of GDP respectively. Since pension systems in other euro area countries usually rely heavily on public pension schemes, the importance of occupational pension funds in these countries is relatively limited (below 20% of GDP).31
30 A captive insurer is a company that is established by its parents to cover specific risks that the parents
are exposed to. In the EU, insurance captives are supervised in the same way as any other insurance companies and considered from a consolidated perspective in terms of group supervision.
31 The ECB’s statistics do not include any public pension funds.
0.0
0.5
1.0
1.5
2.0
2.5
3.0
DE FR NL IT ES IE BE LU AT FI PT GR SK SI MT CY EE LT LV
insurance corporationspension funds
Chart 3.1 Total assets of euro area ICPFs
(2008-16; EUR trillions)
Notes: The solid vertical line indicates the structural break in the data due to the changes in ECB’s IC and PF balance sheet data. See Box 1 for more details. Source: ECB (IC and PF balance sheet data).
0
1
2
3
4
5
6
7
8
9
10
11
2008 2009 2010 2011 2012 2013 2014 2015 2016
insurance corporationspension funds
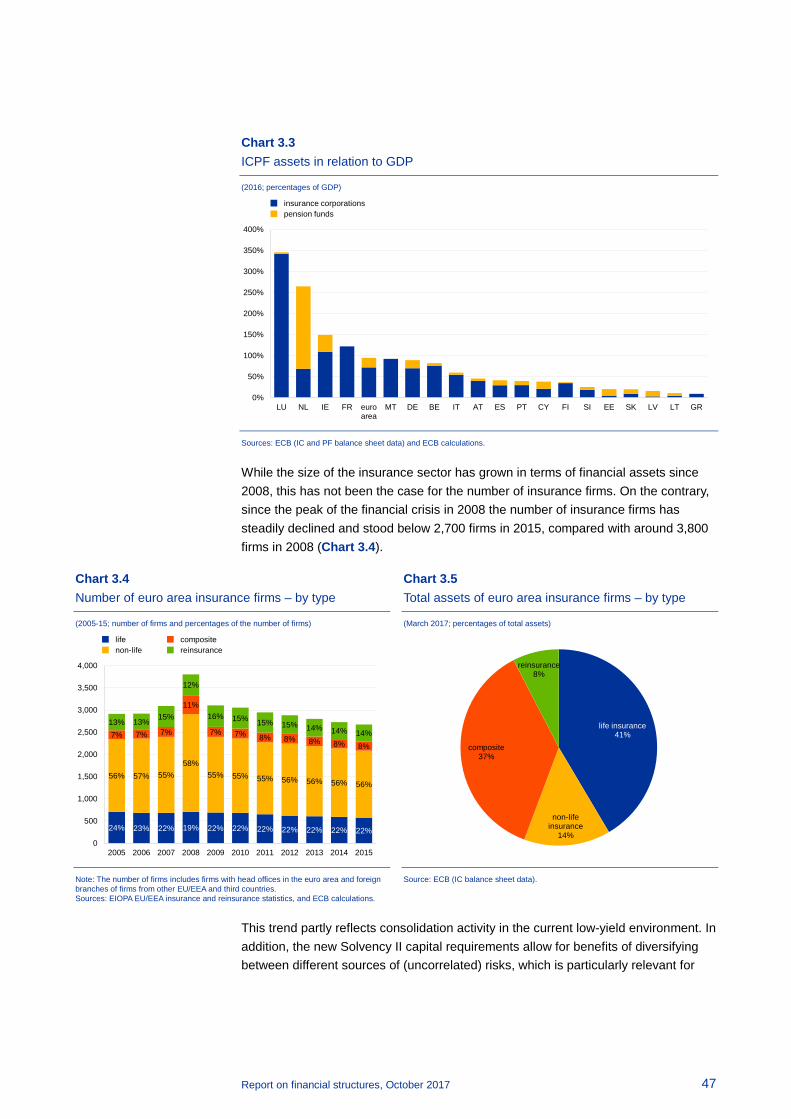
Report on financial structures, October 2017 47
Chart 3.3 ICPF assets in relation to GDP
(2016; percentages of GDP)
Sources: ECB (IC and PF balance sheet data) and ECB calculations.
While the size of the insurance sector has grown in terms of financial assets since 2008, this has not been the case for the number of insurance firms. On the contrary, since the peak of the financial crisis in 2008 the number of insurance firms has steadily declined and stood below 2,700 firms in 2015, compared with around 3,800 firms in 2008 (Chart 3.4).
Chart 3.5 Total assets of euro area insurance firms – by type
(March 2017; percentages of total assets)
Source: ECB (IC balance sheet data).
This trend partly reflects consolidation activity in the current low-yield environment. In addition, the new Solvency II capital requirements allow for benefits of diversifying between different sources of (uncorrelated) risks, which is particularly relevant for
0%
50%
100%
150%
200%
250%
300%
350%
400%
LU NL IE FR euroarea
MT DE BE IT AT ES PT CY FI SI EE SK LV LT GR
insurance corporationspension funds
life insurance41%
non-life insurance
14%
composite37%
reinsurance8%
Chart 3.4 Number of euro area insurance firms – by type
(2005-15; number of firms and percentages of the number of firms)
Note: The number of firms includes firms with head offices in the euro area and foreign branches of firms from other EU/EEA and third countries. Sources: EIOPA EU/EEA insurance and reinsurance statistics, and ECB calculations.
24% 23% 22% 19% 22% 22% 22% 22% 22% 22% 22%
56% 57% 55%58%
55% 55% 55% 56% 56% 56% 56%
7% 7% 7%
11%
7% 7% 8% 8% 8% 8% 8%
13% 13% 15%
12%
16% 15% 15% 15% 14% 14% 14%
0
500
1,000
1,500
2,000
2,500
3,000
3,500
4,000
2005 2006 2007 2008 2009 2010 2011 2012 2013 2014 2015
lifenon-life
compositereinsurance
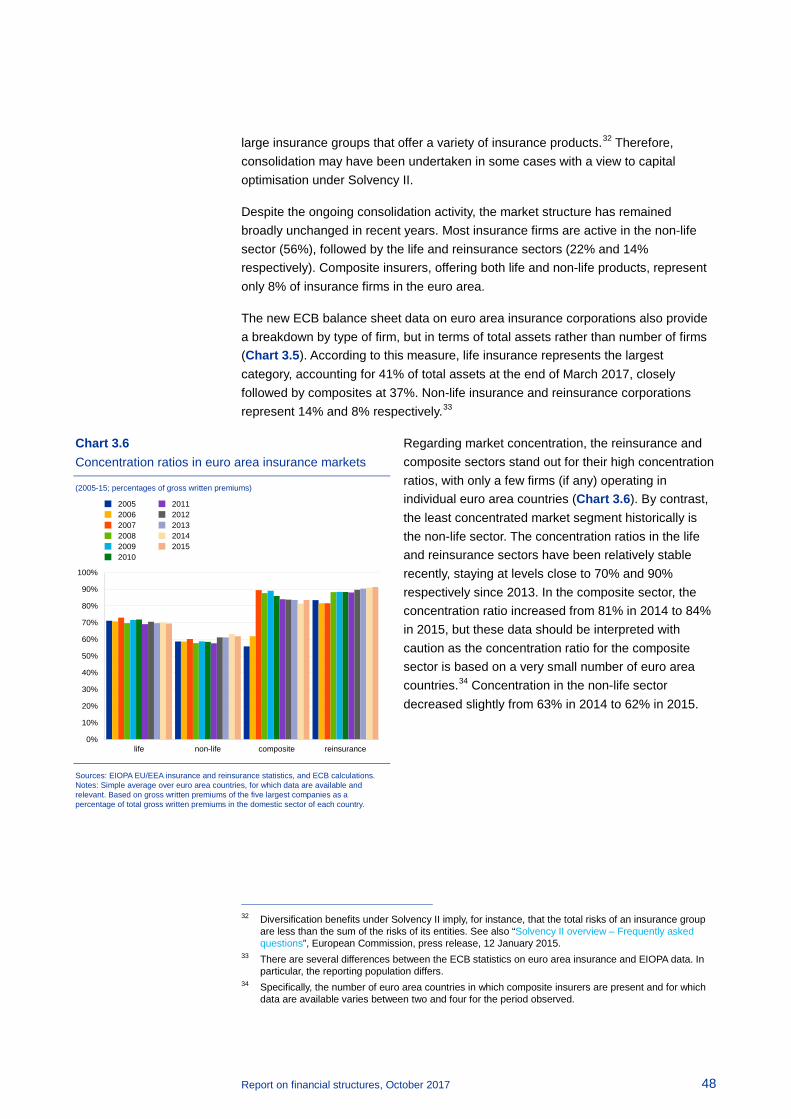
Report on financial structures, October 2017 48
large insurance groups that offer a variety of insurance products.32 Therefore, consolidation may have been undertaken in some cases with a view to capital optimisation under Solvency II.
Despite the ongoing consolidation activity, the market structure has remained broadly unchanged in recent years. Most insurance firms are active in the non-life sector (56%), followed by the life and reinsurance sectors (22% and 14% respectively). Composite insurers, offering both life and non-life products, represent only 8% of insurance firms in the euro area.
The new ECB balance sheet data on euro area insurance corporations also provide a breakdown by type of firm, but in terms of total assets rather than number of firms (Chart 3.5). According to this measure, life insurance represents the largest category, accounting for 41% of total assets at the end of March 2017, closely followed by composites at 37%. Non-life insurance and reinsurance corporations represent 14% and 8% respectively.33
Regarding market concentration, the reinsurance and composite sectors stand out for their high concentration ratios, with only a few firms (if any) operating in individual euro area countries (Chart 3.6). By contrast, the least concentrated market segment historically is the non-life sector. The concentration ratios in the life and reinsurance sectors have been relatively stable recently, staying at levels close to 70% and 90% respectively since 2013. In the composite sector, the concentration ratio increased from 81% in 2014 to 84% in 2015, but these data should be interpreted with caution as the concentration ratio for the composite sector is based on a very small number of euro area countries.34 Concentration in the non-life sector decreased slightly from 63% in 2014 to 62% in 2015.
32 Diversification benefits under Solvency II imply, for instance, that the total risks of an insurance group
are less than the sum of the risks of its entities. See also “Solvency II overview – Frequently asked questions”, European Commission, press release, 12 January 2015.
33 There are several differences between the ECB statistics on euro area insurance and EIOPA data. In particular, the reporting population differs.
34 Specifically, the number of euro area countries in which composite insurers are present and for which data are available varies between two and four for the period observed.
Chart 3.6 Concentration ratios in euro area insurance markets
(2005-15; percentages of gross written premiums)
Sources: EIOPA EU/EEA insurance and reinsurance statistics, and ECB calculations. Notes: Simple average over euro area countries, for which data are available and relevant. Based on gross written premiums of the five largest companies as a percentage of total gross written premiums in the domestic sector of each country.
0%
10%
20%
30%
40%
50%
60%
70%
80%
90%
100%
life non-life composite reinsurance
200520062007200820092010
20112012201320142015
Report on financial structures, October 2017 49
Box 1 New quantitative information on insurance corporations and pension funds
New and improved quantitative information on insurance corporations has become available during 2017. This is due to two developments, which are to some extent inter-related. First, the ECB released new, harmonised statistics for euro area insurance corporations for the first time in February 2017. Second, data collected by EIOPA and the national insurance supervisors for the purpose of the Solvency II framework have recently become available. Solvency II data are also used as inputs into the compilation process for the ECB dataset to limit the reporting burden for insurers.
The new ECB dataset consists of assets and liabilities of euro area insurance corporations on a solo basis. These data replace the previous ECB insurance corporations data released from June 2011 to October 2016. Owing to changes in methodology and coverage, the new dataset is not directly comparable with the old dataset. In total, the assets held by the euro area insurance sector are approximately 5% higher according to the new statistics compared with the previous ones.
The new dataset provides a number of improvements over the previous dataset, such as harmonised concepts, full coverage of institutions and more timely data releases. In addition, the new dataset is much more granular. The assets and liabilities are now further broken down, providing more detailed information on the geographical location and economic sector of counterparties as well as on maturities of the instruments held. Balance sheet information is available separately for life, non-life, composite and reinsurance corporations. In addition, transaction data are available in addition to data on outstanding amounts. The scope of the data will gradually increase over time.
Together with the new dataset on insurance corporations, a separate dataset on assets and liabilities of pension funds has also been made available by the ECB. However, these data, aligned with the new statistical standards (ESA 2010), have not been fully harmonised across the euro area. To further enhance the availability of harmonised data for this sector, the ECB has recently carried out a public consultation on a draft regulation on statistical reporting requirements for pension funds.35
3.2 Asset and liability structure
The financial portfolio of euro area ICPFs is dominated by fixed income instruments (Chart 3.7). At the end of 2016, close to 40% of the ICPF portfolio was invested in debt securities, with euro area government bonds accounting for nearly half of this position. The second most prominent investment class was investment fund shares
35 See the ECB’s press release entitled “ECB seeks to increase transparency of euro area pension fund
sector”, 26 July 2017.
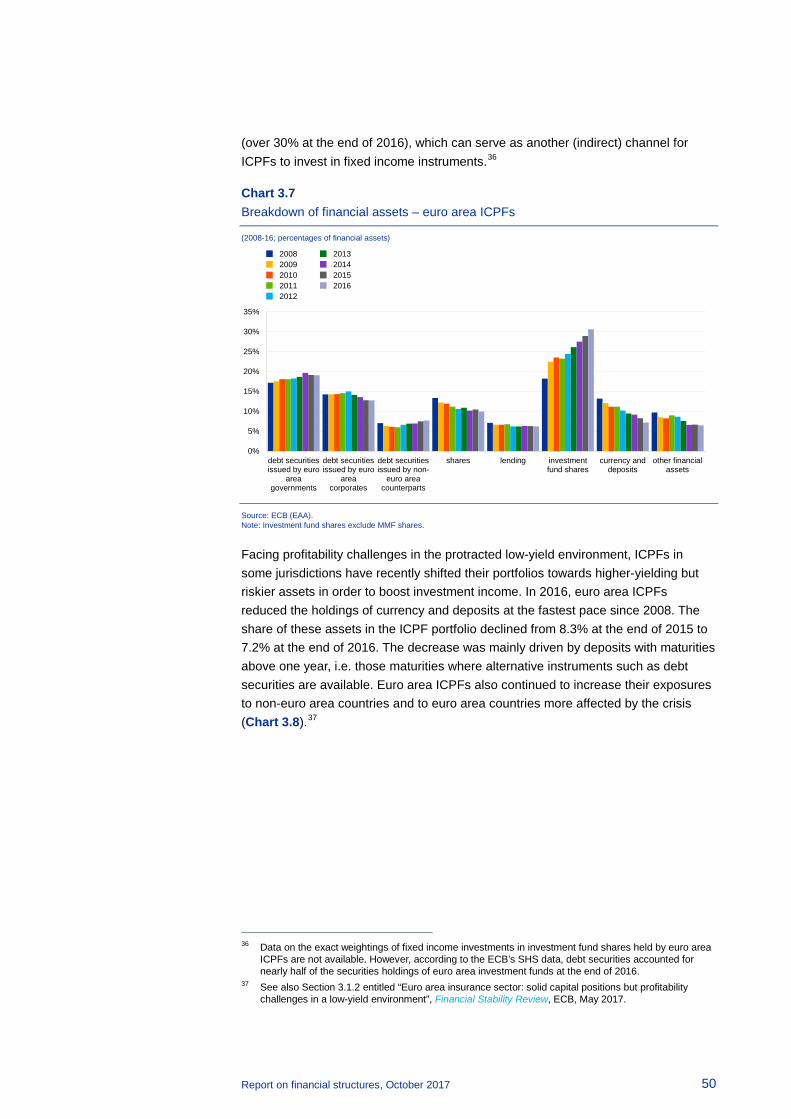
Report on financial structures, October 2017 50
(over 30% at the end of 2016), which can serve as another (indirect) channel for ICPFs to invest in fixed income instruments.36
Chart 3.7 Breakdown of financial assets – euro area ICPFs
(2008-16; percentages of financial assets)
Source: ECB (EAA). Note: Investment fund shares exclude MMF shares.
Facing profitability challenges in the protracted low-yield environment, ICPFs in some jurisdictions have recently shifted their portfolios towards higher-yielding but riskier assets in order to boost investment income. In 2016, euro area ICPFs reduced the holdings of currency and deposits at the fastest pace since 2008. The share of these assets in the ICPF portfolio declined from 8.3% at the end of 2015 to 7.2% at the end of 2016. The decrease was mainly driven by deposits with maturities above one year, i.e. those maturities where alternative instruments such as debt securities are available. Euro area ICPFs also continued to increase their exposures to non-euro area countries and to euro area countries more affected by the crisis (Chart 3.8).37
36 Data on the exact weightings of fixed income investments in investment fund shares held by euro area
ICPFs are not available. However, according to the ECB’s SHS data, debt securities accounted for nearly half of the securities holdings of euro area investment funds at the end of 2016.
37 See also Section 3.1.2 entitled “Euro area insurance sector: solid capital positions but profitability challenges in a low-yield environment”, Financial Stability Review, ECB, May 2017.
0%
5%
10%
15%
20%
25%
30%
35%
debt securitiesissued by euro
areagovernments
debt securitiesissued by euro
areacorporates
debt securitiesissued by non-
euro areacounterparts
shares lending investmentfund shares
currency anddeposits
other financialassets
20082009201020112012
2013201420152016
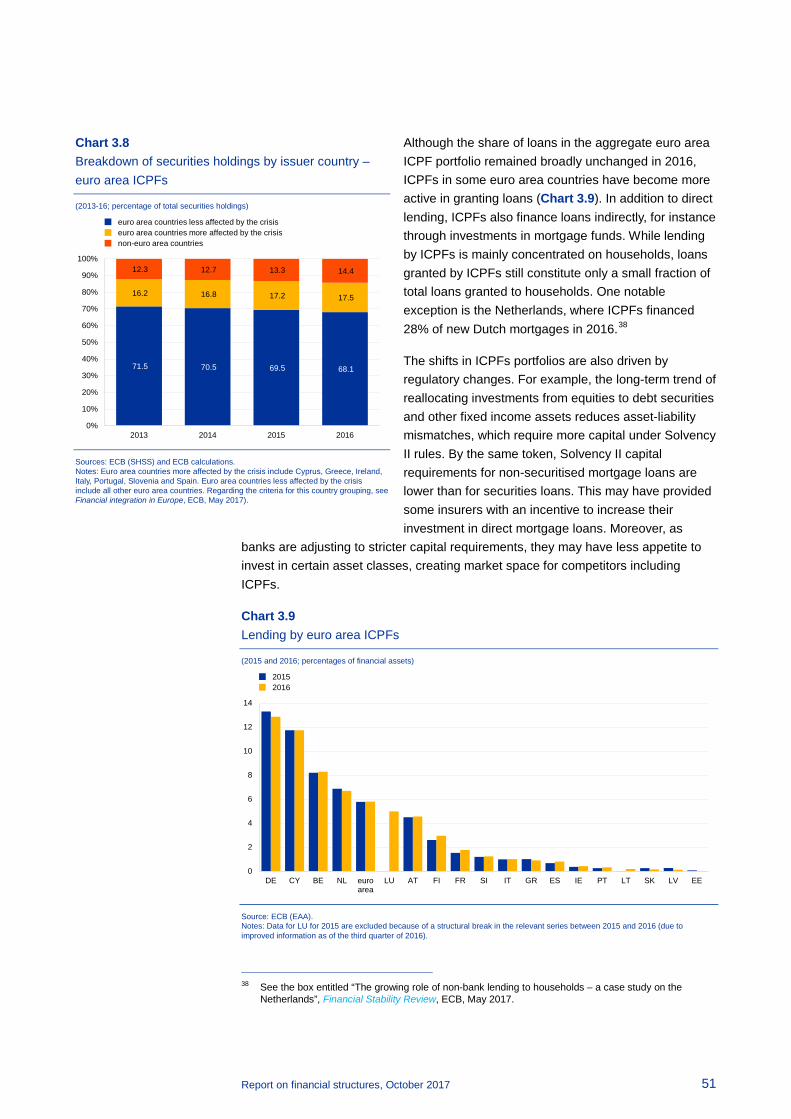
Report on financial structures, October 2017 51
Although the share of loans in the aggregate euro area ICPF portfolio remained broadly unchanged in 2016, ICPFs in some euro area countries have become more active in granting loans (Chart 3.9). In addition to direct lending, ICPFs also finance loans indirectly, for instance through investments in mortgage funds. While lending by ICPFs is mainly concentrated on households, loans granted by ICPFs still constitute only a small fraction of total loans granted to households. One notable exception is the Netherlands, where ICPFs financed 28% of new Dutch mortgages in 2016.38
The shifts in ICPFs portfolios are also driven by regulatory changes. For example, the long-term trend of reallocating investments from equities to debt securities and other fixed income assets reduces asset-liability mismatches, which require more capital under Solvency II rules. By the same token, Solvency II capital requirements for non-securitised mortgage loans are lower than for securities loans. This may have provided some insurers with an incentive to increase their investment in direct mortgage loans. Moreover, as
banks are adjusting to stricter capital requirements, they may have less appetite to invest in certain asset classes, creating market space for competitors including ICPFs.
Chart 3.9 Lending by euro area ICPFs
(2015 and 2016; percentages of financial assets)
Source: ECB (EAA). Notes: Data for LU for 2015 are excluded because of a structural break in the relevant series between 2015 and 2016 (due to improved information as of the third quarter of 2016).
38 See the box entitled “The growing role of non-bank lending to households – a case study on the
Netherlands”, Financial Stability Review, ECB, May 2017.
0
2
4
6
8
10
12
14
DE CY BE NL euroarea
LU AT FI FR SI IT GR ES IE PT LT SK LV EE
20152016
Chart 3.8 Breakdown of securities holdings by issuer country – euro area ICPFs
(2013-16; percentage of total securities holdings)
Sources: ECB (SHSS) and ECB calculations. Notes: Euro area countries more affected by the crisis include Cyprus, Greece, Ireland, Italy, Portugal, Slovenia and Spain. Euro area countries less affected by the crisis include all other euro area countries. Regarding the criteria for this country grouping, see Financial integration in Europe, ECB, May 2017).
71.5 70.5 69.5 68.1
16.2 16.8 17.2 17.5
12.3 12.7 13.3 14.4
0%
10%
20%
30%
40%
50%
60%
70%
80%
90%
100%
2013 2014 2015 2016
euro area countries less affected by the crisiseuro area countries more affected by the crisisnon-euro area countries
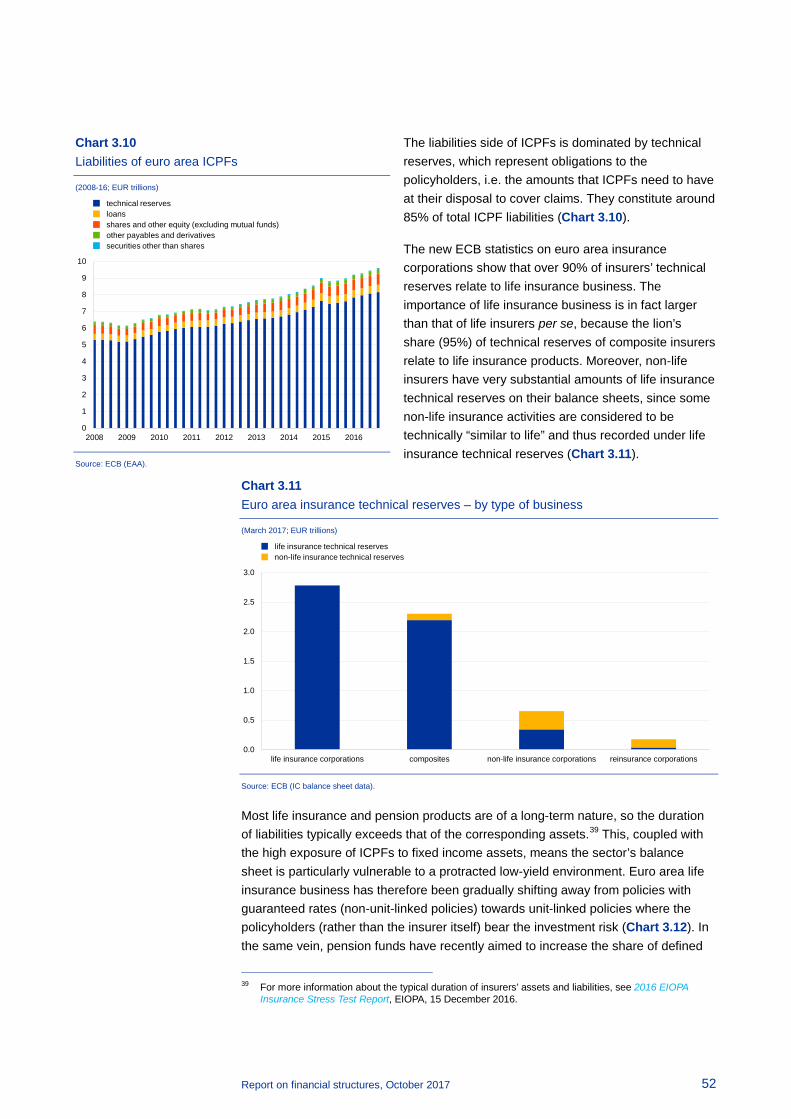
Report on financial structures, October 2017 52
The liabilities side of ICPFs is dominated by technical reserves, which represent obligations to the policyholders, i.e. the amounts that ICPFs need to have at their disposal to cover claims. They constitute around 85% of total ICPF liabilities (Chart 3.10).
The new ECB statistics on euro area insurance corporations show that over 90% of insurers’ technical reserves relate to life insurance business. The importance of life insurance business is in fact larger than that of life insurers per se, because the lion’s share (95%) of technical reserves of composite insurers relate to life insurance products. Moreover, non-life insurers have very substantial amounts of life insurance technical reserves on their balance sheets, since some non-life insurance activities are considered to be technically “similar to life” and thus recorded under life insurance technical reserves (Chart 3.11).
Chart 3.11 Euro area insurance technical reserves – by type of business
(March 2017; EUR trillions)
Source: ECB (IC balance sheet data).
Most life insurance and pension products are of a long-term nature, so the duration of liabilities typically exceeds that of the corresponding assets.39 This, coupled with the high exposure of ICPFs to fixed income assets, means the sector’s balance sheet is particularly vulnerable to a protracted low-yield environment. Euro area life insurance business has therefore been gradually shifting away from policies with guaranteed rates (non-unit-linked policies) towards unit-linked policies where the policyholders (rather than the insurer itself) bear the investment risk (Chart 3.12). In the same vein, pension funds have recently aimed to increase the share of defined
39 For more information about the typical duration of insurers’ assets and liabilities, see 2016 EIOPA
Insurance Stress Test Report, EIOPA, 15 December 2016.
0.0
0.5
1.0
1.5
2.0
2.5
3.0
life insurance corporations composites non-life insurance corporations reinsurance corporations
life insurance technical reservesnon-life insurance technical reserves
Chart 3.10 Liabilities of euro area ICPFs
(2008-16; EUR trillions)
Source: ECB (EAA).
0
1
2
3
4
5
6
7
8
9
10
2008 2009 2010 2011 2012 2013 2014 2015 2016
technical reservesloansshares and other equity (excluding mutual funds)other payables and derivativessecurities other than shares
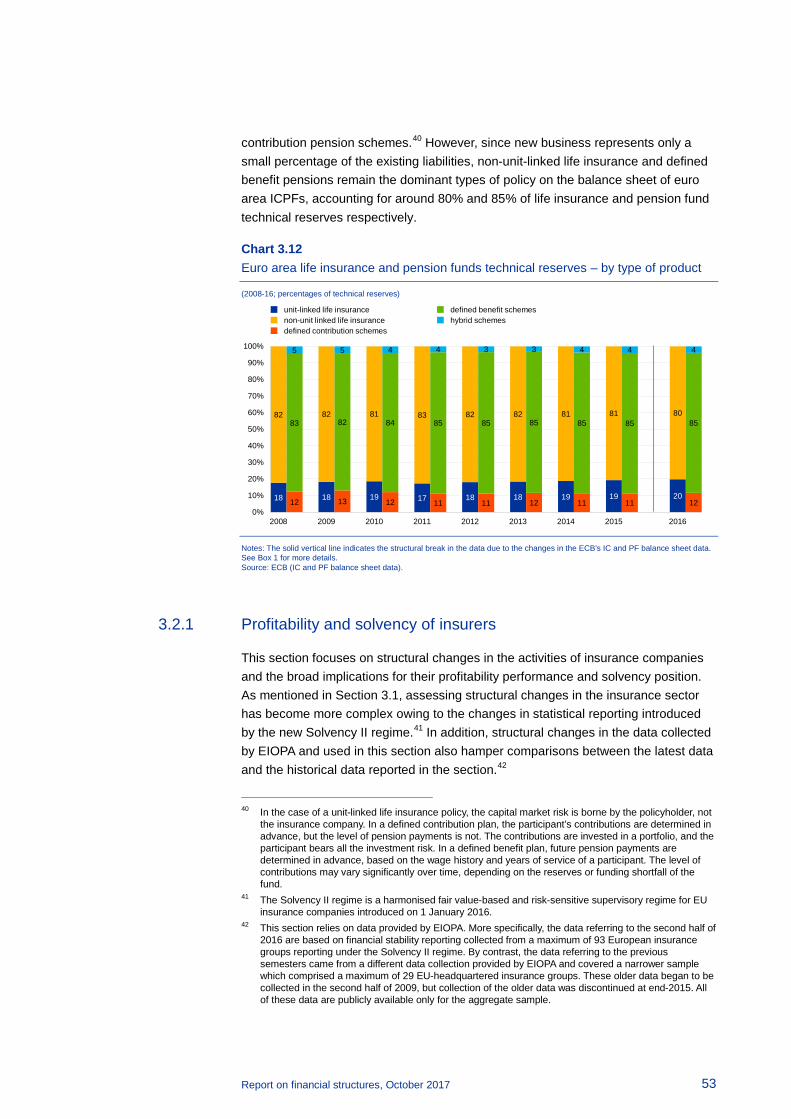
Report on financial structures, October 2017 53
contribution pension schemes.40 However, since new business represents only a small percentage of the existing liabilities, non-unit-linked life insurance and defined benefit pensions remain the dominant types of policy on the balance sheet of euro area ICPFs, accounting for around 80% and 85% of life insurance and pension fund technical reserves respectively.
Chart 3.12 Euro area life insurance and pension funds technical reserves – by type of product
(2008-16; percentages of technical reserves)
Notes: The solid vertical line indicates the structural break in the data due to the changes in the ECB’s IC and PF balance sheet data. See Box 1 for more details. Source: ECB (IC and PF balance sheet data).
3.2.1 Profitability and solvency of insurers
This section focuses on structural changes in the activities of insurance companies and the broad implications for their profitability performance and solvency position. As mentioned in Section 3.1, assessing structural changes in the insurance sector has become more complex owing to the changes in statistical reporting introduced by the new Solvency II regime.41 In addition, structural changes in the data collected by EIOPA and used in this section also hamper comparisons between the latest data and the historical data reported in the section.42
40 In the case of a unit-linked life insurance policy, the capital market risk is borne by the policyholder, not
the insurance company. In a defined contribution plan, the participant’s contributions are determined in advance, but the level of pension payments is not. The contributions are invested in a portfolio, and the participant bears all the investment risk. In a defined benefit plan, future pension payments are determined in advance, based on the wage history and years of service of a participant. The level of contributions may vary significantly over time, depending on the reserves or funding shortfall of the fund.
41 The Solvency II regime is a harmonised fair value-based and risk-sensitive supervisory regime for EU insurance companies introduced on 1 January 2016.
42 This section relies on data provided by EIOPA. More specifically, the data referring to the second half of 2016 are based on financial stability reporting collected from a maximum of 93 European insurance groups reporting under the Solvency II regime. By contrast, the data referring to the previous semesters came from a different data collection provided by EIOPA and covered a narrower sample which comprised a maximum of 29 EU-headquartered insurance groups. These older data began to be collected in the second half of 2009, but collection of the older data was discontinued at end-2015. All of these data are publicly available only for the aggregate sample.
18 18 19 17 18 18 19 19 20
82 82 81 83 82 82 81 81 80
12 13 12 11 11 12 11 11 12
83 82 84 85 85 85 85 85 85
5 5 4 4 3 3 4 4 4
0%
10%
20%
30%
40%
50%
60%
70%
80%
90%
100%
2008 2009 2010 2011 2012 2013 2014 2015 2016
unit-linked life insurancenon-unit linked life insurancedefined contribution schemes
defined benefit schemeshybrid schemes
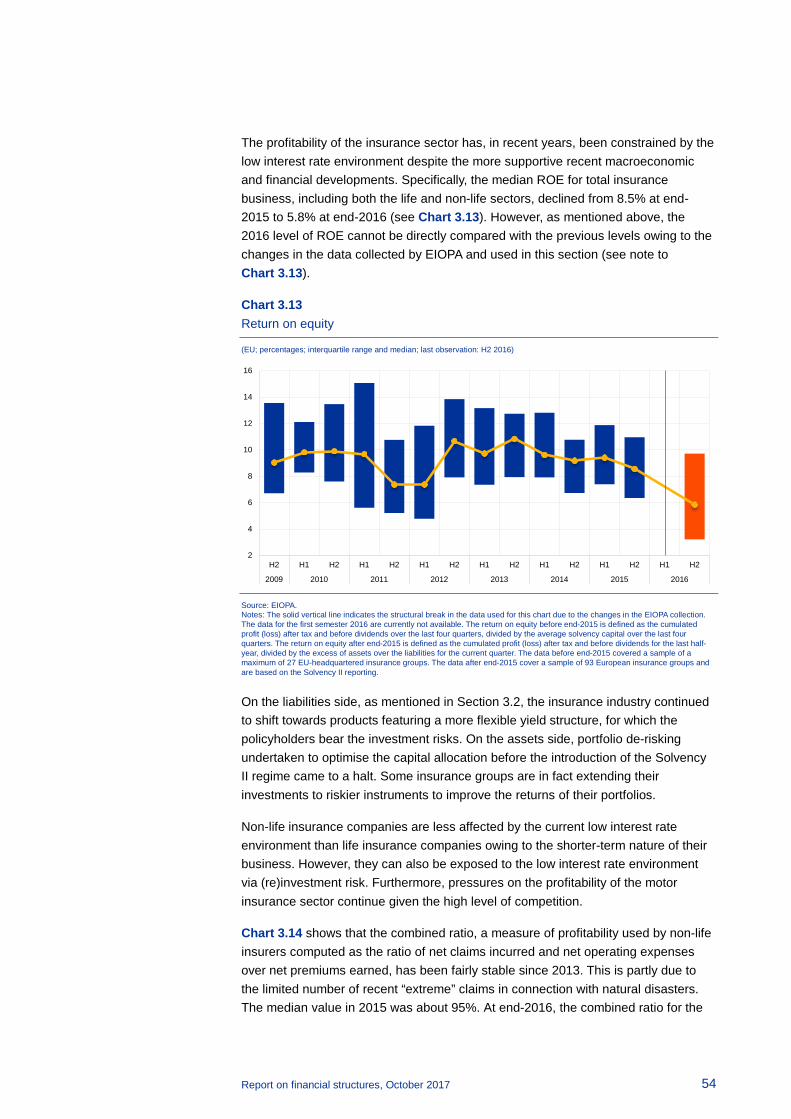
Report on financial structures, October 2017 54
The profitability of the insurance sector has, in recent years, been constrained by the low interest rate environment despite the more supportive recent macroeconomic and financial developments. Specifically, the median ROE for total insurance business, including both the life and non-life sectors, declined from 8.5% at end-2015 to 5.8% at end-2016 (see Chart 3.13). However, as mentioned above, the 2016 level of ROE cannot be directly compared with the previous levels owing to the changes in the data collected by EIOPA and used in this section (see note to Chart 3.13).
Chart 3.13 Return on equity
(EU; percentages; interquartile range and median; last observation: H2 2016)
Source: EIOPA. Notes: The solid vertical line indicates the structural break in the data used for this chart due to the changes in the EIOPA collection. The data for the first semester 2016 are currently not available. The return on equity before end-2015 is defined as the cumulated profit (loss) after tax and before dividends over the last four quarters, divided by the average solvency capital over the last four quarters. The return on equity after end-2015 is defined as the cumulated profit (loss) after tax and before dividends for the last half-year, divided by the excess of assets over the liabilities for the current quarter. The data before end-2015 covered a sample of a maximum of 27 EU-headquartered insurance groups. The data after end-2015 cover a sample of 93 European insurance groups and are based on the Solvency II reporting.
On the liabilities side, as mentioned in Section 3.2, the insurance industry continued to shift towards products featuring a more flexible yield structure, for which the policyholders bear the investment risks. On the assets side, portfolio de-risking undertaken to optimise the capital allocation before the introduction of the Solvency II regime came to a halt. Some insurance groups are in fact extending their investments to riskier instruments to improve the returns of their portfolios.
Non-life insurance companies are less affected by the current low interest rate environment than life insurance companies owing to the shorter-term nature of their business. However, they can also be exposed to the low interest rate environment via (re)investment risk. Furthermore, pressures on the profitability of the motor insurance sector continue given the high level of competition.
Chart 3.14 shows that the combined ratio, a measure of profitability used by non-life insurers computed as the ratio of net claims incurred and net operating expenses over net premiums earned, has been fairly stable since 2013. This is partly due to the limited number of recent “extreme” claims in connection with natural disasters. The median value in 2015 was about 95%. At end-2016, the combined ratio for the
2
4
6
8
10
12
14
16
H2 H1 H2 H1 H2 H1 H2 H1 H2 H1 H2 H1 H2 H1 H2
2009 2010 2011 2012 2013 2014 2015 2016
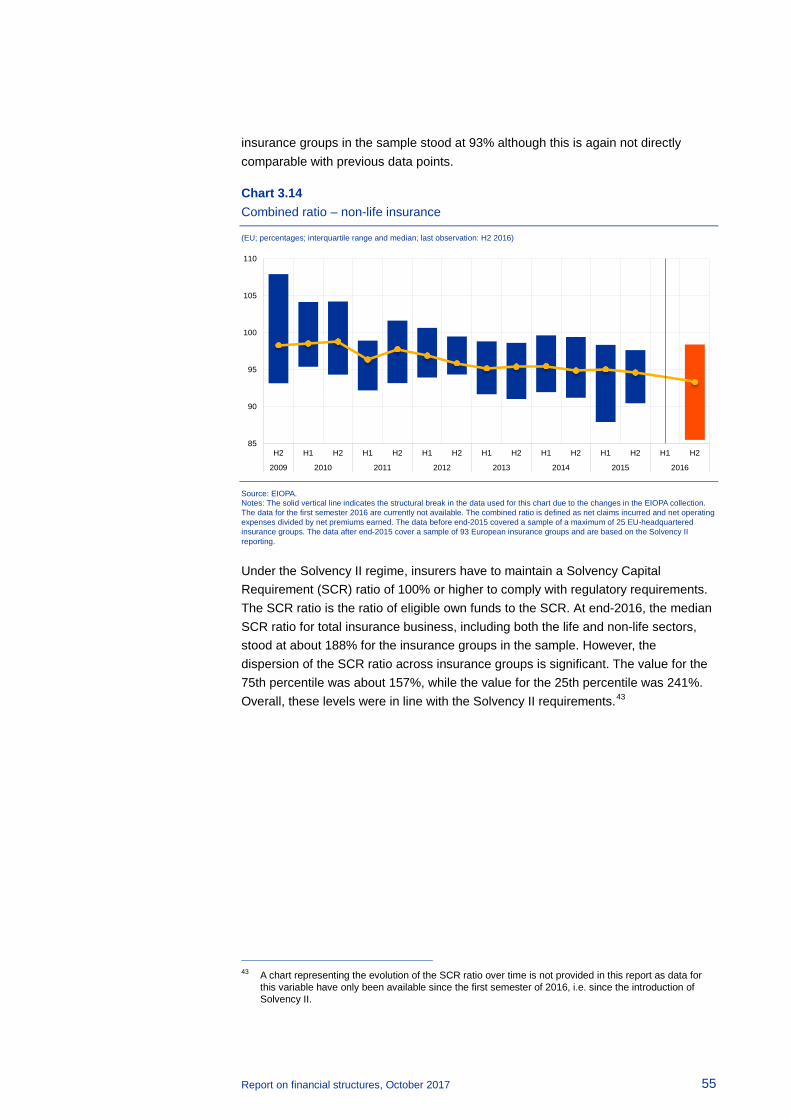
Report on financial structures, October 2017 55
insurance groups in the sample stood at 93% although this is again not directly comparable with previous data points.
Chart 3.14 Combined ratio – non-life insurance
(EU; percentages; interquartile range and median; last observation: H2 2016)
Source: EIOPA. Notes: The solid vertical line indicates the structural break in the data used for this chart due to the changes in the EIOPA collection. The data for the first semester 2016 are currently not available. The combined ratio is defined as net claims incurred and net operating expenses divided by net premiums earned. The data before end-2015 covered a sample of a maximum of 25 EU-headquartered insurance groups. The data after end-2015 cover a sample of 93 European insurance groups and are based on the Solvency II reporting.
Under the Solvency II regime, insurers have to maintain a Solvency Capital Requirement (SCR) ratio of 100% or higher to comply with regulatory requirements. The SCR ratio is the ratio of eligible own funds to the SCR. At end-2016, the median SCR ratio for total insurance business, including both the life and non-life sectors, stood at about 188% for the insurance groups in the sample. However, the dispersion of the SCR ratio across insurance groups is significant. The value for the 75th percentile was about 157%, while the value for the 25th percentile was 241%. Overall, these levels were in line with the Solvency II requirements.43
43 A chart representing the evolution of the SCR ratio over time is not provided in this report as data for
this variable have only been available since the first semester of 2016, i.e. since the introduction of Solvency II.
85
90
95
100
105
110
H2 H1 H2 H1 H2 H1 H2 H1 H2 H1 H2 H1 H2 H1 H2
2009 2010 2011 2012 2013 2014 2015 2016
Report on financial structures, October 2017 56
4 Other euro area non-bank financial entities
This chapter reviews the structural features of the euro area non-bank financial sector, including all non-bank financial entities except ICPFs. Structural features of non-bank sub-sectors for which balance sheet data are available, namely non-MMF investment funds, MMFs and FVCs, are outlined in more detail. Both a broad and a narrow aggregate measure of the non-bank financial sector are examined. The broad measure includes all financial intermediaries except banks and ICPFs, whereas the narrow measure includes investment funds, MMFs and FVCs only.
In 2016 the non-bank financial sector’s total assets – according to the broad measure – grew by more than 4%, following a period of stagnation in 2015. The expansion of the (non-MMF) investment fund sector, underpinning much of the increase in the non-bank financial sector since the global financial crisis, continued its secular growth trend in 2016. Total assets in the investment fund sector went up by 7% in 2016 and have increased by approximately 160% since 2008, driven by net inflows and rising asset valuations. The MMF sector grew by 6%, making 2016 the third consecutive year of uninterrupted growth. Despite the low returns offered by money markets, euro area money market funds attracted net inflows from both domestic and foreign investors. Euro area FVCs’ total assets continued to decline slightly throughout most of 2016 owing to continued weak securitisation activity by euro area credit institutions. In the last quarter of 2016, securitisation picked up, albeit moderately.
Total assets of the remaining non-bank financial sector, for which a breakdown by type of entity is not available, increased by 2.8% in 2016. This sector comprises more than 50% of the assets held by financial institutions in the euro area. Firms in this part of the non-bank financial sector are often linked to non-financial corporations and tend to be concentrated in a few euro area countries.
4.1 Developments in main aggregates
Total assets held by the broadly defined non-bank financial sector, comprising MMFs, non-MMF investment funds and FVCs, started to grow again in March 2016 after a year of near-stagnation (see Chart 4.1). The sector expanded in 2016 by more than 4% overall. Growth in the investment fund sector, underpinning much of the expansion of the non-bank financial sector since the global financial crisis, continued its longer-term path, with total assets expanding by 7% in 2016.44 The much smaller MMF sector grew by 6%, making 2016 the third consecutive year in which this sector has expanded. Meanwhile, total assets of the FVC sector declined 44 For a risk perspective on the non-bank financial sector, in particular investment funds, see
Section 3.1.3, Financial Stability Review, ECB, May 2017.
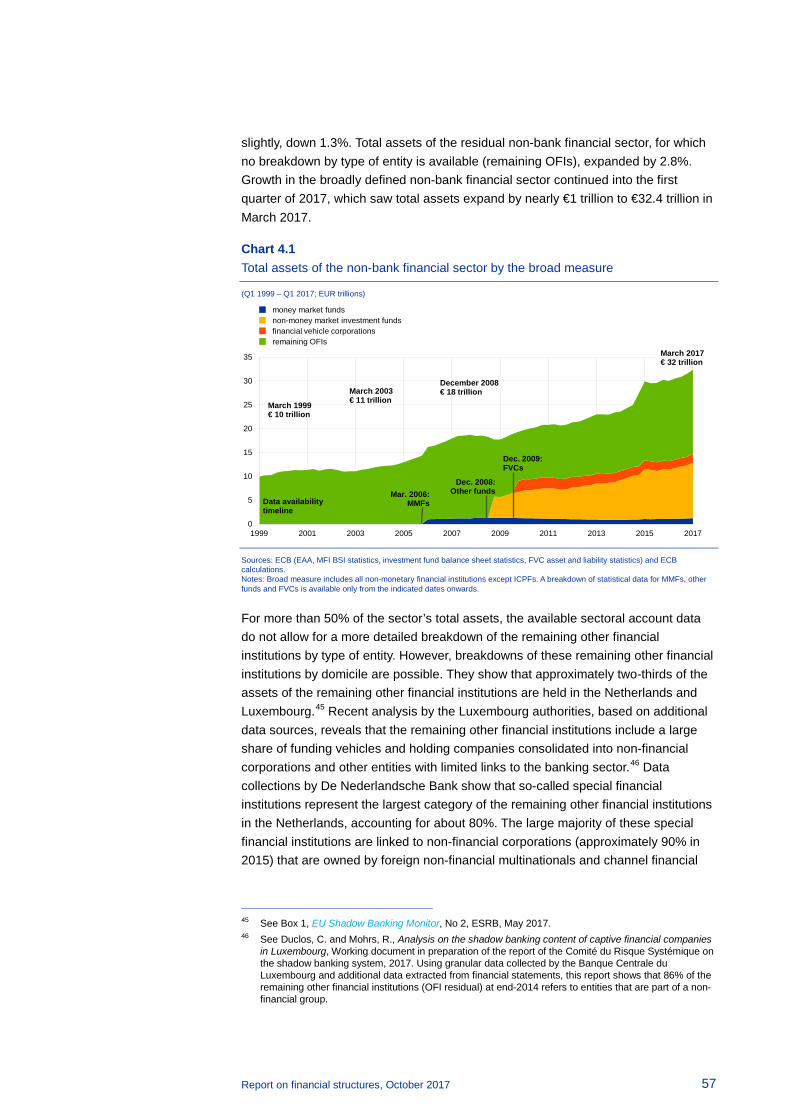
Report on financial structures, October 2017 57
slightly, down 1.3%. Total assets of the residual non-bank financial sector, for which no breakdown by type of entity is available (remaining OFIs), expanded by 2.8%. Growth in the broadly defined non-bank financial sector continued into the first quarter of 2017, which saw total assets expand by nearly €1 trillion to €32.4 trillion in March 2017.
Chart 4.1 Total assets of the non-bank financial sector by the broad measure
(Q1 1999 – Q1 2017; EUR trillions)
Sources: ECB (EAA, MFI BSI statistics, investment fund balance sheet statistics, FVC asset and liability statistics) and ECB calculations. Notes: Broad measure includes all non-monetary financial institutions except ICPFs. A breakdown of statistical data for MMFs, other funds and FVCs is available only from the indicated dates onwards.
For more than 50% of the sector’s total assets, the available sectoral account data do not allow for a more detailed breakdown of the remaining other financial institutions by type of entity. However, breakdowns of these remaining other financial institutions by domicile are possible. They show that approximately two-thirds of the assets of the remaining other financial institutions are held in the Netherlands and Luxembourg.45 Recent analysis by the Luxembourg authorities, based on additional data sources, reveals that the remaining other financial institutions include a large share of funding vehicles and holding companies consolidated into non-financial corporations and other entities with limited links to the banking sector.46 Data collections by De Nederlandsche Bank show that so-called special financial institutions represent the largest category of the remaining other financial institutions in the Netherlands, accounting for about 80%. The large majority of these special financial institutions are linked to non-financial corporations (approximately 90% in 2015) that are owned by foreign non-financial multinationals and channel financial
45 See Box 1, EU Shadow Banking Monitor, No 2, ESRB, May 2017. 46 See Duclos, C. and Mohrs, R., Analysis on the shadow banking content of captive financial companies
in Luxembourg, Working document in preparation of the report of the Comité du Risque Systémique on the shadow banking system, 2017. Using granular data collected by the Banque Centrale du Luxembourg and additional data extracted from financial statements, this report shows that 86% of the remaining other financial institutions (OFI residual) at end-2014 refers to entities that are part of a non-financial group.
0
5
10
15
20
25
30
35
1999 2001 2003 2005 2007 2009 2011 2013 2015 2017
Data availabilitytimeline
March 2017€ 32 trillion
December 2008€ 18 trillion
March 1999€ 10 trillion
March 2003€ 11 trillion
Dec. 2008:Other fundsMar. 2006:
MMFs
Dec. 2009:FVCs
money market fundsnon-money market investment fundsfinancial vehicle corporationsremaining OFIs
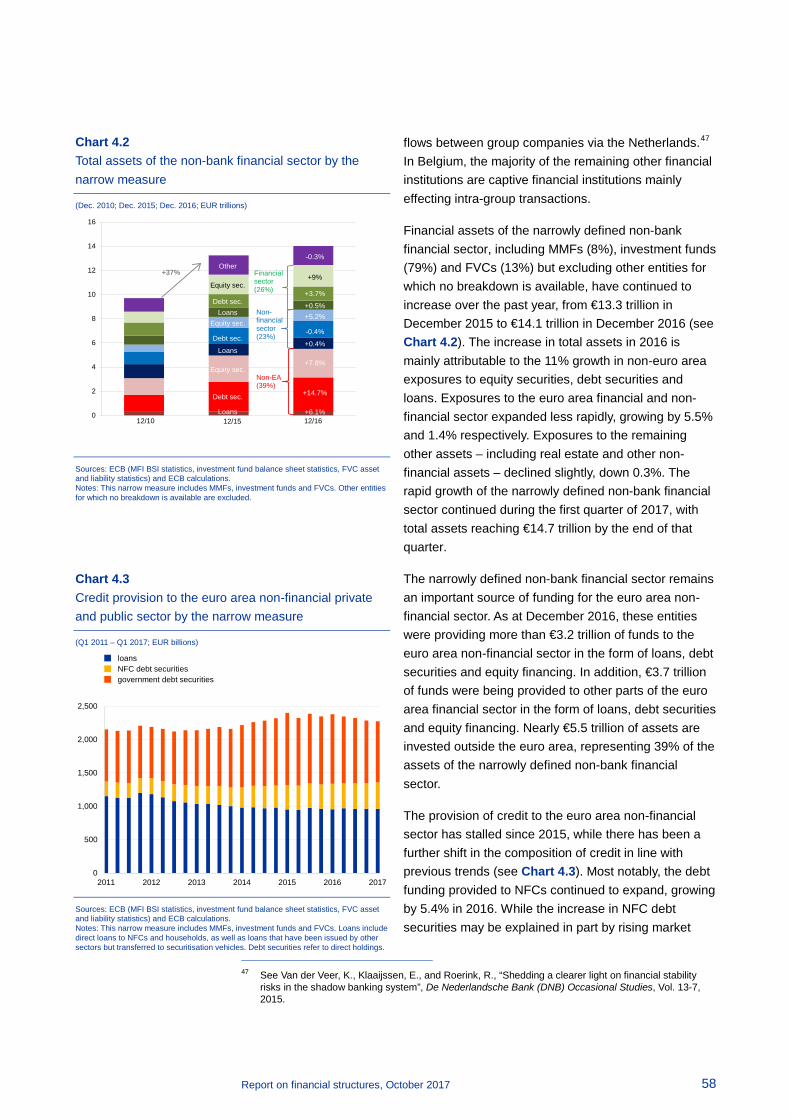
Report on financial structures, October 2017 58
flows between group companies via the Netherlands.47 In Belgium, the majority of the remaining other financial institutions are captive financial institutions mainly effecting intra-group transactions.
Financial assets of the narrowly defined non-bank financial sector, including MMFs (8%), investment funds (79%) and FVCs (13%) but excluding other entities for which no breakdown is available, have continued to increase over the past year, from €13.3 trillion in December 2015 to €14.1 trillion in December 2016 (see Chart 4.2). The increase in total assets in 2016 is mainly attributable to the 11% growth in non-euro area exposures to equity securities, debt securities and loans. Exposures to the euro area financial and non-financial sector expanded less rapidly, growing by 5.5% and 1.4% respectively. Exposures to the remaining other assets – including real estate and other non-financial assets – declined slightly, down 0.3%. The rapid growth of the narrowly defined non-bank financial sector continued during the first quarter of 2017, with total assets reaching €14.7 trillion by the end of that quarter.
The narrowly defined non-bank financial sector remains an important source of funding for the euro area non-financial sector. As at December 2016, these entities were providing more than €3.2 trillion of funds to the euro area non-financial sector in the form of loans, debt securities and equity financing. In addition, €3.7 trillion of funds were being provided to other parts of the euro area financial sector in the form of loans, debt securities and equity financing. Nearly €5.5 trillion of assets are invested outside the euro area, representing 39% of the assets of the narrowly defined non-bank financial sector.
The provision of credit to the euro area non-financial sector has stalled since 2015, while there has been a further shift in the composition of credit in line with previous trends (see Chart 4.3). Most notably, the debt funding provided to NFCs continued to expand, growing by 5.4% in 2016. While the increase in NFC debt securities may be explained in part by rising market
47 See Van der Veer, K., Klaaijssen, E., and Roerink, R., “Shedding a clearer light on financial stability
risks in the shadow banking system”, De Nederlandsche Bank (DNB) Occasional Studies, Vol. 13-7, 2015.
Chart 4.2 Total assets of the non-bank financial sector by the narrow measure
(Dec. 2010; Dec. 2015; Dec. 2016; EUR trillions)
Sources: ECB (MFI BSI statistics, investment fund balance sheet statistics, FVC asset and liability statistics) and ECB calculations. Notes: This narrow measure includes MMFs, investment funds and FVCs. Other entities for which no breakdown is available are excluded.
Chart 4.3 Credit provision to the euro area non-financial private and public sector by the narrow measure
(Q1 2011 – Q1 2017; EUR billions)
Sources: ECB (MFI BSI statistics, investment fund balance sheet statistics, FVC asset and liability statistics) and ECB calculations. Notes: This narrow measure includes MMFs, investment funds and FVCs. Loans include direct loans to NFCs and households, as well as loans that have been issued by other sectors but transferred to securitisation vehicles. Debt securities refer to direct holdings.
0
2
4
6
8
10
12
14
16
12/10
+37%Other
Equity sec.
Debt sec.Loans
Equity sec.
Debt sec.
Loans
Equity sec.
Debt sec.
Loans
-0.3%
+9%
+3.7%
+0.5%+5.2%
-0.4%
+0.4%
+7.8%
+14.7%
+6.1%
Non-financial sector(23%)
Non-EA (39%)
12/15 12/16
Financial sector (26%)
0
500
1,000
1,500
2,000
2,500
2011 2012 2013 2014 2015 2016 2017
loansNFC debt securitiesgovernment debt securities

Report on financial structures, October 2017 59
valuations, it also reflects increased issuance activity and rising demand for these assets, which generate higher yields on average than government bonds. By contrast, the holdings of government debt securities declined by 8.2%, possibly reflecting lower demand from investors due in part to supressed yields and continued asset purchases under the ECB’s public sector purchase programme (PSPP). The amount of loans to the non-financial private sector, mainly securities loans on the balance of securitisation vehicles, remained stable in 2016 (+0.1%). While overall credit growth gained some momentum in 2016, securitisation activity has not strengthened to the same extent. Anecdotal evidence suggests that non-bank financial corporations are increasingly venturing into the loan origination business in the current low-yield environment. However, the amounts of direct loans originated by non-banks are still small, partly because investment funds, for instance, are prohibited from originating loans in many jurisdictions.
4.2 Asset and liability structure of other non-bank financial entities
4.2.1 The investment fund sector
The investment fund sector, which had stalled in 2015 owing to a slowdown in inflows and stagnating valuations, continued its longer-term growth path in 2016, with total assets expanding by 7% (see Chart 4.4). All types of investment fund contributed to this expansion. Net inflows were particularly strong for bond and mixed funds, adding a total of €130 billion and €11 billion to these sectors respectively. There was some volatility in fund flows towards the beginning and the end of 2016, reflecting financial market volatility more broadly. Equity funds, the second-largest fund category, received only €22 billion of net inflows, whereas the much smaller real estate fund sector also received €22 billion of net inflows during 2016, corresponding to an 8% increase relative to total assets. The net inflows for the fund sector as a whole were equally strong for both non-euro area investors and investors from the euro area. In addition to the net inflows, expansion in the euro area investment fund sector’s total assets was also driven by positive asset
valuation effects (including those resulting from changes in global asset prices). The stabilisation of the nominal effective exchange rate of the euro versus other main currencies slightly dampened the overall rise in valuations of assets denominated in non-euro currencies.
Chart 4.4 Euro area investment funds – quarterly net flows and total assets
(Q1 2011 – Q1 2017; EUR billions (left-hand scale); EUR trillions (right-hand scale))
Sources: ECB (investment fund balance sheet statistics) and ECB calculations. Note: Net flows reflect net issuance of shares.
-4
-2
0
2
4
6
8
10
12
-100
-50
0
50
100
150
200
250
300
2011 2012 2013 2014 2015 2016 2017
bond fundsequity fundsmixed fundsreal estate funds
hedge fundsother fundsall funds' total assets
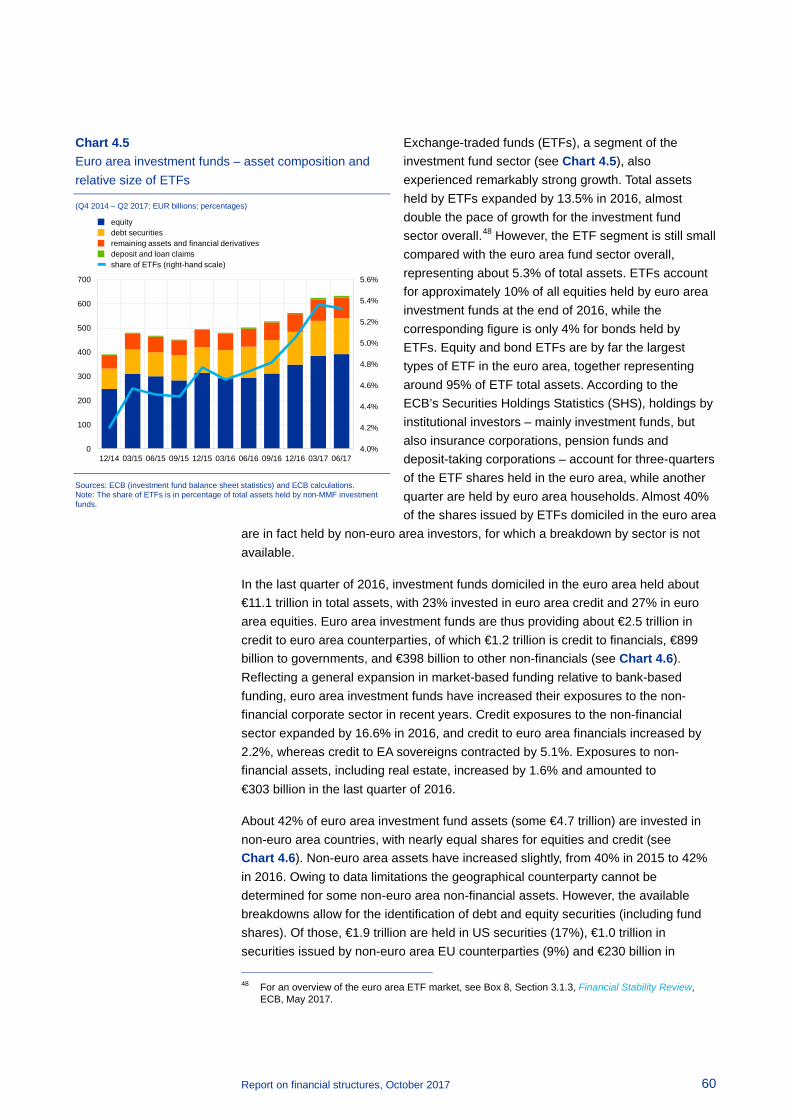
Report on financial structures, October 2017 60
Exchange-traded funds (ETFs), a segment of the investment fund sector (see Chart 4.5), also experienced remarkably strong growth. Total assets held by ETFs expanded by 13.5% in 2016, almost double the pace of growth for the investment fund sector overall.48 However, the ETF segment is still small compared with the euro area fund sector overall, representing about 5.3% of total assets. ETFs account for approximately 10% of all equities held by euro area investment funds at the end of 2016, while the corresponding figure is only 4% for bonds held by ETFs. Equity and bond ETFs are by far the largest types of ETF in the euro area, together representing around 95% of ETF total assets. According to the ECB’s Securities Holdings Statistics (SHS), holdings by institutional investors – mainly investment funds, but also insurance corporations, pension funds and deposit-taking corporations – account for three-quarters of the ETF shares held in the euro area, while another quarter are held by euro area households. Almost 40% of the shares issued by ETFs domiciled in the euro area
are in fact held by non-euro area investors, for which a breakdown by sector is not available.
In the last quarter of 2016, investment funds domiciled in the euro area held about €11.1 trillion in total assets, with 23% invested in euro area credit and 27% in euro area equities. Euro area investment funds are thus providing about €2.5 trillion in credit to euro area counterparties, of which €1.2 trillion is credit to financials, €899 billion to governments, and €398 billion to other non-financials (see Chart 4.6). Reflecting a general expansion in market-based funding relative to bank-based funding, euro area investment funds have increased their exposures to the non-financial corporate sector in recent years. Credit exposures to the non-financial sector expanded by 16.6% in 2016, and credit to euro area financials increased by 2.2%, whereas credit to EA sovereigns contracted by 5.1%. Exposures to non-financial assets, including real estate, increased by 1.6% and amounted to €303 billion in the last quarter of 2016.
About 42% of euro area investment fund assets (some €4.7 trillion) are invested in non-euro area countries, with nearly equal shares for equities and credit (see Chart 4.6). Non-euro area assets have increased slightly, from 40% in 2015 to 42% in 2016. Owing to data limitations the geographical counterparty cannot be determined for some non-euro area non-financial assets. However, the available breakdowns allow for the identification of debt and equity securities (including fund shares). Of those, €1.9 trillion are held in US securities (17%), €1.0 trillion in securities issued by non-euro area EU counterparties (9%) and €230 billion in 48 For an overview of the euro area ETF market, see Box 8, Section 3.1.3, Financial Stability Review,
ECB, May 2017.
Chart 4.5 Euro area investment funds – asset composition and relative size of ETFs
(Q4 2014 – Q2 2017; EUR billions; percentages)
Sources: ECB (investment fund balance sheet statistics) and ECB calculations. Note: The share of ETFs is in percentage of total assets held by non-MMF investment funds.
4.0%
4.2%
4.4%
4.6%
4.8%
5.0%
5.2%
5.4%
5.6%
0
100
200
300
400
500
600
700
12/14 03/15 06/15 09/15 12/15 03/16 06/16 09/16 12/16 03/17 06/17
equitydebt securitiesremaining assets and financial derivativesdeposit and loan claimsshare of ETFs (right-hand scale)

Report on financial structures, October 2017 61
Japanese securities (2%). A large and growing share of about 20%, or €2.1 trillion, is invested in other non-euro area non-EU countries including emerging market countries. This geographical composition of investments has been relatively stable over the past few years. However, notable shifts have taken place in the longer-term. For instance, the share of US securities rose from 10% in 2009 to 17% in 2016, while the share of euro area securities declined from 60% to 51% during the same period. Likewise, the shares of euro area investors and non-euro area investors hardly changed in 2016, but there has been a notable shift in investor composition since 2009. The share of non-euro investors increased from 19% to 26% between 2009 and 2016, while the share of EA investors decreased from 81% to 74%.
Chart 4.7 Euro area investment funds – assets by location and fund type
(Q1 2009 (top row); Q4 2016 (bottom row); percentage of total assets)
Sources: ECB (investment fund balance sheet statistics) and ECB calculations. Note: Credit includes loans and debt securities; non-financial assets include real estate and other non-financial assets.
As regards investment fund domiciles in the euro area, more than 90% of assets remained under management in Luxembourg, Germany, Ireland, France and the Netherlands in 2016 (see Chart 4.7). Only 10% of assets were therefore located in countries other than these main fund domiciles, compared with 14% in 2009. Between 2009 and 2016, Ireland’s share experienced by far the strongest growth, rising from 8% to 18%. Luxembourg also expanded somewhat in relative terms, from 31% to 34%. The shares of France and the remaining other countries declined significantly, while Germany’s share contracted slightly, down by 2 percentage points, and the Netherlands’ share stayed almost constant. During 2016, funds domiciled in all major host countries expanded more or less in sync so that their relative shares hardly changed compared with 2015. Bond, equity and mixed funds still represented the largest share in the assets of euro area investment funds, amounting to 82% of total assets held (see Chart 4.7).
31%
8%
20%
19%
8%
14%
LU IE DEFR NL other
34%
18%18%
12%
8%
10%
22%
32%
28%
7%
3%
8%
equity bond mixedreal estate hedge other
27%
30%
25%
6%4%
8%
Chart 4.6 Euro area investment funds – assets by type
(Dec. 2015; Dec. 2016; EUR trillions)
Sources: ECB (investment fund balance sheet statistics) and ECB calculations. Note: Credit includes loans and debt securities; non-financial assets include real estate and other non-financial assets.
0
2
4
6
8
10
12
December 2015 December 2016
remaining assets
non-EA equities
non-EA credit
EA non-financial assets
equities EA non-financials (excl. gov.)
equities EA financials
credit to EA government
credit to EA non-financials (excl. gov.)
credit to EA financialsEAcredit (23%)
Non-EAassets (42%)
EAequities(27%)
-0.5%
+7.7%
+16.9%
+1.6%
+5.2%
+9%
-5.1%+16.6%
+2.2%
€10.4 tr
€11.1 tr
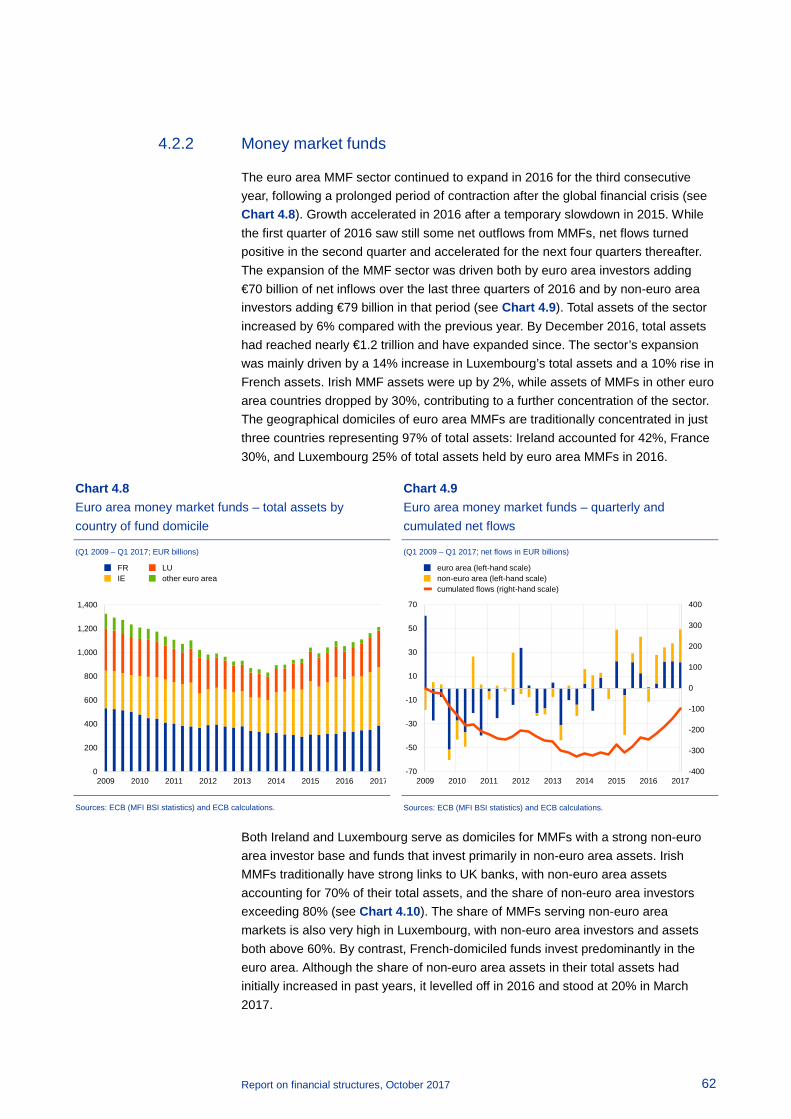
Report on financial structures, October 2017 62
4.2.2 Money market funds
The euro area MMF sector continued to expand in 2016 for the third consecutive year, following a prolonged period of contraction after the global financial crisis (see Chart 4.8). Growth accelerated in 2016 after a temporary slowdown in 2015. While the first quarter of 2016 saw still some net outflows from MMFs, net flows turned positive in the second quarter and accelerated for the next four quarters thereafter. The expansion of the MMF sector was driven both by euro area investors adding €70 billion of net inflows over the last three quarters of 2016 and by non-euro area investors adding €79 billion in that period (see Chart 4.9). Total assets of the sector increased by 6% compared with the previous year. By December 2016, total assets had reached nearly €1.2 trillion and have expanded since. The sector’s expansion was mainly driven by a 14% increase in Luxembourg’s total assets and a 10% rise in French assets. Irish MMF assets were up by 2%, while assets of MMFs in other euro area countries dropped by 30%, contributing to a further concentration of the sector. The geographical domiciles of euro area MMFs are traditionally concentrated in just three countries representing 97% of total assets: Ireland accounted for 42%, France 30%, and Luxembourg 25% of total assets held by euro area MMFs in 2016.
Chart 4.9 Euro area money market funds – quarterly and cumulated net flows
(Q1 2009 – Q1 2017; net flows in EUR billions)
Sources: ECB (MFI BSI statistics) and ECB calculations.
Both Ireland and Luxembourg serve as domiciles for MMFs with a strong non-euro area investor base and funds that invest primarily in non-euro area assets. Irish MMFs traditionally have strong links to UK banks, with non-euro area assets accounting for 70% of their total assets, and the share of non-euro area investors exceeding 80% (see Chart 4.10). The share of MMFs serving non-euro area markets is also very high in Luxembourg, with non-euro area investors and assets both above 60%. By contrast, French-domiciled funds invest predominantly in the euro area. Although the share of non-euro area assets in their total assets had initially increased in past years, it levelled off in 2016 and stood at 20% in March 2017.
-400
-300
-200
-100
0
100
200
300
400
-70
-50
-30
-10
10
30
50
70
2009 2010 2011 2012 2013 2014 2015 2016 2017
euro area (left-hand scale)non-euro area (left-hand scale)cumulated flows (right-hand scale)
Chart 4.8 Euro area money market funds – total assets by country of fund domicile
(Q1 2009 – Q1 2017; EUR billions)
Sources: ECB (MFI BSI statistics) and ECB calculations.
0
200
400
600
800
1,000
1,200
1,400
2009 2010 2011 2012 2013 2014 2015 2016 2017
FRIE
LUother euro area
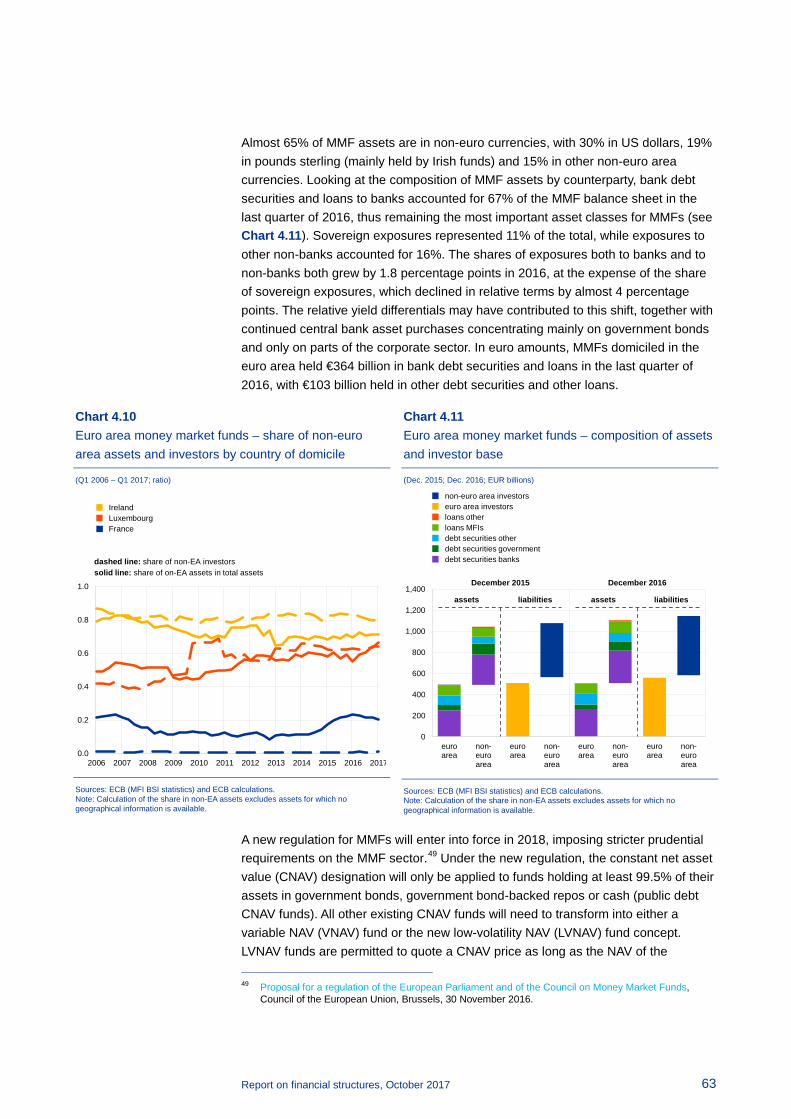
Report on financial structures, October 2017 63
Almost 65% of MMF assets are in non-euro currencies, with 30% in US dollars, 19% in pounds sterling (mainly held by Irish funds) and 15% in other non-euro area currencies. Looking at the composition of MMF assets by counterparty, bank debt securities and loans to banks accounted for 67% of the MMF balance sheet in the last quarter of 2016, thus remaining the most important asset classes for MMFs (see Chart 4.11). Sovereign exposures represented 11% of the total, while exposures to other non-banks accounted for 16%. The shares of exposures both to banks and to non-banks both grew by 1.8 percentage points in 2016, at the expense of the share of sovereign exposures, which declined in relative terms by almost 4 percentage points. The relative yield differentials may have contributed to this shift, together with continued central bank asset purchases concentrating mainly on government bonds and only on parts of the corporate sector. In euro amounts, MMFs domiciled in the euro area held €364 billion in bank debt securities and loans in the last quarter of 2016, with €103 billion held in other debt securities and other loans.
Chart 4.11 Euro area money market funds – composition of assets and investor base
(Dec. 2015; Dec. 2016; EUR billions)
Sources: ECB (MFI BSI statistics) and ECB calculations. Note: Calculation of the share in non-EA assets excludes assets for which no geographical information is available.
A new regulation for MMFs will enter into force in 2018, imposing stricter prudential requirements on the MMF sector.49 Under the new regulation, the constant net asset value (CNAV) designation will only be applied to funds holding at least 99.5% of their assets in government bonds, government bond-backed repos or cash (public debt CNAV funds). All other existing CNAV funds will need to transform into either a variable NAV (VNAV) fund or the new low-volatility NAV (LVNAV) fund concept. LVNAV funds are permitted to quote a CNAV price as long as the NAV of the 49 Proposal for a regulation of the European Parliament and of the Council on Money Market Funds,
Council of the European Union, Brussels, 30 November 2016.
0
200
400
600
800
1,000
1,200
1,400
euroarea
non-euroarea
euroarea
non-euroarea
euroarea
non-euroarea
euroarea
non-euroarea
assets assetsliabilities liabilities
December 2015
non-euro area investorseuro area investorsloans other loans MFIsdebt securities otherdebt securities governmentdebt securities banks
December 2016
Chart 4.10 Euro area money market funds – share of non-euro area assets and investors by country of domicile
(Q1 2006 – Q1 2017; ratio)
Sources: ECB (MFI BSI statistics) and ECB calculations. Note: Calculation of the share in non-EA assets excludes assets for which no geographical information is available.
0.0
0.2
0.4
0.6
0.8
1.0
2006 2007 2008 2009 2010 2011 2012 2013 2014 2015 2016 2017
solid line: share of on-EA assets in total assets dashed line: share of non-EA investors
IrelandLuxembourgFrance
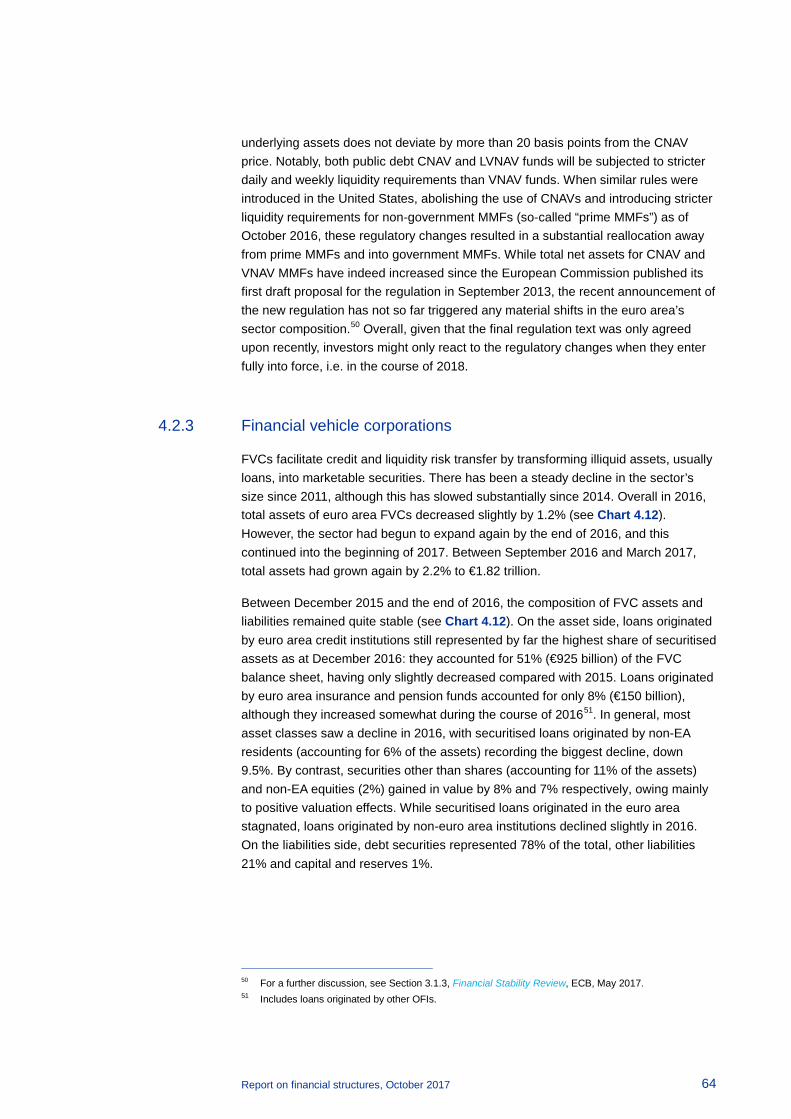
Report on financial structures, October 2017 64
underlying assets does not deviate by more than 20 basis points from the CNAV price. Notably, both public debt CNAV and LVNAV funds will be subjected to stricter daily and weekly liquidity requirements than VNAV funds. When similar rules were introduced in the United States, abolishing the use of CNAVs and introducing stricter liquidity requirements for non-government MMFs (so-called “prime MMFs”) as of October 2016, these regulatory changes resulted in a substantial reallocation away from prime MMFs and into government MMFs. While total net assets for CNAV and VNAV MMFs have indeed increased since the European Commission published its first draft proposal for the regulation in September 2013, the recent announcement of the new regulation has not so far triggered any material shifts in the euro area’s sector composition.50 Overall, given that the final regulation text was only agreed upon recently, investors might only react to the regulatory changes when they enter fully into force, i.e. in the course of 2018.
4.2.3 Financial vehicle corporations
FVCs facilitate credit and liquidity risk transfer by transforming illiquid assets, usually loans, into marketable securities. There has been a steady decline in the sector’s size since 2011, although this has slowed substantially since 2014. Overall in 2016, total assets of euro area FVCs decreased slightly by 1.2% (see Chart 4.12). However, the sector had begun to expand again by the end of 2016, and this continued into the beginning of 2017. Between September 2016 and March 2017, total assets had grown again by 2.2% to €1.82 trillion.
Between December 2015 and the end of 2016, the composition of FVC assets and liabilities remained quite stable (see Chart 4.12). On the asset side, loans originated by euro area credit institutions still represented by far the highest share of securitised assets as at December 2016: they accounted for 51% (€925 billion) of the FVC balance sheet, having only slightly decreased compared with 2015. Loans originated by euro area insurance and pension funds accounted for only 8% (€150 billion), although they increased somewhat during the course of 201651. In general, most asset classes saw a decline in 2016, with securitised loans originated by non-EA residents (accounting for 6% of the assets) recording the biggest decline, down 9.5%. By contrast, securities other than shares (accounting for 11% of the assets) and non-EA equities (2%) gained in value by 8% and 7% respectively, owing mainly to positive valuation effects. While securitised loans originated in the euro area stagnated, loans originated by non-euro area institutions declined slightly in 2016. On the liabilities side, debt securities represented 78% of the total, other liabilities 21% and capital and reserves 1%.
50 For a further discussion, see Section 3.1.3, Financial Stability Review, ECB, May 2017. 51 Includes loans originated by other OFIs.
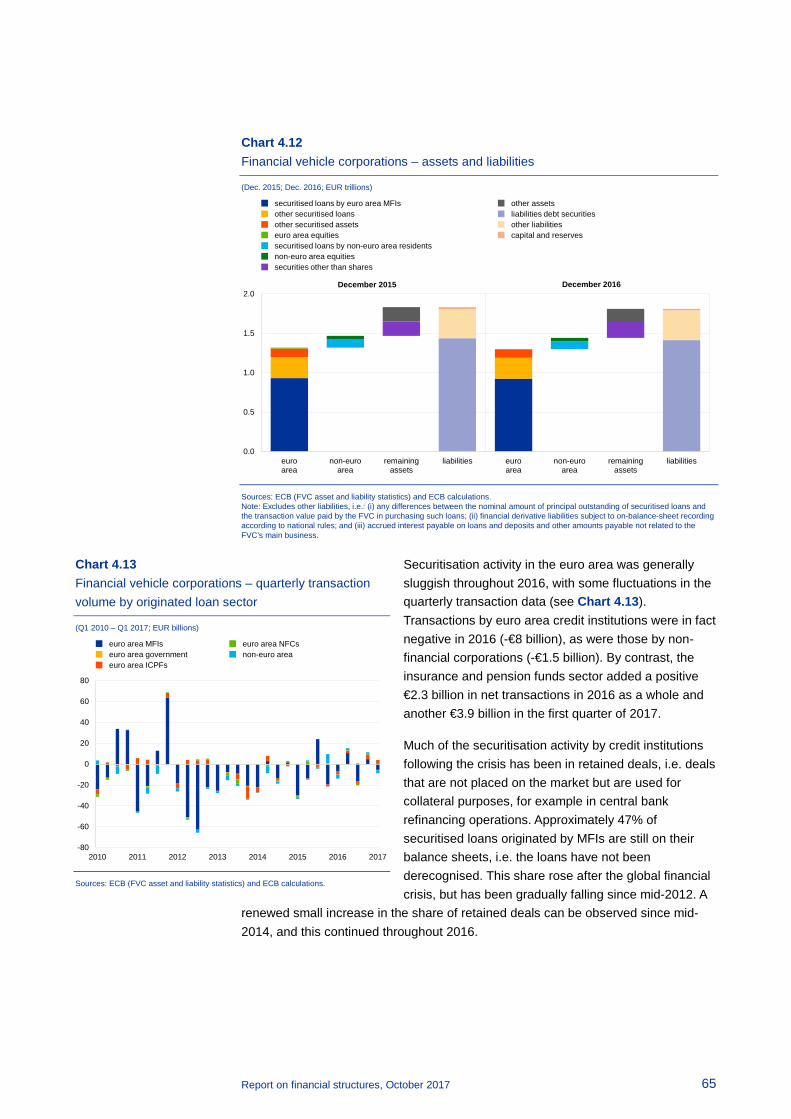
Report on financial structures, October 2017 65
Chart 4.12 Financial vehicle corporations – assets and liabilities
(Dec. 2015; Dec. 2016; EUR trillions)
Sources: ECB (FVC asset and liability statistics) and ECB calculations. Note: Excludes other liabilities, i.e.: (i) any differences between the nominal amount of principal outstanding of securitised loans and the transaction value paid by the FVC in purchasing such loans; (ii) financial derivative liabilities subject to on-balance-sheet recording according to national rules; and (iii) accrued interest payable on loans and deposits and other amounts payable not related to the FVC’s main business.
Securitisation activity in the euro area was generally sluggish throughout 2016, with some fluctuations in the quarterly transaction data (see Chart 4.13). Transactions by euro area credit institutions were in fact negative in 2016 (-€8 billion), as were those by non-financial corporations (-€1.5 billion). By contrast, the insurance and pension funds sector added a positive €2.3 billion in net transactions in 2016 as a whole and another €3.9 billion in the first quarter of 2017.
Much of the securitisation activity by credit institutions following the crisis has been in retained deals, i.e. deals that are not placed on the market but are used for collateral purposes, for example in central bank refinancing operations. Approximately 47% of securitised loans originated by MFIs are still on their balance sheets, i.e. the loans have not been derecognised. This share rose after the global financial crisis, but has been gradually falling since mid-2012. A
renewed small increase in the share of retained deals can be observed since mid-2014, and this continued throughout 2016.
0.0
0.5
1.0
1.5
2.0
euroarea
non-euroarea
remainingassets
liabilities euroarea
non-euroarea
remainingassets
liabilities
December 2016December 2015
securitised loans by euro area MFIsother securitised loansother securitised assetseuro area equitiessecuritised loans by non-euro area residentsnon-euro area equitiessecurities other than shares
other assetsliabilities debt securitiesother liabilitiescapital and reserves
Chart 4.13 Financial vehicle corporations – quarterly transaction volume by originated loan sector
(Q1 2010 – Q1 2017; EUR billions)
Sources: ECB (FVC asset and liability statistics) and ECB calculations.
-80
-60
-40
-20
0
20
40
60
80
2010 2011 2012 2013 2014 2015 2016 2017
euro area MFIseuro area governmenteuro area ICPFs
euro area NFCsnon-euro area
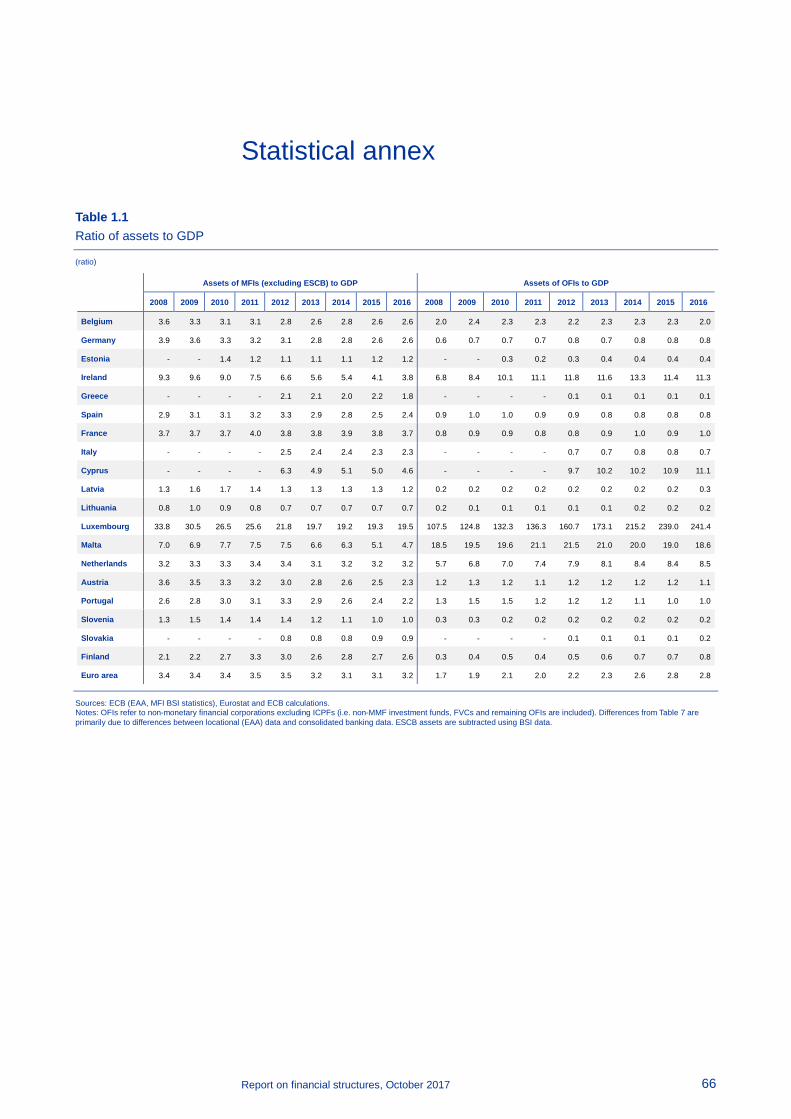
Report on financial structures, October 2017 66
Statistical annex
Table 1.1 Ratio of assets to GDP
(ratio)
Sources: ECB (EAA, MFI BSI statistics), Eurostat and ECB calculations. Notes: OFIs refer to non-monetary financial corporations excluding ICPFs (i.e. non-MMF investment funds, FVCs and remaining OFIs are included). Differences from Table 7 are primarily due to differences between locational (EAA) data and consolidated banking data. ESCB assets are subtracted using BSI data.
Assets of MFIs (excluding ESCB) to GDP Assets of OFIs to GDP
2008 2009 2010 2011 2012 2013 2014 2015 2016 2008 2009 2010 2011 2012 2013 2014 2015 2016
Belgium 3.6 3.3 3.1 3.1 2.8 2.6 2.8 2.6 2.6 2.0 2.4 2.3 2.3 2.2 2.3 2.3 2.3 2.0
Germany 3.9 3.6 3.3 3.2 3.1 2.8 2.8 2.6 2.6 0.6 0.7 0.7 0.7 0.8 0.7 0.8 0.8 0.8
Estonia - - 1.4 1.2 1.1 1.1 1.1 1.2 1.2 - - 0.3 0.2 0.3 0.4 0.4 0.4 0.4
Ireland 9.3 9.6 9.0 7.5 6.6 5.6 5.4 4.1 3.8 6.8 8.4 10.1 11.1 11.8 11.6 13.3 11.4 11.3
Greece - - - - 2.1 2.1 2.0 2.2 1.8 - - - - 0.1 0.1 0.1 0.1 0.1
Spain 2.9 3.1 3.1 3.2 3.3 2.9 2.8 2.5 2.4 0.9 1.0 1.0 0.9 0.9 0.8 0.8 0.8 0.8
France 3.7 3.7 3.7 4.0 3.8 3.8 3.9 3.8 3.7 0.8 0.9 0.9 0.8 0.8 0.9 1.0 0.9 1.0
Italy - - - - 2.5 2.4 2.4 2.3 2.3 - - - - 0.7 0.7 0.8 0.8 0.7
Cyprus - - - - 6.3 4.9 5.1 5.0 4.6 - - - - 9.7 10.2 10.2 10.9 11.1
Latvia 1.3 1.6 1.7 1.4 1.3 1.3 1.3 1.3 1.2 0.2 0.2 0.2 0.2 0.2 0.2 0.2 0.2 0.3
Lithuania 0.8 1.0 0.9 0.8 0.7 0.7 0.7 0.7 0.7 0.2 0.1 0.1 0.1 0.1 0.1 0.2 0.2 0.2
Luxembourg 33.8 30.5 26.5 25.6 21.8 19.7 19.2 19.3 19.5 107.5 124.8 132.3 136.3 160.7 173.1 215.2 239.0 241.4
Malta 7.0 6.9 7.7 7.5 7.5 6.6 6.3 5.1 4.7 18.5 19.5 19.6 21.1 21.5 21.0 20.0 19.0 18.6
Netherlands 3.2 3.3 3.3 3.4 3.4 3.1 3.2 3.2 3.2 5.7 6.8 7.0 7.4 7.9 8.1 8.4 8.4 8.5
Austria 3.6 3.5 3.3 3.2 3.0 2.8 2.6 2.5 2.3 1.2 1.3 1.2 1.1 1.2 1.2 1.2 1.2 1.1
Portugal 2.6 2.8 3.0 3.1 3.3 2.9 2.6 2.4 2.2 1.3 1.5 1.5 1.2 1.2 1.2 1.1 1.0 1.0
Slovenia 1.3 1.5 1.4 1.4 1.4 1.2 1.1 1.0 1.0 0.3 0.3 0.2 0.2 0.2 0.2 0.2 0.2 0.2
Slovakia - - - - 0.8 0.8 0.8 0.9 0.9 - - - - 0.1 0.1 0.1 0.1 0.2
Finland 2.1 2.2 2.7 3.3 3.0 2.6 2.8 2.7 2.6 0.3 0.4 0.5 0.4 0.5 0.6 0.7 0.7 0.8
Euro area 3.4 3.4 3.4 3.5 3.5 3.2 3.1 3.1 3.2 1.7 1.9 2.1 2.0 2.2 2.3 2.6 2.8 2.8
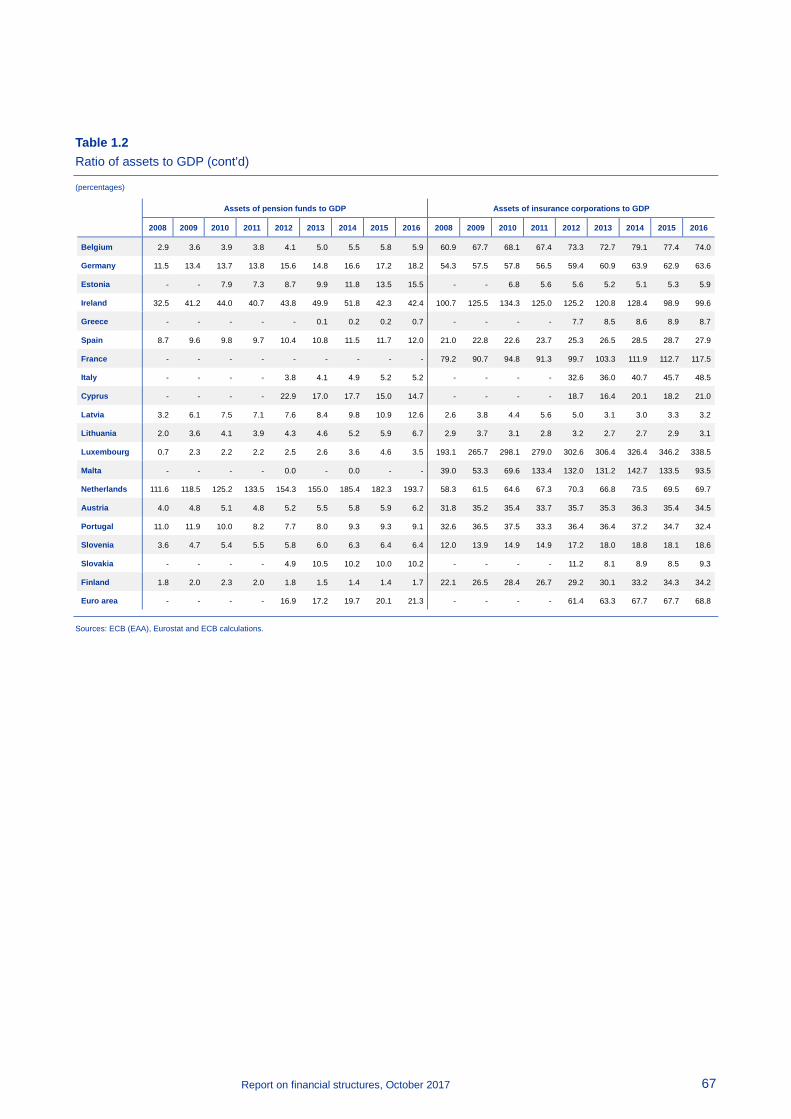
Report on financial structures, October 2017 67
Table 1.2 Ratio of assets to GDP (cont’d)
(percentages)
Sources: ECB (EAA), Eurostat and ECB calculations.
Assets of pension funds to GDP Assets of insurance corporations to GDP
2008 2009 2010 2011 2012 2013 2014 2015 2016 2008 2009 2010 2011 2012 2013 2014 2015 2016
Belgium 2.9 3.6 3.9 3.8 4.1 5.0 5.5 5.8 5.9 60.9 67.7 68.1 67.4 73.3 72.7 79.1 77.4 74.0
Germany 11.5 13.4 13.7 13.8 15.6 14.8 16.6 17.2 18.2 54.3 57.5 57.8 56.5 59.4 60.9 63.9 62.9 63.6
Estonia - - 7.9 7.3 8.7 9.9 11.8 13.5 15.5 - - 6.8 5.6 5.6 5.2 5.1 5.3 5.9
Ireland 32.5 41.2 44.0 40.7 43.8 49.9 51.8 42.3 42.4 100.7 125.5 134.3 125.0 125.2 120.8 128.4 98.9 99.6
Greece - - - - - 0.1 0.2 0.2 0.7 - - - - 7.7 8.5 8.6 8.9 8.7
Spain 8.7 9.6 9.8 9.7 10.4 10.8 11.5 11.7 12.0 21.0 22.8 22.6 23.7 25.3 26.5 28.5 28.7 27.9
France - - - - - - - - - 79.2 90.7 94.8 91.3 99.7 103.3 111.9 112.7 117.5
Italy - - - - 3.8 4.1 4.9 5.2 5.2 - - - - 32.6 36.0 40.7 45.7 48.5
Cyprus - - - - 22.9 17.0 17.7 15.0 14.7 - - - - 18.7 16.4 20.1 18.2 21.0
Latvia 3.2 6.1 7.5 7.1 7.6 8.4 9.8 10.9 12.6 2.6 3.8 4.4 5.6 5.0 3.1 3.0 3.3 3.2
Lithuania 2.0 3.6 4.1 3.9 4.3 4.6 5.2 5.9 6.7 2.9 3.7 3.1 2.8 3.2 2.7 2.7 2.9 3.1
Luxembourg 0.7 2.3 2.2 2.2 2.5 2.6 3.6 4.6 3.5 193.1 265.7 298.1 279.0 302.6 306.4 326.4 346.2 338.5
Malta - - - - 0.0 - 0.0 - - 39.0 53.3 69.6 133.4 132.0 131.2 142.7 133.5 93.5
Netherlands 111.6 118.5 125.2 133.5 154.3 155.0 185.4 182.3 193.7 58.3 61.5 64.6 67.3 70.3 66.8 73.5 69.5 69.7
Austria 4.0 4.8 5.1 4.8 5.2 5.5 5.8 5.9 6.2 31.8 35.2 35.4 33.7 35.7 35.3 36.3 35.4 34.5
Portugal 11.0 11.9 10.0 8.2 7.7 8.0 9.3 9.3 9.1 32.6 36.5 37.5 33.3 36.4 36.4 37.2 34.7 32.4
Slovenia 3.6 4.7 5.4 5.5 5.8 6.0 6.3 6.4 6.4 12.0 13.9 14.9 14.9 17.2 18.0 18.8 18.1 18.6
Slovakia - - - - 4.9 10.5 10.2 10.0 10.2 - - - - 11.2 8.1 8.9 8.5 9.3
Finland 1.8 2.0 2.3 2.0 1.8 1.5 1.4 1.4 1.7 22.1 26.5 28.4 26.7 29.2 30.1 33.2 34.3 34.2
Euro area - - - - 16.9 17.2 19.7 20.1 21.3 - - - - 61.4 63.3 67.7 67.7 68.8
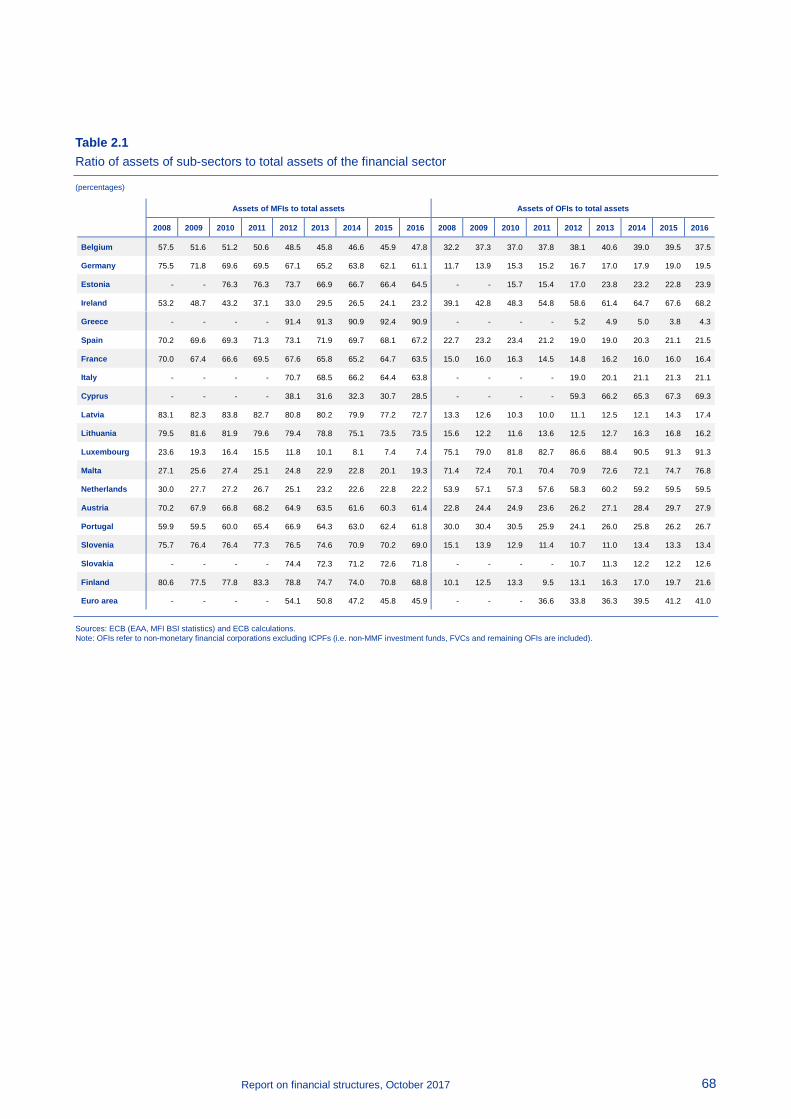
Report on financial structures, October 2017 68
Table 2.1 Ratio of assets of sub-sectors to total assets of the financial sector
(percentages)
Sources: ECB (EAA, MFI BSI statistics) and ECB calculations. Note: OFIs refer to non-monetary financial corporations excluding ICPFs (i.e. non-MMF investment funds, FVCs and remaining OFIs are included).
Assets of MFIs to total assets Assets of OFIs to total assets
2008 2009 2010 2011 2012 2013 2014 2015 2016 2008 2009 2010 2011 2012 2013 2014 2015 2016
Belgium 57.5 51.6 51.2 50.6 48.5 45.8 46.6 45.9 47.8 32.2 37.3 37.0 37.8 38.1 40.6 39.0 39.5 37.5
Germany 75.5 71.8 69.6 69.5 67.1 65.2 63.8 62.1 61.1 11.7 13.9 15.3 15.2 16.7 17.0 17.9 19.0 19.5
Estonia - - 76.3 76.3 73.7 66.9 66.7 66.4 64.5 - - 15.7 15.4 17.0 23.8 23.2 22.8 23.9
Ireland 53.2 48.7 43.2 37.1 33.0 29.5 26.5 24.1 23.2 39.1 42.8 48.3 54.8 58.6 61.4 64.7 67.6 68.2
Greece - - - - 91.4 91.3 90.9 92.4 90.9 - - - - 5.2 4.9 5.0 3.8 4.3
Spain 70.2 69.6 69.3 71.3 73.1 71.9 69.7 68.1 67.2 22.7 23.2 23.4 21.2 19.0 19.0 20.3 21.1 21.5
France 70.0 67.4 66.6 69.5 67.6 65.8 65.2 64.7 63.5 15.0 16.0 16.3 14.5 14.8 16.2 16.0 16.0 16.4
Italy - - - - 70.7 68.5 66.2 64.4 63.8 - - - - 19.0 20.1 21.1 21.3 21.1
Cyprus - - - - 38.1 31.6 32.3 30.7 28.5 - - - - 59.3 66.2 65.3 67.3 69.3
Latvia 83.1 82.3 83.8 82.7 80.8 80.2 79.9 77.2 72.7 13.3 12.6 10.3 10.0 11.1 12.5 12.1 14.3 17.4
Lithuania 79.5 81.6 81.9 79.6 79.4 78.8 75.1 73.5 73.5 15.6 12.2 11.6 13.6 12.5 12.7 16.3 16.8 16.2
Luxembourg 23.6 19.3 16.4 15.5 11.8 10.1 8.1 7.4 7.4 75.1 79.0 81.8 82.7 86.6 88.4 90.5 91.3 91.3
Malta 27.1 25.6 27.4 25.1 24.8 22.9 22.8 20.1 19.3 71.4 72.4 70.1 70.4 70.9 72.6 72.1 74.7 76.8
Netherlands 30.0 27.7 27.2 26.7 25.1 23.2 22.6 22.8 22.2 53.9 57.1 57.3 57.6 58.3 60.2 59.2 59.5 59.5
Austria 70.2 67.9 66.8 68.2 64.9 63.5 61.6 60.3 61.4 22.8 24.4 24.9 23.6 26.2 27.1 28.4 29.7 27.9
Portugal 59.9 59.5 60.0 65.4 66.9 64.3 63.0 62.4 61.8 30.0 30.4 30.5 25.9 24.1 26.0 25.8 26.2 26.7
Slovenia 75.7 76.4 76.4 77.3 76.5 74.6 70.9 70.2 69.0 15.1 13.9 12.9 11.4 10.7 11.0 13.4 13.3 13.4
Slovakia - - - - 74.4 72.3 71.2 72.6 71.8 - - - - 10.7 11.3 12.2 12.2 12.6
Finland 80.6 77.5 77.8 83.3 78.8 74.7 74.0 70.8 68.8 10.1 12.5 13.3 9.5 13.1 16.3 17.0 19.7 21.6
Euro area - - - - 54.1 50.8 47.2 45.8 45.9 - - - 36.6 33.8 36.3 39.5 41.2 41.0

Report on financial structures, October 2017 69
Table 2.2 Ratio of assets of sub-sectors to total assets of the financial sector (cont’d)
(percentages)
Sources: ECB (EAA, MFI BSI statistics) and ECB calculations.
Assets of pension funds to total assets Assets of insurance corporations to total assets
2008 2009 2010 2011 2012 2013 2014 2015 2016 2008 2009 2010 2011 2012 2013 2014 2015 2016
Belgium 0.5 0.6 0.6 0.6 0.7 0.9 0.9 1.0 1.1 9.8 10.6 11.2 11.0 12.8 12.8 13.4 13.5 13.6
Germany 2.3 2.7 2.9 3.0 3.4 3.5 3.8 4.1 4.3 10.6 11.6 12.2 12.3 12.8 14.3 14.6 14.8 15.1
Estonia - - 4.3 4.7 5.7 6.1 7.0 7.7 8.4 - - 3.7 3.6 3.6 3.2 3.1 3.0 3.2
Ireland 1.9 2.1 2.1 2.0 2.2 2.6 2.5 2.5 2.6 5.8 6.4 6.4 6.2 6.2 6.4 6.3 5.8 6.0
Greece - - - - - 0.1 0.1 0.1 0.3 - - - - 3.3 3.8 4.0 3.8 4.5
Spain 2.1 2.2 2.2 2.2 2.3 2.6 2.9 3.1 3.4 5.0 5.1 5.1 5.4 5.6 6.5 7.1 7.7 7.9
France - - - - - - - - - 15.0 16.6 17.1 16.0 17.5 17.9 18.8 19.3 20.1
Italy - - - - 1.1 1.2 1.4 1.5 1.5 - - - - 9.2 10.2 11.3 12.8 13.6
Cyprus - - - - 1.4 1.1 1.1 0.9 0.9 - - - - 1.1 1.1 1.3 1.1 1.3
Latvia 2.0 3.1 3.7 4.1 4.8 5.3 6.1 6.5 7.9 1.7 2.0 2.2 3.2 3.2 2.0 1.9 2.0 2.0
Lithuania 2.0 3.1 3.7 3.9 4.6 5.3 5.7 6.5 7.1 2.9 3.1 2.8 2.9 3.4 3.2 2.9 3.2 3.3
Luxembourg 0.0 0.0 0.0 0.0 0.0 0.0 0.0 0.0 0.0 1.3 1.7 1.8 1.7 1.6 1.6 1.4 1.3 1.3
Malta - - - - 0.0 - 0.0 - - 1.5 2.0 2.5 4.5 4.4 4.5 5.1 5.2 3.9
Netherlands 10.6 10.0 10.2 10.4 11.4 11.6 13.0 12.9 13.5 5.5 5.2 5.3 5.3 5.2 5.0 5.2 4.9 4.8
Austria 0.8 0.9 1.0 1.0 1.1 1.3 1.4 1.4 1.6 6.3 6.8 7.3 7.2 7.8 8.1 8.5 8.6 9.0
Portugal 2.5 2.5 2.0 1.7 1.6 1.7 2.2 2.4 2.5 7.5 7.6 7.5 7.0 7.4 8.0 9.0 9.0 9.0
Slovenia 2.1 2.4 2.8 3.1 3.2 3.6 3.9 4.3 4.5 7.1 7.2 7.9 8.2 9.6 10.8 11.8 12.2 13.1
Slovakia - - - - 4.6 9.2 8.8 8.1 8.2 - - - - 10.4 7.1 7.7 7.0 7.4
Finland 0.7 0.7 0.7 0.5 0.5 0.4 0.4 0.4 0.5 8.7 9.3 8.3 6.7 7.6 8.6 8.6 9.1 9.1
Euro area - - - - 2.6 2.8 3.0 3.0 3.1 - - - - 9.5 10.1 10.3 10.0 10.0

Report on financial structures, October 2017 70
Table 3.1 Composition of financing provided to non-financial corporations by euro area financial institutions, by sector and by instrument
(percentages based on stocks at the end of the period)
Sector/instrument
Loans Debt securities Listed shares
2013 2014 2015 2016 2013 2014 2015 2016 2013 2014 2015 2016
MFIs 74.8 73.1 71.3 70.9 20.5 18.6 18.3 19.6 11.9 10.9 8.7 7.7
OFIs excluding non-MMF IFs 24.1 25.8 27.3 27.6 4.8 7.5 7.0 4.8 13.0 22.8 24.1 18.0
ICPFs 0.9 1.0 1.1 1.1 41.9 40.4 40.7 40.1 13.2 11.6 11.4 13.4
IFs 0.1 0.2 0.3 0.4 32.8 33.5 34.0 35.5 61.9 54.7 55.8 61.0
Sources: ECB (EAA) and ECB calculations. Note: OFIs refer to non-monetary financial corporations excluding ICPFs and non-MMF investment funds (i.e. FVCs and remaining OFIs are included).
Table 3.2 Financing provided to non-financial corporations by the euro area financial sector in relation to nominal GDP and to total financing received, by instrument
(percentages)
percentage of nominal GDP percentage share of total financing received by NFCs
2013 2014 2015 2016 2013 2014 2015 2016
Loans 52.6 52.9 52.7 51.8 58.7 58.4 56.3 56.4
Debt securities 7.3 8.2 8.3 8.9 66.5 68.2 69.2 70.7
Listed shares 10.1 12.1 13.1 13.1 24.3 28.1 27.9 27.3
Sources: ECB (EAA) and ECB calculations.
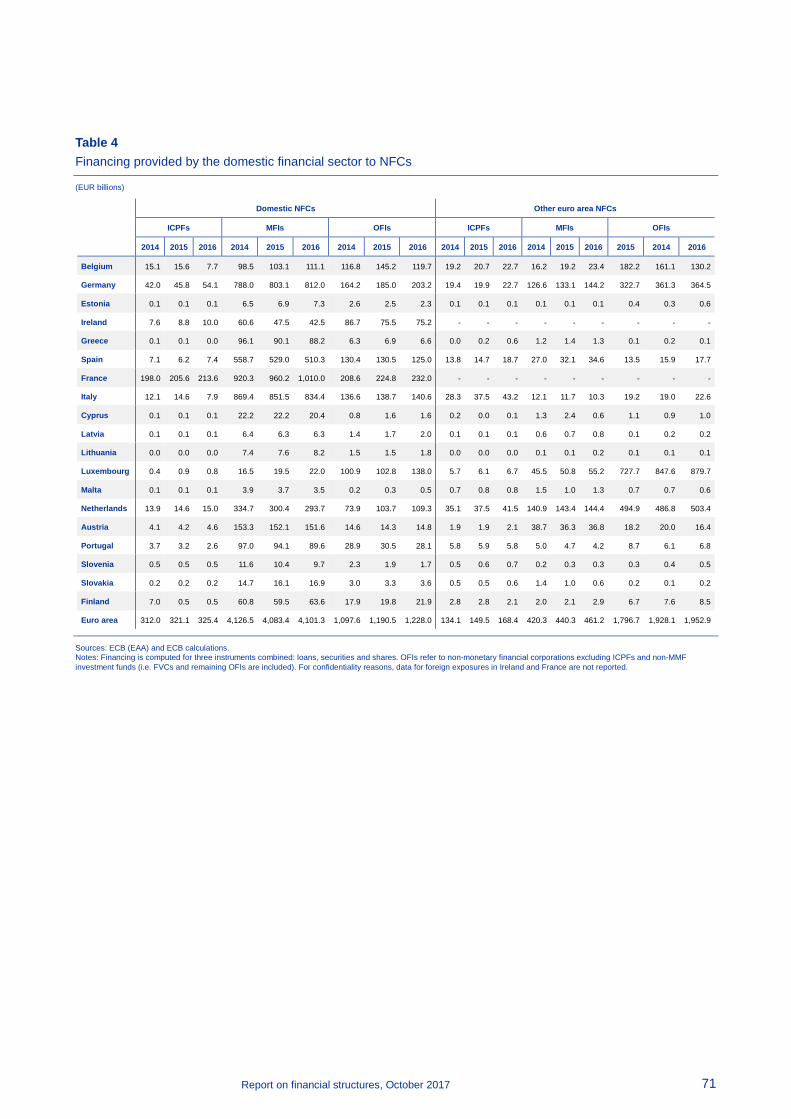
Report on financial structures, October 2017 71
Table 4 Financing provided by the domestic financial sector to NFCs
(EUR billions)
Sources: ECB (EAA) and ECB calculations. Notes: Financing is computed for three instruments combined: loans, securities and shares. OFIs refer to non-monetary financial corporations excluding ICPFs and non-MMF investment funds (i.e. FVCs and remaining OFIs are included). For confidentiality reasons, data for foreign exposures in Ireland and France are not reported.
Domestic NFCs Other euro area NFCs
ICPFs MFIs OFIs ICPFs MFIs OFIs
2014 2015 2016 2014 2015 2016 2014 2015 2016 2014 2015 2016 2014 2015 2016 2015 2014 2016
Belgium 15.1 15.6 7.7 98.5 103.1 111.1 116.8 145.2 119.7 19.2 20.7 22.7 16.2 19.2 23.4 182.2 161.1 130.2
Germany 42.0 45.8 54.1 788.0 803.1 812.0 164.2 185.0 203.2 19.4 19.9 22.7 126.6 133.1 144.2 322.7 361.3 364.5
Estonia 0.1 0.1 0.1 6.5 6.9 7.3 2.6 2.5 2.3 0.1 0.1 0.1 0.1 0.1 0.1 0.4 0.3 0.6
Ireland 7.6 8.8 10.0 60.6 47.5 42.5 86.7 75.5 75.2 - - - - - - - - -
Greece 0.1 0.1 0.0 96.1 90.1 88.2 6.3 6.9 6.6 0.0 0.2 0.6 1.2 1.4 1.3 0.1 0.2 0.1
Spain 7.1 6.2 7.4 558.7 529.0 510.3 130.4 130.5 125.0 13.8 14.7 18.7 27.0 32.1 34.6 13.5 15.9 17.7
France 198.0 205.6 213.6 920.3 960.2 1,010.0 208.6 224.8 232.0 - - - - - - - - -
Italy 12.1 14.6 7.9 869.4 851.5 834.4 136.6 138.7 140.6 28.3 37.5 43.2 12.1 11.7 10.3 19.2 19.0 22.6
Cyprus 0.1 0.1 0.1 22.2 22.2 20.4 0.8 1.6 1.6 0.2 0.0 0.1 1.3 2.4 0.6 1.1 0.9 1.0
Latvia 0.1 0.1 0.1 6.4 6.3 6.3 1.4 1.7 2.0 0.1 0.1 0.1 0.6 0.7 0.8 0.1 0.2 0.2
Lithuania 0.0 0.0 0.0 7.4 7.6 8.2 1.5 1.5 1.8 0.0 0.0 0.0 0.1 0.1 0.2 0.1 0.1 0.1
Luxembourg 0.4 0.9 0.8 16.5 19.5 22.0 100.9 102.8 138.0 5.7 6.1 6.7 45.5 50.8 55.2 727.7 847.6 879.7
Malta 0.1 0.1 0.1 3.9 3.7 3.5 0.2 0.3 0.5 0.7 0.8 0.8 1.5 1.0 1.3 0.7 0.7 0.6
Netherlands 13.9 14.6 15.0 334.7 300.4 293.7 73.9 103.7 109.3 35.1 37.5 41.5 140.9 143.4 144.4 494.9 486.8 503.4
Austria 4.1 4.2 4.6 153.3 152.1 151.6 14.6 14.3 14.8 1.9 1.9 2.1 38.7 36.3 36.8 18.2 20.0 16.4
Portugal 3.7 3.2 2.6 97.0 94.1 89.6 28.9 30.5 28.1 5.8 5.9 5.8 5.0 4.7 4.2 8.7 6.1 6.8
Slovenia 0.5 0.5 0.5 11.6 10.4 9.7 2.3 1.9 1.7 0.5 0.6 0.7 0.2 0.3 0.3 0.3 0.4 0.5
Slovakia 0.2 0.2 0.2 14.7 16.1 16.9 3.0 3.3 3.6 0.5 0.5 0.6 1.4 1.0 0.6 0.2 0.1 0.2
Finland 7.0 0.5 0.5 60.8 59.5 63.6 17.9 19.8 21.9 2.8 2.8 2.1 2.0 2.1 2.9 6.7 7.6 8.5
Euro area 312.0 321.1 325.4 4,126.5 4,083.4 4,101.3 1,097.6 1,190.5 1,228.0 134.1 149.5 168.4 420.3 440.3 461.2 1,796.7 1,928.1 1,952.9
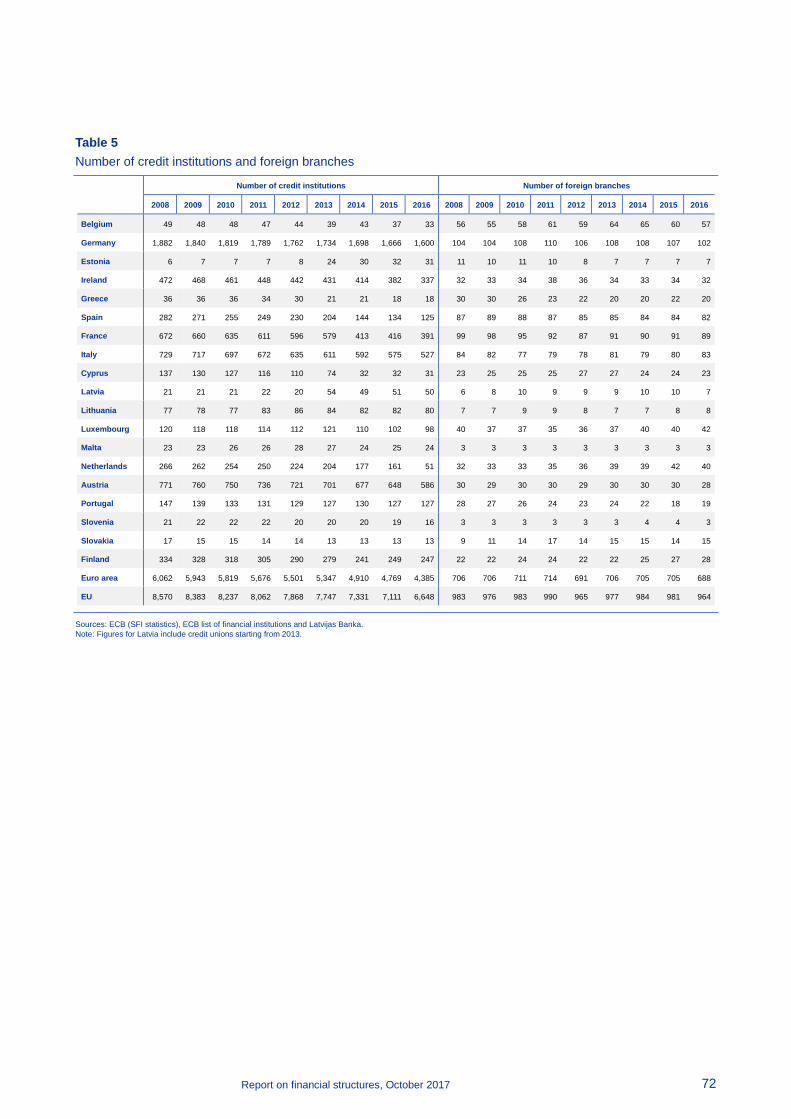
Report on financial structures, October 2017 72
Table 5 Number of credit institutions and foreign branches
Sources: ECB (SFI statistics), ECB list of financial institutions and Latvijas Banka. Note: Figures for Latvia include credit unions starting from 2013.
Number of credit institutions Number of foreign branches
2008 2009 2010 2011 2012 2013 2014 2015 2016 2008 2009 2010 2011 2012 2013 2014 2015 2016
Belgium 49 48 48 47 44 39 43 37 33 56 55 58 61 59 64 65 60 57
Germany 1,882 1,840 1,819 1,789 1,762 1,734 1,698 1,666 1,600 104 104 108 110 106 108 108 107 102
Estonia 6 7 7 7 8 24 30 32 31 11 10 11 10 8 7 7 7 7
Ireland 472 468 461 448 442 431 414 382 337 32 33 34 38 36 34 33 34 32
Greece 36 36 36 34 30 21 21 18 18 30 30 26 23 22 20 20 22 20
Spain 282 271 255 249 230 204 144 134 125 87 89 88 87 85 85 84 84 82
France 672 660 635 611 596 579 413 416 391 99 98 95 92 87 91 90 91 89
Italy 729 717 697 672 635 611 592 575 527 84 82 77 79 78 81 79 80 83
Cyprus 137 130 127 116 110 74 32 32 31 23 25 25 25 27 27 24 24 23
Latvia 21 21 21 22 20 54 49 51 50 6 8 10 9 9 9 10 10 7
Lithuania 77 78 77 83 86 84 82 82 80 7 7 9 9 8 7 7 8 8
Luxembourg 120 118 118 114 112 121 110 102 98 40 37 37 35 36 37 40 40 42
Malta 23 23 26 26 28 27 24 25 24 3 3 3 3 3 3 3 3 3
Netherlands 266 262 254 250 224 204 177 161 51 32 33 33 35 36 39 39 42 40
Austria 771 760 750 736 721 701 677 648 586 30 29 30 30 29 30 30 30 28
Portugal 147 139 133 131 129 127 130 127 127 28 27 26 24 23 24 22 18 19
Slovenia 21 22 22 22 20 20 20 19 16 3 3 3 3 3 3 4 4 3
Slovakia 17 15 15 14 14 13 13 13 13 9 11 14 17 14 15 15 14 15
Finland 334 328 318 305 290 279 241 249 247 22 22 24 24 22 22 25 27 28
Euro area 6,062 5,943 5,819 5,676 5,501 5,347 4,910 4,769 4,385 706 706 711 714 691 706 705 705 688
EU 8,570 8,383 8,237 8,062 7,868 7,747 7,331 7,111 6,648 983 976 983 990 965 977 984 981 964
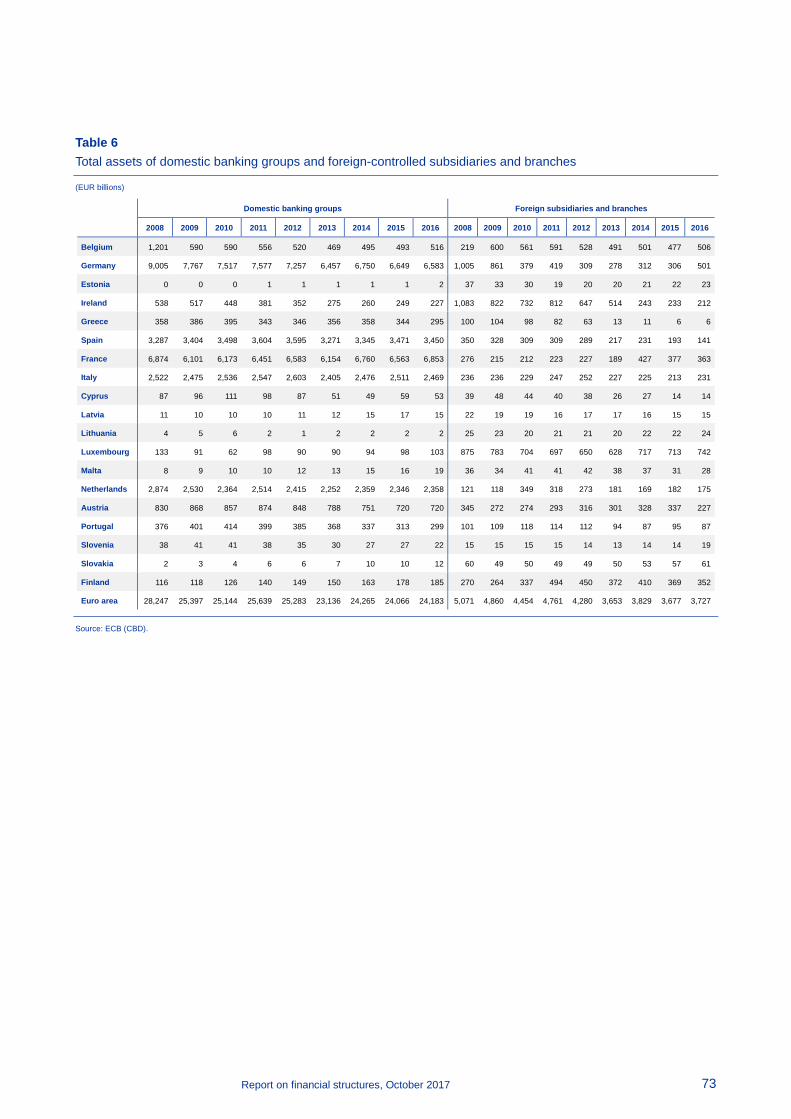
Report on financial structures, October 2017 73
Table 6 Total assets of domestic banking groups and foreign-controlled subsidiaries and branches
(EUR billions)
Source: ECB (CBD).
Domestic banking groups Foreign subsidiaries and branches
2008 2009 2010 2011 2012 2013 2014 2015 2016 2008 2009 2010 2011 2012 2013 2014 2015 2016
Belgium 1,201 590 590 556 520 469 495 493 516 219 600 561 591 528 491 501 477 506
Germany 9,005 7,767 7,517 7,577 7,257 6,457 6,750 6,649 6,583 1,005 861 379 419 309 278 312 306 501
Estonia 0 0 0 1 1 1 1 1 2 37 33 30 19 20 20 21 22 23
Ireland 538 517 448 381 352 275 260 249 227 1,083 822 732 812 647 514 243 233 212
Greece 358 386 395 343 346 356 358 344 295 100 104 98 82 63 13 11 6 6
Spain 3,287 3,404 3,498 3,604 3,595 3,271 3,345 3,471 3,450 350 328 309 309 289 217 231 193 141
France 6,874 6,101 6,173 6,451 6,583 6,154 6,760 6,563 6,853 276 215 212 223 227 189 427 377 363
Italy 2,522 2,475 2,536 2,547 2,603 2,405 2,476 2,511 2,469 236 236 229 247 252 227 225 213 231
Cyprus 87 96 111 98 87 51 49 59 53 39 48 44 40 38 26 27 14 14
Latvia 11 10 10 10 11 12 15 17 15 22 19 19 16 17 17 16 15 15
Lithuania 4 5 6 2 1 2 2 2 2 25 23 20 21 21 20 22 22 24
Luxembourg 133 91 62 98 90 90 94 98 103 875 783 704 697 650 628 717 713 742
Malta 8 9 10 10 12 13 15 16 19 36 34 41 41 42 38 37 31 28
Netherlands 2,874 2,530 2,364 2,514 2,415 2,252 2,359 2,346 2,358 121 118 349 318 273 181 169 182 175
Austria 830 868 857 874 848 788 751 720 720 345 272 274 293 316 301 328 337 227
Portugal 376 401 414 399 385 368 337 313 299 101 109 118 114 112 94 87 95 87
Slovenia 38 41 41 38 35 30 27 27 22 15 15 15 15 14 13 14 14 19
Slovakia 2 3 4 6 6 7 10 10 12 60 49 50 49 49 50 53 57 61
Finland 116 118 126 140 149 150 163 178 185 270 264 337 494 450 372 410 369 352
Euro area 28,247 25,397 25,144 25,639 25,283 23,136 24,265 24,066 24,183 5,071 4,860 4,454 4,761 4,280 3,653 3,829 3,677 3,727

Report on financial structures, October 2017 74
Table 7 Total assets of domestic banking groups and foreign-controlled subsidiaries and branches in relation to GDP
(ratio)
Sources: ECB (CBD) and ECB calculations. Note: Differences from Table 1 are mainly due to differences between locational (EAA) data and consolidated banking data.
Domestic banking groups Foreign subsidiaries and branches
2008 2009 2010 2011 2012 2013 2014 2015 2016 2008 2009 2010 2011 2012 2013 2014 2015 2016
Belgium 3.4 1.7 1.6 1.5 1.3 1.2 1.2 1.2 1.2 0.6 1.7 1.5 1.6 1.4 1.3 1.3 1.2 1.2
Germany 3.5 3.2 2.9 2.8 2.6 2.3 2.3 2.2 2.1 0.4 0.3 0.1 0.2 0.1 0.1 0.1 0.1 0.2
Estonia 0.02 0.0 0.0 0.1 0.0 0.0 0.1 0.1 0.1 2.2 2.3 2.1 1.1 1.1 1.1 1.1 1.1 1.1
Ireland 2.9 3.0 2.7 2.2 2.0 1.5 1.3 1.0 0.9 5.8 4.8 4.4 4.7 3.7 2.9 1.3 0.9 0.8
Greece 1.5 1.6 1.7 1.7 1.8 2.0 2.0 2.0 1.7 0.4 0.4 0.4 0.4 0.3 0.1 0.1 0.0 0.0
Spain 2.9 3.2 3.2 3.4 3.5 3.2 3.2 3.2 3.1 0.3 0.3 0.3 0.3 0.3 0.2 0.2 0.2 0.1
France 3.4 3.1 3.1 3.1 3.2 2.9 3.1 3.0 3.1 0.1 0.1 0.1 0.1 0.1 0.1 0.2 0.2 0.2
Italy 1.5 1.6 1.6 1.6 1.6 1.5 1.5 1.5 1.5 0.1 0.2 0.1 0.2 0.2 0.1 0.1 0.1 0.1
Cyprus 4.6 5.1 5.8 5.0 4.5 2.8 2.8 3.4 3.0 2.0 2.6 2.3 2.0 1.9 1.5 1.5 0.8 0.8
Latvia 0.5 0.5 0.6 0.5 0.5 0.5 0.6 0.7 0.6 0.9 1.0 1.1 0.8 0.8 0.7 0.7 0.6 0.6
Lithuania 0.1 0.2 0.2 0.1 0.0 0.1 0.1 0.1 0.1 0.8 0.8 0.7 0.7 0.6 0.6 0.6 0.6 0.6
Luxembourg 3.5 2.4 1.6 2.3 2.1 1.9 1.9 1.9 1.9 22.9 21.2 17.5 16.1 14.7 13.5 14.3 13.6 13.7
Malta 1.3 1.4 1.5 1.5 1.6 1.6 1.8 1.7 1.9 5.9 5.5 6.2 6.1 5.9 4.9 4.4 3.4 2.8
Netherlands 4.5 4.1 3.7 3.9 3.7 3.4 3.6 3.4 3.4 0.2 0.2 0.6 0.5 0.4 0.3 0.3 0.3 0.2
Austria 2.8 3.0 2.9 2.8 2.7 2.4 2.3 2.1 2.1 1.2 1.0 0.9 0.9 1.0 0.9 1.0 1.0 0.6
Portugal 2.1 2.3 2.3 2.3 2.3 2.2 1.9 1.7 1.6 0.6 0.6 0.7 0.6 0.7 0.6 0.5 0.5 0.5
Slovenia 1.0 1.1 1.1 1.0 1.0 0.8 0.7 0.7 0.5 0.4 0.4 0.4 0.4 0.4 0.4 0.4 0.4 0.5
Slovakia 0.0 0.0 0.1 0.1 0.1 0.1 0.1 0.1 0.1 0.9 0.8 0.7 0.7 0.7 0.7 0.7 0.7 0.8
Finland 0.6 0.7 0.7 0.7 0.7 0.7 0.8 0.8 0.9 1.4 1.5 1.8 2.5 2.3 1.8 2.0 1.8 1.6
Euro area 3.0 2.8 2.7 2.6 2.6 2.3 2.4 2.3 2.3 0.5 0.5 0.5 0.5 0.4 0.4 0.4 0.4 0.3
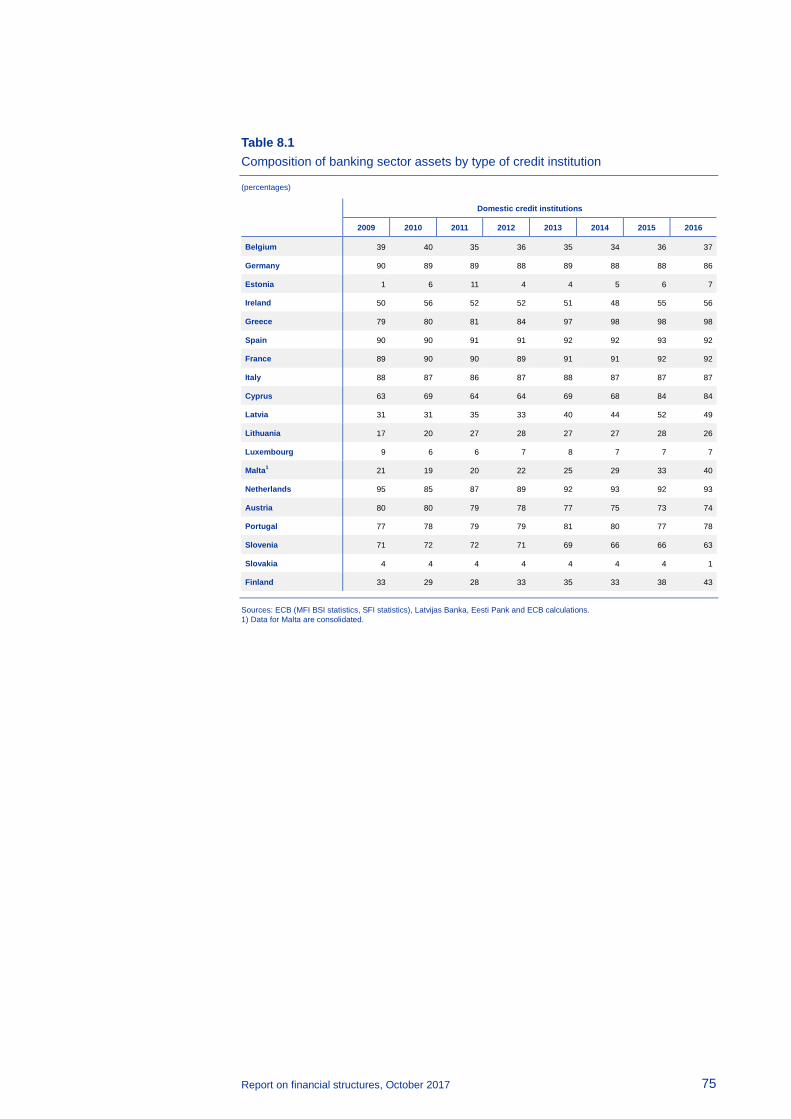
Report on financial structures, October 2017 75
Table 8.1 Composition of banking sector assets by type of credit institution
(percentages)
Domestic credit institutions
2009 2010 2011 2012 2013 2014 2015 2016
Belgium 39 40 35 36 35 34 36 37
Germany 90 89 89 88 89 88 88 86
Estonia 1 6 11 4 4 5 6 7
Ireland 50 56 52 52 51 48 55 56
Greece 79 80 81 84 97 98 98 98
Spain 90 90 91 91 92 92 93 92
France 89 90 90 89 91 91 92 92
Italy 88 87 86 87 88 87 87 87
Cyprus 63 69 64 64 69 68 84 84
Latvia 31 31 35 33 40 44 52 49
Lithuania 17 20 27 28 27 27 28 26
Luxembourg 9 6 6 7 8 7 7 7
Malta1 21 19 20 22 25 29 33 40
Netherlands 95 85 87 89 92 93 92 93
Austria 80 80 79 78 77 75 73 74
Portugal 77 78 79 79 81 80 77 78
Slovenia 71 72 72 71 69 66 66 63
Slovakia 4 4 4 4 4 4 4 1
Finland 33 29 28 33 35 33 38 43
Sources: ECB (MFI BSI statistics, SFI statistics), Latvijas Banka, Eesti Pank and ECB calculations. 1) Data for Malta are consolidated.

Report on financial structures, October 2017 76
Table 8.2 Composition of banking sector assets by type of credit institution (cont’d)
(percentages)
Sources: ECB (MFI BSI statistics, SFI statistics), Latvijas Banka, Eesti Pank and ECB calculations. 1) For confidentiality reasons, data for Malta combine branches of credit institutions from EU countries and branches and subsidiaries of credit institutions from the rest of the world.
Subsidiaries of credit institutions from EU countries Branches of credit institutions from EU countries
2008 2009 2010 2011 2012 2013 2014 2015 2016 2008 2009 2010 2011 2012 2013 2014 2015 2016
Belgium 18.0 50.0 47.8 47.1 42.3 40.2 38.4 35.9 34.5 3.6 3.6 3.9 6.6 8.3 10.6 13.4 12.4 12.7
Germany 2.2 6.9 7.6 8.0 7.7 7.3 7.6 7.5 7.9 2.0 2.0 2.0 2.3 3.1 2.5 2.5 3.3 4.0
Estonia - 82.1 65.1 61.6 63.7 63.9 63.9 62.1 62.7 - 16.8 27.2 27.6 28.6 27.2 25.9 26.2 25.4
Ireland 37.9 33.6 27.0 25.8 23.4 24.5 27.2 17.5 15.6 9.5 9.5 10.3 12.1 14.2 13.2 14.3 15.9 15.1
Greece 13.6 13.3 12.8 8.1 7.5 0.2 0.2 0.2 0.1 8.4 7.6 7.0 10.8 8.7 2.5 2.2 1.3 1.6
Spain 3.3 3.3 3.3 3.4 3.3 3.3 2.5 1.7 1.5 6.8 6.4 5.9 5.7 5.3 4.2 3.5 3.4 3.9
France 8.9 8.0 7.7 7.4 8.1 6.2 6.1 4.8 4.7 1.9 1.8 1.6 1.5 1.6 1.4 1.5 1.6 1.6
Italy 5.6 5.6 6.0 5.9 6.1 5.8 5.8 5.6 6.2 7.3 6.2 6.6 7.0 6.7 6.0 6.2 6.5 5.9
Cyprus 30.4 32.7 25.2 20.6 16.0 13.3 14.2 11.0 11.2 3.5 0.8 1.1 1.5 1.8 1.4 1.0 0.6 0.6
Latvia - 42.7 40.4 36.7 34.8 33.3 28.8 28.4 30.2 - 12.0 12.1 12.3 13.4 11.8 12.8 10.5 13.7
Lithuania 67.2 65.8 61.5 54.5 52.4 54.5 53.5 56.9 57.5 17.6 17.6 18.1 18.9 19.7 18.2 19.8 15.2 16.2
Luxembourg 68.8 68.1 71.0 68.0 66.8 63.1 55.7 53.0 49.6 13.8 14.3 12.7 11.3 11.6 11.1 13.2 14.9 16.3
Malta1 - 35.2 36.5 34.8 31.9 24.7 17.4 16.9 13.5 - 44.1 44.3 45.0 46.5 50.2 54.0 49.6 46.0
Netherlands 0.7 0.6 10.3 7.3 3.8 2.6 1.8 1.5 0.9 2.9 2.9 3.2 4.2 5.4 3.8 3.5 4.2 4.5
Austria 17.9 13.8 13.6 14.3 14.8 15.3 16.2 17.4 15.4 1.1 1.1 1.1 1.1 1.2 1.4 1.6 1.7 1.8
Portugal 15.8 15.8 14.4 13.4 12.1 12.7 13.5 17.6 17.4 5.8 6.4 6.8 7.5 8.1 6.5 6.6 5.4 4.5
Slovenia 29.8 28.2 27.2 27.1 27.8 28.7 31.1 31.9 33.1 1.0 0.9 1.0 1.3 1.5 2.0 2.5 2.6 3.7
Slovakia 88.5 89.2 89.2 88.6 88.3 88.9 82.2 82.1 84.3 6.6 6.9 6.6 7.0 7.7 7.2 13.9 14.2 14.5
Finland 64.6 62.7 65.6 65.4 60.0 59.4 61.5 55.8 49.6 4.9 4.4 5.0 6.1 7.0 5.4 5.7 6.5 7.6
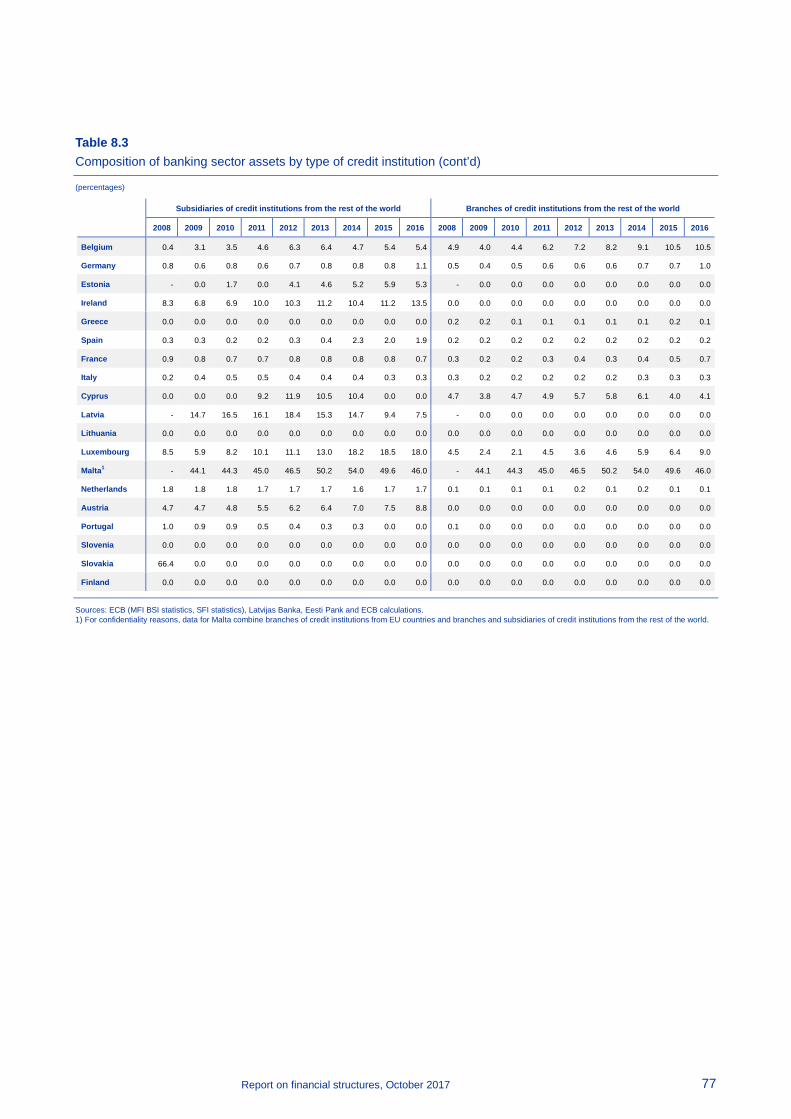
Report on financial structures, October 2017 77
Table 8.3 Composition of banking sector assets by type of credit institution (cont’d)
(percentages)
Sources: ECB (MFI BSI statistics, SFI statistics), Latvijas Banka, Eesti Pank and ECB calculations. 1) For confidentiality reasons, data for Malta combine branches of credit institutions from EU countries and branches and subsidiaries of credit institutions from the rest of the world.
Subsidiaries of credit institutions from the rest of the world Branches of credit institutions from the rest of the world
2008 2009 2010 2011 2012 2013 2014 2015 2016 2008 2009 2010 2011 2012 2013 2014 2015 2016
Belgium 0.4 3.1 3.5 4.6 6.3 6.4 4.7 5.4 5.4 4.9 4.0 4.4 6.2 7.2 8.2 9.1 10.5 10.5
Germany 0.8 0.6 0.8 0.6 0.7 0.8 0.8 0.8 1.1 0.5 0.4 0.5 0.6 0.6 0.6 0.7 0.7 1.0
Estonia - 0.0 1.7 0.0 4.1 4.6 5.2 5.9 5.3 - 0.0 0.0 0.0 0.0 0.0 0.0 0.0 0.0
Ireland 8.3 6.8 6.9 10.0 10.3 11.2 10.4 11.2 13.5 0.0 0.0 0.0 0.0 0.0 0.0 0.0 0.0 0.0
Greece 0.0 0.0 0.0 0.0 0.0 0.0 0.0 0.0 0.0 0.2 0.2 0.1 0.1 0.1 0.1 0.1 0.2 0.1
Spain 0.3 0.3 0.2 0.2 0.3 0.4 2.3 2.0 1.9 0.2 0.2 0.2 0.2 0.2 0.2 0.2 0.2 0.2
France 0.9 0.8 0.7 0.7 0.8 0.8 0.8 0.8 0.7 0.3 0.2 0.2 0.3 0.4 0.3 0.4 0.5 0.7
Italy 0.2 0.4 0.5 0.5 0.4 0.4 0.4 0.3 0.3 0.3 0.2 0.2 0.2 0.2 0.2 0.3 0.3 0.3
Cyprus 0.0 0.0 0.0 9.2 11.9 10.5 10.4 0.0 0.0 4.7 3.8 4.7 4.9 5.7 5.8 6.1 4.0 4.1
Latvia - 14.7 16.5 16.1 18.4 15.3 14.7 9.4 7.5 - 0.0 0.0 0.0 0.0 0.0 0.0 0.0 0.0
Lithuania 0.0 0.0 0.0 0.0 0.0 0.0 0.0 0.0 0.0 0.0 0.0 0.0 0.0 0.0 0.0 0.0 0.0 0.0
Luxembourg 8.5 5.9 8.2 10.1 11.1 13.0 18.2 18.5 18.0 4.5 2.4 2.1 4.5 3.6 4.6 5.9 6.4 9.0
Malta1 - 44.1 44.3 45.0 46.5 50.2 54.0 49.6 46.0 - 44.1 44.3 45.0 46.5 50.2 54.0 49.6 46.0
Netherlands 1.8 1.8 1.8 1.7 1.7 1.7 1.6 1.7 1.7 0.1 0.1 0.1 0.1 0.2 0.1 0.2 0.1 0.1
Austria 4.7 4.7 4.8 5.5 6.2 6.4 7.0 7.5 8.8 0.0 0.0 0.0 0.0 0.0 0.0 0.0 0.0 0.0
Portugal 1.0 0.9 0.9 0.5 0.4 0.3 0.3 0.0 0.0 0.1 0.0 0.0 0.0 0.0 0.0 0.0 0.0 0.0
Slovenia 0.0 0.0 0.0 0.0 0.0 0.0 0.0 0.0 0.0 0.0 0.0 0.0 0.0 0.0 0.0 0.0 0.0 0.0
Slovakia 66.4 0.0 0.0 0.0 0.0 0.0 0.0 0.0 0.0 0.0 0.0 0.0 0.0 0.0 0.0 0.0 0.0 0.0
Finland 0.0 0.0 0.0 0.0 0.0 0.0 0.0 0.0 0.0 0.0 0.0 0.0 0.0 0.0 0.0 0.0 0.0 0.0
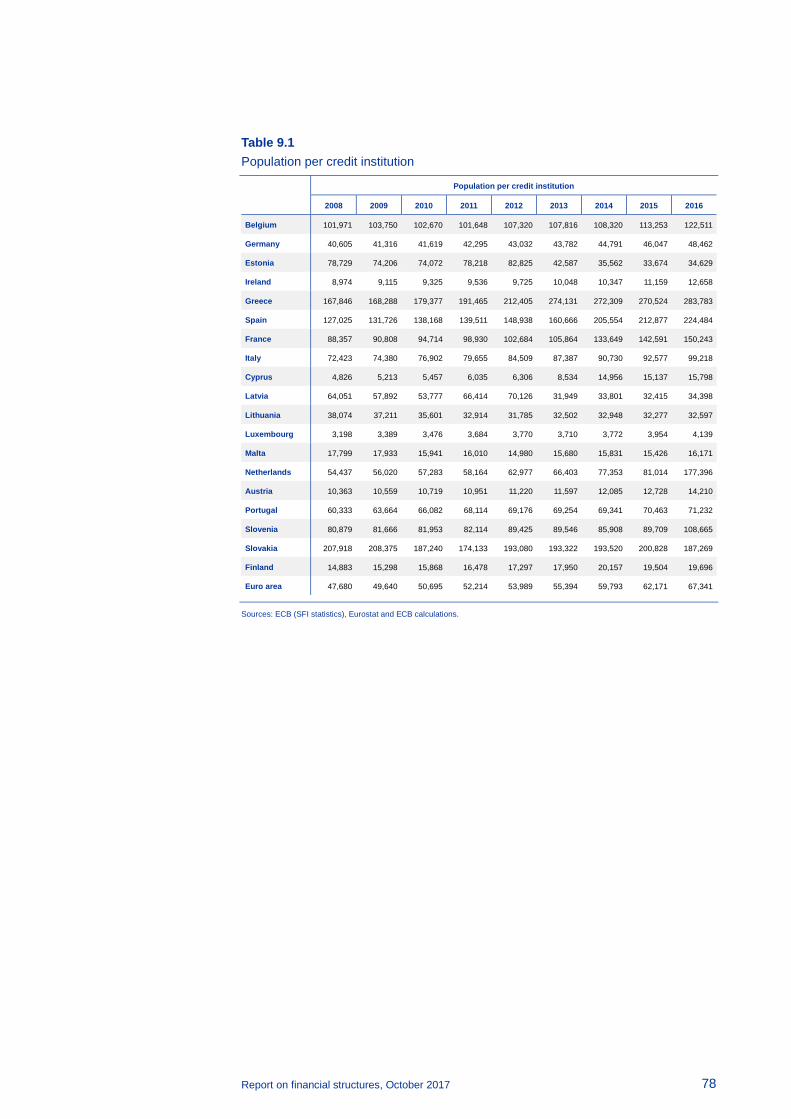
Report on financial structures, October 2017 78
Table 9.1 Population per credit institution
Population per credit institution
2008 2009 2010 2011 2012 2013 2014 2015 2016
Belgium 101,971 103,750 102,670 101,648 107,320 107,816 108,320 113,253 122,511
Germany 40,605 41,316 41,619 42,295 43,032 43,782 44,791 46,047 48,462
Estonia 78,729 74,206 74,072 78,218 82,825 42,587 35,562 33,674 34,629
Ireland 8,974 9,115 9,325 9,536 9,725 10,048 10,347 11,159 12,658
Greece 167,846 168,288 179,377 191,465 212,405 274,131 272,309 270,524 283,783
Spain 127,025 131,726 138,168 139,511 148,938 160,666 205,554 212,877 224,484
France 88,357 90,808 94,714 98,930 102,684 105,864 133,649 142,591 150,243
Italy 72,423 74,380 76,902 79,655 84,509 87,387 90,730 92,577 99,218
Cyprus 4,826 5,213 5,457 6,035 6,306 8,534 14,956 15,137 15,798
Latvia 64,051 57,892 53,777 66,414 70,126 31,949 33,801 32,415 34,398
Lithuania 38,074 37,211 35,601 32,914 31,785 32,502 32,948 32,277 32,597
Luxembourg 3,198 3,389 3,476 3,684 3,770 3,710 3,772 3,954 4,139
Malta 17,799 17,933 15,941 16,010 14,980 15,680 15,831 15,426 16,171
Netherlands 54,437 56,020 57,283 58,164 62,977 66,403 77,353 81,014 177,396
Austria 10,363 10,559 10,719 10,951 11,220 11,597 12,085 12,728 14,210
Portugal 60,333 63,664 66,082 68,114 69,176 69,254 69,341 70,463 71,232
Slovenia 80,879 81,666 81,953 82,114 89,425 89,546 85,908 89,709 108,665
Slovakia 207,918 208,375 187,240 174,133 193,080 193,322 193,520 200,828 187,269
Finland 14,883 15,298 15,868 16,478 17,297 17,950 20,157 19,504 19,696
Euro area 47,680 49,640 50,695 52,214 53,989 55,394 59,793 62,171 67,341
Sources: ECB (SFI statistics), Eurostat and ECB calculations.
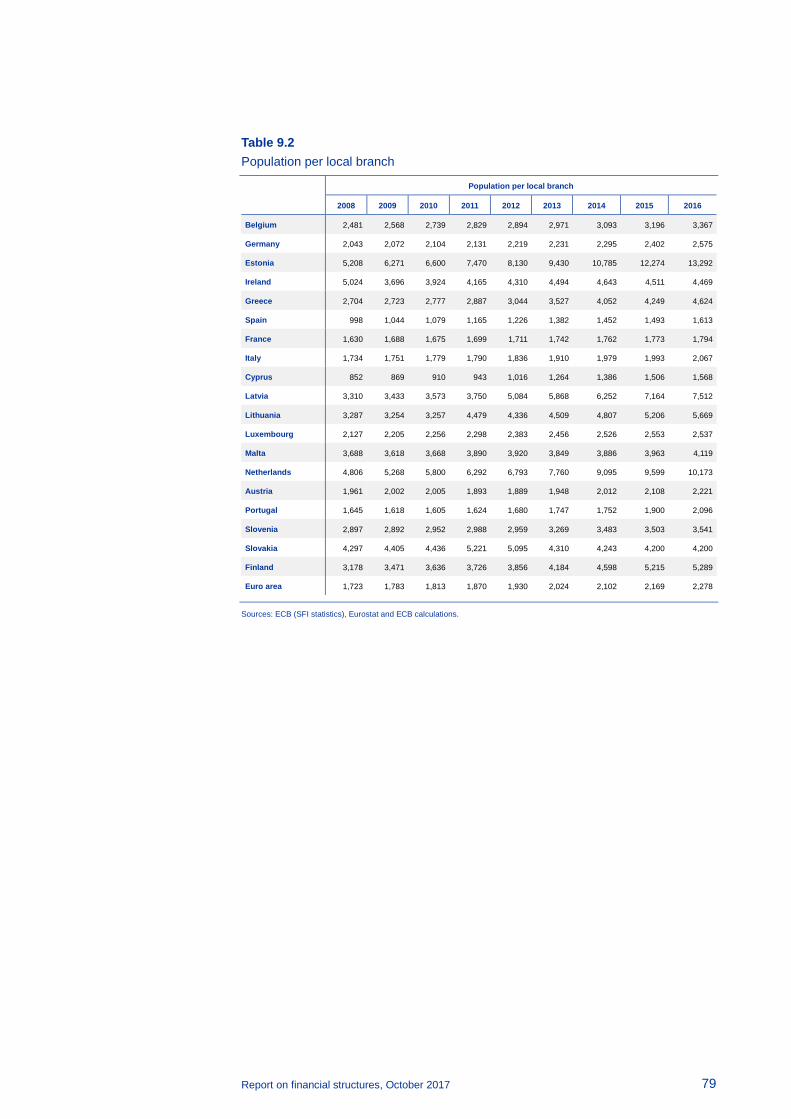
Report on financial structures, October 2017 79
Table 9.2 Population per local branch
Population per local branch
2008 2009 2010 2011 2012 2013 2014 2015 2016
Belgium 2,481 2,568 2,739 2,829 2,894 2,971 3,093 3,196 3,367
Germany 2,043 2,072 2,104 2,131 2,219 2,231 2,295 2,402 2,575
Estonia 5,208 6,271 6,600 7,470 8,130 9,430 10,785 12,274 13,292
Ireland 5,024 3,696 3,924 4,165 4,310 4,494 4,643 4,511 4,469
Greece 2,704 2,723 2,777 2,887 3,044 3,527 4,052 4,249 4,624
Spain 998 1,044 1,079 1,165 1,226 1,382 1,452 1,493 1,613
France 1,630 1,688 1,675 1,699 1,711 1,742 1,762 1,773 1,794
Italy 1,734 1,751 1,779 1,790 1,836 1,910 1,979 1,993 2,067
Cyprus 852 869 910 943 1,016 1,264 1,386 1,506 1,568
Latvia 3,310 3,433 3,573 3,750 5,084 5,868 6,252 7,164 7,512
Lithuania 3,287 3,254 3,257 4,479 4,336 4,509 4,807 5,206 5,669
Luxembourg 2,127 2,205 2,256 2,298 2,383 2,456 2,526 2,553 2,537
Malta 3,688 3,618 3,668 3,890 3,920 3,849 3,886 3,963 4,119
Netherlands 4,806 5,268 5,800 6,292 6,793 7,760 9,095 9,599 10,173
Austria 1,961 2,002 2,005 1,893 1,889 1,948 2,012 2,108 2,221
Portugal 1,645 1,618 1,605 1,624 1,680 1,747 1,752 1,900 2,096
Slovenia 2,897 2,892 2,952 2,988 2,959 3,269 3,483 3,503 3,541
Slovakia 4,297 4,405 4,436 5,221 5,095 4,310 4,243 4,200 4,200
Finland 3,178 3,471 3,636 3,726 3,856 4,184 4,598 5,215 5,289
Euro area 1,723 1,783 1,813 1,870 1,930 2,024 2,102 2,169 2,278
Sources: ECB (SFI statistics), Eurostat and ECB calculations.

Report on financial structures, October 2017 80
Table 10 Population per bank employee and assets per bank employee
(EUR thousands)
Sources: ECB (SFI statistics) and ECB calculations.
Population per bank employee Assets per bank employee
2008 2009 2010 2011 2012 2013 2014 2015 2016 2008 2009 2010 2011 2012 2013 2014 2015 2016
Belgium 162 169 176 179 184 191 197 201 206 19,258 18,133 18,313 19,550 18,052 17,524 19,431 19,027 20,099
Germany 118 119 120 121 122 123 125 128 131 11,488 11,023 12,408 12,634 12,470 11,477 11,999 12,023 12,402
Estonia 218 235 243 241 238 272 271 264 267 3,598 3,748 3,700 3,448 3,536 4,104 4,415 4,668 5,018
Ireland 111 119 125 129 144 154 160 171 175 34,863 34,669 32,055 28,808 27,466 24,826 23,743 22,634 22,018
Greece 167 169 175 185 194 214 239 235 253 6,986 7,473 8,103 7,942 7,743 7,937 8,696 8,363 8,241
Spain 166 173 178 190 200 216 230 236 249 12,229 12,840 13,248 14,690 15,255 14,555 14,707 14,348 14,537
France 152 155 157 153 156 158 162 164 166 17,019 17,169 17,953 18,833 18,302 18,155 19,286 19,256 19,850
Italy 175 184 186 190 195 198 203 203 205 10,752 11,412 11,707 12,754 13,607 13,171 13,395 13,112 13,273
Cyprus 63 65 66 66 67 77 78 77 80 9,411 11,138 10,675 10,277 9,969 8,103 8,320 8,287 8,117
Latvia 157 173 182 184 192 201 213 210 223 2,319 2,420 2,657 2,621 2,683 2,917 3,292 3,397 3,343
Lithuania 289 290 310 348 345 352 328 344 332 2,395 2,401 2,569 2,836 2,814 2,864 2,847 2,938 3,131
Luxembourg 18 19 19 19 20 21 21 22 22 34,239 30,189 29,299 29,841 27,800 27,291 28,458 28,740 29,304
Malta 106 108 106 103 105 101 97 94 92 10,920 10,731 12,749 12,700 13,304 11,940 11,847 10,313 9,719
Netherlands 142 150 154 158 162 174 179 188 198 19,216 20,132 20,917 22,678 23,672 22,768 25,582 26,856 28,644
Austria 106 108 107 107 109 112 115 118 120 13,414 13,300 12,500 12,919 12,586 12,022 11,819 11,650 11,578
Portugal 169 172 172 176 183 187 193 204 222 7,729 8,445 9,086 9,568 9,691 9,185 8,670 8,819 9,140
Slovenia 165 168 171 174 179 184 193 198 205 3,988 4,380 4,419 4,436 4,415 4,125 4,076 3,978 3,987
Slovakia 262 289 298 293 290 292 290 287 274 3,101 2,905 3,092 3,124 3,193 3,287 3,439 3,653 3,695
Finland 207 215 230 232 241 243 248 251 250 14,939 15,581 20,131 27,296 26,524 23,296 26,153 25,341 24,753
Euro area 140 147 149 152 156 160 165 170 174 13,419 13,477 14,180 14,956 14,910 14,243 14,902 14,836 15,229

Report on financial structures, October 2017 81
Table 11 Herfindahl index for credit institutions and share of total assets of the five largest credit institutions
Sources: ECB (SFI statistics) and ECB calculations. 1) The Herfindahl index (HI) refers to the concentration of banking business. The HI is obtained by adding the squares of the market shares of all the credit institutions in the banking sector. The exact formula according to which data must be transmitted to the ECB is given in the Guideline of the ECB on monetary, financial institutions and markets statistics (recast) (ECB/2007/9) (OJ L 341, 27.12.2007, p. 1). 2) Banking sector and individual figures are reported on an unconsolidated basis.
Herfindahl index for credit institutions1
(index ranging from 0 to 10,000)
Share of total assets of the five largest credit institutions2
(percentage share of the five largest credit institutions)
2008 2009 2010 2011 2012 2013 2014 2015 2016 2008 2009 2010 2011 2012 2013 2014 2015 2016
Belgium 1,881 1,622 1,439 1,294 1,061 979 981 998 1,017 81 77 75 71 66 64 66 65 66
Germany 191 206 301 317 307 266 300 273 277 23 25 33 34 33 31 32 31 31
Estonia 3,120 3,090 2,929 2,613 2,493 2,483 2,445 2,409 2,406 95 93 92 91 90 90 90 89 88
Ireland 661 714 700 647 632 674 677 678 644 50 53 50 47 46 48 48 46 44
Greece 1,172 1,183 1,214 1,278 1,487 2,136 2,195 2,254 2,332 70 69 71 72 79 94 94 95 97
Spain 497 507 528 596 654 719 839 896 937 42 43 44 48 51 54 58 60 62
France 681 605 610 600 545 568 584 589 572 51 47 47 48 45 47 48 47 46
Italy 307 298 410 407 410 406 424 435 452 31 31 40 39 40 40 41 41 43
Cyprus 1,017 1,085 1,125 1,030 1,007 1,645 1,445 1,443 1,372 64 65 64 61 63 64 63 68 66
Latvia 1,205 1,181 1,005 929 1,027 1,037 1,001 1,033 1,080 70 69 60 60 64 64 64 65 67
Lithuania 1,714 1,693 1,545 1,871 1,749 1,892 1,818 1,939 1,938 81 80 79 85 84 87 86 87 87
Luxembourg 309 310 343 346 345 357 330 321 260 30 29 31 31 33 34 32 31 28
Malta 1,236 1,250 1,181 1,203 1,313 1,458 1,648 1,620 1,599 73 73 71 72 74 76 81 81 80
Netherlands 2,167 2,034 2,049 2,067 2,026 2,105 2,131 2,104 2,097 87 85 84 84 82 84 85 85 85
Austria 454 414 383 423 395 405 412 397 358 39 37 36 38 36 37 37 36 34
Portugal 1,114 1,150 1,207 1,206 1,191 1,197 1,164 1,215 1,181 69 70 71 71 70 70 69 72 71
Slovenia 1,268 1,256 1,160 1,142 1,115 1,045 1,026 1,077 1,147 59 60 59 59 58 57 56 59 61
Slovakia 1,197 1,273 1,239 1,268 1,221 1,215 1,221 1,250 1,264 72 72 72 72 71 70 71 72 73
Finland 3,160 3,120 3,550 3,700 3,010 3,080 3,310 2,730 1,790 83 83 84 81 79 84 80 75 66
Euro area 676 649 688 710 677 689 730 720 697 44 44 47 47 47 47 48 48 48
EU 648 629 669 685 662 674 692 677 661 44 44 47 47 47 47 47 46 46
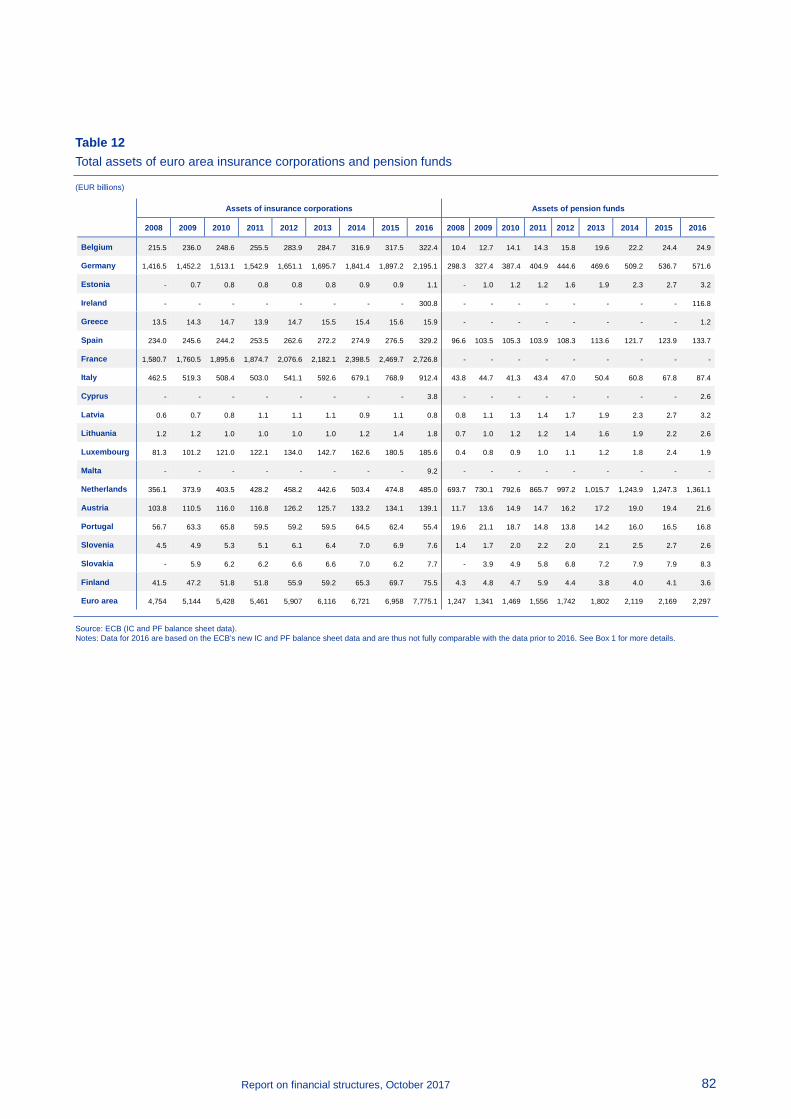
Report on financial structures, October 2017 82
Table 12 Total assets of euro area insurance corporations and pension funds
(EUR billions)
Source: ECB (IC and PF balance sheet data). Notes: Data for 2016 are based on the ECB’s new IC and PF balance sheet data and are thus not fully comparable with the data prior to 2016. See Box 1 for more details.
Assets of insurance corporations Assets of pension funds
2008 2009 2010 2011 2012 2013 2014 2015 2016 2008 2009 2010 2011 2012 2013 2014 2015 2016
Belgium 215.5 236.0 248.6 255.5 283.9 284.7 316.9 317.5 322.4 10.4 12.7 14.1 14.3 15.8 19.6 22.2 24.4 24.9
Germany 1,416.5 1,452.2 1,513.1 1,542.9 1,651.1 1,695.7 1,841.4 1,897.2 2,195.1 298.3 327.4 387.4 404.9 444.6 469.6 509.2 536.7 571.6
Estonia - 0.7 0.8 0.8 0.8 0.8 0.9 0.9 1.1 - 1.0 1.2 1.2 1.6 1.9 2.3 2.7 3.2
Ireland - - - - - - - - 300.8 - - - - - - - - 116.8
Greece 13.5 14.3 14.7 13.9 14.7 15.5 15.4 15.6 15.9 - - - - - - - - 1.2
Spain 234.0 245.6 244.2 253.5 262.6 272.2 274.9 276.5 329.2 96.6 103.5 105.3 103.9 108.3 113.6 121.7 123.9 133.7
France 1,580.7 1,760.5 1,895.6 1,874.7 2,076.6 2,182.1 2,398.5 2,469.7 2,726.8 - - - - - - - - -
Italy 462.5 519.3 508.4 503.0 541.1 592.6 679.1 768.9 912.4 43.8 44.7 41.3 43.4 47.0 50.4 60.8 67.8 87.4
Cyprus - - - - - - - - 3.8 - - - - - - - - 2.6
Latvia 0.6 0.7 0.8 1.1 1.1 1.1 0.9 1.1 0.8 0.8 1.1 1.3 1.4 1.7 1.9 2.3 2.7 3.2
Lithuania 1.2 1.2 1.0 1.0 1.0 1.0 1.2 1.4 1.8 0.7 1.0 1.2 1.2 1.4 1.6 1.9 2.2 2.6
Luxembourg 81.3 101.2 121.0 122.1 134.0 142.7 162.6 180.5 185.6 0.4 0.8 0.9 1.0 1.1 1.2 1.8 2.4 1.9
Malta - - - - - - - - 9.2 - - - - - - - - -
Netherlands 356.1 373.9 403.5 428.2 458.2 442.6 503.4 474.8 485.0 693.7 730.1 792.6 865.7 997.2 1,015.7 1,243.9 1,247.3 1,361.1
Austria 103.8 110.5 116.0 116.8 126.2 125.7 133.2 134.1 139.1 11.7 13.6 14.9 14.7 16.2 17.2 19.0 19.4 21.6
Portugal 56.7 63.3 65.8 59.5 59.2 59.5 64.5 62.4 55.4 19.6 21.1 18.7 14.8 13.8 14.2 16.0 16.5 16.8
Slovenia 4.5 4.9 5.3 5.1 6.1 6.4 7.0 6.9 7.6 1.4 1.7 2.0 2.2 2.0 2.1 2.5 2.7 2.6
Slovakia - 5.9 6.2 6.2 6.6 6.6 7.0 6.2 7.7 - 3.9 4.9 5.8 6.8 7.2 7.9 7.9 8.3
Finland 41.5 47.2 51.8 51.8 55.9 59.2 65.3 69.7 75.5 4.3 4.8 4.7 5.9 4.4 3.8 4.0 4.1 3.6
Euro area 4,754 5,144 5,428 5,461 5,907 6,116 6,721 6,958 7,775.1 1,247 1,341 1,469 1,556 1,742 1,802 2,119 2,169 2,297
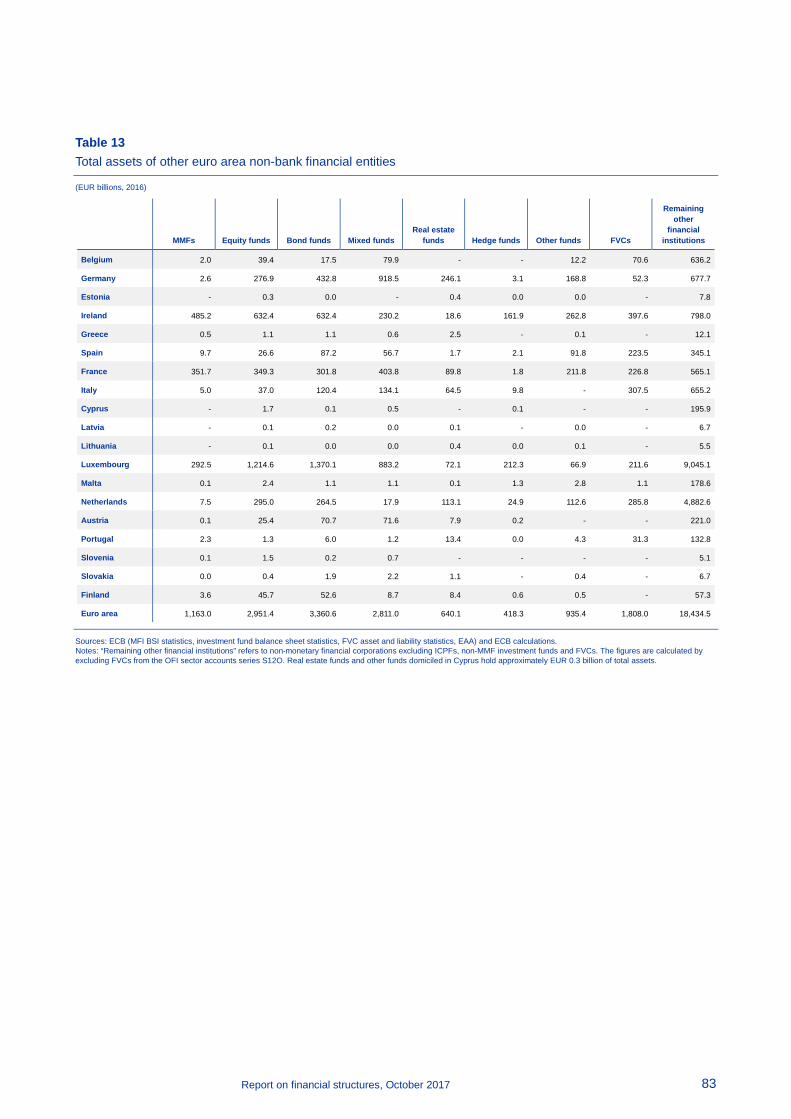
Report on financial structures, October 2017 83
Table 13 Total assets of other euro area non-bank financial entities
(EUR billions, 2016)
Sources: ECB (MFI BSI statistics, investment fund balance sheet statistics, FVC asset and liability statistics, EAA) and ECB calculations. Notes: “Remaining other financial institutions” refers to non-monetary financial corporations excluding ICPFs, non-MMF investment funds and FVCs. The figures are calculated by excluding FVCs from the OFI sector accounts series S12O. Real estate funds and other funds domiciled in Cyprus hold approximately EUR 0.3 billion of total assets.
MMFs Equity funds Bond funds Mixed funds Real estate
funds Hedge funds Other funds FVCs
Remaining other
financial institutions
Belgium 2.0 39.4 17.5 79.9 - - 12.2 70.6 636.2
Germany 2.6 276.9 432.8 918.5 246.1 3.1 168.8 52.3 677.7
Estonia - 0.3 0.0 - 0.4 0.0 0.0 - 7.8
Ireland 485.2 632.4 632.4 230.2 18.6 161.9 262.8 397.6 798.0
Greece 0.5 1.1 1.1 0.6 2.5 - 0.1 - 12.1
Spain 9.7 26.6 87.2 56.7 1.7 2.1 91.8 223.5 345.1
France 351.7 349.3 301.8 403.8 89.8 1.8 211.8 226.8 565.1
Italy 5.0 37.0 120.4 134.1 64.5 9.8 - 307.5 655.2
Cyprus - 1.7 0.1 0.5 - 0.1 - - 195.9
Latvia - 0.1 0.2 0.0 0.1 - 0.0 - 6.7
Lithuania - 0.1 0.0 0.0 0.4 0.0 0.1 - 5.5
Luxembourg 292.5 1,214.6 1,370.1 883.2 72.1 212.3 66.9 211.6 9,045.1
Malta 0.1 2.4 1.1 1.1 0.1 1.3 2.8 1.1 178.6
Netherlands 7.5 295.0 264.5 17.9 113.1 24.9 112.6 285.8 4,882.6
Austria 0.1 25.4 70.7 71.6 7.9 0.2 - - 221.0
Portugal 2.3 1.3 6.0 1.2 13.4 0.0 4.3 31.3 132.8
Slovenia 0.1 1.5 0.2 0.7 - - - - 5.1
Slovakia 0.0 0.4 1.9 2.2 1.1 - 0.4 - 6.7
Finland 3.6 45.7 52.6 8.7 8.4 0.6 0.5 - 57.3
Euro area 1,163.0 2,951.4 3,360.6 2,811.0 640.1 418.3 935.4 1,808.0 18,434.5
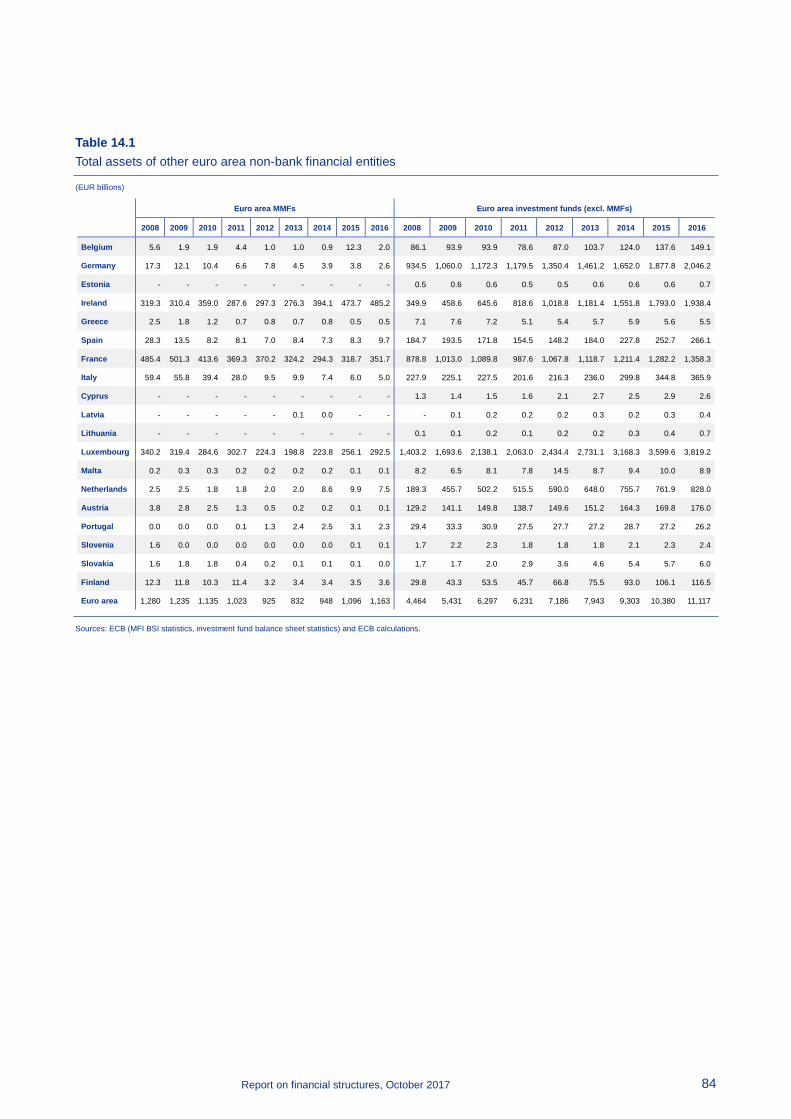
Report on financial structures, October 2017 84
Table 14.1 Total assets of other euro area non-bank financial entities
(EUR billions)
Sources: ECB (MFI BSI statistics, investment fund balance sheet statistics) and ECB calculations.
Euro area MMFs Euro area investment funds (excl. MMFs)
2008 2009 2010 2011 2012 2013 2014 2015 2016 2008 2009 2010 2011 2012 2013 2014 2015 2016
Belgium 5.6 1.9 1.9 4.4 1.0 1.0 0.9 12.3 2.0 86.1 93.9 93.9 78.6 87.0 103.7 124.0 137.6 149.1
Germany 17.3 12.1 10.4 6.6 7.8 4.5 3.9 3.8 2.6 934.5 1,060.0 1,172.3 1,179.5 1,350.4 1,461.2 1,652.0 1,877.8 2,046.2
Estonia - - - - - - - - - 0.5 0.6 0.6 0.5 0.5 0.6 0.6 0.6 0.7
Ireland 319.3 310.4 359.0 287.6 297.3 276.3 394.1 473.7 485.2 349.9 458.6 645.6 818.6 1,018.8 1,181.4 1,551.8 1,793.0 1,938.4
Greece 2.5 1.8 1.2 0.7 0.8 0.7 0.8 0.5 0.5 7.1 7.6 7.2 5.1 5.4 5.7 5.9 5.6 5.5
Spain 28.3 13.5 8.2 8.1 7.0 8.4 7.3 8.3 9.7 184.7 193.5 171.8 154.5 148.2 184.0 227.8 252.7 266.1
France 485.4 501.3 413.6 369.3 370.2 324.2 294.3 318.7 351.7 878.8 1,013.0 1,089.8 987.6 1,067.8 1,118.7 1,211.4 1,282.2 1,358.3
Italy 59.4 55.8 39.4 28.0 9.5 9.9 7.4 6.0 5.0 227.9 225.1 227.5 201.6 216.3 236.0 299.8 344.8 365.9
Cyprus - - - - - - - - - 1.3 1.4 1.5 1.6 2.1 2.7 2.5 2.9 2.6
Latvia - - - - - 0.1 0.0 - - - 0.1 0.2 0.2 0.2 0.3 0.2 0.3 0.4
Lithuania - - - - - - - - - 0.1 0.1 0.2 0.1 0.2 0.2 0.3 0.4 0.7
Luxembourg 340.2 319.4 284.6 302.7 224.3 198.8 223.8 256.1 292.5 1,403.2 1,693.6 2,138.1 2,063.0 2,434.4 2,731.1 3,168.3 3,599.6 3,819.2
Malta 0.2 0.3 0.3 0.2 0.2 0.2 0.2 0.1 0.1 8.2 6.5 8.1 7.8 14.5 8.7 9.4 10.0 8.9
Netherlands 2.5 2.5 1.8 1.8 2.0 2.0 8.6 9.9 7.5 189.3 455.7 502.2 515.5 590.0 648.0 755.7 761.9 828.0
Austria 3.8 2.8 2.5 1.3 0.5 0.2 0.2 0.1 0.1 129.2 141.1 149.8 138.7 149.6 151.2 164.3 169.8 176.0
Portugal 0.0 0.0 0.0 0.1 1.3 2.4 2.5 3.1 2.3 29.4 33.3 30.9 27.5 27.7 27.2 28.7 27.2 26.2
Slovenia 1.6 0.0 0.0 0.0 0.0 0.0 0.0 0.1 0.1 1.7 2.2 2.3 1.8 1.8 1.8 2.1 2.3 2.4
Slovakia 1.6 1.8 1.8 0.4 0.2 0.1 0.1 0.1 0.0 1.7 1.7 2.0 2.9 3.6 4.6 5.4 5.7 6.0
Finland 12.3 11.8 10.3 11.4 3.2 3.4 3.4 3.5 3.6 29.8 43.3 53.5 45.7 66.8 75.5 93.0 106.1 116.5
Euro area 1,280 1,235 1,135 1,023 925 832 948 1,096 1,163 4,464 5,431 6,297 6,231 7,186 7,943 9,303 10,380 11,117
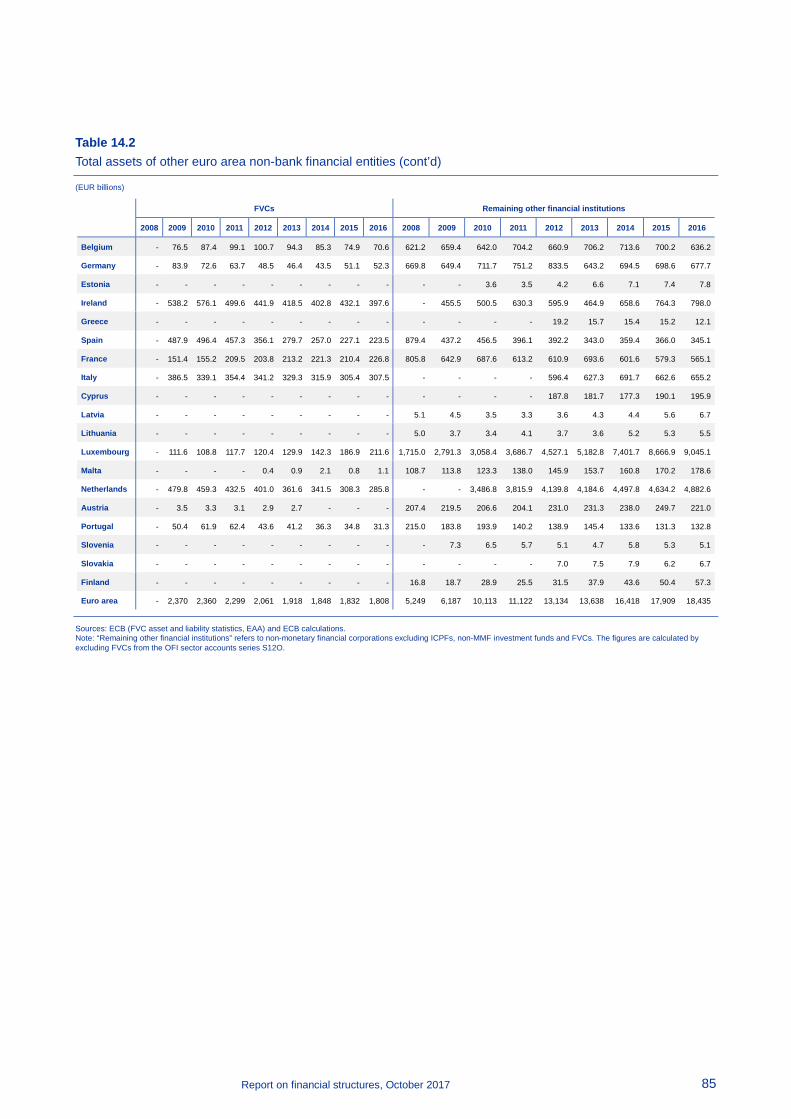
Report on financial structures, October 2017 85
Table 14.2 Total assets of other euro area non-bank financial entities (cont’d)
(EUR billions)
Sources: ECB (FVC asset and liability statistics, EAA) and ECB calculations. Note: “Remaining other financial institutions” refers to non-monetary financial corporations excluding ICPFs, non-MMF investment funds and FVCs. The figures are calculated by excluding FVCs from the OFI sector accounts series S12O.
FVCs Remaining other financial institutions
2008 2009 2010 2011 2012 2013 2014 2015 2016 2008 2009 2010 2011 2012 2013 2014 2015 2016
Belgium - 76.5 87.4 99.1 100.7 94.3 85.3 74.9 70.6 621.2 659.4 642.0 704.2 660.9 706.2 713.6 700.2 636.2
Germany - 83.9 72.6 63.7 48.5 46.4 43.5 51.1 52.3 669.8 649.4 711.7 751.2 833.5 643.2 694.5 698.6 677.7
Estonia - - - - - - - - - - - 3.6 3.5 4.2 6.6 7.1 7.4 7.8
Ireland - 538.2 576.1 499.6 441.9 418.5 402.8 432.1 397.6 - 455.5 500.5 630.3 595.9 464.9 658.6 764.3 798.0
Greece - - - - - - - - - - - - - 19.2 15.7 15.4 15.2 12.1
Spain - 487.9 496.4 457.3 356.1 279.7 257.0 227.1 223.5 879.4 437.2 456.5 396.1 392.2 343.0 359.4 366.0 345.1
France - 151.4 155.2 209.5 203.8 213.2 221.3 210.4 226.8 805.8 642.9 687.6 613.2 610.9 693.6 601.6 579.3 565.1
Italy - 386.5 339.1 354.4 341.2 329.3 315.9 305.4 307.5 - - - - 596.4 627.3 691.7 662.6 655.2
Cyprus - - - - - - - - - - - - - 187.8 181.7 177.3 190.1 195.9
Latvia - - - - - - - - - 5.1 4.5 3.5 3.3 3.6 4.3 4.4 5.6 6.7
Lithuania - - - - - - - - - 5.0 3.7 3.4 4.1 3.7 3.6 5.2 5.3 5.5
Luxembourg - 111.6 108.8 117.7 120.4 129.9 142.3 186.9 211.6 1,715.0 2,791.3 3,058.4 3,686.7 4,527.1 5,182.8 7,401.7 8,666.9 9,045.1
Malta - - - - 0.4 0.9 2.1 0.8 1.1 108.7 113.8 123.3 138.0 145.9 153.7 160.8 170.2 178.6
Netherlands - 479.8 459.3 432.5 401.0 361.6 341.5 308.3 285.8 - - 3,486.8 3,815.9 4,139.8 4,184.6 4,497.8 4,634.2 4,882.6
Austria - 3.5 3.3 3.1 2.9 2.7 - - - 207.4 219.5 206.6 204.1 231.0 231.3 238.0 249.7 221.0
Portugal - 50.4 61.9 62.4 43.6 41.2 36.3 34.8 31.3 215.0 183.8 193.9 140.2 138.9 145.4 133.6 131.3 132.8
Slovenia - - - - - - - - - - 7.3 6.5 5.7 5.1 4.7 5.8 5.3 5.1
Slovakia - - - - - - - - - - - - - 7.0 7.5 7.9 6.2 6.7
Finland - - - - - - - - - 16.8 18.7 28.9 25.5 31.5 37.9 43.6 50.4 57.3
Euro area - 2,370 2,360 2,299 2,061 1,918 1,848 1,832 1,808 5,249 6,187 10,113 11,122 13,134 13,638 16,418 17,909 18,435

Abbreviations Countries BE Belgium BG Bulgaria CZ Czech Republic DK Denmark DE Germany EE Estonia IE Ireland GR Greece ES Spain FR France
HR Croatia IT Italy CY Cyprus LV Latvia LT Lithuania LU Luxembourg HU Hungary MT Malta NL Netherlands AT Austria
PL Poland PT Portugal RO Romania SI Slovenia SK Slovakia FI Finland SE Sweden UK United Kingdom US United States
In accordance with EU practice, the EU Member States are listed in this report using the alphabetical order of the country names in the national languages. Others ATM BSI
Automated teller machine balance sheet item
CBD consolidated banking data CET1 Common Equity Tier 1 CI credit institution CNAV constant net asset value EA euro area EAA euro area accounts ECB European Central Bank EEA European Economic Area EIOPA European Insurance and Occupational Pensions
Authority ESA European System of Accounts ESCB European System of Central Banks ESRB European Systemic Risk Board ETF exchange-traded fund EU European Union FSR Financial Stability Review FVC GDP
financial vehicle corporation gross domestic product
HI Herfindahl index IC insurance corporation ICPFs insurance corporations and pension funds IF investment fund IFRS International Financial Reporting Standards IFS International Financial Statistics
IFSU investment fund shares/units IMF International Monetary Fund LVNAV low-volatility net asset value M&A mergers and acquisitions MFI monetary financial institution MMF money market fund NAV net asset value NCB national central bank NFC non-financial corporation non-MMF non-money market investment fund NPL non-performing loan OFI other financial intermediary PF pension funds PSPP public sector purchase programme RFS Report on financial structures ROA return on assets ROE return on equity RWA risk-weighted asset SCR Solvency Capital Requirement SFI structural financial indicators SHS Securities Holdings Statistics SHSS Securities Holdings Statistics by Sector SSM Single Supervisory Mechanism VNAV variable net asset value
Conventions used in the tables “-” data are not available/data are not applicable
© European Central Bank, 2017
Postal address 60640 Frankfurt am Main, Germany Telephone +49 69 1344 0 Website www.ecb.europa.eu
All rights reserved. Reproduction for educational and non-commercial purposes is permitted provided that the source is acknowledged.
ISSN 2467-0111 (pdf) DOI 10.2866/349729 (pdf) ISBN 978-92-899-3013-0 (pdf) EU catalogue No QB-BV-17-001-EN-N (pdf)