2017 PNG Economic Survey,devpolicy.org/Events/2017/PNG Update Conference/Presentations/PS2... ·...
33
2017 PNG Economic Survey Rohan Fox (ANU), Stephen Howes (ANU), Nelson Atip Nema (UPNG), Marcel Schröder (UPNG and ANU)
Transcript of 2017 PNG Economic Survey,devpolicy.org/Events/2017/PNG Update Conference/Presentations/PS2... ·...

2017 PNG Economic Survey
Rohan Fox (ANU), Stephen Howes (ANU), Nelson Atip Nema (UPNG), Marcel Schröder (UPNG and ANU)

Introduction
• New government, new plan
• Short-term challenges: recession, falling government revenue, foreign exchange shortages
• Long term challenges: low growth of economy and of government revenue

The long-term view of the economyIntroduction – Growth – Fiscal – Macro – Conclusion
0
0.2
0.4
0.6
0.8
1
1.2
19
80
19
82
19
84
19
86
19
88
19
90
19
92
19
94
19
96
19
98
20
00
20
02
20
04
20
06
20
08
20
10
20
12
20
14
20
16
Non-resource GDP per capita (adjusted for inflation; 1980=1)

The long-term view of government
0
500
1000
1500
2000
25001
98
9
19
90
19
91
19
92
19
93
19
94
19
95
19
96
19
97
19
98
19
99
20
00
20
01
20
02
20
03
20
04
20
05
20
06
20
07
20
08
20
09
20
10
20
11
20
12
20
13
20
14
20
15
20
16
20
17
Kin
a (2
01
5 p
rice
s)
Real revenue per capita Real expenditure per capita
Revenue and expenditure per person (adjusted for inflation)
Introduction – Growth – Fiscal – Macro – Conclusion

This survey
• How can PNG respond to current economic difficulties AND get on a higher growth path?
• Section 2 – Growth
• Section 3 – Fiscal
• Section 4 – Macro (exchange rate and inflation)
• Conclusion
Introduction – Growth – Fiscal – Macro – Conclusion

Economic growth

The growth slowdown
Introduction – Growth – Fiscal – Macro – Conclusion
Real GDP and non-resource GDP growth (%)
0
2
4
6
8
10
12
14
2002 2003 2004 2005 2006 2007 2008 2009 2010 2011 2012 2013 2014 2015 2016
%
GDP Non-resource GDP

Has there been a recession?
• Views of business: Drop in output and sales of 20-35% from the peak.
• Negative growth in economy-wide tax revenue every year since 2014 (25% after inflation for GST, income tax and non-resource corporate tax).
• Sharp contraction in imports since 2014.
• Small fall in number of formal workers, and of foreign workers, both since 2013.
• Some evidence that the recession is now bottoming out.
• Confidence going forward from future resource projects, but nothing in the next year (or two?), and mistake to wait for the next project.
Introduction – Growth – Fiscal – Macro – Conclusion

Fiscal

Falling revenue; back to 2005 levels
Introduction – Growth – Fiscal – Macro – Conclusion
4
6
8
10
12
14
161
99
0
19
91
19
92
19
93
19
94
19
95
19
96
19
97
19
98
19
99
20
00
20
01
20
02
20
03
20
04
20
05
20
06
20
07
20
08
20
09
20
10
20
11
20
12
20
13
20
14
20
15
20
16
20
17
K b
illio
ns
(20
17
pri
ces)
. Government revenue, adjusted for inflation

Since 2014, falls in economy-wide taxes
0
500
1000
1500
2000
2500
3000
3500
4000
45001
98
9
19
90
19
91
19
92
19
93
19
94
19
95
19
96
19
97
19
98
19
99
20
00
20
01
20
02
20
03
20
04
20
05
20
06
20
07
20
08
20
09
20
10
20
11
20
12
20
13
20
14
20
15
20
16
20
17
K m
illio
n (
20
17
pri
ces)
Personal Income Tax Company Tax GST Mining and Petroleum Taxes
Tax revenue by source (adjusted for inflation)
Introduction – Growth – Fiscal – Macro – Conclusion

Sharp falls in expenditure, but after a steep increase
2
4
6
8
10
12
14
16
18
20
200020012002200320042005200620072008200920102011201220132014201520162017
Kin
a b
illio
n (
20
17
pri
ces)
Government expenditure, adjusted for inflation
Introduction – Growth – Fiscal – Macro – Conclusion

Rising salary and interest bill
0
0.5
1
1.5
2
2.5
3
3.5
41
98
9
19
90
19
91
19
92
19
93
19
94
19
95
19
96
19
97
19
98
19
99
20
00
20
01
20
02
20
03
20
04
20
05
20
06
20
07
20
08
20
09
20
10
20
11
20
12
20
13
20
14
20
15
20
16
20
17
Kin
a b
illio
ns
(20
15
pri
ces)
Real salaries Real interest
Salaries and interest bill, adjusted for inflation
Introduction – Growth – Fiscal – Macro – Conclusion

Discretionary spending back at 2007 levels
0
2
4
6
8
10
12
19
89
19
90
19
91
19
92
19
93
19
94
19
95
19
96
19
97
19
98
19
99
20
00
20
01
20
02
20
03
20
04
20
05
20
06
20
07
20
08
20
09
20
10
20
11
20
12
20
13
20
14
20
15
20
16
Kin
a b
illio
ns
(20
15
pri
ces)
Non-salary non-interest exp. (discretionary exp.)
Discretionary expenditure (total minus salaries and interest), adjusted for inflation
Introduction – Growth – Fiscal – Macro – Conclusion

Growth in provincial spending (DSIP etc) has also crowded out other sectors
0
0.5
1
1.5
2
2.5
3
3.5
4
4.5
5
ECONOMIC UTILITIES TRANSPORT COMMUNITY &CULTURE
EDUCATION HEALTH LAW & JUSTICE ADMINISTRATION MISCELLANEOUS PROVINCES*
K b
illio
ns
(20
17
pri
ces)
2012 2013 2014 2015 2016
Budget expenditure by sector, adjusted for inflation
Introduction – Growth – Fiscal – Macro – Conclusion

Big increase in deficits (borrowing) in recent years
-1.5
-1
-0.5
0
0.5
1
1.5
2
2.5
3
3.51
98
9
19
90
19
91
19
92
19
93
19
94
19
95
19
96
19
97
19
98
19
99
20
00
20
01
20
02
20
03
20
04
20
05
20
06
20
07
20
08
20
09
20
10
20
11
20
12
20
13
20
14
20
15
20
16
20
17
Kin
a b
illio
ns
(20
15
pri
ces)
Exp-Rev (real; 2015 prices)
Government expenditure minus revenue (borrowing)
Introduction – Growth – Fiscal – Macro – Conclusion

Leading to rapid growth in debt
0
5
10
15
20
25
30
K b
illio
n
Foreign Domestic
Government debt (not adjusted for inflation)
Introduction – Growth – Fiscal – Macro – Conclusion

Debt-to-revenue back at pre-boom levels
0
0.5
1
1.5
2
2.5
3
2000 2001 2002 2003 2004 2005 2006 2007 2008 2009 2010 2011 2012 2013 2014 2015 2016 2017
Debt to revenue ratio
Introduction – Growth – Fiscal – Macro – Conclusion

Macro and the Real Exchange Rate (RER)

Background - RER and TOT (terms of trade), 2000-16
Source: BPNG and WDI
Introduction – Growth – Fiscal – Macro – Conclusion

PGK/USD Exchange Rate, 08/2012-08/2017
Introduction – Growth – Fiscal – Macro – Conclusion

• Theory: Sharp RER appreciation during resource boom and decline of tradable sector ("Dutch Disease").
• After the boom, RER depreciation needed to restore internal and external balance
• In PNG, RER continued to appreciate even after the boom (see previous Figure)
• Reserves declined from US$ 4B in 6/2012 to US$ 1.7B in 12/2016.
• FX restrictions since 2014: US$ 300M-1B excess demand.
• Fox & Schröder (2017): kina overvaluation = 22% in 2015.
• We update their estimate to 2016: kina still 20% overvalued.
• 2017: RER appreciation projected overvaluation likely to increase
Introduction – Growth – Fiscal – Macro – Conclusion

Macro-level consequences of FX restrictions
• Macroeconomic adjustment to end of resource boom postponed for years.
• RER overvaluation leads to resource misallocation lower output and productivity growth, and investment.
• Businesses have great difficulty to source intermediate and capital goods from the rest of the world.
Imports have collapsed to historically low levels.
Introduction – Growth – Fiscal – Macro – Conclusion

PNG Imports – 1980-2016
Soruce: BPNG and WDI
Introduction – Growth – Fiscal – Macro – Conclusion

Micro-level consequences
• FX has become number 1 issue for PNG businesses.
• Processing time of FX-orders: Currently 8-16 weeks.
• Invoices outstanding now 60-180 days vs. 14-30d credit lines.
• "Dollarized" debt piles up while kina is pressured to depreciate.
• Overseas suppliers may lose have lost their patience.
• MNEs cannot repatriate profits.
• Administrative burden of FX-crisis increases costs Inflation.
Introduction – Growth – Fiscal – Macro – Conclusion

Inflation
0
2
4
6
8
10
12
14
16
18
201
99
0
19
91
19
92
19
93
19
94
19
95
19
96
19
97
19
98
19
99
20
00
20
01
20
02
20
03
20
04
20
05
20
06
20
07
20
08
20
09
20
10
20
11
20
12
20
13
20
14
20
15
20
16
20
17
p
%
Introduction – Growth – Fiscal – Macro – Conclusion
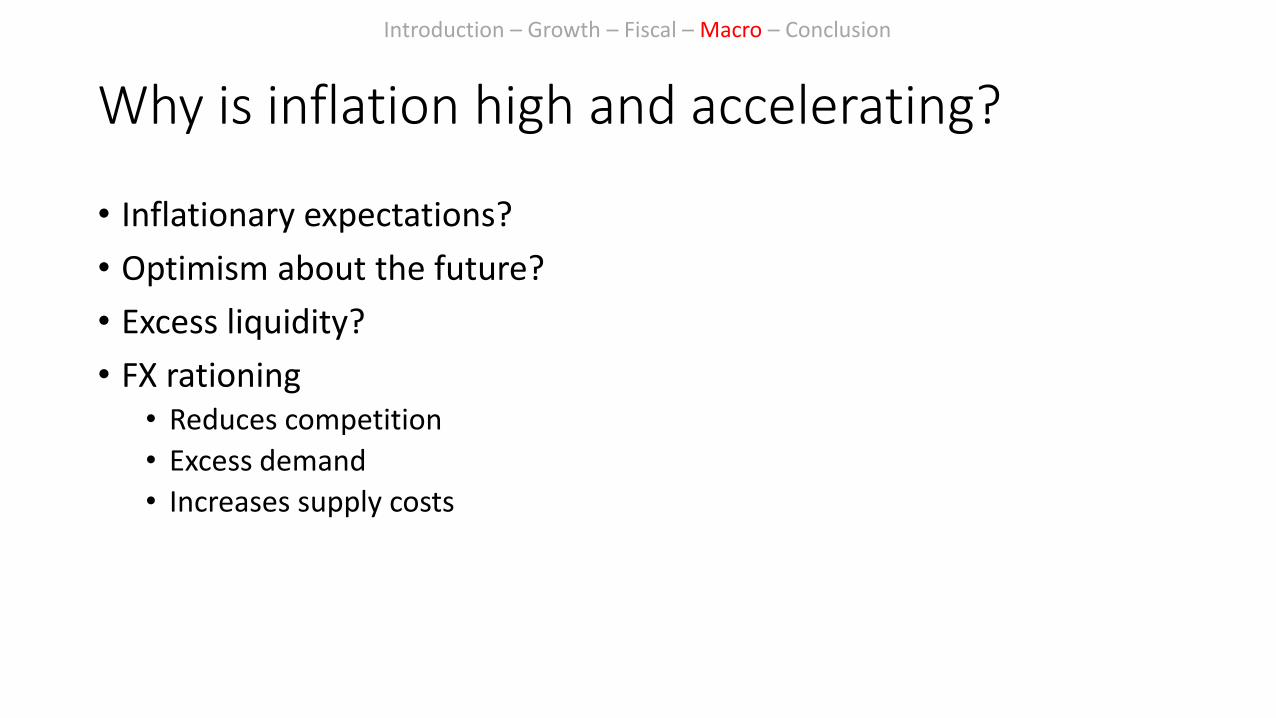
Why is inflation high and accelerating?
• Inflationary expectations?
• Optimism about the future?
• Excess liquidity?
• FX rationing• Reduces competition
• Excess demand
• Increases supply costs
Introduction – Growth – Fiscal – Macro – Conclusion
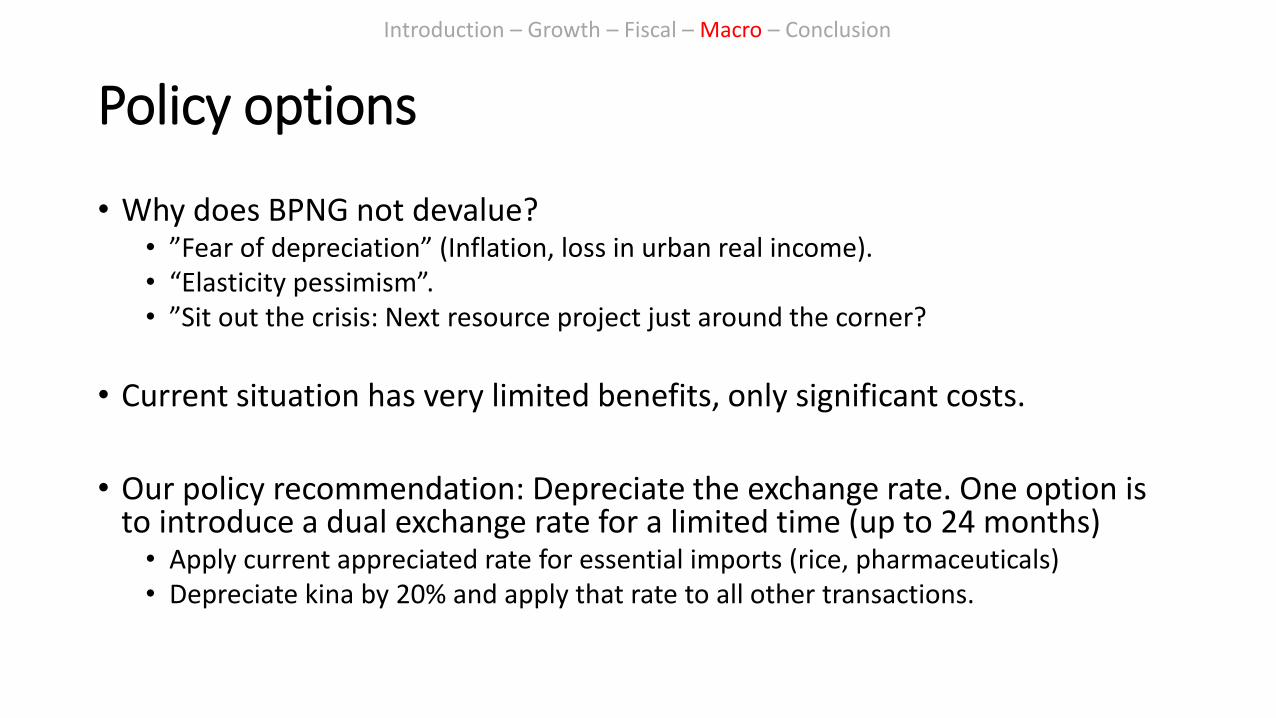
Policy options
• Why does BPNG not devalue?• ”Fear of depreciation” (Inflation, loss in urban real income).• “Elasticity pessimism”.• ”Sit out the crisis: Next resource project just around the corner?
• Current situation has very limited benefits, only significant costs.
• Our policy recommendation: Depreciate the exchange rate. One option is to introduce a dual exchange rate for a limited time (up to 24 months)• Apply current appreciated rate for essential imports (rice, pharmaceuticals)• Depreciate kina by 20% and apply that rate to all other transactions.
Introduction – Growth – Fiscal – Macro – Conclusion

Conclusion

Building consensus for reform
• New Treasurer has admitted there is a problem. Need to build consensus on this, and the need for tough decisions.
• Twin reform goals needed:• Stimulating economic growth
• Restoring fiscal sustainability while protecting basic services
Introduction – Growth – Fiscal – Macro – Conclusion

Reforms to stimulate economic growth
• Interest rate: BPNG has limited influence on market interest rates
• Exchange rate: Case for depreciation already discussed
• Structural policy: Need to rebuild business confidence
Introduction – Growth – Fiscal – Macro – Conclusion

Reforms for fiscal sustainability
• Borrowing: Government already borrowing as much as it can; deficits need to fall as the economy recovers.
• Taxation: Focus on compliance – IRC funding and performance
• Expenditure: Protection of key services (health, education) will require salary restraint and cuts to MP funds (DSIP etc).
Introduction – Growth – Fiscal – Macro – Conclusion

Tenkyu tru!
PNG Budget Database (devpolicy.anu.edu.au & look for PNG Project)