2017 Oregon Wine Symposium | The Myth of Terroir and Understanding Your Site: Soils, Rootstalks,...
49
Understanding your site: soils, climate, rootstocks and management strategies Cornelis (Kees) van Leeuwen Bordeaux Sciences Agro - UMR EGFV Institut des Sciences de la Vigne et du Vin 1
-
Upload
oregon-wine-board -
Category
Education
-
view
101 -
download
0
Transcript of 2017 Oregon Wine Symposium | The Myth of Terroir and Understanding Your Site: Soils, Rootstalks,...
Understanding your site: soils, climate, rootstocks and management strategies
Cornelis (Kees) van Leeuwen
Bordeaux Sciences Agro - UMR EGFV
Institut des Sciences de la Vigne et du Vin
1
Outline
• Define terroir
• Major environmental factors involved in terroir expression are :
– Temperature
– Water status
– Nitrogen status
• Measurement of terroir parameters
• Managing terroir
2
I – define terroir
3
4 4
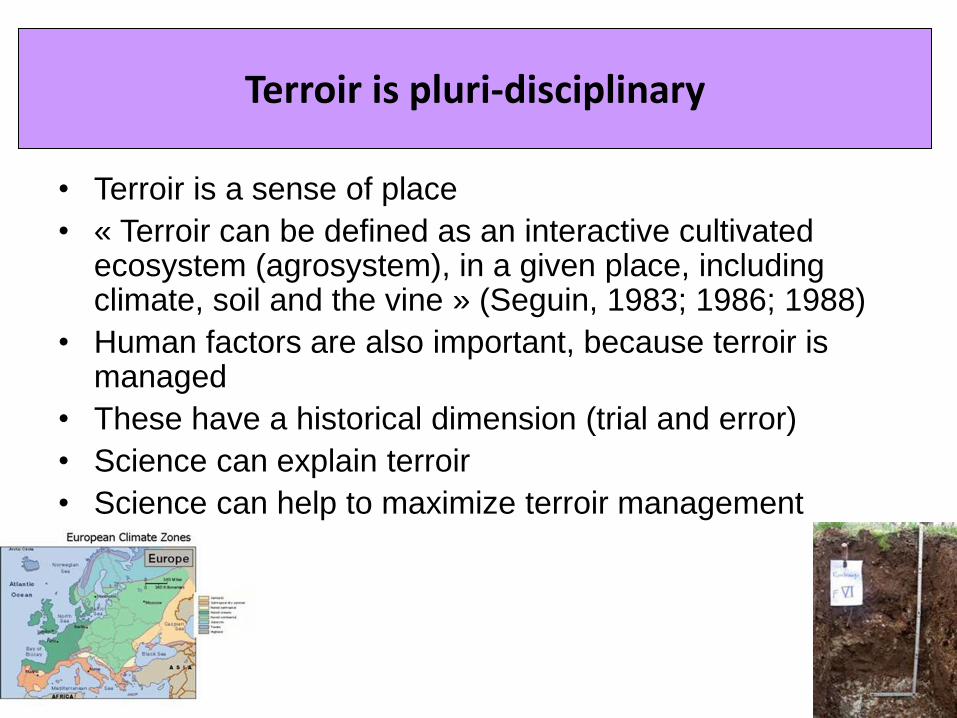
• Terroir is a sense of place
• « Terroir can be defined as an interactive cultivated ecosystem (agrosystem), in a given place, including climate, soil and the vine » (Seguin, 1983; 1986; 1988)
• Human factors are also important, because terroir is managed
• These have a historical dimension (trial and error)
• Science can explain terroir
• Science can help to maximize terroir management
Terroir is pluri-disciplinary
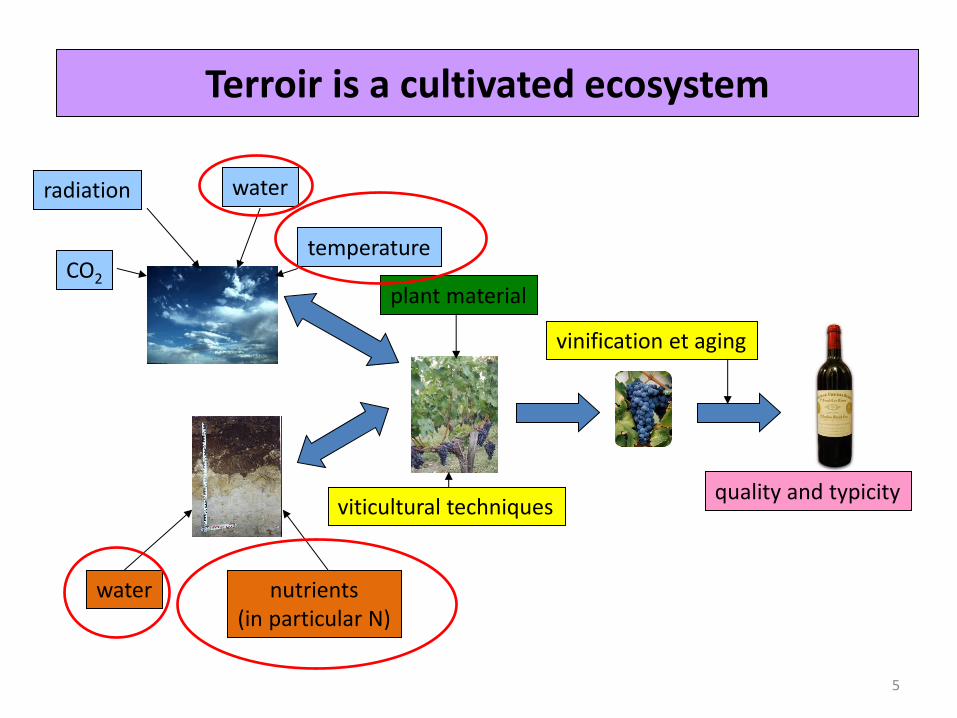
Terroir is a cultivated ecosystem
CO2
water radiation
water nutrients (in particular N)
temperature
viticultural techniques quality and typicity
vinification et aging
plant material
5
6 6
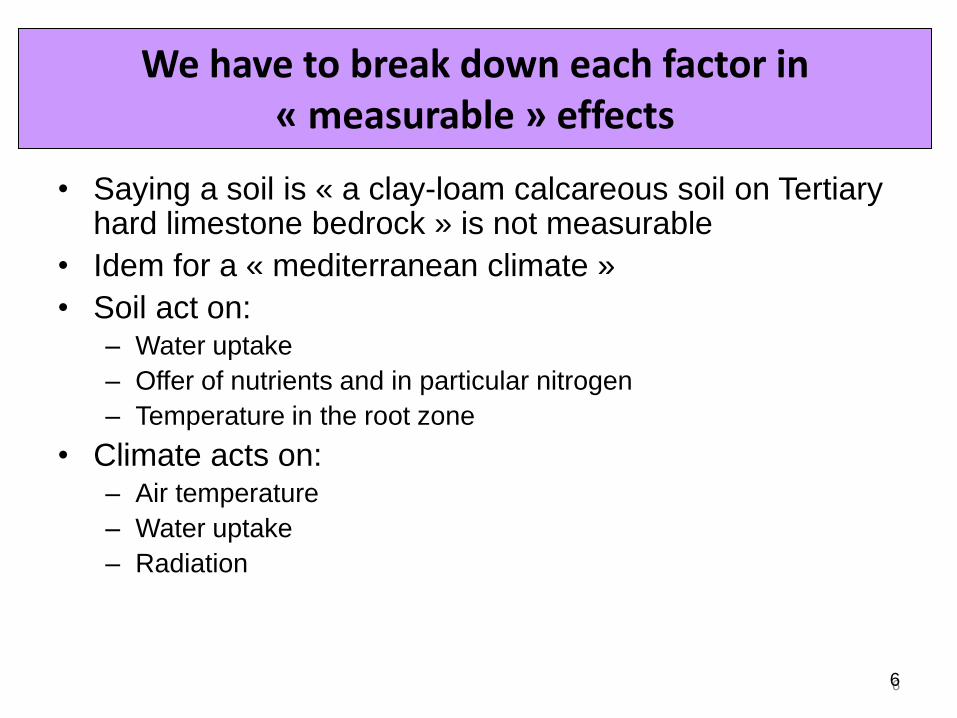
• Saying a soil is « a clay-loam calcareous soil on Tertiary hard limestone bedrock » is not measurable
• Idem for a « mediterranean climate »
• Soil act on: – Water uptake
– Offer of nutrients and in particular nitrogen
– Temperature in the root zone
• Climate acts on: – Air temperature
– Water uptake
– Radiation
We have to break down each factor in « measurable » effects
II - Major environmental factors
7
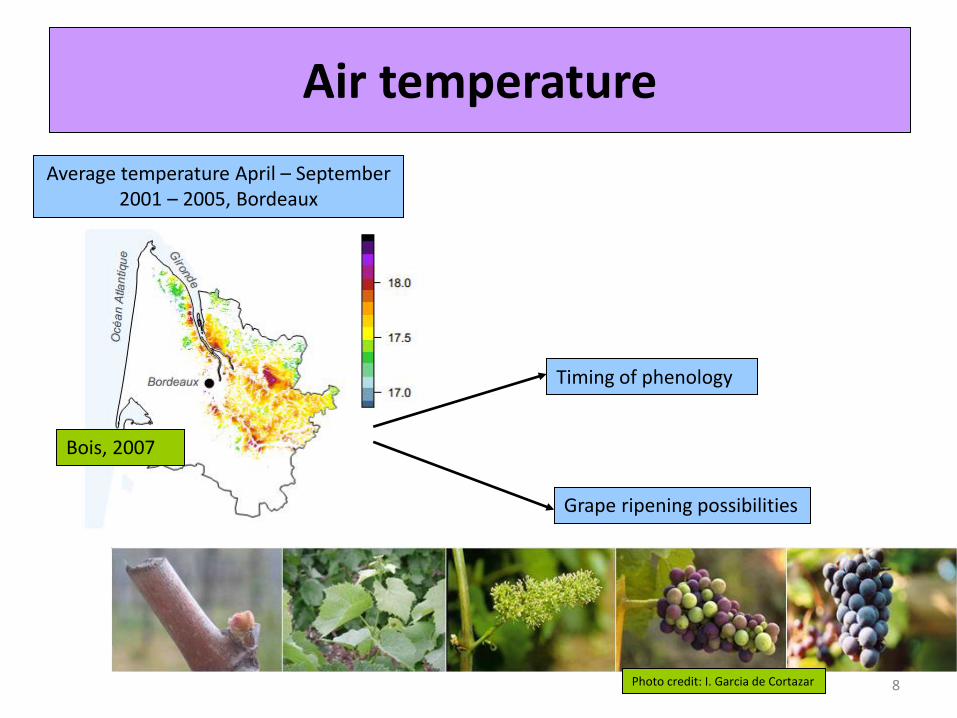
Average temperature April – September 2001 – 2005, Bordeaux
Bois, 2007
Air temperature
Timing of phenology
Grape ripening possibilities
Photo credit: I. Garcia de Cortazar 8
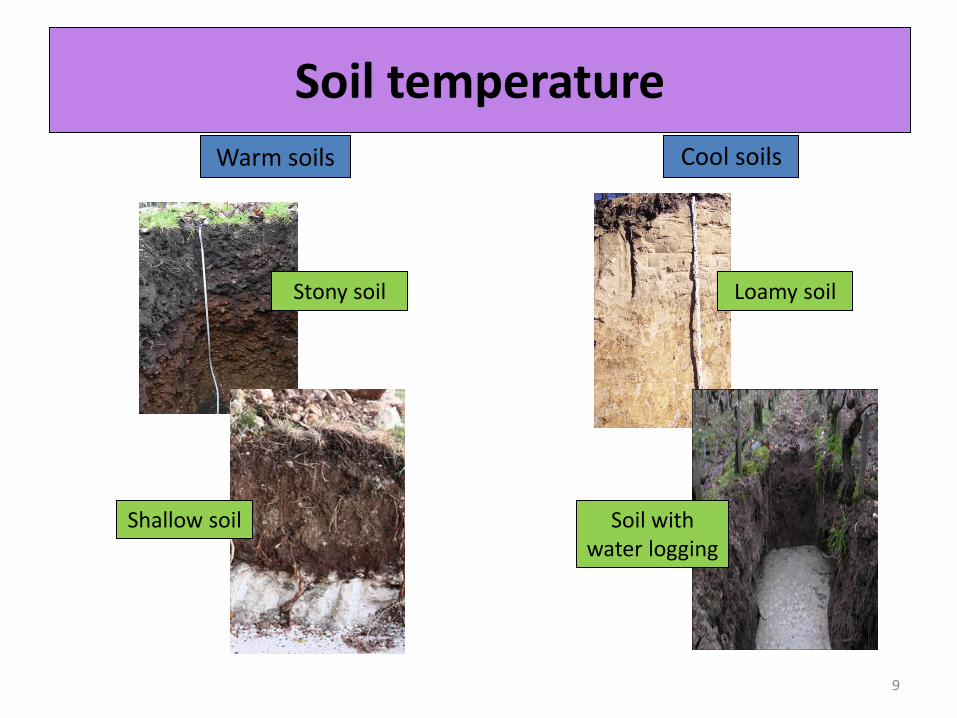
Warm soils Cool soils
Stony soil
Soil with water logging
Shallow soil
Loamy soil
9
Soil temperature
10 10
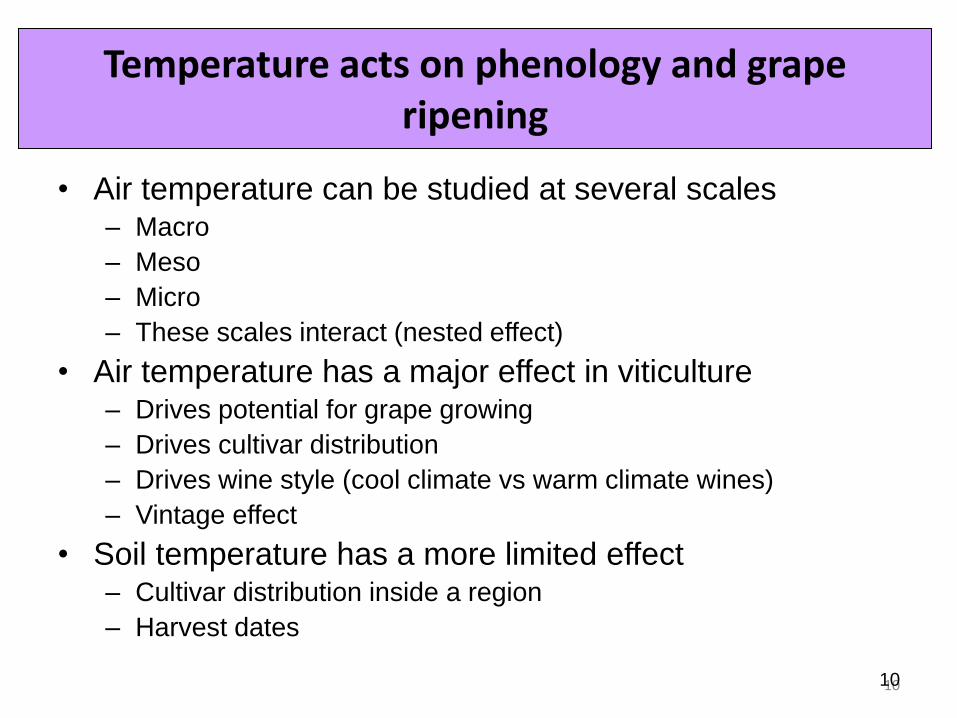
• Air temperature can be studied at several scales – Macro
– Meso
– Micro
– These scales interact (nested effect)
• Air temperature has a major effect in viticulture – Drives potential for grape growing
– Drives cultivar distribution
– Drives wine style (cool climate vs warm climate wines)
– Vintage effect
• Soil temperature has a more limited effect – Cultivar distribution inside a region
– Harvest dates
Temperature acts on phenology and grape ripening
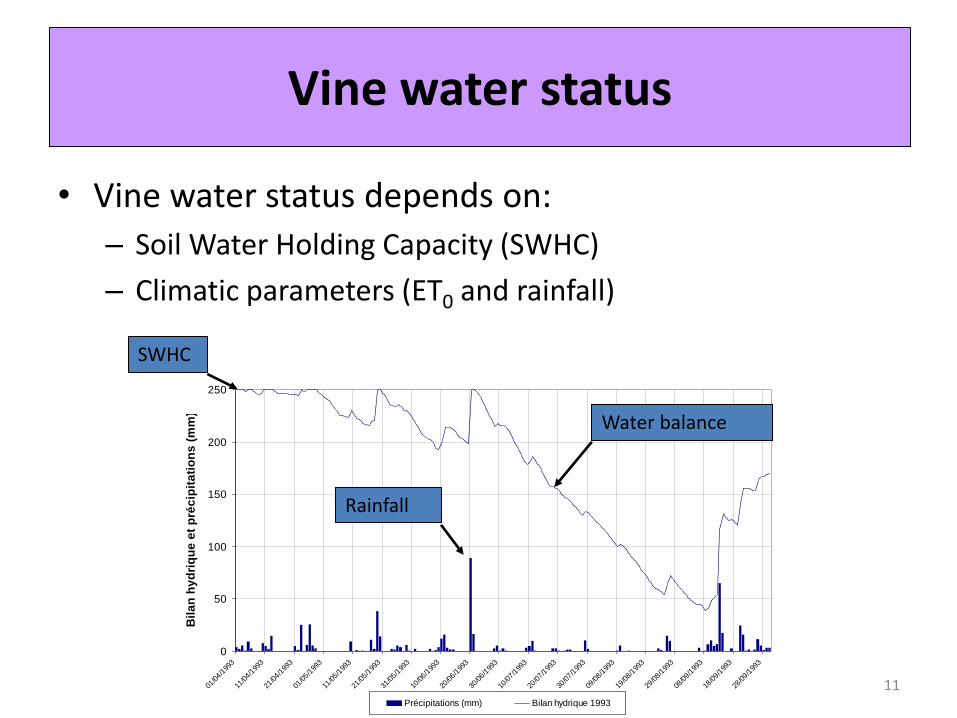
Vine water status
• Vine water status depends on:
– Soil Water Holding Capacity (SWHC)
– Climatic parameters (ET0 and rainfall)
0
50
100
150
200
250
01/04/1
993
11/04/1
993
21/04/1
993
01/05/1
993
11/05/1
993
21/05/1
993
31/05/1
993
10/06/1
993
20/06/1
993
30/06/1
993
10/07/1
993
20/07/1
993
30/07/1
993
09/08/1
993
19/08/1
993
29/08/1
993
08/09/1
993
18/09/1
993
28/09/1
993
Bil
an
hy
dri
qu
e e
t p
réc
ipit
ati
on
s (
mm
)
Précipitations (mm) Bilan hydrique 1993
SWHC
Water balance
Rainfall
11
12
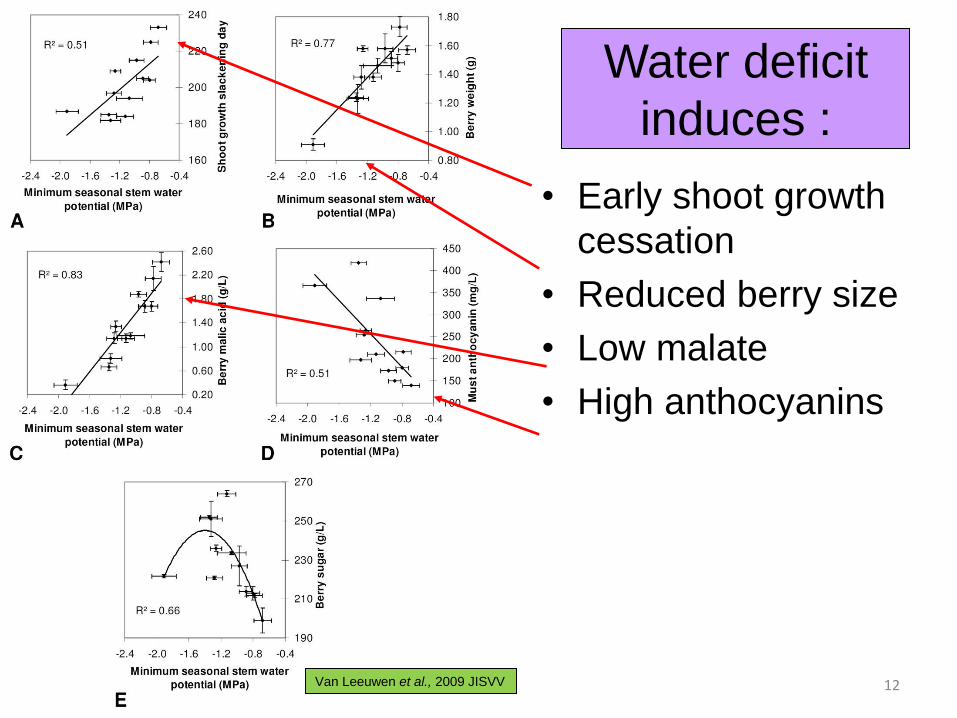
Water deficit
induces :
• Early shoot growth
cessation
• Reduced berry size
• Low malate
• High anthocyanins
Van Leeuwen et al., 2009 JISVV
13
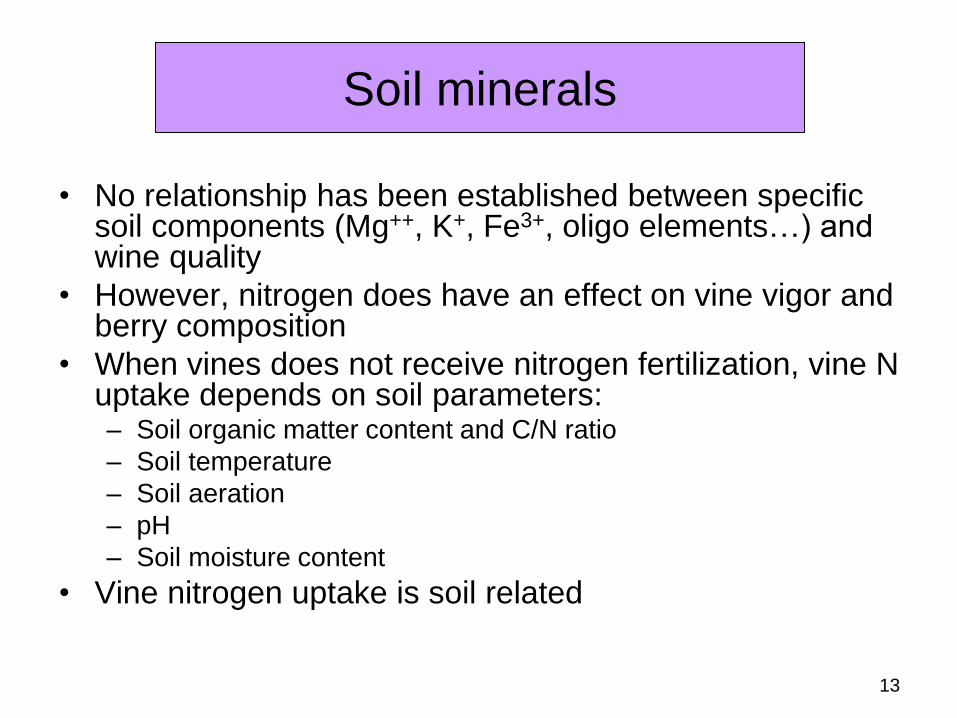
• No relationship has been established between specific soil components (Mg++, K+, Fe3+, oligo elements…) and wine quality
• However, nitrogen does have an effect on vine vigor and berry composition
• When vines does not receive nitrogen fertilization, vine N uptake depends on soil parameters: – Soil organic matter content and C/N ratio
– Soil temperature
– Soil aeration
– pH
– Soil moisture content
• Vine nitrogen uptake is soil related
Soil minerals
14
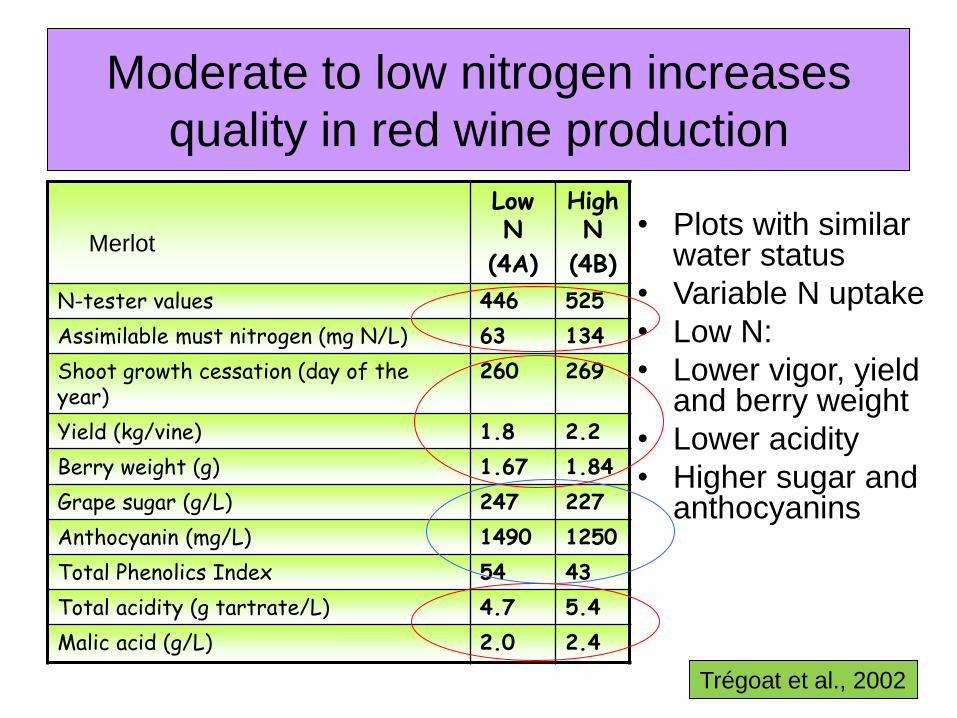
Moderate to low nitrogen increases
quality in red wine production
• Plots with similar water status
• Variable N uptake
• Low N:
• Lower vigor, yield and berry weight
• Lower acidity
• Higher sugar and anthocyanins
Trégoat et al., 2002
Low N
(4A)
High N
(4B)
N-tester values 446 525
Assimilable must nitrogen (mg N/L) 63 134
Shoot growth cessation (day of the year)
260 269
Yield (kg/vine) 1.8 2.2
Berry weight (g) 1.67 1.84
Grape sugar (g/L) 247 227
Anthocyanin (mg/L) 1490 1250
Total Phenolics Index 54 43
Total acidity (g tartrate/L) 4.7 5.4
Malic acid (g/L) 2.0 2.4
Merlot
15
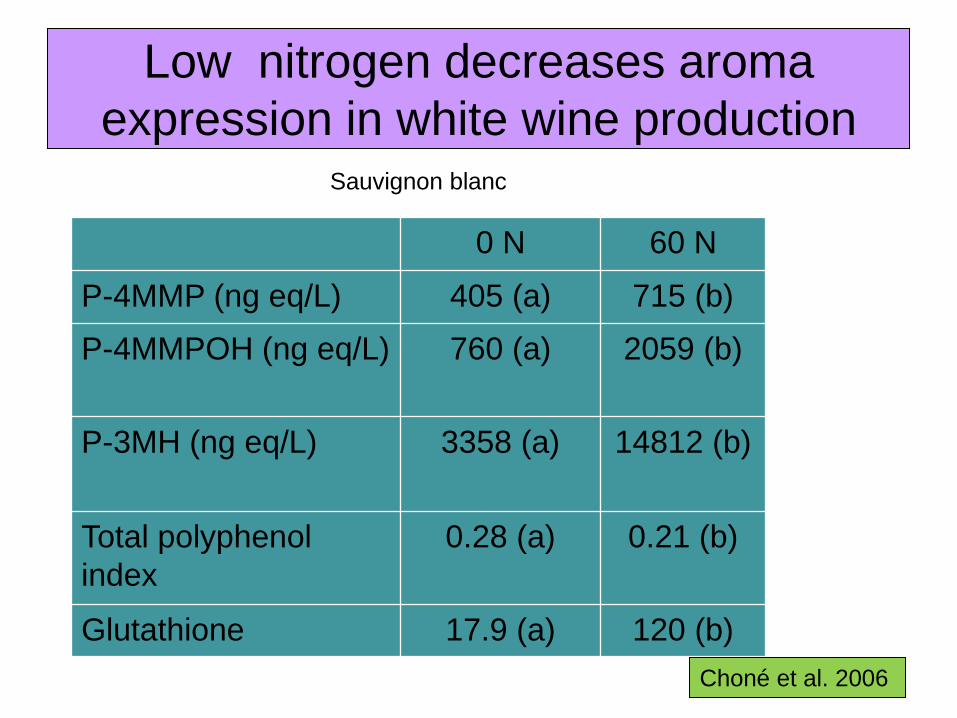
Low nitrogen decreases aroma
expression in white wine production
0 N 60 N
P-4MMP (ng eq/L) 405 (a) 715 (b)
P-4MMPOH (ng eq/L) 760 (a) 2059 (b)
P-3MH (ng eq/L) 3358 (a) 14812 (b)
Total polyphenol
index
0.28 (a) 0.21 (b)
Glutathione 17.9 (a) 120 (b)
Choné et al. 2006
Sauvignon blanc
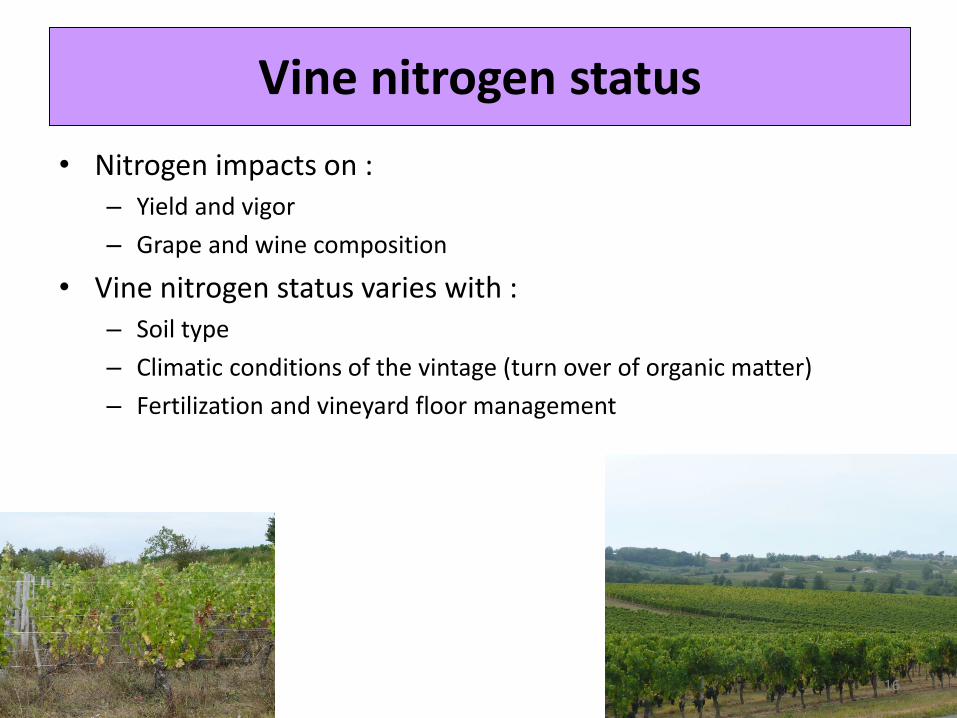
Vine nitrogen status
• Nitrogen impacts on : – Yield and vigor
– Grape and wine composition
• Vine nitrogen status varies with : – Soil type
– Climatic conditions of the vintage (turn over of organic matter)
– Fertilization and vineyard floor management
16
III – Measurement of terroir parameters
17
Soil mapping
18
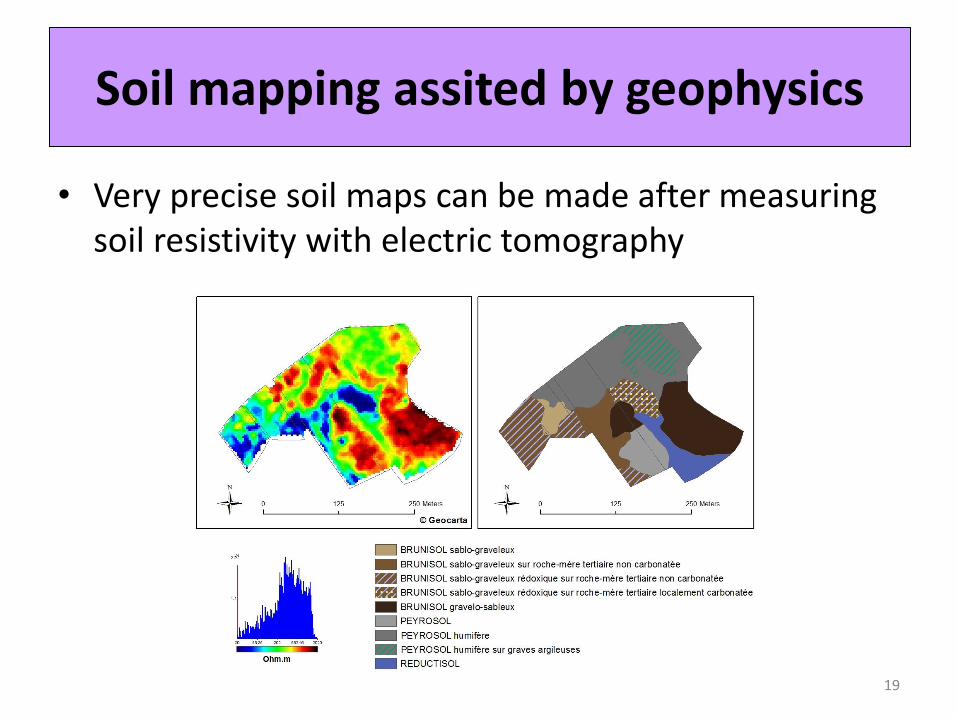
Soil mapping assited by geophysics
• Very precise soil maps can be made after measuring soil resistivity with electric tomography
19
Climate
20
21
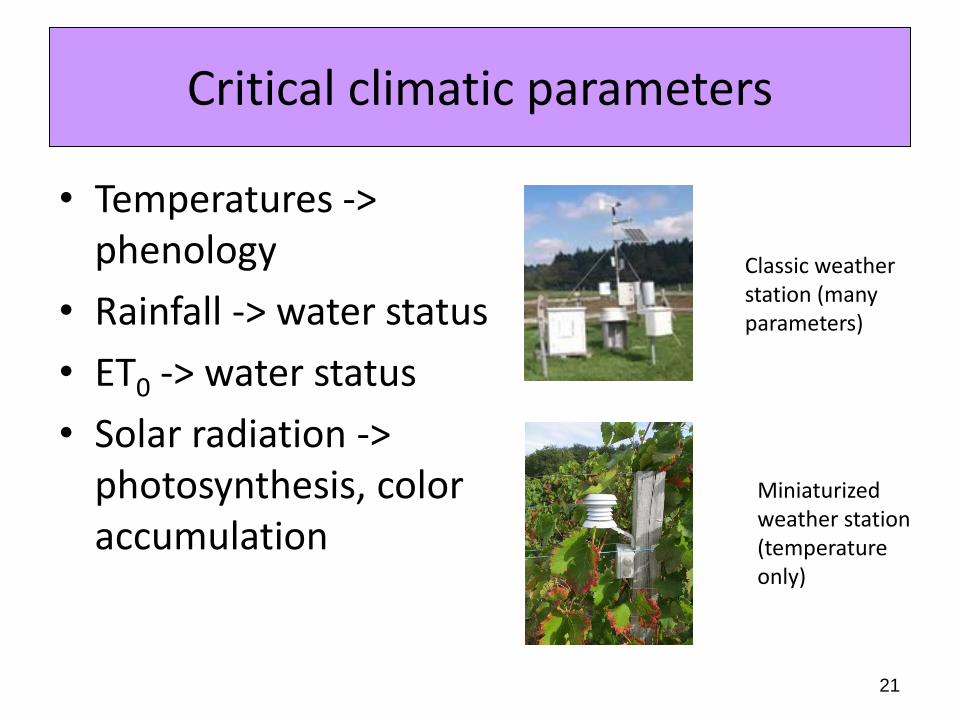
Critical climatic parameters
• Temperatures -> phenology
• Rainfall -> water status
• ET0 -> water status
• Solar radiation -> photosynthesis, color accumulation
Classic weather station (many parameters)
Miniaturized weather station (temperature only)
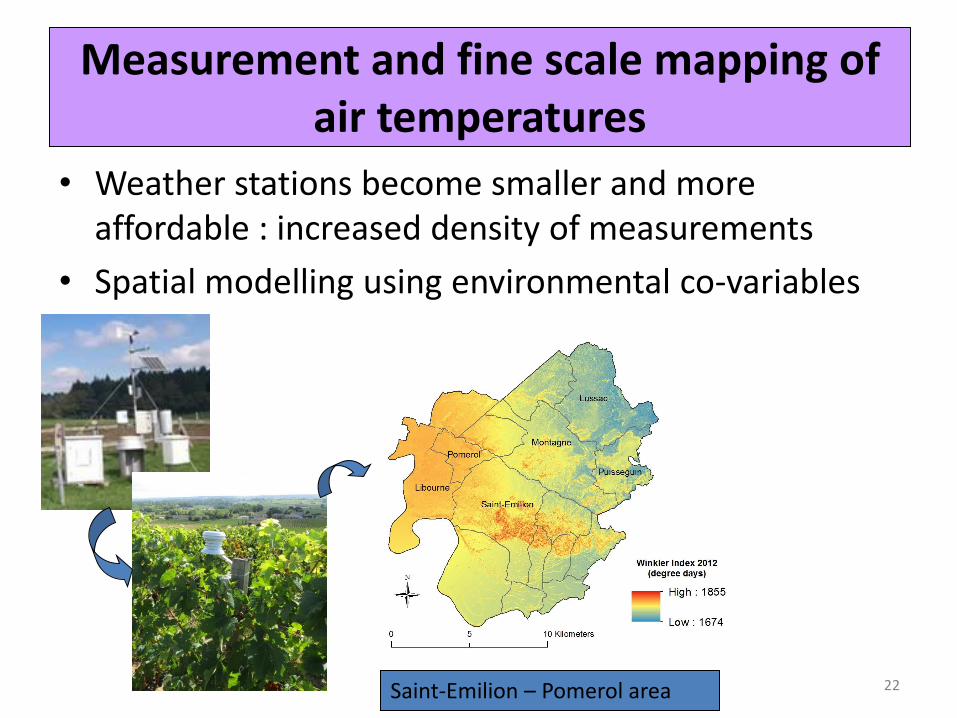
Measurement and fine scale mapping of air temperatures
• Weather stations become smaller and more affordable : increased density of measurements
• Spatial modelling using environmental co-variables
Saint-Emilion – Pomerol area 22
Phenology
23
Measure phenology
• Timing of phenology depends on temperature and grapevine variety
• Timing of phenology is a key factor in terroir expression
• Precise assessment of phenological stages is important
• « 50% » date: bud break, flowering, veraison
• This knowledge helps to orientate variety choices
24
25
Predicting phenology
• Vine phenology is temperature driven
• Phenology can be predicted with process-based models, using temperature as input data
• Examples: Winkler, Huglin
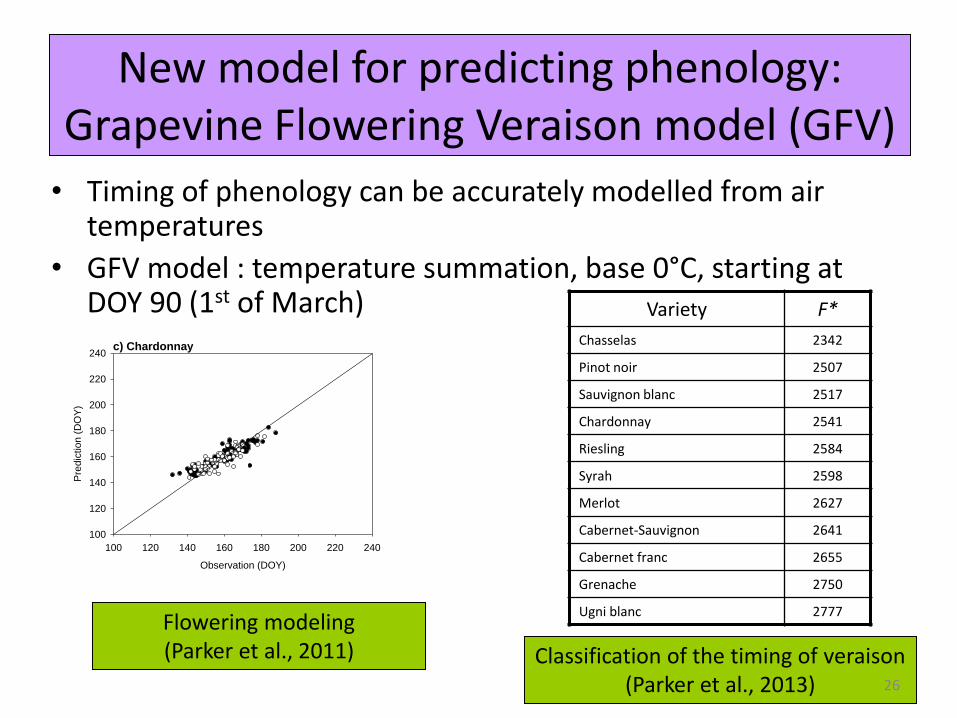
New model for predicting phenology: Grapevine Flowering Veraison model (GFV)
• Timing of phenology can be accurately modelled from air temperatures
• GFV model : temperature summation, base 0°C, starting at DOY 90 (1st of March)
c) Chardonnay
Observation (DOY)
100 120 140 160 180 200 220 240
Pre
dic
tion (
DO
Y)
100
120
140
160
180
200
220
240
Flowering modeling (Parker et al., 2011) Classification of the timing of veraison
(Parker et al., 2013) 26
Variety F*
Chasselas 2342
Pinot noir 2507
Sauvignon blanc 2517
Chardonnay 2541
Riesling 2584
Syrah 2598
Merlot 2627
Cabernet-Sauvignon 2641
Cabernet franc 2655
Grenache 2750
Ugni blanc 2777
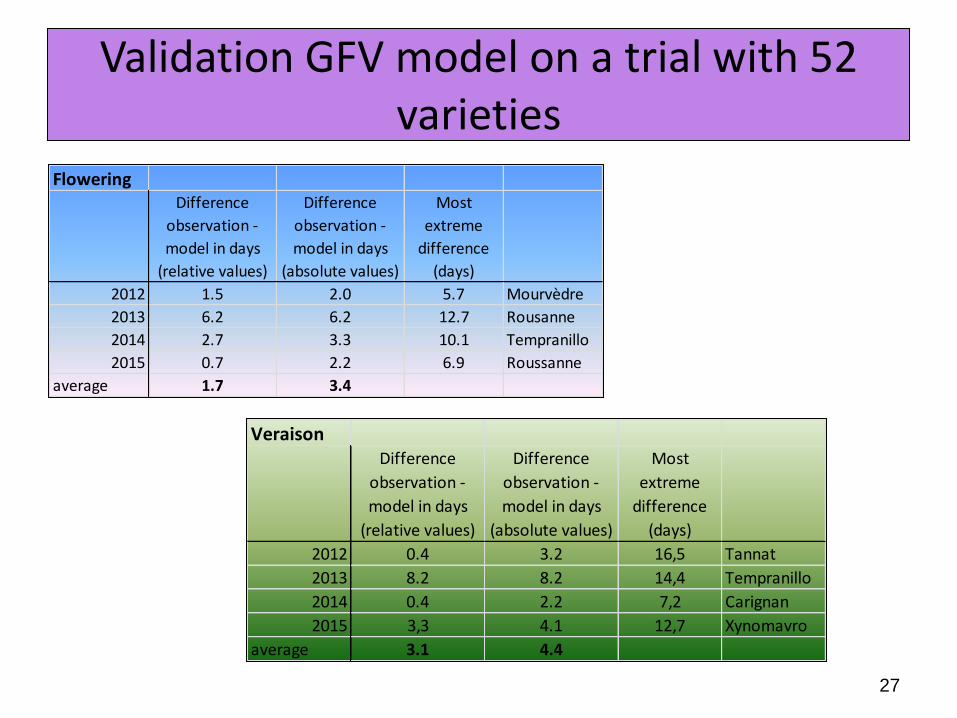
Validation GFV model on a trial with 52 varieties
27
FloweringDifference
observation -
model in days
(relative values)
Difference
observation -
model in days
(absolute values)
Most
extreme
difference
(days)
2012 1.5 2.0 5.7 Mourvèdre
2013 6.2 6.2 12.7 Rousanne
2014 2.7 3.3 10.1 Tempranillo
2015 0.7 2.2 6.9 Roussanne
average 1.7 3.4
VeraisonDifference
observation -
model in days
(relative values)
Difference
observation -
model in days
(absolute values)
Most
extreme
difference
(days)
2012 0.4 3.2 16,5 Tannat
2013 8.2 8.2 14,4 Tempranillo
2014 0.4 2.2 7,2 Carignan
2015 3,3 4.1 12,7 Xynomavro
average 3.1 4.4
Water
28
29
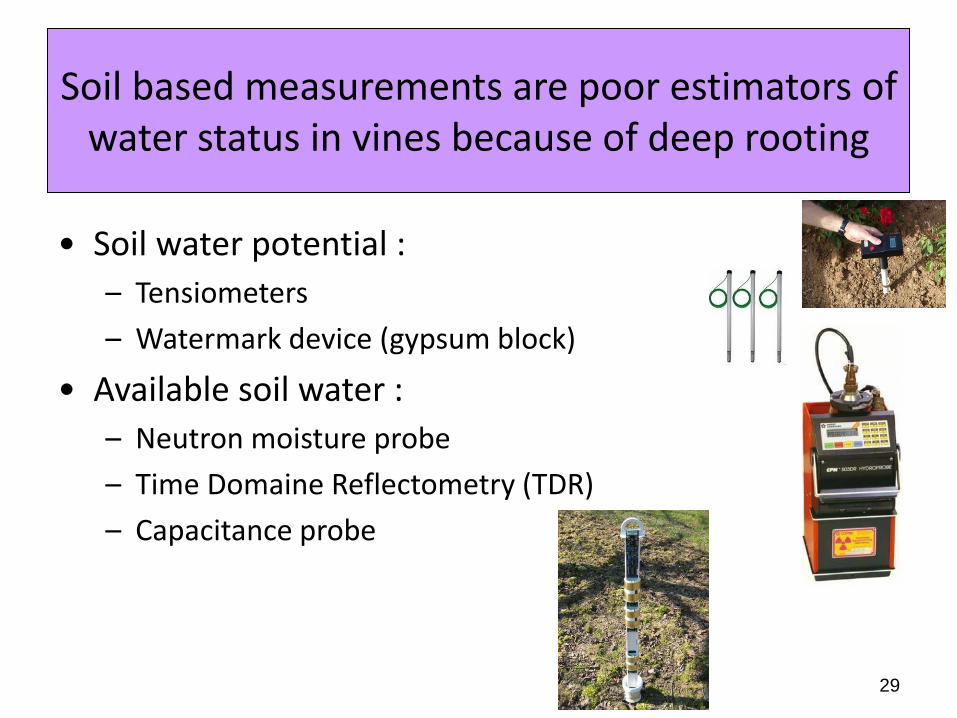
Soil based measurements are poor estimators of water status in vines because of deep rooting
• Soil water potential :
– Tensiometers
– Watermark device (gypsum block)
• Available soil water :
– Neutron moisture probe
– Time Domaine Reflectometry (TDR)
– Capacitance probe
30
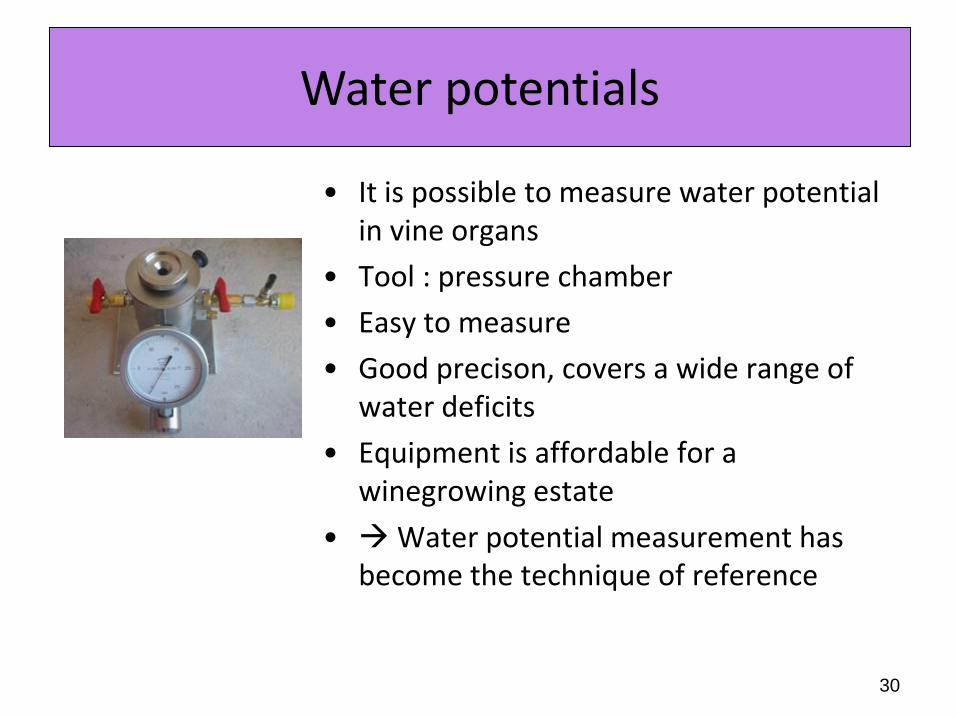
Water potentials
• It is possible to measure water potential in vine organs
• Tool : pressure chamber
• Easy to measure
• Good precison, covers a wide range of water deficits
• Equipment is affordable for a winegrowing estate
• Water potential measurement has become the technique of reference
31
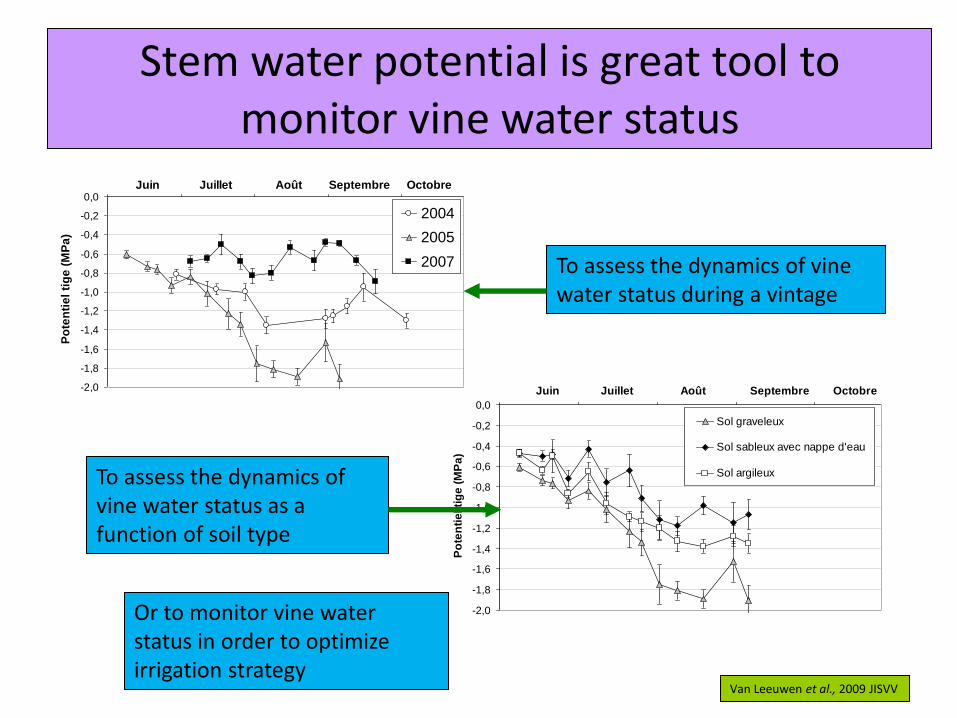
Stem water potential is great tool to monitor vine water status
-2,0
-1,8
-1,6
-1,4
-1,2
-1,0
-0,8
-0,6
-0,4
-0,2
0,0Juin Juillet Août Septembre Octobre
Po
ten
tie
l ti
ge
(M
Pa
)
2004
2005
2007
-2,0
-1,8
-1,6
-1,4
-1,2
-1,0
-0,8
-0,6
-0,4
-0,2
0,0
Juin Juillet Août Septembre Octobre
Po
ten
tie
l ti
ge
(M
Pa
)
Sol graveleux
Sol sableux avec nappe d'eau
Sol argileux
To assess the dynamics of vine water status during a vintage
To assess the dynamics of vine water status as a function of soil type
Van Leeuwen et al., 2009 JISVV
Or to monitor vine water status in order to optimize irrigation strategy
32
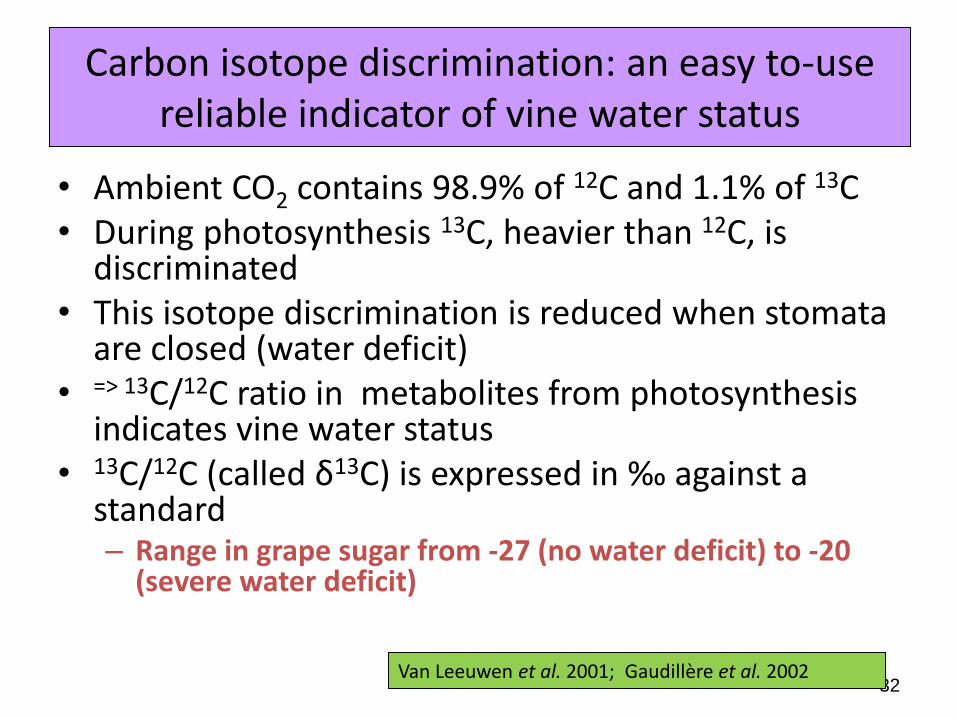
Carbon isotope discrimination: an easy to-use reliable indicator of vine water status
• Ambient CO2 contains 98.9% of 12C and 1.1% of 13C • During photosynthesis 13C, heavier than 12C, is
discriminated • This isotope discrimination is reduced when stomata
are closed (water deficit) • => 13C/12C ratio in metabolites from photosynthesis
indicates vine water status • 13C/12C (called δ13C) is expressed in ‰ against a
standard – Range in grape sugar from -27 (no water deficit) to -20
(severe water deficit)
Van Leeuwen et al. 2001; Gaudillère et al. 2002
33
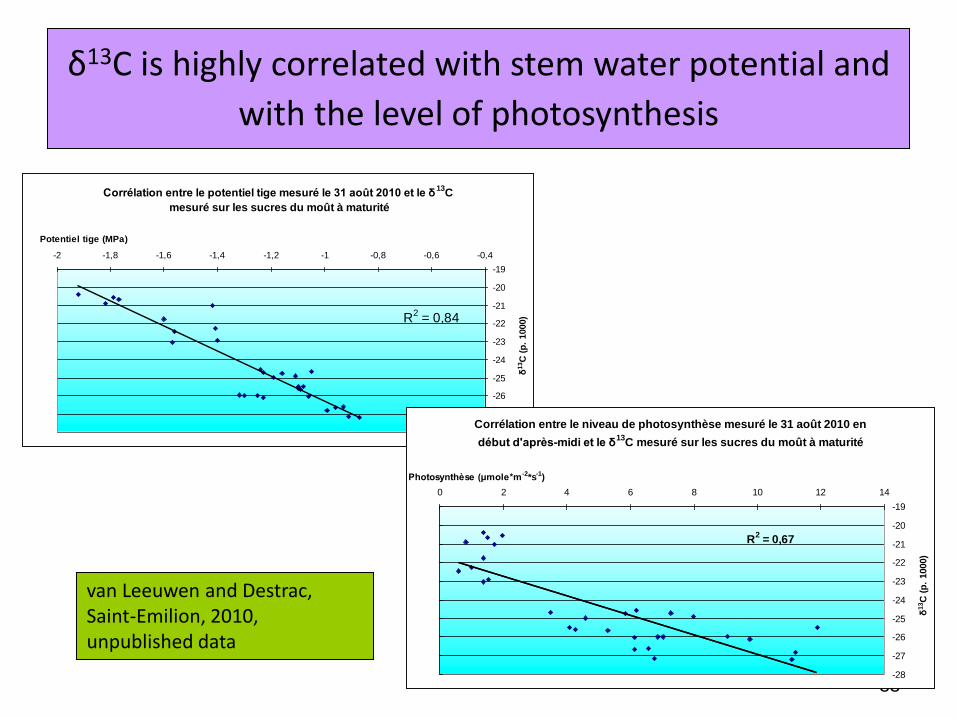
δ13C is highly correlated with stem water potential and
with the level of photosynthesis
Corrélation entre le potentiel tige mesuré le 31 août 2010 et le δ13
C
mesuré sur les sucres du moût à maturité
R2 = 0,84
-28
-27
-26
-25
-24
-23
-22
-21
-20
-19
-2 -1,8 -1,6 -1,4 -1,2 -1 -0,8 -0,6 -0,4
Potentiel tige (MPa)
δ13C
(p
. 1000)
Corrélation entre le niveau de photosynthèse mesuré le 31 août 2010 en
début d'après-midi et le δ13
C mesuré sur les sucres du moût à maturité
R2 = 0,67
-28
-27
-26
-25
-24
-23
-22
-21
-20
-19
0 2 4 6 8 10 12 14
Photosynthèse (μmole*m-2*s-1)
δ13C
(p
. 1000)
van Leeuwen and Destrac, Saint-Emilion, 2010, unpublished data
34
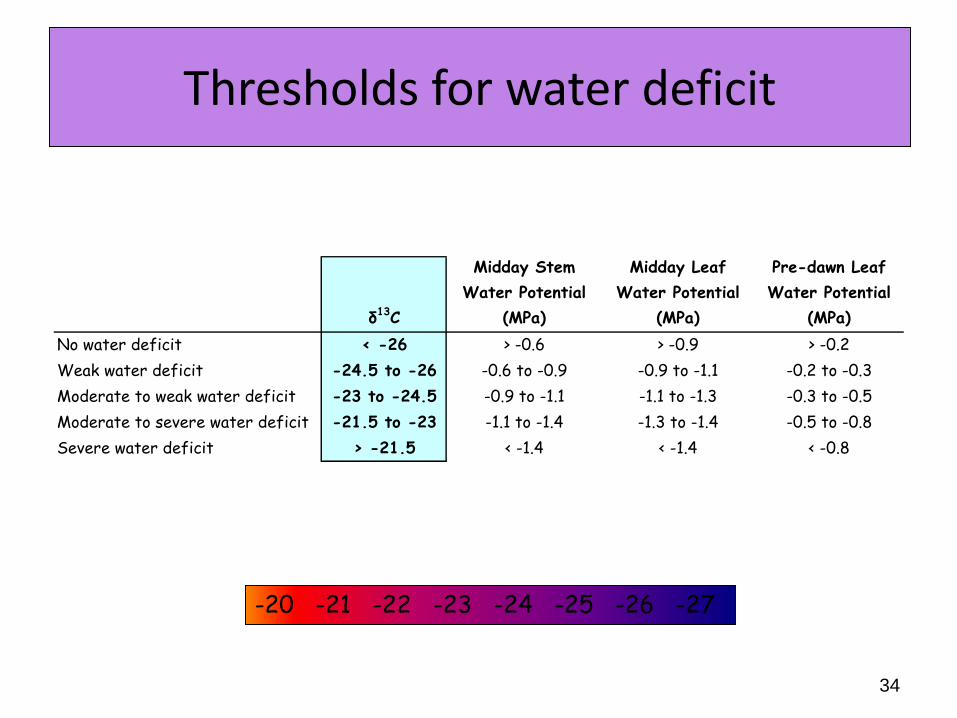
Thresholds for water deficit
δ13C
Midday Stem
Water Potential
(MPa)
Midday Leaf
Water Potential
(MPa)
Pre-dawn Leaf
Water Potential
(MPa)
No water deficit < -26 > -0.6 > -0.9 > -0.2
Weak water deficit -24.5 to -26 -0.6 to -0.9 -0.9 to -1.1 -0.2 to -0.3
Moderate to weak water deficit -23 to -24.5 -0.9 to -1.1 -1.1 to -1.3 -0.3 to -0.5
Moderate to severe water deficit -21.5 to -23 -1.1 to -1.4 -1.3 to -1.4 -0.5 to -0.8
Severe water deficit > -21.5 < -1.4 < -1.4 < -0.8
-20 -21 -22 -23 -24 -25 -26 -27
35
Advantage of the δ13C technique
• Easy to measure (specialized labs)
• Integrated measurement of vine water status during the fruit ripening period
• Many plots can be sampled
• Validation of irrigation strategies
• Not for day to day irrigation management
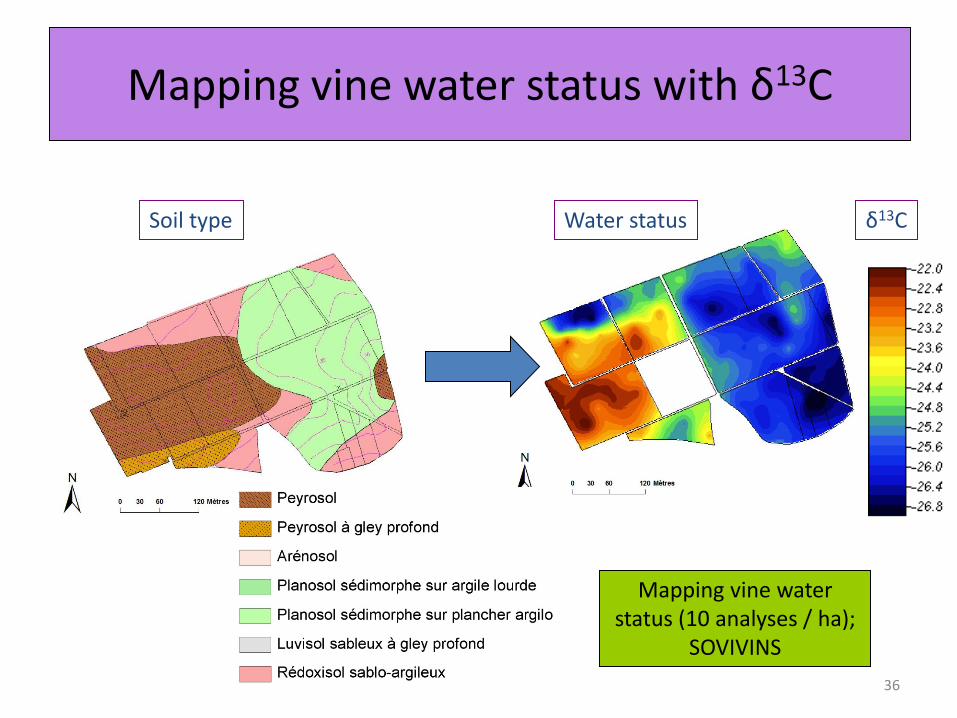
Mapping vine water status with δ13C
Water status Soil type δ13C
Mapping vine water status (10 analyses / ha);
SOVIVINS
36
Nitrogen
37
38
Assessment of nitrogen status is easy with plant based indicators
• Leaf blade N
• Petiole N
• Grape juice Yeast Available Nitrogen (YAN)
• Leaf blade color (SPAD)
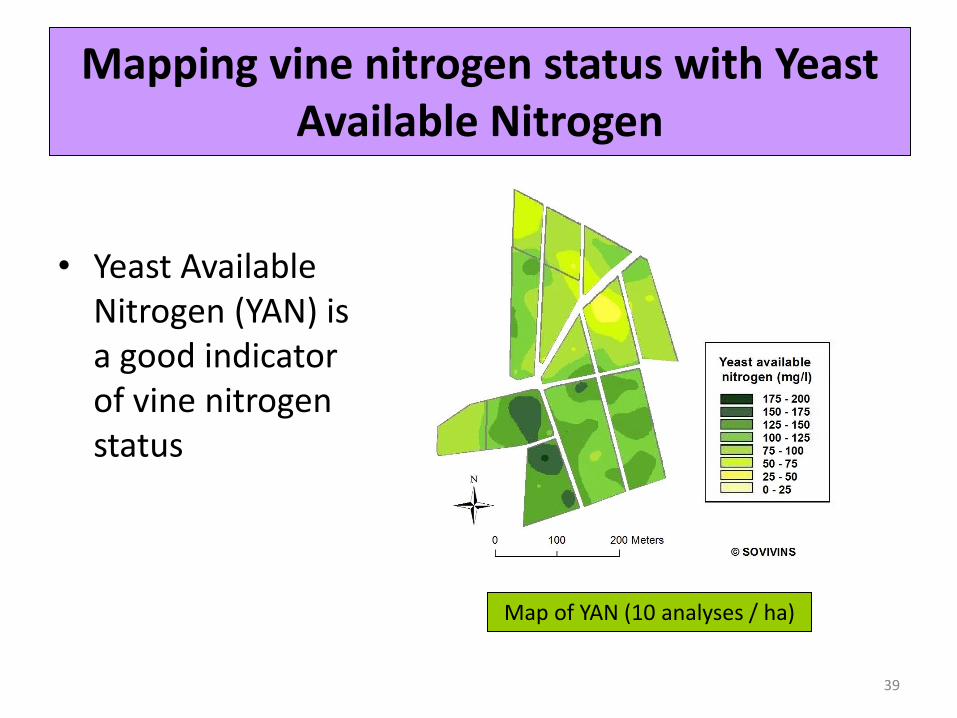
Mapping vine nitrogen status with Yeast Available Nitrogen
• Yeast Available Nitrogen (YAN) is a good indicator of vine nitrogen status
Map of YAN (10 analyses / ha)
39
Brief summary
• Several factors are involved in terroir expression:
• Climate : temperature, impact on water status (ET0 and rainfall)
• Soil : soil temperature, impact on vine water status and impact on vine nutrient status (in particular N)
• These factors interact with plant material (variety and root stock), training system and vineyard floor management
• These factors can be measured at fine resolution
• How can terroir be managed at the block level to maximize yield and quality?
40
III – Managing terroir
41
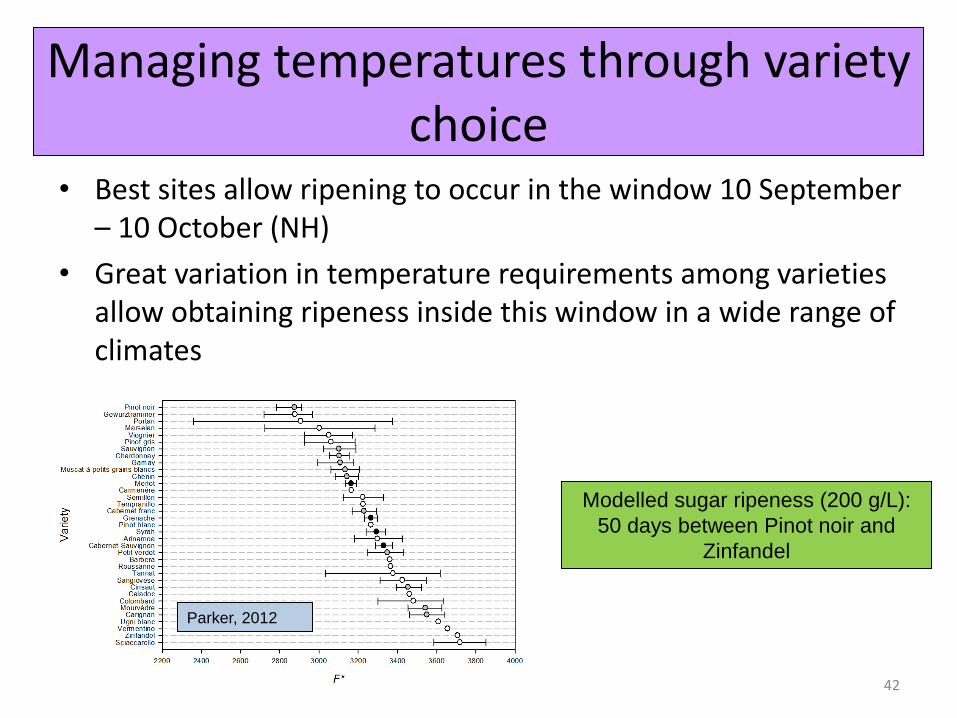
• Best sites allow ripening to occur in the window 10 September – 10 October (NH)
• Great variation in temperature requirements among varieties allow obtaining ripeness inside this window in a wide range of climates
Managing temperatures through variety choice
42
Parker, 2012
Modelled sugar ripeness (200 g/L):
50 days between Pinot noir and
Zinfandel
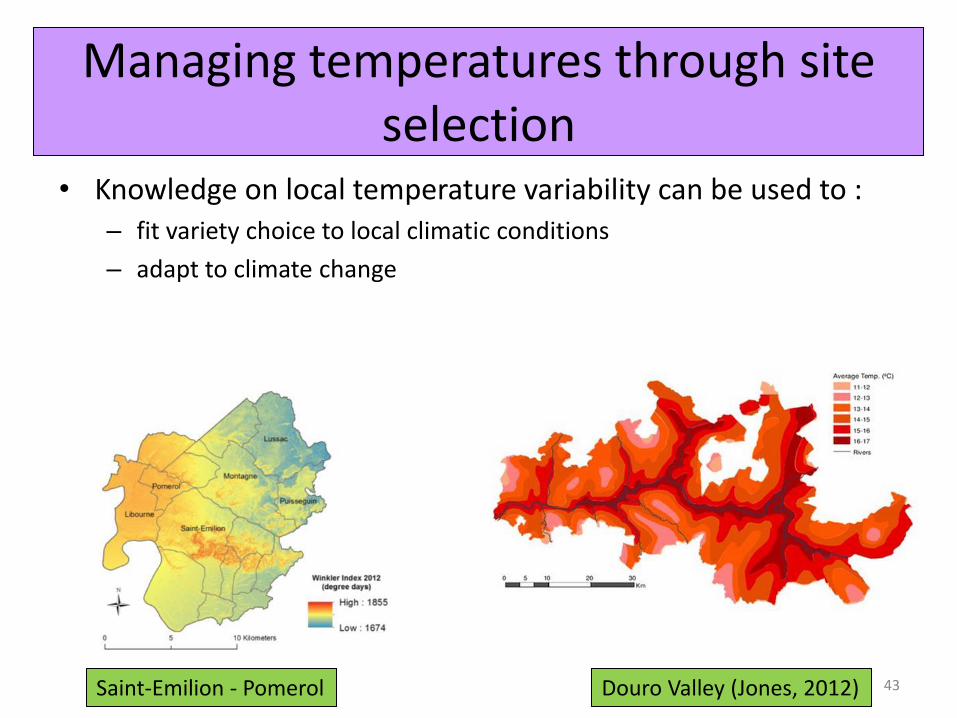
• Knowledge on local temperature variability can be used to : – fit variety choice to local climatic conditions
– adapt to climate change
Managing temperatures through site selection
43 Saint-Emilion - Pomerol Douro Valley (Jones, 2012)
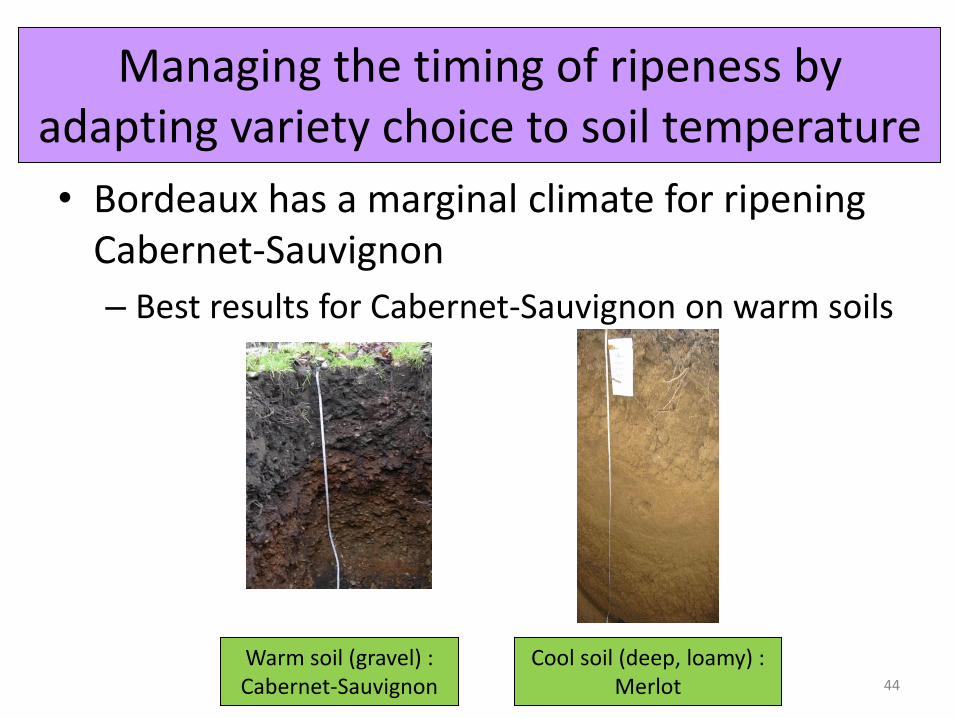
Managing the timing of ripeness by adapting variety choice to soil temperature
• Bordeaux has a marginal climate for ripening Cabernet-Sauvignon
– Best results for Cabernet-Sauvignon on warm soils
Warm soil (gravel) : Cabernet-Sauvignon 44
Cool soil (deep, loamy) : Merlot
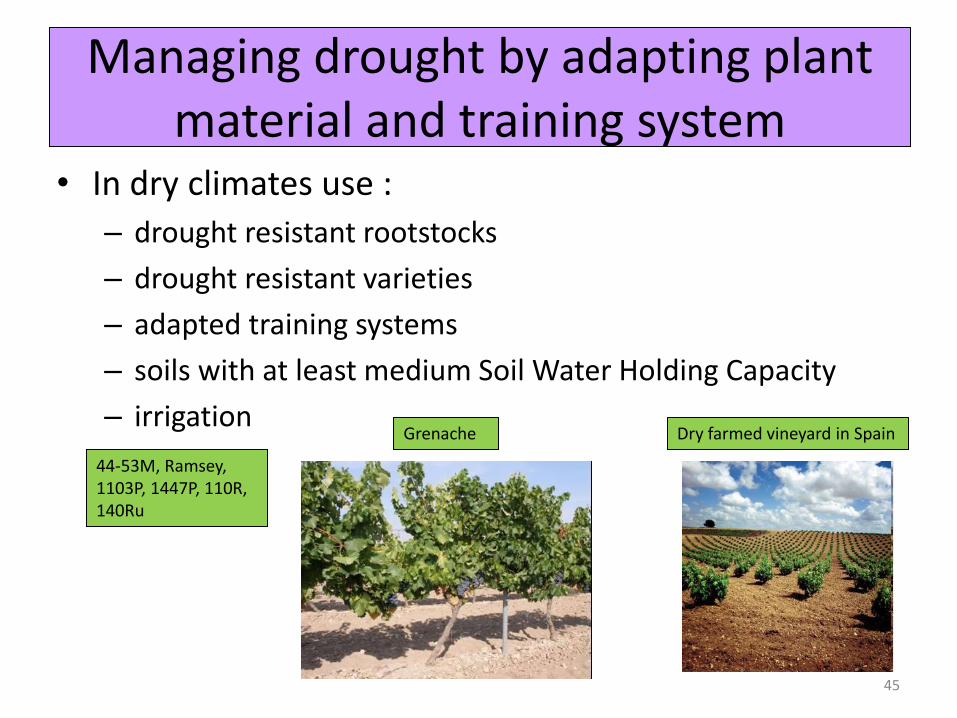
Managing drought by adapting plant material and training system
• In dry climates use :
– drought resistant rootstocks
– drought resistant varieties
– adapted training systems
– soils with at least medium Soil Water Holding Capacity
– irrigation
45
44-53M, Ramsey, 1103P, 1447P, 110R, 140Ru
Grenache Dry farmed vineyard in Spain
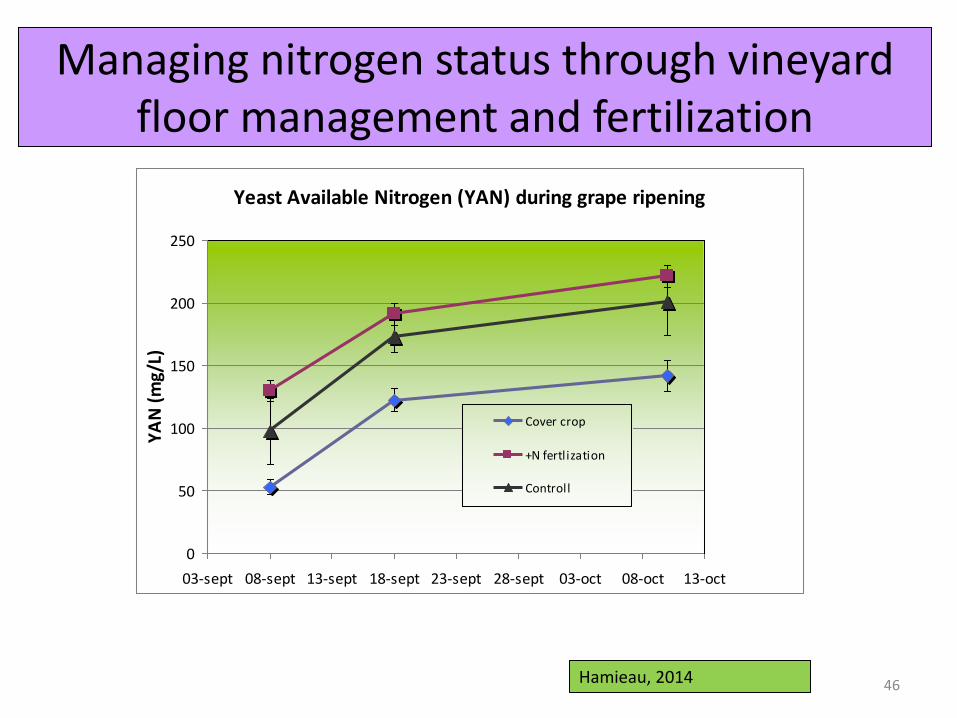
Managing nitrogen status through vineyard floor management and fertilization
46
Yeast Available Nitrogen (YAN) during grape ripening
0
50
100
150
200
250
03-sept 08-sept 13-sept 18-sept 23-sept 28-sept 03-oct 08-oct 13-oct
YA
N (
mg/
L)
Cover crop
+N fertlization
Controll
Hamieau, 2014
Conclusion
• Terroir is all about interactions between the vine and its local environment
• Impact of environmental factors (soil, climate) should be broken down in measurable factors (water, temperature, light) to be understood
• Some terroir factors matter more than others
• Tools have been developped to measure and map major terroir factors
• This knowledge should be used to manage terroir through – Plant material
– Management strategies
• This allows to maximizing terroir expression in a given site
47
Continuing education at Bordeaux Sciences Agro
48
49
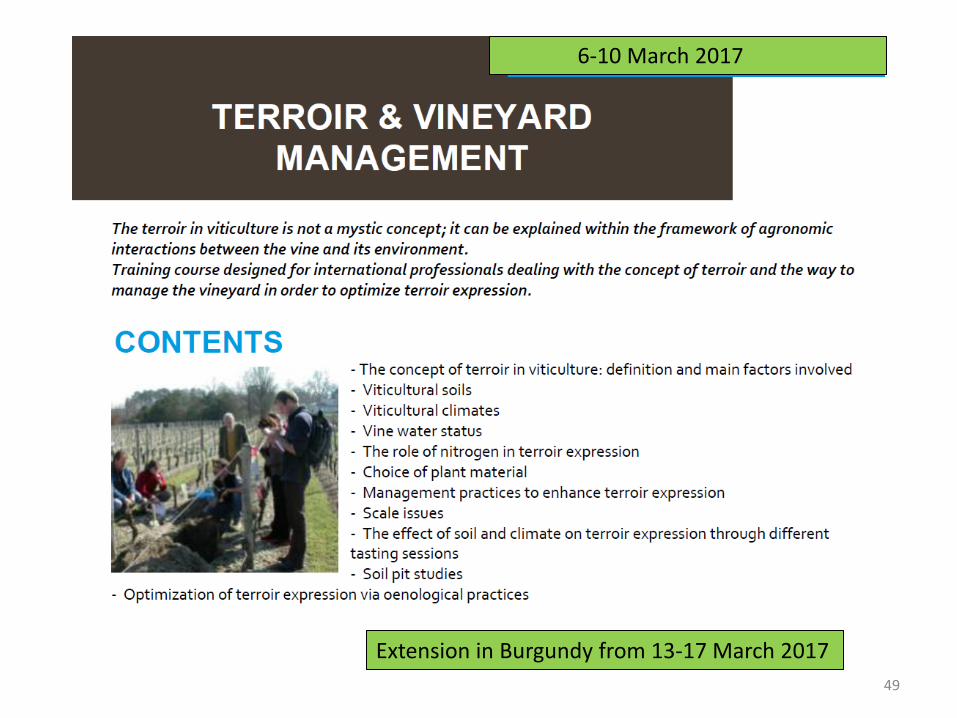
Extension in Burgundy from 13-17 March 2017
6-10 March 2017