2017 Microsoft Hosting and Cloud study. By 451 Research.
127
Hosting and Cloud Study 2017 Digital Transformation Opportunity for Service Providers: Beyond Infrastructure Survey Data Summary Report
-
Upload
hameed-mohammed -
Category
Technology
-
view
403 -
download
0
Transcript of 2017 Microsoft Hosting and Cloud study. By 451 Research.

Hosting and Cloud Study 2017Digital Transformation Opportunity for Service Providers: Beyond Infrastructure
Survey Data Summary Report

Study OverviewGrand Strategy for Digital Transformation: Partner for Success, is a study Microsoft commissioned through 451 Research. The study is designed to better understand how companies, SMBs, Enterprises etc. are transforming digitally and identify market opportunities for Microsoft’s infrastructure service provider partners to help their customers as they progress along their digital transformation journey. Over 1,700 respondents across 10 geographies participated in this survey study that was fielded between January 30, 2017 to February 22, 2017.
Key findings showed:
The Era of Managed Infrastructure Services: Managed is the New Normal – 62% of Cloud/Hosting Infrastructure Spending Comes Bundled with Value-Added Services
The Next “Beyond Infrastructure” Opportunity: Professional Services for Cloud-Enablement represent 18% of total hosting/cloud spending and 25% of the “Beyond Infrastructure” Opportunity – But Hurry…The Window is Closing Fast!
The Multi-Cloud World Is Real, Tightly Linked to Digital Transformation. 41% of Organizations Are Already On-Board, Driven by Best Execution Venue Considerations, Maximizing On-Premises IT Investments, and Opex-based IT Resource Extension. However, Implementation and Management Challenges Create Service Provider Opportunity --89% of Organizations Are Willing to Pay A Hefty Premium For Assistance
2

Study Overview (Cont.)Key findings showed: (Cont.)
A Majority of Businesses Are Now On-Board the Digital Economy Express, But Skills, Expertise, and Partners Are Lacking, Resulting in A Key Role for Service Providers in Future Digital Transformation Projects • 52% of organizations are on-board with the digital revolution as Market Disruptors, Market Makers or Business
Re-inventors (compared to 46% in 2016)
Half of All Organizations Consider Service Providers As Vital For Future Digital Transformation Projects. 60% of These Look to Service Providers for Sourcing, Implementation and Management and Would Be Willing to Pay a 2X Premium for a “One Throat to Choke” Trusted Advisor Solution
3

Geographic Scope

Worldwide Sample Size n=1,738 10 Countries Represented
USA55%
UK8%
Germany7%
India7%
Brazil5%
Netherlands3%
Turkey3%
Japan4%
Singapore3%
Australia5%
5

HOSTING/CLOUD SERVICES SPENDING (H)

Budgets
41%
39%
42%
41%
39%
40%
30%
36%
30%
30%
32%
32%
16%
13%
16%
16%
17%
16%
13%
12%
12%
14%
12%
12%
MEA (n=47)
LA (n=95)
APAC (n=316)
WE (n=330)
NA (n=950)
Total (n=1738)
0% 10% 20% 30% 40% 50% 60% 70% 80% 90% 100%Average %
2017 IT Budget Allocation by Region
On-PremisesInfrastructure &StaffHosting Services
SaaS
S8b. Using your best guess, approximately what percentage of your total IT budget in 2017 is allocated to: [sum to 100%]
7

Budgets/Spending
8
26%
25%
26%
26%
25%
26%
19%
18%
21%
20%
19%
20%
18%
18%
18%
18%
19%
18%
18%
20%
18%
17%
19%
18%
18%
20%
17%
19%
18%
18%
MEA(n=47)
LA(n=95)
APAC(n=316)
WE(n=330)
NA(n=950)
Total(n=1738)
0% 20% 40% 60% 80% 100%Average %
2017 Hosting/Cloud Services Budget Allocation by Region
InfrastructureHostingApplicationHostingManagedServicesSecurityServicesProfessionalServices
28%
29%
26%
27%
26%
27%
22%
19%
22%
21%
20%
21%
18%
16%
18%
17%
19%
18%
18%
20%
19%
18%
19%
19%
15%
16%
15%
17%
16%
16%
MEA(n=47)
LA (n=95)
APAC(n=316)
WE(n=330)
NA(n=950)
Total(n=1738)
0% 20% 40% 60% 80% 100%Average %
2019 Hosting/Cloud Services Budget Allocation by Region
InfrastructureHostingApplicationHostingManagedServicesSecurityServicesProfessionalServices
H1. Approximately what percent of your HOSTING & CLOUD SERVICES budget in 2016 is allocated to the following services? [Sum to 100%]H2. Now thinking out two years, approximately what percent of your HOSTING & CLOUD SERVICES budget will be allocated to the following services? [Sum to 100%]

INFRASTRUCTURE HOSTING SERVICES AND HYBRID/MULTI-CLOUD (I)
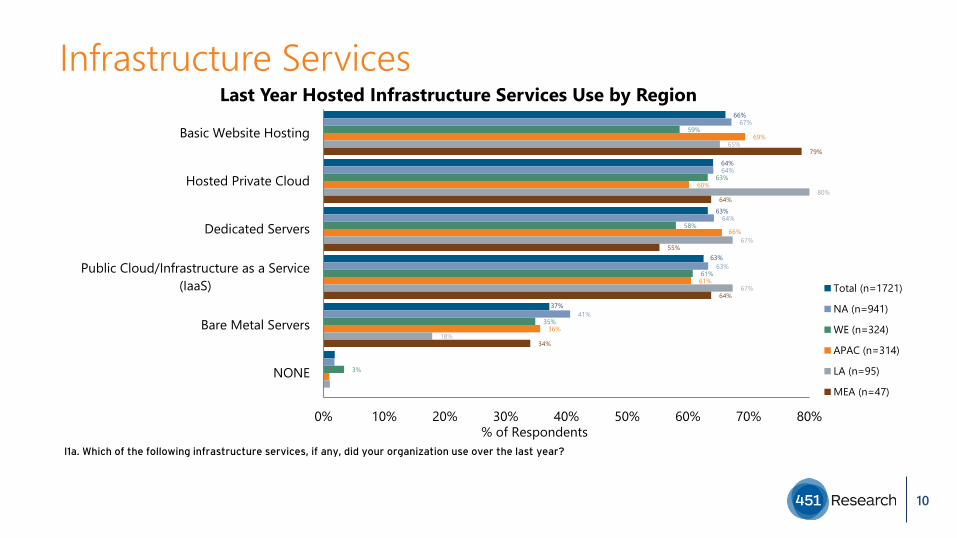
Infrastructure Services66%
64%
63%
63%
37%
67%
64%
64%
63%
41%
59%
63%
58%
61%
35%
3%
69%
60%
66%
61%
36%
65%
80%
67%
67%
18%
79%
64%
55%
64%
34%
0% 10% 20% 30% 40% 50% 60% 70% 80%
Basic Website Hosting
Hosted Private Cloud
Dedicated Servers
Public Cloud/Infrastructure as a Service(IaaS)
Bare Metal Servers
NONE
% of Respondents
Last Year Hosted Infrastructure Services Use by Region
Total (n=1721)
NA (n=941)
WE (n=324)
APAC (n=314)
LA (n=95)
MEA (n=47)
I1a. Which of the following infrastructure services, if any, did your organization use over the last year?
10

Infrastructure Services66%
61%
60%
53%
39%
65%
61%
58%
52%
38%
64%
58%
58%
52%
40%
68%
67%
66%
57%
40%
74%
60%
62%
48%
45%
3%
70%
66%
68%
72%
32%
0% 10% 20% 30% 40% 50% 60% 70% 80%
Hosted Private Cloud
Dedicated Servers
Public Cloud/Infrastructure as a Service(IaaS)
Basic Website Hosting
Bare Metal Servers
NONE
% of Respondents
Coming Year Hosted Infrastructure Services Use by Region
Total (n=1721)
NA (n=941)
WE (n=324)
APAC (n=314)
LA (n=95)
MEA (n=47)
I1b. Which of the following infrastructure services, if any, do you plan to use in the coming year?
11
Infrastructure Services
36%
32%
39%
40%
38%
38%
64%
68%
61%
60%
62%
62%
MEA (n=47)
LA (n=95)
APAC (n=316)
WE (n=330)
NA (n=950)
Total (n=1738)
0% 10% 20% 30% 40% 50% 60% 70% 80% 90% 100%Average %
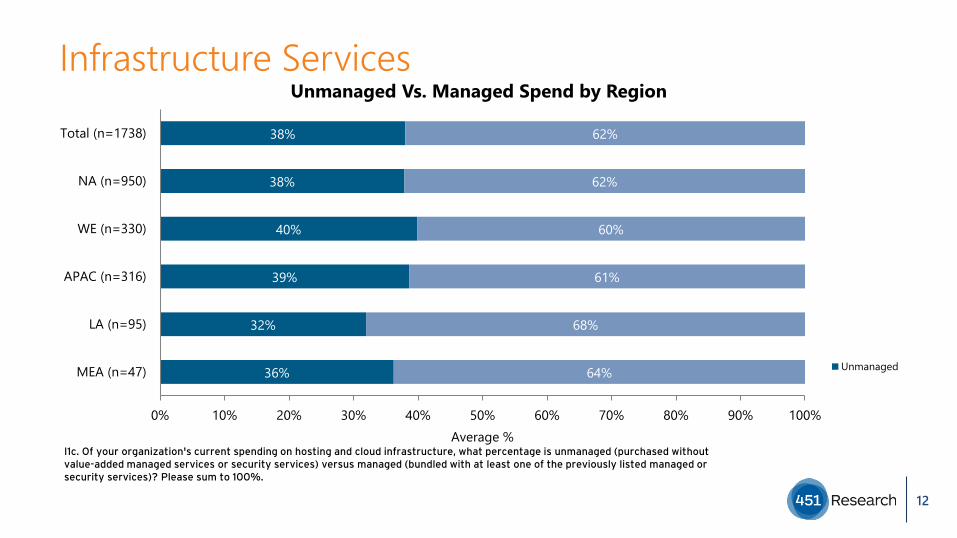
Unmanaged Vs. Managed Spend by Region
Unmanaged
I1c. Of your organization's current spending on hosting and cloud infrastructure, what percentage is unmanaged (purchased without value-added managed services or security services) versus managed (bundled with at least one of the previously listed managed orsecurity services)? Please sum to 100%.
12

Infrastructure Services
48%
43%
47%
47%
45%
46%
52%
57%
53%
53%
55%
54%
MEA (n=47)
LA (n=95)
APAC (n=316)
WE (n=330)
NA (n=950)
Total (n=1738)
0% 10% 20% 30% 40% 50% 60% 70% 80% 90% 100%Average %
Managed Spend by Region
Basicinfrastructure
Managedservices/securityservices
I1d . Thinking about your organization's managed infrastructure spending, what percentage of the spending is allocated to each of the following? Please sum to 100%. [Sum to 100%]
13

Infrastructure Services
16% 14%22% 17%
9%17%
84% 86%78% 83%
91%83%
Total (n=1738) NA (n=950) WE (n=330) APAC (n=316) LA (n=95) MEA (n=47)0%
10%
20%
30%
40%
50%
60%
70%
80%
90%
100%
% o
f Res
pond
ents
Next Engagement by Region
Managed/BundledUnmanaged
I1e. For your organization's next hosting and cloud infrastructure engagement, will the service be unmanaged (purchased without value-added managed services or security services) or managed (bundled with managed or security services)?
14

Infrastructure Services31%
28%
25%
15%
33%
26%
23%
17%
29%
34%
24%
13%
29%
29%
29%
13%
28%
29%
29%
13%
21%
23%
38%
17%
0% 10% 20% 30% 40% 50%
We will focus primarily on a single cloud environment, not multiple clouds
We will have multiple different cloud environments, but there will be little to nointeroperability between the cloud en
We will have multiple cloud environments to migrate workloads or data betweendifferent cloud environments
We will have multiple cloud environments where the delivery of a single businessfunction across the different cloud env
% of Respondents
Cloud Environments Next 2 Years by Region
Total (n=1738)
NA (n=950)
WE (n=330)
APAC (n=316)
LA (n=95)
MEA (n=47)
I2. Which of the following statements best describes how your organization will use different on-premises and off-premises cloudenvironments over the next 2 years?
15

Infrastructure Services
76% 79% 74%67%
78% 77%
19% 16% 19%28%
17% 19%
Total (n=1738) NA (n=950) WE (n=330) APAC (n=316) LA (n=95) MEA (n=47)0%
10%
20%
30%
40%
50%
60%
70%
80%
90%
100%
% o
f Res
pond
ents
Have On-Premise Private Cloud by Region
No
Yes
I3. Does your organization currently have an on-premises private cloud? This is where IT resources in your company owned or operated datacenter are pooled using a cloud platform with policy-based automation and orchestration for delivery.
16

Infrastructure Services64%
57%
55%
49%
18%
16%
65%
59%
63%
51%
18%
15%
64%
54%
38%
42%
11%
10%
61%
59%
56%
57%
22%
18%
56%
50%
38%
24%
24%
29%
71%
53%
35%
53%
24%
35%
0% 10% 20% 30% 40% 50% 60% 70% 80%
On-premises private cloud with a hosted private cloud
On-premises private cloud with a public cloud/IaaS platform
Hosted private cloud with a public cloud/IaaS platform
Public cloud/IaaS platform with a different public cloud/IaaSplatform
Non-cloud environment with a public cloud/IaaS platform
Non-cloud environment with a hosted private cloud
None of the Above
% of Respondents
Cloud Deployment Interoperability
Total (n=554)
NA (n=305)
WE (n=96)
APAC (n=102)
LA (n=34)
MEA (n=17)
Note: Caution is advised when interpreting segments with small sample sizes.
I4. Has your organization configured any of the following cloud deployments for interoperability for the seamless delivery of a business function or to migrate workloads between different cloud environments? Please select all that apply.
17

Infrastructure Services64%
56%
56%
49%
49%
47%
44%
40%
63%
58%
52%
48%
48%
47%
42%
41%
70%
50%
57%
44%
49%
48%
40%
35%
68%
57%
64%
55%
55%
41%
56%
44%
47%
56%
71%
50%
47%
53%
32%
32%
53%
47%
35%
65%
29%
53%
65%
47%
0% 10% 20% 30% 40% 50% 60% 70% 80%
Flexibility and choice: applications/workloads can operate in the mostappropriate IT environment based on security, data residency, application
workload characteristics, end user demand/traffic, etc.
Extend the IT resource capacity of existing on-premises infrastructurewithout capital expense
Maximize return on existing on-premises IT investments for existingapplications/workloads, but use public cloud/IaaS for new
applications/workloads
Establish the right balance between speed/agility/innovation andsecurity/risk
Migrate workloads as needed between private/public cloud and on-premises/off-premises environments
Integrate core business systems and data ("systems of record") to enableinteraction with customer-/end user-facing digital initiatives ("systems of
engagement")
Support the development lifecycle: private cloud for production and publiccloud for development/test
Need for an off-site location for backup /disaster recovery/businesscontinuity
% of Respondents
Adoption Drivers of Hybrid/Multi-Cloud Environments
Total (n=550)
NA (n=303)
WE (n=94)
APAC (n=102)
LA (n=34)
MEA (n=17)
I5. Which of the following factors are driving your organization's adoption/usage of hybrid/multi-cloud environments? Please select all that apply.
Note: Caution is advised when interpreting segments with small sample sizes.
18

Infrastructure Services61%
53%
46%
43%
33%
65%
56%
53%
47%
39%
62%
39%
29%
39%
24%
57%
56%
47%
39%
25%
56%
48%
33%
41%
41%
43%
86%
29%
36%
21%
0% 10% 20% 30% 40% 50% 60% 70% 80% 90% 100%
Microsoft Azure
Google Cloud Platform
Amazon Web Services (AWS)
IBM SoftLayer
VMware vCloud Air
Other
Don't Know
% of Respondents
Public Cloud/IaaS Provider by Region
Total (n=480)
NA (n=262)
WE (n=82)
APAC (n=95)
LA (n=27)
MEA (n=14)
I7. You previously mentioned that you use a public cloud/IaaS platform as part of your hybrid/multi-cloud environment. Which public cloud/IaaS provider(s) are you using? Please select all that apply.
Note: Caution is advised when interpreting segments with small sample sizes.
19

Infrastructure Services41%
30%
16%
13%
44%
28%
16%
11%
34%
35%
10%
20%
28%
36%
19%
16%
56%
19%
26%
64%
7%
14%
14%
0% 10% 20% 30% 40% 50% 60% 70% 80%
Self-built and managed using our own IT staffand hardware/software investments
Service provider-/vendor-built and self-managed
Self-built, but service provider-/vendor managed
Service provider-/vendor-built and managed
Other
% of Respondents
Hybrid/Multi-Cloud Environment Management by Region
Total (n=480)
NA (n=262)
WE (n=82)
APAC (n=95)
LA (n=27)
MEA (n=14)
I8a. How is your organization implementing and managing your hybrid cloud/multi-cloud environment?
Note: Caution is advised when interpreting segments with small sample sizes.
20
Infrastructure Services64%
63%
57%
56%
55%
46%
46%
41%
40%
63%
63%
57%
57%
56%
45%
49%
41%
40%
64%
59%
49%
53%
51%
43%
38%
36%
40%
71%
69%
57%
59%
65%
43%
45%
47%
43%
47%
59%
74%
41%
44%
59%
35%
32%
29%
65%
59%
59%
65%
35%
65%
53%
59%
29%
0% 10% 20% 30% 40% 50% 60% 70% 80%
Cloud Management Platforms
Private Cloud…
Integration Services
Cloud Automation and Orchestration
Application/Workload Migration
Building and Implementation Services
Cloud Brokerage/Marketplace Solutions
Advisory and Planning Services
Workload Placement
% of Respondents
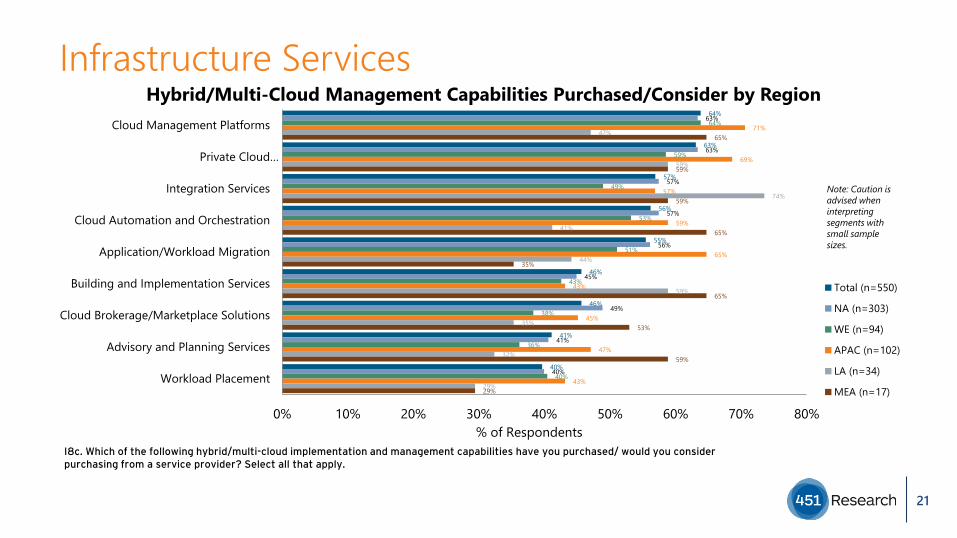
Hybrid/Multi-Cloud Management Capabilities Purchased/Consider by Region
Total (n=550)
NA (n=303)
WE (n=94)
APAC (n=102)
LA (n=34)
MEA (n=17)
I8c. Which of the following hybrid/multi-cloud implementation and management capabilities have you purchased/ would you considerpurchasing from a service provider? Select all that apply.
Note: Caution is advised when interpreting segments with small sample sizes.
21

Infrastructure Services
89% 91%83%
93%85% 82%
8% 7%14%
3% 12% 12%
Total (n=549) NA (n=302) WE (n=94) APAC (n=102) LA (n=34) MEA (n=17)0%
10%
20%
30%
40%
50%
60%
70%
80%
90%
100%
% o
f Res
pond
ents
Pay Premium for Service Provider Hybrid/Multi Cloud Mgt Services by Region
Don'tknowNo
I8d. Would your organization expect to pay a premium for a service provider's hybrid/multi-cloud implementation and management services?
Note: Caution is advised when interpreting segments with small sample sizes.
22

Infrastructure Services57%
55%
53%
51%
51%
41%
39%
36%
33%
31%
53%
54%
54%
53%
50%
43%
39%
36%
35%
33%
56%
49%
37%
40%
41%
33%
35%
24%
35%
23%
65%
65%
65%
58%
57%
42%
43%
44%
29%
31%
59%
45%
45%
45%
52%
24%
34%
34%
24%
34%
71%
64%
50%
64%
71%
71%
43%
43%
21%
21%
0% 10% 20% 30% 40% 50% 60% 70% 80%
Managed Service Provider (MSP)/Managed Hosting Provider
Public Cloud Infrastructure as a Service (IaaS) Provider
Security Service Provider
Consulting/IT Outsourcing/Systems Integrator
Cloud Enablement and Management Specialist
Hardware Vendor/OEM
Independent Software Vendor (ISV)
Telecommunications Provider
Value Added Reseller (VAR)
Cloud Broker
% of Respondents
Hybrid/Multi-Cloud Management Capabilities Service Providers Consider by Region
Total (n=490)
NA (n=274)
WE (n=78)
APAC (n=95)
LA (n=29)
MEA (n=14)
I8e. What types of service providers does or would your organization look to for hybrid/multi-cloud implementation and management capabilities? Select all that apply.
Note: Caution is advised when interpreting segments with small sample sizes.
23

Infrastructure Services
39%
36%
26%
39%
38%
23%
47%
26%
28%
31%
37%
31%
35%
35%
29%
53%
29%
18%
0% 10% 20% 30% 40% 50% 60% 70%
Individual best-of-breed services purchasedfrom multiple providers/vendors that we
implement and manage ourselves
Integrated multi-vendor solution built andmanaged by a single provider/vendor ('one
throat to choke')
Pre-packaged, pre-configured serviceprovider solution built and managed by a
service provider
% of Respondents
Hybrid/Multi-Cloud Management Capabilities Acquisition Preference by Region
Total (n=549)
NA (n=302)
WE (n=94)
APAC (n=102)
LA (n=34)
MEA (n=17)
I8f. Which of the following best describes how your organization would like to obtain hybrid/multi-cloud implementation and management services?
Note: Caution is advised when interpreting segments with small sample sizes.
24

Infrastructure Services
44%50%
39%28%
50% 50%
28%25%
19% 45%
27%33%
19% 14%
33%
20%19%
17%4% 4% 6% 3%5% 6% 4% 5% 4%
Total (n=442) NA (n=247) WE (n=70) APAC (n=87) LA (n=26) MEA (n=12)0%
10%
20%
30%
40%
50%
60%
70%
80%
90%
100%
% o
f Res
pond
ents
Public Cloud/IaaS Bursting Capability Plans by Region
No plans tousePlan to use in1-2 yearsPlan to use in12 monthsPlan to use in6 monthsCurrently Use
I9. Does your organization currently use or plan to use public cloud/IaaS for bursting capabilities, meaning that an application/workload running in a private cloud or non-cloud environment "bursts" into a public cloud when demand for capacity spikes?
Note: Caution is advised when interpreting segments with small sample sizes.
25
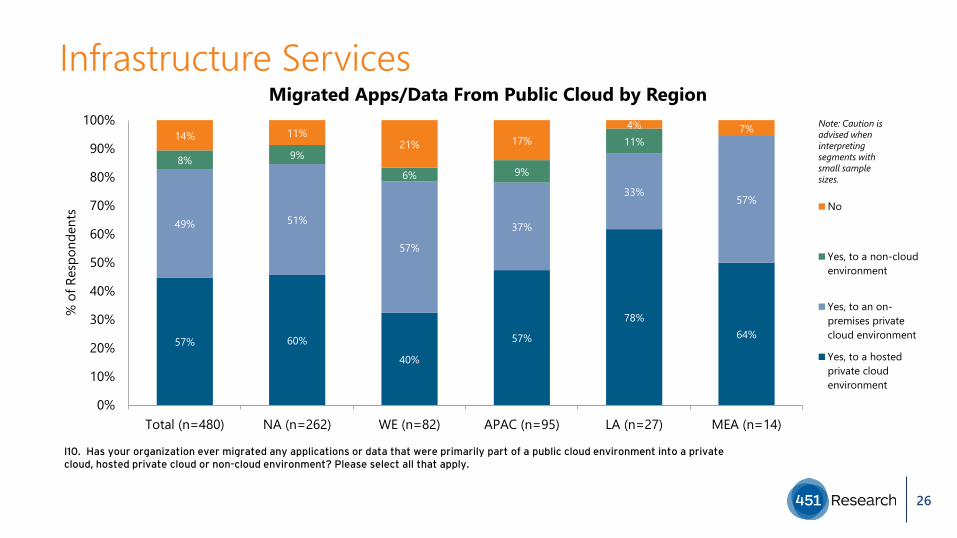
Infrastructure Services
57% 60%
40%
57%
78%64%
49% 51%
57%
37%
33%57%
8% 9%
6% 9%
11%14% 11%21% 17%
4% 7%
Total (n=480) NA (n=262) WE (n=82) APAC (n=95) LA (n=27) MEA (n=14)0%
10%
20%
30%
40%
50%
60%
70%
80%
90%
100%
% o
f Res
pond
ents
Migrated Apps/Data From Public Cloud by Region
No
Yes, to a non-cloudenvironment
Yes, to an on-premises privatecloud environment
Yes, to a hostedprivate cloudenvironment
I10. Has your organization ever migrated any applications or data that were primarily part of a public cloud environment into a private cloud, hosted private cloud or non-cloud environment? Please select all that apply.
Note: Caution is advised when interpreting segments with small sample sizes.
26

Infrastructure Services20%
16%
15%
14%
12%
7%
6%
5%
5%
20%
19%
13%
11%
13%
7%
6%
6%
6%
14%
12%
23%
17%
11%
11%
6%
2%
5%
24%
14%
10%
22%
9%
6%
5%
8%
3%
27%
12%
27%
19%
4%
4%
8%
23%
15%
38%
15%
8%
0% 10% 20% 30% 40%
Security
Part of an IT Centralization…
Better Control
Performance
Enhanced Capabilities/Functionality
We Only use Public Cloud/IaaS for…
Lower Cost
Availability
Customer Service Issues
% of Respondents
Hybrid/Multi-Cloud Management Capabilities Acquisition Preference by Region
Total (n=415)
NA (n=232)
WE (n=65)
APAC (n=79)
LA (n=26)
MEA (n=13)
I11. What was the primary driver for migrating workloads from a public cloud to a private cloud, hosted private cloud or non-cloud environment?
Note: Caution is advised when interpreting segments with small sample sizes.
27

MANAGED SERVICES (M)
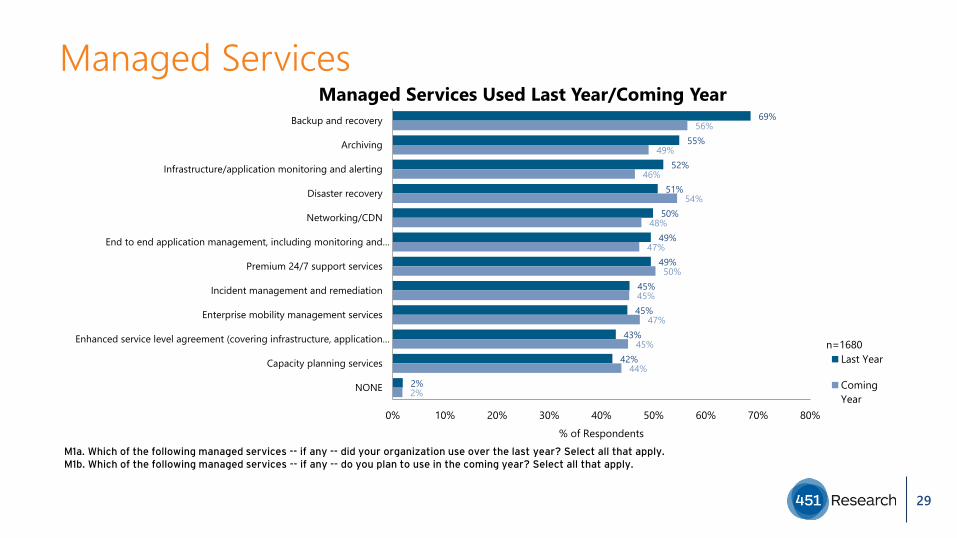
Managed Services69%
55%
52%
51%
50%
49%
49%
45%
45%
43%
42%
2%
56%
49%
46%
54%
48%
47%
50%
45%
47%
45%
44%
2%
0% 10% 20% 30% 40% 50% 60% 70% 80%
Backup and recovery
Archiving
Infrastructure/application monitoring and alerting
Disaster recovery
Networking/CDN
End to end application management, including monitoring and…
Premium 24/7 support services
Incident management and remediation
Enterprise mobility management services
Enhanced service level agreement (covering infrastructure, application…
Capacity planning services
NONE
% of Respondents
Managed Services Used Last Year/Coming Year
Last Year
ComingYear
n=1680
M1a. Which of the following managed services -- if any -- did your organization use over the last year? Select all that apply. M1b. Which of the following managed services -- if any -- do you plan to use in the coming year? Select all that apply.
29

Managed Services
0% 10% 20% 30% 40% 50% 60% 70% 80% 90%
Backup and recovery
Archiving
Infrastructure/application monitoring and alerting
Disaster recovery
Networking/CDN
End to end application management, including…
Premium 24/7 support services
Incident management and remediation
Enterprise mobility management services
Enhanced service level agreement (covering…
Capacity planning services
NONE
% of Respondents
Managed Services Used Last Year by Region
Total (n=1668)
NA (n=920)
WE (n=309)
APAC (n=298)
LA (n=94)
MEA (n=47)
M1a. Which of the following managed services -- if any -- did your organization use over the last year? Select all that apply.
30

Managed Services
0% 10% 20% 30% 40% 50% 60% 70% 80% 90%
Backup and recovery
Disaster recovery
Premium 24/7 support services
Archiving
Networking/CDN
Enterprise mobility management services
End to end application management, including…
Infrastructure/application monitoring and alerting
Incident management and remediation
Enhanced service level agreement (covering…
Capacity planning services
NONE
% of Respondents
Managed Services Used Coming Year by Region
Total (n=1668)
NA (n=920)
WE (n=309)
APAC (n=298)
LA (n=94)
MEA (n=47)
M1b. Which of the following managed services -- if any -- do you plan to use in the coming year? Select all that apply.
31
PROFESSIONAL SERVICES FOR CLOUD ENABLEMENT (Z)

Professional Services63%
56%
53%
48%
7%
60%
58%
54%
53%
5%
0% 10% 20% 30% 40% 50% 60% 70% 80%
Cloud Integration Services
Cloud Migration Services
Cloud Assessment, Readiness and EnablementServices
Cloud Transformation Services
NONE
% of Respondents
Cloud Professional Services Used Last Year/Coming Year
Last Year
Coming Year
n=1599
Z1a. Which of the following cloud professional services does your organization use -- if any -- did your organization use over the last year? Select all that apply.Z1b. Which of the following cloud professional services does your organization use -- if any -- do you plan to use in the coming year? Select all that apply.
33

Professional Services63%
56%
53%
48%
7%
65%
57%
56%
51%
4%
57.0%
54.0%
42.0%
41.3%
11.7%
59%
56%
55%
46%
10%
73%
66%
62%
48%
71%
36%
49%
60%
4%
0% 10% 20% 30% 40% 50% 60% 70% 80%
Cloud Integration Services
Cloud Migration Services
Cloud Assessment, Readiness andEnablement Services
Cloud Transformation Services
NONE
% of Respondents
Cloud Professional Services Used Last Year by Region
Total (n=1599)
NA (n=876)
WE (n=300)
APAC (n=287)
LA (n=91)
MEA (n=45)
Z1a. Which of the following cloud professional services does your organization use -- if any -- did your organization use over the last year? Select all that apply.
34

Professional Services60%
58%
54%
53%
5%
59%
58%
54%
53%
3%
58.3%
53.3%
43.7%
49.0%
8.3%
62%
59%
61%
57%
8%
68%
65%
54%
54%
7%
71%
58%
69%
60%
4%
0% 10% 20% 30% 40% 50% 60% 70% 80%
Cloud Integration Services
Cloud Migration Services
Cloud Assessment, Readiness andEnablement Services
Cloud Transformation Services
NONE
% of Respondents
Cloud Professional Services Use Coming Year by Region
Total(n=1599)NA (n=876)
WE (n=300)
APAC (n=287)
LA (n=91)
Z1b. Which of the following cloud professional services does your organization use -- if any -- do you plan to use in the coming year? Select all that apply.
35
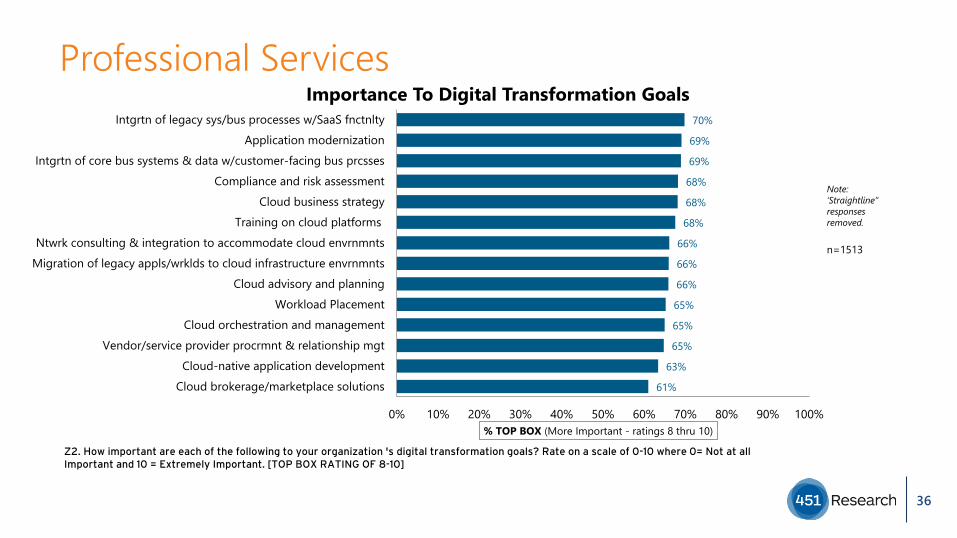
Professional Services70%
69%
69%
68%
68%
68%
66%
66%
66%
65%
65%
65%
63%
61%
0% 10% 20% 30% 40% 50% 60% 70% 80% 90% 100%
Intgrtn of legacy sys/bus processes w/SaaS fnctnltyApplication modernization
Intgrtn of core bus systems & data w/customer-facing bus prcssesCompliance and risk assessment
Cloud business strategyTraining on cloud platforms
Ntwrk consulting & integration to accommodate cloud envrnmntsMigration of legacy appls/wrklds to cloud infrastructure envrnmnts
Cloud advisory and planningWorkload Placement
Cloud orchestration and managementVendor/service provider procrmnt & relationship mgt
Cloud-native application developmentCloud brokerage/marketplace solutions
% TOP BOX (More Important - ratings 8 thru 10)
Importance To Digital Transformation Goals
n=1513
Z2. How important are each of the following to your organization 's digital transformation goals? Rate on a scale of 0-10 where 0= Not at all Important and 10 = Extremely Important. [TOP BOX RATING OF 8-10]
Note: ‘Straightline” responses removed.
36

Professional Services
0% 10% 20% 30% 40% 50% 60% 70% 80% 90% 100%
Intgrtn of legacy sys/bus processes w/SaaS fnctnltyApplication modernization
Intgrtn of core bus systems & data w/customer-facing bus prcssesCompliance and risk assessment
Cloud business strategyTraining on cloud platforms
Ntwrk consulting & integration to accommodate cloud envrnmntsMigration of legacy appls/wrklds to cloud infrastructure envrnmnts
Cloud advisory and planningWorkload Placement
Cloud orchestration and managementVendor/service provider procrmnt & relationship mgt
Cloud-native application developmentCloud brokerage/marketplace solutions
% TOP BOX (More Important - ratings 8 thru 10)
Importance To Digital Transformation Goals by Region
Total (n=1513)
NA (n=851)
WE (n=274)
APAC (n=262)
LA (n=83)
MEA (n=43)
Z2. How important are each of the following to your organization 's digital transformation goals? Rate on a scale of 0-10 where 0= Not at all Important and 10 = Extremely Important. [TOP BOX RATING OF 8-10]
Note: ‘Straightline” responses removed.
37

Professional Services
12% 15%9% 10% 7% 3%
14%15% 24%
4% 12%13%
16%16%
23%
9%4%
38%
19%19%
19%
19%22%
21%17%
18%
13%
16%
30%
13%11%
10%7%
16%
10%
8%11% 8% 4%
28%
13%5%
Total (n=1282) NA (n=732) WE (n=217) APAC (n=227) LA (n=67) MEA (n=39)0%
10%
20%
30%
40%
50%
60%
70%
80%
90%
100%
% o
f Res
pond
ents
Most Recent Professional Services Cloud Project Spend by Region
$2mil+
$500,000-<$2mil$100,000-$499,999$25,000-$99,999$5,000-$24,999
$1,000-$4,999
<$1,000
Z3. How much did your organization spend on your most recent professional services for cloud enablement project? Please enter a US dollar value. [OPEN NUMERIC]
38

Professional Services
11% 12% 6%13% 11% 12%
22% 24%20%
18% 20% 19%
25% 24%30% 25% 22% 21%
21% 23%23% 19%
16%14%
7% 6% 7%8% 14%
5%
14% 12% 14% 18% 16%30%
Total (n=1391) NA (n=778) WE (n=236) APAC (n=255) LA (n=79) MEA (n=43)0%
10%
20%
30%
40%
50%
60%
70%
80%
90%
100%
% o
f Res
pond
ents
Most Recent Professional Services Cloud Project Duration by Region
More than 24weeks17-24 weeks
9-16 weeks
5-8 weeks
3-4 weeks
1-2 weeks
Average Weeks 13 12 12 14 14 20
Z4. What was the duration (WEEKS) of your organization 's most recent professional services for cloud enablement project? ________ Weeks [OPEN NUMERIC]
39

Professional Services
0% 10% 20% 30%
Public Cloud Infrastructure as a Service (IaaS) Provider
Cloud Enablement and Management Specialist
Managed Service Provider (MSP)/Managed Hosting…
Consulting/IT Outsourcing/Systems Integrator
Security Service Provider
Independent Software Vendor (ISV)
Hardware Vendor/OEM
Telecommunications Provider
Value Added Reseller (VAR)
Cloud Broker
% of Respondents
Total (n=1541)
NA (n=859)
WE (n=279)
APAC (n=269)
LA (n=89)
MEA (n=45)
Most Recent Professional Services Cloud Project Vendor by Region
Z5. Which of the following best describes the type of service provider/vendor your organization used for your most recent professional services for cloud project? Select one.
40

APPLICATION HOSTING (A)

Application Services58%
55%
53%
51%
48%
45%
45%
44%
43%
42%
42%
41%
39%
38%
32%
52%
49%
47%
45%
45%
44%
44%
43%
43%
45%
40%
45%
40%
42%
37%
0% 10% 20% 30% 40% 50% 60% 70%
File storageWebsite hosting and web presence
Database and data warehousingEmail, collaboration & productivity apps for…
CRMData analytics/Business intelligence/Big Data
Industry-specific applicationsApp development (tools, platforms & DevOps)
ERPEcommerce
Media streaming and digital publishingSocial applications
Engineering/R&D/Technical computingVDI and mobility management
Other line of business (LOB) applicationsNONE
% of Respondents
Hosted Applications Used Last Year/Coming Year
Last Year
Coming Year
n=1673
A1a. Which of the following hosted applications - if any -- did your organization use over the last year? Select all that apply. A1b. Which of the following hosted applications -- if any -- do you plan to use in the coming year? Select all that apply.
42

Application Services
0% 10% 20% 30% 40% 50% 60% 70% 80%
File storageWebsite hosting and web presence
Database and data warehousingEmail, collaboration & productivity apps for…
CRMData analytics/Business intelligence/Big Data
Industry-specific applicationsApp development (tools, platforms & DevOps)
ERPEcommerce
Media streaming and digital publishingSocial applications
Engineering/R&D/Technical computingVDI and mobility management
Other line of business (LOB) applicationsNONE
% of Respondents
Hosted Applications Used Last Year by Region
Total (n=1673)
NA (n=911)
WE (n=319)
APAC (n=303)
LA (n=93)
MEA (n=47)
A1a. Which of the following hosted applications - if any -- did your organization use over the last year? Select all that apply.
43
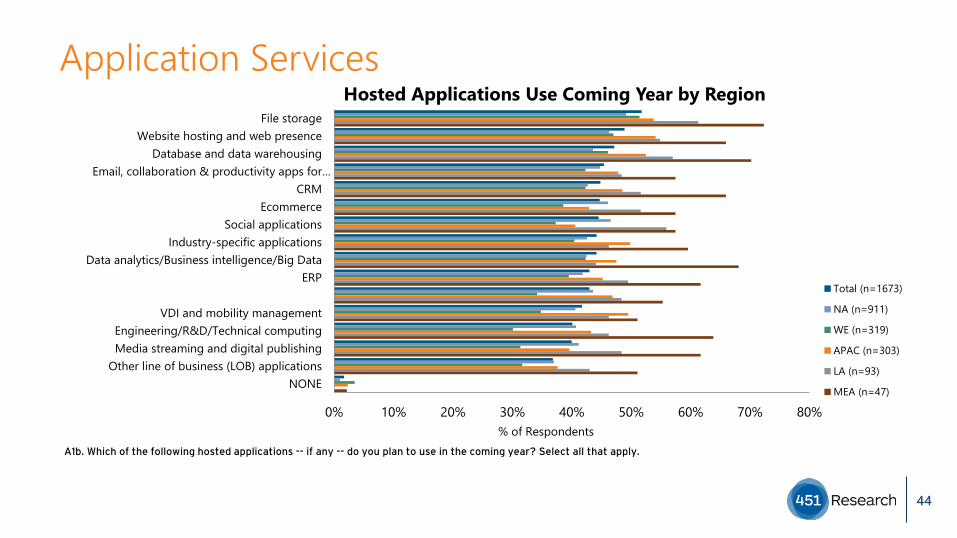
Application Services
0% 10% 20% 30% 40% 50% 60% 70% 80%
File storageWebsite hosting and web presence
Database and data warehousingEmail, collaboration & productivity apps for…
CRMEcommerce
Social applicationsIndustry-specific applications
Data analytics/Business intelligence/Big DataERP
VDI and mobility managementEngineering/R&D/Technical computingMedia streaming and digital publishing
Other line of business (LOB) applicationsNONE
% of Respondents
Hosted Applications Use Coming Year by Region
Total (n=1673)
NA (n=911)
WE (n=319)
APAC (n=303)
LA (n=93)
MEA (n=47)
A1b. Which of the following hosted applications -- if any -- do you plan to use in the coming year? Select all that apply.
44

58%
48%
53%
54%
51%
52%
42%
52%
47%
46%
49%
48%
MEA (n=47)
LA (n=95)
APAC (n=316)
WE (n=330)
NA (n=950)
Total (n=1738)
0% 20% 40% 60% 80% 100%Average %
Application Allocation Today to Third-Party Vs. Internal by Region
Operate/manageinternally
59%
57%
52%
54%
51%
52%
41%
43%
48%
46%
49%
48%
MEA(n=47)
LA (n=95)
APAC(n=316)
WE(n=330)
NA(n=950)
Total(n=1738)
0% 20% 40% 60% 80% 100%
Average %
Application Allocation In 2 Yrs to Third-Party Vs. Internal by Region
Operate/manage internally
Use a ServiceProvider foroperations/management
45
A2a. Thinking about all of your organization's applications, today, what percentage of these would you look to a third-party provider to operate and manage and what percentage would you continue to operate and manage internally? Sum to 100%A2b. Thinking about all of your organization's applications, 2 years from now, what percentage of these would you look to a third-party provider to operate and manage and what percentage would you continue to operate and manage internally?
Application Services

SECURITY SERVICES (E)

Security Services62%
53%
52%
52%
51%
49%
47%
46%
46%
45%
45%
55%
51%
51%
50%
50%
46%
47%
48%
45%
45%
44%
0% 10% 20% 30% 40% 50% 60% 70%
Anti-virus/endpoint security
Web app firewall (WAF)
Data encryption/encryption services
Data loss prevention (DLP)
App security (including patching & firewall mgt)
Advanced anti-malware or advanced persistent threat (APT)…
Security config mgt (including endpoint security)
Vulnerability assessment
Identity and access management (IAM)
IT governance, risk & compliance (GRC) functions
Security info & event mgt (SIEM) & logging/event mgt
NONE
% of Respondents
Security Services Used Last Year/Coming Year
Last Year
Coming Year
n=1673
E1a. Which of the following security services -- if any -- did your organization use over the last year? Select all that apply.E1b. Which of the following security services -- if any -- do you plan to use in the coming year? Select all that apply.
47

Security Services
0% 10% 20% 30% 40% 50% 60% 70% 80% 90%
Anti-virus/endpoint security
Web app firewall (WAF)
Data encryption/encryption services
Data loss prevention (DLP)
App security (including patching & firewall mgt)
Advanced anti-malware or advanced persistent threat (APT)…
Security config mgt (including endpoint security)
Vulnerability assessment
Identity and access management (IAM)
IT governance, risk & compliance (GRC) functions
Security info & event mgt (SIEM) & logging/event mgt
NONE
% of Respondents
Security Services Used Last Year by Region
Total (n=1666)
NA (n=912)
WE (n=311)
APAC (n=301)
LA (n=95)
MEA (n=47)
E1a. Which of the following security services -- if any -- did your organization use over the last year? Select all that apply.
48

Security Services
0% 10% 20% 30% 40% 50% 60% 70% 80%
Anti-virus/endpoint security
Data encryption/encryption services
Web app firewall (WAF)
Data loss prevention (DLP)
App security (including patching & firewall mgt)
Vulnerability assessment
Security config mgt (including endpoint security)
Advanced anti-malware or advanced persistent threat (APT)…
IT governance, risk & compliance (GRC) functions
Identity and access management (IAM)
Security info & event mgt (SIEM) & logging/event mgt
NONE
% of Respondents
Security Services Use Next Year by Region
Total (n=1666)
NA (n=912)
WE (n=311)
APAC (n=301)
LA (n=95)
MEA (n=47)
E1b. Which of the following security services -- if any -- do you plan to use in the coming year? Select all that apply.
49

Transformation (C)

Business Transformation
9% 10% 9% 8% 5% 4%
14%18%
8% 13%
4% 9%
29%29%
27%30%
41%
19%
38% 34%
45%41% 40%
64%
9% 9% 10% 7% 9%4%
Total (n=1738) NA (n=950) WE (n=330) APAC (n=316) LA (n=95) MEA (n=47)0%
10%
20%
30%
40%
50%
60%
70%
80%
90%
100%
% o
f Res
pond
ents
Business Transition Descriptor by Region
Other
Transitioning
Staying theCourseUnderReinventionMarket Maker
MarketDisrupter
C1. Which of the following best describes your organization? (Randomize Select one.)
51
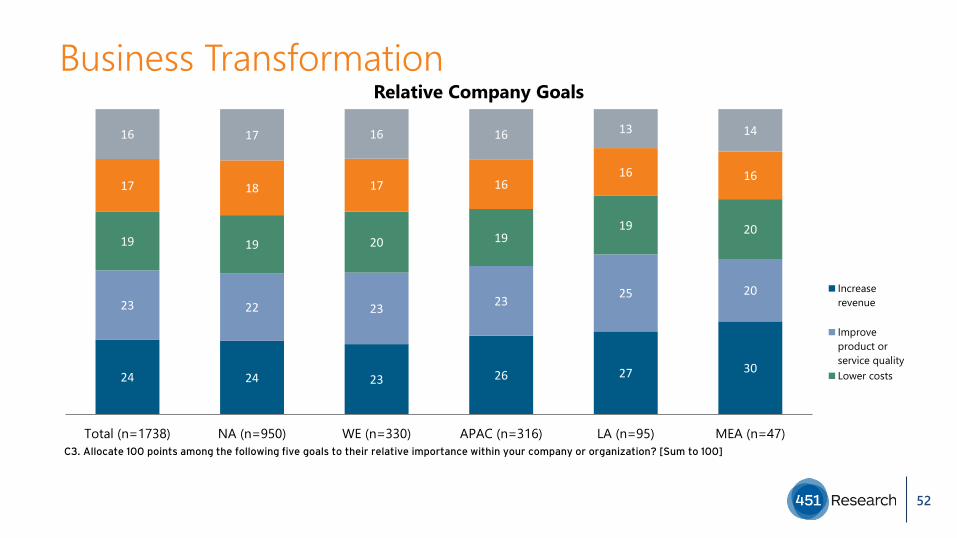
Business Transformation
24 24 23 26 27 30
23 22 23 23 25 20
19 19 20 1919 20
17 18 17 1616 16
16 17 16 16 13 14
Total (n=1738) NA (n=950) WE (n=330) APAC (n=316) LA (n=95) MEA (n=47)
Relative Company Goals
Increaserevenue
Improveproduct orservice qualityLower costs
C3. Allocate 100 points among the following five goals to their relative importance within your company or organization? [Sum to 100]
52

Business Transformation27%
15%
14%
13%
13%
11%
7%
0%
0% 5% 10% 15% 20% 25% 30%
Improve marketing/promotion of products andservices
Compete aggressively to increase market share
Target Cross-sell/Up-sell opportunities within clientbase
Expand geographically
Hire quality staff
Optimize Pricing
Enter into adjacent lines of business
Other
% of Respondents
Most Important Attribute to Increase Revenue by Region
Total (n=1067)
NA (n=555)
WE (n=202)
APAC (n=205)
LA (n=69)
MEA (n=36)
C4. Based on what you have heard, which of the following will be the primary strategy for your organization to increase revenue over the next two years? (Select one)
53
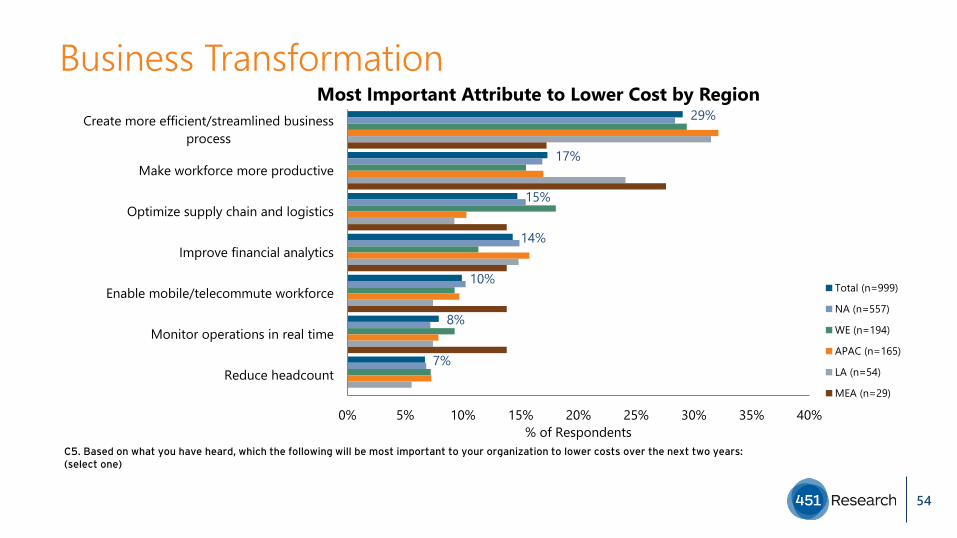
Business Transformation29%
17%
15%
14%
10%
8%
7%
0% 5% 10% 15% 20% 25% 30% 35% 40%
Create more efficient/streamlined businessprocess
Make workforce more productive
Optimize supply chain and logistics
Improve financial analytics
Enable mobile/telecommute workforce
Monitor operations in real time
Reduce headcount
% of Respondents
Most Important Attribute to Lower Cost by Region
Total (n=999)
NA (n=557)
WE (n=194)
APAC (n=165)
LA (n=54)
MEA (n=29)
C5. Based on what you have heard, which the following will be most important to your organization to lower costs over the next two years: (select one)
54

Business Transformation21%
13%
12%
11%
10%
8%
8%
6%6%
5%
0% 5% 10% 15% 20% 25% 30%
Innovate or deliver new products or services
Find, develop and retain talent
Focus on customer convenience
Single customer experience across digital and physical…
Personalize customer experience
Use analytics to predict or recover from errors
Deliver digital products (vs physical products)
Build online communities
Tracking digital identities of customers
Offer self-service products/services
% of Respondents
Most Important Attribute to Improve Product or Service Quality by Region
Total (n=1044)
NA (n=536)
WE (n=207)
APAC (n=204)
LA (n=69)
MEA (n=28)
C6. Based on what you have heard, which the following will be most important to your organization to improve product or service quality over the next two years: (select one)
Note: Caution is advised when interpreting segments with small sample sizes.
55

Business Transformation19%
15%
15%
14%
14%
13%
10%
0% 5% 10% 15% 20% 25% 30%
Improve production processes
Use data to drive strategic decision making
Automate business processes
Encourage knowledge sharing & collaborationamong employees
Invest in research and development
Integrate customer feedback through communitiesor analytics
Cultivate a culture of risk taking (where failure is avalid outcome) to accelerate development
% of Respondents
Most Important Attribute to Speed Time to Market by Region
Total (n=984)
NA (n=570)
WE (n=186)
APAC (n=163)
LA (n=44)
MEA (n=21)
C7. Based on what you have heard, which the following will be most important to your organization to speed time to market over the next two years: (select one)
Note: Caution is advised when interpreting segments with small sample sizes.
56

Business Transformation25%
22%
19%
18%
16%
0% 5% 10% 15% 20% 25% 30% 35% 40%
Identify threats in business exposure orcompetition
Analytics to recognize risks sooner
Focus on reducing Cybersecurity attacks
Minimize risk making decisions with data
Building Digital Trust competencies
% of Respondents
Most Important Attribute to Lower Risk by Region
Total (n=983)
NA (n=559)
WE (n=175)
APAC (n=183)
LA (n=43)
MEA (n=23)
C8. Based on what you have heard, which the following will be most important to your organization to lower risk over the next two years: (select one)
Note: Caution is advised when interpreting segments with small sample sizes.
57

Digital Investment
3% 3% 3% 4% 6%
28% 24%
39% 35%
14%
21%
69% 73%
58% 61%
85%
72%
Total (n=1738) NA (n=950) WE (n=330) APAC (n=316) LA (n=95) MEA (n=47)0%
10%
20%
30%
40%
50%
60%
70%
80%
90%
100%
% o
f Res
pond
ents
Digital Investment Importance by Region
Top Box (MoreImportant:Ratings 8-10)
Middle(Ratings 5-7)
Bottom Box(LessImportant:Ratings 0-4)
C8a. Rate the overall importance of digital investment in achieving your organization's business transformation objectives on a scale of 0 to 10 where 0 is Not at All Important and 10 is Extremely Important.Digital investment here refers to funding for IT and IT-related initiatives. These could be led by IT or by a business unit using technology.
58
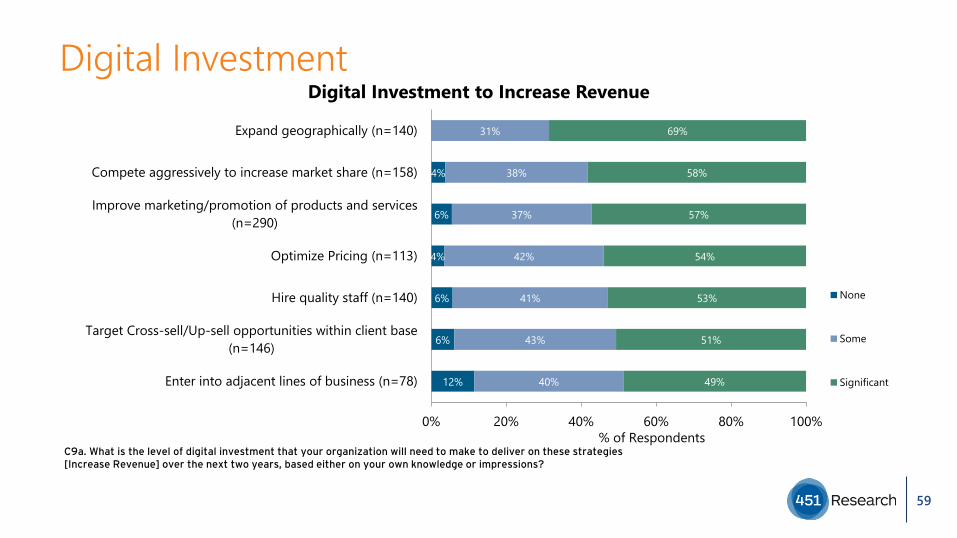
Digital Investment
12%
6%
6%
4%
6%
4%
40%
43%
41%
42%
37%
38%
31%
49%
51%
53%
54%
57%
58%
69%
Enter into adjacent lines of business (n=78)
Target Cross-sell/Up-sell opportunities within client base(n=146)
Hire quality staff (n=140)
Optimize Pricing (n=113)
Improve marketing/promotion of products and services(n=290)
Compete aggressively to increase market share (n=158)
Expand geographically (n=140)
0% 20% 40% 60% 80% 100%% of Respondents
Digital Investment to Increase Revenue
None
Some
Significant
C9a. What is the level of digital investment that your organization will need to make to deliver on these strategies [Increase Revenue] over the next two years, based either on your own knowledge or impressions?
59

Digital Investment
10%
9%
5%
3%
3%
49%
39%
42%
42%
39%
38%
37%
40%
52%
53%
55%
58%
59%
60%
Reduce headcount (n=67)
Enable mobile/telecommute workforce (n=99)
Monitor operations in real time (n=79)
Optimize supply chain and logistics (n=147)
Make workforce more productive (n=173)
Improve financial analytics (n=143)
Create more efficient/streamlined business process(n=290)
0% 20% 40% 60% 80% 100%% of Respondents
Digital Investment to Lower Costs
None
Some
Significant
C9b. What is the level of digital investment that your organization will need to make to deliver on these strategies [Lower Costs] over the next two years, based either on your own knowledge or impressions?
60

Digital Investment
4%
4%
5%
3%
3%
3%
52%
49%
42%
42%
39%
41%
39%
38%
32%
28%
46%
47%
55%
56%
56%
57%
59%
59%
66%
70%
Tracking digital identities of customers (n=63)
Offer self-service products/services (n=51)
Use analytics to predict or recover from errors (n=84)
Build online communities (n=66)
Find, develop and retain talent (n=135)
Focus on customer convenience (n=129)
Single cstmr exprnce across digital & physical srvcs/devices/pltfrms…
Personalize customer experience (n=102)
Deliver digital products (vs physical products) (n=79)
Innovate or deliver new products or services (n=224)
0% 20% 40% 60% 80% 100%% of Respondents
Digital Investment to Improve Product or Service Quality
None
Some
Significant
C9c. What is the level of digital investment that your organization will need to make to deliver on these strategies [Improve Product or Service Quality] over the next two years, based either on your own knowledge or impressions?
61

Digital Investment
6%
4%
39%
41%
40%
39%
38%
34%
37%
55%
56%
58%
59%
60%
62%
63%
Cultivate a culture of risk taking...to accelerate development (n=101)
Encourage knowledge sharing & collaboration among employees(n=135)
Invest in research and development (n=133)
Integrate customer feedback through communities or analytics(n=132)
Automate business processes (n=145)
Use data to drive strategic decision making (n=149)
Improve production processes (n=189)
0% 20% 40% 60% 80% 100%% of Respondents
Digital Investment to Speed Time to Market
None
Some
Significant
C9d. What is the level of digital investment that your organization will need to make to deliver on these strategies [Speed Time to Market] over the next two years, based either on your own knowledge or impressions?
62

Digital Investment
42%
41%
38%
36%
27%
56%
58%
60%
62%
71%
Minimize risk making decisions with data (n=177)
Analytics to recognize risks sooner (n=217)
Building Digital Trust competencies (n=162)
Identify threats in business exposure or competition(n=241)
Focus on reducing Cybersecurity attacks (n=186)
0% 20% 40% 60% 80% 100%% of Respondents
Digital Investment to Lower Risk
None
Some
Significant
C9e. What is the level of digital investment that your organization will need to make to deliver on these strategies [Lower Risk] over the next two years, based either on your own knowledge or impressions?
63
Digital Investment
3%
3%
4%
4%
25%
24%
20%
26%
25%
26%
19%
51%
42%
50%
44%
44%
45%
45%
24%
28%
26%
24%
27%
26%
29%
4%
4%
3%
Expand geographically (n=140)
Compete aggressively to increase market share (n=158)
Improve marketing/promotion of products and services(n=290)
Optimize Pricing (n=113)
Target Cross-sell/Up-sell opportunities within client base(n=146)
Enter into adjacent lines of business (n=78)
Hire quality staff (n=140)
0% 20% 40% 60% 80% 100%% of Respondents
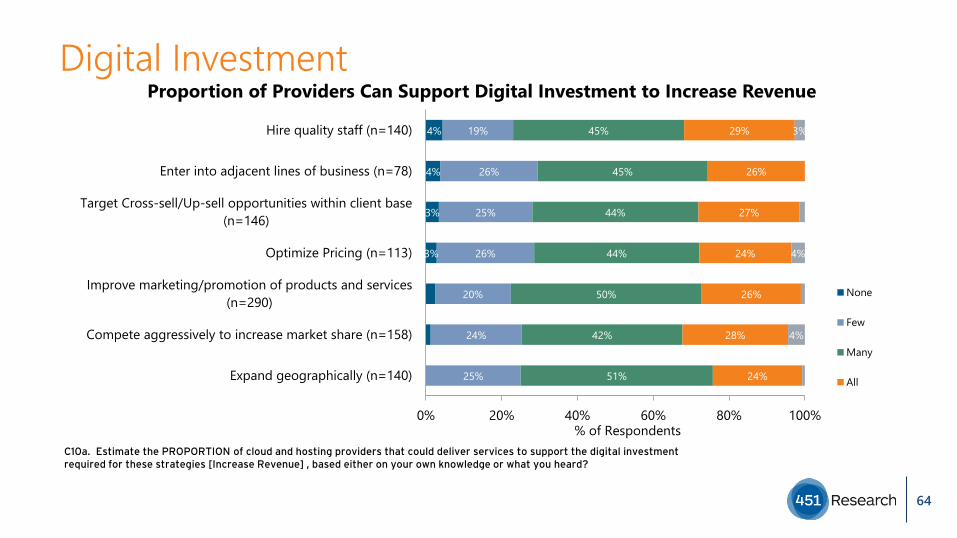
Proportion of Providers Can Support Digital Investment to Increase Revenue
None
Few
Many
All
C10a. Estimate the PROPORTION of cloud and hosting providers that could deliver services to support the digital investment required for these strategies [Increase Revenue] , based either on your own knowledge or what you heard?
64

Digital Investment
3%
9%
13%
23%
20%
21%
24%
24%
28%
45%
52%
52%
48%
46%
44%
28%
42%
23%
26%
25%
28%
26%
28%
3%
5%
6%
Improve financial analytics (n=143)
Monitor operations in real time (n=79)
Create more efficient/streamlined business process(n=290)
Make workforce more productive (n=173)
Optimize supply chain and logistics (n=147)
Enable mobile/telecommute workforce (n=99)
Reduce headcount (n=67)
0% 20% 40% 60% 80% 100%% of Respondents
Proportion of Providers Can Support Digital Investment to Lower Costs
None
Few
Many
All
Don't know
C10b. Estimate the PROPORTION of cloud and hosting providers that could deliver services to support the digital investment required for these strategies [Lower Costs], based either on your own knowledge or what you heard?
65
Digital Investment
3%
5%
14%
15%
19%
18%
17%
18%
15%
17%
20%
21%
55%
48%
57%
50%
46%
50%
39%
52%
50%
46%
29%
36%
24%
29%
36%
26%
43%
27%
26%
24%
3%
5%
4%
Offer self-service products/services (n=51)
Build online communities (n=66)
Tracking digital identities of customers (n=63)
Innovate or deliver new products or services (n=224)
Single customer experience across digital and physical services, devices or platforms…
Use analytics to predict or recover from errors (n=84)
Deliver digital products (vs physical products) (n=79)
Personalize customer experience (n=102)
Focus on customer convenience (n=129)
Find, develop and retain talent (n=135)
0% 20% 40% 60% 80% 100%% of Respondents
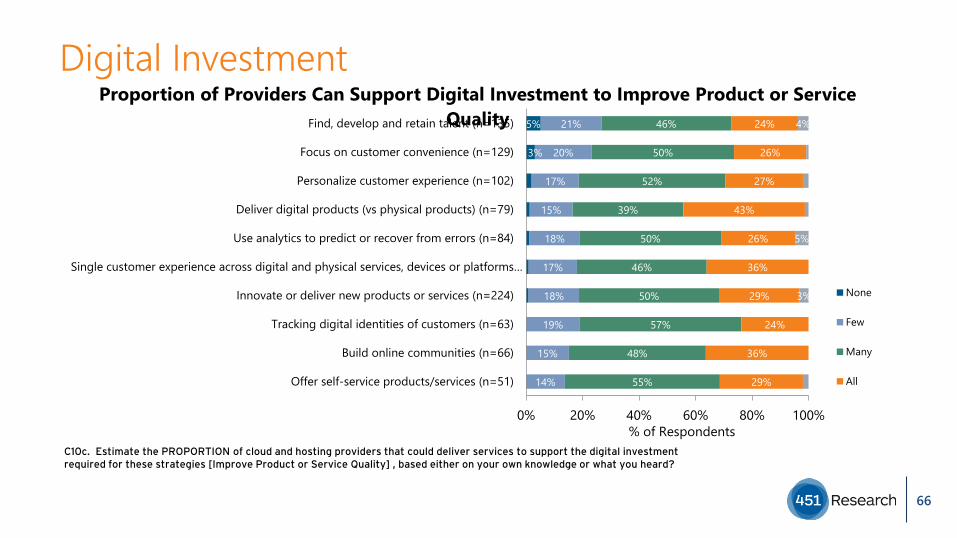
Proportion of Providers Can Support Digital Investment to Improve Product or Service Quality
None
Few
Many
All
C10c. Estimate the PROPORTION of cloud and hosting providers that could deliver services to support the digital investment required for these strategies [Improve Product or Service Quality] , based either on your own knowledge or what you heard?
66

5%
14%
15%
19%
18%
17%
18%
15%
17%
20%
21%
55%
48%
57%
50%
46%
50%
39%
52%
50%
46%
29%
36%
24%
29%
36%
26%
43%
27%
26%
24%
3%
5%
4%
Offer self-service products/services (n=51)
Build online communities (n=66)
Tracking digital identities of customers (n=63)
Innovate or deliver new products or services (n=224)
Single customer experience across digital and physical services, devices or platforms (n=111)
Use analytics to predict or recover from errors (n=84)
Deliver digital products (vs physical products) (n=79)
Personalize customer experience (n=102)
Focus on customer convenience (n=129)
Find, develop and retain talent (n=135)
0% 20% 40% 60% 80% 100%% of Respondents
Proportion of Providers Can Support Digital Investment to Improve Product or Service Quality
None
Few
Many
All
Digital Investment
C10c. Estimate the PROPORTION of cloud and hosting providers that could deliver services to support the digital investment required for these strategies [Improve Product or Service Quality] , based either on your own knowledge or what you heard?
67

Digital Investment
C10d. Estimate the PROPORTION of cloud and hosting providers that could deliver services to support the digital investment required for these strategies [Speed Time to Market], based either on your own knowledge or what you heard?
17%
15%
15%
14%
20%
12%
19%
54%
54%
58%
51%
50%
51%
50%
26%
30%
26%
33%
30%
33%
28%
3%Automate business processes (n=145)
Use data to drive strategic decision making (n=149)
Integrate customer feedback through communities or analytics(n=132)
Invest in research and development (n=133)
Improve production processes (n=189)
Encourage knowledge sharing & collaboration among employees(n=135)
Cultivate a culture of risk taking...to accelerate development(n=101)
0% 20% 40% 60% 80% 100%% of Respondents
Proportion of Providers Can Support Digital Investment to Speed Time to Market
None
Few
Many
All
68
Digital Investment
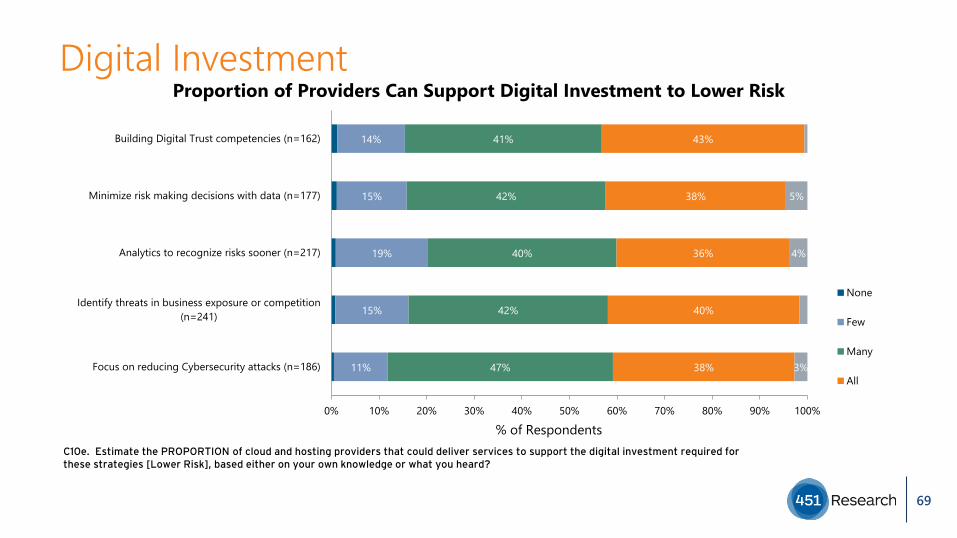
C10e. Estimate the PROPORTION of cloud and hosting providers that could deliver services to support the digital investment required for these strategies [Lower Risk], based either on your own knowledge or what you heard?
11%
15%
19%
15%
14%
47%
42%
40%
42%
41%
38%
40%
36%
38%
43%
3%
4%
5%
Focus on reducing Cybersecurity attacks (n=186)
Identify threats in business exposure or competition(n=241)
Analytics to recognize risks sooner (n=217)
Minimize risk making decisions with data (n=177)
Building Digital Trust competencies (n=162)
0% 10% 20% 30% 40% 50% 60% 70% 80% 90% 100%
% of Respondents
Proportion of Providers Can Support Digital Investment to Lower Risk
None
Few
Many
All
69
Digital Transformation
5% 5% 7% 5% 4%
41% 37%
49%47%
33%
49%
54% 58%44% 48%
65%
47%
Total (n=1738) NA (n=950) WE (n=330) APAC (n=316) LA (n=95) MEA (n=47)0%
10%
20%
30%
40%
50%
60%
70%
80%
90%
100%
% o
f Res
pond
ents
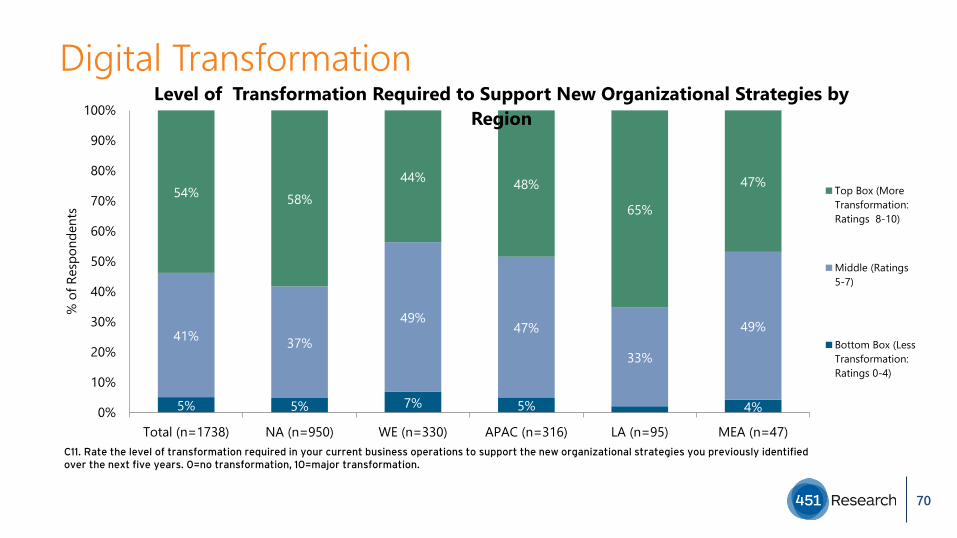
Level of Transformation Required to Support New Organizational Strategies by Region
Top Box (MoreTransformation:Ratings 8-10)
Middle (Ratings5-7)
Bottom Box (LessTransformation:Ratings 0-4)
C11. Rate the level of transformation required in your current business operations to support the new organizational strategies you previously identified over the next five years. 0=no transformation, 10=major transformation.
70

Digital Transformation
4% 4% 6% 4%
42% 37%
51%47%
41% 45%
54% 59%44% 50%
58% 53%
Total (n=1738) NA (n=950) WE (n=330) APAC (n=316) LA (n=95) MEA (n=47)0%
10%
20%
30%
40%
50%
60%
70%
80%
90%
100%
% o
f Res
pond
ents
Level of Transformation Required in Current IT/Digital Infrastructure Environment by Region
Top Box(MoreTransformation: Ratings 8-10)Middle(Ratings 5-7)
C12. Rate the level of transformation required in your current IT or digital infrastructure environment to support this level of business transformation over the next five years. 0=no transformation, 10=major transformation.
71

Digital Transformation
24% 22% 17%23%
58% 53%
35%32% 43%
40%
21% 34%
41% 46% 40% 37%
21%13%
Total (n=1738) NA (n=950) WE (n=330) APAC (n=316) LA (n=95) MEA (n=47)0%
10%
20%
30%
40%
50%
60%
70%
80%
90%
100%
% o
f Res
pond
ents
Digital Technology Disruption in Your Industry by Region
Top Box(Moredisruption:ratings 8-10)
Middle(Ratings 5-7)
C14. Rate the extent to which digital technology is disrupting your industry over the next 5 years on a 0 to 10 scale where 0 = no disruption and 10 = major disruption.
72

Digital Transformation
C15. What is the level of your organization's commitment to implementing digital/online operations for each of the following business functions? (Randomize) Rate on a scale of 0-10 where 0 = Not at all Committed and 10 = Completely Committed. [TOP BOX RATING OF 8-10]
67%
66%
64%
63%
73%
72%
71%
70%
54%
52%
51%
45%
60%
59%
54%
56%
78%
80%
68%
72%
66%
54%
49%
54%
0% 10% 20% 30% 40% 50% 60% 70% 80% 90% 100%
Customer service/support
Sales
Marketing
Automated internal businessworkflows
% TOP BOX (More Committed - ratings 8 thru 10)
Commitment to Implementing Digital/Online Operation by Region
Total (n=1502)
NA (n=844)
WE (n=271)
APAC (n=265)
LA (n=81)
MEA (n=41)
Note: ‘Straightline” responses removed.
73
Digital Transformation
74
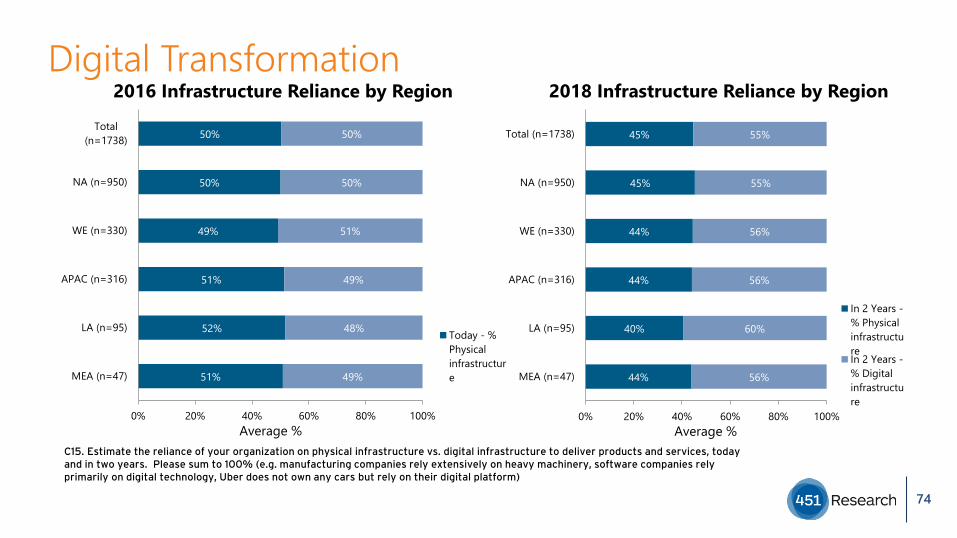
51%
52%
51%
49%
50%
50%
49%
48%
49%
51%
50%
50%
MEA (n=47)
LA (n=95)
APAC (n=316)
WE (n=330)
NA (n=950)
Total(n=1738)
0% 20% 40% 60% 80% 100%Average %
2016 Infrastructure Reliance by Region
Today - %Physicalinfrastructure
C15. Estimate the reliance of your organization on physical infrastructure vs. digital infrastructure to deliver products and services, today and in two years. Please sum to 100% (e.g. manufacturing companies rely extensively on heavy machinery, software companies relyprimarily on digital technology, Uber does not own any cars but rely on their digital platform)
44%
40%
44%
44%
45%
45%
56%
60%
56%
56%
55%
55%
MEA (n=47)
LA (n=95)
APAC (n=316)
WE (n=330)
NA (n=950)
Total (n=1738)
0% 20% 40% 60% 80% 100%Average %
2018 Infrastructure Reliance by Region
In 2 Years -% PhysicalinfrastructureIn 2 Years -% Digitalinfrastructure

Digital Transformation
C16c. How important are each of the following for your organization's digital innovation strategy over the next five years? Rate on a 0-10 scale where 0 = Not at all important and 10 = Extremely Important. (Randomize) [TOP BOX RATING OF 8-10]
72%
72%
65%
63%
79%
78%
72%
70%
62%
63%
50%
48%
62%
59%
57%
58%
81%
82%
81%
68%
74%
77%
49%
58%
0% 10% 20% 30% 40% 50% 60% 70% 80% 90% 100%
Engaging Customers
Optimizing Business Operations
Empowering employees
Transforming Products
% TOP BOX (More Important - ratings 8 thru 10)
Importance to Digital Innovation Strategy by Region
Total (n=1573)
NA (n=870)
WE (n=310)
APAC (n=278)
LA (n=72)
MEA (n=43)
Note: ‘Straightline” responses removed.
75
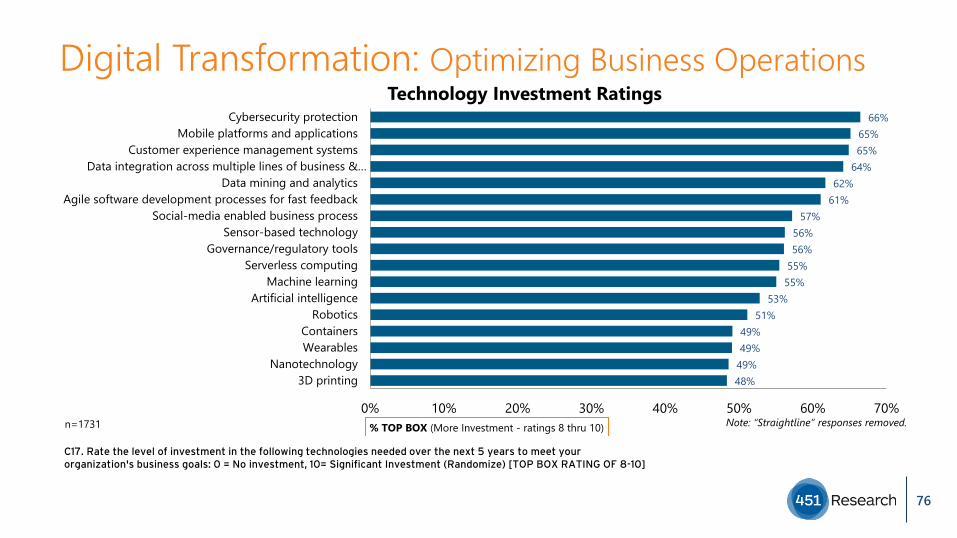
Digital Transformation: Optimizing Business Operations
C17. Rate the level of investment in the following technologies needed over the next 5 years to meet your organization's business goals: 0 = No investment, 10= Significant Investment (Randomize) [TOP BOX RATING OF 8-10]
66%65%65%
64%62%
61%57%
56%56%
55%55%
53%51%
49%49%
49%48%
0% 10% 20% 30% 40% 50% 60% 70%
Cybersecurity protectionMobile platforms and applications
Customer experience management systemsData integration across multiple lines of business &…
Data mining and analyticsAgile software development processes for fast feedback
Social-media enabled business processSensor-based technology
Governance/regulatory toolsServerless computing
Machine learningArtificial intelligence
RoboticsContainersWearables
Nanotechnology3D printing
% TOP BOX (More Investment - ratings 8 thru 10)
Technology Investment Ratings
Note: “Straightline” responses removed.n=1731
76

Digital Transformation: Digital Skills
C18. How capable are staff in the following groups at your organization in understanding how digital technologies could transform your business? 0=not at all capable, 10=very capable (Randomize) [TOP BOX RATING OF 8-10]
76%
68%
67%
62%
62%
59%
80%
75%
75%
71%
71%
66%
67%
55%
49%
43%
48%
45%
68%
59%
57%
53%
49%
51%
88%
72%
80%
78%
62%
53%
72%
57%
79%
60%
64%
62%
0% 10% 20% 30% 40% 50% 60% 70% 80% 90% 100%
IT
Security
Executive team
Line of Business
Support functions: HR, Finance
Legal
% TOP BOX (More Capable - ratings 8 thru 10)
Staff Capability to Understand Digital Technology Transformation by Region
Total(n=1639)NA (n=900)
WE (n=310)
APAC (n=297)
LA (n=85)
77

Digital Transformation: Digital Skills
54% 54% 51%61%
39%
57%
42% 42% 43%33%
58%
43%
5% 4% 6% 6% 3%
Total (n=1738) NA (n=950) WE (n=330) APAC (n=316) LA (n=95) MEA (n=47)0%
10%
20%
30%
40%
50%
60%
70%
80%
90%
100%
% o
f Res
pond
ents
Skill Shortage in Cloud Computing Expertise by Region
Don'tknow
No
C19. Does your organization currently face a skills shortage in cloud computing expertise?
78

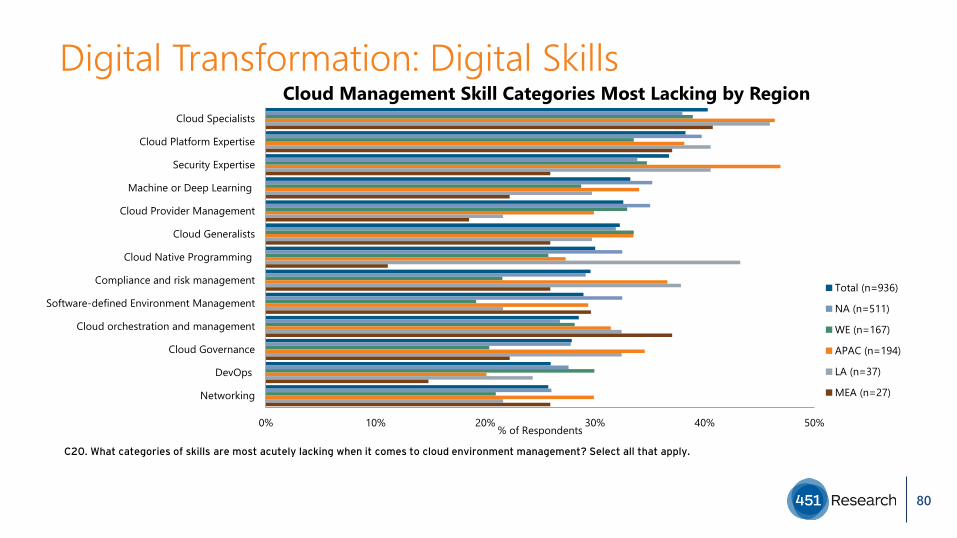
Digital Transformation: Digital Skills
C20. What categories of skills are most acutely lacking when it comes to cloud environment management? Select all that apply.
40%
38%
37%
33%
33%
32%
30%
30%
29%
29%
28%
26%
26%
0% 10% 20% 30% 40% 50%
Cloud Specialists
Cloud Platform Expertise
Security Expertise
Machine or Deep Learning
Cloud Provider Management
Cloud Generalists
Cloud Native Programming
Compliance and risk management
Software-defined Environment…
Cloud orchestration and management
Cloud Governance
DevOps
Networking
% of Respondents
Cloud Management Skill Categories Most Lacking
n=936
79
Digital Transformation: Digital Skills
C20. What categories of skills are most acutely lacking when it comes to cloud environment management? Select all that apply.
0% 10% 20% 30% 40% 50%
Cloud Specialists
Cloud Platform Expertise
Security Expertise
Machine or Deep Learning
Cloud Provider Management
Cloud Generalists
Cloud Native Programming
Compliance and risk management
Software-defined Environment Management
Cloud orchestration and management
Cloud Governance
DevOps
Networking
% of Respondents
Cloud Management Skill Categories Most Lacking by Region
Total (n=936)
NA (n=511)
WE (n=167)
APAC (n=194)
LA (n=37)
MEA (n=27)
80

Digital Transformation: Digital Skills
45% 45% 42%55%
33%21%
50% 50% 54%41%
63%70%
5% 5% 4% 4% 4% 9%
Total (n=1738) NA (n=950) WE (n=330) APAC (n=316) LA (n=95) MEA (n=47)0%
10%
20%
30%
40%
50%
60%
70%
80%
90%
100%
% o
f Res
pond
ents
Lack of Skillset Impeding Digital Transformation Initiatives by Region
Don'tKnow
No
C22. Is there a lack of skillsets in cloud impeding digital transformation initiatives at your organization?
81

Digital Transformation: Digital Culture
4% 3% 3% 8% 3% 6%
33%29%
40%41%
32%36%
63% 69%57%
50%65%
57%
Total (n=1738) NA (n=950) WE (n=330) APAC (n=316) LA (n=95) MEA (n=47)0%
10%
20%
30%
40%
50%
60%
70%
80%
90%
100%
% o
f Res
pond
ents
Level of Agreement by Region
Top Box(More Agree:Ratings 8-10)
Middle(Ratings 5-7)
Our organization has a clear strategy to evolve our digital business
C23. Please rate your level of agreement with this statement where 0=completely disagree, 10=completely agree. Our organization has a clear strategy to evolve our digital business environment over the next five years.
82

Digital Transformation: Digital Culture
C24. Which of the following best describes the key digital transformation leader in your organization, if any?
5%
26%
20%
26%
7%
6%
3%
3%
4%
0% 10% 20% 30% 40%
None: we do not have a digital transfrmtn…
Chief Executive Officer (CEO)
Chief Information Officer (CIO)
Chief Technology Officer (CTO)
Chief Operating Officer (COO)
Chief Digital Officer
Chief Security Officer
Head of Sales
Chief Marketing Officer
% of Respondents
Staff Capability to Understand Digital Technology Transformation by Region
Total (n=1738)
NA (n=950)
WE (n=330)
APAC (n=316)
LA (n=95)
MEA (n=47)
83
DIGITAL TRANSFORMATION CASE STUDY (T)

Digital Transformation
QT1: Is your organization currently undertaking a significant digital transformation project?QT1a: Has your organization completed a significant digital transformation project within the past year?QT1b: Is your organization planning a significant digital transformation project within the next year?
83%
72%
68%
64%
69%
69%
0% 10% 20% 30% 40% 50% 60% 70% 80% 90% 100%
LA (n=95)
APAC (n=316)
MEA (n=47)
WE (n=330)
NA (n=950)
Total (n=1738)
UndertakingDigitalTransformation - Active
DigitalTransformation - PlansWithin NextYear
85
Digital Transformation
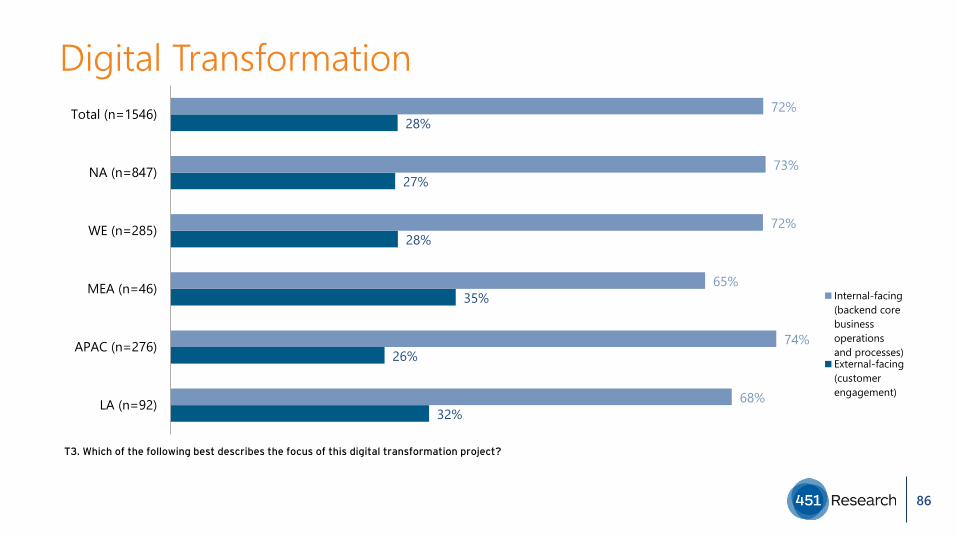
T3. Which of the following best describes the focus of this digital transformation project?
32%
26%
35%
28%
27%
28%
68%
74%
65%
72%
73%
72%
LA (n=92)
APAC (n=276)
MEA (n=46)
WE (n=285)
NA (n=847)
Total (n=1546)
Internal-facing(backend corebusinessoperationsand processes)External-facing(customerengagement)
86

Digital Transformation
T4. What is the primary business purpose of this digital transformation project?
37%
28%
50%
21%
28%
28%
0% 10% 20% 30% 40% 50% 60%
LA (n=92)
APAC (n=276)
MEA (n=46)
WE (n=285)
NA (n=847)
Total (n=1546)
Expand the Business (EnterNew Markets/Lines ofBusiness, Develop NewProducts/Services)Grow the Business (IncreaseRevenue from ExistingBusiness/Products)
Run the Business (OptimizeBusiness Operations)
87

Digital Transformation
T5. Which business processes are being transformed as part of this digital transformation project?
15%
24%
30%
34%
38%
38%
41…
44%
72%
0% 10% 20% 30% 40% 50% 60% 70% 80% 90%
Sales
Customerservice/support
Marketing
Finance
Legal
Human Resources
Line of businessoperations
IT
Productdevelopment/R&D
Total(n=1546)NA (n=847)
WE (n=285)
MEA (n=46)
APAC(n=276)
88

Digital Transformation
T6. At what stage of the digital transformation project was IT brought in?
34%
35%
35%
38%
43%
0% 10% 20% 30% 40% 50% 60% 70%
Infrastructure
Applications/Software
Managed Services
Security Services
Professional Services for CloudEnablement
Total(n=1546)NA (n=847)
WE (n=285)
MEA (n=46)
APAC(n=276)
89

Digital Transformation – IT Service Providers
T7. Please rate the strategic importance of IT service providers for this digital transformation project. [% TOP BOX RATING (More Strategic 8 thru 10)]
77%
61%
63%
60%
71%
67%
LA (n=92)
APAC(n=276)
MEA (n=46)
WE (n=285)
NA (n=847)
Total(n=1546)
90
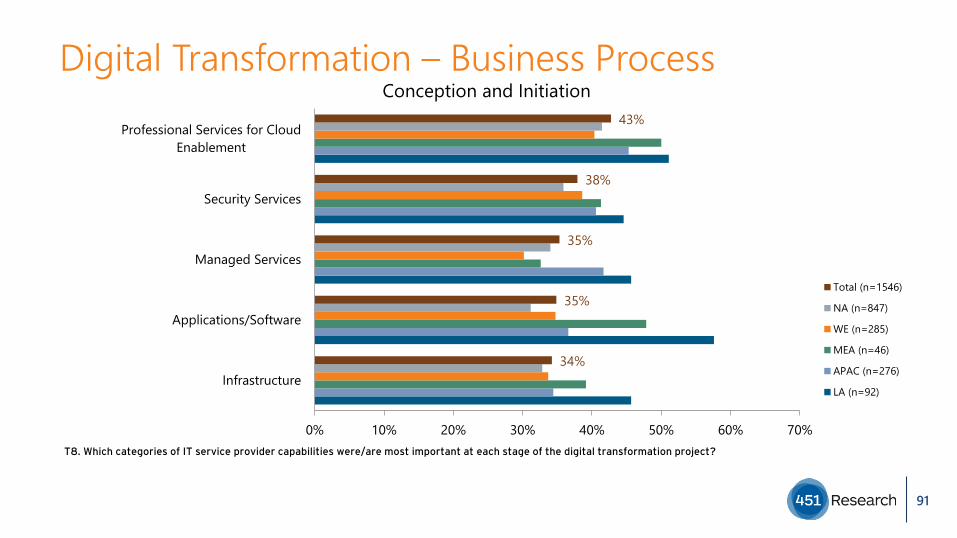
Digital Transformation – Business Process
T8. Which categories of IT service provider capabilities were/are most important at each stage of the digital transformation project?
34%
35%
35%
38%
43%
0% 10% 20% 30% 40% 50% 60% 70%
Infrastructure
Applications/Software
Managed Services
Security Services
Professional Services for CloudEnablement
Conception and Initiation
Total (n=1546)
NA (n=847)
WE (n=285)
MEA (n=46)
APAC (n=276)
LA (n=92)
91

Digital Transformation – Business Process
T8. Which categories of IT service provider capabilities were/are most important at each stage of the digital transformation project?
33%
34%
36%
37%
38%
0% 10% 20% 30% 40% 50% 60%
Infrastructure
Applications/Software
Managed Services
Security Services
Professional Services for CloudEnablement
Scoping and Planning
Total (n=1546)
NA (n=847)
WE (n=285)
MEA (n=46)
APAC (n=276)
LA (n=92)
92

Digital Transformation – Business Process
T8. Which categories of IT service provider capabilities were/are most important at each stage of the digital transformation project?
34%
35%
37%
38%
43%
0% 10% 20% 30% 40% 50% 60%
Infrastructure
Applications/Software
Managed Services
Security Services
Professional Services for CloudEnablement
Launch/Execution
Total (n=1546)
NA (n=847)
WE (n=285)
MEA (n=46)
APAC (n=276)
LA (n=92)
93

Digital Transformation – Business Process
T8. Which categories of IT service provider capabilities were/are most important at each stage of the digital transformation project?
32%
33%
34%
37%
39%
0% 10% 20% 30% 40% 50% 60%
Infrastructure
Applications/Software
Managed Services
Security Services
Professional Services for CloudEnablement
Evaluation of Results
Total (n=1546)
NA (n=847)
WE (n=285)
MEA (n=46)
APAC (n=276)
LA (n=92)
94
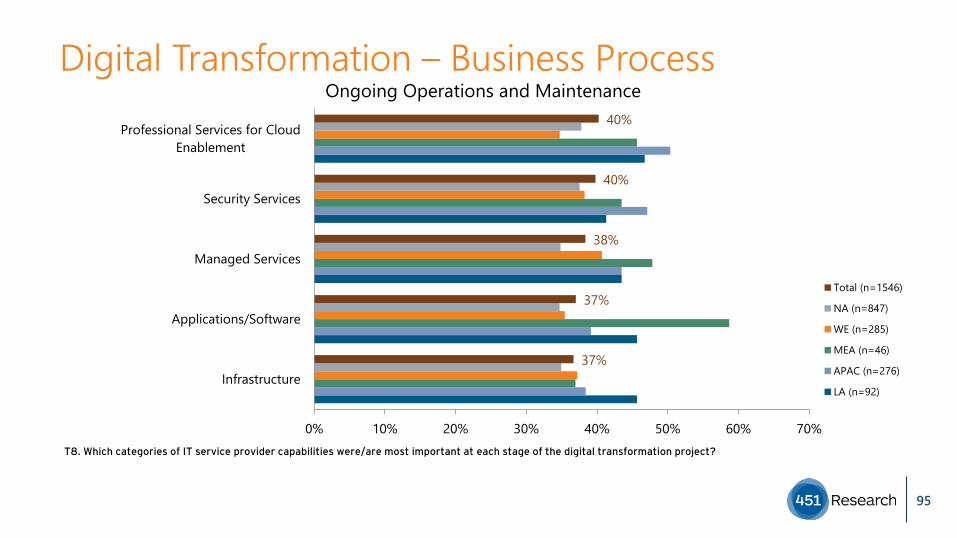
Digital Transformation – Business Process
T8. Which categories of IT service provider capabilities were/are most important at each stage of the digital transformation project?
37%
37%
38%
40%
40%
0% 10% 20% 30% 40% 50% 60% 70%
Infrastructure
Applications/Software
Managed Services
Security Services
Professional Services for CloudEnablement
Ongoing Operations and Maintenance
Total (n=1546)
NA (n=847)
WE (n=285)
MEA (n=46)
APAC (n=276)
LA (n=92)
95
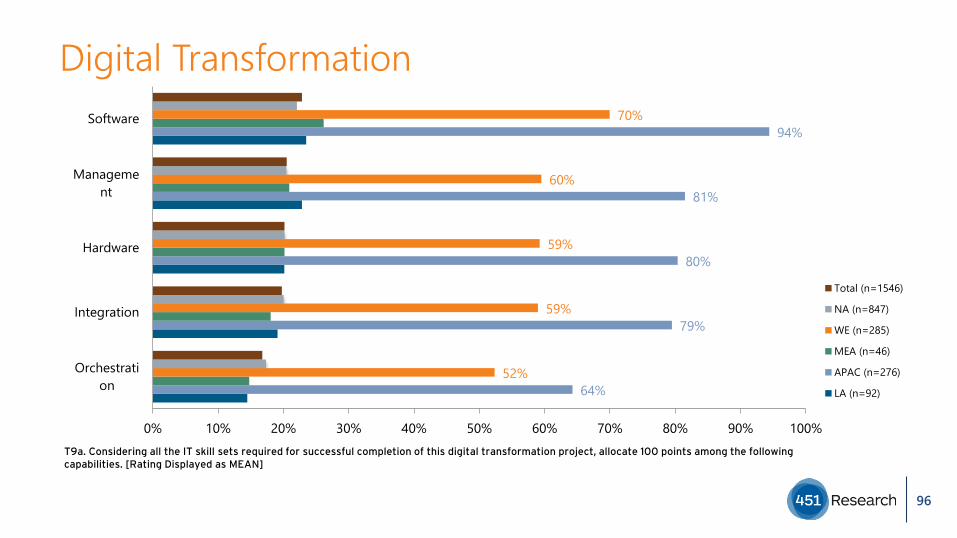
Digital Transformation
T9a. Considering all the IT skill sets required for successful completion of this digital transformation project, allocate 100 points among the following capabilities. [Rating Displayed as MEAN]
64%
79%
80%
81%
94%
52%
59%
59%
60%
70%
0% 10% 20% 30% 40% 50% 60% 70% 80% 90% 100%
Orchestration
Integration
Hardware
Management
Software
Total (n=1546)
NA (n=847)
WE (n=285)
MEA (n=46)
APAC (n=276)
LA (n=92)
96
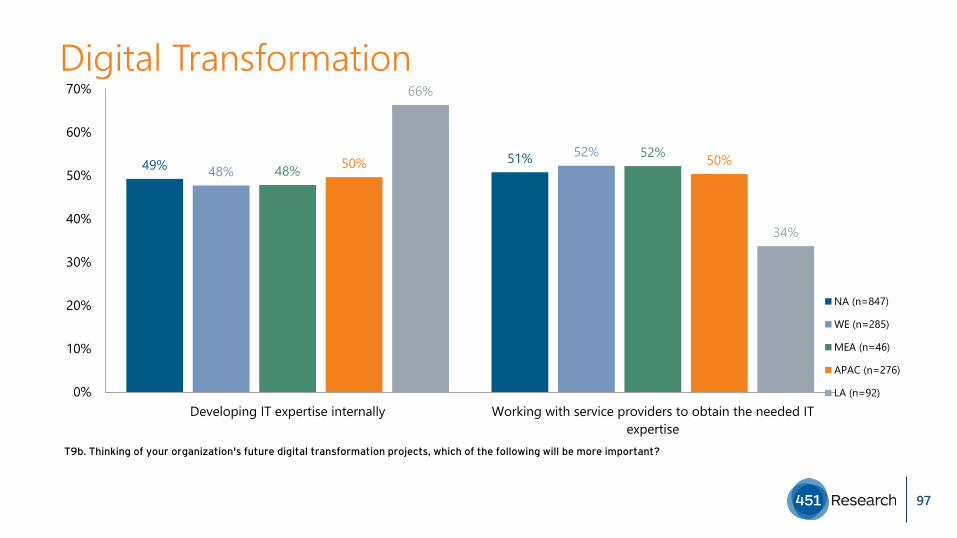
Digital Transformation
T9b. Thinking of your organization's future digital transformation projects, which of the following will be more important?
49% 51%48%
52%48%
52%50% 50%
66%
34%
0%
10%
20%
30%
40%
50%
60%
70%
Developing IT expertise internally Working with service providers to obtain the needed ITexpertise
NA (n=847)
WE (n=285)
MEA (n=46)
APAC (n=276)
LA (n=92)
97

Hosting/Cloud Service Providers
T10. Which of the following best describes your organization's approach to dealing with hosting/cloud service providers to obtain the IT services needed for digital transformation projects?
27%
34%
36%
0% 10% 20% 30% 40% 50% 60%
Single provider that can offer a broad range of products andservices that it builds and manages
Single provider that can source and manage multipleproducts and services from partnerships it has with other
providers/
Individual best-of-breed services purchased from multipleproviders that we implement and manage ourselves
Total (n=773)
NA (n=430)
WE (n=149)
MEA (n=24)
APAC (n=139)
LA (n=31)
98

Primary Hosting / Cloud Service Provider
T12. Does your organization's primary hosting/cloud service provider currently have the partners and partner relationships needed to help your organization on its digital transformation journey?
13%
13%
8%
17%
14%
14%
77%
82%
75%
75%
80%
79%
0% 10% 20% 30% 40% 50% 60% 70% 80% 90%
LA (n=31)
APAC(n=139)
MEA (n=24)
WE (n=149)
NA (n=430)
Total (n=773)
Yes
No
99

MANAGED SERVICES PARTNERING (P)

Hosting / Cloud Service Provider
P1. Do you know if your organization's primary hosting/cloud service provider partners with any other providers to deliver the services you procure from them?
18%
23%
11%
22%
24%
23%
64%
66%
81%
59%
65%
64%
0% 10% 20% 30% 40% 50% 60% 70% 80% 90%
LA (n=95)
AP$AC$ (n=316)
MEA (n=47)
WE (n=330)
NA (n=950)
Total (n=1738)
Yes
No
101

Types of Partners
P2. Which of the following best describes the type(s) of partner(s) that is your organization's primary hosting/cloud service provider works with?
26%
29%
30%
32%
32%
39%
40%
41%
41%
0% 10% 20% 30% 40% 50% 60% 70%
Cloud Broker
Value $Ad$ded Reseller (VAR)
Consulting/Outsourcing/Systems Integrator
Telecommunications Provider
Independent Software Vendor (ISV)
Infrastructure Hardware Vendor/OEM
Cloud Enablement and Man$Ag$ement Specialist
Infrastructure as a Service (IaaS)/Public CloudProvider
Security Service Provider
Total (n=1117)
NA (n=614)
WE (n=195)
MEA (n=38)
AP$AC$(n=209)LA (n=61)
102
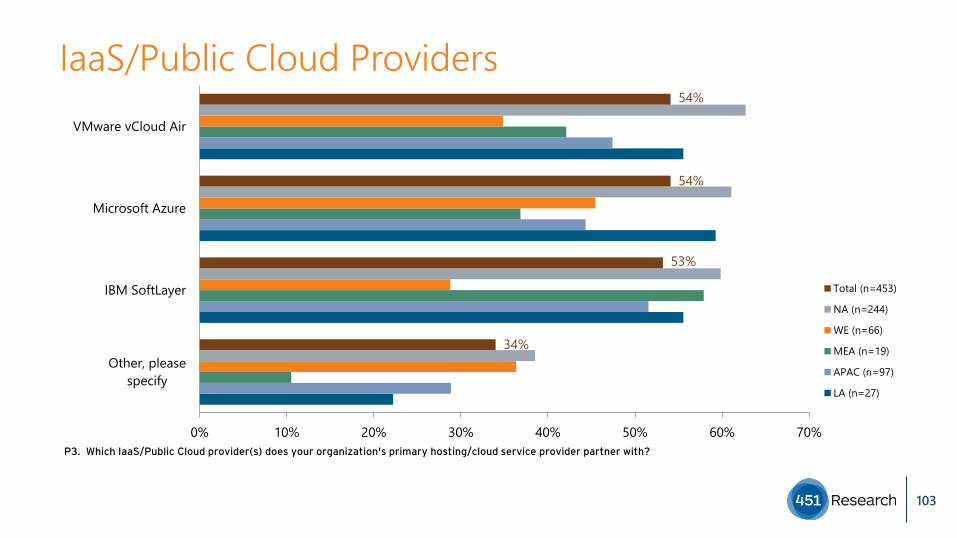
IaaS/Public Cloud Providers
P3. Which IaaS/Public Cloud provider(s) does your organization's primary hosting/cloud service provider partner with?
34%
53%
54%
54%
0% 10% 20% 30% 40% 50% 60% 70%
Other, pleasespecify
IBM SoftLayer
Microsoft Azure
VMware vCloud Air
Total (n=453)
NA (n=244)
WE (n=66)
MEA (n=19)
APAC (n=97)
LA (n=27)
103
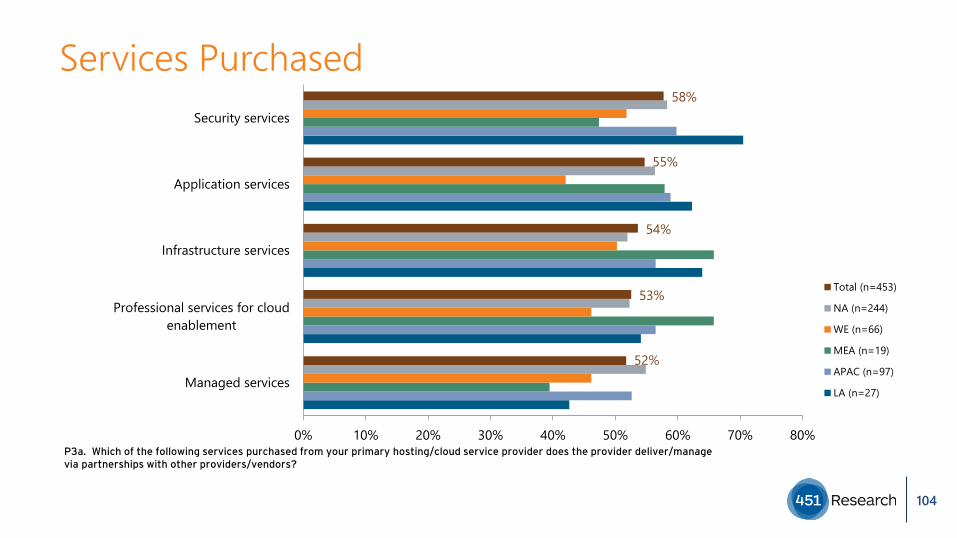
Services Purchased
P3a. Which of the following services purchased from your primary hosting/cloud service provider does the provider deliver/manage via partnerships with other providers/vendors?
52%
53%
54%
55%
58%
0% 10% 20% 30% 40% 50% 60% 70% 80%
Managed services
Professional services for cloudenablement
Infrastructure services
Application services
Security services
Total (n=453)
NA (n=244)
WE (n=66)
MEA (n=19)
APAC (n=97)
LA (n=27)
104
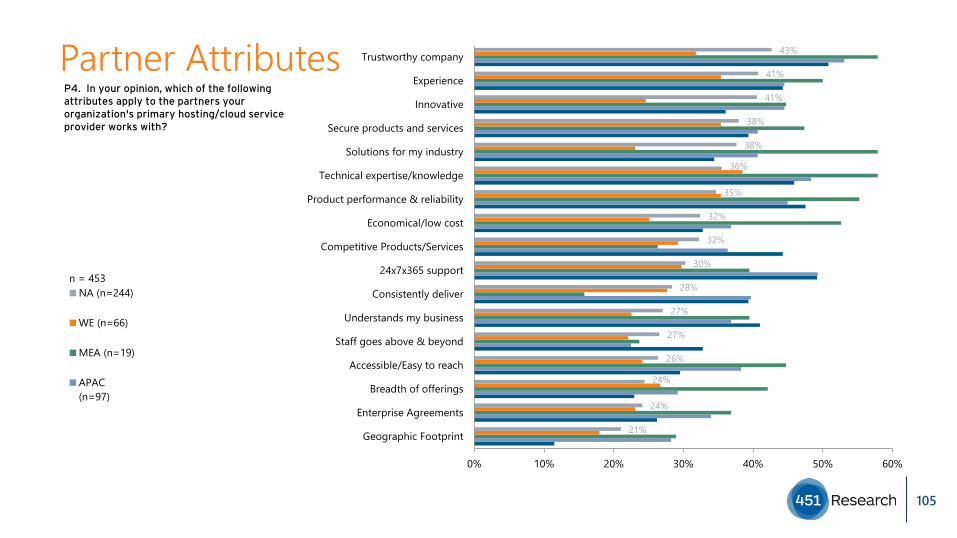
Partner AttributesP4. In your opinion, which of the following attributes apply to the partners your organization's primary hosting/cloud service provider works with?
21%
24%
24%
26%
27%
27%
28%
30%
32%
32%
35%
36%
38%
38%
41%
41%
43%
0% 10% 20% 30% 40% 50% 60%
Geographic Footprint
Enterprise Agreements
Breadth of offerings
Accessible/Easy to reach
Staff goes above & beyond
Understands my business
Consistently deliver
24x7x365 support
Competitive Products/Services
Economical/low cost
Product performance & reliability
Technical expertise/knowledge
Solutions for my industry
Secure products and services
Innovative
Experience
Trustworthy company
NA (n=244)
WE (n=66)
MEA (n=19)
APAC(n=97)
n = 453
105

CLOUD/HOSTING SERVICES AND IMPACT ON BUSINESS GOALS (X)

Digital Transformation - Managed Services
X1. Thinking about the managed services you are currently using / planning to use, rate the impact of these services on your organization’s ability to do the following. Use a 0 to 10 scale where 0 = No Impact and 10 = Significant Impact. [% TOP BOX RATING (Most Impactful 8 thru 10)]
63%
64%
66%
71%
0% 10% 20% 30% 40% 50% 60% 70% 80% 90%
Empower youremployees
Transform yourproducts
Engage your customers
Optimize youroperations
Total (n=1707)
NA (n=936)
WE (n=321)
MEA (n=47)
APAC (n=309)
LA (n=95)
107

Digital Transformation – Business Goals
X2. Still thinking about the managed services you are currently using or planning to use rate the role of these services have/had in accomplishing the following business goals, using a 0 to 10 scale where 0 = Not at All Important and 10 = Extremely Important.[% TOP BOX RATING (Most Important 8 thru 10)]
68%
67…
67%
73%
74%
0% 10% 20% 30% 40% 50% 60% 70% 80% 90%
Lower costs
Speed time to market
Lower risk
Increase revenue
Improve product or servicequality
Total (n=1707)
NA (n=936)
WE (n=321)
MEA (n=47)
APAC (n=309)
LA (n=95)
108
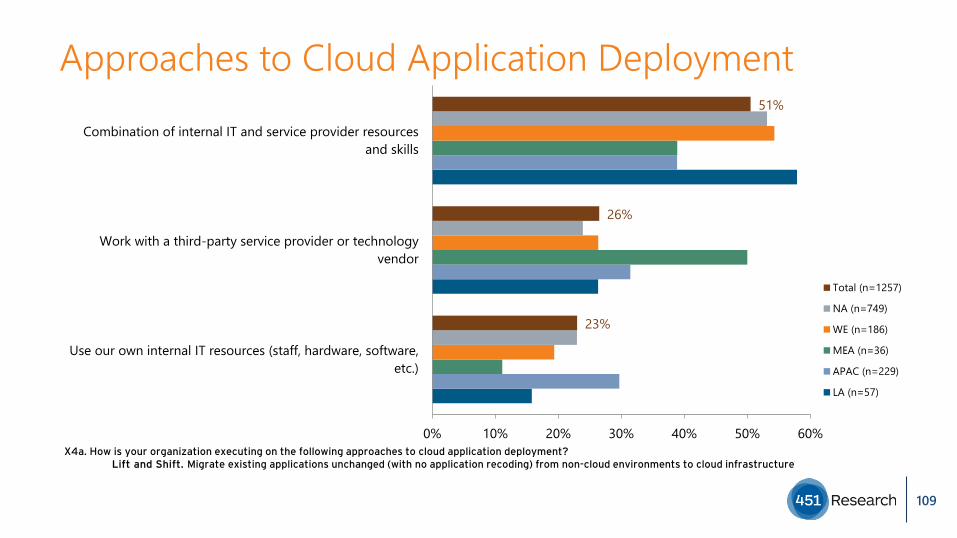
Approaches to Cloud Application Deployment
X4a. How is your organization executing on the following approaches to cloud application deployment?Lift and Shift. Migrate existing applications unchanged (with no application recoding) from non-cloud environments to cloud infrastructure
23%
26%
51%
0% 10% 20% 30% 40% 50% 60%
Use our own internal IT resources (staff, hardware, software,etc.)
Work with a third-party service provider or technologyvendor
Combination of internal IT and service provider resourcesand skills
Total (n=1257)
NA (n=749)
WE (n=186)
MEA (n=36)
APAC (n=229)
LA (n=57)
109

Approaches to Cloud Application Deployment
X4b. How is your organization executing on the following approaches to cloud application deployment?Refactor and Shift. Modernize existing applications by moving them to cloud hosted or SaaSenvironments (show only if X3b today or 2 years from now > 0%)
22%
29%
50%
0% 10% 20% 30% 40% 50% 60%
Use our own internal IT resources (staff, hardware,software, etc.)
Work with a third-party service provider or technologyvendor
Combination of internal IT and service providerresources and skills
Total (n=1255)
NA (n=747)
WE (n=186)
MEA (n=36)
APAC (n=230)
LA (n=56)
110
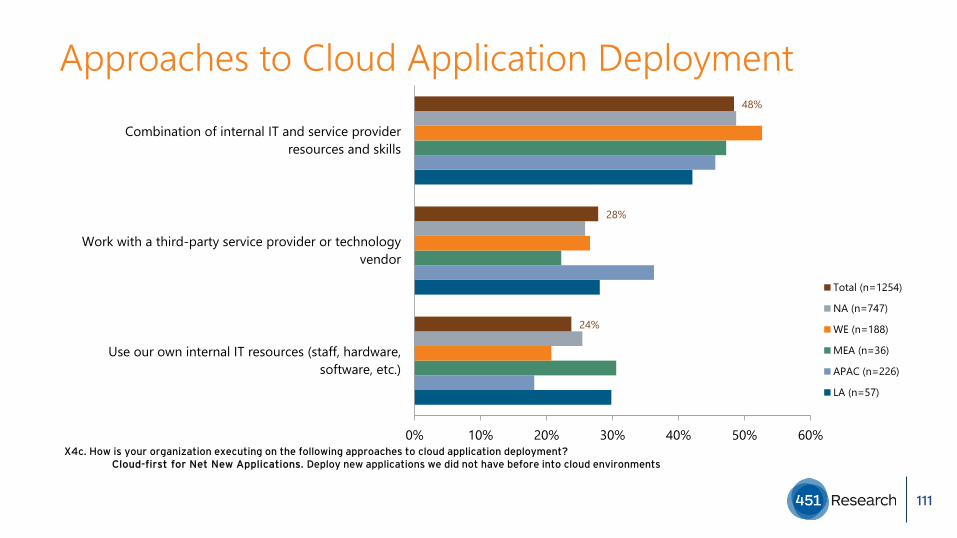
Approaches to Cloud Application Deployment
X4c. How is your organization executing on the following approaches to cloud application deployment?Cloud-first for Net New Applications. Deploy new applications we did not have before into cloud environments
24%
28%
48%
0% 10% 20% 30% 40% 50% 60%
Use our own internal IT resources (staff, hardware,software, etc.)
Work with a third-party service provider or technologyvendor
Combination of internal IT and service providerresources and skills
Total (n=1254)
NA (n=747)
WE (n=188)
MEA (n=36)
APAC (n=226)
LA (n=57)
111
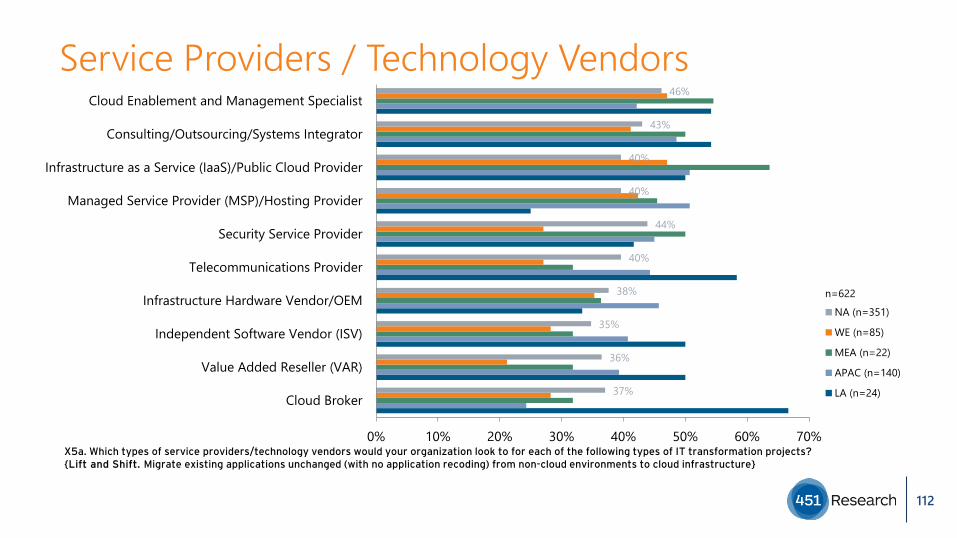
37%
36%
35%
38%
40%
44%
40%
40%
43%
46%
0% 10% 20% 30% 40% 50% 60% 70%
Cloud Broker
Value Added Reseller (VAR)
Independent Software Vendor (ISV)
Infrastructure Hardware Vendor/OEM
Telecommunications Provider
Security Service Provider
Managed Service Provider (MSP)/Hosting Provider
Infrastructure as a Service (IaaS)/Public Cloud Provider
Consulting/Outsourcing/Systems Integrator
Cloud Enablement and Management Specialist
NA (n=351)
WE (n=85)
MEA (n=22)
APAC (n=140)
LA (n=24)
Service Providers / Technology Vendors
X5a. Which types of service providers/technology vendors would your organization look to for each of the following types of IT transformation projects? {Lift and Shift. Migrate existing applications unchanged (with no application recoding) from non-cloud environments to cloud infrastructure}
n=622
112

Service Providers / Technology Vendors
X5b. Which types of service providers/technology vendors would your organization look to for each of the following types of IT transformation projects? {Refactor and Shift. Modernize existing applications by moving them to cloud hosted or SaaS environments}
43%
42%
41%
45%
44%
45%
44%
44%
44%
46%
0% 20% 40% 60% 80%
Infrastructure as a Service (IaaS)/Public Cloud…
Managed Service Provider (MSP)/Hosting Provider
Value Added Reseller (VAR)
Consulting/Outsourcing/Systems Integrator
Cloud Enablement and Management Specialist
Cloud Broker
Infrastructure Hardware Vendor/OEM
Independent Software Vendor (ISV)
Telecommunications Provider
Security Service Provider
NA (n=590)
WE (n=145)
MEA (n=26)
APAC (n=185)
LA (n=69)
n=982
113

36%
39%
38%
39%
39%
38%
40%
41%
45%
47%
0% 10% 20% 30% 40% 50% 60% 70%
Telecommunications Provider
Independent Software Vendor (ISV)
Cloud Broker
Infrastructure Hardware Vendor/OEM
Value Added Reseller (VAR)
Consulting/Outsourcing/Systems Integrator
Security Service Provider
Infrastructure as a Service (IaaS)/Public Cloud Provider
Managed Service Provider (MSP)/Hosting Provider
Cloud Enablement and Management Specialist
NA (n=557)
WE (n=149)
MEA (n=25)
APAC (n=185)
LA (n=40)
Service Providers / Technology Vendors
X5c. Which types of service providers/technology vendors would your organization look to for each of the following types of IT transformation projects? {Cloud-first for Net New Applications. Deploy new applications we did not have before into cloud environments}
n=557
114

DEPENDENT VARIABLES/CROSS TAB QUESTIONS (V)
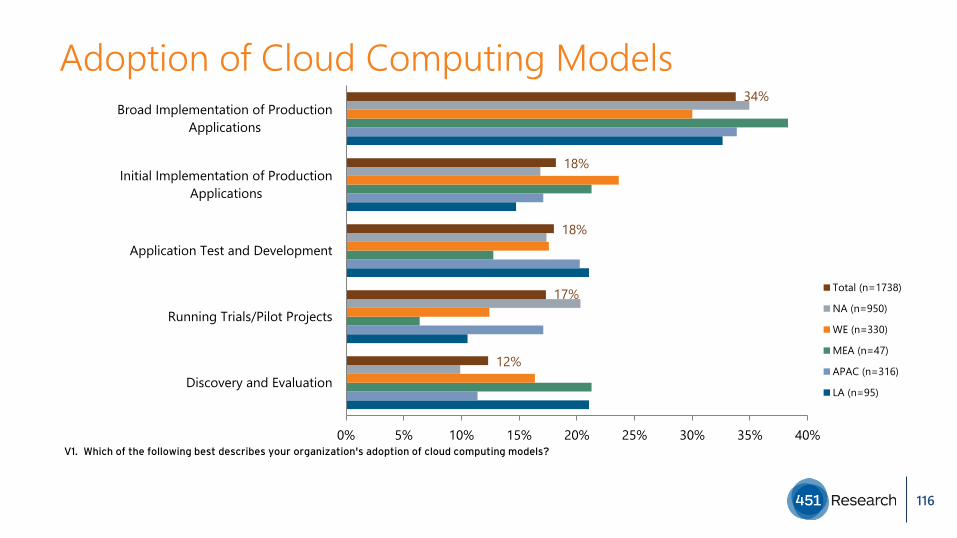
Adoption of Cloud Computing Models
V1. Which of the following best describes your organization's adoption of cloud computing models?
12%
17%
18%
18%
34%
0% 5% 10% 15% 20% 25% 30% 35% 40%
Discovery and Evaluation
Running Trials/Pilot Projects
Application Test and Development
Initial Implementation of ProductionApplications
Broad Implementation of ProductionApplications
Total (n=1738)
NA (n=950)
WE (n=330)
MEA (n=47)
APAC (n=316)
LA (n=95)
116

DEMOGRAPHICS (D)
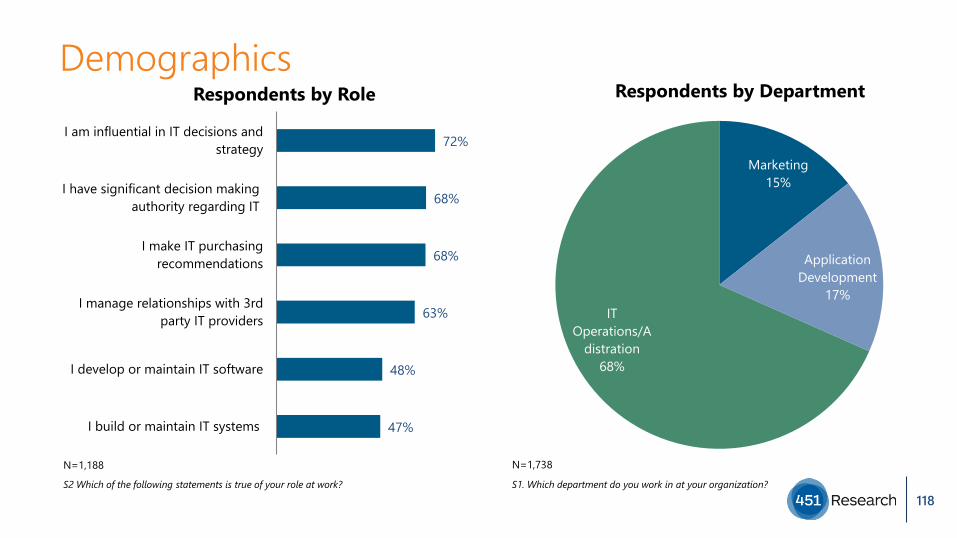
Marketing15%
Application Development
17%IT
Operations/Adistration
68%
Respondents by Department
47%
48%
63%
68%
68%
72%
I build or maintain IT systems
I develop or maintain IT software
I manage relationships with 3rdparty IT providers
I make IT purchasingrecommendations
I have significant decision makingauthority regarding IT
I am influential in IT decisions andstrategy
Respondents by Role
N=1,188
S2 Which of the following statements is true of your role at work?
Demographics
S1. Which department do you work in at your organization?
N=1,738
118
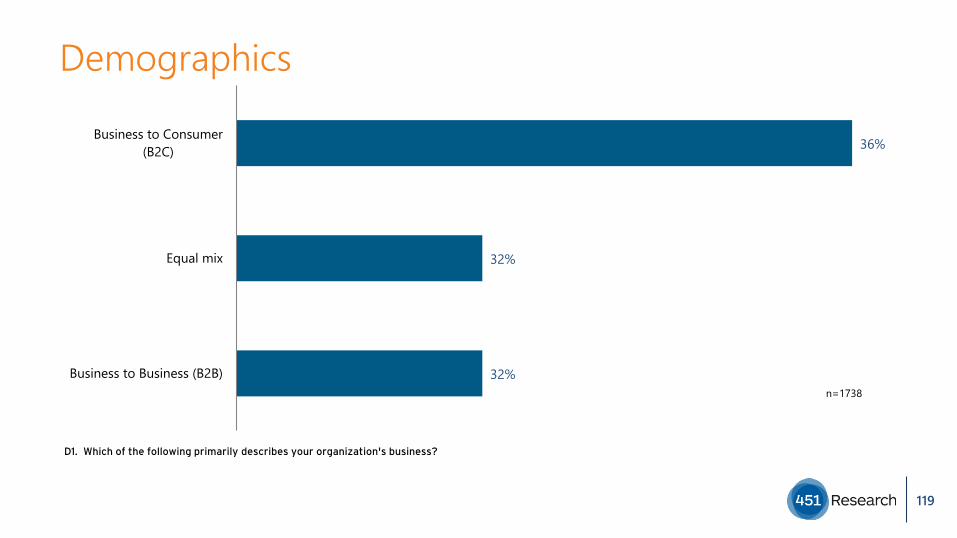
Demographics
D1. Which of the following primarily describes your organization's business?
32%
32%
36%
Business to Business (B2B)
Equal mix
Business to Consumer(B2C)
n=1738
119

Demographics
D2. Which of the following best describes your organization's approach to NEW technology adoption?
1%
16%
36%
46%
We are skeptical and are usually late to the game
We are conservative about new technology and take a wait and seeapproach
We are early adopters on the leading edge
We are pragmatic about new technology, but will act sooner rather thanlater
n=1738
120

Demographics
D3. How long has your company been in business?
3%
16%
29%
34%
19%
1-1.9 years
2-4.9 years
5-9.9 years
10-24.9years
25+ years
n=1738
121

Demographics
D5. What is your total IT budget for 2017? This includes all capex and opex spend on staffing, hardware, software and IT services and providers?
6%
13%
14%
25%
20%
15%
6%
<$100,000
$100,000 to less than $500,000
$500,000 to less than $1 million
$1 million to less than $5million
$5 million to less than $10million
$10 million to less than $50million
$50 million+
n=1738
122

Demographics
D6a. Please indicate how your total IT budget will change in 2 years.
5%
16%
79%
Decrease
Stay theSame
Increase
n=1738
123

Demographics
QD8. Which of the following categories best describes your organization's total annual revenue in 2016?
5%
16%
79%
Decrease
Stay theSame
Increase
n=1738
124

Demographics
QD9. Approximately how much does your organization spend with all of your hosting/cloud providers on a monthly basis?
7%
2%
7%
6%
10%
9%
12%
13%
13%
9%
7%
5%
Don't Know
<$100/month
$100-499/month
$500-999/month
$1,000-1,999/month
$2,000-2,499/month
$2,500-4,999/month
$5,000-9,999/month
$10,000-…
$25000-…
$50,000-…
$100,000+/month
n=1738
125

Demographics
D10. Which of the following best matches your role in the organization?
1%
9%
11%
21%
25%
33%
Other, pleasespecify
VP
Supervisor
Director
C-Level
Manager
n=1738
126