2017 M&A Global Outlook - J.P. Morgan · PDF filePublished by J.P. Morgan’s M&A team in...
24
2017 M&A Global Outlook Finding opportunities in a dynamic market
Transcript of 2017 M&A Global Outlook - J.P. Morgan · PDF filePublished by J.P. Morgan’s M&A team in...

2017 M&A Global OutlookFinding opportunities in a dynamic market

Published by J.P. Morgan’s M&A team in January 2017
Global
Hernan Cristerna Global Co-Head of M&A E: [email protected] T: +44 20 7134 4631
Kurt Simon Global Chairman of M&A E: [email protected] T: +1 212 622 9882
Chris Ventresca Global Co-Head of M&A E: [email protected] T: +1 212 622 2228
North America
Anu Aiyengar Regional Head of M&A E: [email protected] T: +1 212 622 2260
Europe, Middle East and Africa
Dirk Albersmeier Regional Co-Head of M&A E: [email protected] T: +44 20 7742 4461
David Lomer Regional Co-Head of M&A E: [email protected] T: +44 20 7134 9798
Asia Pacific
Brian Gu Regional Co-Head of M&A E: [email protected] T: +852 2800 6811
John Hall Regional Co-Head of M&A E: [email protected] T: +852 2800 6606
Latin America
Ignacio Benito Regional Head of M&A E: [email protected] T: +1 212 622 2459

2017 M&A GLOBAL OUTLOOK | 1
ContentsExecutive summary 2
2016 — A year in review 2
2017 — The year ahead 4
1. An active M&A market continues 5
2. The impact of regulatory uncertainty and potential reform 8
A new administration in the U.S. 8
Brexit takes shape 8
Increased scrutiny in China 8
Withdrawn deals in 2016 9
3. Cross-border transactions will remain important 10
Impact of Brexit on U.K. cross-border M&A flows 10
The evolution of China outbound interest 11
The importance of Japan cross-border activity 11
4. Activism: What’s ahead in 2017? 13
The evolution of institutional investor involvement in activism 13
The changing regulatory environment for activists 14
Continued globalization of shareholder activism 14
About J.P. Morgan M&A advisory solutions 16
Select J.P. Morgan-advised M&A transactions in 2016 17
Please note: Use of this material is subject to the important disclaimers set out on the inside back cover.

2 | 2017 M&A GLOBAL OUTLOOK
Executive summary
2016 — A year in reviewThe global M&A market demonstrated its resilience in 2016, posting volumes of $3.9 trillion, in line with the third best year on record. Much has been made of the year’s challenges, including the highest withdrawn deal volume since 2008 and an 18% year-over-year decline in M&A dollar volume. The latter was impacted by a 39% decrease in megadeals of more than $10 billion, while deals greater than $250 million dropped by a more modest 6% year-over-year. 2016 was nevertheless a vibrant year for M&A, where deal volumes and deal count endured amid substantial global uncertainty (geopolitical changes, heightened regulatory scrutiny and speculation around both Brexit and China). Notwithstanding all of these pressures, the market remained dynamic and a source of encouragement for dealmaking in 2017, particularly if the various sources of uncertainty subside.
Despite challenges, a number of positive fundamentals shaped 2016 as companies sought to complement organic growth with acquisitions to access new regions, products and know-how, while benefiting from continued low cost of funding. Acquirers across the globe leveraged strategic combinations to expand both their geographic reach and innovation capabilities, such as proposed transactions that include Qualcomm’s acquisition of NXP Semiconductors, ChemChina’s acquisition of Syngenta, London Stock Exchange’s merger with Deutsche Boerse Group and AT&T’s acquisition of Time Warner.
Cross-border M&A remained an important feature of the market, accounting for 36% of total volume versus 31% in 2015. A surge in China outbound deal volumes contributed to overall cross-border M&A growth, as Chinese companies sought attractive opportunities abroad. China outbound activity into the U.S. and EMEA increased by 471% and 252% year-over-year, respectively.
Additionally, market reception to the announcement of significant transactions in 2016, which acquirers have seen positively reflected in their stock prices, was another encouraging sign for the deal environment after facing some more negative price reactions in the second half of 2015.
Exhibit 1
China outbound M&A volume, 2016 versus 2015 ($bn)
68.2
U.S. EMEA
11.9
2015 2016 2015 2016
20.4
23.7
10.0
9.05.1
33.39.015.04.7 4.6
116.8
8.6
46.9
38.2
15.47.73.33.9 4.7
< $250mm $250mm < 1bn $1bn < 5bn $5bn < 10bn > $10bn−
+471%+110%
+252%
ChemChina/Syngenta deal
Source: Dealogic as of December 31, 2016; M&A volumes are rounded to the nearest decimal
Note: M&A market data source: Dealogic, unless otherwise noted
2017 M&A GLOBAL OUTLOOK | 3
1 Withdrawn deal volume reflects deals greater than $10 million
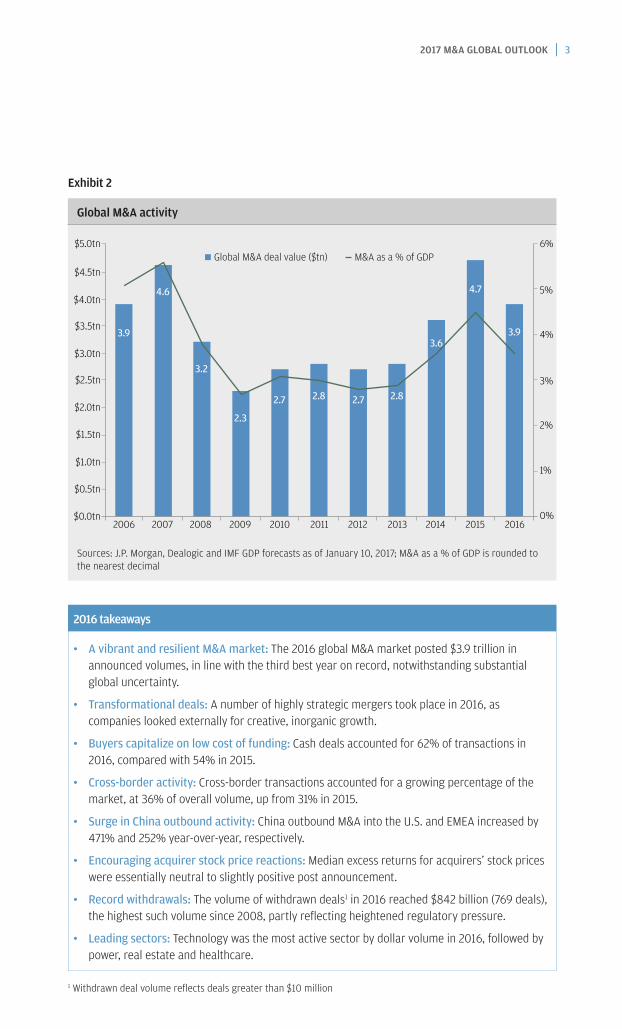
Exhibit 2
Global M&A activity
$5.0tn 6%
5%
4%
3%
2%
1%
0%
3.9
4.6
3.2
2.3
2.7 2.72.8 2.8
3.6
4.7
3.9
$4.0tn
$3.5tn
2006 2007 2008 2009 2010 2011 2012 2013 2014 2015 2016
$2.5tn
$2.0tn
$0.5tn
$0.0tn
$4.5tn
$3.0tn
$1.0tn
$1.5tn
Global M&A deal value ($tn) M&A as a % of GDP
Sources: J.P. Morgan, Dealogic and IMF GDP forecasts as of January 10, 2017; M&A as a % of GDP is rounded to the nearest decimal
2016 takeaways
• A vibrant and resilient M&A market: The 2016 global M&A market posted $3.9 trillion in announced volumes, in line with the third best year on record, notwithstanding substantial global uncertainty.
• Transformational deals: A number of highly strategic mergers took place in 2016, as companies looked externally for creative, inorganic growth.
• Buyers capitalize on low cost of funding: Cash deals accounted for 62% of transactions in 2016, compared with 54% in 2015.
• Cross-border activity: Cross-border transactions accounted for a growing percentage of the market, at 36% of overall volume, up from 31% in 2015.
• Surge in China outbound activity: China outbound M&A into the U.S. and EMEA increased by 471% and 252% year-over-year, respectively.
• Encouraging acquirer stock price reactions: Median excess returns for acquirers’ stock prices were essentially neutral to slightly positive post announcement.
• Record withdrawals: The volume of withdrawn deals1 in 2016 reached $842 billion (769 deals), the highest such volume since 2008, partly reflecting heightened regulatory pressure.
• Leading sectors: Technology was the most active sector by dollar volume in 2016, followed by power, real estate and healthcare.

4 | 2017 M&A GLOBAL OUTLOOK
2017 — The year aheadWe anticipate 2017 volumes will be consistent with 2016’s solid performance, as we expect companies to continue to seek both innovative and transformative transactions to complement organic growth. Investors’ receptivity to enhanced scale and synergistic strategic fits, as demonstrated by encouraging acquirer stock price reactions, should support this trend.
With ongoing modest global GDP growth expected, a strong M&A market performance in 2017 will be necessary to accelerate expansion. As markets adjust to ongoing political and regulatory changes, the M&A market should be buoyed by strong fundamentals and the potential for pro-business policy changes. In particular, opportunities may emerge from potential new U.S. policies, such as cash repatriation, corporate tax reform and more modest regulation.
Alongside regulatory uncertainty, the greatest threat to M&A activity is equity market valuations, which ended 2016 at all-time highs, and the related risk of overpaying for assets. The likely result is a larger stock component in deal offerings to bring some balance to valuations. In addition, regulatory scrutiny for large transformative transactions will most likely continue, at least partially offset by a higher deal count.
We also expect increased activity from private equity funds, which notwithstanding a record $822 billion2 in “dry powder” — capital available for investment purposes — did not feature prominently in the 2016 M&A market. These funds are likely to come under pressure to deploy their substantial available capital in the months ahead.
2017 key themes
• An active M&A market continues: We anticipate consistent deal volume in 2017 as companies face continued pressure to complement modest organic growth. Activity will be encouraged, in part, by low cost of funding and positive acquirer share price reactions.
• Regulatory uncertainty will remain: The impact of 2016 electoral and referendum outcomes, in addition to a number of key global elections and administration changes slated for 2017, are likely to contribute to regulatory uncertainty. Such uncertainty may have an adverse effect on companies’ readiness to pursue complex deals with a possible lengthy path to completion.
• Cross-border transactions will continue to provide a source of value creation: As companies continue to look for strategic growth, new regions provide exposure to different economic, market and consumer dynamics.
• Activist investors will remain prominent: Activists continue to prove adept at challenging corporate strategies and expanding their influence globally.
2 Source: Preqin as of December 31, 2016

2017 M&A GLOBAL OUTLOOK | 5
1. An active M&A market continues
As we move into 2017, a number of factors point toward an active deal environment. With ongoing modest GDP growth expected, companies will look externally for opportunities to complement organic growth, benefiting from their experience navigating 2016’s uncertain market conditions. Dealmakers will be further motivated by recent encouraging acquirer stock price reactions, while private equity funds may feature more prominently in the market as they deploy record dry powder.
These important market trends will be further accelerated by the continued low cost of funding. As 2016 came to an end, the median weighted average cost of capital (WACC) for S&P 500 companies fell to 7.6%, a level not seen since 2004. Since peaking at 9.2% in 2009, the median WACC has drifted downward.3 While we anticipate interest rate increases in 2017, the cost of capital is unlikely to be substantially impacted, and we do not think any increases will impede M&A activity. Given that in the past few years, corporations around the globe frequently did not lower their hurdle rates as much as the capital asset pricing model (CAPM) would have indicated, there remains an opportunity for more aggressive investment strategies.
Exhibit 3
Historical S&P 500 (excluding financials) cost of capital (WACC) analysis
12%
10%
2001 20032002 20052004 2006 2007 2008 20102009 20122011 2013 2014 2015 20164%
8%
6%
WAC
C
Median WACC25th to 75th percentile
8.0%
7.1%
8.9%
7.2%
9.3%
6.4%
8.3%
6.5%
8.5%
6.9%
8.8%
7.4%
8.9%
7.4%
8.9%
9.7%
10.3%10.0%
9.9% 9.8% 9.7%
9.3%8.9%
8.5%
8.1%8.3%
8.0%7.7%
7.2% 7.1% 7.0% 6.9%
6.5%
8.2%
7.3%7.5%
7.9%8.2%
8.2%
8.9%9.2% 9.1%
8.8%8.7%
8.5%8.5%
8.1%
7.6%
Sources: J.P. Morgan, FactSet, Bloomberg, Moody’s Note: Market data as of year-end of each respective year unless otherwise noted; S&P 500 cost of capital calculated as the median of nonfinancial firms that have been trading for at least five years; based on five-year historical betas calculated versus the S&P 500; risk-free rate based on annual average 10-year Treasury rates; J.P. Morgan estimate of U.S. equity risk premium based on a dividend discount model; cost of debt estimated using Moody’s historical intermediate term observed yields by rating then adding the difference between the average 10-year and 7-year swap rates for each respective year; 2016 data as of December 31, 2016
3 Sources: J.P. Morgan, FactSet, Bloomberg, Moody’s

6 | 2017 M&A GLOBAL OUTLOOK
The market reception to the announcement of significant transactions in 2016, which acquirers have seen positively reflected in their stock prices, is another encouraging sign for the deal environment. After some more negative price reactions in the second half of 2015, following several years of positive median excess returns, the median excess returns for acquirers’ stock prices were essentially neutral in 2016, +0.2% to (0.1)%, for both the one-day and five-day post-announcement periods. Such reactions indicate that investors are open-minded to new and well thought out transactions. In fact, 20% of all announced transactions with a value in excess of $500 million resulted in a positive share price five-day reaction of at least 5%.4
For deals less well received in 2016, the most common factors impacting their reception were a perceived strategic divergence from what management had led investors to expect and overall regulatory uncertainty about whether the deal would close. With acquirer stock prices generally performing in line with peers in 2016, the boards of potential acquirers may view the market as endorsing deal activity. This may factor into their decision to move forward with a transaction, as opposed to the close of 2015, when the median acquirer stock price reaction underperformed peers.
Exhibit 4
Median acquirer stock price reactiona
3.5%
1.5%
1.0%
(0.5%)
(1.0%)
(1.5%)
2008 2009 2010 2011 2012 2013 2014 2015 2016
(2.0%)
(2.5%)
0.5%
0.0%
2.5%
3.0%
2.0%
1-day reaction 5-day reaction
(0.8%)
(2.0%)
(0.2%)
0.4% 0.4%
1.0%
0.7% 0.7%
2.2%
1.7%
0.9%
3.4%
0.2%
(0.4%)(0.2%) (0.2%)
(0.6%)
(0.1%)
Sources: FactSet and company filings as of December 31, 2016 Note: Includes acquisitions by U.S. buyers with minimum deal value of $500mm, % owned < 20%, % acquired > 80% and target > 5% of the size of the acquirer a Excess return over S&P 500 returns times acquirer’s beta from unaffected date prior to announcement
4 Excess return over S&P 500 returns times acquirer’s beta from unaffected date prior to announcement

2017 M&A GLOBAL OUTLOOK | 7
Corporate decision makers pursuing acquisitions for growth will continue to compete against private equity firms, who are seeking to put to work a record $822 billion in dry powder, as of year-end 2016. Following several years of robust fundraising and a decline in deal activity in 2016, many private equity players are under pressure to deploy capital in 2017. In an environment of heightened competition for quality assets from corporations and alternative investors (e.g., pension funds, sovereign wealth funds, family offices), these firms are likely to continue to be willing to pay higher transaction multiples and contribute more equity to get deals done. In addition to pursuing traditional buyout/leveraged buyout activity, private equity firms may also look to boost fund returns by allocating increasing amounts of capital to non-control investments and to “buy-and-build” strategies for existing portfolio companies.
Exhibit 5
Private equity dry powder, December 2006 - December 2016 ($bn)
700
600
400
300
200
2006 2007 2008 2009 2010 2011 2012 2013 2014 2015 2016
100
0
500
900
800
Source: Preqin, as of December 31, 2016
Executive takeaways
• With ongoing modest GDP growth expected, companies will look externally for opportunities to complement organic growth in 2017, benefiting from their experience navigating 2016’s uncertain market conditions.
• Low cost of funding will encourage activity. Notwithstanding likely interest rate increases in 2017, the cost of capital is unlikely to be substantially impacted, and we do not think any increases will impede M&A activity.
• Acquirers experienced generally neutral to slightly positive stock price reactions to their deals in 2016, which may be viewed by the boards of potential acquirers as an endorsement of deal activity.
• Corporate acquirers will face competition from private equity funds looking to deploy record dry powder.

8 | 2017 M&A GLOBAL OUTLOOK
2. The impact of regulatory uncertainty and potential reform
A number of notable elections and administration changes around the globe, both in 2016 and 2017, are likely to contribute to regulatory uncertainty that will continue to affect the M&A market throughout the year. As we continue to assess the impact of the new U.S. administration and the U.K.’s Brexit, we also await the outcome of several key elections in Europe (France, Germany, Netherlands, etc.), along with further clarity regarding foreign exchange restrictions in China. Impediments in all these factors will contribute to companies further scrutinizing the regulatory landscape before evaluating significant transaction opportunities.
A new administration in the U.S.Although specific policies have not yet been confirmed, tax reform is high on the agenda for the new administration and the Republican controlled Congress. Current proposals would lower corporate tax rates to 15% to 25% and remove the incentive to retain offshore “trapped cash” by imposing a mandatory tax, likely at a 5% to 10% rate, on current and future unrepatriated foreign earnings. Once implemented, such proposals could provide excess capital available for M&A, although there may be short-term headwinds as companies await the outcome.
Additional policy changes could include an increase in federal spending on infrastructure along with public-private partnerships, which may lead to growth in impacted sectors. Loosened restrictions and regulations in the energy sector should also encourage growth and consolidation.
Brexit takes shapeWhile much was made of the impact of the Brexit referendum in 2016, its real effect may start to take shape in 2017. U.K. Prime Minister Theresa May has signaled her intent to trigger Article 50, which will serve as the official start of the EU withdrawal process, by the end of March. The impact of Brexit on other European nations remains to be seen, with some concerned that other countries may follow the U.K.’s lead and vote for similar referendums.
Increased scrutiny in ChinaIncreased regulatory and political scrutiny in China may have a negative impact on global M&A. While Chinese corporations are likely to remain active in evaluating outbound acquisition opportunities, other headwinds may exist. The impact of ongoing electoral changes around the world could result in different jurisdictions seeking greater reciprocity from China, regarding its support for foreign investment, in return for continued China inbound activity.
Separately, tighter controls on China outbound investments may impact M&A volume. The Chinese government remains supportive of strategic outbound acquisitions, so any impact is expected to be limited for well established Chinese buyers, but certain types of transaction activity may be affected. More opportunistic financial and real estate investments, including Chinese company delistings in foreign exchanges, are likely to be scrutinized, with regulatory approval less forthcoming. This will affect RMB financings and could lead to non-recourse offshore funding and to Chinese companies deploying existing offshore earnings, if available.

2017 M&A GLOBAL OUTLOOK | 9
Withdrawn deals in 2016As we enter 2017, we anticipate continued regulatory scrutiny to have an impact on the M&A market, as was the case in 2016, when the combination of a challenging regulatory environment and acquirers’ aggressive pursuit of growth-enhancing targets resulted in withdrawn deal5 volume reaching $842 billion (769 deals), the highest withdrawn deal volume since 2008. North American targets accounted for 65% of all withdrawn deals as a result of CFIUS concerns and the U.S. Treasury Department’s April ruling on inversions. Additionally, antitrust legislation led to the withdrawal of a number of deals in the U.S. and Europe.
Exhibit 6
Select deals affected by regulatory intervention (withdrawn year, 2016)
Ann. date Withdrawn date
Value ($bn)
Target Acquirer Target country
Acquirer country
Sector Reason for withdrawal
Nov 23, 2015 Apr 6, 2016 160.0 Allergan Pfizer U.S. U.S. Healthcare Treasury Department’s ruling on inversions in April 2016
Feb 26, 2016 Mar 1, 2016 102.8 United Technologies
Honeywell U.S. U.S. Diversified industries
Failed negotiations/potential antitrust
Nov 17, 2014 Apr 30, 2016 38.7 Baker Hughes
Halliburton Co.
U.S. U.S. Oil & Gas Inability to construct a divestiture package that met antitrust regulators’ demands
Jan 23, 2015 Jun 30, 2016 15.4 Telefonica UK Ltd - 02 UK
Hutchison 3G UK
Holdings
U.K. Hong Kong
Telecom- munications
Regulatory — blocked by European Commission
Sources: Dealogic and company filings as of December 31, 2016 Includes expired, rejected and withdrawn transactions
Executive takeaways
• Regulatory uncertainty will continue to affect the M&A market in 2017, as we assess the impact of 2016 electoral and referendum outcomes, in addition to notable elections and potential policy changes around the globe.
• A new administration in the U.S. may result in lower corporate tax rates, tax reform and new policies that may benefit certain sectors.
• Further definition around the extent of Brexit and its impact on other European countries is expected. Concern remains that other European countries may follow the U.K.’s lead and vote for similar referendums.
• Tighter controls on China outbound investments may impact M&A volume; however, the Chinese government remains supportive of strategic outbound acquisitions and any impact is expected to be limited for well established Chinese buyers.
5 Source: Dealogic (M&A Analytics) as of January 10, 2017
Note: Deals with value greater than or equal to $10 million. Includes expired, rejected and withdrawn transactions Region based on target information

10 | 2017 M&A GLOBAL OUTLOOK
3. Cross-border transactions will remain important
Despite a number of headwinds, cross-border transactions will provide an important source of value creation for corporations in 2017, as companies continue to look to new regions for exposure to different economic, market and consumer dynamics.
Impact of Brexit on U.K. cross-border M&A flows The U.K. electorate’s June 2016 decision to exit the EU sent a shudder through global equity markets — with major global indices down an average of 4.5% that week — adding to rising levels of global market uncertainty. Since then, the markets have rebounded strongly, but uncertainty remains around the true impact of the U.K.’s exit from the EU, where volumes for deals involving a U.K. target declined 48% in 2016, when compared to 2015.
Whether we witness a “hard” or “soft” Brexit, a formal departure from the EU is likely to force U.K. companies to be more dynamic in international markets and to seek opportunities for expansion and growth around the world. Similarly, foreign companies are likely to remain interested in acquiring or partnering with U.K. companies, benefiting from global operations, world-class capabilities and, in some instances, the likely continued weakness in sterling.
Despite the tumult around Brexit, the U.K. M&A market remains one of the most open, structured and transparent markets globally. While populist demands for curbs on overseas buyers of U.K. assets persist, cross-border M&A continues to make up the largest proportion of total U.K. M&A volume, accounting for approximately 69%6, on average, for the 10 years from 2007 through 2016.
Exhibit 7
U.K. M&A deal volume ($bn) and cross-border activity
395
96
161
138
438
81
177
180
729
307
222
200
442
104
186
152 20837
103
68
238
88
85
65
22386
54
82
20055
51
94
19753
61
83
351
118
106
127
542
110
83
349
333
111
64
158
59.1% 59.5% 69.6% 57.9% 50.4% 64.2% 75.8% 74.6% 68.9% 69.7% 84.7% 80.7%
20062005 2007 2009 2010 20112008 2012 2013 2014 2015 2016
U.K. outboundU.K. domestic U.K. inbound
600
400
200
0
800
Cross-bordera
Source: Dealogic as of December 31, 2016; M&A volumes are rounded to the nearest whole number a Cross-border includes U.K. inbound and outbound flows excluding U.K. offshore divestments
6 Cross-border includes U.K. inbound and outbound flows excluding U.K. offshore divestments

10 | 2017 M&A GLOBAL OUTLOOK 2017 M&A GLOBAL OUTLOOK | 11
The evolution of China outbound interestAs previously discussed, following a surge in China outbound M&A deal activity in 2016, we anticipate Chinese buyers will continue to look for attractive opportunities abroad, although transaction activity is likely to be curbed by different jurisdictions seeking greater inbound reciprocity from China and tighter controls on outbound investments.
We anticipate that Chinese buyer interest in 2017 will focus on a number of sector-based strategic factors:
• Consumer and leisure/recreation opportunities associated with growing demand from the rising middle class, with significant focus on established brands.
• Industrials acquisitions focusing on industrial know-how, such as robotics and automation, to address the partial erosion of manufacturing competitiveness.
• Technology transactions in pursuit of a strong technology edge. Despite greater regulatory scrutiny from both the U.S. and Europe, interest for technology targets remains strong.
• Investments in power, utilities and infrastructure, as well as natural resources, which have seen recoveries, partially due to the government-backed “One Belt, One Road” initiative.
• Chinese buyers have also become increasingly receptive to a variety of transaction structures, such as strategic minority investments, public tender and controlling deals with pre-agreed mitigation measures to preserve jobs and operational independence.
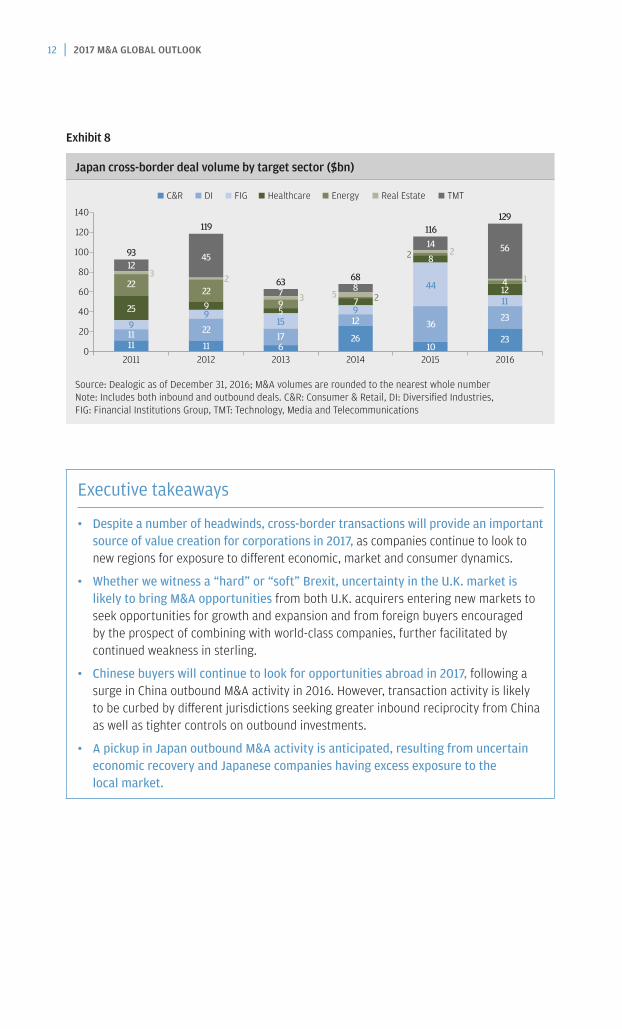
The importance of Japan cross-border activityFor Japan, the 2016 M&A market showed activity levels similar to 2015, with little growth, a possible result of an uncertain economic and business environment, as reflected in the flat performance of the Nikkei during 2016. This is consistent with the historical correlation between Japanese stock market performance and M&A transaction volumes, with the exception of certain megadeals (e.g., Softbank’s acquisition of Sprint Nextel in 2012 and Softbank’s acquisition of ARM in 2016).
The likely continued uncertainty of Japan’s GDP growth, along with inflation relative to Japanese companies’ excess exposure to the local economy, should encourage corporations’ search for growth through cross-border M&A, which accounted for 58% of all deals in 2016, compared with 44% in 2011.
We anticipate a pickup in outbound M&A activity during 2017 to continue, driven by a number of factors:
• Increasing pressure from shareholders to achieve higher return on equity and growth, following the introduction of the Corporate Governance Code in 2015.
• Historical local diversification into different sectors that may lead to the sale of non-core assets, as companies face pressure from shareholders to achieve higher return on equity and expand core operations.
• Expected strengthening of the yen.
12 | 2017 M&A GLOBAL OUTLOOK
Exhibit 8
Japan cross-border deal volume by target sector ($bn)
2015201111119
25
22
123
11 626
1023
23
11
412
56
1
36
44
8
142 2
1297 28
5
1715597 3
22
9922
45
2
93
119
63 68
116129
2012 2013 20162014
C&R EnergyHealthcareFIGDI Real Estate TMT
140
120
80
60
40
20
0
100
Source: Dealogic as of December 31, 2016; M&A volumes are rounded to the nearest whole number Note: Includes both inbound and outbound deals. C&R: Consumer & Retail, DI: Diversified Industries, FIG: Financial Institutions Group, TMT: Technology, Media and Telecommunications
Executive takeaways
• Despite a number of headwinds, cross-border transactions will provide an important source of value creation for corporations in 2017, as companies continue to look to new regions for exposure to different economic, market and consumer dynamics.
• Whether we witness a “hard” or “soft” Brexit, uncertainty in the U.K. market is likely to bring M&A opportunities from both U.K. acquirers entering new markets to seek opportunities for growth and expansion and from foreign buyers encouraged by the prospect of combining with world-class companies, further facilitated by continued weakness in sterling.
• Chinese buyers will continue to look for opportunities abroad in 2017, following a surge in China outbound M&A activity in 2016. However, transaction activity is likely to be curbed by different jurisdictions seeking greater inbound reciprocity from China as well as tighter controls on outbound investments.
• A pickup in Japan outbound M&A activity is anticipated, resulting from uncertain economic recovery and Japanese companies having excess exposure to the local market.

12 | 2017 M&A GLOBAL OUTLOOK 2017 M&A GLOBAL OUTLOOK | 13
4. Activism: What’s ahead in 2017?
We anticipate activism to continue to be a prominent theme in 2017, as activists prove themselves adept at navigating the ongoing evolution and global expansion of the strategy.
After several years of strong growth, activist hedge fund assets under management (AUM) dropped to $121.2 billion at the end of 2016, down roughly 1.4% from their 2015 peak, but up from earlier in the year when AUM was down 8.5% from year-end 2015 levels. The asset class suffered from a combination of underperformance by a number of activist funds, redemptions by hedge fund investors and a shift from active to passive/index investment strategies.
Issuers should not view this decline in activist AUM as a reason to become complacent about shareholder activism, however, as we expect the storm has passed for activist hedge funds. The pressures exerted upon shareholder activists have resulted in better developed activist campaigns and more aggressive activist actions. We also expect more direct engagement from traditional long-only investors, who are more comfortable flexing their muscle by taking direct action at portfolio companies they view as underperformers.
After seeing a record in 2015 with respect to activist campaigns ending in settlements putting an activist representative on the board, 2016 saw reduced settlement activity. This pullback was driven in part by slightly lower levels of activism overall following significant activist headwinds leading into the 2016 proxy season, but also by increased pushback from institutional investors, who increasingly view settlements as usurping shareholders’ right to determine the composition of a company’s board. We expect this shareholder pressure to continue in 2017, resulting in less frequent settlement, particularly settlements reached very quickly after an activist campaign is launched. Where settlements do still occur, we expect companies to increase their engagement with non-activist shareholders before entering into a settlement agreement.
The evolution of institutional investor involvement in activismMajor institutional investors have demonstrated a willingness to support activists calling for change. No longer averse to confrontation, these investors are now not only prepared to support a dissident, but also are becoming more directly involved in shareholder activism. The first seeds of activism sown by long-only institutional investors began to emerge a couple of years ago when investors started reaching out to activists and inviting them to target their portfolio companies. Some are now submitting shareholder proposals and initiating full-scale campaigns on their own.
Conversely, as targeted companies have looked to settlement in an effort to avoid the negative impact of a full-scale activist campaign, institutional investors — mainly index funds — are beginning to push back, arguing that ceding board seats in a settlement usurps shareholders’ right to determine the makeup of the company’s board. These investors are calling upon companies to resist activists’ short-term interests, encouraging corporates to impose tougher terms when negotiating settlements and engaging with shareholders prior to finalizing a settlement agreement.

14 | 2017 M&A GLOBAL OUTLOOK
The changing regulatory environment for activistsIn reaction to the demonstrated ability of activists to quickly and radically affect the companies they target, recent regulatory developments in the U.S. are set to shape the evolution of shareholder activism:
• In October 2016, the U.S. Securities and Exchange Commission voted 2-1 to propose a universal proxy card rule for contested board elections. If implemented, this would result in all director nominees — those nominated by the company, as well as those nominated by the dissident — being placed on a single proxy card, allowing investors to split their votes between all nominees.
• Both the U.S. Department of Justice and the Federal Trade Commission are evaluating activist investors’ requirements under the Hart-Scott-Rodino Act (HSR) and imposing fines for violations. Historically, however, activists have relied on an exemption for investors that are accumulating shares “solely for the purpose of investment.” Given an activist’s typical strategy to influence the management, board and strategy of the companies they target, regulators are reexamining whether this exemption should continue to apply to activists.
• The U.S. Congress is considering tightening other disclosure requirements that directly affect activists’ ability to accumulate shares. The Brokaw Act, a bill that would shorten the SEC’s Schedule 13D filing window from 10 days to two, was recently placed on hold in the Senate.
Continued globalization of shareholder activismWhile the U.S. has historically been the focus of the vast majority of shareholder activism, international activist campaign volume7 has significantly increased. 2016 saw new peaks in campaign activity in Europe and Asia Pacific, where year-over-year activity grew by 51% and 10%, respectively. Despite cultural, structural and regulatory differences, international activism is expected to develop along the same lines it has in the U.S., where campaign themes became progressively more sophisticated and large-cap companies became increasingly vulnerable.
Exhibit 9
Number of shareholder activism campaigns globallya
2011 2012 2013 2014 2015 2016
400
350
250
200
150
100
0
300
50
U.S. Internationalb
266
80
276
125
276
168
350
169
375
225
325
282
Sources: FactSet’s SharkRepellent, Activist Insight, Mergermarket, company filings, press articles as of January 15, 2017 a Represents the following campaign types: board control and representation, enhance corporate governance, maximize shareholder value, remove director(s), remove officer(s) and vote/activism against a merger b Europe, Asia and Australia
7 Defined as Europe, Asia and Australia

14 | 2017 M&A GLOBAL OUTLOOK 2017 M&A GLOBAL OUTLOOK | 15
International campaign volume has been and will continue to be driven by both domestic and foreign investors, the latter looking for opportunities outside of a saturated U.S. market, capitalizing on the changing face of international shareholder registers, which increasingly resemble U.S. companies’ shareholder registers. These registers have already shown they are receptive to activist agendas.
Executive takeaways
• Despite a decrease in activist AUM in 2016, the strategy will remain prominent, and continue to evolve, in 2017.
• Pressures exerted upon shareholder activists are likely to result in better developed activist campaigns and more aggressive activist actions, as shareholder activists look to demonstrate to their own investors that they are working hard to deliver returns.
• 2017 campaigns are less likely to result in settlement. Where settlements occur, we expect companies to increase their engagement with non-activist shareholders before entering into a settlement agreement.
• Institutional investors are increasingly engaging in shareholder activism, shedding their historical supporting roles for more direct engagement.
• Recent regulatory developments in the U.S. are set to shape the evolution of shareholder activism.

16 | 2017 M&A GLOBAL OUTLOOK
About J.P. Morgan M&A advisory solutions
We advise corporations and institutions of all sizes on their most complex strategic needs, in their home markets and around the world. Whatever your strategic challenge or opportunity, J.P. Morgan provides a full M&A offering to address your needs. Drawing upon our in-depth industry-specific expertise and regional market acumen, we can evaluate your business with a long-term view to provide a tailored, comprehensive and integrated solution.
We have a track record of strategic defense. Our scale and breadth of experience with shareholder activism mean we provide a differentiated approach toward defense for clients. We have successfully engaged with all the major activists in some of the most sophisticated campaigns around the world, and our deep understanding of activist tactics and firsthand knowledge bring experience to your defense. As we advise only corporate clients and do not counsel any shareholder activist campaigns, our interests are fully aligned with your company’s priorities.
Clients benefit from J.P. Morgan’s global experience leveraging our specialized advice, swift strategic execution and strong resources to help you seize opportunities and solve problems.
Our bespoke solutions combine:
• In-depth knowledge of sector and market dynamics with M&A bankers based locally in most major markets globally.
• Innovative advice on valuation, transaction structures and deal tactics and negotiations.
• Rigorous execution delivered with responsive and agile service.
• Ability to partner with product experts across our full range of competencies, including comprehensive financing through our debt and equity issuance platforms, as well as derivatives and treasury services, such as escrow services.
J.P. Morgan provides M&A advisory solutions across the full strategic life cycle of our clients:
Strategic expansion
• Acquisitions, including cross-border opportunities
• Mergers and joint ventures
Enhancing business value
• Corporate combinations
• Divestures
• Capital restructuring projects
• Spinoffs and other repositionings
Shareholder strategy
• Defense preparations for publicly announced and non-public approaches
• Dedicated shareholder activism advice

16 | 2017 M&A GLOBAL OUTLOOK 2017 M&A GLOBAL OUTLOOK | 17
Select J.P. Morgan-advised M&A transactions in 2016
Pending $107.9bn
Advisor to AT&T on its acquisition of Time Warner
Pending $58.1bn
Advisor to Reynolds American on its sale of remaining 57.8% stake to British American Tobacco
Pending $46.9bn
Advisor to Syngenta on its sale to ChemChina
Pending $23.1bn
Advisor to Twenty-First Century Fox on its acquisition of remaining 61.6% stake in Sky plc
Pending $18.4bn
Advisor to NextEra Energy on its acquisition of Energy Future Holdings
2017 $18.0bn
Advisor to Colony Capital on its merger of equals with Northstar Asset Management and North Realty Finance
2016 $14.3bn
Advisor to Medivation on its sale to Pfizer
Pending $10.0bn
Advisor to CIT Group on the sale of its of aircraft leasing business to Avolon Holdings
2016 $7.5bn
Advisor to Multiplan on its sale to Hellman & Friedman
2016 $10.3bn
Advisor to Progressive Waste Solutions on its sale to Waste Connections
Pending $8.2bn
Advisor to Rockwell Collins on its acquisition of B/E Aerospace
Pending $6.5bn
Advisor to HNA Group on its acquisition of a 25% stake in Hilton Worldwide from Blackstone
Cross-border deals
Pending $6.4bn
Advisor to Quironsalud on its sale to Fresenius
Pending $8.9bn
Advisor to Harman International on its sale to Samsung Electronics
2016 $6.6bn
Advisor to Markit on its sale to IHS
Pending $8.8bn
Advisor to Micro Focus on its merger with HP Software Business Segment
2016 $7.0bn
Advisor to AMSURG on its merger with Envision Healthcare
Pending $7.7bn
Advisor to Gamesa Corporacion Tecnologica on its acquisition of wind business from Siemens
Pending $11.3bn
Advisor to Sherwin-Williams on its acquisition of Valspar
Pending $43.0bn
Advisor to Enbridge on its merger with Spectra Energy
Pending $14.2bn
Advisor to London Stock Exchange on its merger with Deutsche Boerse
Pending $8.4bn
Advisor to Alere on its sale to Abbott Laboratories
2016 $8.0bn
Advisor to Hon Hai Precision Industry and SIO International on its acquisition of 66% stake in Sharp Corp
2016 $7.2bn
Advisor to Johnson Controls on the spinoff of its automotive seating business
2016 $6.8bn
Advisor to Energy Future Holdings on its spinoff of Texas Competitive Electric Holdings

18 | 2017 M&A GLOBAL OUTLOOK
2016 $5.8bn
Advisor to Lockheed Martin on its sale of IT systems and Global Solutions business to Leidos Holdings
Pending $5.8bn
Advisor to Regency Centers on its merger with Equity One
Pending $5.6bn
Advisor to Bass Pro Group on its acquisition of Cabela’s
Pending $5.2bn
Advisor to Petrobas on its sale of South American natural gas transmission utility to Brookfield Infrastructure Consortium
2016 $5.0bn
Advisor to E.ON on spinoff of Uniper
2016 $4.8bn
Advisor to Post Properties on its combination with Mid-America Apartment Communities
Pending $4.6bn
Advisor to GE on its sale of GE Money Bank to Cerberus Capital Management
2016 $4.5bn
Advisor to Ant Financial Group on its sale of 7.5% stake to China Investment Corp and others
2016 $3.8bn
Advisor to EPH on its acquisition of Lignite
2016 $4.5bn
Advisor to Thermo Fisher Scientific on its acquisition of FEI Company
2016 $4.0bn
Advisor to Ultimate Fighting Championship on its sale to a consortium of investors
Pending $3.6bn
Advisor to Equinix on its acquisition of 29 data center assets from Verizon
Cross-border deals
2016 $3.6bn
Advisor to Microchip Technology on its offer to acquire Atmel Corp
2016 $4.5bn
Advisor to Lions Gate Entertainment on its acquisition of Starz
2016 $3.6bn
Advisor to Thomson Reuters on the sale of its Intellectual Property & Science business to Onex and Baring Private Equity
Pending $4.5bn
Advisor to Intrum Justitia on its merger with Lindorff
2016 $3.7bn
Advisor to Casino Guichard-Perrachon on the sale of 58.6% stake in its Big C Supercenter to TCC Group
Pending $3.9bn
Advisor to CIBC on its acquisition of PrivateBancorp
Pending $4.5bn
Advisor to Siemens on its acquisition of Mentor Graphics
Pending $5.5bn
Advisor to Yahoo on sale of its operating business to Verizon
2016 $4.7bn
Advisor to Symantec on its acquisition of Blue Coat
Pending $4.4bn
Advisor to CST Brands on its sale to Alimentation Couche-Tard
2016 $4.0bn
Advisor to Emerson Electric on the sale of its Network Power business to Platinum Equity
2017 $3.8bn
Advisor to Evonik on its acquisition of Air Products Performance Materials
2016 $3.6bn
Advisor to Cousins Properties on its merger with Parkway Properties

18 | 2017 M&A GLOBAL OUTLOOK 2017 M&A GLOBAL OUTLOOK | 19
Notes

Notes

This material (including market commentary, market data, observations or the like) has been prepared by personnel in the Mergers & Acquisitions Group of JPMorgan Chase & Co. It has not been reviewed, endorsed or otherwise approved by, and is not a work product of, any research department of JPMorgan Chase & Co. and/or its affiliates (“J.P. Morgan”). Any views or opinions expressed herein are solely those of the individual authors and may differ from the views and opinions expressed by other departments or divisions of J.P. Morgan. This material is for the general information of our clients only and is a “solicitation” only as that term is used within CFTC Rule 1.71 and 23.605 promulgated under the U.S. Commodity Exchange Act.
RESTRICTED DISTRIBUTION: This material is distributed by the relevant J.P. Morgan entities that possess the necessary licenses to distribute the material in the respective countries. This material is proprietary and confidential to J.P. Morgan and is for your personal use only. Any distribution, copy, reprints and/or forward to others is strictly prohibited.
This material is intended merely to highlight market developments and is not intended to be comprehensive and does not constitute investment, legal or tax advice, nor does it constitute an offer or solicitation for the purchase or sale of any financial instrument or a recommendation for any investment product or strategy.
Information contained in this material has been obtained from sources believed to be reliable but no representation or warranty is made by J.P. Morgan as to the quality, completeness, accuracy, fitness for a particular purpose or non infringement of such information. In no event shall J.P. Morgan be liable (whether in contract, tort, equity or otherwise) for any use by any party of, for any decision made or action taken by any party in reliance upon, or for any inaccuracies or errors in, or omissions from, the information contained herein and such information may not be relied upon by you in evaluating the merits of participating in any transaction. All information contained herein is as of the date referenced and is subject to change without notice. All market statistics are based on announced transactions. Numbers in various tables may not sum due to rounding.
J.P. Morgan may have positions (long or short), effect transactions, or make markets in securities or financial instruments mentioned herein (or options with respect thereto), or provide advice or loans to, or participate in the underwriting or restructuring of the obligations of, issuers mentioned herein. All transactions presented herein are for illustration purposes only. J.P. Morgan does not make representations or warranties as to the legal, tax, credit, or accounting treatment of any such transactions, or any other effects similar transactions may have on you or your affiliates. You should consult with your own advisors as to such matters.
The use of any third-party trademarks or brand names is for informational purposes only and does not imply an endorsement by JPMorgan Chase & Co. or that such trademark owner has authorized JPMorgan Chase & Co. to promote its products or services.
J.P. Morgan is the marketing name for the investment banking activities of JPMorgan Chase Bank, N.A., J.P. Morgan Limited, J.P. Morgan Securities LLC (member, NYSE), J.P. Morgan Securities plc (authorized by the Prudential Regulation Authority and regulated by the Financial Conduct Authority and the Prudential Regulation Authority), J.P. Morgan Australia Limited (ABN 52 002 888 011/AFS Licence No: 238188 and regulated by Australian Securities and Investments Commission) and their investment banking affiliates. J. P. Morgan Securities plc is exempt from the licensing provisions of the Financial and Intermediary Services Act, 2002 (South Africa).
For Brazil: Ombudsman J.P. Morgan: 0800-7700847 / [email protected]
For Australia: This material is issued and distributed by JP Morgan Australia Limited (ABN 52 002 888 011/AFS Licence No: 238188) (regulated by ASIC) for the benefit of “wholesale clients” only. This material does not take into account the specific investment objectives, financial situation or particular needs of the recipient. The recipient of this material must not distribute it to any third party or outside Australia without the prior written consent of JP Morgan Australia Limited.
© 2017 JPMorgan Chase & Co. All rights reserved.