2017 LONG ISLAND ECONOMIC SURVEY … results of the 2017 Long Island Economic Survey and Opinion...
20
libn.com LONG ISLAND ECONOMIC SURVEY &OPINION POLL 2 0 1 7
Transcript of 2017 LONG ISLAND ECONOMIC SURVEY … results of the 2017 Long Island Economic Survey and Opinion...

libn.com
LONG ISLAND ECONOMIC SURVEY&OPINION POLL
2 0 1 7
0-0-AVZ2017 NEW_Layout 1 12/15/16 9:33 AM Page 1

libn.com
Itʼs been a year crammed full of hot topics in the economy, the news, politics, and the world. Here on LongIsland, our headlines included steady job growth, lower energy prices, a stronger commercial and residentialhousing market, an increase in consumer spending, and a growth in retail sales, just to name a few. All in all,we are seeing a steady economic optimism from business owners.
Here are the results of our 23nd annual Long Island Economic Survey and Opinion Poll. We fully recognizethat if it were not for the Long Island business community, we would never have come this far. We are sograteful to our prestigious sponsors, respondents, and to the business men and women who turn out each yearto attend our results breakfast. You are the reason we want to make this survey bigger and better year afteryear.
We appreciate your interest in our questionnaire and survey results, but most importantly your ongoingcommitment to the Long Island business community. We hope you will find this data beneficial as it reflects theexperiences of our local business owners, who are the foundation upon which our Long Island economy is built.
Highlights
➢ The National economic confidence rating remained steady at 6.1.
➢ The Long Island economic confidence rating increased from 6.1 to 6.3.
➢ 66% of respondents realized an increase in revenue in 2016.
➢ 86% increased prices for products or services in 2016.
➢ 38% of respondents increased headcount in 2016.
➢ 42% of businesses have job openings that are hard to fill.
➢ 31% of respondents had to adjust their culture to succeed in todayʼs business environment.
➢ 48% of respondents feel financially prepared for retirement.
➢ 33% believe that the economy is the most important issue facing President Trump.
➢ 41% believe the Patriots will win Super Bowl 51.
We are continually grateful that our survey is used as a reference tool for countless business men and womenthroughout Long Island. As you read through this data, we hope you feel as optimistic about the future as manyof our respondents appear to feel.
Once again, thank you so much for your participation and we welcome your comments or feedback as we moveto create a more valuable survey for you each year. Best wishes for growth and success in 2017.
Sponsored by
0-0-AVZ2017 NEW_Layout 1 12/15/16 9:33 AM Page 2

The results of the 2017 Long Island EconomicSurvey and Opinion Poll were compiled by AVZ.An electronic survey was sent out to Long Islandbusiness men and women in mid-October 2016.The survey was closed mid-November and theresponses were tabulated at that time.
Over half (54%) of the respondents maintain theirbusiness operations in Suffolk County, almostone-quarter (24%) are in Nassau County, with 14%having facilities in both locations and 8% else-where; in places like North Carolina, Virginia,Florida, and Connecticut.
An overwhelming majority (89%) has been in busi-ness for more than 10 years and 56% have oper-ated for over 30 years.
Three-quarters of our respondents (75%) reportedtotal employee headcount of less than 250, withover half (55%) employing less than 50 people.
WHERE IS YOUR PRINCIPALPLACE OF BUSINESS?
HOW MANY YEARS HAS YOURCOMPANY BEEN IN BUSINESS?
HOW MANY EMPLOYEESDO YOU HAVE?
Demographics
I 3 I
■ Nassau County
■ Suffolk County
■ Both
■ Elsewhere
■ 0 to 5
■ 6 to 10
■ 11 to 20
■ 21 to 30
■ Over 30
■ Less than 25
■ 25-49
■ 50-74
■ 75-99
■ 100-249
■ 250-500
■ Greater than 500
24%
54%
56%
44%
12%
17%
16%
14%
11%
7% 4%
4%
14%
8%
4%
11%
0-0-AVZ2017 NEW_Layout 1 12/15/16 9:35 AM Page 3

I 4 I
TYPE OF BUSINESS
CONFIDENCE IN THE NATIONAL ECONOMY
Economic Confidence Ratings
■ Health Care
■ Manufacturing
■ Distribution
■ Technology
■ Construction
■ Retail
■ Professional Services
■ Other Services
■ Other
IS YOUR BUSINESS PUBLICLYOR PRIVATELY OWNED?
■ Publicly Owned
■ Privately Owned
6%
28%
36%
3%
2%3%
9%7%
6%
76%
24%
6.0 6.5 6.2
4.5 5.1 5.0 4.5 4.75.5 5.8 6.1 6.1
Our respondents represent a very diverse cross section ofindustries. Over one-third of the respondents (36%) catego-rized their industry as “Other”. They represent industriessuch as Transportation, Media, Trade Associations, Not forProfit, and Government business sectors.
Privately held businesses represent over three quarters(76%) of the respondents.
We asked “On a scale of 1-10 with 10 being the most confident, rateyour confidence in the National economy”.
This is the twelfth consecutive year we measured the National economic confidence rating. Our results show confidence on a National level has remained steady from last year with a 6.1 rating.
2005 2006 2007 2008 2009 2010 2011 2012 2013 2014 2015 2016
0-0-AVZ2017 NEW_Layout 1 12/15/16 9:37 AM Page 4

I 5 I
We asked “On a scale of 1-10 with 10 being the most confident,rate your confidence in the Long Island economy”.
Confidence in the Long Island economy is more optimistic than theNational economy with a rating of 6.3, which is up from 6.1 last year.
1995 1996 1997 1998 1999 2000 2001 2002 2003 2004 2005 2006 2007 2008 2009 2010 2011 2012 2013 2014 2015 2016
5.06.0
6.6 6.8 7.2 7.26.6 6.3 6.36.7 6.7
6.0 6.1 6.1 6.14.9 5.2 5.0 5.1 4.9
5.6 5.7
CONFIDENCE IN THE LONG ISLAND ECONOMY
0-0-AVZ2017 NEW_Layout 1 12/15/16 9:38 AM Page 5
I 6 I
■ No Change ■ Less Than Prior Year ■ 1-5% ■ 6-10% ■ 11-15% ■ 16-20% ■ 21-25% ■ Greater Than 25%
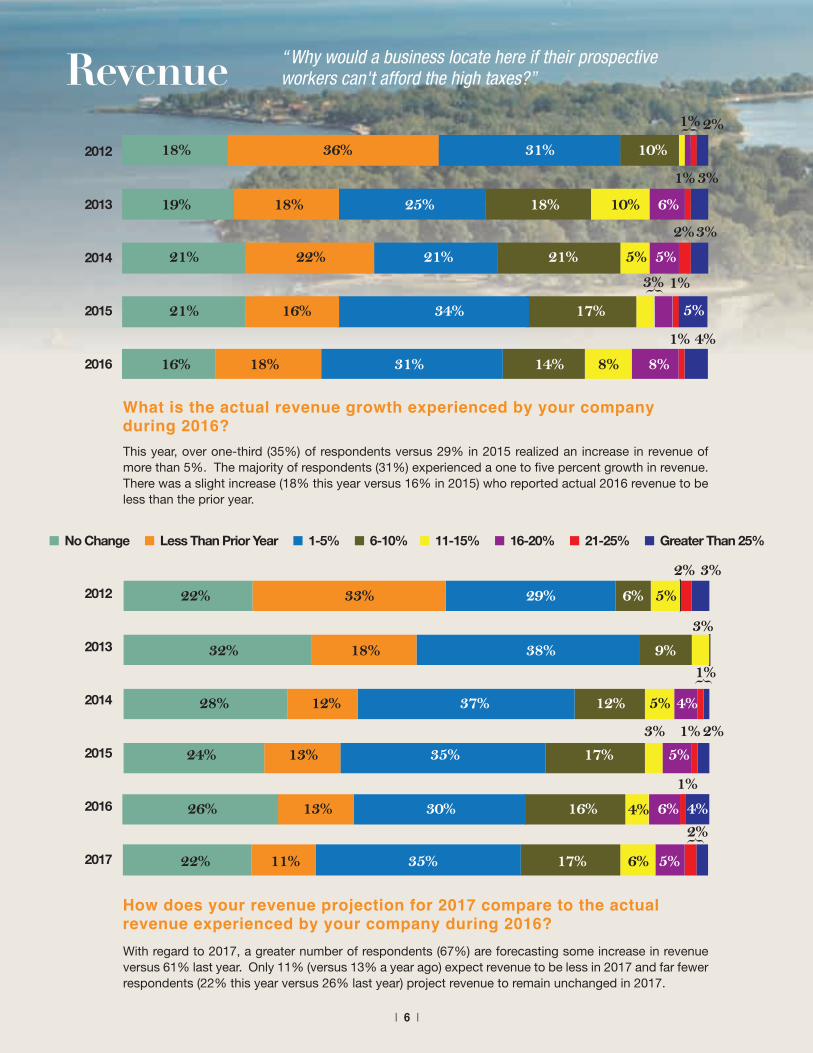
Revenue
With regard to 2017, a greater number of respondents (67%) are forecasting some increase in revenueversus 61% last year. Only 11% (versus 13% a year ago) expect revenue to be less in 2017 and far fewerrespondents (22% this year versus 26% last year) project revenue to remain unchanged in 2017.
How does your revenue projection for 2017 compare to the actualrevenue experienced by your company during 2016?
This year, over one-third (35%) of respondents versus 29% in 2015 realized an increase in revenue ofmore than 5%. The majority of respondents (31%) experienced a one to five percent growth in revenue.There was a slight increase (18% this year versus 16% in 2015) who reported actual 2016 revenue to beless than the prior year.
What is the actual revenue growth experienced by your company during 2016?
18%
19%
21%
21%
16% 18% 31% 14% 8% 8%
16% 34% 17%
22% 21% 21% 5% 5%
2%3%
3%
18% 25% 18% 10%
1%
1%
1%
5%
6%
36% 31%
1%
10%
2%
4%
3%
2012
2013
2014
2015
2016
2012
2013
2014
2015
2016
2017
{
{
22%
32%
28%
24%
26%
22% 11% 35% 17% 6% 5%
13% 30% 16%
13% 35% 17% 5%
6% 4%
3%
4%
1%
1%
2%
12% 37% 12% 5% 4%
18% 38% 9%
33% 29% 6% 5%
3%
3%
2%
{1%
{2%
“Why would a business locate here if their prospectiveworkers can't afford the high taxes?”
0-0-AVZ2017 NEW_Layout 1 12/15/16 9:38 AM Page 6

I 7 I
■ Decrease
■ 0-4%
■ 5-9%
■ 10-14%
■ Greater than 15%
■ Higher
■ Lower
■ No Change
We saw a greater number of respondents decreasing prices this year. Up from lastyear, 14% of respondents decreased prices versus 10% in 2015. An increase inprices above 4% was set by only 11% of respondents in 2016 versus 16% in 2015.
During the past 12 months, what was the average priceincrease (or decrease) of your products or services?
Prices and Profits
Decreasing from last year, less than half (49%) of the respondents (versus 55% in 2015) projected 2016 netincome to be higher. Fewer respondents (17% this year versus 24% last year) projected their net income to belower in 2016. Over one-third (34%) projected no change.
How does your projected net income for 2016 compare to your actual netincome for 2015?
64%58%
8% 8%
1%
15%
71% 74% 75%
13% 10% 11%4%
1% 1%2%1%
16%14% 14%
33%
5%1%
2012 2013 2014 2015 2016
2012 2013 2014 2015 2016
27%
46%
27%
45%
28% 27%
47%
30%
23%
55%
24%21%
49%
17%
34%
“The funding of companies to remain intown by reducing their taxes even thoughthey are showing huge profits.”
0-0-AVZ2017 NEW_Layout 1 12/15/16 9:39 AM Page 7
I 8 I
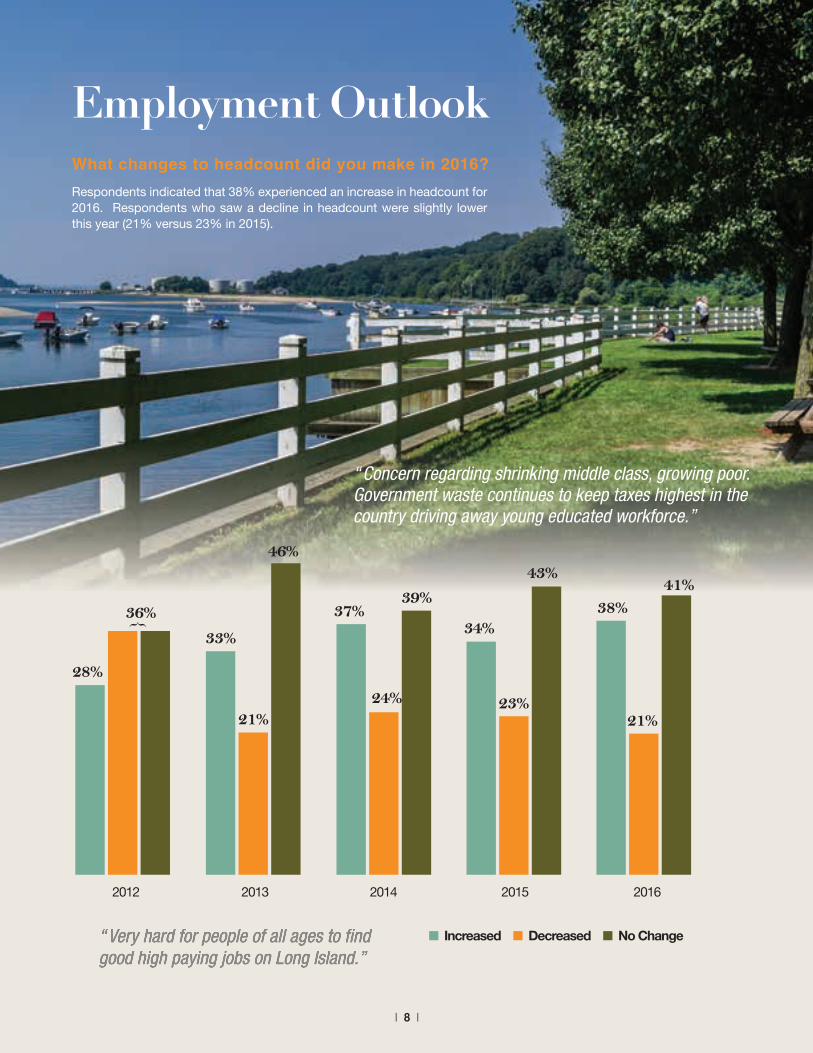
Employment Outlook
Respondents indicated that 38% experienced an increase in headcount for2016. Respondents who saw a decline in headcount were slightly lowerthis year (21% versus 23% in 2015).
What changes to headcount did you make in 2016?
28%
36%
33%
21%
46%
37%
24%
39%
34%
23%
43%
38%
21%
41%
2012 2013 2014 2015 2016
{
■ Increased ■ Decreased ■ No Change
“Concern regarding shrinking middle class, growing poor. Government waste continues to keep taxes highest in the country driving away young educated workforce.”
0-0-AVZ2017 NEW_Layout 1 12/15/16 9:40 AM Page 8

I 9 I
■ Increase ■ Decrease ■ No Change
■ Yes ■ No
Have you seen a substantial change in your employee turnover in 2016?
Looking forward to 2017, far fewer firms (37% in 2017 versus 46% in 2016) are planning to hire additional employees. More than half of our respondents (58%) plan to keep their workforce number steady, while only5% anticipate having to decrease headcount.
What are your plans for headcount in 2017?
84% 80%
20%16%
37%
5%
58%
29%
15%
56%
31%
6%
63%
34%
8%
58%
46%
2%
52%
2013 2014 2015 2016 2017
2014 2015
78%
22%
2016
There appears to be an upward trend in the amount of employees who are seeking and finding employmentelsewhere. While the large majority of respondents (78%) did not experience a substantial turnover in theirworkforce in 2016, we are seeing an upward trend (22% in 2016; 20% in 2015 and 16% in 2014) thatexperienced substantial employee turnover.
0-0-AVZ2017 NEW_Layout 1 12/15/16 9:42 AM Page 9

I 10 I
■ Yes ■ No
Over two-thirds (69%) of respondents have not had to adjusttheir overall culture in order to succeed in today’s business envi-ronment. Of the 31% who responded yes, they have done suchthings as become more customer service centric, worked onemployee morale, increased communication and transparency,offered better educational opportunities for employees andplanned more community activities, which allow employees tobecome more involved.
Have you had to adjust the overall culture of your organization in order to succeed intoday's business environment?
69%
31%
2016
■ Yes ■ No
Almost three-quarters of our respondents (72%) have notadjusted their best practices to keep pace with the needs of amillennial workforce. According to the 28% of respondentsthat have made changes, these adjustments include moreflexible hours, enhanced technology, increased benefits, andonline job postings.
Have you adjusted any of your Human Resources best practices to keep pacewith the needs of a millennial workforce?
72%
28%
2016
The majority of respondents (58%) are finding qualified candidates to fillvacant job openings. However, of those that are having a problem fillingopen positions, Middle Management (15%) and Laborers (14%) are thejob vacancies that employers are finding hardest to fill.
Do you have job openings that are hard to fill?
2016
■ No
■ Executive
■ Middle Management
■ Administrative
■ Laborer
58%15%
10%
14%
3%
0-0-AVZ2017 NEW_Layout 1 12/15/16 1:00 PM Page 10

I 11 I
Annual Raises
This year, there was a slight decrease to 83% (versus 86% a year ago) in annualraises in the zero to four percent range. Respondents with employees whoreceived raises above five percent increased to 12% versus 8% a year ago. It isinteresting to note that there are still firms (5% of respondents) who found itnecessary to decrease salaries.
During the past 12 months, what was the average annual raise granted to your employees?■ Decreased Salaries
■ 0-4%
■ 5-9%
■ 10-14%
■ Greater Than 15%
2012 2013 2014 2015 2016
91%
2% 5% 2%7%
83%
8% 4% 6% 6%
85% 86%83%
5%
12%9%
1%{ 1%{1%{
0-0-AVZ2017 NEW_Layout 1 12/15/16 9:47 AM Page 11
I 12 I
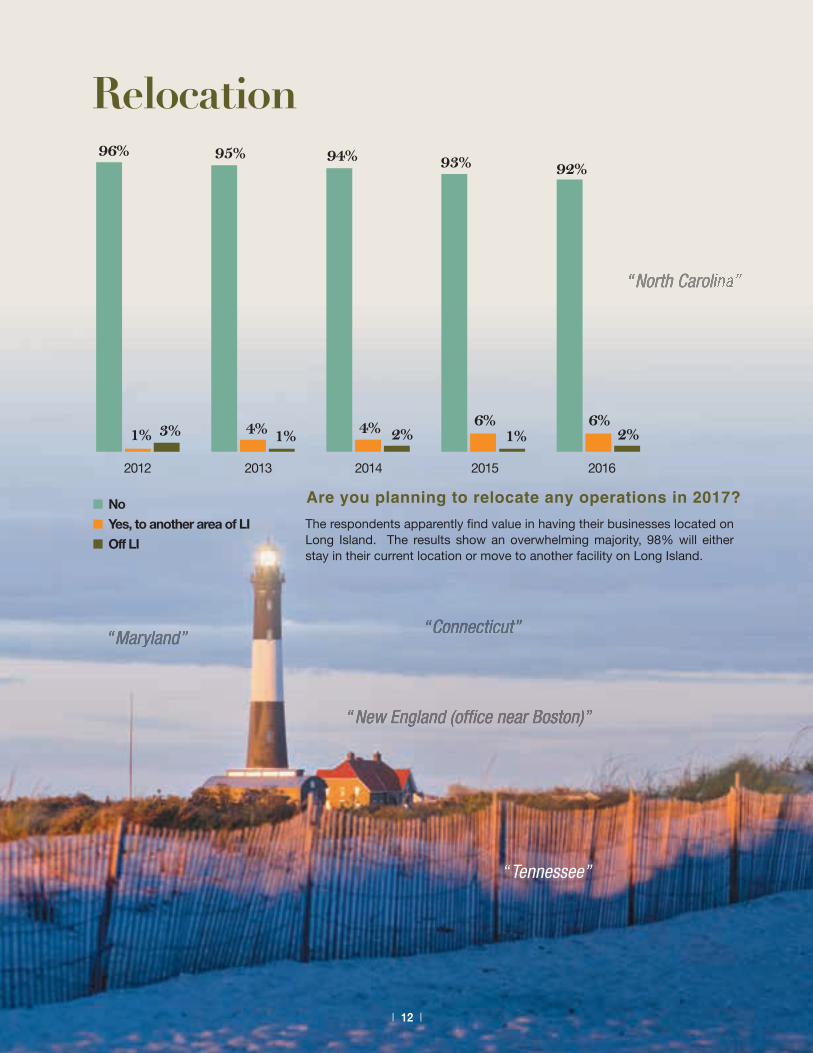
The respondents apparently find value in having their businesses located onLong Island. The results show an overwhelming majority, 98% will eitherstay in their current location or move to another facility on Long Island.
Are you planning to relocate any operations in 2017?■ No
■ Yes, to another area of LI
■ Off LI
2012 2013 2014 2015 2016
6% 6%
96%
1% 3%
95%
4% 1% 1%
94% 93% 92%
4% 2% 2%
Relocation
“Tennessee”
0-0-AVZ2017 NEW_Layout 1 12/15/16 9:48 AM Page 12

I 13 I
Growth Industries
For the third year in a row, Health Care is in the number one spot with 42% ofrespondents anticipating this to be the industry with the greatest potential forgrowth. Technology remains in the second position, as reported by 30% of therespondents.
Which industry do you feel has the greatest potentialfor growth on Long Island?
■ Tourism
■ Technology
■ Retail
■ Services
■ Health Care
■ Manufacturing
■ Other
2012
2013
2014
2015
2016
18%
5%
7% 28% 8% 47% 5%
2%3%
3% 3%
4%
8% 30% 42%14%
34% 11% 43% 4%
2%2%
39% 16% 33% 4%
3%
37% 19% 17% 6%
3%
“There is a severe shortage of software developers on long Island.”
0-0-AVZ2017 NEW_Layout 1 12/15/16 9:50 AM Page 13

I 14 I
Economic Indicators
It appears respondents are very optimistic about where the stock market indexwill go over the coming year. Almost half of all respondents (46%) believe thestock market will go up versus only 15% last year. The remaining respondents(27% in each category) are equally split between there being no change and themarket going down.
Where do you think the S&P 500 index will go over thecoming year?■ No Change
■ Up
■ Down
2012 2013 2014 2015 2016
35%38%
27% 27% 27%26%
52%
22%24%
46% 46%
30%
15%
47%
38%
0-0-AVZ2017 NEW_Layout 1 12/15/16 9:50 AM Page 14

I 15 I
Retirement
More than half (52%) of all respondents do not feel financially preparedfor retirement. While 48% believe they are prepared, many addedcomments that retirement depends on the continued upward trend ofthe stock and real estate markets or that they still plan to work to sup-plement income after they exit the daily workforce. Many respondentsstated that the value of their home is their “nest egg”.
Do you feel financially prepared for retirement?
■ Yes
■ No
48%52%
2016
“At least I think I'm prepared. But retirement for me won't be the same as how myparents defined retirement. I'll still be doing something to earn money.”
0-0-AVZ2017 NEW_Layout 1 12/15/16 9:51 AM Page 15

I 16 I
Real Estate
There seems to be a little less optimism this year versus last year that real estateprices will go up (48% in 2016 versus 57% in 2015). Over one-third (38%) believethat there will be no change, with only 14% anticipating that prices will go down.
What do you project will happen to residential realestate prices on Long Island in the coming year?
■ No Change
■ Up
■ Down
2012 2013 2014 2015 2016
46%
37%
17%
29%
63%
8%
35%
53%
12%14%
35%
57%
48%
38%
8%
“At some point we will level off. I don't think we will eversee prices as high as we did about 10-15 years ago.”
0-0-AVZ2017 NEW_Layout 1 12/15/16 9:52 AM Page 16

I 17 I
More than half of all respondents (57%) would not supportpaying more sales tax to reduce property taxes.
Would you support an increased sales taxin order to reduce property taxes?
According to one-third of all respondents (33%),our Economy is the most important issue facingour new President. Terrorism (28%) and theDeficit (15%) round out the top three most significant issues facing President Trump.
What is the most important issuefacing our next President?
■ Yes
■ No43%57%
6%7%
2%
■ Deficit
■ Immigration
■ Terrorism
■ Economy
■ Jobs/Unemployment
■ International Relations
■ Global Warming
15%
9%
28%33%
Current Events & Issues
An overwhelming majority (77%) believe that the UnitedStates will experience some impact from Great Britain’s European Union exit.
Do you believe Great Britainʼs EuropeanUnion exit will impact the United States?
Only 26% of respondents believe that their businesswill be impacted in some way by Great Britain’s EuropeanUnion exit. The vast majority (74%) do not believe itwill affect them in any way.
Do you believe that your business willbe impacted when Great Britain exitsthe European Union?
■ Major impact
■ Some impact
■ No impact
■ Major impact
■ Some impact
■ No impact
73%
23%
23%
74%
4%
3%
0-0-AVZ2017 NEW_Layout 1 12/15/16 9:53 AM Page 17

I 18 I
Just For Fun
Of the 32 teams in the NFL, less than half (14) were rated as possible SuperBowl winners. Of course, eternally optimistic New York fans (Jets andGiants combined) make up 20% of our responses. Once again, the NewEngland Patriots are the overwhelming favorite to win with 41% of respondentsbelieving they will go all the way. Here’s a fun fact: last year only 2% of re-spondents predicted the champion Broncos would win Super Bowl 50.Hope your team wins!
Which team do you predict will win Super Bowl 51?
41% 14% 11% 8% 7% 6% 4% 2% 1% <1% <1% <1% <1% <1% < 1% <1% <1% <1%
Don’tknow/care
0-0-AVZ2017 NEW_Layout 1 12/15/16 9:54 AM Page 18
I 19 I
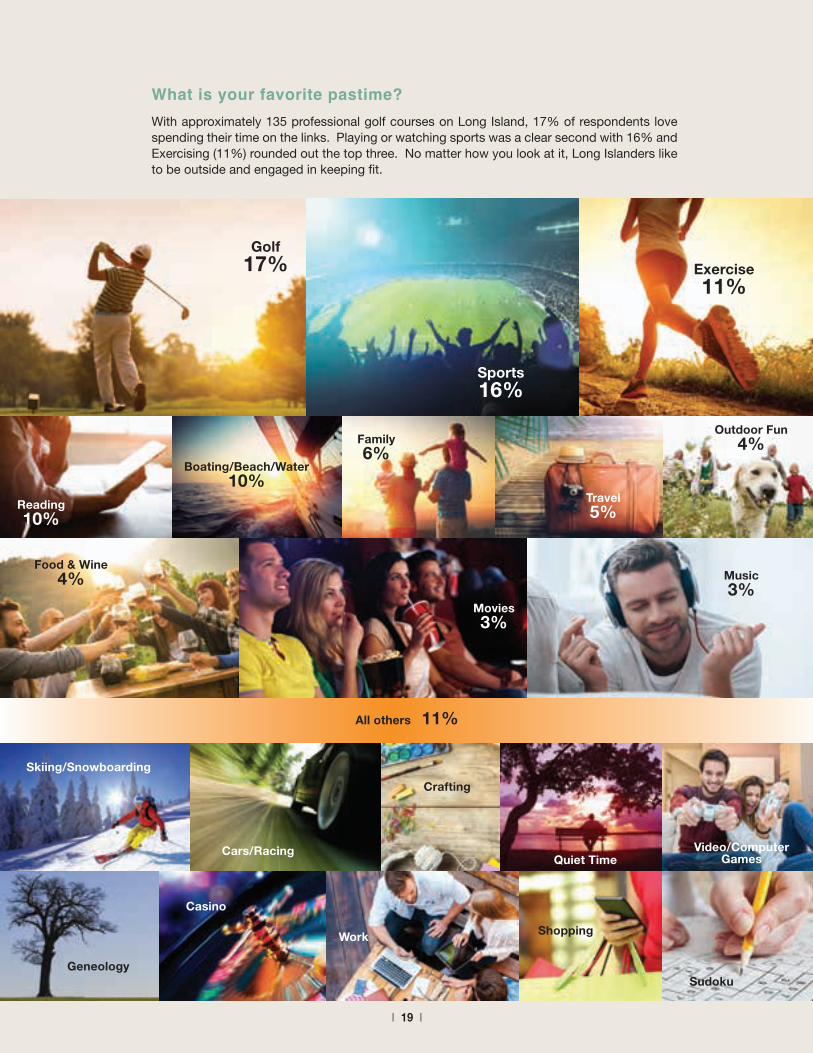
With approximately 135 professional golf courses on Long Island, 17% of respondents lovespending their time on the links. Playing or watching sports was a clear second with 16% andExercising (11%) rounded out the top three. No matter how you look at it, Long Islanders liketo be outside and engaged in keeping fit.
What is your favorite pastime?
Sports16%
Reading10%
Boating/Beach/Water10%
Family6%
Travel5%
Outdoor Fun4%
Golf17% Exercise
11%
Food & Wine4%
Movies3%
Music3%
All others 11%
Cars/Racing
Skiing/Snowboarding
Crafting
Quiet TimeVideo/Computer
Games
Geneology
Casino
Work Shopping
Sudoku
0-0-AVZ2017 NEW_Layout 1 12/15/16 9:55 AM Page 19

Editor & Writer
Annette EspositoMarketing DirectorAVZ
Page Layout & Design
Mike AlbanoCreative Director
PhotographyJim LennonPhotographerJim Lennon Photography, Inc.
PrinterOfficial Offset Corp.
libn.com
0-0-AVZ2017 NEW_Layout 1 12/15/16 9:55 AM Page 20