
2017 IRP Advisory Group - Puget Sound Energy · Overview February 3, ... Overview of Resource...
69
2017 IRP Advisory Group February 3, 2017 IRPAG
Transcript of 2017 IRP Advisory Group - Puget Sound Energy · Overview February 3, ... Overview of Resource...

2017 IRP Advisory Group
February 3, 2017 IRPAG
2
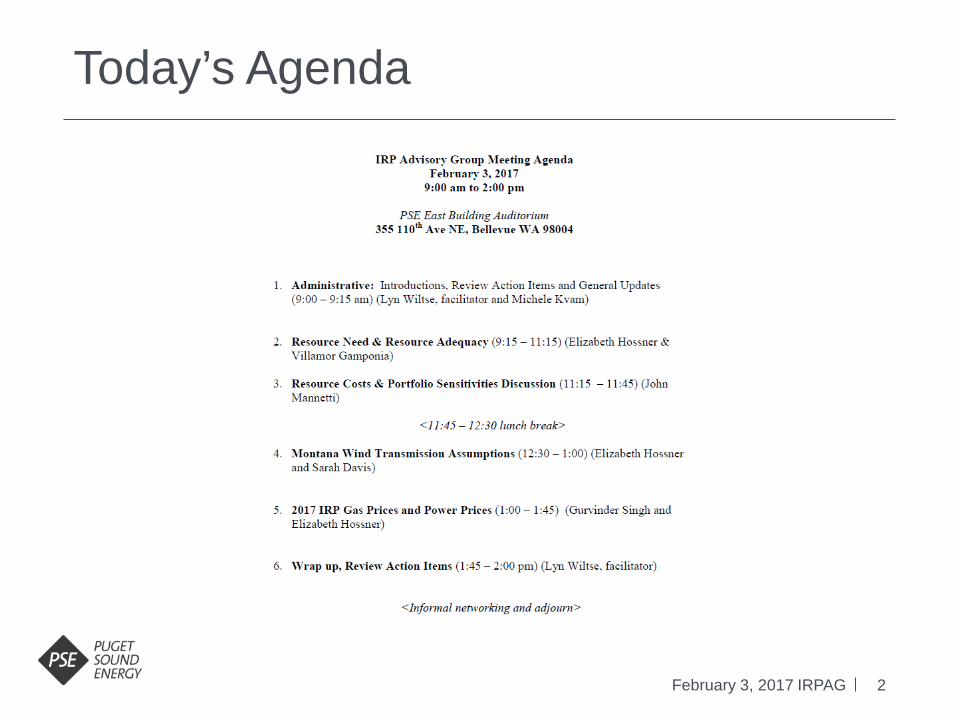
Today’s Agenda
February 3, 2017 IRPAG

3
Purpose of IRP
February 3, 2017 IRPAG
WAC 480-100-238 Integrated resource planning.
• (1) Purpose. Each electric utility regulated by the commission has the responsibility to meet its system demand with a least cost mix of energy supply resources and conservation. In furtherance of that responsibility, each electric utility must develop an "integrated resource plan."
4
Advisory Group Process: Update
February 3, 2017 IRPAG
New Resource: IRP Mailbox: [email protected] • Michele will check mailbox daily and respond or collaborate with others to draft response • Other PSE members will have access to the email as well
Sharing of Questions and Answers • Per Ground Rules: Michele or designee will reply with acknowledgement and answer question
or provide anticipated response date within 2 business days • Answers to questions sent to [email protected] will be shared with IRPAG Opt-in “sharing”
distribution list, along with the original question and receipt • Answers and questions will also be posted to pse.com : About PSE/Resource Planning
Alternative: Emails, calls, discussion outside Mailbox will not be posted • Will “reply all” within 2 days • If you email Phillip Popoff a question/request, please cc Michele Kvam
([email protected]) • Questions must meet ground rules – applicable to IRP only, please
5
Ground Rules: Types of Questions Questions We Can Answer • Focused and directly related to the IRP • Clarifying information on slides • Clarification of PSE’s process or what a scenario means, etc. • Number of questions must be manageable
Questions We May Not Answer • Require legal input/interpretation or have legal implications. • Questions that require significant resources to respond. • Silver Lining: May highlight items we can include in the IRP document,
so your question will be answered in the IRP filing.
Reminder: if not directly related to the IRP, we reserve the right not to answer

Resource Need & Resource Adequacy
February 3, 2017 IRPAG
7
Overview
February 3, 2017 IRPAG
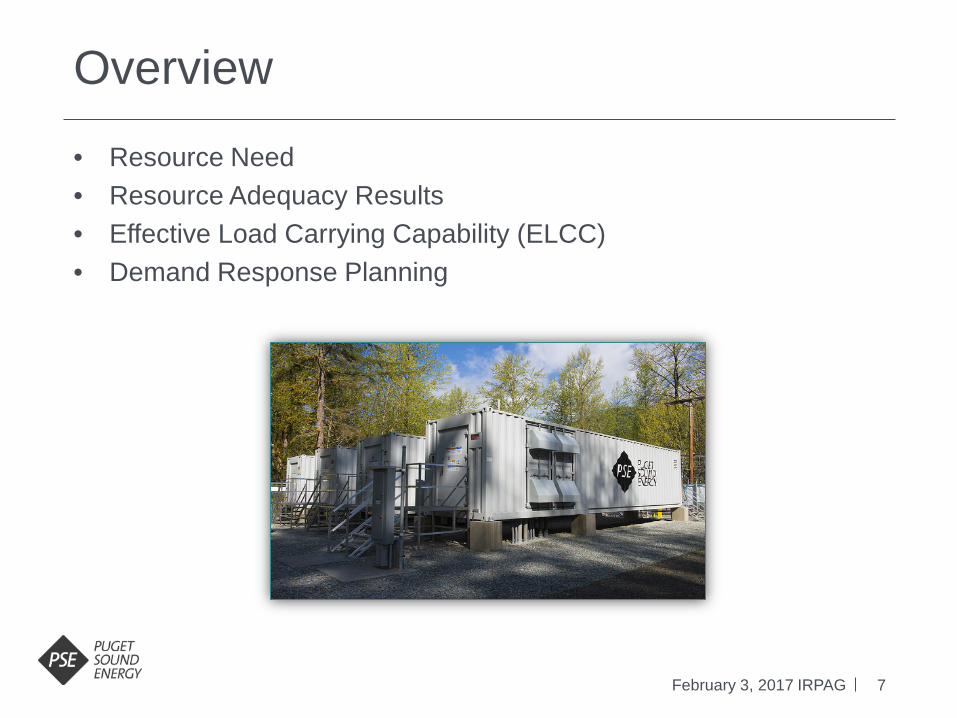
• Resource Need • Resource Adequacy Results • Effective Load Carrying Capability (ELCC) • Demand Response Planning

8
Calculating the Resource Need
February 3, 2017 IRPAG
December 2020 w/ Colstrip 1&2
Peak Demand 5,227 MW
Planning Margin 13.6%
Normal Peak Load + PM 5,927 MW
Operating Reserves 408 MW
Total Capacity Need 6,334 MW
Total Resources (No DSR) (4,357) MW
Available Mid-C Transmission (1,722) MW
Total 256 MW
Operating reserves on new resources 8 MW
Total Resource Deficit/(surplus)* 263 MW
*Resource need before demand side resources (DSR)

9
December Peak Capacity Deficit/(Surplus)
February 3, 2017 IRPAG
-5
12
-60
-19
286
293
314 41
5
788
828
838 91
1 990
1,31
4
1,38
0
1,44
8
1,51
7
1,59
5
1,61
0
1,69
1
108
223
263 38
2
758 825 90
6 1,06
4
1,46
7
1,53
7
1,57
8
1,67
6
1,78
2 2,14
7
2,24
8
2,34
9
2,45
0
2,55
6
2,59
6
2,70
4
-500
0
500
1,000
1,500
2,000
2,500
3,000
2018 2019 2020 2021 2022 2023 2024 2025 2026 2027 2028 2029 2030 2031 2032 2033 2034 2035 2036 2037
MW
Total Need after 2015 IRP DSR
2017 IRP Total Need Before DSR
10
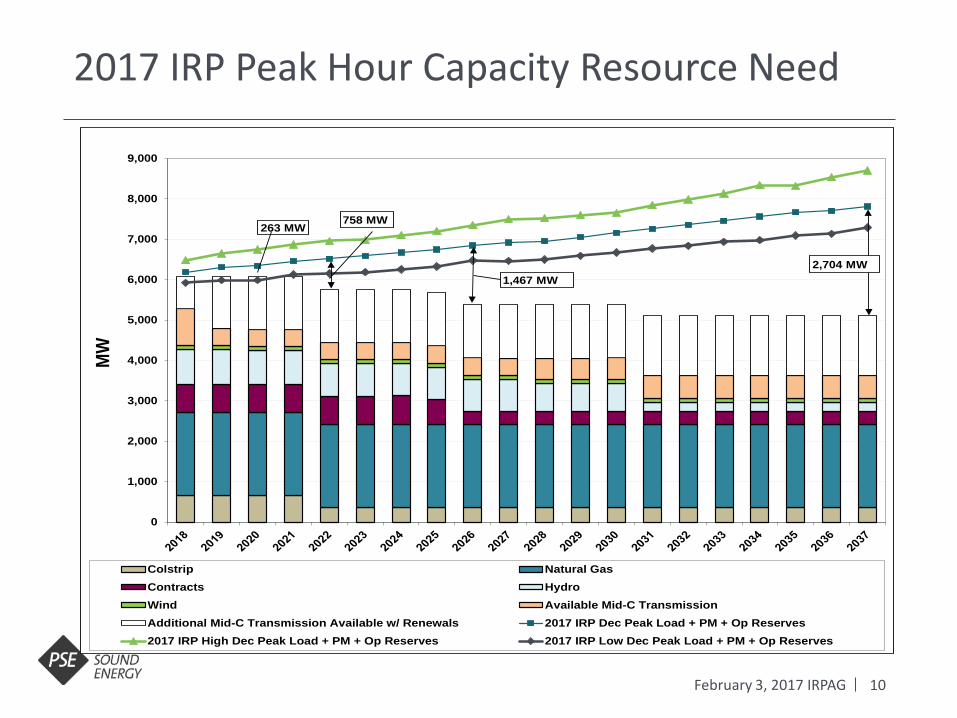
2017 IRP Peak Hour Capacity Resource Need
February 3, 2017 IRPAG
0
1,000
2,000
3,000
4,000
5,000
6,000
7,000
8,000
9,000
MW
Colstrip Natural GasContracts HydroWind Available Mid-C TransmissionAdditional Mid-C Transmission Available w/ Renewals 2017 IRP Dec Peak Load + PM + Op Reserves2017 IRP High Dec Peak Load + PM + Op Reserves 2017 IRP Low Dec Peak Load + PM + Op Reserves
2,704 MW1,467 MW
758 MW263 MW

11
Overview
February 3, 2017 IRPAG
• Resource Need • Resource Adequacy Results • Effective Load Carrying Capability (ELCC) • Demand Response Planning
12
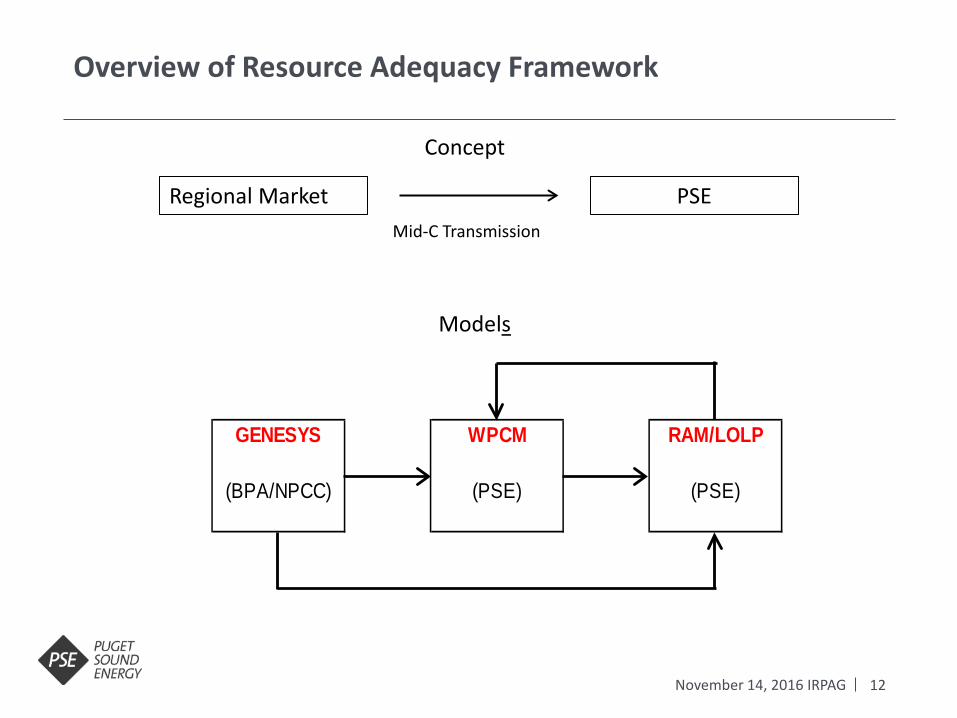
Overview of Resource Adequacy Framework
November 14, 2016 IRPAG
GENESYS WPCM RAM/LOLP
(BPA/NPCC) (PSE) (PSE)
Regional Market PSE Mid-C Transmission
Concept
Models
13
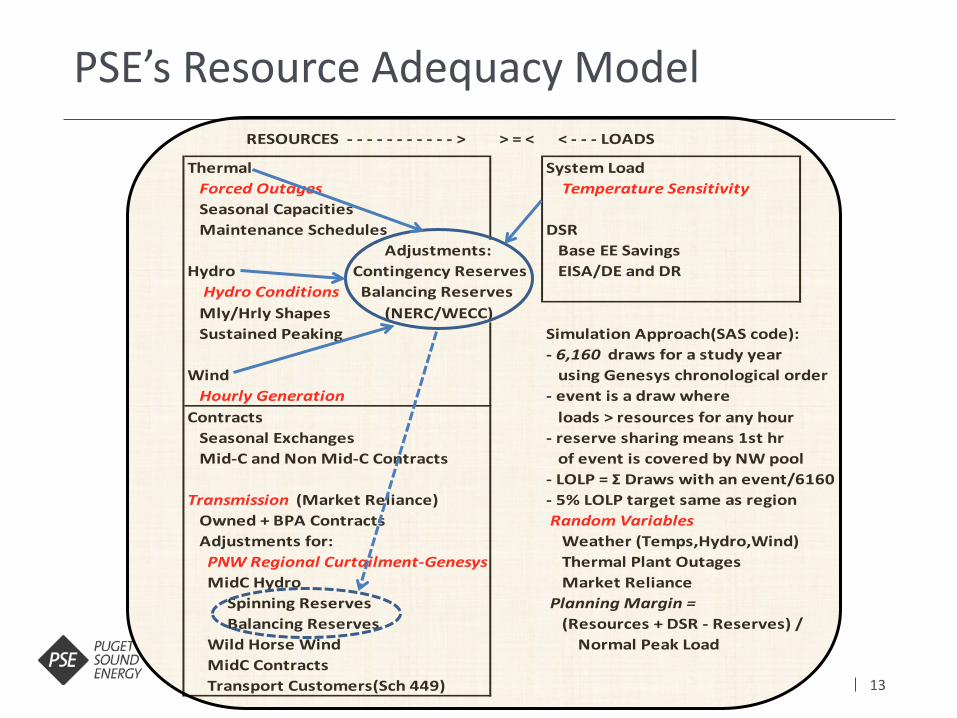
PSE’s Resource Adequacy Model > = <
Thermal System Load Forced Outages Temperature Sensitivity Seasonal Capacities Maintenance Schedules DSR
Adjustments: Base EE SavingsHydro Contingency Reserves EISA/DE and DR Hydro Conditions Balancing Reserves Mly/Hrly Shapes (NERC/WECC) Sustained Peaking Simulation Approach(SAS code):
- 6,160 draws for a study yearWind using Genesys chronological order Hourly Generation - event is a draw whereContracts loads > resources for any hour Seasonal Exchanges - reserve sharing means 1st hr Mid-C and Non Mid-C Contracts of event is covered by NW pool
- LOLP = Ʃ Draws with an event/6160Transmission (Market Reliance) - 5% LOLP target same as region Owned + BPA Contracts Random Variables Adjustments for: Weather (Temps,Hydro,Wind) PNW Regional Curtailment-Genesys Thermal Plant Outages MidC Hydro Market Reliance Spinning Reserves Planning Margin = Balancing Reserves (Resources + DSR - Reserves) / Wild Horse Wind Normal Peak Load MidC Contracts Transport Customers(Sch 449)
RESOURCES - - - - - - - - - - - > < - - - LOADS
14
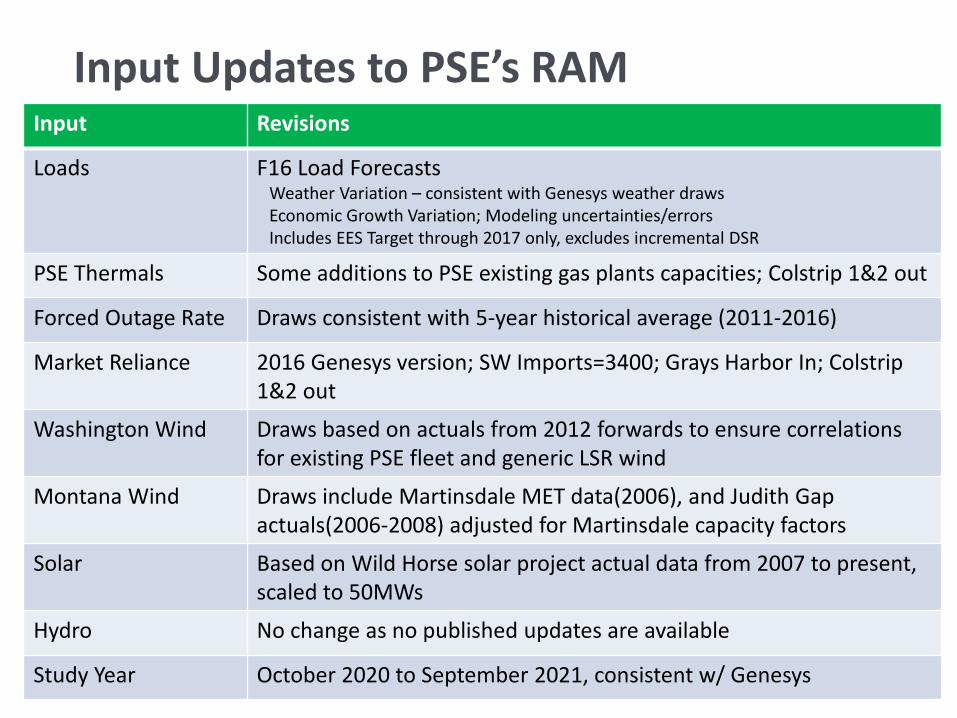
Input Updates to PSE’s RAM
February 3, 2017 IRPAG
Input Revisions
Loads F16 Load Forecasts Weather Variation – consistent with Genesys weather draws Economic Growth Variation; Modeling uncertainties/errors Includes EES Target through 2017 only, excludes incremental DSR
PSE Thermals Some additions to PSE existing gas plants capacities; Colstrip 1&2 out
Forced Outage Rate Draws consistent with 5-year historical average (2011-2016)
Market Reliance 2016 Genesys version; SW Imports=3400; Grays Harbor In; Colstrip 1&2 out
Washington Wind Draws based on actuals from 2012 forwards to ensure correlations for existing PSE fleet and generic LSR wind
Montana Wind Draws include Martinsdale MET data(2006), and Judith Gap actuals(2006-2008) adjusted for Martinsdale capacity factors
Solar Based on Wild Horse solar project actual data from 2007 to present, scaled to 50MWs
Hydro No change as no published updates are available
Study Year October 2020 to September 2021, consistent w/ Genesys
15
Consistent Treatment of Colstrip 1&2 in the Models
February 3, 2017 IRPAG
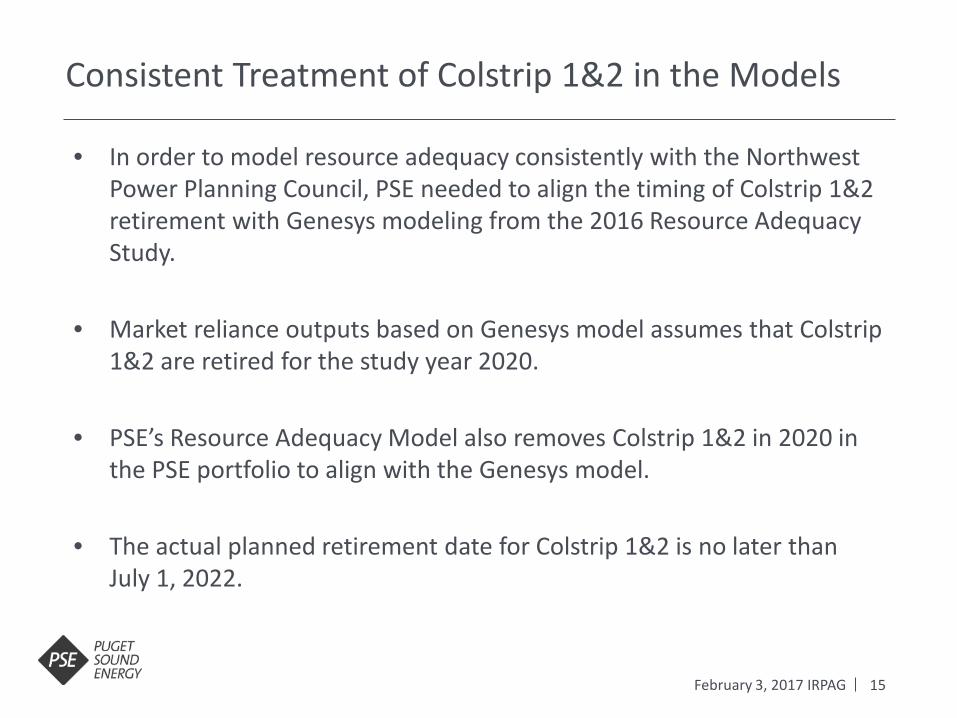
• In order to model resource adequacy consistently with the Northwest Power Planning Council, PSE needed to align the timing of Colstrip 1&2 retirement with Genesys modeling from the 2016 Resource Adequacy Study.
• Market reliance outputs based on Genesys model assumes that Colstrip 1&2 are retired for the study year 2020.
• PSE’s Resource Adequacy Model also removes Colstrip 1&2 in 2020 in the PSE portfolio to align with the Genesys model.
• The actual planned retirement date for Colstrip 1&2 is no later than July 1, 2022.
16
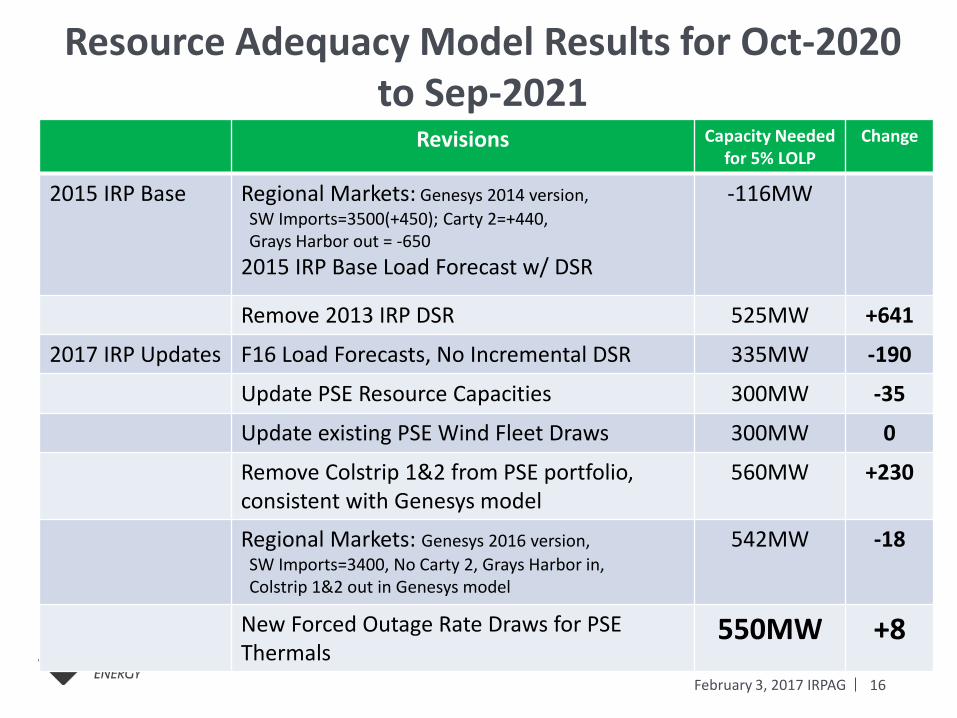
Resource Adequacy Model Results for Oct-2020 to Sep-2021
February 3, 2017 IRPAG
Revisions Capacity Needed for 5% LOLP
Change
2015 IRP Base Regional Markets: Genesys 2014 version, SW Imports=3500(+450); Carty 2=+440, Grays Harbor out = -650 2015 IRP Base Load Forecast w/ DSR
-116MW
Remove 2013 IRP DSR 525MW +641
2017 IRP Updates F16 Load Forecasts, No Incremental DSR 335MW -190
Update PSE Resource Capacities 300MW -35
Update existing PSE Wind Fleet Draws 300MW 0
Remove Colstrip 1&2 from PSE portfolio, consistent with Genesys model
560MW +230
Regional Markets: Genesys 2016 version, SW Imports=3400, No Carty 2, Grays Harbor in, Colstrip 1&2 out in Genesys model
542MW -18
New Forced Outage Rate Draws for PSE Thermals
550MW +8

17
Calculating the Resource Need
February 3, 2017 IRPAG
December 2020 w/ Colstrip 1&2
Peak Demand 5,227 MW
Planning Margin 13.6%
Normal Peak Load + PM 5,927 MW
Operating Reserves 408 MW
Total Capacity Need 6,334 MW
Total Resources (No DSR) (4,357) MW
Available Mid-C Transmission (1,722) MW
Total 256 MW
Operating reserves on new resources 8 MW
Total Resource Deficit/(surplus)* 263 MW
*Resource need before demand side resources (DSR)
December 2020 w/o Colstrip 1&2
5,227 MW
13.6%
5,927 MW
399 MW
6,325 MW
(4,058) MW
(1,717) MW
550 MW
17 MW
567 MW
18
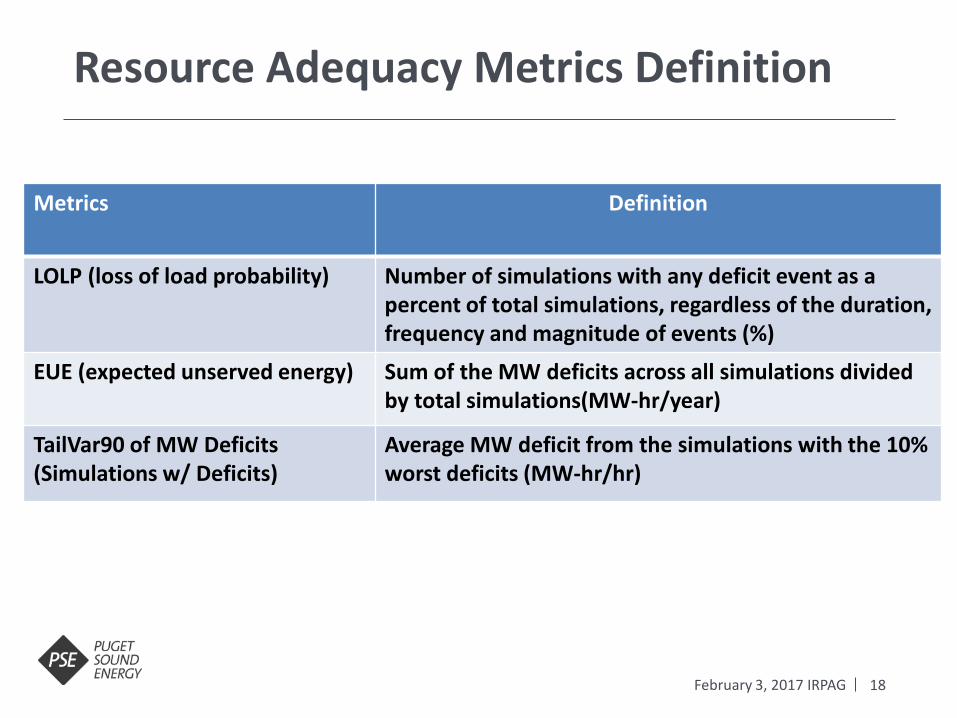
Resource Adequacy Metrics Definition
February 3, 2017 IRPAG
Metrics Definition
LOLP (loss of load probability) Number of simulations with any deficit event as a percent of total simulations, regardless of the duration, frequency and magnitude of events (%)
EUE (expected unserved energy) Sum of the MW deficits across all simulations divided by total simulations(MW-hr/year)
TailVar90 of MW Deficits (Simulations w/ Deficits)
Average MW deficit from the simulations with the 10% worst deficits (MW-hr/hr)

19
Resource Adequacy Model 2017IRP Metrics
February 3, 2017 IRPAG
MW peaker needed or EUE are inputs into the peak capacity credit calculations
Peak capacity credit approach used is ELCC (effective load carrying capability) defined as the equivalent peaker capacity change to get the same LOLP or EUE as a percent of the resource capacity added or removed from portfolio
PSE Portfolio for Study Year: Oct-2020 to Sep-2021 5% LOLP
MW Capacity Needed 550 MW
EUE (expected unserved energy) 34.6 MW-hr/year
TailVar90 of MW Deficit (Simulations w/ Deficit Events) 460 MW-hr/hr

20
Overview
February 3, 2017 IRPAG
• Resource Need • Resource Adequacy Results • Effective Load Carrying Capability (ELCC) • Demand Response Planning
21
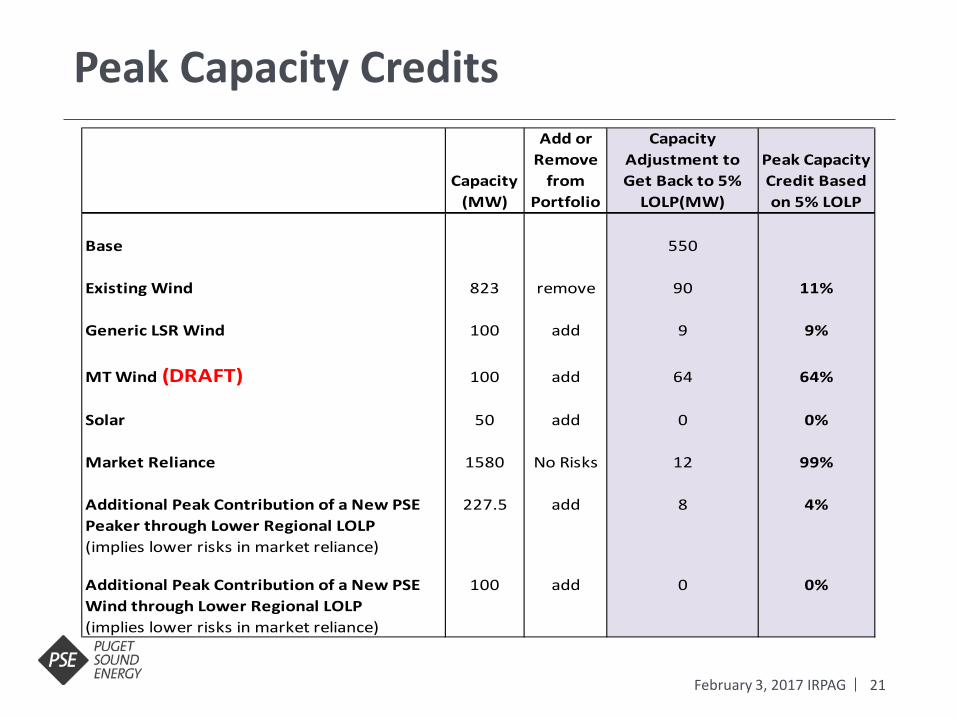
Peak Capacity Credits
February 3, 2017 IRPAG
Capacity(MW)
Add or Remove
from Portfolio
Capacity Adjustment to Get Back to 5%
LOLP(MW)
Peak Capacity Credit Based on 5% LOLP
Base 550
Existing Wind 823 remove 90 11%
Generic LSR Wind 100 add 9 9%
MT Wind (DRAFT) 100 add 64 64%
Solar 50 add 0 0%
Market Reliance 1580 No Risks 12 99%
Additional Peak Contribution of a New PSE 227.5 add 8 4%Peaker through Lower Regional LOLP(implies lower risks in market reliance)
Additional Peak Contribution of a New PSE 100 add 0 0%Wind through Lower Regional LOLP(implies lower risks in market reliance)

22
Peak Capacity Credit for Battery
February 3, 2017 IRPAG
Capacity(MW)
Add or Remove
from Portfolio
Capacity Adjustment to Get Back to 5%
LOLP(MW)
Peak Capacity Credit Based on 5% LOLP
EUE @ 5% LOLP
Capacity Adjustment to Get EUE @ 5%
LOLP(MW)
Peak Capacity Credit Based on EUE @ 5%
LOLPFinal EUE
Base 550 34.6Battery Lithium Ion, 2Hr, 25MW max per hr 25 add 24 96% 36.3 15 60% 34.5 Lithium Ion, 4Hr, 25MW max per hr 25 add 24 96% 35.0 22 88% 34.7 Lithium Ion, 2Hr, 50MW max per hr 50 add 50 100% 34.5 50 100% 34.5 Flow Battery, 4Hr, 25MW max per hr 25 add 24 96% 35.5 19 76% 34.6 Flow Battery, 6Hr, 25MW max per hr 25 add 24 96% 35.3 20 80% 34.5
LOLP Does: Count New Simulations That Experience a Resource Deficiency LOLP Does Not: Reflect Making Deficiencies Worse in an Event That Was Already Short
23
Overview
February 3, 2017 IRPAG
• Resource Need • Resource Adequacy Results • Effective Load Carrying Capability (ELCC) • Demand Response Planning

24
Demand Response Planning
February 3, 2017 IRPAG
Determine The Characteristics Needed from Demand Response • What we need versus what we can have • What characteristics should a DR program have to adequately displace a
peaker of a given size? • Focused on load that needs to be carried, rather than the load that
can be carried by a specific program
Key Question • LOLP: Only focuses on new simulations that experience a resource • LOLP Does Not: Address bad simulations where events are made worse
in frequency, duration, and magnitude • Question: Shouldn’t we be concerned about making already bad
simulations worse?

25
How to Estimate Reliability Needed From Demand Response
February 3, 2017 IRPAG
The equivalent DR program is described by the difference before and after removing a peaker based on: duration of deficit events by hour, event frequency(number of events in a year), and magnitude of deficits in MWs time between deficit events
26
Approach to Describing the Need
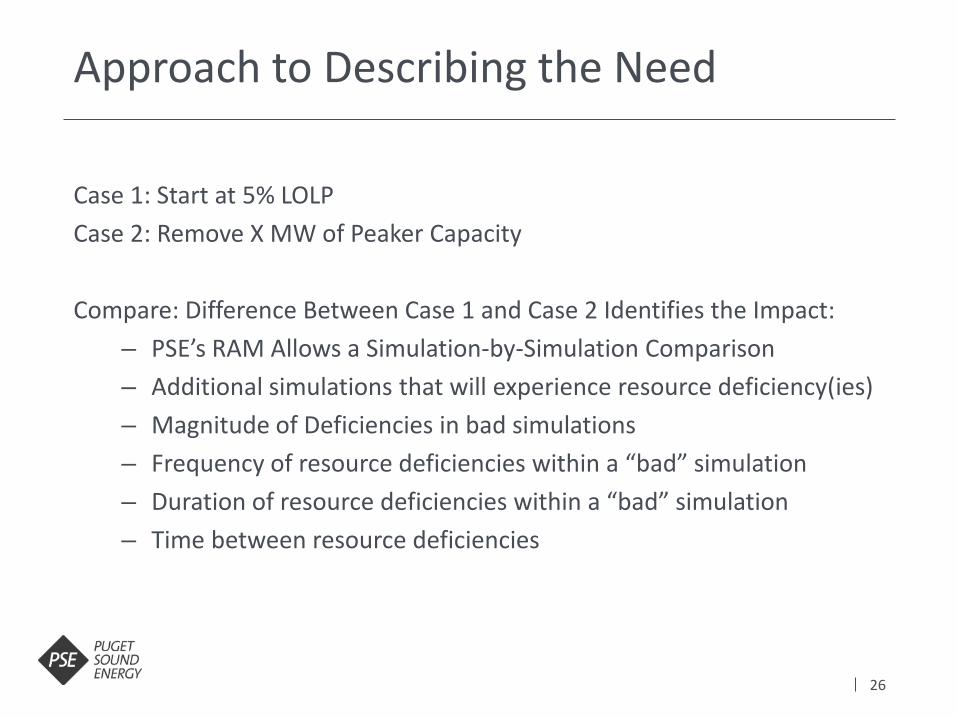
Case 1: Start at 5% LOLP Case 2: Remove X MW of Peaker Capacity Compare: Difference Between Case 1 and Case 2 Identifies the Impact:
– PSE’s RAM Allows a Simulation-by-Simulation Comparison – Additional simulations that will experience resource deficiency(ies) – Magnitude of Deficiencies in bad simulations – Frequency of resource deficiencies within a “bad” simulation – Duration of resource deficiencies within a “bad” simulation – Time between resource deficiencies
27
Using a Layered Approach
February 3, 2017 IRPAG
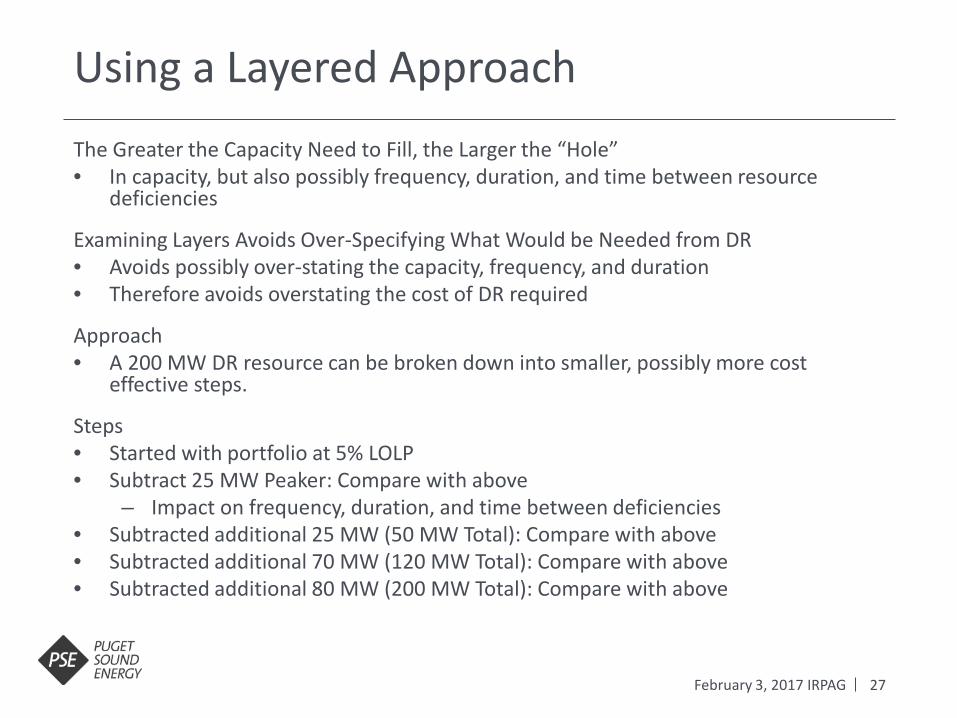
The Greater the Capacity Need to Fill, the Larger the “Hole” • In capacity, but also possibly frequency, duration, and time between resource
deficiencies
Examining Layers Avoids Over-Specifying What Would be Needed from DR • Avoids possibly over-stating the capacity, frequency, and duration • Therefore avoids overstating the cost of DR required
Approach • A 200 MW DR resource can be broken down into smaller, possibly more cost
effective steps.
Steps • Started with portfolio at 5% LOLP • Subtract 25 MW Peaker: Compare with above
– Impact on frequency, duration, and time between deficiencies • Subtracted additional 25 MW (50 MW Total): Compare with above • Subtracted additional 70 MW (120 MW Total): Compare with above • Subtracted additional 80 MW (200 MW Total): Compare with above

28
Summary of Results
February 3, 2017 IRPAG
LOLP Only: DR calls at most 2x a year for a maximum of 2 hour duration
LOLP + EUE: DR calls at most 6x a year for a maximum of 5-8 hour duration
Scenarios LOLP Only Duration (hours)
LOLP Only Frequency
LOLP+EUE Duration (hours)
LOLP+EUE Frequency
Base less 25MW 2 1 5 6 Base less 25 MW more(-50MW) 2 2 6 6 Base less 70 MW more(-120MW) 2 2 7 6 Base less 80 MW more(-200MW) 2 2 8 6
If All We Cared About Was LOLP
If We Needed to Make Portfolio
Whole

29
Analysis Approach
February 3, 2017 IRPAG
Assumes DR is dispatchable, peaker has a 3% forced outage rate
DR programs are stackable based on size
From a base portfolio where 5% LOLP is achieved, reduce peaker capacity by some MWs incrementally
Examine the characteristics of incremental deficits created by the reduction in peaker capacity
LOLP EUE Simulations with Deficits
Number of Deficit Events
Base 5% 34.6 306 522
Base less 25MW 5.4% 39.7 335 (+29) 592 (+70)
Base less 50MW 6.1% 44.4 376 (+41) 667 (+75)
Base less 120MW 7.2% 64.0 441 (+65) 837 (+170)
Base less 200MW 8.9% 95.6 550 (+109) 1129 (+292)
30
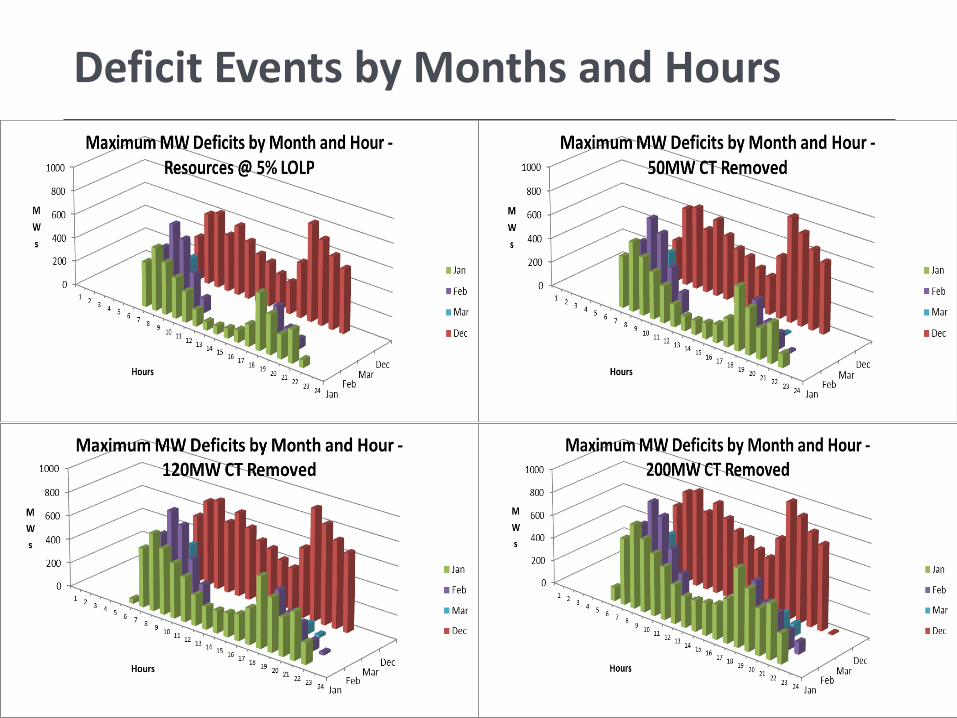
Deficit Events by Months and Hours
31
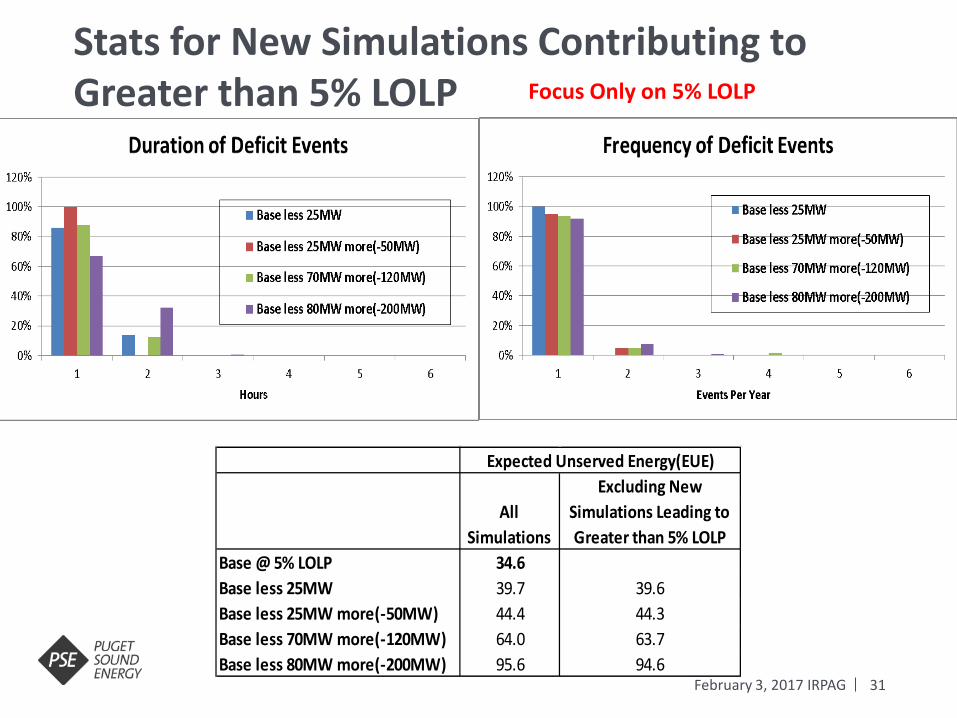
Stats for New Simulations Contributing to Greater than 5% LOLP
February 3, 2017 IRPAG
Excluding NewAll
SimulationsSimulations Leading to Greater than 5% LOLP
Base @ 5% LOLP 34.6Base less 25MW 39.7 39.6Base less 25MW more(-50MW) 44.4 44.3Base less 70MW more(-120MW) 64.0 63.7Base less 80MW more(-200MW) 95.6 94.6
Expected Unserved Energy(EUE)
Focus Only on 5% LOLP

32
Duration of Deficit Events for all Simulations With Deficit (Incremental Impact Only)
Make Portfolio Whole
33
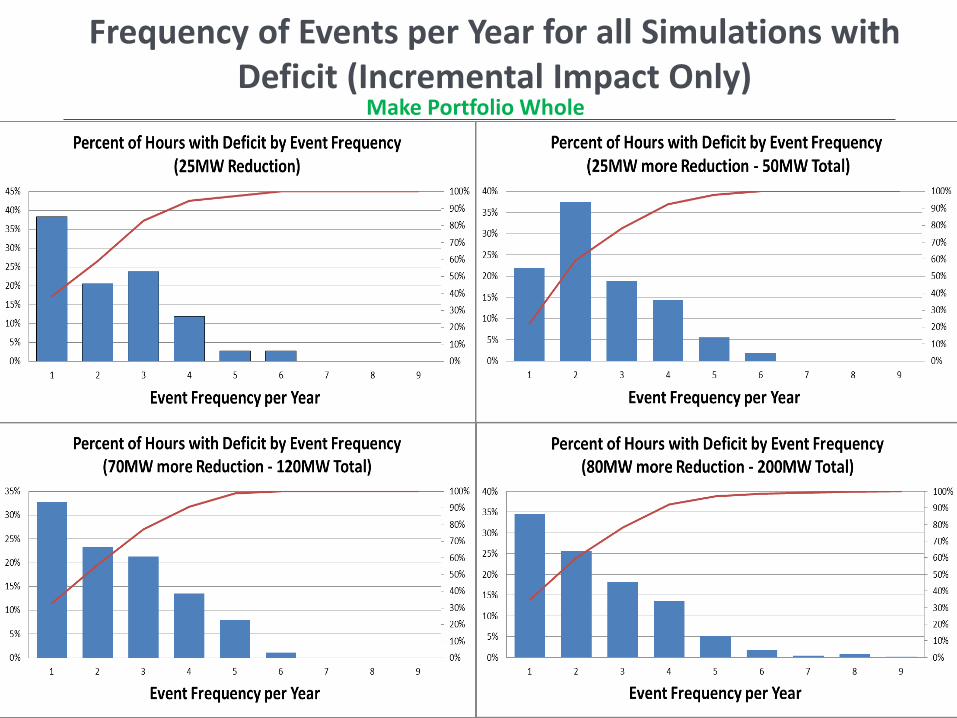
Frequency of Events per Year for all Simulations with Deficit (Incremental Impact Only)
Make Portfolio Whole
34
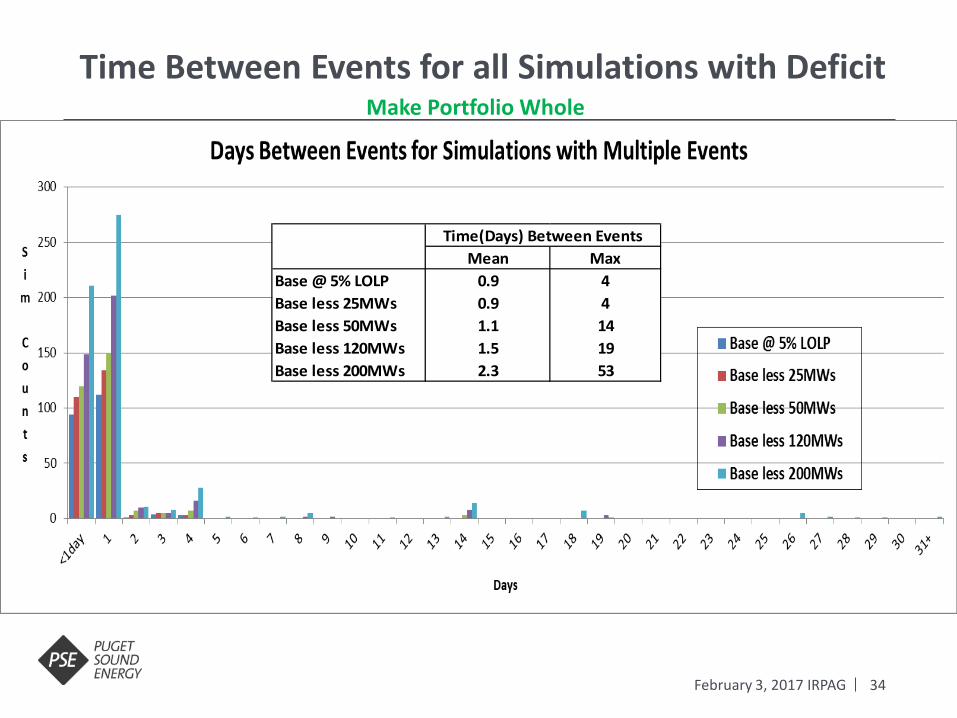
Time Between Events for all Simulations with Deficit
February 3, 2017 IRPAG
Mean MaxBase @ 5% LOLP 0.9 4Base less 25MWs 0.9 4Base less 50MWs 1.1 14Base less 120MWs 1.5 19Base less 200MWs 2.3 53
Time(Days) Between Events
Make Portfolio Whole
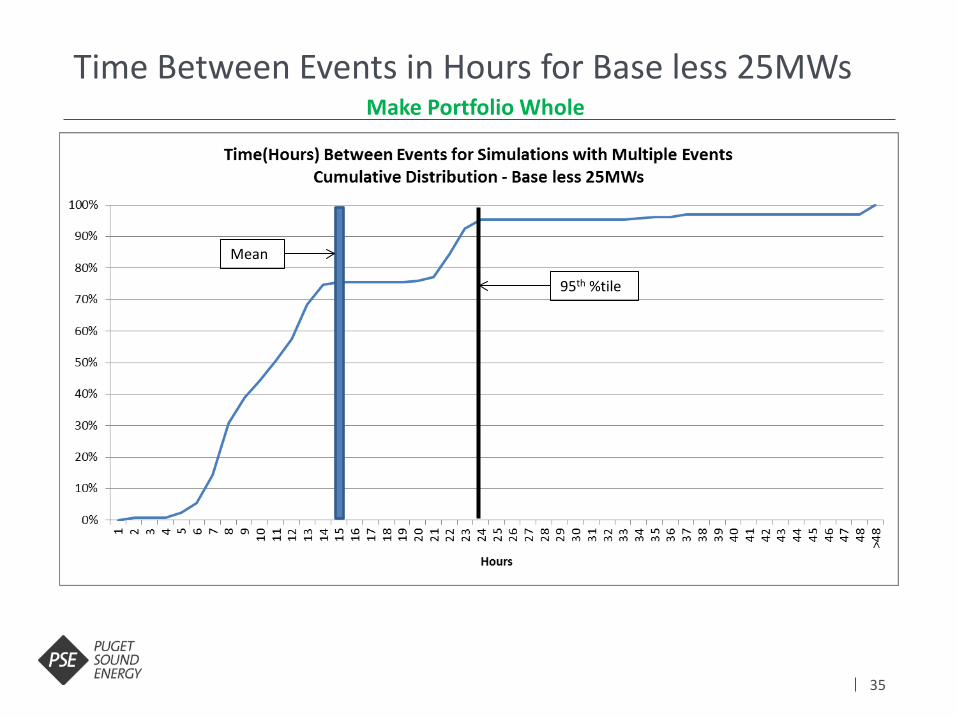
35
Time Between Events in Hours for Base less 25MWs Make Portfolio Whole
Mean
95th %tile
36
Next Steps
February 3, 2017 IRPAG
Refine analysis of time between deficiencies to hourly rather than daily
Examine tradeoff between duration and time between deficiencies • Example, a 6 hour DR event might cover multiple deficiencies
Consider working with Navigant to refine potential assessment to shape DR to fit PSE’s resource need. Consider just estimating the ELCC of a 4-hour, once a day or twice a day demand response resource of a given MW magnitude, or variations thereof. Next IRP: Examine the ELCC implications of day-ahead demand response • Not effective for covering resource deficiencies created by forced
outages…or not totally effective.
Resource Costs & Portfolio Sensitivities Discussion
February 3, 2017 IRPAG
38
Purpose of Generic Resources
February 3, 2017 IRPAG
• Resource decisions are not made in the IRP. Acquisition decisions are made in a separate process as detailed in WAC 480-107.
• In the acquisition process, generic resource costs for near-term decisions are replaced with actual resource alternatives.
• Generic resource costs in the IRP are helpful just to let participants in the acquisition process know the range of what PSE thinks it may see for new resources, however, bidders will compete against each other with a PSE self-build as a back-stop.
• The alternatives evaluated in the RFP do not compete against the generic resources assumed in PSE’s IRP
39
Frame CT Cost Assumptions
February 3, 2017 IRPAG
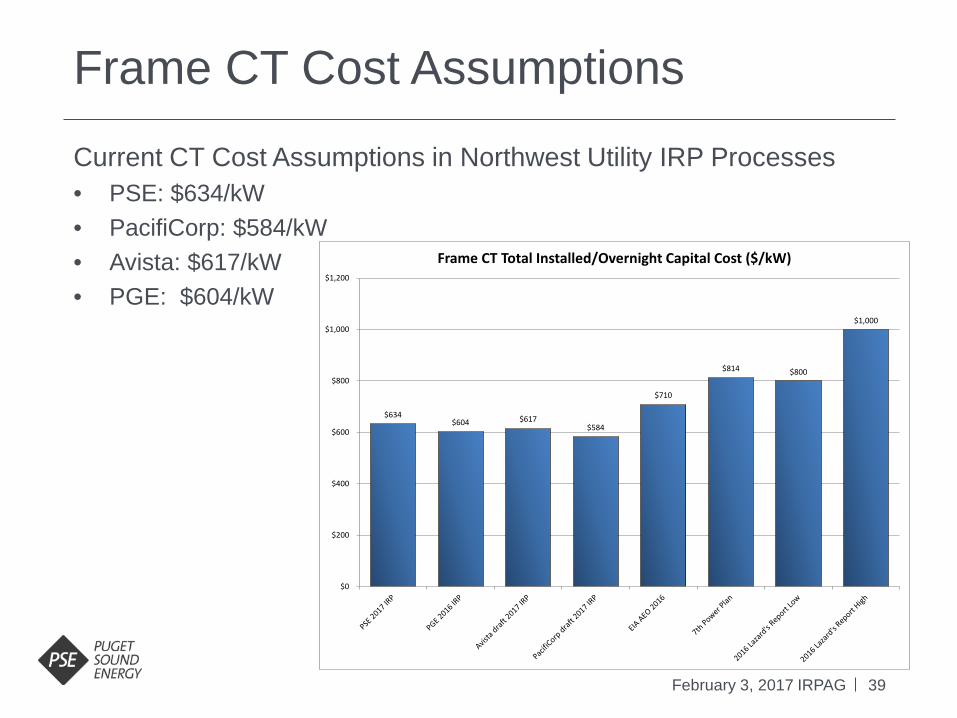
Current CT Cost Assumptions in Northwest Utility IRP Processes • PSE: $634/kW • PacifiCorp: $584/kW • Avista: $617/kW • PGE: $604/kW
$634 $604 $617
$584
$710
$814 $800
$1,000
$0
$200
$400
$600
$800
$1,000
$1,200
Frame CT Total Installed/Overnight Capital Cost ($/kW)
40
Other Thermal Plant Input
February 3, 2017 IRPAG
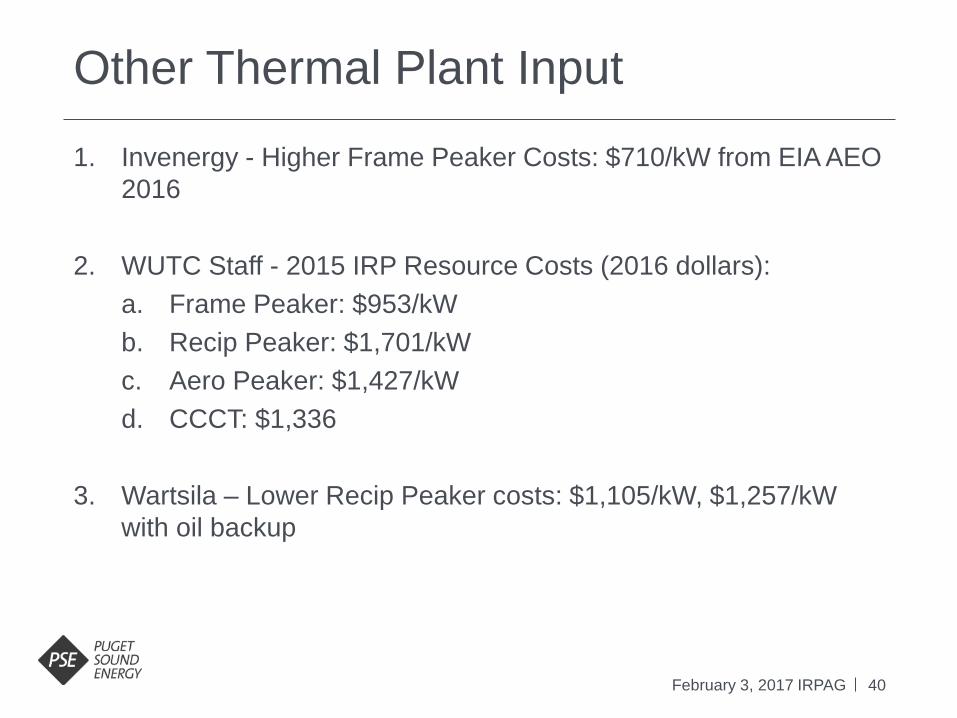
1. Invenergy - Higher Frame Peaker Costs: $710/kW from EIA AEO 2016
2. WUTC Staff - 2015 IRP Resource Costs (2016 dollars): a. Frame Peaker: $953/kW b. Recip Peaker: $1,701/kW c. Aero Peaker: $1,427/kW d. CCCT: $1,336
3. Wartsila – Lower Recip Peaker costs: $1,105/kW, $1,257/kW
with oil backup
41
Wind Resource Cost Update
February 3, 2017 IRPAG
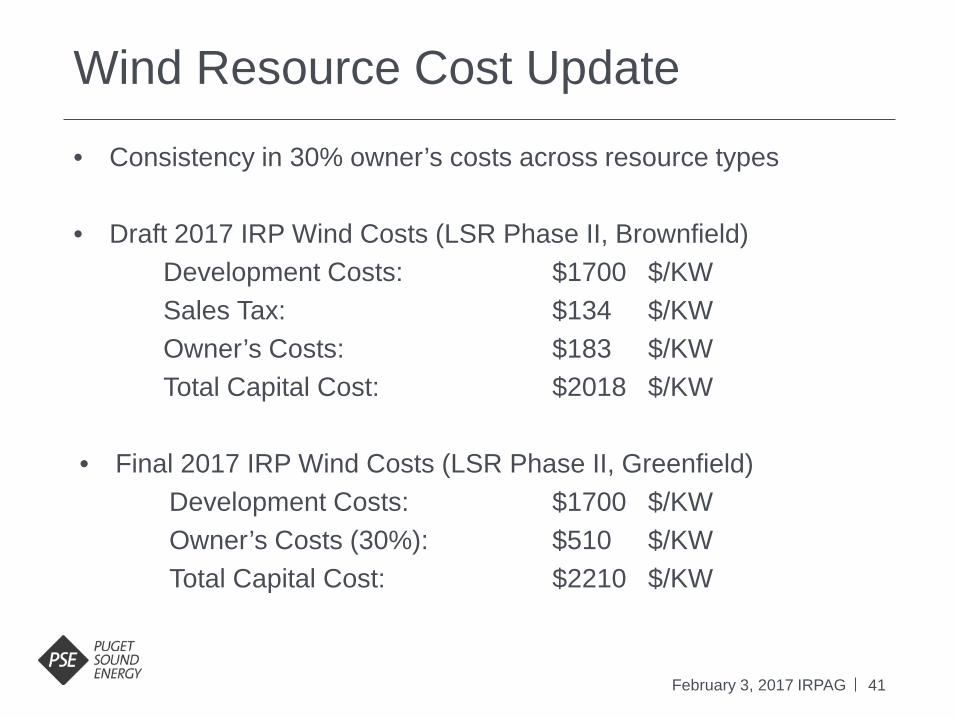
• Consistency in 30% owner’s costs across resource types • Draft 2017 IRP Wind Costs (LSR Phase II, Brownfield)
Development Costs: $1700 $/KW Sales Tax: $134 $/KW Owner’s Costs: $183 $/KW Total Capital Cost: $2018 $/KW
• Final 2017 IRP Wind Costs (LSR Phase II, Greenfield) Development Costs: $1700 $/KW Owner’s Costs (30%): $510 $/KW Total Capital Cost: $2210 $/KW
42
Wind Cost Estimates
February 3, 2017 IRPAG
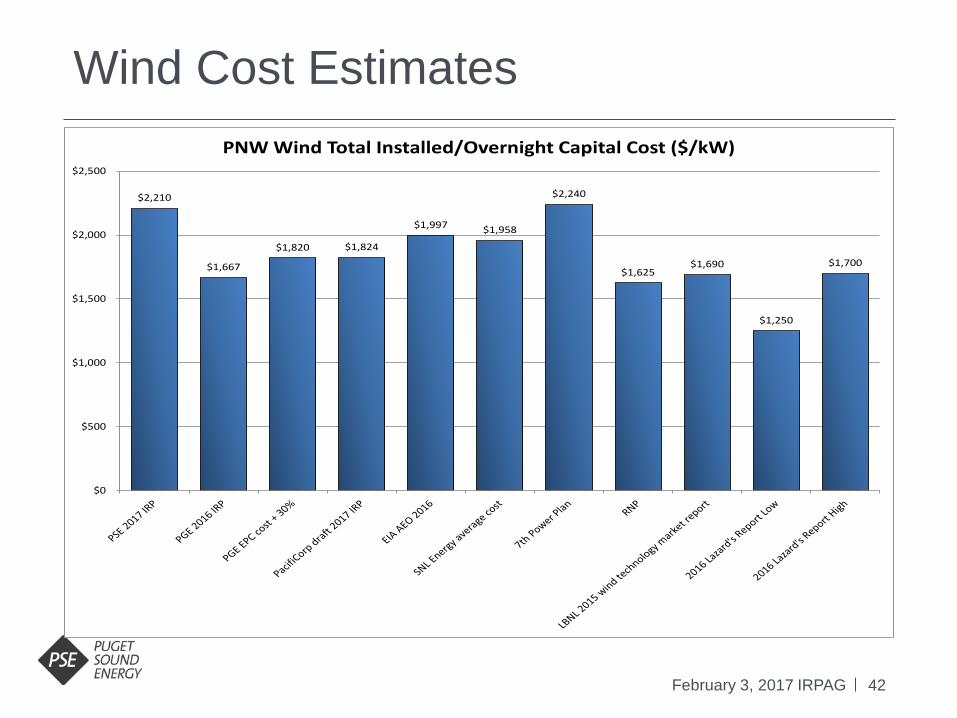
$2,210
$1,667
$1,820 $1,824
$1,997 $1,958
$2,240
$1,625 $1,690
$1,250
$1,700
$0
$500
$1,000
$1,500
$2,000
$2,500
PNW Wind Total Installed/Overnight Capital Cost ($/kW)
43
Offshore Wind
February 3, 2017 IRPAG
WUTC Staff: Model offshore wind in IRP • 2016 Lazard’s Report: $3,625/kW • EIA AEO 2016: $6,289/kW

44
Portfolio Sensitivities
February 3, 2017 IRPAG
Sensitivity Alternatives Analyzed A Colstrip
How do different retirement dates affect decisions about replacing Colstrip resources?
Baseline – Colstrip units 1&2 retire mid-2022, units 3&4 remain in service 1. Retire units 1&2 in 2018 2. Retire units 3&4 in 2030
B Demand-side Resources (DSR) How much does DSR reduce cost, risk and emissions?
Baseline – All cost-effective DSR per RCW 19.285 requirements 1. No DSR. All future needs met with supply-side resources.
C Thermal Mix How does changing the mix of resources affect portfolio cost and risk?
Baseline – Frame peakers selected as lowest cost addition in the Base Scenario deterministic portfolio 1. All CCCT additions 2. Mix of CCCT and frame peaker additions
D Gas Plant Location What if gas plants were built in eastern Washington instead of PSE service territory?
Baseline – Gas plants located in PSE Service territory 1. Model gas plants with gas transport costs and transmission costs from eastern Washington.
Highlighted sensitivities indicate stakeholder suggestions

45
Portfolio Sensitivities
February 3, 2017 IRPAG
Sensitivity Alternatives Analyzed E Gas Transport/Oil Backup for Peakers
What if peakers cannot rely on oil for backup fuel and must have firm gas supply instead?
Baseline – No firm pipeline capacity with 48 hours of oil backup 1. 100% firm pipeline capacity with no oil backup
F Energy Storage What is the cost difference between a portfolio with and without energy storage?
Baseline – Batteries and pumped hydro included only if chosen economically 1. Add X MW battery in 2022 instead of economically chosen peaker. 2. Add X MW pumped hydro storage in 2022 instead of economically chosen peaker.
G Montana Wind What if Montana wind was an RPS-eligible resource?
Baseline – Montana wind is not an RPS-eligible resource 1. Montana wind is an RPS-eligible resource
H Stakeholder-requested alternate resource costs and assumptions
Baseline – PSE cost estimate for generic supply-side resources 1. Lower Recip Peaker Cost 2. Higher thermal resource costs 3. Lower wind development cost 4. More aggressive cost curve for solar
Highlighted sensitivities indicate stakeholder suggestions

46
Portfolio Sensitivities
February 3, 2017 IRPAG
Sensitivity Alternatives Analyzed I No New Thermal
What would it cost to fill all future resources needs without new carbon emitting resources
Baseline – Gas-fired generation is an option in the optimization model 1. Remove carbon emitting resource alternatives to examine how this would affect the least-cost mix of resources.
J Renewable Resources + Energy Storage Does bundling renewable resources with energy storage change resource decisions?
Baseline – Renewable resources and energy storage evaluated as individual resources in the analysis 1. Bundle 200 MW battery + 200 MW wind
K Expanded Conservation Potential Baseline: Retrofit programs fully captured within 10-year accelerated ramp based on conservation potential assessment. 1. Assumes new, unforecasted efficiency measures are developed, such that the 10-year ramp continues for the full 20-year horizon.
Highlighted sensitivities indicate stakeholder suggestions
47
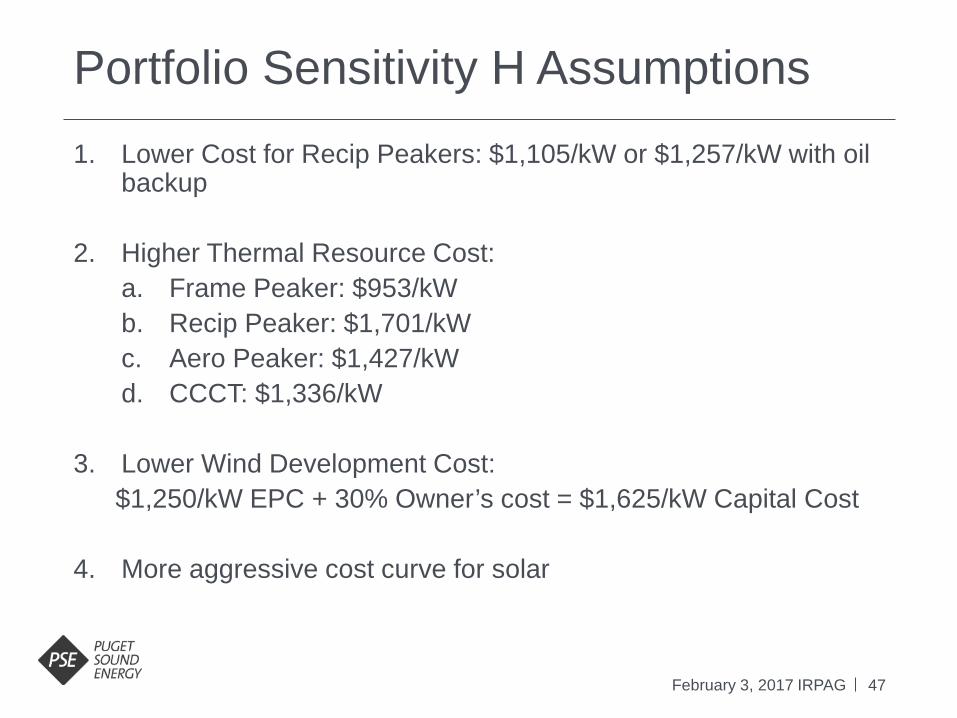
Portfolio Sensitivity H Assumptions
February 3, 2017 IRPAG
1. Lower Cost for Recip Peakers: $1,105/kW or $1,257/kW with oil backup
2. Higher Thermal Resource Cost: a. Frame Peaker: $953/kW b. Recip Peaker: $1,701/kW c. Aero Peaker: $1,427/kW d. CCCT: $1,336/kW
3. Lower Wind Development Cost: $1,250/kW EPC + 30% Owner’s cost = $1,625/kW Capital Cost
4. More aggressive cost curve for solar
48
Resource Assumptions Matrix
February 3, 2017 IRPAG

Montana Wind Transmission Assumptions
February 3, 2017 IRPAG
50
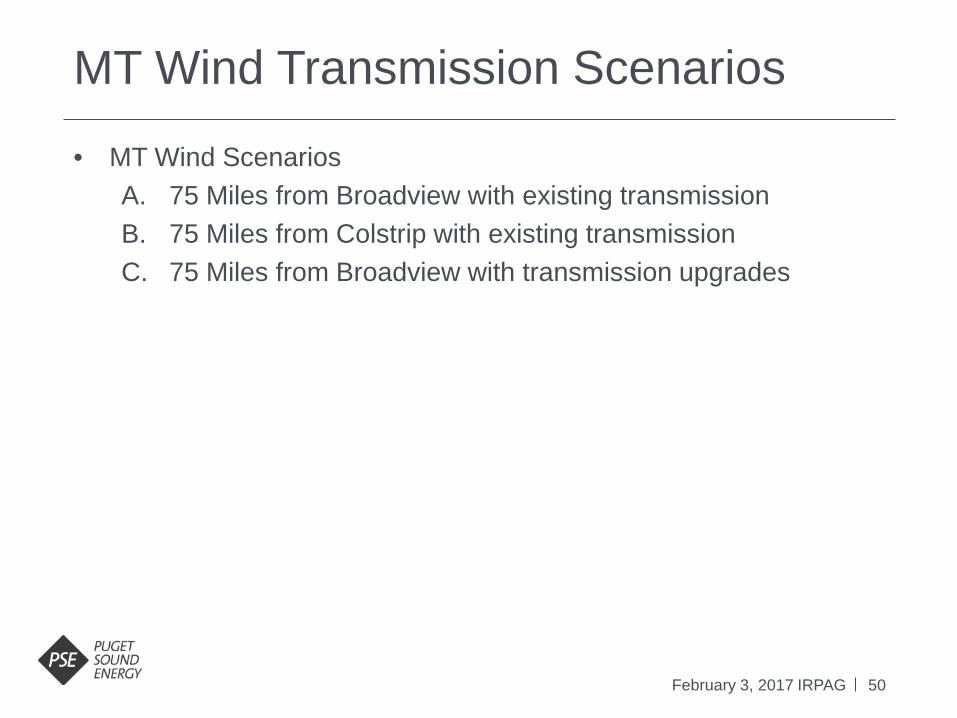
MT Wind Transmission Scenarios
February 3, 2017 IRPAG
• MT Wind Scenarios A. 75 Miles from Broadview with existing transmission B. 75 Miles from Colstrip with existing transmission C. 75 Miles from Broadview with transmission upgrades
51
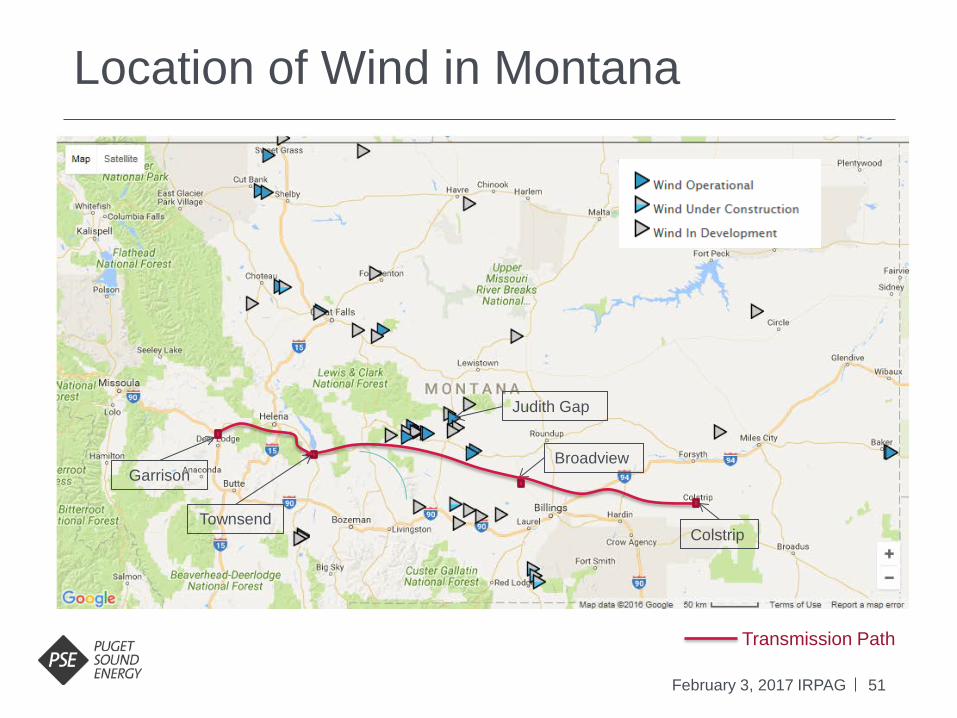
Location of Wind in Montana
February 3, 2017 IRPAG
Colstrip
Judith Gap
Broadview
Townsend
Garrison
Transmission Path

52 February 3, 2017 IRPAG
le.g.end - BPA, Losses = 1.9% +Formula losses on Townsend-Garrison
PSEI, LosS<>s ·= 2.7% • • • • Wind Project, Assume Losses : 2. 7%
Garrison
@ Judith Gap
o© ~ : ; :~ ~.' fl! • ,
Broadview Colstrip
Esti mates of lnte:rconnection Costs and Transmission Rates Options Interconnection Costs Transmission Rates ($/KW-Year)
A - Colstrip 1&2 Retired, 300MW, 75 Mi les Away to Broadview Sub $ B - Colstrip 1&2 Ret ired, 300MW, 75 Ml les Away to Colstrip Sub $ C - Colstrip 1&2 Retired, Above 300MW Wind, 75 Miles Away to Broadview Sub $
Assumpt ions and Scope of Est imates:
• Transmission capacity freed up by reti r ing Colst rip 1&2 is currently unknow n.
• Costs to mitigate transmission impacts of ret ir ing Colstrip 1&2 are currently unknown.
• Interconnection costs and t ransmission faci l ities costs are estimates based on previous
NorthWestern Energy {NWE) studies t hat assume Colstrip 1&2 ar·e not retfred.
• Costs exclude costs to bui ld generation.
• Costs exclude overheads.
52,200,000 $ 80.16
51,800,000 $ 80.16
52,200,000 S 80.16 +llmpactofcapacfty Increase on Rate
Wind Site Statistks Estimated Wind Capacity Percentage
MT Wind Capacity Factor 46.00% Loss Factor 7.30% Wind Capacity Net of Losses 42..64%
Transmission Rate Breakdown Transmission Rates $/KW-Year ~~~~~~~~~~~~
Colstrip to Townsend (PSEI) $ 31.83
Townsend to Garrison (BPA) $ 7.36 Garrison ito PSEI (BPA)1 $ 21 .62
Estimated Wind Integration Costs2 $ 19.34
Impact of Capacity Increase on Rate $ Uncertain 1 Rates from BP-18 Initial Proposal 2 201£ year a..erage of NWMT Energy Imbalance Prices

2017 IRP Gas Prices & Power Prices
February 3, 2017 IRPAG

54
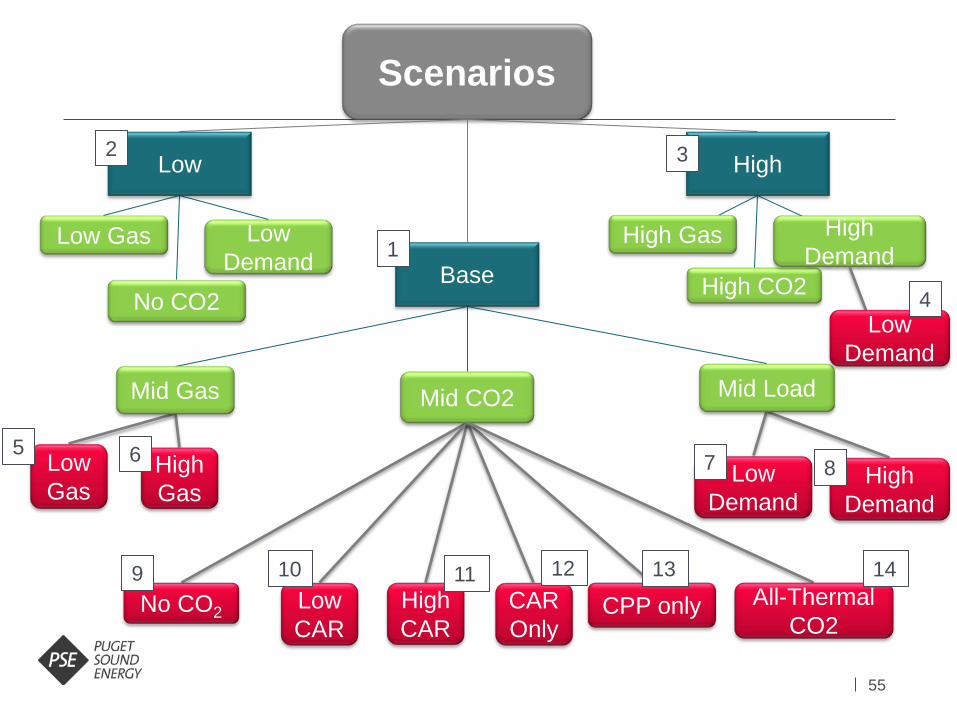
2017 IRP Scenarios
February 3, 2017 IRPAG
Scenario Demand Gas Price CO2 Regulation 1 Base Mid Mid Mid CAR to 2022, then CPP
2 Low Low Low Low CAR to 2022
3 High High High High CAR to 2022, then CPP
4 Low Demand + High Gas & CO2 Low High High CAR to 2022, then CPP
5 Base + Low Gas Price Mid Low Mid CAR to 2022, then CPP
6 Base + High Gas Price Mid High Mid CAR to 2022, then CPP
7 Base + Low Demand Low Mid Mid CAR to 2022, then CPP
8 Base + High Demand High Mid Mid CAR to 2022, then CPP
9 Base + No CO2 Mid Mid None
10 Base + Low CAR CO2 Mid Mid Low CAR to 2022, then CPP
11 Base + High CAR CO2 Mid Mid High CAR to 2022, then CPP
12 Base w/ CAR Only (electric only) Mid Mid Mid CAR indefinitely
13 Base w/ CPP Only (electric only) Mid Mid CPP in 2022
14 Base + All-Thermal CO2 (electric only)
Mid Mid CO2 price applied to all thermal resources in the WECC (baseload and peakers)
CAR: WA Clean Air Rule CPP: EPA Clean Power Plan
55
Scenarios
Low Gas
Mid Gas Mid CO2 Mid Load
Low Gas
High Gas
High CAR
No CO2
Low Demand
High Demand
Low High
Base
Low CAR
CAR Only
2
1
3
5 6 7 8
9 10 12 11 CPP only All-Thermal
CO2
No CO2
14
High CO2
Low Demand
High Gas High Demand
Low Demand
4
13

56
2017 IRP Gas prices
February 3, 2017 IRPAG
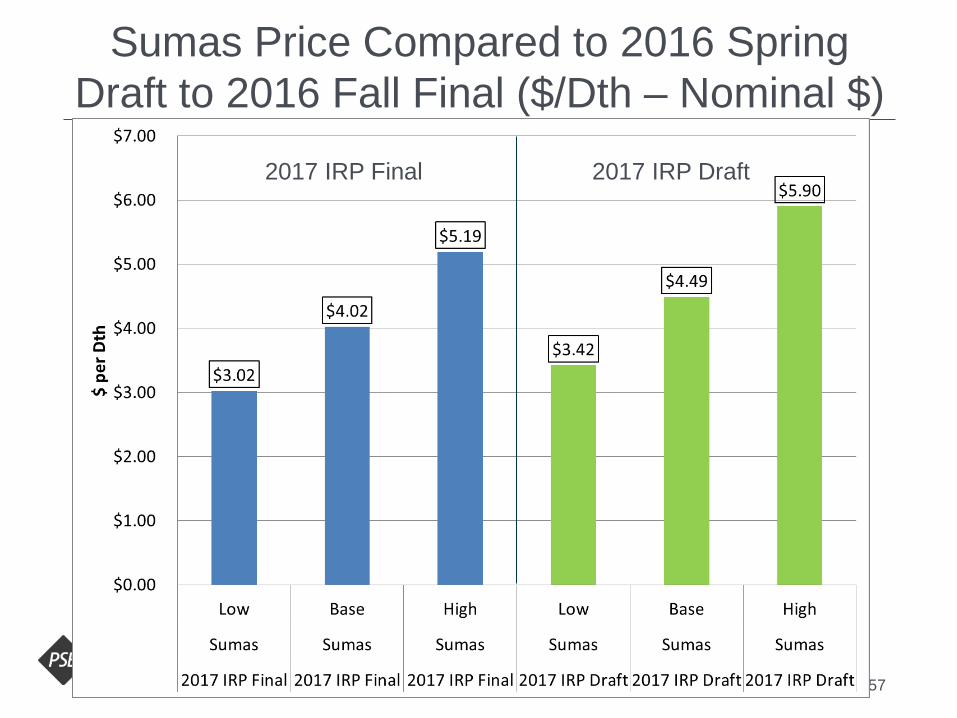
• Base 2018-2021: 3 month average forward marks from Sep 23 thru Dec 27, 2016 (65 business days) 2022-2037: Wood Mackenzie Fall 2016 long term fundamentals forecast
• Low
2018-2037: Wood Mackenzie long term low forecast
• High 2018-2037: Wood Mackenzie long term high forecast
57
Sumas Price Compared to 2016 Spring Draft to 2016 Fall Final ($/Dth – Nominal $)
2017 IRP Final 2017 IRP Draft

58
Levelized Sumas Price ($/Dth – Nominal $)

59
Sumas Price Compared to Past IRPs
$7
.85 $1
0.01
$7.3
5
$8.0
8
$6.0
6
$5.3
7
$4.0
2
$0.3
6
$3.0
4
$3.0
4
$1.4
6
$3.11
$0.00
$2.00
$4.00
$6.00
$8.00
$10.00
$12.00
$14.00
2007 IRP 2009 IRP 2009 IRP Update 2011 IRP 2013 IRP 2015 IRP 2017 IRP
(2008-2027) (2010-2029) (2010-2029) (2012-2031) (2014-2033) (2016-2035) (2018-2037)
$ pe
r Dth
CO2 priceBase gas price
60
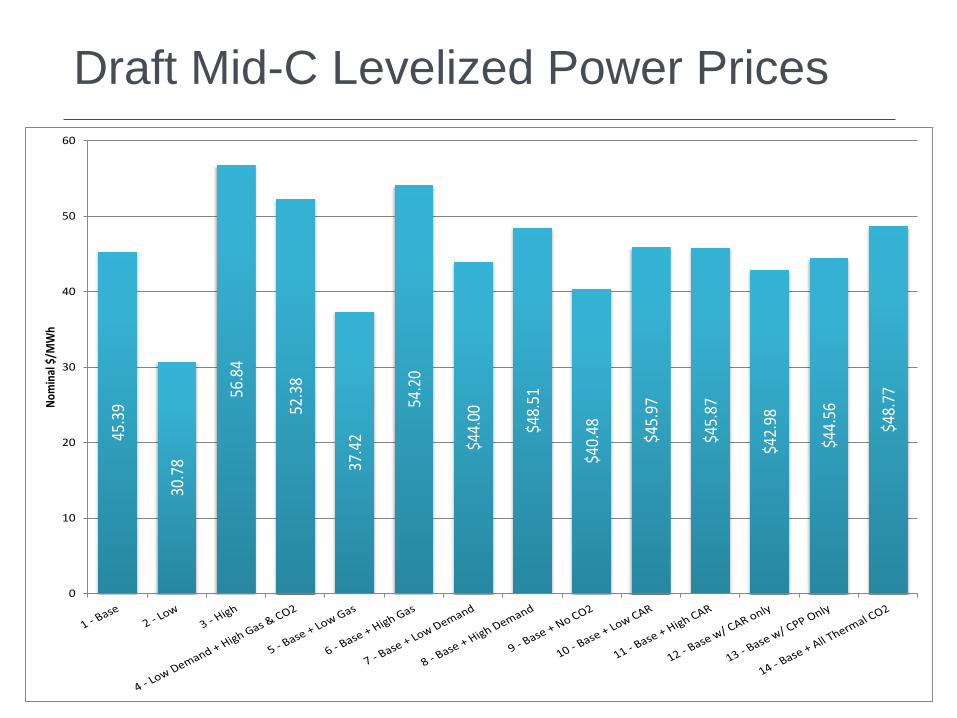
Draft Mid-C Levelized Power Prices
45
.39
30.7
8
56.8
4
52.3
8
37.4
2
54.2
0
$44.
00
$48.
51
$40.
48
$45.
97
$45.
87
$42.
98
$44.
56
$48.
77
0
10
20
30
40
50
60
Nom
inal
$/M
Wh
61
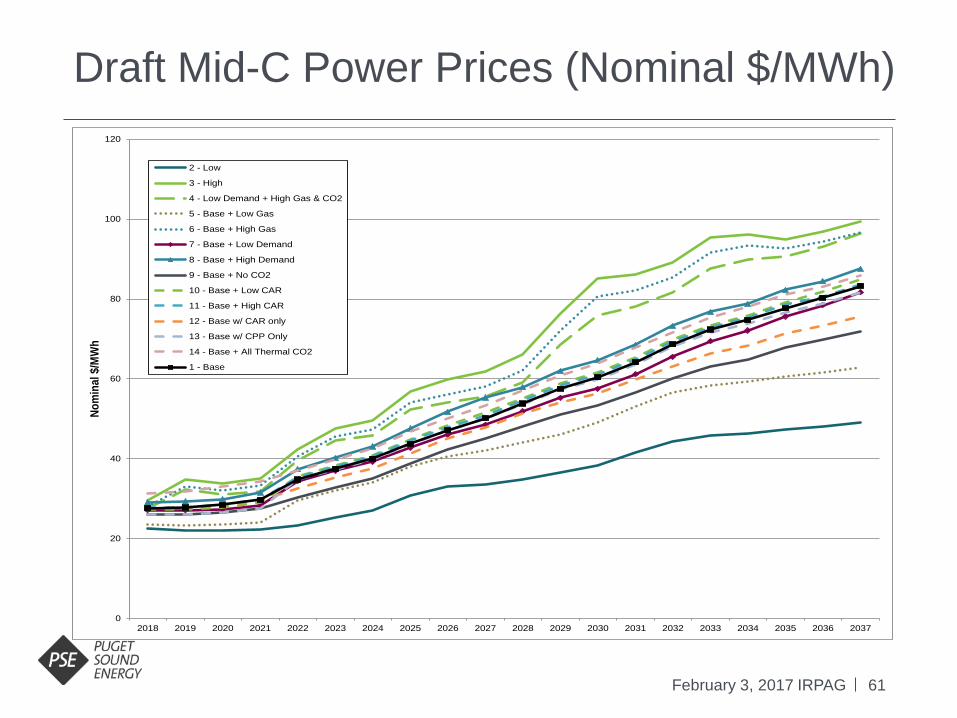
Draft Mid-C Power Prices (Nominal $/MWh)
February 3, 2017 IRPAG
0
20
40
60
80
100
120
2018 2019 2020 2021 2022 2023 2024 2025 2026 2027 2028 2029 2030 2031 2032 2033 2034 2035 2036 2037
Nom
inal
$/M
Wh
2 - Low
3 - High
4 - Low Demand + High Gas & CO2
5 - Base + Low Gas
6 - Base + High Gas
7 - Base + Low Demand
8 - Base + High Demand
9 - Base + No CO2
10 - Base + Low CAR
11 - Base + High CAR
12 - Base w/ CAR only
13 - Base w/ CPP Only
14 - Base + All Thermal CO2
1 - Base

62
Draft 2017 IRP Mid-C Prices vs. 2015 IRP
February 3, 2017 IRPAG
0
20
40
60
80
100
120
140
160
2016 2017 2018 2019 2020 2021 2022 2023 2024 2025 2026 2027 2028 2029 2030 2031 2032 2033 2034 2035 2036 2037
Nom
inal
$/M
Wh
2015 IRP Base2015 IRP Low2015 IRP High2017 IRP Base2017 IRP Low2017 IRP High
63
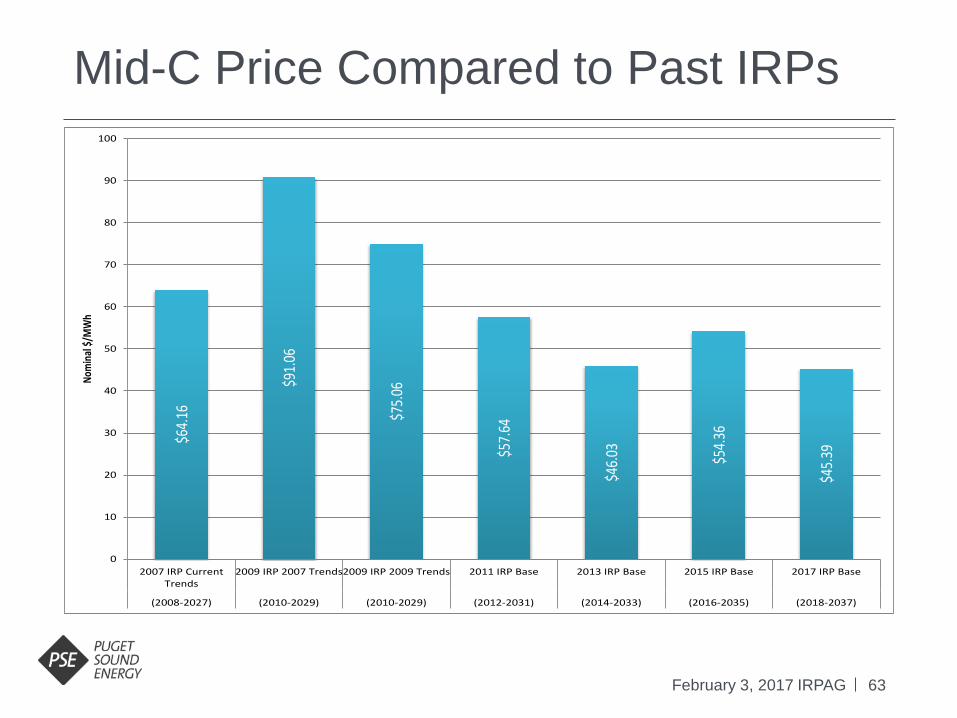
Mid-C Price Compared to Past IRPs
February 3, 2017 IRPAG
$64.1
6
$91.0
6
$75.0
6
$57.6
4
$46.0
3
$54.3
6
$45.3
9
0
10
20
30
40
50
60
70
80
90
100
2007 IRP CurrentTrends
2009 IRP 2007 Trends2009 IRP 2009 Trends 2011 IRP Base 2013 IRP Base 2015 IRP Base 2017 IRP Base
(2008-2027) (2010-2029) (2010-2029) (2012-2031) (2014-2033) (2016-2035) (2018-2037)
Nom
inal
$/M
Wh
64
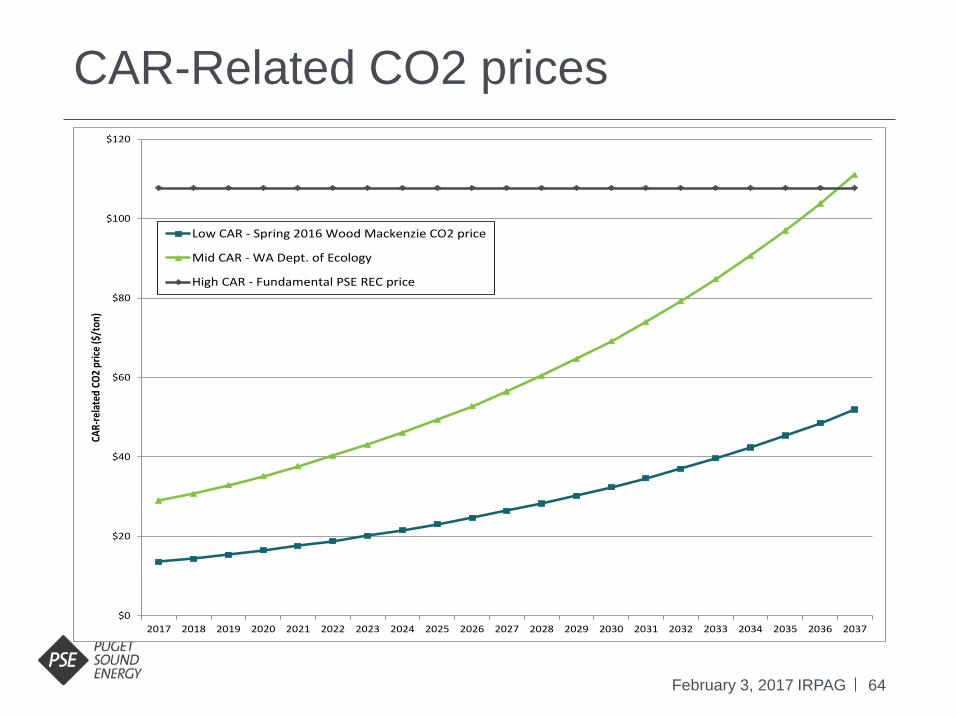
CAR-Related CO2 prices
February 3, 2017 IRPAG
$0
$20
$40
$60
$80
$100
$120
2017 2018 2019 2020 2021 2022 2023 2024 2025 2026 2027 2028 2029 2030 2031 2032 2033 2034 2035 2036 2037
CAR-
rela
ted
CO2
price
($/t
on)
Low CAR - Spring 2016 Wood Mackenzie CO2 price
Mid CAR - WA Dept. of Ecology
High CAR - Fundamental PSE REC price

65
Electric CO2 price scenarios
February 3, 2017 IRPAG
$0
$20
$40
$60
$80
$100
$120
2018 2019 2020 2021 2022 2023 2024 2025 2026 2027 2028 2029 2030 2031 2032 2033 2034 2035 2036 2037
CO2
price
($/t
on)
High, Base + High CAR
Base + No CPP (WA only)
Base
Base + Low CAR
Low
Base + No CAR
WA CAR WECC CO2
66
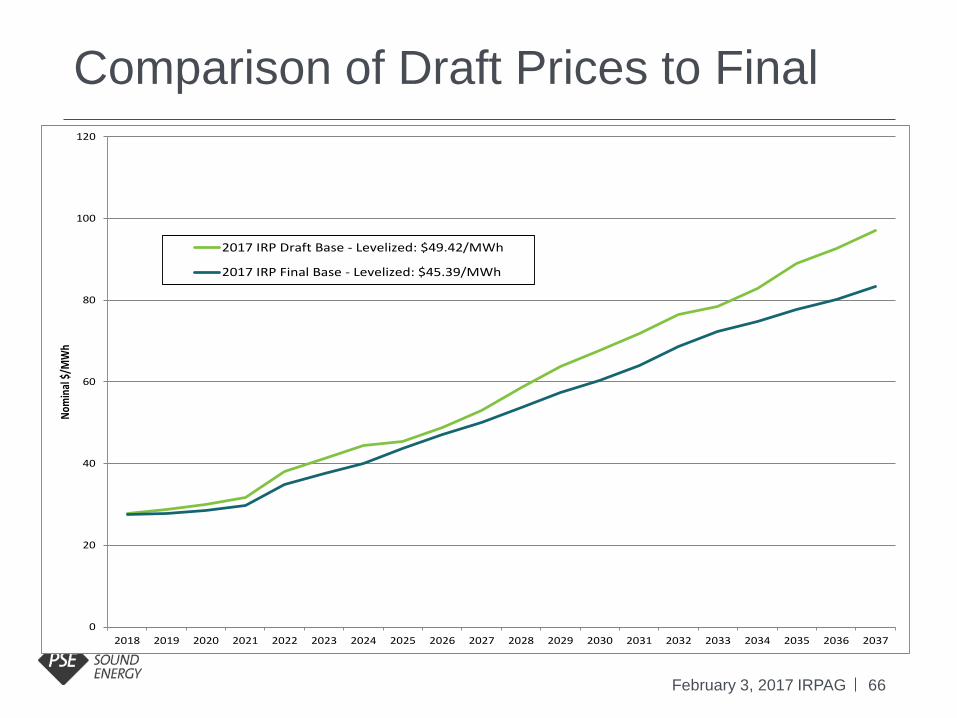
Comparison of Draft Prices to Final
February 3, 2017 IRPAG
0
20
40
60
80
100
120
2018 2019 2020 2021 2022 2023 2024 2025 2026 2027 2028 2029 2030 2031 2032 2033 2034 2035 2036 2037
Nom
inal
$/M
Wh
2017 IRP Draft Base - Levelized: $49.42/MWh
2017 IRP Final Base - Levelized: $45.39/MWh
Wrap-up/Review
February 3, 2017 IRPAG
68
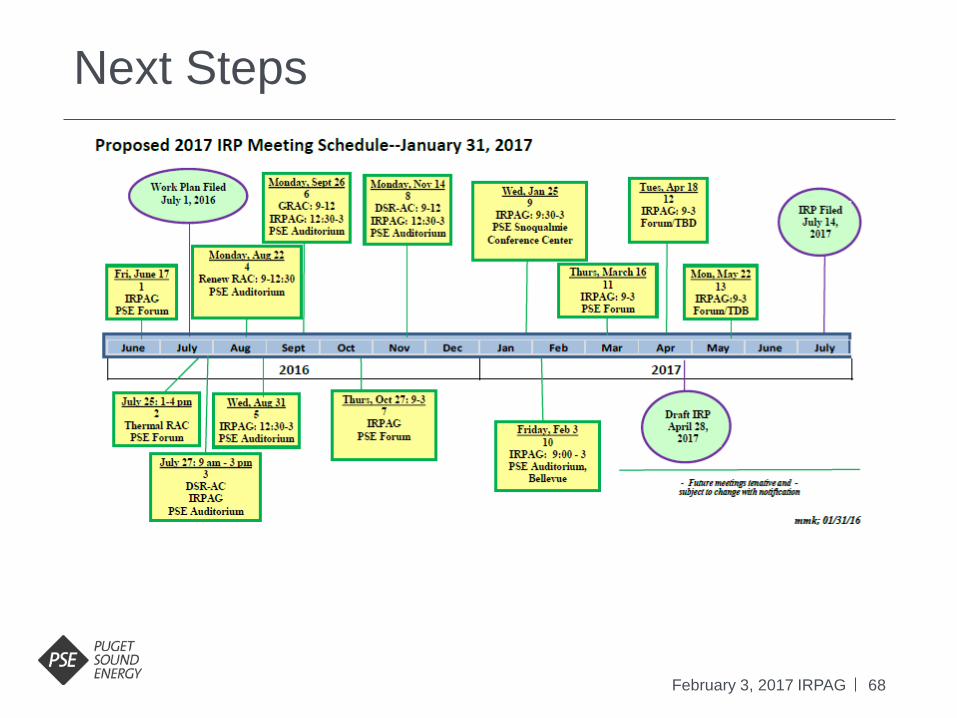
Next Steps
February 3, 2017 IRPAG

69
THANK YOU
February 3, 2017 IRPAG