Startup Investor Workshop (Intermediate Session) | Brightspark Ventures and OurCrowd

2017 INVESTOR WORKSHOPJune 20th, 2017

2017 INVESTOR WORKSHOPJune 20th, 2017
Judith HARTMANNExecutive Vice President, Chief Financial Officer
Clear strategic priorities
Transformation ahead of plan
Guidance confirmed
KEY MESSAGES
2017 INVESTOR WORKSHOP 3
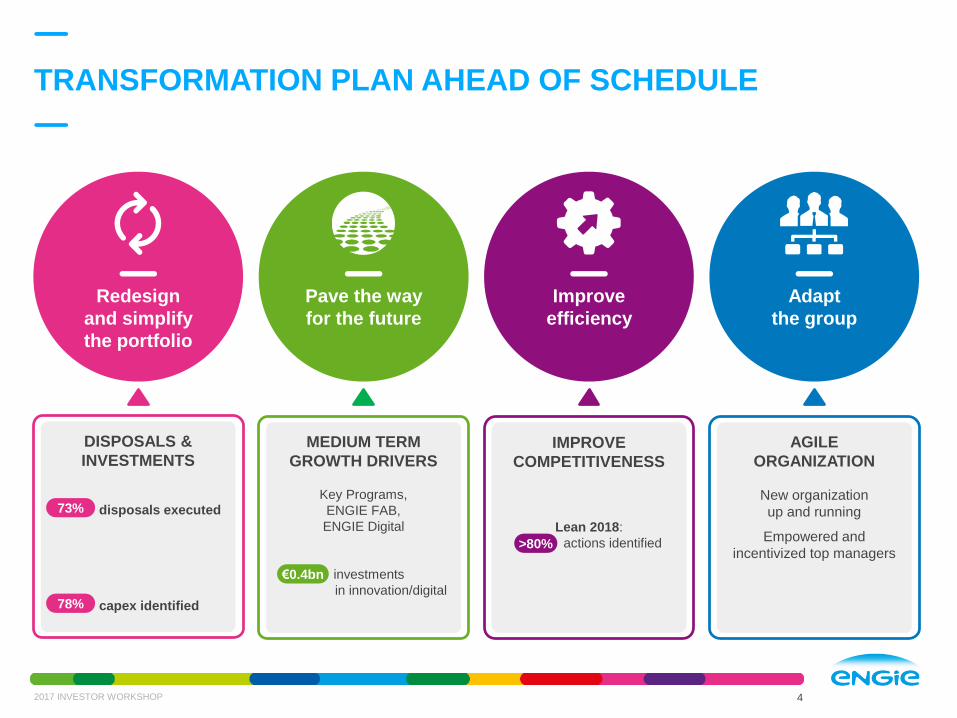
TRANSFORMATION PLAN AHEAD OF SCHEDULE
Adapt
the group
AGILE
ORGANIZATION
New organization
up and running
Empowered and
incentivized top managers
2017 INVESTOR WORKSHOP
Improve
efficiency
IMPROVE
COMPETITIVENESS
Lean 2018:
actions identified>80%
Pave the way
for the future
MEDIUM TERM
GROWTH DRIVERS
Key Programs,
ENGIE FAB,
ENGIE Digital
investments
in innovation/digital
€0.4bn
Redesign
and simplify
the portfolio
DISPOSALS &
INVESTMENTS
disposals executed
capex identified
73%
78%
4
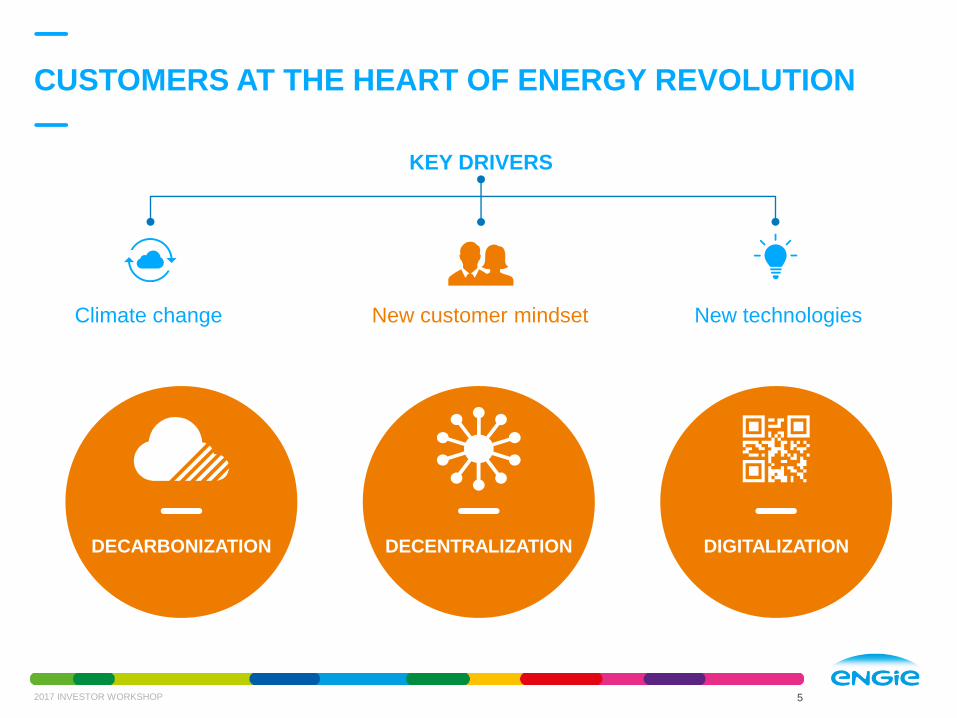
CUSTOMERS AT THE HEART OF ENERGY REVOLUTION
2017 INVESTOR WORKSHOP
KEY DRIVERS
Climate change New customer mindset New technologies
DECARBONIZATION DECENTRALIZATION DIGITALIZATION
5

Accelerating
in Customer solutions

POSITIVE DYNAMICS
2017 INVESTOR WORKSHOP
Favorable
market trends
Leading position
2
1
3
4
Portfolio
complementarity
5
Profitable and recurring
Significant growth
perspectives
7
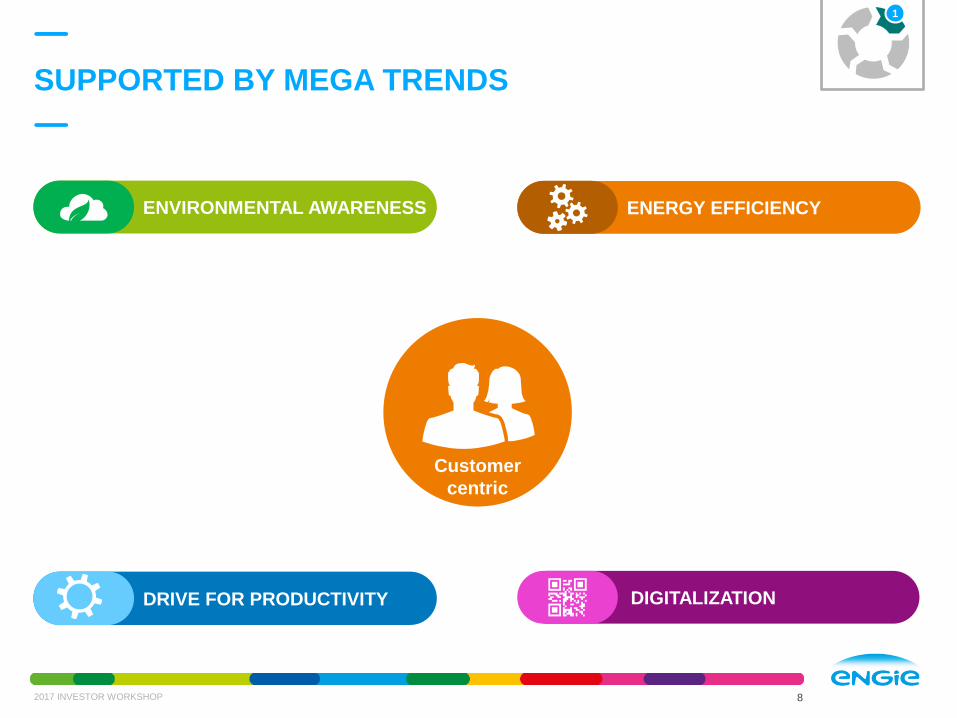
SUPPORTED BY MEGA TRENDS
2017 INVESTOR WORKSHOP
ENVIRONMENTAL AWARENESS ENERGY EFFICIENCY
DRIVE FOR PRODUCTIVITY DIGITALIZATION
Customer
centric
1
8
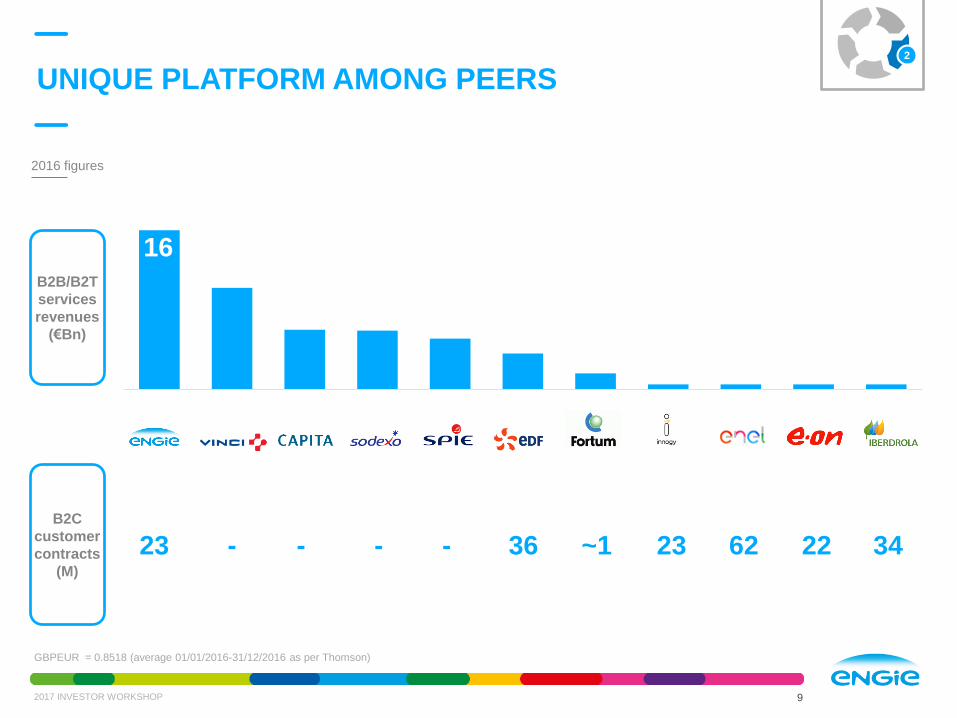
UNIQUE PLATFORM AMONG PEERS
2017 INVESTOR WORKSHOP
GBPEUR = 0.8518 (average 01/01/2016-31/12/2016 as per Thomson)
2
9
B2C
customer
contracts
(M)
B2B/B2T
services
revenues
(€Bn)
23 - - - - 36 ~1 23 62 22 34
2016 figures
16

GLOBAL LEADER
2017 INVESTOR WORKSHOP
B2C
► #1 in France
► #1 in Belgium
► 23 million contracts
in 12 countries
► #1 position in Energy
services in France,
Belgium, Italy
and the Netherlands
► Global leader in B2B
services
► #1 in DHC networks
(> 250 worldwide)
► 1M lighting points
► Global leader for energy
solutions in cities
B2B B2T
BUILDINGS & INDUSTRYEnergy performance solutions
LARGE INFRASTRUCTURESOptimization of energy mix
CITIES & TERRITORIES
Optimize management of territories
RETAIL CUSTOMERS
& SMALL BUSINESSES
Energy contracts & cross-selling services
2
10

INTEGRAL PART OF PORTFOLIO
2017 INVESTOR WORKSHOP 11
DHC networks
Gas supply
Decentralized energy
EngineeringGeothermal heating
network
Green power offers
Power supply
Biogas
3
Complementarity of customer solutions activities with the rest of the Group
CUSTOMER
SOLUTIONS
GLOBAL
NETWORKS
LOW CO2
POWER GENERATION
Small scale LNG

SIGNIFICANT SIZE
2016 EBITDA BY ACTIVITY
49%
20%
31%
€1.9bn(1)
B2B B2T B2C
Energy Supply 31%
Services 69%
68%
6%
26%
~€42bn
2016 REVENUES BY ACTIVITY
B2C €0.6bn
Energy supply 98%
Services 2%
B2B €0.9bn
Energy efficiency &
integrated services45%
Installations 27%
Engineering 8%
Energy supply 3%
Suez 15%
Other 2%
B2T €0.4bn
District network 89%
Green mobility 7%
Solutions for cities 4%
2017 INVESTOR WORKSHOP 12
62% of total 18% of total
(1) Total including corporate costs
4

HIGH PROFITABILITY
2017 INVESTOR WORKSHOP
2016 ROCE(1) BY MÉTIER
~7%
~6%
~2%
~7%
~9%
~11%
Total ROCep
Total
Upstream & ThermalMerchant
Infrastructures
RES+ThermalContracted
Customer solutions
GROUP
ROCE
GROUP
ROCEp(2)
CUSTOMER SOLUTIONS
2016 sales
EBIT margin
ROCE
€25bn
1-3%
n/r
€0.6bn
12-16%
> 30%
€13.5bn
3-6%
10-20%
€1.8bn
10-12%
4-8%
ENERGY
SUPPLY
INSTALLATION
& SERVICES
DISTRICT
NETWORKS
Very limited capital requirement
(services model)
High capital intensity
(infrastructures model)
ENGINEERING
4
13
CUSTOMER
SOLUTIONS
Unaudited figures
(1) ROCE computed on average 2016 industrial capital employed
(2) ROCEp computed on end-2016 productive industrial capital employed (excl. assets under construction)

SERVICES: RECURRING REVENUE STREAM DRIVEN
BY CONTRACT DURATION AND CLIENT MIX
2017 INVESTOR WORKSHOP 14
29%
17%18%
14%
11%
6% 5%
~€16bn(1)
revenues
DIVERSIFIED CLIENT BASE
>80% Contract renewals
83% of clients < €50m
Remaining portfolio duration
>8 years
“ANNUITY” STREAM
€5.7bninstallations backlog
4
(1) Revenues in B2B and B2T services
Industry
Private Tertiary
Public Tertiary
OtherInfrastructures
Public District Networks
Collective Housing

RESILIENT THROUGH ECONOMIC CYCLES
B2B & B2T SERVICES VS. GDP GROWTH IN EURO ZONE (2008-2016)
Revenues EBITEuro Zone GDP
CAGR
+1.2%
CAGR
+3.3%(1)Growth
+0.4%
4
(1) Excluding climate effect
2017 INVESTOR WORKSHOP 15
92% of revenues
in Europe

GROWTH AMBITION: +50% EBITDA BY 2018
Supportive market trends
Key accounts approach
and cross selling
Purchasing
Organization
Tuck-in acquisitions
Reach critical mass
in international development
M&A Contribution
Lean Program
Organic Growth
5
2017 INVESTOR WORKSHOP 16
EBITDA
+€1.0bn

LEAN 2018
2017 INVESTOR WORKSHOP
LOW CO2
POWER
GENERATION
CUSTOMER
SOLUTIONS
PURCHASE
GAINS
GLOBAL
NETWORKS
o/w 27% realised in 2016
o/w 80% actions identified
47%
36%
17%
EBITDA net
gains
+1.2 bn
PERSONNEL
COSTS
REAL ESTATE PERFORMANCE
CULTURE
SUBCONTRACTING
B2C
B2T
B2B
5
17
11%
62%
28%
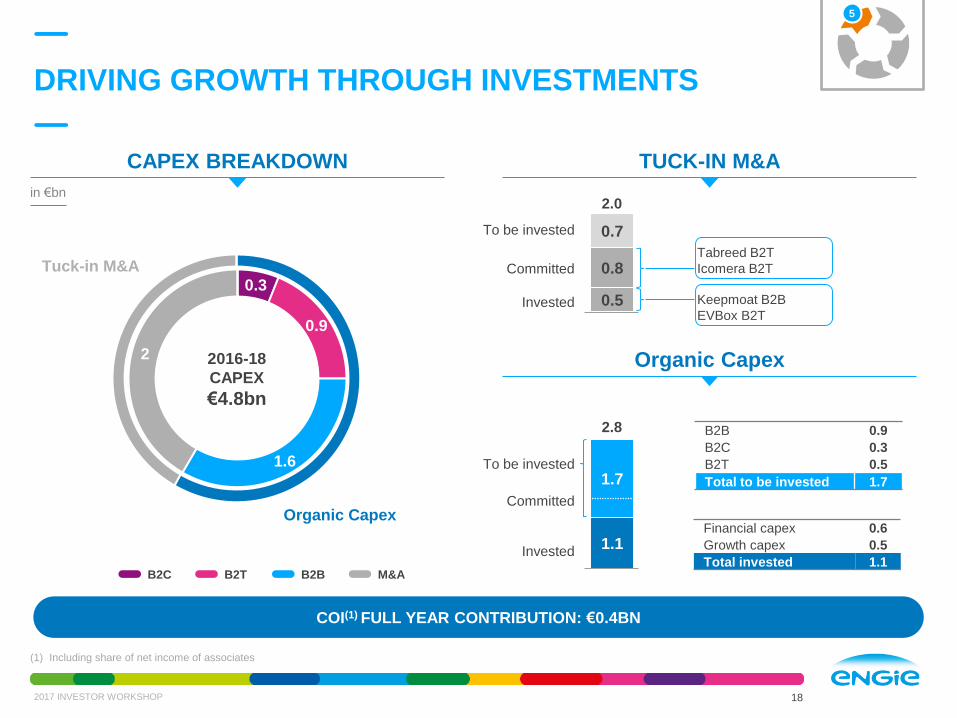
DRIVING GROWTH THROUGH INVESTMENTS
5
(1) Including share of net income of associates
in €bn
Invested
To be invested
0.5
0.8
0.7
2.0
Committed
Keepmoat B2B
EVBox B2T
Tabreed B2T
Icomera B2T
Invested
To be invested
1.1
1.7
2.8
B2BB2TB2C M&A
COI(1) FULL YEAR CONTRIBUTION: €0.4BN
TUCK-IN M&A
2017 INVESTOR WORKSHOP 18
Financial capex 0.6
Growth capex 0.5
Total invested 1.1
B2B 0.9
B2C 0.3
B2T 0.5
Total to be invested 1.7
CAPEX BREAKDOWN
Organic Capex
0.3
0.9
1.6
2 2016-18
CAPEX
€4.8bn
Committed
Tuck-in M&A
Organic Capex

M&A: CONSOLIDATION OPPORTUNITY
IN A FRAGMENTED MARKET
2017 INVESTOR WORKSHOP 19
Contribution to 2016 revenues (in €bn)
0.70.2
0.6
0.4
0.9(1)
2013 2014 2015 2016 2017
33 ACQUISITIONS OVER THE LAST 5 YEARSAverage EV/EBITDA pre-synergies: ~ 9x
5
Number
of acquisitions 6 9 9 8 1
Main
acquisitions
(revenues
contribution
>€100m)
Balfour Beatty
Workplace (UK)Ecova (USA)
TSC Group
(Australia/NZ)OpTerra (USA)
Keepmoat
Regeneration (UK)
Lahmeyer
(International)
(1) Keepmoat full year contribution

B2B PEERS TRADING AT HIGH MULTIPLES
2017 INVESTOR WORKSHOP 20
5
EV/EBITDA 18E
Average:10.1x

CONCLUSION
Key pillar of ENGIE’s success
2017 INVESTOR WORKSHOP 21
ENGIE Customer Solutions:
• Key to strategy
• Unique positioning
• Profitable, resilient and recurring business model
• Generating growth

2017 INVESTOR WORKSHOPJune 20th, 2017
Claude TURBETManaging Director, Solutions for Businesses

24 BUs SUPPORTED BY METIER LINES
23
North America
Brazil
Latin America
Asia-Pacific
MESCAT
Africa
China
Métiers lines
Global LNG E&P GTTTractebel
Engineering
Global Energy
Management
2017 INVESTOR WORKSHOP
LOW CO2 POWER
GENERATION
GLOBAL
NETWORKS
CUSTOMER
SOLUTIONS
24 BUs
France (8 BUs)
GenerationEurope
North, South & Eastern Europe
Benelux
UK
GRDF
GRTgaz
Elengy
Storengy
France B2B
France B2C
France Renewable Energy
France Networks

5 MÉTIERS ACCELERATING THE STRATEGIC, BUSINESS
AND HUMAN TRANSFORMATION
5 BUSINESS ACTIVITIES
to ensure that the Group Business Units
function as a network.
THE FUNCTIONAL DIVISIONS,
responsible for the coherence of Group
management.
LOW CO2 POWER GENERATION
SOLUTIONS FOR BUSINESSES
(B2B)
DECENTRALIZED SOLUTIONS FOR
CITIES AND TERRITORIES
(B2T)
GLOBAL NETWORKS
SOLUTIONS FOR RESIDENTIALS AND
PROFESSIONALS
(B2C)
2017 INVESTOR WORKSHOP 24

3 Métiers
ServicesRetail Other TOTAL
INTERNATIONAL(1)
0.2 (0.1) 3.4
EUROPE(2)
1.5 2.7
INFRASTRUCTURESEUROPE 3.5
GEM & LNG, E&P 0.1 1.2
OTHER 0.1 (0.5) -
TOTAL %(3)
3.1 27% 1.4 12% 3.8 33% 1.2 11% 1.9 17% (0.8) 10.7
2017 INVESTOR WORKSHOP
EUROPEAN STRONGHOLDS AND GROWING INTERNATIONAL POSITIONS
2016 EBITDA (€bn) LOW CO2 POWER
GENERATION
CUSTOMER
SOLUTIONSGLOBAL
NETWORKS
1.3 services0.6 supply
25
(1) Included segment: Noram, Latam, Africa/Asia Pacific/ME
(2) Included segment: France, Benelux, Other Europe
(3) Unaudited figures Excluding "Other"
In €bn
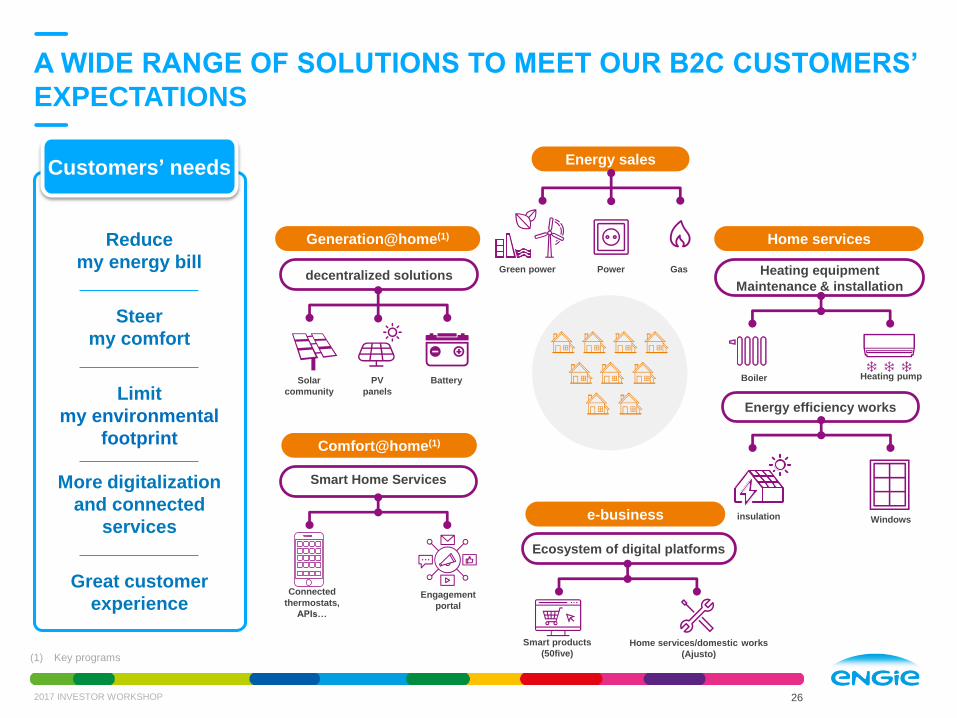
A WIDE RANGE OF SOLUTIONS TO MEET OUR B2C CUSTOMERS’
EXPECTATIONS
Heating equipment
Maintenance & installation
Energy sales
Reduce
my energy bill
Steer
my comfort
Limit
my environmental
footprint
More digitalization
and connected
services
Great customer
experience
Energy efficiency works
Boiler Heating pump
insulation Windowse-business
Smart products
(50five)Home services/domestic works
(Ajusto)
Power GasGreen power
Home services
Ecosystem of digital platforms
Generation@home(1)
Solar
community
PV
panels
Battery
decentralized solutions
Comfort@home(1)
Engagement
portal
Connected
thermostats,
APIs…
Smart Home Services
Customers’ needs
2017 INVESTOR WORKSHOP 26
(1) Key programs
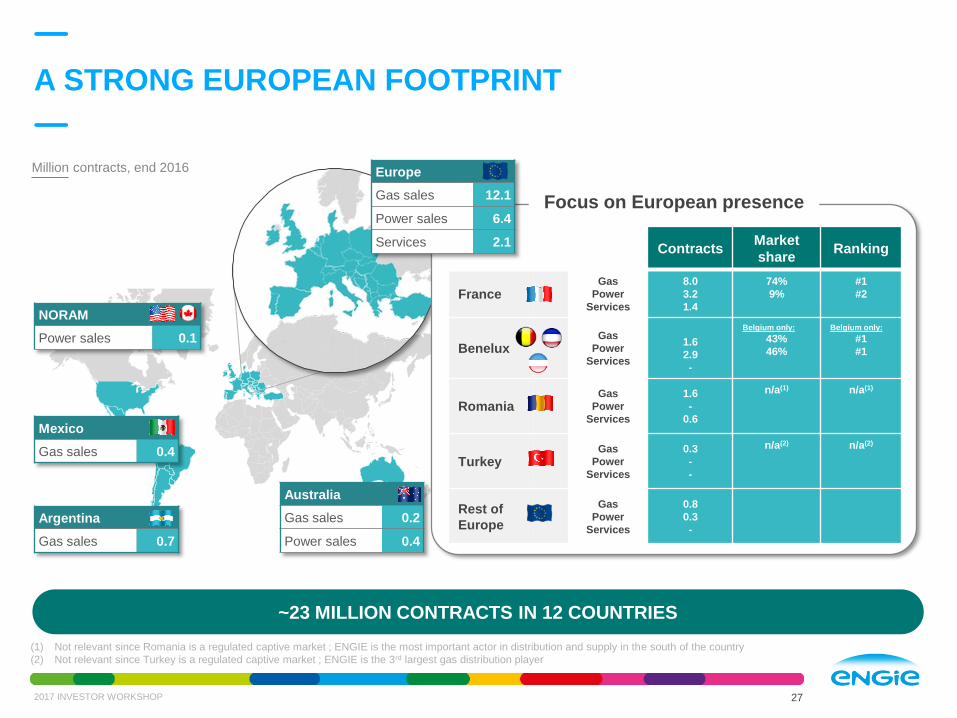
A STRONG EUROPEAN FOOTPRINT
NORAM
Power sales 0.1
Australia
Gas sales 0.2
Power sales 0.4
Argentina
Gas sales 0.7
Mexico
Gas sales 0.4
~23 MILLION CONTRACTS IN 12 COUNTRIES
2017 INVESTOR WORKSHOP 27
ContractsMarket
shareRanking
FranceGas
Power
Services
8.0
3.2
1.4
74%
9%
#1
#2
BeneluxGas
Power
Services
1.6
2.9
-
Belgium only:
43%
46%
Belgium only:
#1
#1
RomaniaGas
Power
Services
1.6
-
0.6
n/a(1) n/a(1)
TurkeyGas
Power
Services
0.3
-
-
n/a(2) n/a(2)
Rest of
Europe
Gas
Power
Services
0.8
0.3
-
Focus on European presence
Europe
Gas sales 12.1
Power sales 6.4
Services 2.1
(1) Not relevant since Romania is a regulated captive market ; ENGIE is the most important actor in distribution and supply in the south of the country
(2) Not relevant since Turkey is a regulated captive market ; ENGIE is the 3rd largest gas distribution player
Million contracts, end 2016

ENGIE B2C SET TO EXPAND
13.9M6.9M
2.1M
CONTRACTS
~23M
EBITDA: ~€0.6bn
Revenues: ~€11bn
Services
Power
Gas
TODAY 2018
~13M
~14M
~3M
CONTRACTS
~30 M
ServicesGas
Power
Develop
new innovative offers
Focus on operational &
commercial performance
Increase geographical
footprint
2020
~ €0.7bn
EBITDA
France52%
Benelux27%
Other21%
Key figures (2016)
~ +50% EBITDA vs 2015
2017 INVESTOR WORKSHOP 28

B2B CUSTOMER NEEDS AND OUR OFFERS
Performance and
productivity
Flexibility
Savings
Quality
Workplace
Innovation
Integrated solutions
INDUSTRY
Help our customers to maintain their
competitive edge by reducing energy &
operating costs, lowering carbon emissions
and ensuring resilience of utility supplies
PUBLIC SECTOR
Design, develop, produce
and operate solutions for
comfort and safety for
public bodies in education,
healthcare, leisure, …
COMMUNITY HOUSING
Custom services for
condominiums based on our
building energy performance
skills, to help them control
their expenses and ensure
inhabitants’ comfort
PRIVATE SECTOR
Deliver tailored and flexible
services with high-quality
technical services to
customers – while improving
their sustainability and cost
efficiency
ENERGY INFRASTRUCTURES
Be the preferred partner for the
design, installation and maintenance
of major infrastructures
Customers’ needs
Energy efficiency
2017 INVESTOR WORKSHOP 29

UNIQUE POSITIONING ALONG THE SERVICES VALUE CHAIN
2017 INVESTOR WORKSHOP 30
Energy
& Service“Integrators”
EQUIPMENT
MANUFACTURER
CONSTRUCTION
WORKS
Historical
positioning
ENGIE has leveraged upon its historical positioning, to expand along the value chain
FINANCING
DIGITAL
PLATFORM
ENGIE positions on the value chain
Power infrastructure
design, engineering
and studies
Installation and Maintenance
of technical equipment
in 3 areas of expertise:
- Electrical
- Mechanical
- HVAC
Integrated Facility Management
Single contract covering a set of
technical and soft services on-site
Business Process Outsourcing
Full outsourcing contract of a specific
business task for a customer
Sales of gas and electricity
associated to services
(e.g. Risk Management,
Demand-Side Management)
Energy efficiency services
Contract featuring long-term
delivery of services
AUDIT,
DESIGN INSTALLATION
ENERGY
SUPPLYOPERATION
MAINTENANCE
FM and BPO
VALUE SHARING
WITH CLIENTS
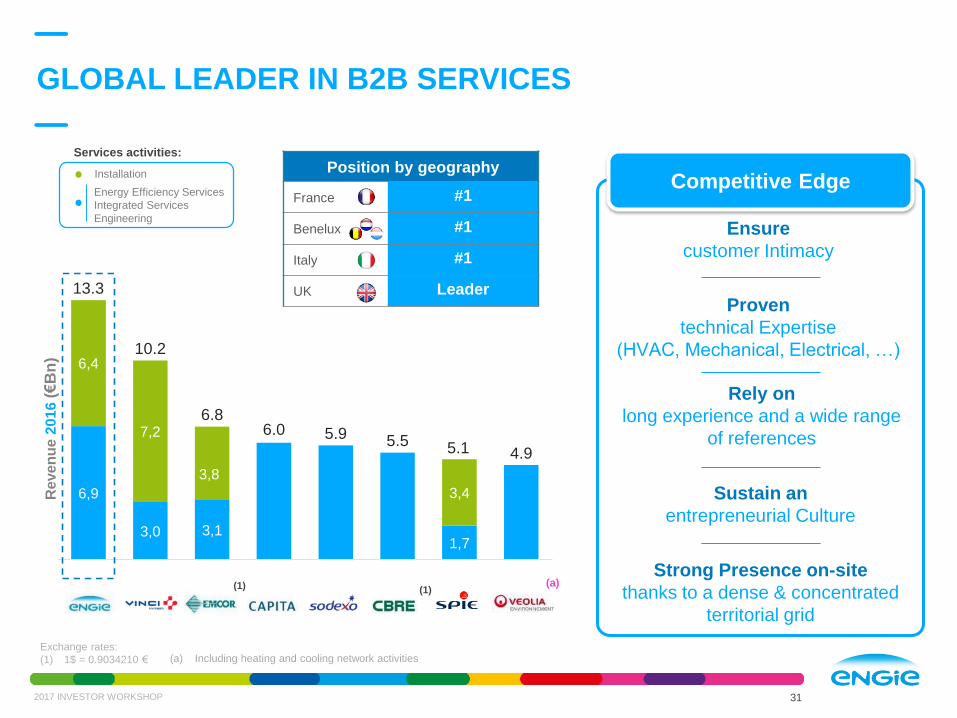
6,9
3,0 3,11,7
6,4
7,2
3,8
3,4
13.3
10.2
6.86.0 5.9 5.5 5.1 4.9
Re
ve
nu
e 2
016
(€B
n)
GLOBAL LEADER IN B2B SERVICES
2017 INVESTOR WORKSHOP 31
(a) Including heating and cooling network activities
(a)(1) (1)
Services activities:
Installation
Energy Efficiency Services
Integrated Services
Engineering
Position by geography
France #1
Benelux #1
Italy #1
UK Leader
Ensure
customer Intimacy
Proven
technical Expertise
(HVAC, Mechanical, Electrical, …)
Rely on
long experience and a wide range
of references
Sustain an
entrepreneurial Culture
Strong Presence on-site
thanks to a dense & concentrated
territorial grid
Competitive Edge
Exchange rates:
(1) 1$ = 0.9034210 €

43%
25%
5%7%
20%
45%
27%8%
3%
17%
EBITDA
~€0.9bn
ENGIE B2B: TOWARDS AMBITIOUS TARGETS
Key figures (2016)
Revenues: ~€28bn
Average services ROCE: >10%
Leader
in 8 countries Promote energy effciency
Develop integrated services
for end users
Target selected markets
outside of Europe
x2 Revenues from integrated
services
x2Countries where ENGIE
is leader
2016 2018
2020
EBITDA
~€1.6bn
Energy services Installations Engineering Energy sales Suez and other
2017 INVESTOR WORKSHOP 32

A PRESENCE ON ALL “VERTICALS” ANSWERING
TO TRANSVERSAL CUSTOMERS NEEDS
(1) Includes city management tools such as dashboards to enable city stakeholders to make informed decisions
Water(with
partners)
Lighting
Green MobilitySecurity
District Heating &
Cooling
Waste(with
partners)
Distributed Energy
ICT Infrastructure CityOS(1) Data Analytics
To improve
Security and Resilience
To benefit from
Fluid & Green mobility
To ensure an
Enjoyable environment
To develop the
Local attractiveness
Our customers’ needs
To allow to
Reduce costs
CITIES & TERRITORIES: AT THE HEART OF THE
ENERGY TRANSITION IN A FAST CHANGING WORLD
2% of World Area
50% of World Population
75% of World Energy Consumption
80% of World GHG
Smart Government
Urban planning
2017 INVESTOR WORKSHOP 33
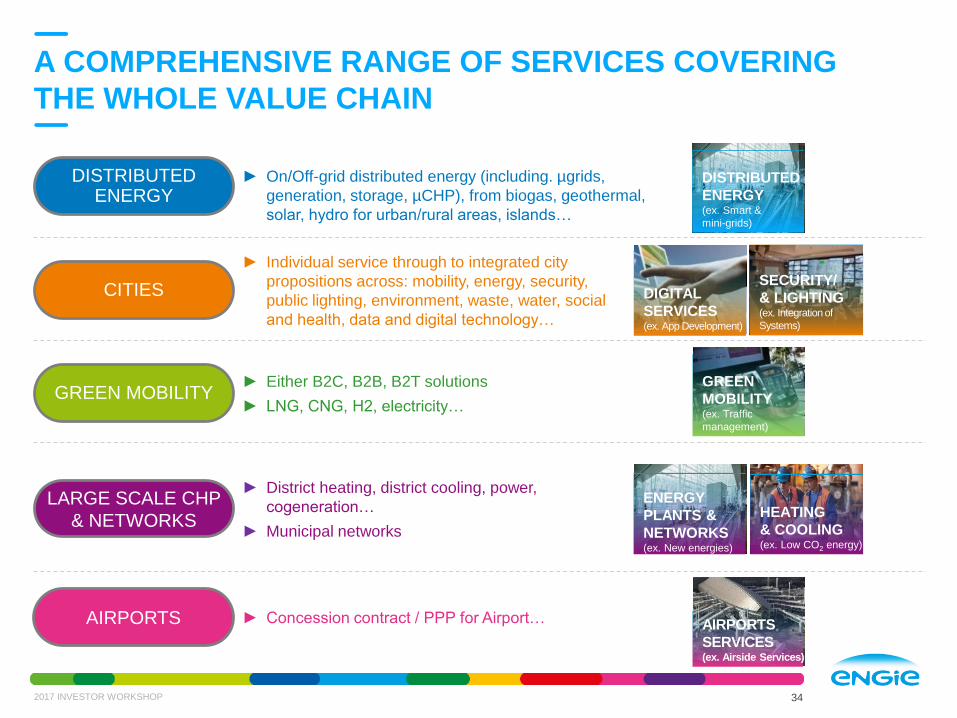
A COMPREHENSIVE RANGE OF SERVICES COVERING
THE WHOLE VALUE CHAIN
2017 INVESTOR WORKSHOP 34
DISTRIBUTED ENERGY
CITIES
GREEN MOBILITY
LARGE SCALE CHP
& NETWORKS
► On/Off-grid distributed energy (including. µgrids,
generation, storage, µCHP), from biogas, geothermal,
solar, hydro for urban/rural areas, islands…
► Individual service through to integrated city
propositions across: mobility, energy, security,
public lighting, environment, waste, water, social
and health, data and digital technology…
► District heating, district cooling, power,
cogeneration…
► Municipal networks
► Either B2C, B2B, B2T solutions
► LNG, CNG, H2, electricity…
GREEN
MOBILITY(ex. Traffic
management)
DISTRIBUTED
ENERGY (ex. Smart &
mini-grids)
SECURITY/
& LIGHTING(ex. Integration of
Systems)
DIGITAL
SERVICES(ex. App Development)
HEATING
& COOLING(ex. Low CO2 energy)
ENERGY
PLANTS &
NETWORKS(ex. New energies)
AIRPORTS
SERVICES(ex. Airside Services)
AIRPORTS ► Concession contract / PPP for Airport…

District network
89%
Green Mobility
7%
Cities4%
ENGIE B2T: A SOLID PLATFORM OFFERING GROWTH
EBITDA
~€0.4bn
0
50
100
150
200
250
300
350
400
2016 2020
Energy mainly DHC Lighting & Security
AirportsGreen Mobility
CAGR +9%
250 DHC(1) networks
incl. 160 in France (leader)
Avg. Residual contracts
duration: ~10y
Market size(3) in $bn
1M lighting points
200k clients with LDCs(2) on
French islands and Monaco
Revenues: ~€2.6bn
(3) sources: - Transparency Market Research 2015-2023 - Navigant Research - Ibis world (airports)
Market trends
2016 2018District network
87%
Green Mobility6%
Cities & Airports7%
EBITDA
~€0.6bn
Urban expansion, energy
transformation, mobility
Growth opportunities
in international markets
Integrated offers & development
of technologies
2020
>150 projects pipeline
incl. external growth
(~50% of growth target)
Growth
78% district network
22% Cities / Airport
and Green mobility
2017 INVESTOR WORKSHOP 35
(1) District Heating & Cooling (2) Local Distribution Companies
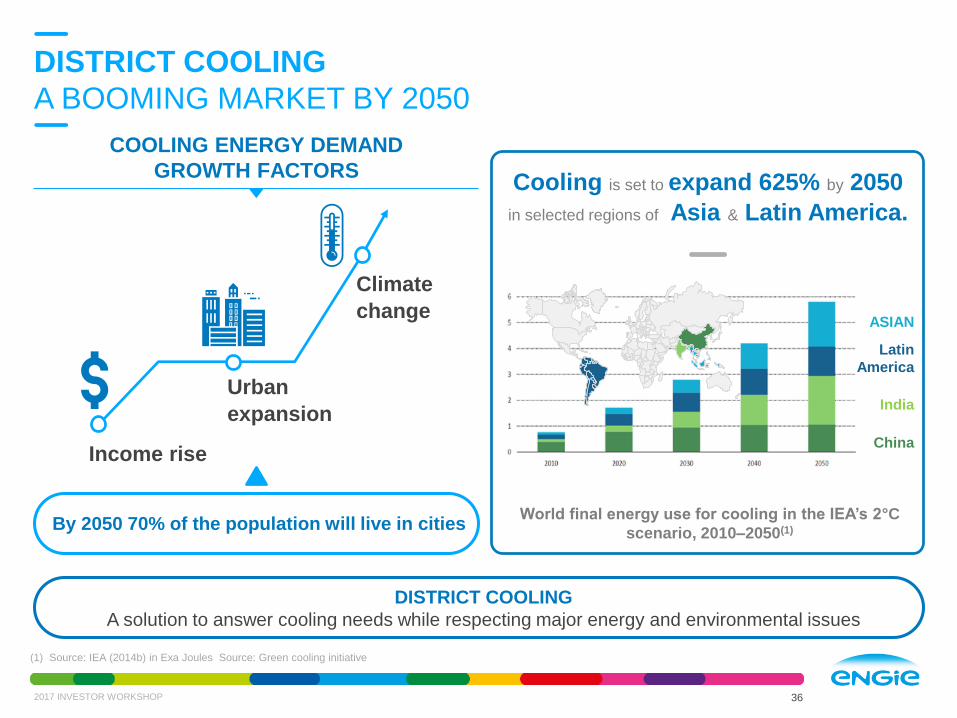
ASIAN
Latin
America
India
China
Cooling is set to expand 625% by 2050
in selected regions of Asia & Latin America.
World final energy use for cooling in the IEA’s 2°C
scenario, 2010–2050(1)
DISTRICT COOLING
A solution to answer cooling needs while respecting major energy and environmental issues
COOLING ENERGY DEMAND
GROWTH FACTORS
Climate
change
Urban
expansion
Income rise
By 2050 70% of the population will live in cities
DISTRICT COOLING
A BOOMING MARKET BY 2050
2017 INVESTOR WORKSHOP 36
(1) Source: IEA (2014b) in Exa Joules Source: Green cooling initiative

MAKING ENGIE #1 WORLDWIDEACQUISITION OF TABREED (1/2)
By acquiring Tabreed, Engie will:
Become #1 worldwide with
dominant positions in GCC
Benefit from a second development
platform to address fast-growing
countries such as India, Turkey and
Egypt
Be referenced as an undisputable
leader on worldwide tender offers
Realize valuable synergies on
purchasing, technologies, operational
performance and HR
A COMPELLING RATIONALE ENGIE BECOMING #1 IN DC NETWORKS
Source: Emerton (2017)
3,500
1,500
1,200
986
492 469 448
Tabreed + Engie
Tabreed Empower Veolia Elmcool Enwave Engie Petronas NRG Mitsubishi
4,184
3,500
684
2017 INVESTOR WORKSHOP 37
(1) Mega Watt of cooling
In MWc(1)
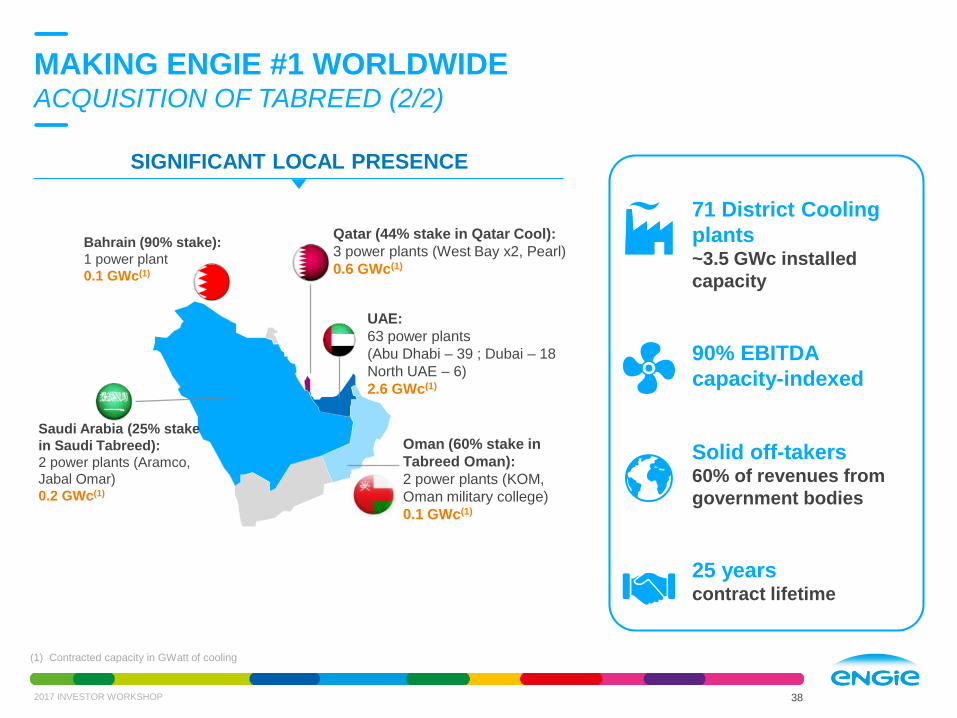
SIGNIFICANT LOCAL PRESENCE
71 District Cooling
plants~3.5 GWc installed
capacity
90% EBITDA
capacity-indexed
Solid off-takers 60% of revenues from
government bodies
25 years contract lifetime
Bahrain (90% stake):
1 power plant
0.1 GWc(1)
Qatar (44% stake in Qatar Cool):
3 power plants (West Bay x2, Pearl)
0.6 GWc(1)
Saudi Arabia (25% stake
in Saudi Tabreed):
2 power plants (Aramco,
Jabal Omar)
0.2 GWc(1)
Oman (60% stake in
Tabreed Oman):
2 power plants (KOM,
Oman military college)
0.1 GWc(1)
UAE:
63 power plants
(Abu Dhabi – 39 ; Dubai – 18
North UAE – 6)
2.6 GWc(1)
MAKING ENGIE #1 WORLDWIDEACQUISITION OF TABREED (2/2)
2017 INVESTOR WORKSHOP 38
(1) Contracted capacity in GWatt of cooling

2017 INVESTOR WORKSHOPJune 20th, 2017
BU France B2B
Franck Bruel, CEO

40
40
Industrial Design
Maintenance
Dismantling
Endel
HVAC
Refrigeration
Fire protection
Axima
Energy efficiency
Multitechnical services
Facility management
District heating networks
Cofely
Electrical solutions:TransportSecurity
InformationTelecommunications
Ineo
WHAT DO WE DO
PRESENCE ON THE WHOLE VALUE CHAIN(1)
An internal organization based on 4 entities
56% 9%
Integrated
servicesInstallation
Energy efficiency
services
35%
2017 INVESTOR WORKSHOP 40
(1) In % of 2016 revenues

OUR CUSTOMERS
Industry InfrastructuresPrivate Tertiary Public Tertiary
Market segments Designing and offering efficient energy
solutions to the key markets
Renovation &
energy transition
Decentralisation &
decarbonisationDigital
revolution
4
ITER Hikari EuromedTGV lineTours-
Bordeaux
FAVOURABLE GLOBAL ENVIRONMENT
2017 INVESTOR WORKSHOP 41
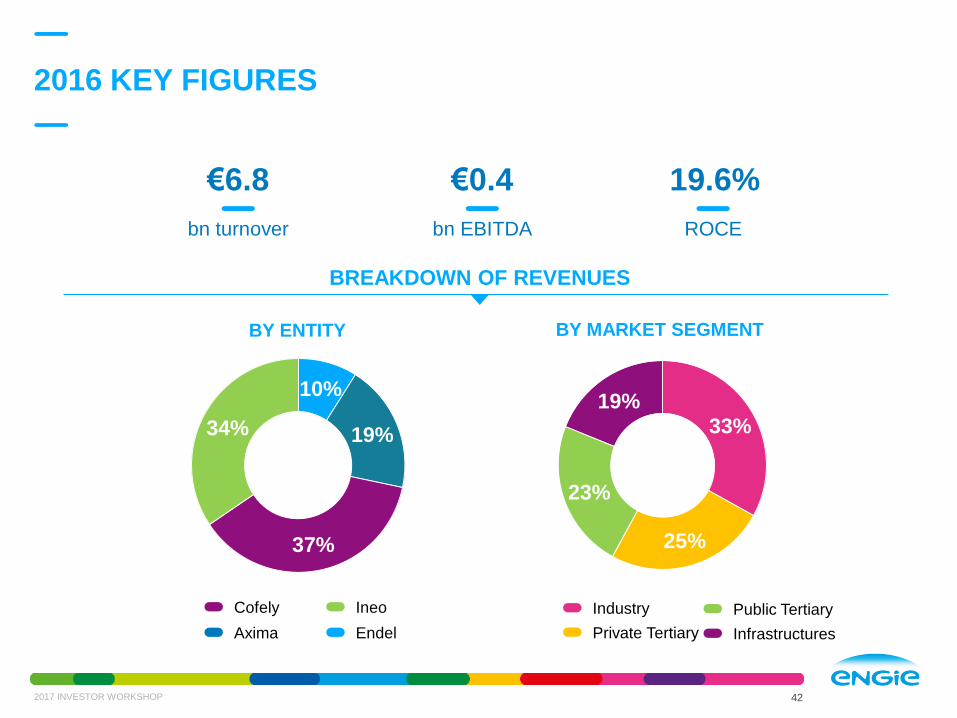
42
€6.8
bn turnover bn EBITDA
19.6%
ROCE
33%
25%
23%
19%
Industry
Private Tertiary
Public Tertiary
Infrastructures
BY MARKET SEGMENT
€6.8 €0.4
10%
19%
37%
34%
BY ENTITY
EndelAxima
Cofely Ineo
BREAKDOWN OF REVENUES
2016 KEY FIGURES
422017 INVESTOR WORKSHOP

WHY ARE WE DIFFERENT
EndelCofely
Axima
Ineo
4 leaders, experts
in their areas
2017 INVESTOR WORKSHOP 43
Full range of offers Consulting Design Installation Maintenance Services
40,214 employees
o/w 3,000 engineersSkilled pool of experts
900local sites
Territorial network

RESILIENT BUSINESS PROFILE
58% of sales
Average backlog Order book (N+1)
Rate of renewal
82%
8 years
<5y5-10y
>15y
11 months
of activities
10-15y
2017 INVESTOR WORKSHOP 44
SERVICES
Remaining portfolio duration
2012 2013 2014 2015 2016
~€4bn
~€3bn
INSTALLATION
Consistently strong backlog(1)
(1) Total backlog for Ineo, Axima, Endel, including mainly installation activities

RESILIENT REVENUES AND GROWING PROFITABILITY
EBIT margin increase by 100bps over 2012-2016
& further improvement in profitability is expected
2017 INVESTOR WORKSHOP 45
Revenues EBIT and EBIT margin %
245
268289
306 314
2012 2013 2014 2015 2016
3.6%
4.6%
3.9%
4.2%
4.5%
(…) 2018
4.9%
+40bps
in €m

GROWTH DRIVERS & AMBITIONS
Complex offersEnergy performance
Usage performance
Design-Build-Operate
Innovation & digitalCities
Dashboarding energy optimization
Building Information Modelling
Cybersecurity
GROWTH AMBITION BY 2018 vs 2015
>25% EBITDA
+40bps EBIT margin
2017 INVESTOR WORKSHOP 46
CUSTOMER
SOLUTIONS

CASE STUDY 1: AIRBUS MULTISITES
2017 INVESTOR WORKSHOP 47
CLIENTS’ CHALLENGES
Decrease energy consumption
Secure fluids availability
ENGIE SOLUTIONS
Centralized monitoring of a national
global Energy Performance Contract
3 millions of m² managed
Total Facility Management including
the multitechnical management
and maintenance
CLIENTS’ BENEFITS
16 M€ cumulated savings
over 2015-2020
ENGIE AXIMA, ENGIE COFELY,
ENGIE INEO AND ENDEL ENGIEHard FM maintenance (HVAC, power, heat, cold)
Supply of utilities
Fire detection
Industrial maintenance
New tertiary works
Full services in the UK
310 people
CONTRACT PERIOD
12-year
REVENUES IN 2016
56 M€ o/w 22 M€ on Hard FM contract
France
B2B

CASE STUDY 2: MARINE SECTOR
2017 INVESTOR WORKSHOP 48
CLIENTS’ CHALLENGES
Navy: maximize ship’s operational availability
and respect specific health and safety regulation
Commercial Marine: accelerate construction
phases and reduction of global costs
ENGIE SOLUTIONS
Military Maintenance in Operational
Condition for 2nd rank military Marine
HVAC “Plug-In” installation specialist for STX
in France and other Shipyards in Europe
Multi-Technique maintenance for on-shore Buildings
and provide utilities on boat docks
CLIENTS’ BENEFITS
Capabilities to embark reliable suppliers
for international contract
KEY FIGURES
100 M€ annual revenueso/w Cruise: €38M
o/w Navy: €37M
Main BU Players:
• ENGIE Axima: €50M
• ENDEL ENGIE: €25M
• ENGIE Ineo: €17M
• ENGIE Cofely: €8M
France
B2B
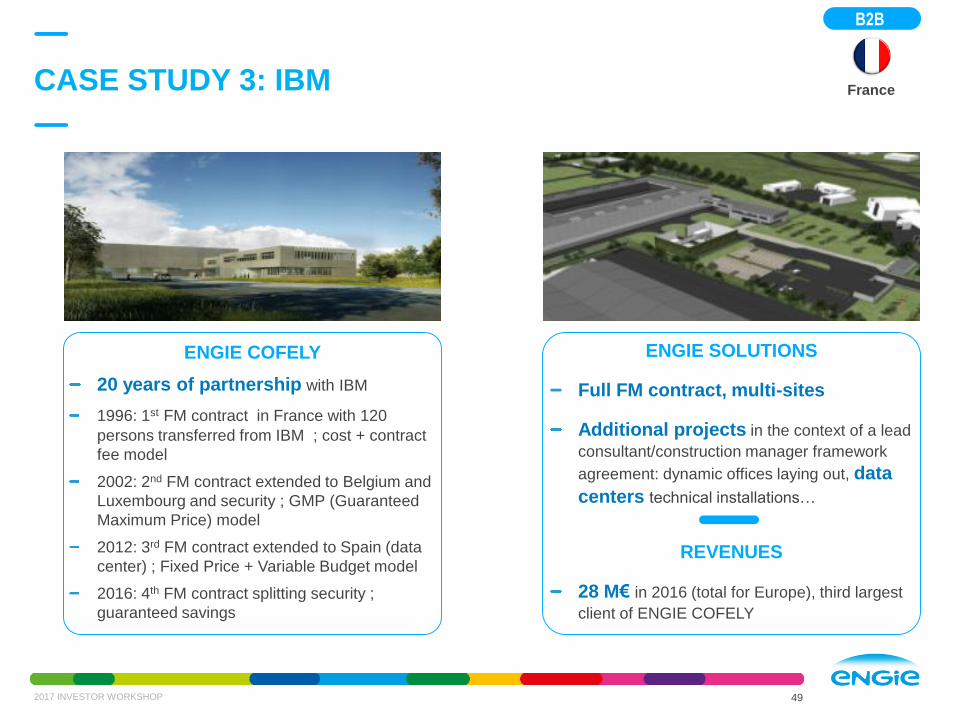
ENGIE COFELY
20 years of partnership with IBM
1996: 1st FM contract in France with 120
persons transferred from IBM ; cost + contract
fee model
2002: 2nd FM contract extended to Belgium and
Luxembourg and security ; GMP (Guaranteed
Maximum Price) model
2012: 3rd FM contract extended to Spain (data
center) ; Fixed Price + Variable Budget model
2016: 4th FM contract splitting security ;
guaranteed savings
CASE STUDY 3: IBM
49
France
B2B
ENGIE SOLUTIONS
Full FM contract, multi-sites
Additional projects in the context of a lead
consultant/construction manager framework
agreement: dynamic offices laying out, data
centers technical installations…
REVENUES
28 M€ in 2016 (total for Europe), third largest
client of ENGIE COFELY
2017 INVESTOR WORKSHOP

CLIENTS’ CHALLENGES
Reduce energy consumption
CONTRACT
March 2016: ENGIE & Artelia won an Energy
Performance Contract with the City of Paris for the
renovation of 140 schools & 21,000
schoolchildren
DURATION: 15-year
REVENUES:
30 M€ for works o/w 20 M€ for ENGIE Cofely
0.8 M€/year for O&M (12 M€ total)
CASE STUDY 4:
RENOVATION OF 140 PARIS SCHOOLS
50
France
B2B
ENGIE SOLUTIONS
Contribute to reducing by 30% the energy
consumption of the buildings
Building retrofits and deployment of some
innovative digital solutions (Vertuoz pilot)
Energy efficiency actions: insulation of facades,
creation of LED lighting and installation of
remote-controlled thermostatic valves
REMUNERATION
Based on energy savings
Savings of ~1 M€/year for the customer
2017 INVESTOR WORKSHOP
2017 INVESTOR WORKSHOPJune 20th, 2017
BU France B2C
Hervé-Matthieu Ricour, CEO

A LEADER IN ELECTRICITY AND GAS SUPPLY IN FRANCE
2017 INVESTOR WORKSHOP 52
Energy sales
~86%
Services
~14%
~€320m(1)
~90%LEADING ENERGY
SUPPLIER IN FRANCE 2016 EBITDA
A GRANULAR NETWORK
IN FRANCE
GAS 3,300 field technicians
> 200 local branches
ELECTRICITY
(74% market share )
(9% market share )
SERVICES
8.0mcontracts
3.2mcontracts
1.4mcontracts
(1) Average weather conditions in France, except one off and affiliates under voluntary liquidation process, proforma Solfea equity consolidated
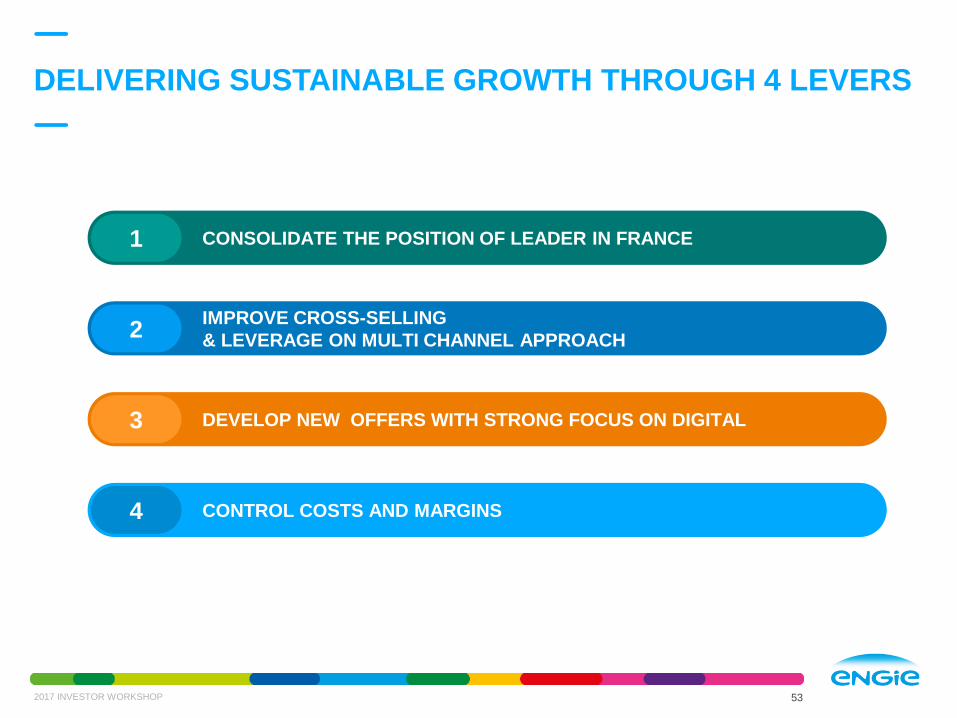
DELIVERING SUSTAINABLE GROWTH THROUGH 4 LEVERS
2017 INVESTOR WORKSHOP 53
CONSOLIDATE THE POSITION OF LEADER IN FRANCE
IMPROVE CROSS-SELLING
& LEVERAGE ON MULTI CHANNEL APPROACH
DEVELOP NEW OFFERS WITH STRONG FOCUS ON DIGITAL
CONTROL COSTS AND MARGINS
2
1
4
3

CONSOLIDATE LEADERSHIP POSITION IN FRANCE
2017 INVESTOR WORKSHOP
8.8
6.1 5.24
2.2
0.6
2.32.8
3.2
3.8
1.6 2.7 3.2 4.2 5.8
2012 2015 2016 2018 2021
11.0 11.2 11.4 11.811.1
1
Electricity Non regulated gas Regulated gas
Competitor
1
Competitor
2
59%
29%
27%
0%
20%
40%
60%
80%
100%
78%
Feb-162015 May-16 Oct-16Sep-16 Jan-17 Feb-17
AMBITIONS TO SECURE OUR LEADERSHIP BRAND RECOGNITION
Growing reputation through media
campaigns
NEW targets
Pioneer in energy transition &
home services
+ 0.2 + 0.6
54
Millions of contracts

IMPROVE CROSS-SELLING & LEVERAGE ON MULTI
CHANNEL APPROACH
2017 INVESTOR WORKSHOP 55
CROSS-SELLING OF SERVICES ON TRACK
8%
12%
16%
20%
30%
2012 2015 2016 2018 2021
● Leader in boiler maintenance
● New offers (GENIE)
● Insurance services
MULTI CHANNEL APPROACH
2
% energy customers with one or several services contracts

A WIDE RANGE OF SOLUTIONS TO MEET OUR CUSTOMERS’
EXPECTATIONS
56
Heating equipment
Maintenance & installation
Energy sales
Energy efficiency works
Boiler Heating pump
insulation Windowse-business
Smart products
(50five)Home services/domestic works
(Ajusto)
Power GasGreen power
Home services
Ecosystem of digital platforms
Generation@home(1)
Solar
community
PV
panels
Battery
decentralized solutions
Comfort@home(1)
Engagement
portal
Connected
thermostats,
APIs…
Smart Home Services
Leadership positions
Active presence
Ongoing development
3
2017 INVESTOR WORKSHOP
(1) Key programs

Products Value for customer
ENGIE’s
differentiation
Green
mobility
offers
● -50% consumption
(off peak hours) The only green
mobility offers
● Charging station package
Electricity
self
consumption
● Self-consumption rate up
to 90%
● Guarantees and services
Most
competitive offer
PRODUCTS LAUNCHED IN 2017
572017 INVESTOR WORKSHOP
3
My Power
Elec’Car
Elec’Charge

Digital
Platforms
● Reactive and well-
qualified professionals
Increase in digital audience and synergies
on lead strategies on
internet● Reactive and simple
Innovativeoffers
● -30% on electricity price on week-end
Unique offerfor Linky
customers
Offer extended to all residential
clients thanks to ENGIE technical
innovation
Green Electricitycontracts
● -20% consumption on 1st year
● Fixed price on the 2 following years
ENGIE’s electricity for SOHOs only
green
All new electricity contracts are green – offer extended to
residential clients
UPDATE ON PRODUCT LAUNCHED IN 2016
582017 INVESTOR WORKSHOP
Update June 2017
3
"Elec Week-end"
for consumers
Manouvellechaudiere.fr
Bienchezmoi.fr
Green Electricity
plan for SOHO(1)
Products Value for customer
ENGIE’s
differentiation
(1) SOHO: Small Office Home Office
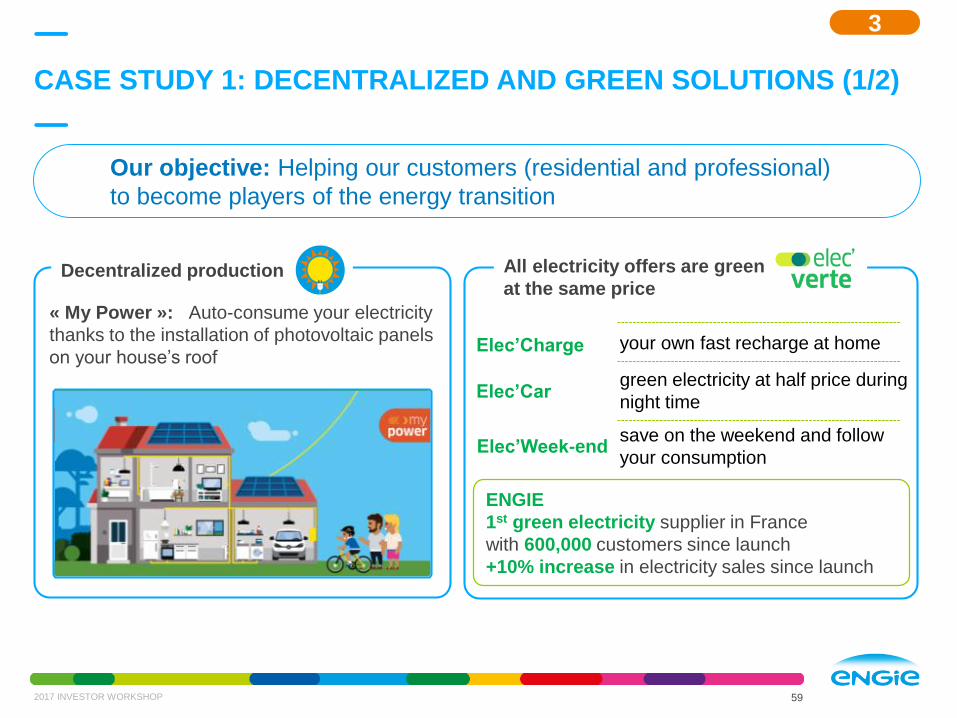
CASE STUDY 1: DECENTRALIZED AND GREEN SOLUTIONS (1/2)
59
ENGIE
1st green electricity supplier in France
with 600,000 customers since launch
+10% increase in electricity sales since launch
Our objective: Helping our customers (residential and professional)
to become players of the energy transition
Decentralized production
save on the weekend and follow
your consumptionElec’Week-end
your own fast recharge at home Elec’Charge
green electricity at half price during
night timeElec’Car
All electricity offers are green
at the same price
« My Power »: Auto-consume your electricity
thanks to the installation of photovoltaic panels
on your house’s roof
3
2017 INVESTOR WORKSHOP
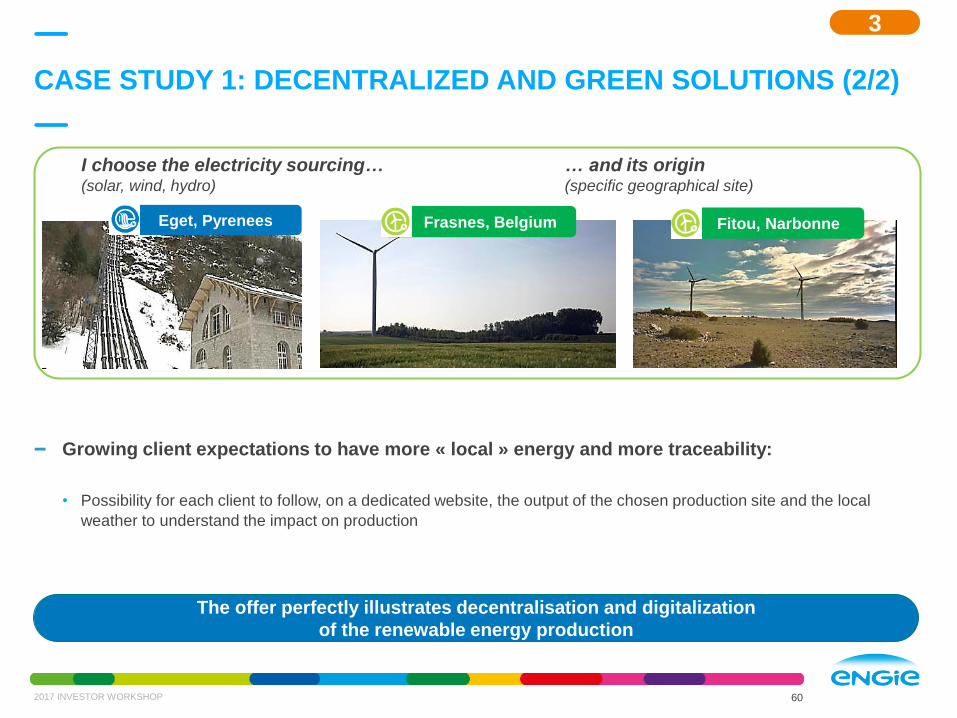
Growing client expectations to have more « local » energy and more traceability:
• Possibility for each client to follow, on a dedicated website, the output of the chosen production site and the local
weather to understand the impact on production
CASE STUDY 1: DECENTRALIZED AND GREEN SOLUTIONS (2/2)
60
I choose the electricity sourcing…(solar, wind, hydro)
… and its origin(specific geographical site)
Frasnes, Belgium Fitou, NarbonneEget, Pyrenees
The offer perfectly illustrates decentralisation and digitalization
of the renewable energy production
2017 INVESTOR WORKSHOP
3

Online store: partners’ products coming along
with expert advice to increase users’ comfort
MaNouvelleChaudière: the full digital solution
to replace your boiler
CASE STUDY 2: HOME SERVICES SOLUTIONS
61
DIGITAL TO CARRY OUR OFFERS
Our objective: bring more comfort & tranquility to enable clients to save energy
Thermal: installation of systems, boilers,
heat pumps, hot water tanks
Water: softener, improve both your comfort
and your thermal performance
Air: mechanical ventilation, ensure the
quality of your ventilation
EQUIPMENT
EVERYDAY SERVICES
Maintenance
of your installations
Emergency service:
plumbing, locksmithing, home
appliances (GENIE)
Tranquility of mind:
protection through our range
of insurance products
3
2017 INVESTOR WORKSHOP

DEVELOP DIGITAL OFFER AND CUSTOMER RELATION
2017 INVESTOR WORKSHOP
STRONG RESULTS IN DIGITALIZATION
OF SALES AND CUSTOMER SUPPORT
Q4
2014
Q2
2016Q4
2016
Q4
2018E
100150
250
500
Index 1
00
Increasing sales through internet Increasing customer self-care
62
3
100
130136
190
Index 1
00
Q4
2014
Q2
2016Q4
2016
Q4
2018E
<50%
53%56%
2014 2015 2016
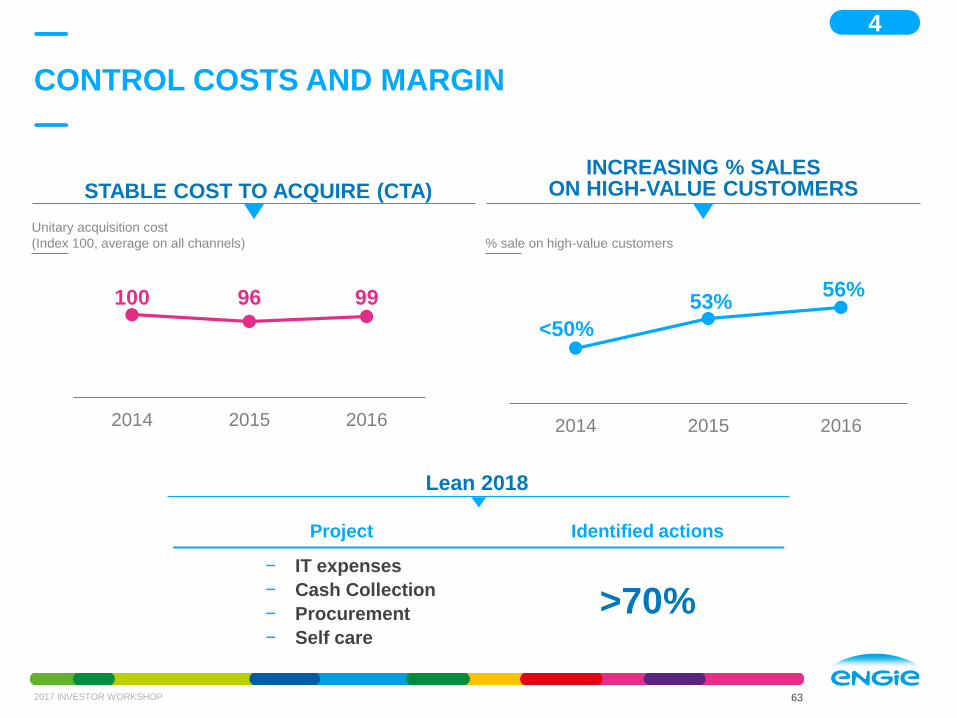
CONTROL COSTS AND MARGIN
2017 INVESTOR WORKSHOP 63
INCREASING % SALES ON HIGH-VALUE CUSTOMERS
Lean 2018
100 96 99
2014 2015 2016
Project Identified actions
− IT expenses
− Cash Collection
− Procurement
− Self care
>70%
STABLE COST TO ACQUIRE (CTA)
4
Unitary acquisition cost
(Index 100, average on all channels) % sale on high-value customers

OUR AMBITION IN FRANCE B2C BY 2018
2017 INVESTOR WORKSHOP 64
EBITDA growth
+20%vs. 2015(1)
Consolidate leadership
Grow market share
~12% electricity clients
~x2 clients in services
Development of
new offers
Maintain #1 position
in gas supply
Undisputed #1 challenger
in electricity supply
Sustain#1 position
in green electricity offers
(1) At average climate

2017 INVESTOR WORKSHOPJune 20th, 2017
BU North, South & Eastern Europe
Etienne Jacolin, CEO
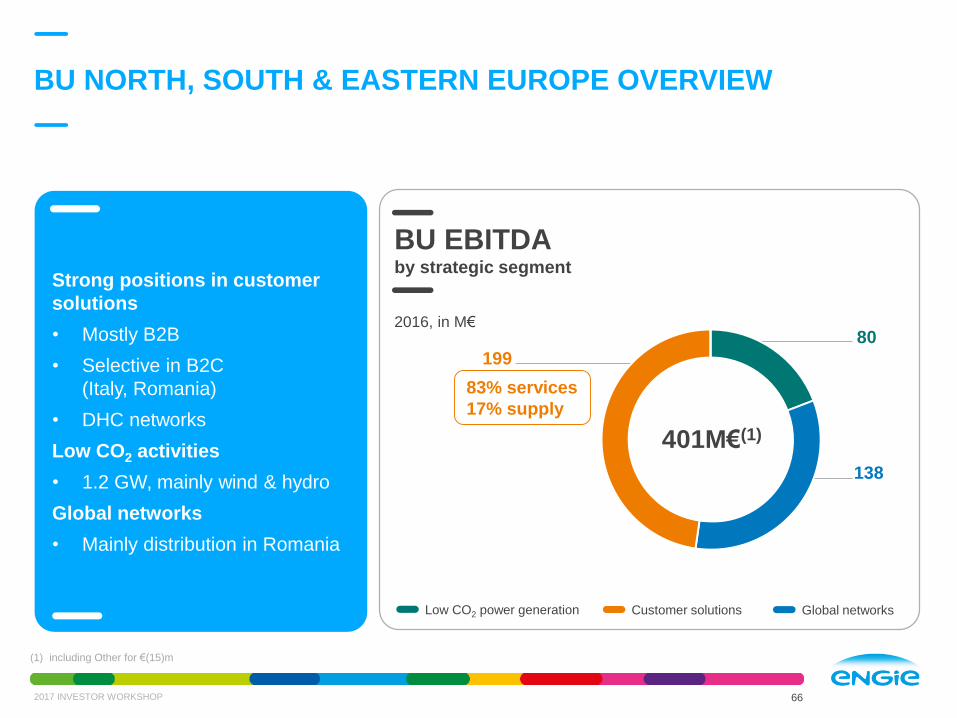
BU NORTH, SOUTH & EASTERN EUROPE OVERVIEW
2017 INVESTOR WORKSHOP 66
199
138
80
Strong positions in customer
solutions
• Mostly B2B
• Selective in B2C
(Italy, Romania)
• DHC networks
Low CO2 activities
• 1.2 GW, mainly wind & hydro
Global networks
• Mainly distribution in Romania
BU EBITDAby strategic segment
2016, in M€
Low CO2 power generation Customer solutions Global networks
83% services
17% supply
401M€(1)
(1) including Other for €(15)m
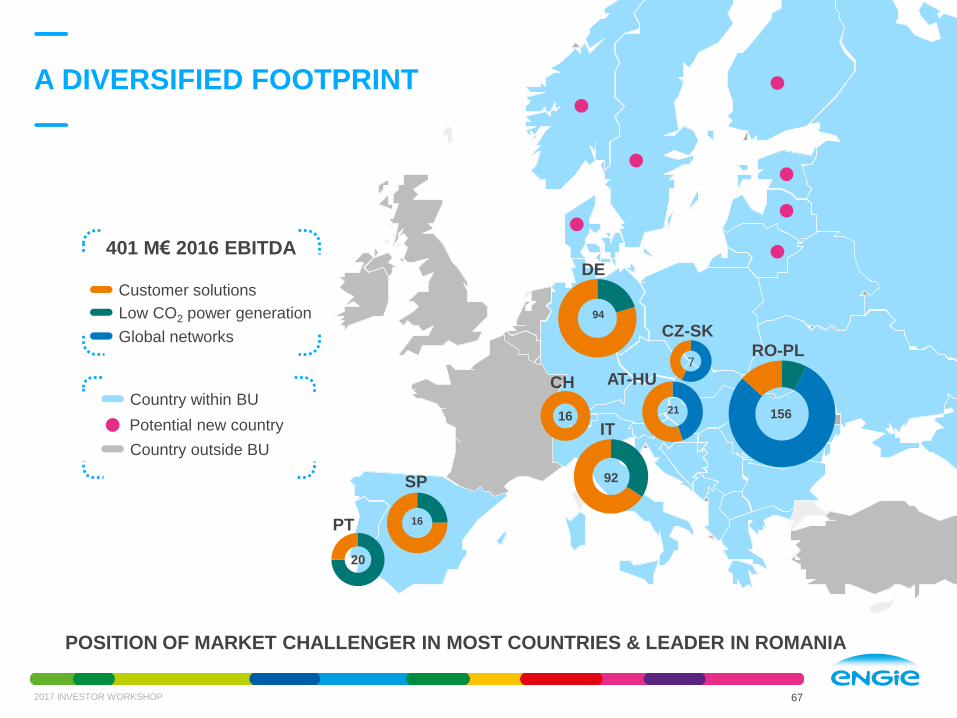
2017 INVESTOR WORKSHOP 67
Country within BU
Country outside BU
Potential new country
401 M€ 2016 EBITDA
156
92
16
1621
20
7
Global networks
Low CO2 power generation
Customer solutions
A DIVERSIFIED FOOTPRINT
RO-PLCZ-SK
AT-HU
SP
PT
IT
CH
POSITION OF MARKET CHALLENGER IN MOST COUNTRIES & LEADER IN ROMANIA
94
DE

ZOOM ON B2X: CUSTOMER OFFERING
2017 INVESTOR WORKSHOP 68
Ex
isti
ng
Ne
w a
rea
s
un
der
de
ve
lop
me
nt
B2B
Integrated offers with digital & energy efficiency
Development of BIM
Decentralized
generation
Installation & O&M
for industry/tertiary• Presence in all countries
Facility management
Specific offering to
public administration • Cities, hospitals, universities
B2C
Comfort at home (connected objects
and bundled offers)
E-servicesPilot project in Bucharest
(Ajusto)
Commodity sales• 1.7 M gas contracts in
Romania
• 0.7 M gas contracts &
0.1 M power contracts in Italy
• Equity participations in
German Stadtwerke
Traditional home
services• RO: ~650k contracts in 2016
B2T
City verticals • Security, traffic management,
air quality, 3D modeling,
dashboards…
DHC• 45 DHC in portfolio
• Incl.world class references
(Barcelona, Lisbon)
Public lighting• ~75k lighting points
already in portfolio (IT, SK)

B2B - REINFORCE CORE BUSINESS IN ENERGY
EFFICIENCY & DECENTRALIZED SOLUTIONS
2017 INVESTOR WORKSHOP 69
Europe remains world 1st market
for energy efficiency
• Dynamic growth in mature markets (DE, IT)
• Specific niches (eg. data centers)
Auto consumption for industrials
is gaining further momentum
• Cogeneration, rooftop PV
Customers expect price, quality
& transparency
Market drivers
Installation backlog represented ~60%
of 2016 revenues and reached a
historical level (+23% in Q1 yoy)
Development of energy efficiency
and decentralized solutions in
installation business
• Datacentre of T-Systems in Biere (Germany)
• DSM in Switzerland
Reinforce customer anchorage
in FM and O&M
• Athens Opera and National Library
(Stavros Niarchos)
Pan European tenders leveraging
Group scale & expertise
Strategy execution
B2B

B2T - A TARGETED MARKET
WITH STRONG POTENTIAL AHEAD
2017 INVESTOR WORKSHOP 70
DHC: continuous development
• Efficient & sustainable energy solutions to meet
urban development challenges
Lighting business: further potential ahead
• Existing regulation imposing phase-out
of old lamps
• Entry point to upsell more services
Expand local footprint through further
DHC development
• Greenfield developments (Aosta, Lisbon,
Barcelona) & selective acquisitions
• Taking over Stadwerke of Gera
Develop offering towards cities
• Ongoing acquisition of >150k lighting points
First steps in green mobility
• Development of CNG ongoing in Romania,
LNG/CNG refueling stations in Italy,…
B2T
EU Street & Roadway
Lighting Market
~+4% CAGR
Over next 6 years
From $2.8bn in 2016
EU District
Heating Market
~+5% CAGR
Over next 6 years
From 575 TWh in 2016
Source: estimates from Navigant Research 2017
Market drivers Strategy execution
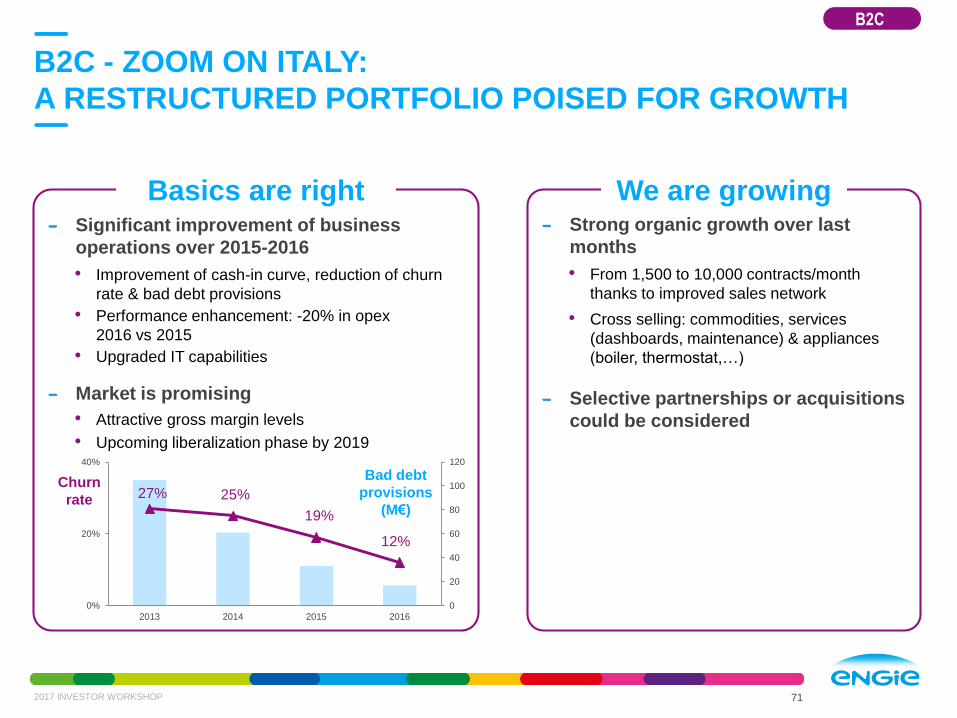
B2C - ZOOM ON ITALY:
A RESTRUCTURED PORTFOLIO POISED FOR GROWTH
2017 INVESTOR WORKSHOP 71
0
20
40
60
80
100
120
0%
20%
40%
2013 2014 2015 2016
Churn
rate 27% 25%
19%
12%
Significant improvement of business
operations over 2015-2016
• Improvement of cash-in curve, reduction of churn
rate & bad debt provisions
• Performance enhancement: -20% in opex
2016 vs 2015
• Upgraded IT capabilities
Market is promising
• Attractive gross margin levels
• Upcoming liberalization phase by 2019
Bad debt
provisions
(M€)
B2C
Strong organic growth over last
months
• From 1,500 to 10,000 contracts/month
thanks to improved sales network
• Cross selling: commodities, services
(dashboards, maintenance) & appliances
(boiler, thermostat,…)
Selective partnerships or acquisitions
could be considered
Basics are right We are growing
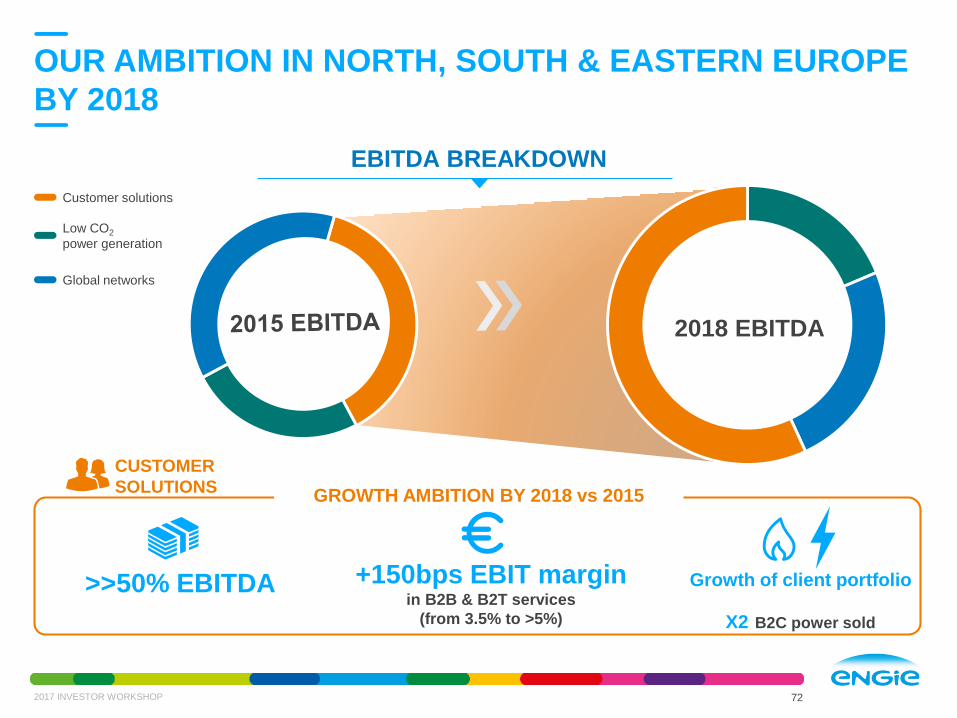
OUR AMBITION IN NORTH, SOUTH & EASTERN EUROPE
BY 2018
2017 INVESTOR WORKSHOP 72
CUSTOMER
SOLUTIONSGROWTH AMBITION BY 2018 vs 2015
>>50% EBITDA
Customer solutions
Low CO2
power generation
Global networks
EBITDA BREAKDOWN
Growth of client portfolio
X2 B2C power sold
+150bps EBIT margin in B2B & B2T services
(from 3.5% to >5%)
2018 EBITDA

CLIENTS’ CHALLENGES
reactivity, reliability, quality
ENGIE’S SOLUTION
BOOT (Build/Own/Operate/Transfer)
O&M contract (facility technical services)
and utilities operation: steam, electricity,
ice water chillers, waste water treatment,
compressed air…
CLIENTS’ BENEFITS
CAPEX savings allowing DANONE
to invest more in the core business
Full O&M risk transfer to ENGIE as
unique technical expert and service
provider
Ongoing energy performance
CASE STUDY 1: DECENTRALISED GENERATION
AND SUPPLY FOR DANONE
73
MILUPA / DANONE
raised the factory production of milk
powder (x2). Outsourcing of the utility
part of the project
CONTRACT PERIOD
10 years
INVESTMENT
20 M€
Germany
B2B
2017 INVESTOR WORKSHOP
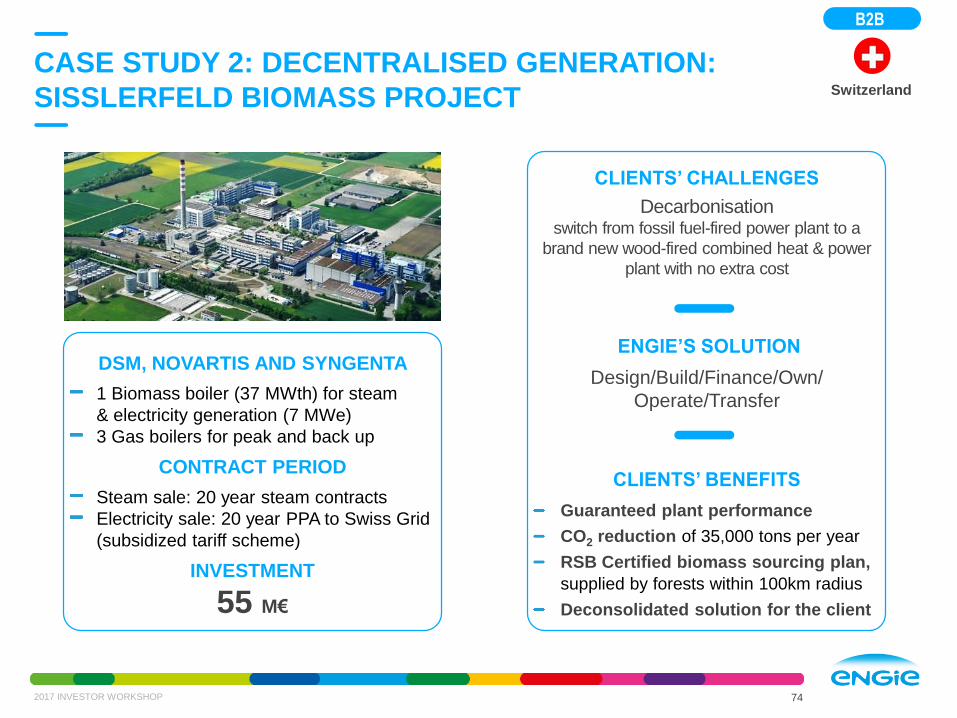
DSM, NOVARTIS AND SYNGENTA
1 Biomass boiler (37 MWth) for steam
& electricity generation (7 MWe)
3 Gas boilers for peak and back up
CONTRACT PERIOD
Steam sale: 20 year steam contracts
Electricity sale: 20 year PPA to Swiss Grid
(subsidized tariff scheme)
INVESTMENT
55 M€
CASE STUDY 2: DECENTRALISED GENERATION:
SISSLERFELD BIOMASS PROJECT
2017 INVESTOR WORKSHOP 74
Switzerland
CLIENTS’ CHALLENGES
Decarbonisationswitch from fossil fuel-fired power plant to a
brand new wood-fired combined heat & power
plant with no extra cost
ENGIE’S SOLUTION
Design/Build/Finance/Own/
Operate/Transfer
CLIENTS’ BENEFITS
Guaranteed plant performance
CO2 reduction of 35,000 tons per year
RSB Certified biomass sourcing plan,
supplied by forests within 100km radius
Deconsolidated solution for the client
B2B

2017 INVESTOR WORKSHOPJune 20th, 2017
BU North America
Frank Demaille, CEO

95
141
475 M€(1)
NORAM BU Overview
Customer solutions
• Services turnover ~€0.5bn
• Electricity contracts
• 97k for B2B
• 95k for B2C
Low CO2 activities
• 2.4 GW contracted gas fleet
• 800 MW renewables
3,635 employees
o/w 2,500 in customer
solutions
BU NORAM EBITDA by strategic segment
2016, in M€
Low CO2 power generationCustomer solutionsUS thermal merchant
assets disposed
762017 INVESTOR WORKSHOP
67% supply
33% services
(1) Includes the contribution from recently divested merchant assets

+ Acquisitions
to enhance offerings:
• Measure & manage
• Energy analytics & engagement
• Energy supply & optimization
Commodity risk
management
Scale and
diversification
Transformation From a merchant generator to a solutions driven BU
Merchant
Generator
&
Commodity
Electric
Supplier
Comprehensive
Energy
Services
Provider
13 GWportfolio
77%merchant
Commodity
energy supply
772017 INVESTOR WORKSHOP
Customer relationships
Sector knowledge
Scope of solutions
Scalability of offerings
Speed and flexibility
3 GWportfolio
Contracted
& low CO2
CUSTOMER
SOLUTIONS
LOW CO2
GENERATION
Key
Requirements

Clients seeking low cost,
resilient and green energy
FAVORABLE ENVIRONMENT FOR CUSTOMER SOLUTIONS
Integrated energy solutions for low cost,
sustainability and resilience
EXTERNAL MARKET DRIVERS ENGIE’S B2X SOLUTIONS
782017 INVESTOR WORKSHOP
Digitalization of energy services; customers
expecting immediate, personalized service
Interest in “One-stop shop“
Financial constraints hindering investment
Rapidly improving competitiveness
of renewable and storage technologies
Rising T&D costs
Digital platform for customer capture
and retention
Focused on outcomes, not complexity
Financing mechanisms
Renewables and storage capabilities
for on-site and off-site options
Grid services solutions
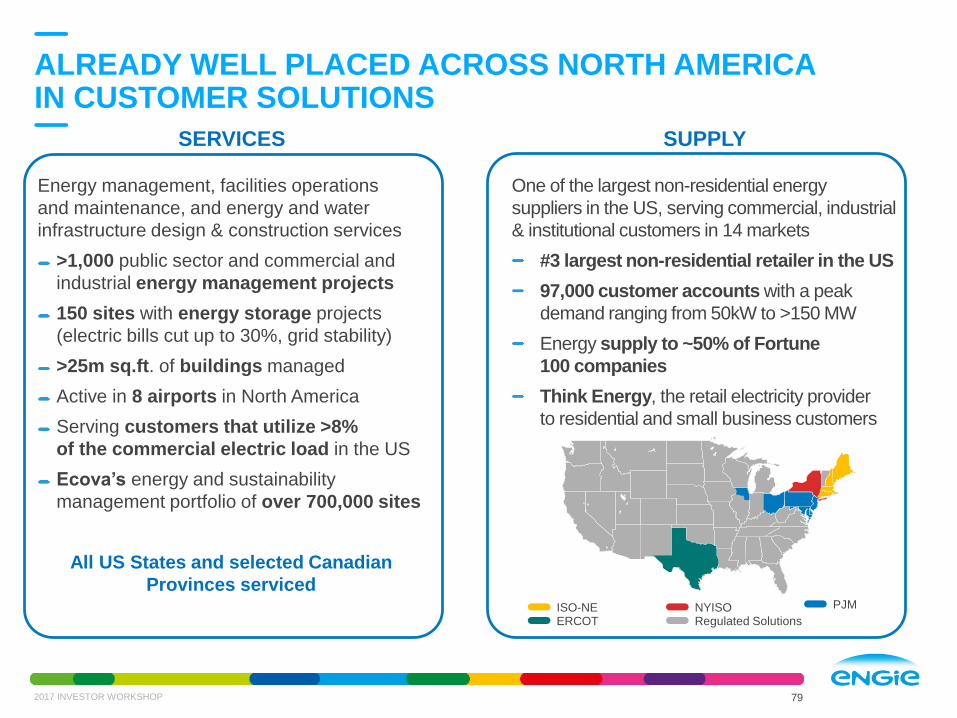
ALREADY WELL PLACED ACROSS NORTH AMERICA IN CUSTOMER SOLUTIONS
SERVICES SUPPLY
ERCOTISO-NE NYISO
Regulated Solutions
PJM
Energy management, facilities operations
and maintenance, and energy and water
infrastructure design & construction services
>1,000 public sector and commercial and
industrial energy management projects
150 sites with energy storage projects
(electric bills cut up to 30%, grid stability)
>25m sq.ft. of buildings managed
Active in 8 airports in North America
Serving customers that utilize >8%
of the commercial electric load in the US
Ecova’s energy and sustainability
management portfolio of over 700,000 sites
All US States and selected Canadian
Provinces serviced
One of the largest non-residential energy
suppliers in the US, serving commercial, industrial
& institutional customers in 14 markets
#3 largest non-residential retailer in the US
97,000 customer accounts with a peak
demand ranging from 50kW to >150 MW
Energy supply to ~50% of Fortune
100 companies
Think Energy, the retail electricity provider
to residential and small business customers
792017 INVESTOR WORKSHOP

Consulting
InstallationRecurring
Service
Commodity
Full range of energy solutions
Access to best technical / financial partners
Strong balance sheet
ENGIE UNIQUE VALUE PROPOSITION
IN A FRAGMENTED COMPETITIVE MARKET
80
ACTION INSIGHTS
Technology agnostic approach
Commodity supply and price risk management expertise
Competitive edges
Financing
Continuous monitoring
Energy supply
Energy procurement
Energy data analytics
Energy & resource
management
Design & build energy
efficiency
Generation
Demand response
Storage
EV infrastructure
2017 INVESTOR WORKSHOP
O&M
Portfolio Optimization

GROWTH AMBITIONS AND PRIORITIES
2017 INVESTOR WORKSHOP
B2B
Build business model around
originating and optimizingenergy solutions
Technology consortia,
partnerships and internal
innovation to drive transformation
Digitalizing our business
processes to increase flexibility
and scalability
Build on C&I Stronghold
Comprehensive energy & sustainability offerings
Decentralized energy (CHP, community solar, storage)
Grow Communities/Territories Segment
Energy efficiency, resilient energy, smart lighting
Energy communities; aggregation services
to utilities / ISOs(1)
Be the largest and most trusted sustainable resource provider,
who guarantees performance and integrates industry leading technologies/services
B2T
Grow Consumer Business
Energy cost management
Prosumer optimization; aggregation services to utilities/ISOs
B2C
Develop a leading all-digital engagement platform, associating price and quantity
81
(1) Independent System Operators

OUR AMBITION IN NORAM BY 2018
2017 INVESTOR WORKSHOP 82
CUSTOMER
SOLUTIONSGROWTH AMBITION BY 2018 vs 2015
> x2 Services revenues
x4 Number of B2C
electricity contracts
> x2EBITDAcustomer solutions
EBITDA BREAKDOWN
2018 EBITDA
Customer solutions
Low CO2
power generation
(1) Pro forma disposal of US merchant power generation assets

CASE STUDY 1: OHIO STATE UNIVERSITY (OSU)
83
OHIO STATE UNIVERSITY
(COLUMBUS, OH)
District energy operation of a university campus
with over 410 buildings
Selected over a 2-year period as the top bidder
amongst 40 participants in the RFI(1) phase
CONTRACT PERIOD
50 years
INVESTMENT
1.2 B$
CLIENT’S CHALLENGE
Position OSU as international leader
in sustainability
ENGIE’S SOLUTION
Innovative 50-year public-private
partnership deal to operate and manage
OSU’s Columbus campus utility system
comprising electric, steam, heating,
natural gas and chilled water facilities
CLIENT’S BENEFITS
25% committed energy consumption
reduction in 10 years
2017 INVESTOR WORKSHOP
(1) Request for information
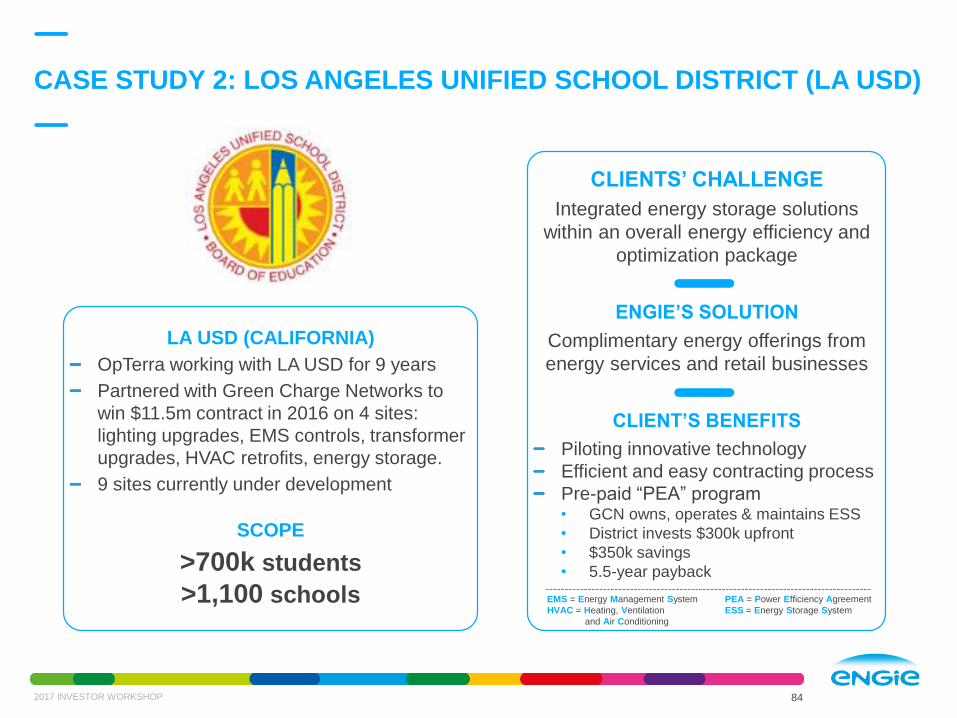
CASE STUDY 2: LOS ANGELES UNIFIED SCHOOL DISTRICT (LA USD)
2017 INVESTOR WORKSHOP 84
LA USD (CALIFORNIA)
OpTerra working with LA USD for 9 years
Partnered with Green Charge Networks to
win $11.5m contract in 2016 on 4 sites:
lighting upgrades, EMS controls, transformer
upgrades, HVAC retrofits, energy storage.
9 sites currently under development
SCOPE
>700k students
>1,100 schools
CLIENTS’ CHALLENGE
Integrated energy storage solutions
within an overall energy efficiency and
optimization package
ENGIE’S SOLUTION
Complimentary energy offerings from
energy services and retail businesses
CLIENT’S BENEFITS
Piloting innovative technology
Efficient and easy contracting process
Pre-paid “PEA” program• GCN owns, operates & maintains ESS
• District invests $300k upfront
• $350k savings
• 5.5-year payback
EMS = Energy Management System
HVAC = Heating, Ventilation
and Air Conditioning
PEA = Power Efficiency Agreement
ESS = Energy Storage System

2017 INVESTOR WORKSHOPJune 20th, 2017
BU United Kingdom
Wilfrid Petrie, CEO

UK BU OVERVIEW
2017 INVESTOR WORKSHOP
Customer solutions
• 25 million m2 of managed
premises
• 32,000 business customer sites
• 170 councils served
Low CO2 activities
• 2 GW – UK’s largest pumped
storage facility (First Hydro)
• 75 MW wind and solar portfolio
• 355 MW of embedded
generation managed for
customers
BU UK EBITDAby strategic segment
2016, in M€
Low CO2 power generation Customer solutions
97 124211 M€(1)
86
65% services
35% supply
(1) Total includes Other €(10)m
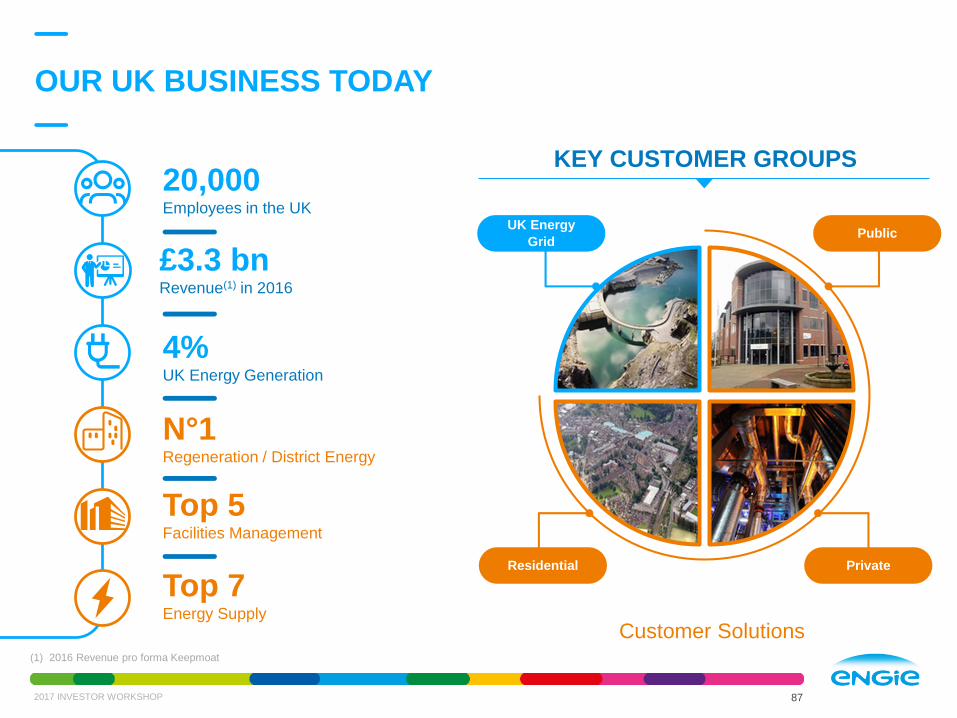
OUR UK BUSINESS TODAY
2017 INVESTOR WORKSHOP
Public
Customer Solutions
KEY CUSTOMER GROUPS
Private Residential
UK Energy
Grid
20,000Employees in the UK
Top 5Facilities Management
4%UK Energy Generation
£3.3 bnRevenue(1) in 2016
Top 7Energy Supply
N°1Regeneration / District Energy
87
(1) 2016 Revenue pro forma Keepmoat

STRATEGY & COMPETITIVE ADVANTAGES
88
Lead the way in innovative services
and sustainable energy to our chosen customers
There is more value
in reducing consumption
than supplying a commodity
The UK has a business
of 35% EBITDA in energy combined
with 65% EBITDA in services
There is more value
in providing integrated
solutions with end results
The UK market is mature
to outsourcing
ENGIE is the player in the market
with capabilities across the value chain
Our portfolio of customers
is balanced
By strengthening our local government
base through the acquisition of
Keepmoat Regeneration we have
increased our resilience
2017 INVESTOR WORKSHOP

Energy Supply
Facilities Management
Technical Services
Business Services
ACTIVITIES IN CUSTOMER SOLUTIONS
£1.6 bn(1)
2016 revenue
£1.2 bn2016 revenue
START UPEnergy Supply
Connected Services
Maintenance
PRIVATE
PUBLIC
Regeneration (Keepmoat)
District Electricity, Heating
& Cooling
Facilities Management
Smart Government
RESIDENTIAL
2017 INVESTOR WORKSHOP 89
(1) Excludes First Hydro

PRIVATE: CREATING MORE VALUE
FROM COMBINING ENERGY & SERVICES
ENGIE uniquely positioned to offer energy & services
Energy Supply
ENGIE has unique position
in UK market
Ability to offer private & public sector
clients energy supply,
technical services and facility
management
Target: to increase integrated
energy & services contracts
from 15% in 2016 to 50% in 2019
Revenue from combined Energy &
Services offers in 2016:
~£200m in Private Sector
Facility Management
&On-site generation
Smart building solutions
Cross sell energy and
facility management
2017 INVESTOR WORKSHOP 90
ENERGY
EFFICIENCY OUTSOURCING
MARKET DRIVERS ENGIEADDITIONAL
GROWTH POTENTIAL

PUBLIC / THE PLACE:
STRONG GROWTH IN A STABLE MARKET
2017 INVESTOR WORKSHOP 91
ENGIE in the UK is a leader in regenerating places
Reduction in Budgets
Devolution to local
Home energy
Retirement living
ACCEPTANCE
OF CHANGE
FOCUS ON
OUTCOMES
ENGIE provides services
to 170 of the 400 councils
Comprehensive solutions to address
regeneration, with district energy,
and cost constraints, with outsourcing
and smart government
8% p.a. growth expected in next
five years
Cross sell in our 170 councils
MARKET DRIVERS ENGIEADDITIONAL
GROWTH POTENTIAL
&

RESIDENTIAL / HOME ENERGY:
LEVERAGING EXISTING UK & GROUP EXPERTISE
2017 INVESTOR WORKSHOP 92
Home energy expands our energy & services proposition for cities & communities
Customer: Fair pricing & new products
Community:
Direct offers from councils
Customer: direct sales in cities,
innovative products
Connected: more connected devices,
leverage ENGIE’s €1.5 bn investment
(e.g. acquisition of EV Box)
B2C is a natural extension of our B2B
energy supply activities in the UK
Key differentiator is the combination of
energy & services
Not trying to create a ‘Big 7’ –
No legacy issues of the Big 6
Community: white label offerings & JV
partnerships, Keepmoat Regeneration
Connected: Technology advances
MARKET DRIVERS ENGIEADDITIONAL
GROWTH POTENTIAL
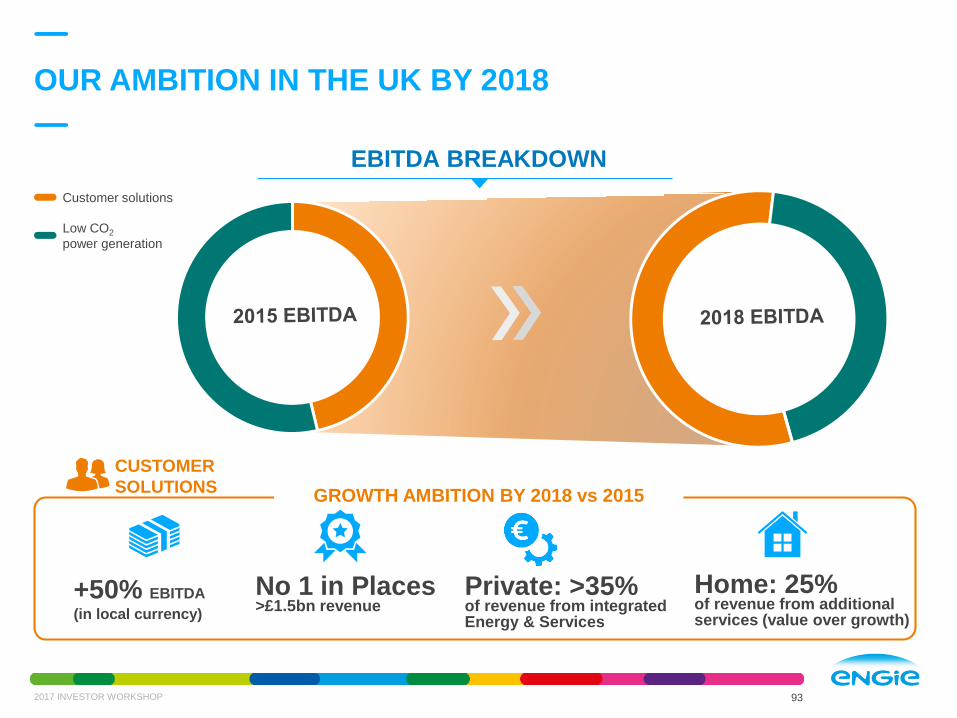
OUR AMBITION IN THE UK BY 2018
93
EBITDA BREAKDOWN
CUSTOMER
SOLUTIONSGROWTH AMBITION BY 2018 vs 2015
+50% EBITDA
(in local currency)
No 1 in Places >£1.5bn revenue
Private: >35% of revenue from integrated Energy & Services
Home: 25% of revenue from additional services (value over growth)
2017 INVESTOR WORKSHOP
Customer solutions
Low CO2
power generation

Healthcare• ENGIE has 30-year PFI for Facilities Management at
Mid-Yorkshire NHS Trust which began in 2007
• £14m p.a , 387 staff providing 15 different services
Local Authority• ENGIE awarded 10-year, £20m p.a contract by Wakefield
Council in December 2016, employing 800 people
• Facilities and energy management services across 500
council buildings and >100 schools with energy savings
guaranteed
Regeneration • Eco-refurbishment of 8-storey tower block
(Low Cross Court)
• Installation of 64 PV panels, insulation & new gas-fired
boiler plant Security - new door entry and CCTV systems
CASE STUDY – PUBLIC / THE PLACE
WAKEFIELD: IMPROVING THE LIVES OF COMMUNITIES
TODAY TOMORROW
Retirement Communities• Walton – Design, Build of 129 retirement dwellings
Phased development with full completion in 2024
On-site generation• Pinderfields hospital – Project to install a CHP
(Combined Heat & Power)
Home Energy • Direct sales to SMEs and residential customers
2017 INVESTOR WORKSHOP 94
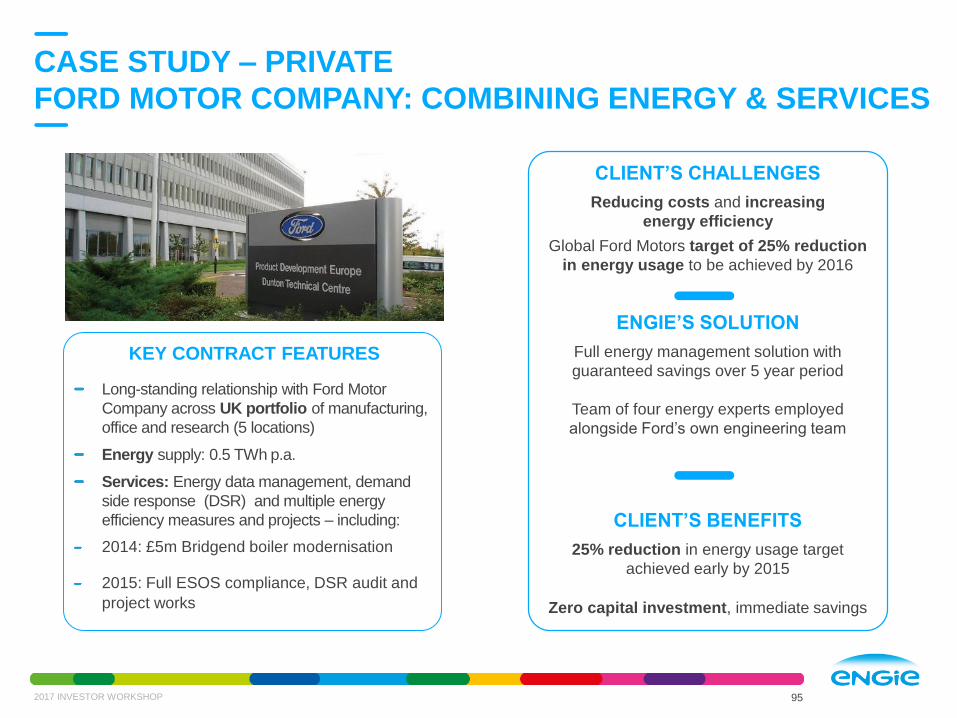
CLIENT’S CHALLENGES
Reducing costs and increasing
energy efficiency
Global Ford Motors target of 25% reduction
in energy usage to be achieved by 2016
ENGIE’S SOLUTION
Full energy management solution with
guaranteed savings over 5 year period
Team of four energy experts employed
alongside Ford’s own engineering team
CLIENT’S BENEFITS
25% reduction in energy usage target
achieved early by 2015
Zero capital investment, immediate savings
KEY CONTRACT FEATURES
Long-standing relationship with Ford Motor
Company across UK portfolio of manufacturing,
office and research (5 locations)
Energy supply: 0.5 TWh p.a.
Services: Energy data management, demand
side response (DSR) and multiple energy
efficiency measures and projects – including:
2014: £5m Bridgend boiler modernisation
2015: Full ESOS compliance, DSR audit and
project works
CASE STUDY – PRIVATE
FORD MOTOR COMPANY: COMBINING ENERGY & SERVICES
952017 INVESTOR WORKSHOP
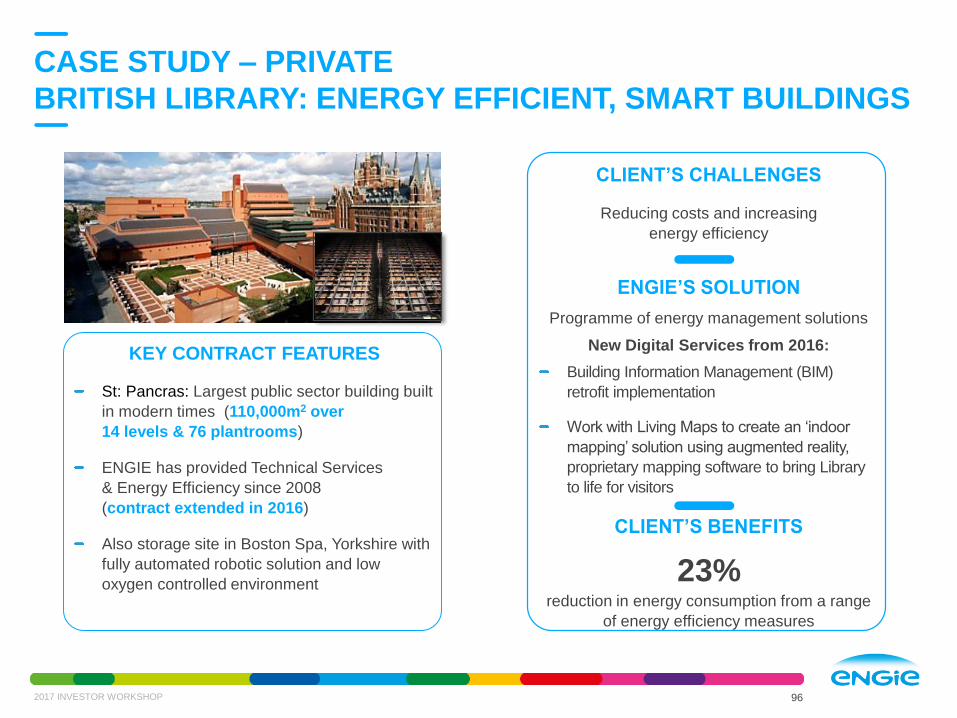
KEY CONTRACT FEATURES
St: Pancras: Largest public sector building built
in modern times (110,000m2 over
14 levels & 76 plantrooms)
ENGIE has provided Technical Services
& Energy Efficiency since 2008
(contract extended in 2016)
Also storage site in Boston Spa, Yorkshire with
fully automated robotic solution and low
oxygen controlled environment
CASE STUDY – PRIVATE
BRITISH LIBRARY: ENERGY EFFICIENT, SMART BUILDINGS
2017 INVESTOR WORKSHOP 96
CLIENT’S CHALLENGES
Reducing costs and increasing
energy efficiency
ENGIE’S SOLUTION
Programme of energy management solutions
New Digital Services from 2016:
Building Information Management (BIM)
retrofit implementation
Work with Living Maps to create an ‘indoor
mapping’ solution using augmented reality,
proprietary mapping software to bring Library
to life for visitors
CLIENT’S BENEFITS
23% reduction in energy consumption from a range
of energy efficiency measures

Forward-Looking statements
This communication contains forward-looking information and statements. These statements include
financial projections, synergies, cost-savings and estimates, statements regarding plans, objectives,
savings, expectations and benefits from the transactions and expectations with respect to future
operations, products and services, and statements regarding future performance. Although the
management of ENGIE believes that the expectations reflected in such forward-looking statements
are reasonable, investors and holders of ENGIE securities are cautioned that forward-looking
information and statements are not guarantees of future performances and are subject to various
risks and uncertainties, many of which are difficult to predict and generally beyond the control of
ENGIE , that could cause actual results, developments, synergies, savings and benefits to differ
materially from those expressed in, or implied or projected by, the forward-looking information and
statements. These risks and uncertainties include those discussed or identified in the public filings
made by ENGIE with the Autorité des Marchés Financiers (AMF), including those listed under
“Facteurs de Risque” (Risk factors) section in the Document de Référence filed by ENGIE (ex GDF
SUEZ) with the AMF on 24 March 2017 (under no: D.17-0220). Investors and holders of ENGIE securities
should consider that the occurrence of some or all of these risks may have a material adverse effect
on ENGIE.
DISCLAIMER
2017 INVESTOR WORKSHOP 97

+33 1 44 22 66 29
FOR MORE INFORMATION ABOUT ENGIE
http://www.engie.com/en/investors-area/
Download the new ENGIE Investor relations app
Ticker: ENGI
+33 1 44 22 66 29
2017 INVESTOR WORKSHOP 98