2017 Investment Symposium - SOA · 2017 Investment Symposium Session 12: ... • Fixed income and...
46
2017 Investment Symposium Session 12: Using Derivatives in Pension Investment Strategies Moderator: Jodan H. Ledford Presenters: Rick Ratkowski, CFA Rene Martel, FSA, CFA SOA Antitrust Disclaimer SOA Presentation Disclaimer
Transcript of 2017 Investment Symposium - SOA · 2017 Investment Symposium Session 12: ... • Fixed income and...
2017 Investment Symposium
Session 12: Using Derivatives in Pension Investment Strategies
Moderator: Jodan H. Ledford
Presenters: Rick Ratkowski, CFA
Rene Martel, FSA, CFA
SOA Antitrust Disclaimer SOA Presentation Disclaimer

Rick RatkowskiDerivatives: Tools for Risk ManagementMarch 9, 2017
2017 SOAInvestment Symposium
© 2017 NISA Investment Advisors, LLC. All rights reserved.All data presented are as of December 31, 2016, unless otherwise noted.The data supplied by NISA are based on trade date and calculated according to NISA’s pricing policies. NISA maintains the data only for its portfolio management, guideline verification and performance calculation purposes. NISA does not provide pricing, recordkeeping, brokerage or any related services. A summary of NISA’s Pricing and Valuation policy is available upon request.Some numbers have been rounded and may not sum to 100% or reported totals.NISA Investment Advisors, LLC is not acting in a fiduciary or advisory capacity in connection with the material presented herein. NISA Investment Advisors, LLC shall not have any liability for any damages of any kind whatsoever relating to this material. See other important disclaimers on the last page.
2
Agenda
Strategies which commonly utilize derivatives.
Importantly, though, derivatives are a tool, not a strategy.
Strategies for managing liability interest rate risk.
Current hedging trends among pension clients.
3
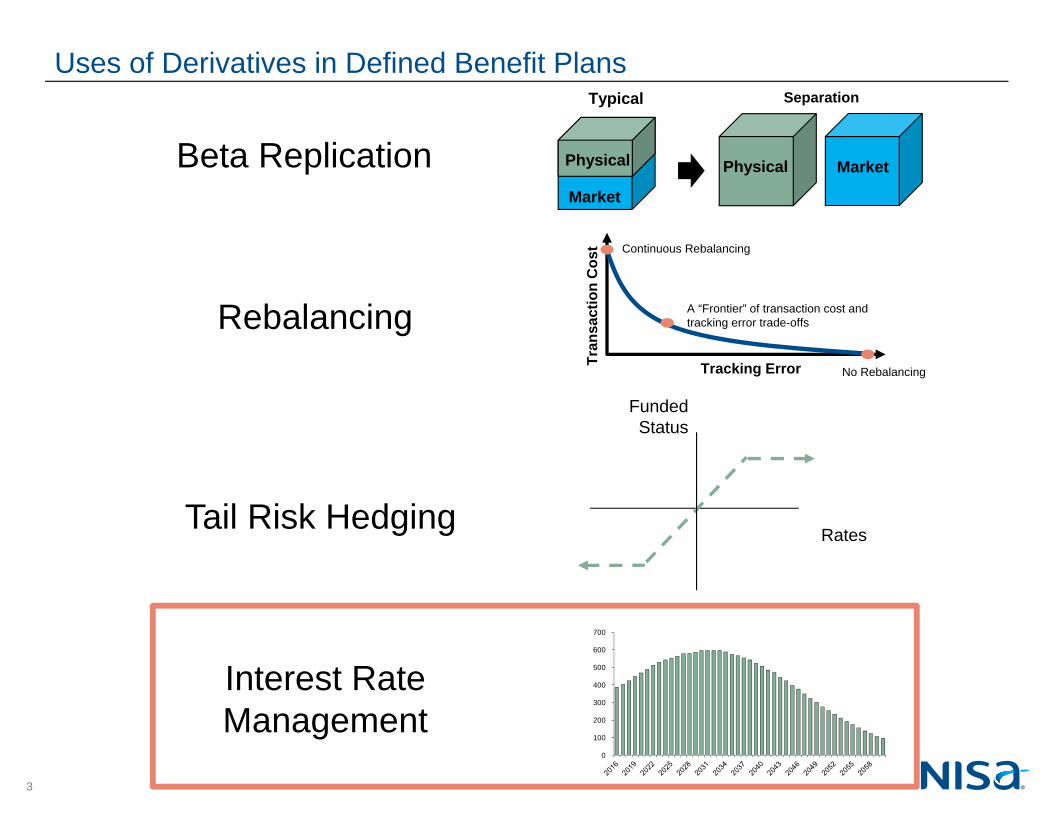
Uses of Derivatives in Defined Benefit Plans
Beta Replication
Rebalancing
Tail Risk HedgingRates
Funded Status
Continuous Rebalancing
Tracking Error No Rebalancing
A “Frontier” of transaction cost and tracking error trade-offs
Tran
sact
ion
Cos
t
Interest Rate Management
0
100
200
300
400
500
600
700
Physical Market
Typical Separation
Market
Physical
4
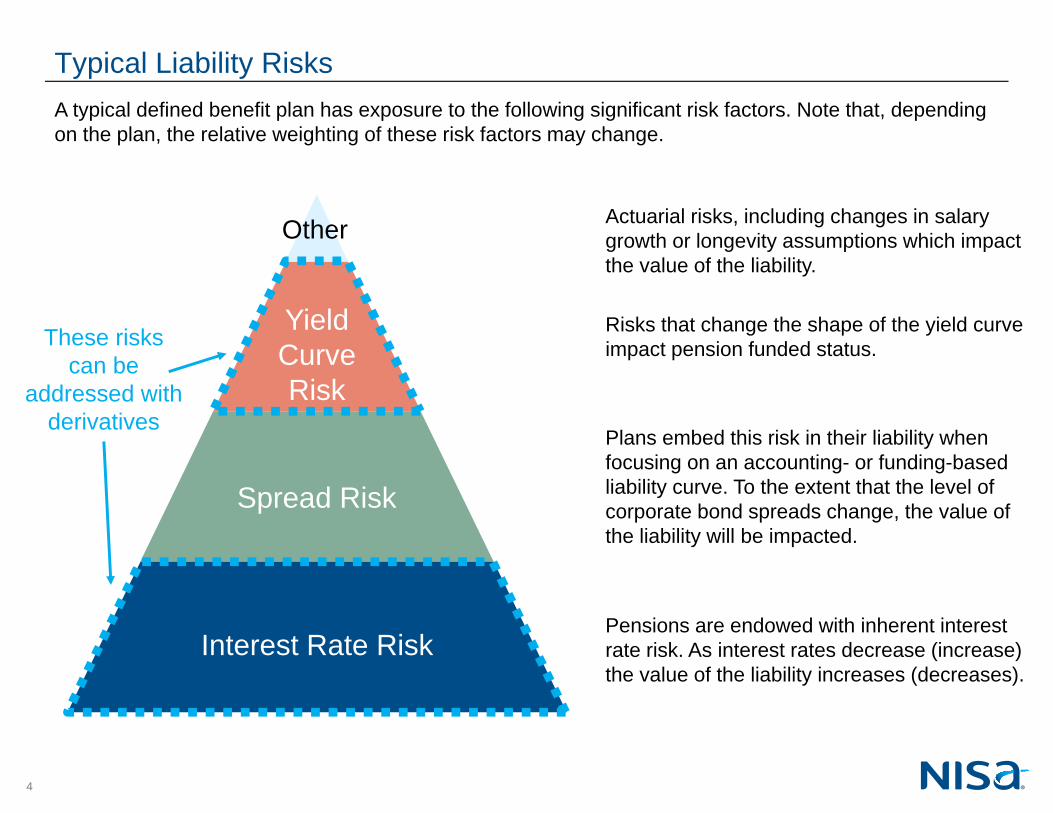
A typical defined benefit plan has exposure to the following significant risk factors. Note that, depending on the plan, the relative weighting of these risk factors may change.
Typical Liability Risks
Pensions are endowed with inherent interest rate risk. As interest rates decrease (increase) the value of the liability increases (decreases).
Plans embed this risk in their liability when focusing on an accounting- or funding-based liability curve. To the extent that the level of corporate bond spreads change, the value of the liability will be impacted.
Risks that change the shape of the yield curve impact pension funded status.
Actuarial risks, including changes in salary growth or longevity assumptions which impact the value of the liability.
Spread Risk
Yield CurveRisk
Other
Interest Rate Risk
These risks can be
addressed with derivatives
5
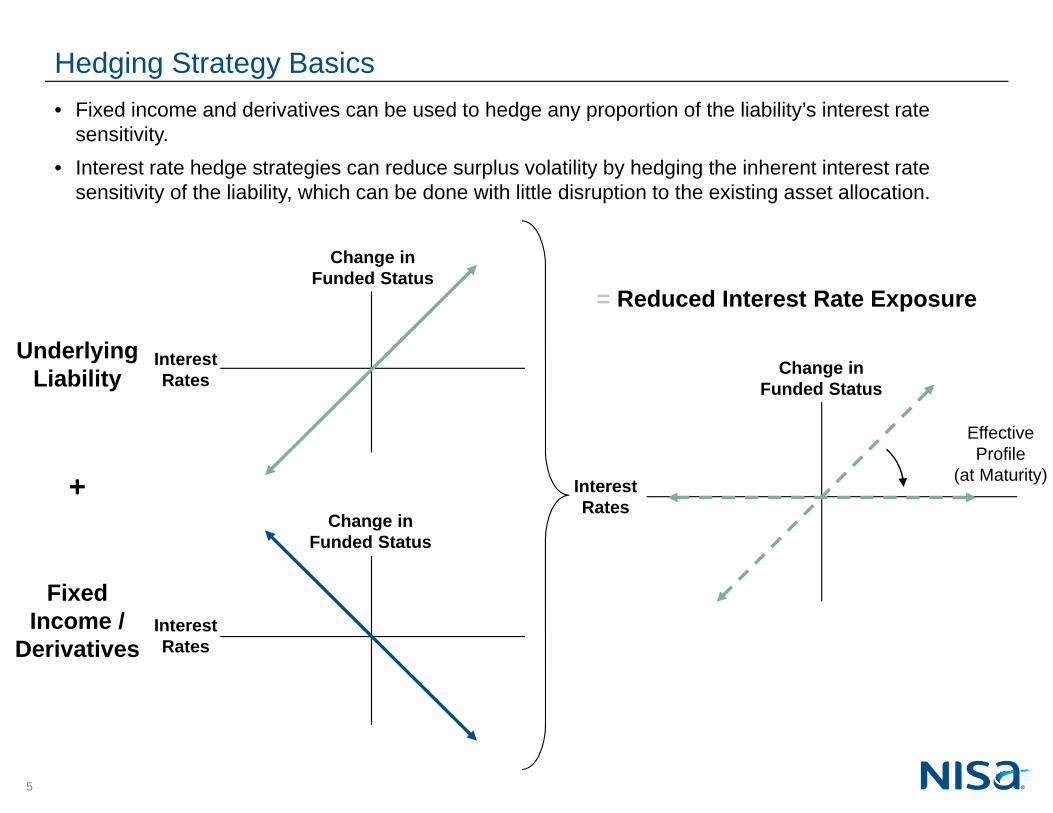
• Fixed income and derivatives can be used to hedge any proportion of the liability’s interest rate sensitivity.
• Interest rate hedge strategies can reduce surplus volatility by hedging the inherent interest rate sensitivity of the liability, which can be done with little disruption to the existing asset allocation.
InterestRates
Underlying Liability
Change inFunded Status
Fixed Income /
Derivatives
+
InterestRates
Change inFunded Status
InterestRates
EffectiveProfile
(at Maturity)
= Reduced Interest Rate Exposure
Change inFunded Status
Hedging Strategy Basics
6
0
10
20
30
40
50
60
70
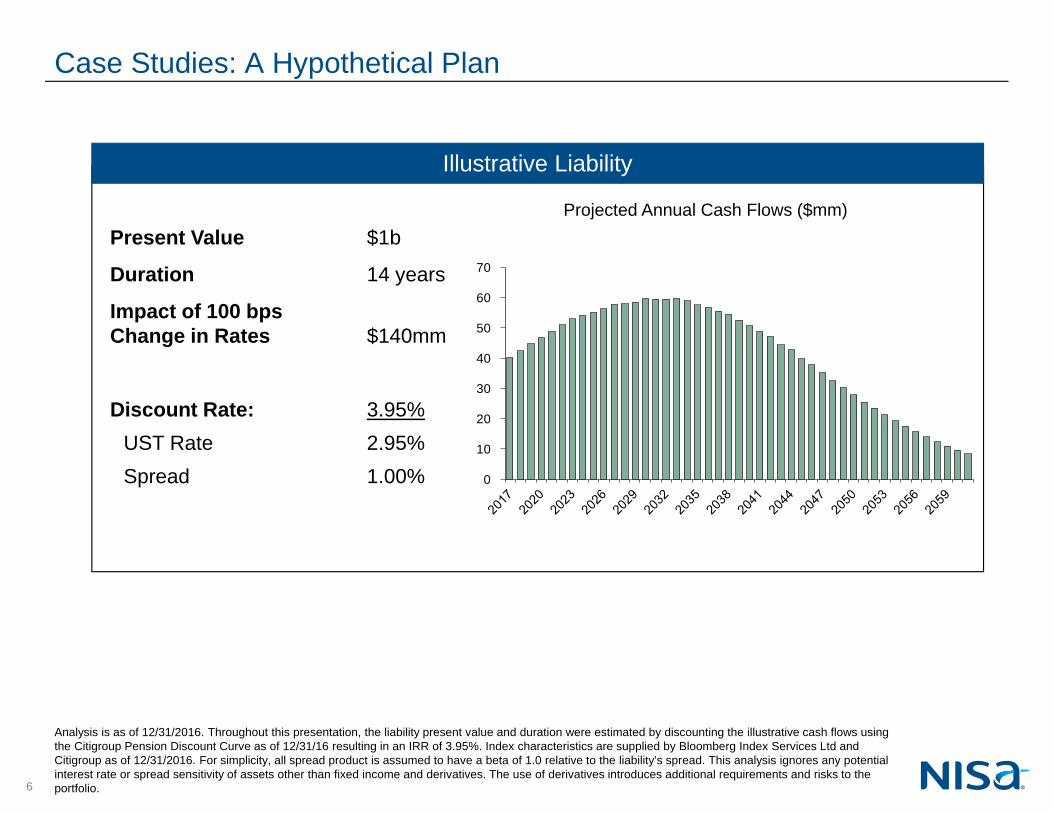
Illustrative Liability
Projected Annual Cash Flows ($mm)Present Value $1b
Duration 14 years
Impact of 100 bps Change in Rates $140mm
Discount Rate: 3.95%UST Rate 2.95%Spread 1.00%
Case Studies: A Hypothetical Plan
Analysis is as of 12/31/2016. Throughout this presentation, the liability present value and duration were estimated by discounting the illustrative cash flows using the Citigroup Pension Discount Curve as of 12/31/16 resulting in an IRR of 3.95%. Index characteristics are supplied by Bloomberg Index Services Ltd and Citigroup as of 12/31/2016. For simplicity, all spread product is assumed to have a beta of 1.0 relative to the liability’s spread. This analysis ignores any potential interest rate or spread sensitivity of assets other than fixed income and derivatives. The use of derivatives introduces additional requirements and risks to the portfolio.
7
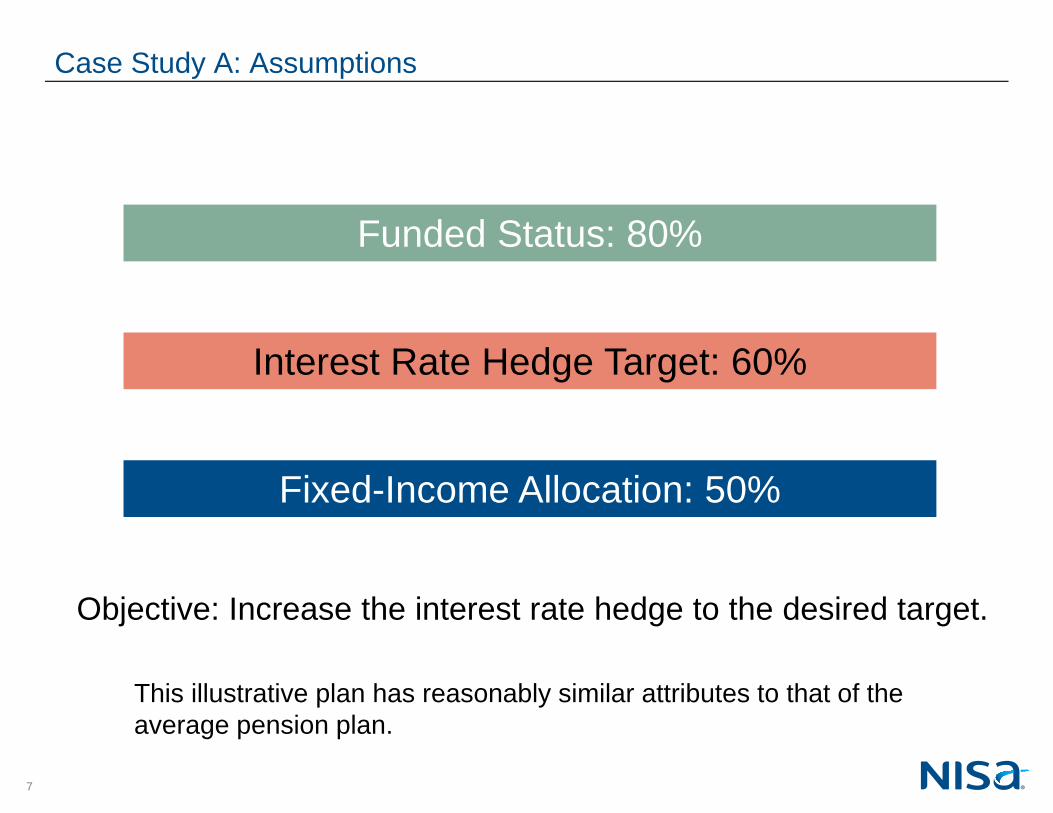
Case Study A: Assumptions
Funded Status: 80%
Interest Rate Hedge Target: 60%
Fixed-Income Allocation: 50%
This illustrative plan has reasonably similar attributes to that of the average pension plan.
Objective: Increase the interest rate hedge to the desired target.
8
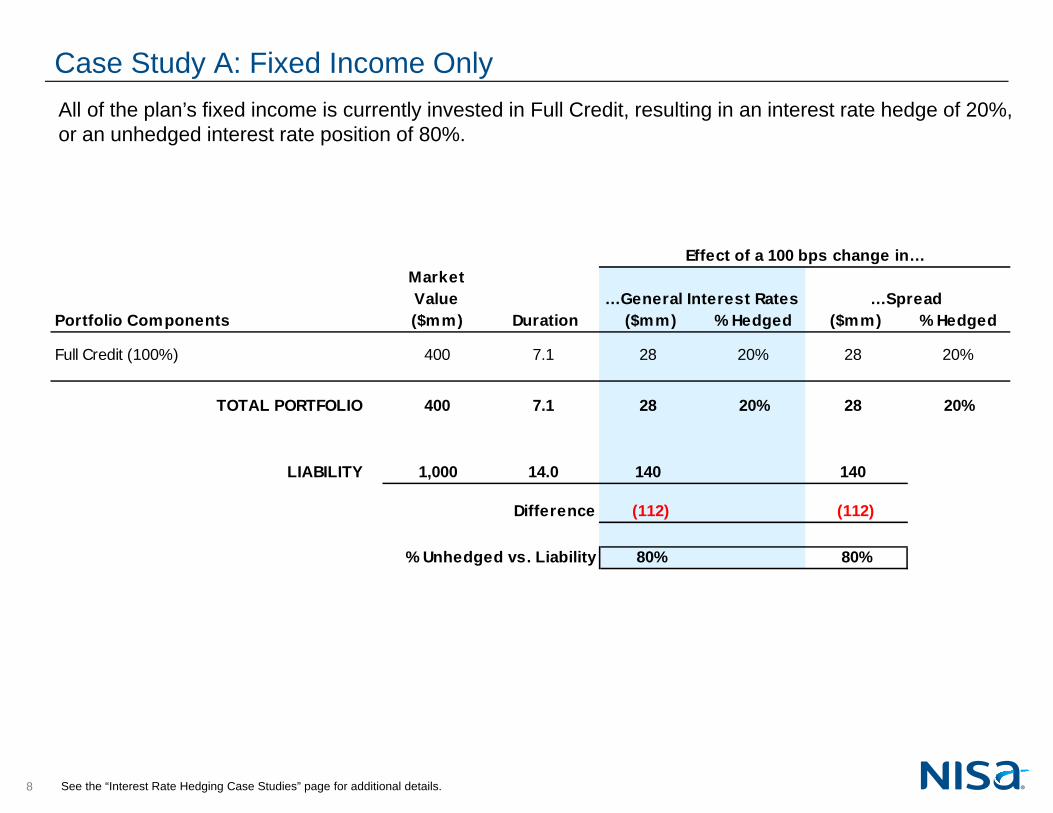
Effect of a 100 bps change in…MarketValue …General Interest Rates …Spread
Portfolio Components ($mm) Duration ($mm) % Hedged ($mm) % Hedged
Full Credit (100%) 400 7.1 28 20% 28 20%
TOTAL PORTFOLIO 400 7.1 28 20% 28 20%
LIABILITY 1,000 14.0 140 140
Difference (112) (112)
% Unhedged vs. Liability 80% 80%
Case Study A: Fixed Income Only
See the “Interest Rate Hedging Case Studies” page for additional details.
All of the plan’s fixed income is currently invested in Full Credit, resulting in an interest rate hedge of 20%, or an unhedged interest rate position of 80%.
9
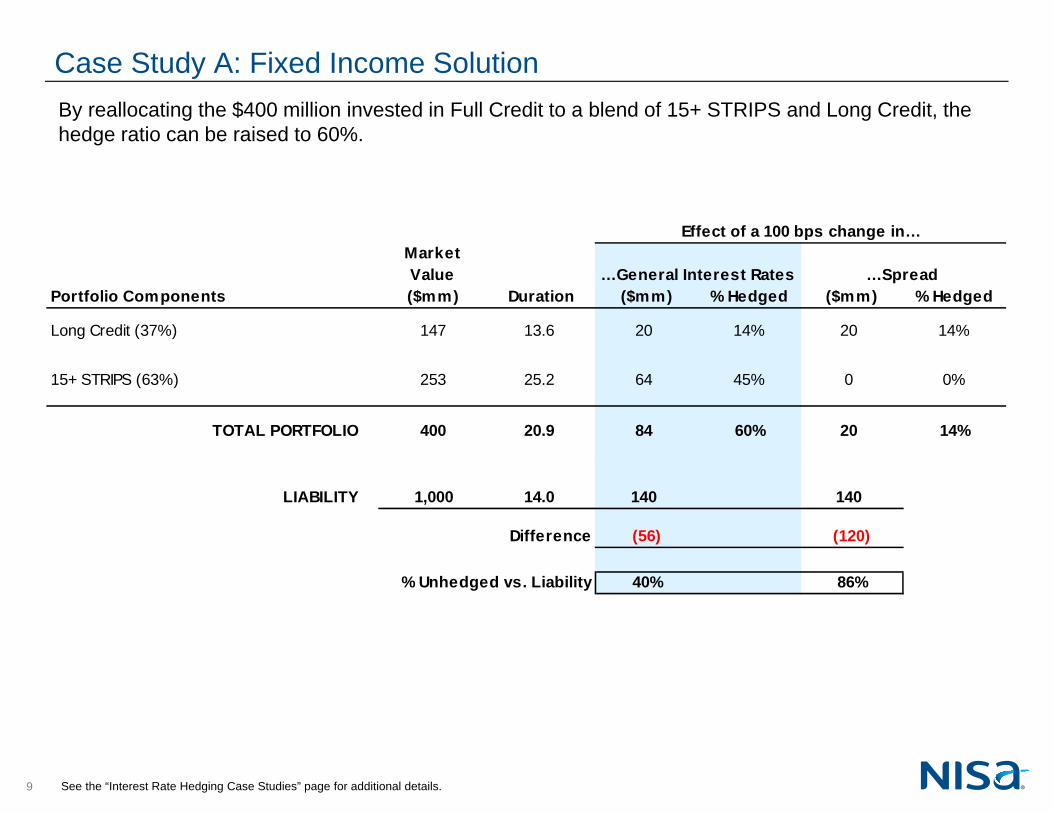
Effect of a 100 bps change in…MarketValue …General Interest Rates …Spread
Portfolio Components ($mm) Duration ($mm) % Hedged ($mm) % Hedged
Long Credit (37%) 147 13.6 20 14% 20 14%
15+ STRIPS (63%) 253 25.2 64 45% 0 0%
TOTAL PORTFOLIO 400 20.9 84 60% 20 14%
LIABILITY 1,000 14.0 140 140
Difference (56) (120)
% Unhedged vs. Liability 40% 86%
Case Study A: Fixed Income SolutionBy reallocating the $400 million invested in Full Credit to a blend of 15+ STRIPS and Long Credit, the hedge ratio can be raised to 60%.
See the “Interest Rate Hedging Case Studies” page for additional details.
10
-5.0
-3.8
-2.5
-1.3
0.0
1.3
2.5
3.8
5.0
0.0
0.5
1.0
1.5
2.0
2.5
3.0
3.5
4.0
Cum
ulat
ive
CTD
Diff
eren
ce
Con
tribu
tion
to D
urat
ion
(yea
rs)
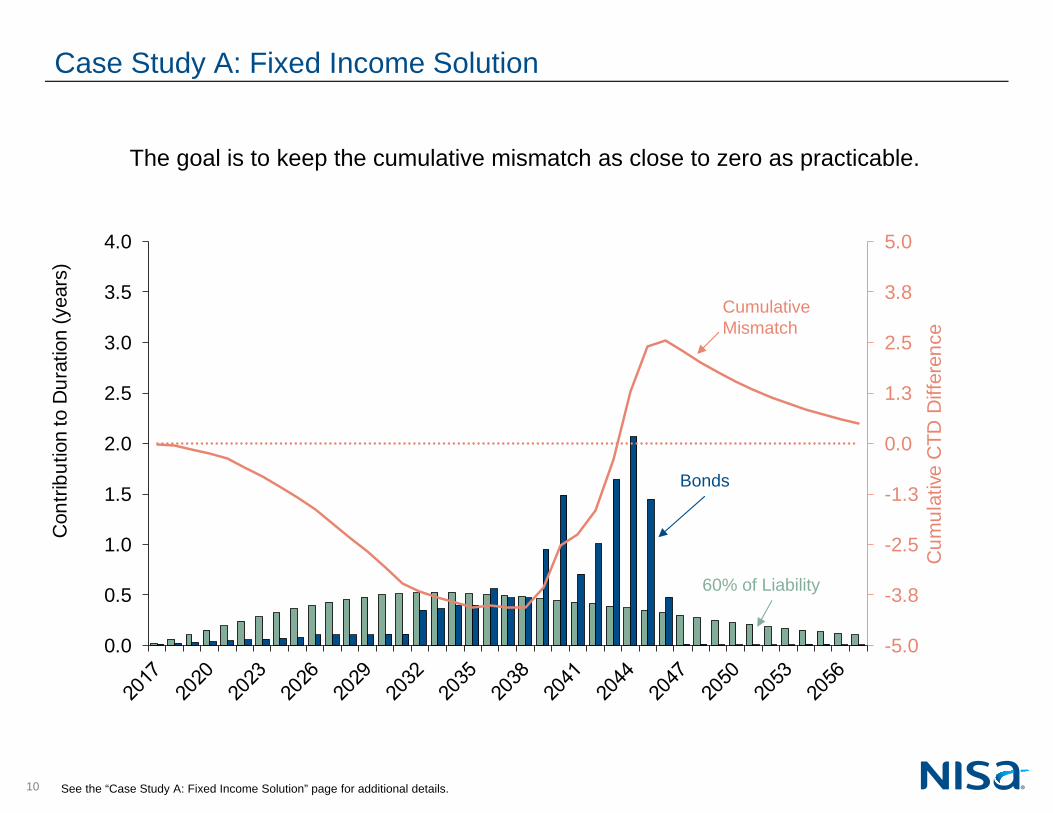
Case Study A: Fixed Income Solution
The goal is to keep the cumulative mismatch as close to zero as practicable.
Bonds
CumulativeMismatch
See the “Case Study A: Fixed Income Solution” page for additional details.
60% of Liability
11
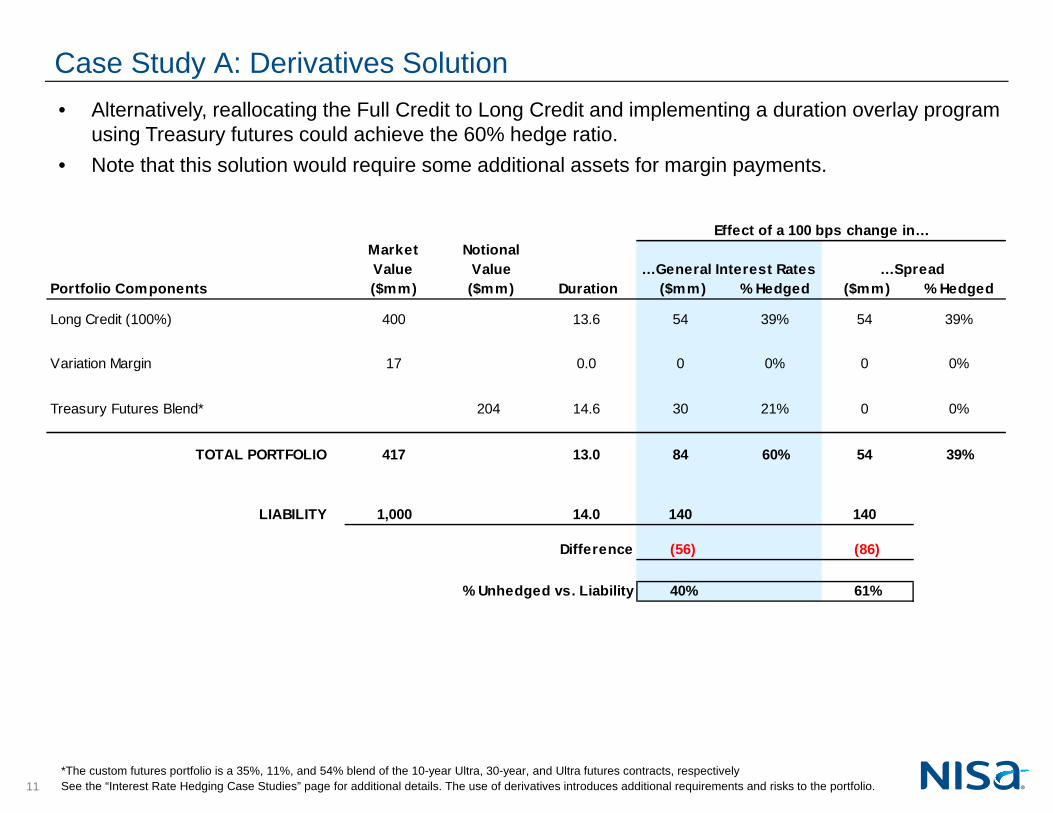
Effect of a 100 bps change in…MarketValue
NotionalValue …General Interest Rates …Spread
Portfolio Components ($mm) ($mm) Duration ($mm) % Hedged ($mm) % Hedged
Long Credit (100%) 400 13.6 54 39% 54 39%
Variation Margin 17 0.0 0 0% 0 0%
Treasury Futures Blend* 204 14.6 30 21% 0 0%
TOTAL PORTFOLIO 417 13.0 84 60% 54 39%
LIABILITY 1,000 14.0 140 140
Difference (56) (86)
% Unhedged vs. Liability 40% 61%
Case Study A: Derivatives Solution• Alternatively, reallocating the Full Credit to Long Credit and implementing a duration overlay program
using Treasury futures could achieve the 60% hedge ratio.• Note that this solution would require some additional assets for margin payments.
*The custom futures portfolio is a 35%, 11%, and 54% blend of the 10-year Ultra, 30-year, and Ultra futures contracts, respectively See the “Interest Rate Hedging Case Studies” page for additional details. The use of derivatives introduces additional requirements and risks to the portfolio.
12
-5.0
-3.8
-2.5
-1.3
0.0
1.3
2.5
3.8
5.0
0.0
0.5
1.0
1.5
2.0
2.5
3.0
3.5
4.0
Cum
ulat
ive
CTD
Diff
eren
ce
Con
tribu
tion
to D
urat
ion
(yea
rs)
-5.0
-3.8
-2.5
-1.3
0.0
1.3
2.5
3.8
5.0
0.0
0.5
1.0
1.5
2.0
2.5
3.0
3.5
4.0
Cum
ulat
ive
CTD
Diff
eren
ce
Con
tribu
tion
to D
urat
ion
(yea
rs)
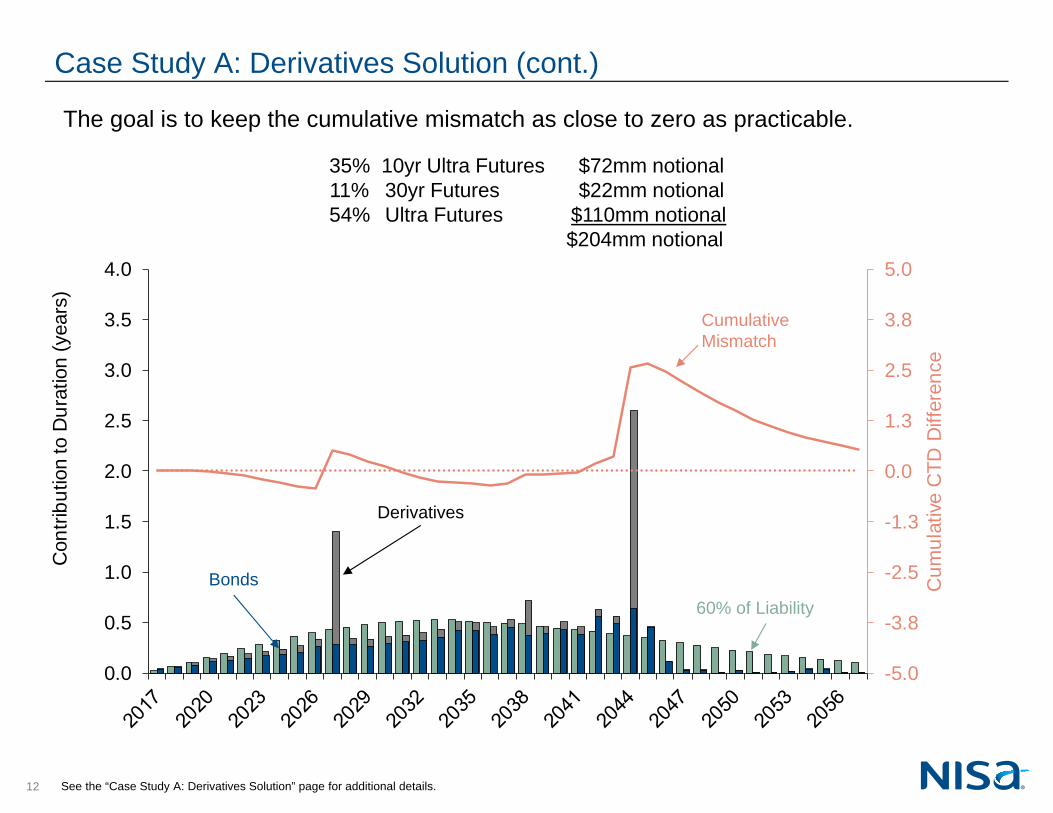
Case Study A: Derivatives Solution (cont.)
The goal is to keep the cumulative mismatch as close to zero as practicable.
60% of LiabilityBonds
CumulativeMismatch
Derivatives
See the “Case Study A: Derivatives Solution” page for additional details.
35% 10yr Ultra Futures $72mm notional11% 30yr Futures $22mm notional54% Ultra Futures $110mm notional
$204mm notional
13
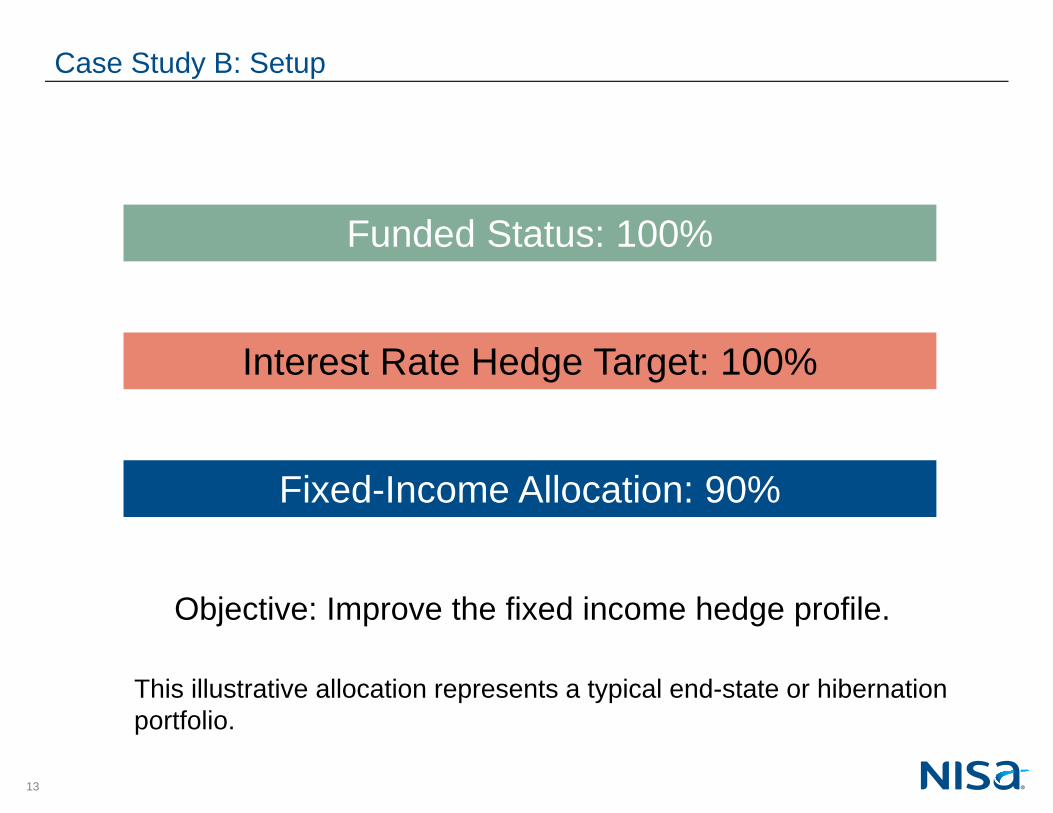
Case Study B: Setup
Funded Status: 100%
Interest Rate Hedge Target: 100%
Fixed-Income Allocation: 90%
This illustrative allocation represents a typical end-state or hibernation portfolio.
Objective: Improve the fixed income hedge profile.
14
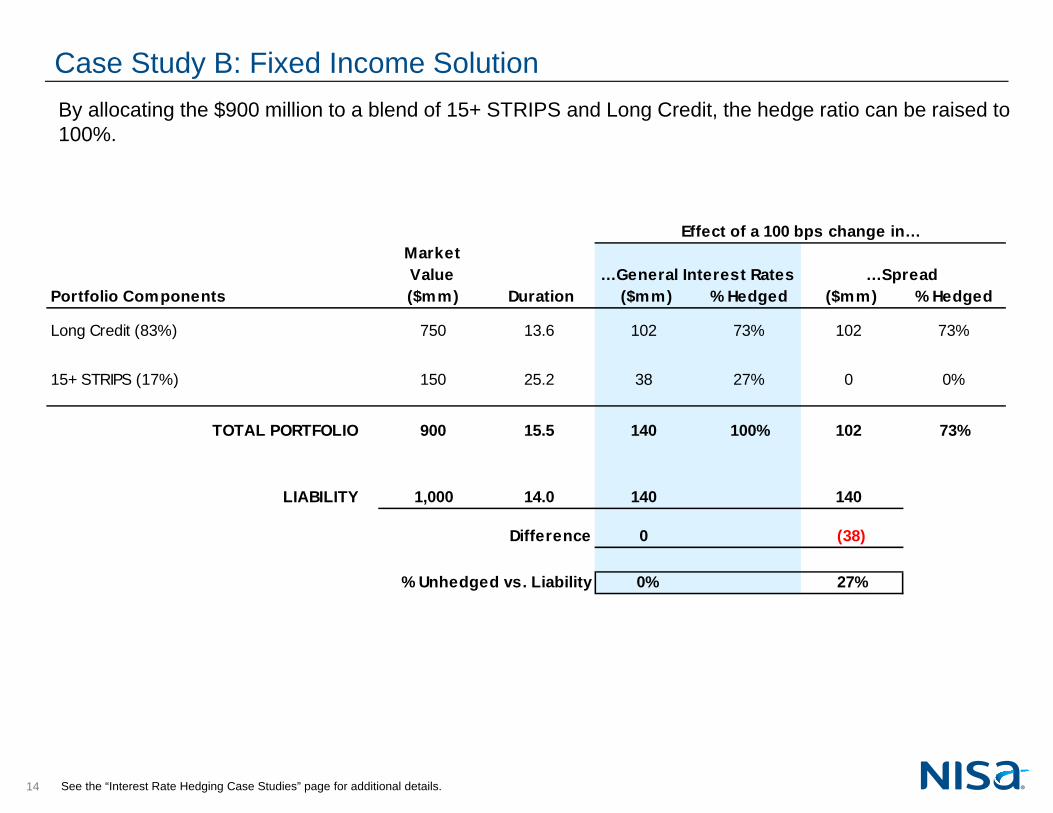
Effect of a 100 bps change in…MarketValue …General Interest Rates …Spread
Portfolio Components ($mm) Duration ($mm) % Hedged ($mm) % Hedged
Long Credit (83%) 750 13.6 102 73% 102 73%
15+ STRIPS (17%) 150 25.2 38 27% 0 0%
TOTAL PORTFOLIO 900 15.5 140 100% 102 73%
LIABILITY 1,000 14.0 140 140
Difference 0 (38)
% Unhedged vs. Liability 0% 27%
Case Study B: Fixed Income SolutionBy allocating the $900 million to a blend of 15+ STRIPS and Long Credit, the hedge ratio can be raised to 100%.
See the “Interest Rate Hedging Case Studies” page for additional details.
15
-5.0
-3.8
-2.5
-1.3
0.0
1.3
2.5
3.8
5.0
0.0
0.4
0.8
1.1
1.5
1.9
2.3
2.6
3.0
Cum
ulat
ive
CTD
Diff
eren
ce
Con
tribu
tion
to D
urat
ion
(yea
rs)
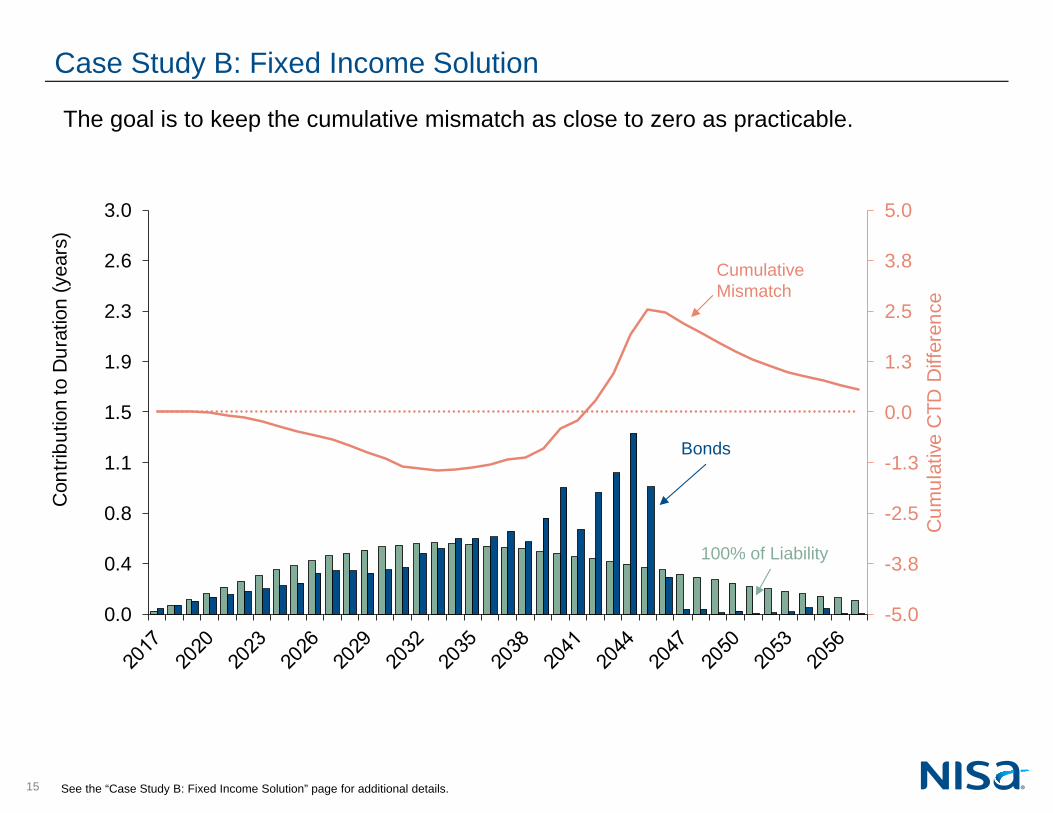
Case Study B: Fixed Income Solution
The goal is to keep the cumulative mismatch as close to zero as practicable.
100% of Liability
Bonds
CumulativeMismatch
See the “Case Study B: Fixed Income Solution” page for additional details.
16
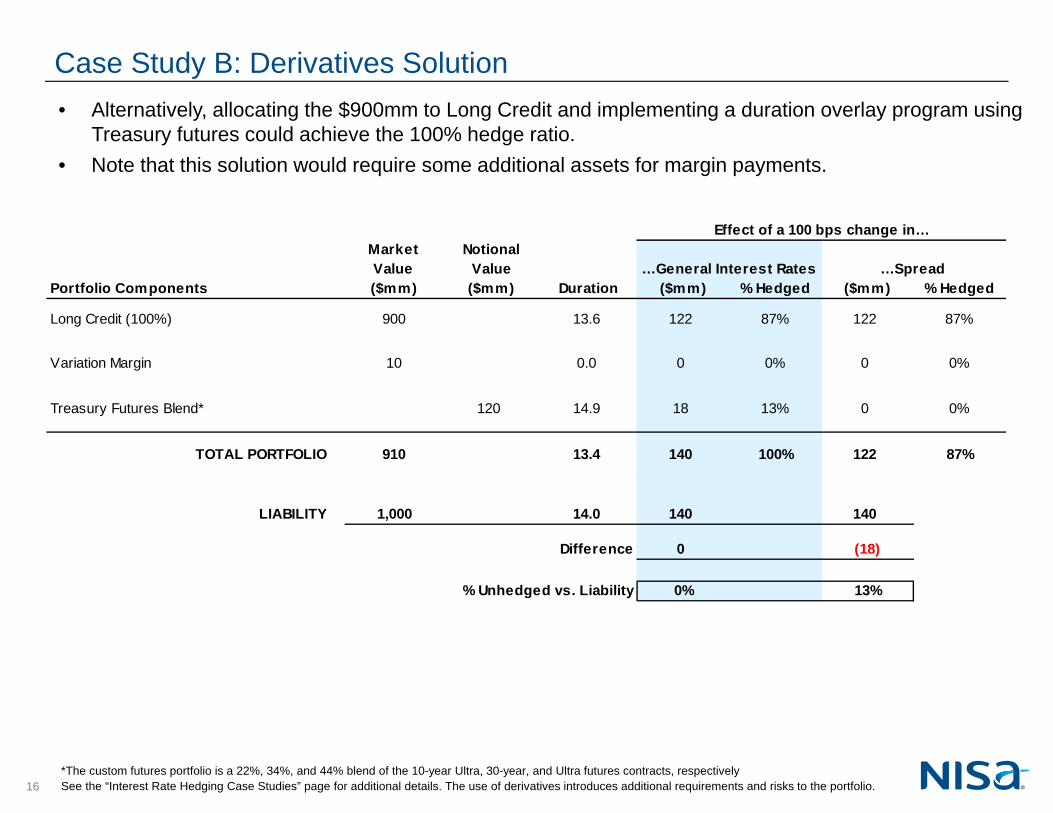
Effect of a 100 bps change in…MarketValue
NotionalValue …General Interest Rates …Spread
Portfolio Components ($mm) ($mm) Duration ($mm) % Hedged ($mm) % Hedged
Long Credit (100%) 900 13.6 122 87% 122 87%
Variation Margin 10 0.0 0 0% 0 0%
Treasury Futures Blend* 120 14.9 18 13% 0 0%
TOTAL PORTFOLIO 910 13.4 140 100% 122 87%
LIABILITY 1,000 14.0 140 140
Difference 0 (18)
% Unhedged vs. Liability 0% 13%
Case Study B: Derivatives Solution• Alternatively, allocating the $900mm to Long Credit and implementing a duration overlay program using
Treasury futures could achieve the 100% hedge ratio.• Note that this solution would require some additional assets for margin payments.
*The custom futures portfolio is a 22%, 34%, and 44% blend of the 10-year Ultra, 30-year, and Ultra futures contracts, respectively See the “Interest Rate Hedging Case Studies” page for additional details. The use of derivatives introduces additional requirements and risks to the portfolio.
17
-5.0
-3.8
-2.5
-1.3
0.0
1.3
2.5
3.8
5.0
0.0
0.4
0.8
1.1
1.5
1.9
2.3
2.6
3.0
Cum
ulat
ive
CTD
Diff
eren
ce
Con
tribu
tion
to D
urat
ion
(yea
rs)
-5.0
-3.8
-2.5
-1.3
0.0
1.3
2.5
3.8
5.0
0.0
0.4
0.8
1.1
1.5
1.9
2.3
2.6
3.0
Cum
ulat
ive
CTD
Diff
eren
ce
Con
tribu
tion
to D
urat
ion
(yea
rs)
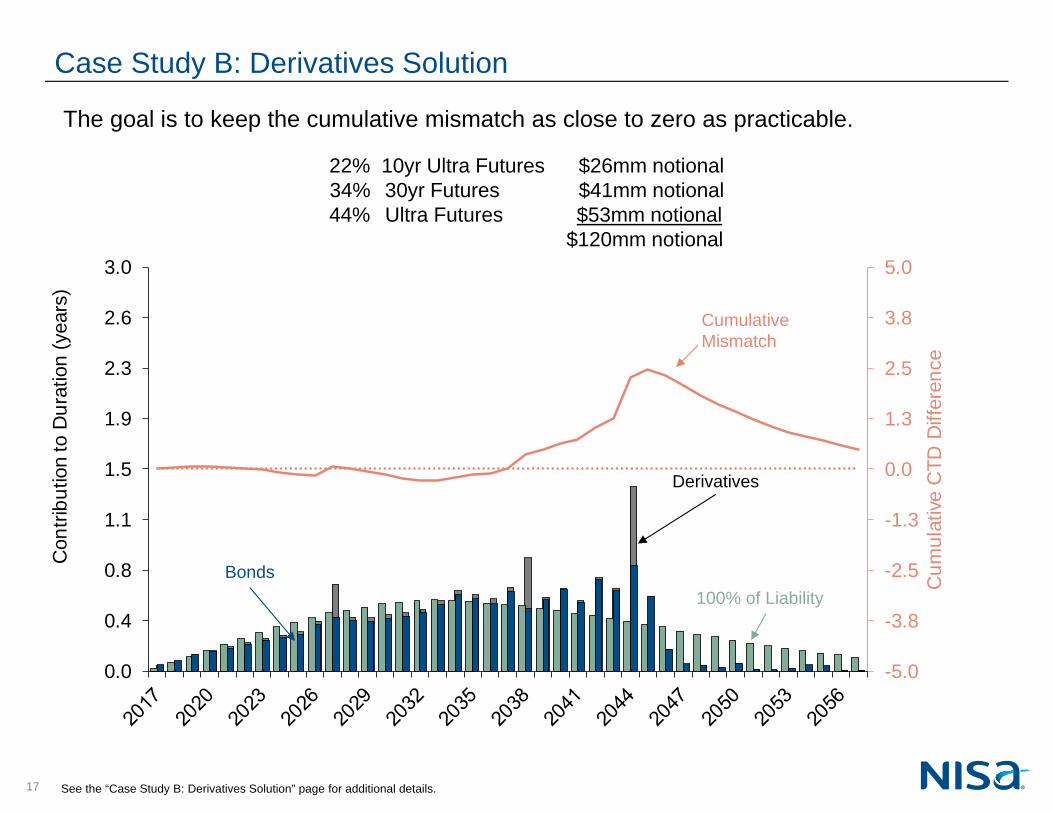
Case Study B: Derivatives Solution
The goal is to keep the cumulative mismatch as close to zero as practicable.
See the “Case Study B: Derivatives Solution” page for additional details.
100% of LiabilityBonds
CumulativeMismatch
Derivatives
22% 10yr Ultra Futures $26mm notional34% 30yr Futures $41mm notional44% Ultra Futures $53mm notional
$120mm notional
18
0%
20%
40%
60%
80%
100%
55% 60% 65% 70% 75% 80% 85% 90% 95% 100% 105% 110%
% U
nhed
ged
% Funded
0%
20%
40%
60%
80%
100%
55% 60% 65% 70% 75% 80% 85% 90% 95% 100% 105% 110%
% U
nhed
ged
% Funded
0%
20%
40%
60%
80%
100%
55% 60% 65% 70% 75% 80% 85% 90% 95% 100% 105% 110%
% U
nhed
ged
% Funded
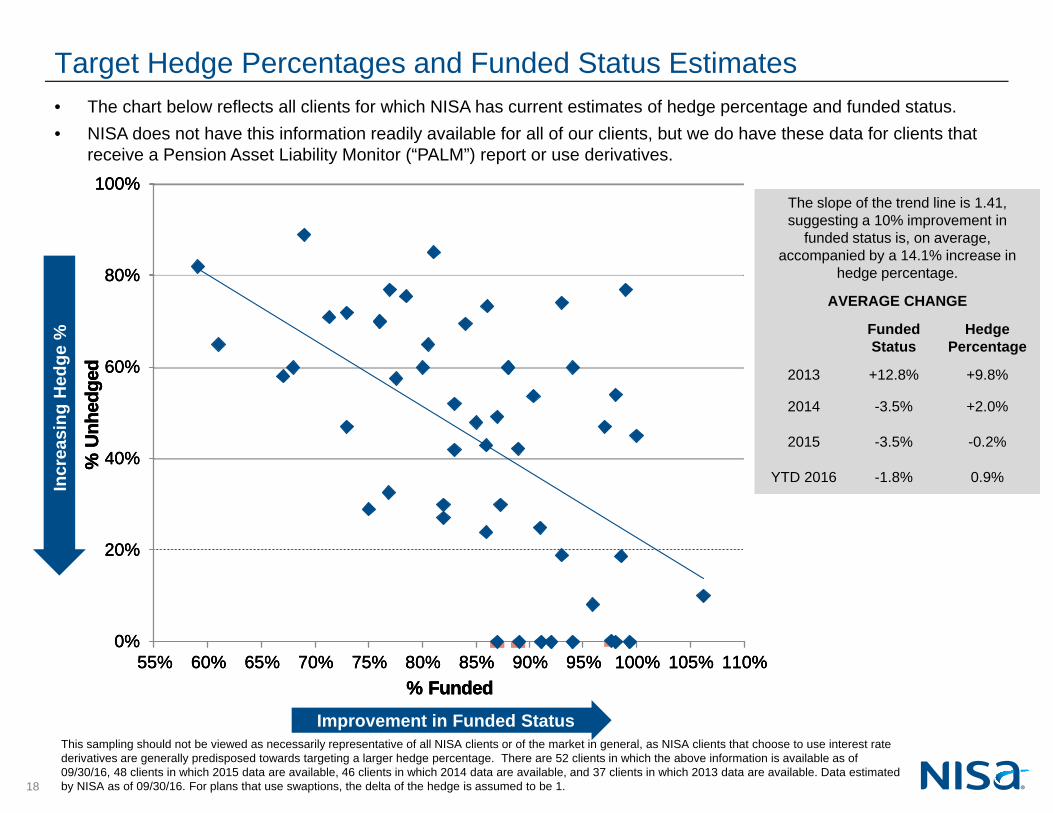
• The chart below reflects all clients for which NISA has current estimates of hedge percentage and funded status.• NISA does not have this information readily available for all of our clients, but we do have these data for clients that
receive a Pension Asset Liability Monitor (“PALM”) report or use derivatives.
Incr
easi
ng H
edge
%
Improvement in Funded Status
The slope of the trend line is 1.41, suggesting a 10% improvement in
funded status is, on average, accompanied by a 14.1% increase in
hedge percentage.
AVERAGE CHANGE
Funded Status
Hedge Percentage
2013 +12.8% +9.8%
2014 -3.5% +2.0%
2015 -3.5% -0.2%
YTD 2016 -1.8% 0.9%
Target Hedge Percentages and Funded Status Estimates
This sampling should not be viewed as necessarily representative of all NISA clients or of the market in general, as NISA clients that choose to use interest rate derivatives are generally predisposed towards targeting a larger hedge percentage. There are 52 clients in which the above information is available as of 09/30/16, 48 clients in which 2015 data are available, 46 clients in which 2014 data are available, and 37 clients in which 2013 data are available. Data estimated by NISA as of 09/30/16. For plans that use swaptions, the delta of the hedge is assumed to be 1.
19
0%
20%
40%
60%
80%
100%
55% 60% 65% 70% 75% 80% 85% 90% 95% 100% 105% 110%
% U
nhed
ged
% Funded
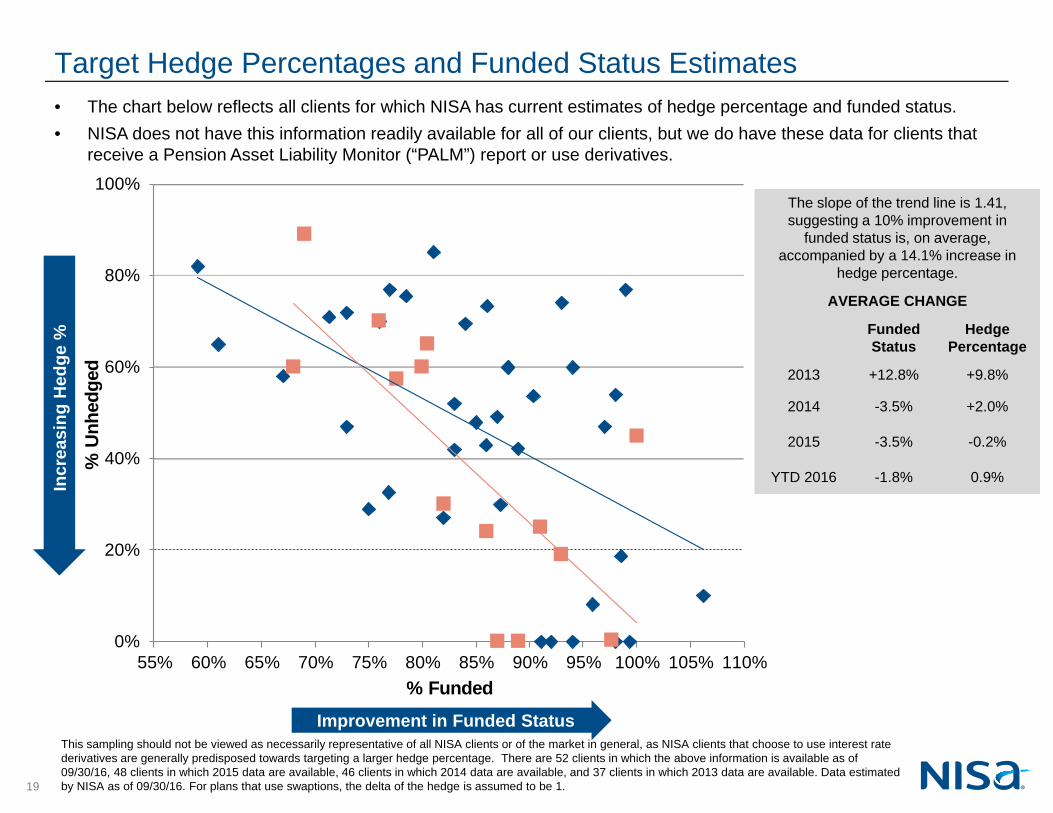
• The chart below reflects all clients for which NISA has current estimates of hedge percentage and funded status.• NISA does not have this information readily available for all of our clients, but we do have these data for clients that
receive a Pension Asset Liability Monitor (“PALM”) report or use derivatives.
Incr
easi
ng H
edge
%
Improvement in Funded Status
The slope of the trend line is 1.41, suggesting a 10% improvement in
funded status is, on average, accompanied by a 14.1% increase in
hedge percentage.
AVERAGE CHANGE
Funded Status
Hedge Percentage
2013 +12.8% +9.8%
2014 -3.5% +2.0%
2015 -3.5% -0.2%
YTD 2016 -1.8% 0.9%
Target Hedge Percentages and Funded Status Estimates
This sampling should not be viewed as necessarily representative of all NISA clients or of the market in general, as NISA clients that choose to use interest rate derivatives are generally predisposed towards targeting a larger hedge percentage. There are 52 clients in which the above information is available as of 09/30/16, 48 clients in which 2015 data are available, 46 clients in which 2014 data are available, and 37 clients in which 2013 data are available. Data estimated by NISA as of 09/30/16. For plans that use swaptions, the delta of the hedge is assumed to be 1.
20
0%
20%
40%
60%
80%
100%
55% 60% 65% 70% 75% 80% 85% 90% 95% 100% 105% 110%
% U
nhed
ged
% Funded
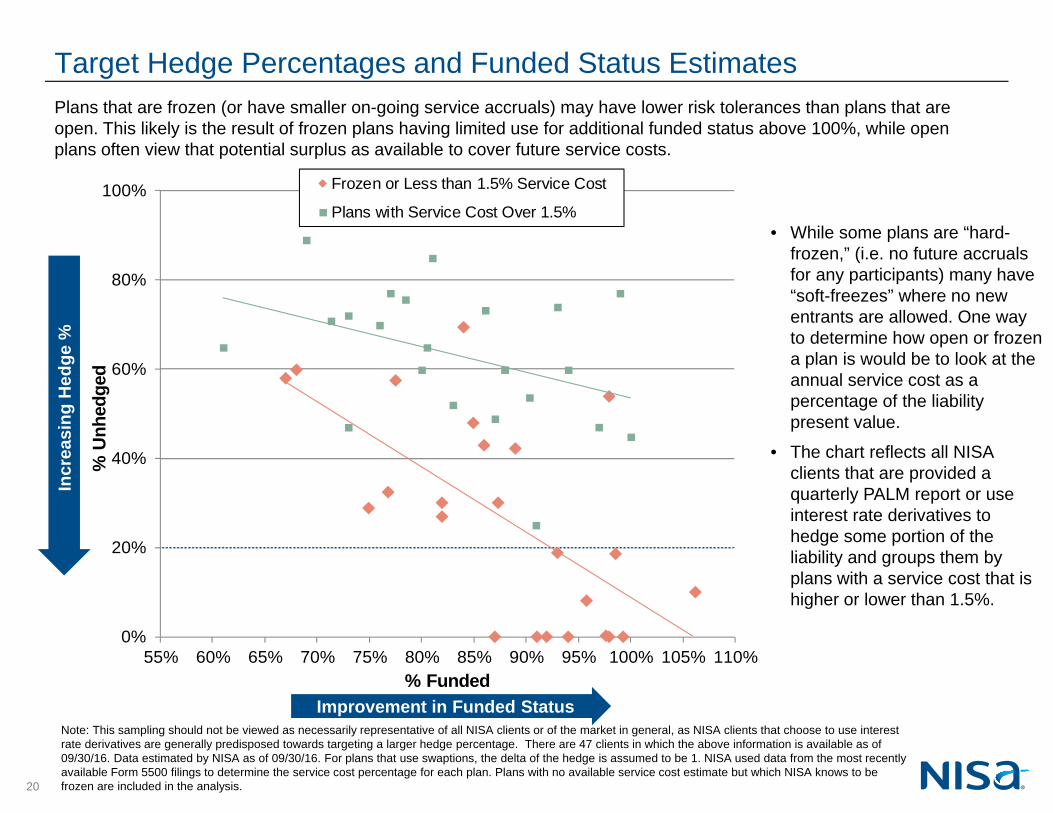
Frozen or Less than 1.5% Service Cost
Plans with Service Cost Over 1.5%
Plans that are frozen (or have smaller on-going service accruals) may have lower risk tolerances than plans that are open. This likely is the result of frozen plans having limited use for additional funded status above 100%, while open plans often view that potential surplus as available to cover future service costs.
Incr
easi
ng H
edge
%
Improvement in Funded Status
Target Hedge Percentages and Funded Status Estimates
Note: This sampling should not be viewed as necessarily representative of all NISA clients or of the market in general, as NISA clients that choose to use interest rate derivatives are generally predisposed towards targeting a larger hedge percentage. There are 47 clients in which the above information is available as of 09/30/16. Data estimated by NISA as of 09/30/16. For plans that use swaptions, the delta of the hedge is assumed to be 1. NISA used data from the most recently available Form 5500 filings to determine the service cost percentage for each plan. Plans with no available service cost estimate but which NISA knows to be frozen are included in the analysis.
• While some plans are “hard-frozen,” (i.e. no future accrualsfor any participants) many have“soft-freezes” where no newentrants are allowed. One wayto determine how open or frozena plan is would be to look at theannual service cost as apercentage of the liabilitypresent value.
• The chart reflects all NISAclients that are provided aquarterly PALM report or useinterest rate derivatives tohedge some portion of theliability and groups them byplans with a service cost that ishigher or lower than 1.5%.
21
This material has been prepared at your request by NISA Investment Advisors, LLC. This material is subject to changewithout notice. This document is for information and illustrative purposes only. It is not, and should not be regarded asinvestment advice or as a recommendation regarding a course of action. This information is provided with theunderstanding that with respect to the material provided herein, NISA Investment Advisors, LLC is not acting in a fiduciaryor advisory capacity, that you will make your own independent decision with respect to any course of action in connectionherewith, as to whether such course of action is appropriate or proper based on your own judgment and your specificcircumstances and objectives, and that you are capable of understanding and assessing the merits of a course of action.NISA Investment Advisors, LLC does not purport to and does not, in any fashion, provide tax, accounting, actuarial,recordkeeping, legal, broker/dealer or any related services. You should consult your advisors with respect to these areasand the material presented herein. You may not rely on the material contained herein. NISA Investment Advisors, LLCshall not have any liability for any damages of any kind whatsoever relating to this material. No part of this document maybe reproduced in any manner, in whole or in part, without the written permission of NISA Investment Advisors, LLC exceptfor your internal use. By accepting this material, you acknowledge, understand and accept the foregoing.
Disclaimers

1
Rene MartelUsing Derivatives in Pension Investment StrategiesMarch 9, 2017
2017 SOAInvestment Symposium
2
Agenda
1. The forgotten derivative in LDI space
2. Streamlining glide path implementationwith derivatives
3
The forgotten derivative in LDI space1.
4
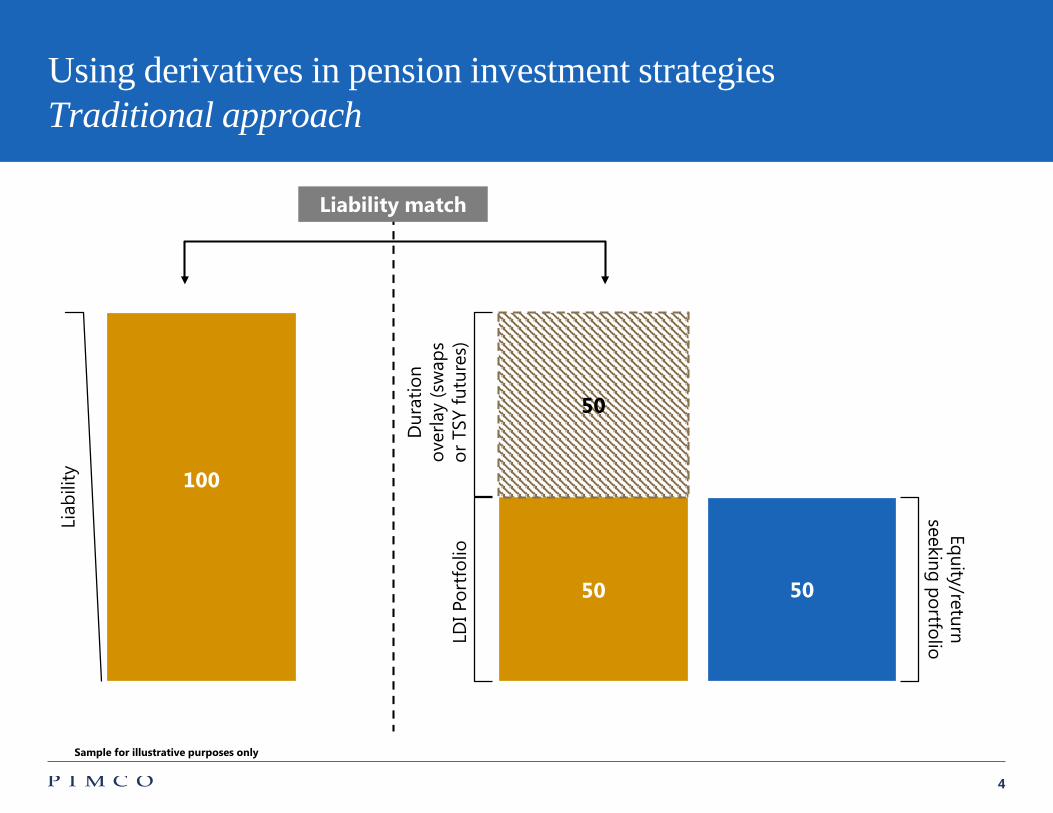
Using derivatives in pension investment strategiesTraditional approach
100
Liab
ility
Equity/return seeking portfolio
5050
LDI P
ortf
olio
50D
urat
ion
over
lay
(sw
aps
or T
SY fu
ture
s)
Liability match
Sample for illustrative purposes only
5
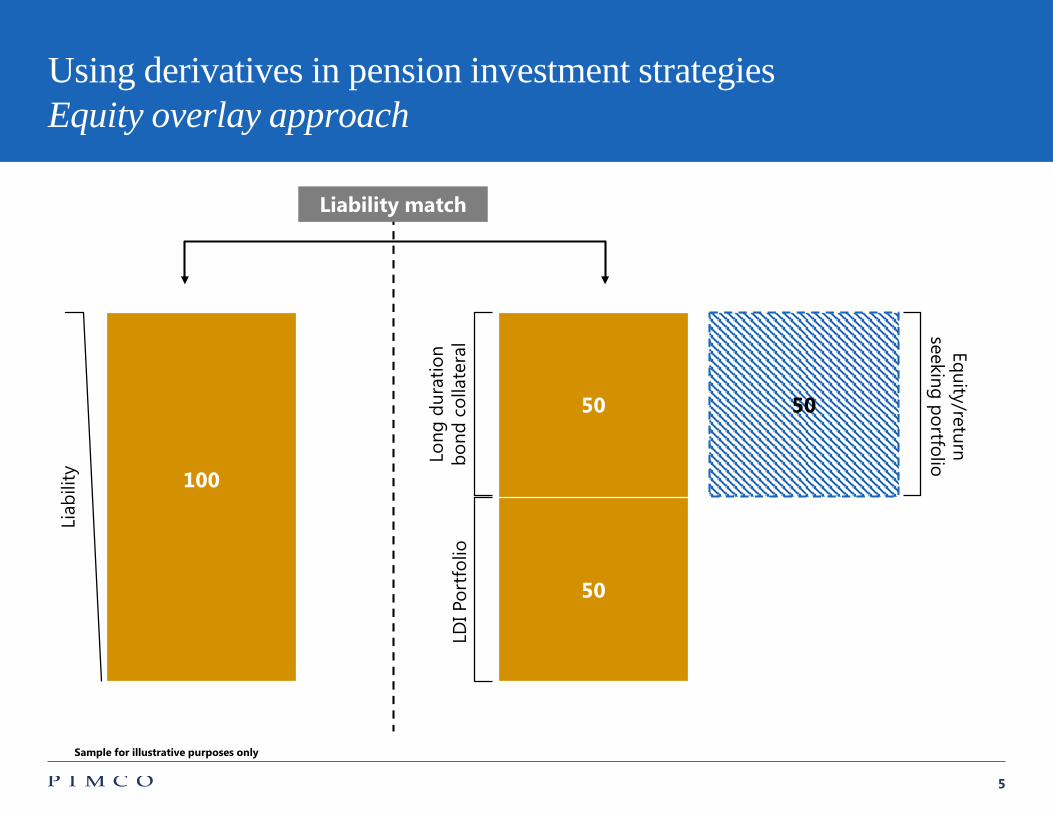
Using derivatives in pension investment strategiesEquity overlay approach
100
Liab
ility
50
LDI P
ortf
olio
50Lo
ng d
urat
ion
bond
col
late
ral
50
Equity/return seeking portfolio
Liability match
Sample for illustrative purposes only
6
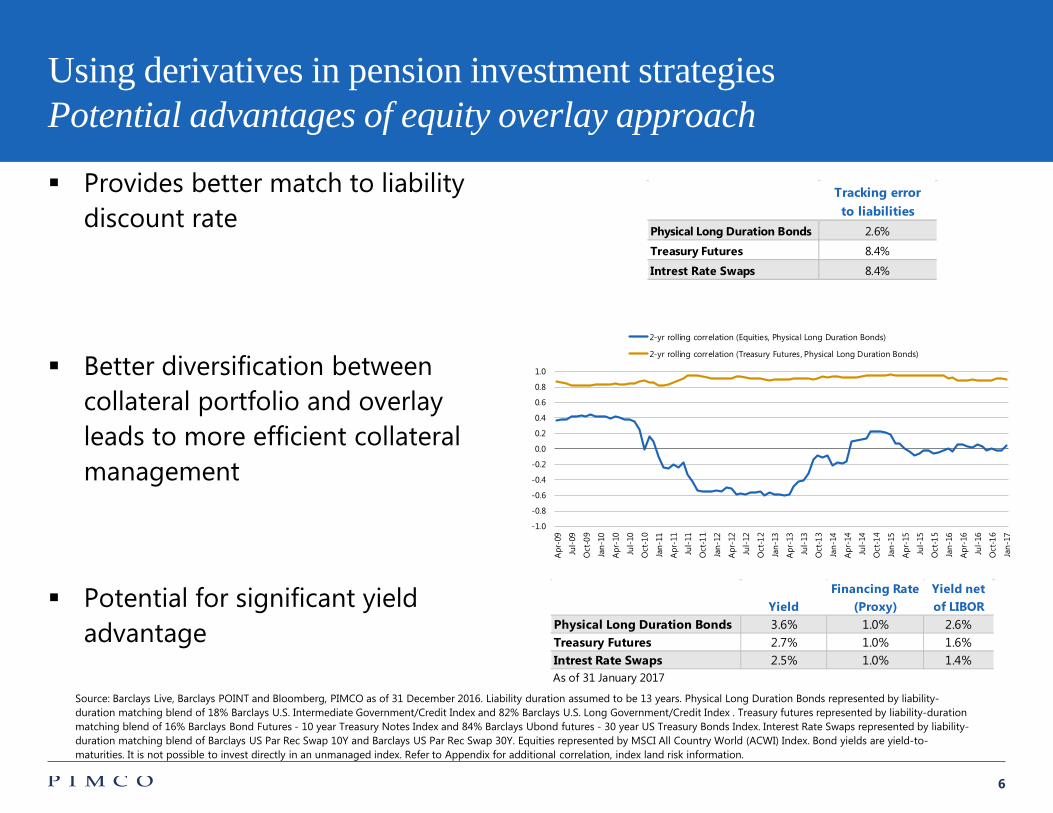
Physical Long Duration Bonds 2.6%
Treasury Futures 8.4%
Intrest Rate Swaps 8.4%
Tracking error to liabilities
YieldFinancing Rate
(Proxy)Yield net of LIBOR
Physical Long Duration Bonds 3.6% 1.0% 2.6%Treasury Futures 2.7% 1.0% 1.6%Intrest Rate Swaps 2.5% 1.0% 1.4%As of 31 January 2017
Using derivatives in pension investment strategiesPotential advantages of equity overlay approach
Provides better match to liability discount rate
Better diversification between collateral portfolio and overlay leads to more efficient collateral management
Potential for significant yield advantage
-1.0
-0.8
-0.6
-0.4
-0.2
0.0
0.2
0.4
0.6
0.8
1.0
Apr
-09
Jul-
09
Oct
-09
Jan-
10
Apr
-10
Jul-
10
Oct
-10
Jan-
11
Apr
-11
Jul-
11
Oct
-11
Jan-
12
Apr
-12
Jul-
12
Oct
-12
Jan-
13
Apr
-13
Jul-
13
Oct
-13
Jan-
14
Apr
-14
Jul-
14
Oct
-14
Jan-
15
Apr
-15
Jul-
15
Oct
-15
Jan-
16
Apr
-16
Jul-
16
Oct
-16
Jan-
17
2-yr rolling correlation (Equities, Physical Long Duration Bonds)
2-yr rolling correlation (Treasury Futures, Physical Long Duration Bonds)
Source: Barclays Live, Barclays POINT and Bloomberg, PIMCO as of 31 December 2016. Liability duration assumed to be 13 years. Physical Long Duration Bonds represented by liability-duration matching blend of 18% Barclays U.S. Intermediate Government/Credit Index and 82% Barclays U.S. Long Government/Credit Index . Treasury futures represented by liability-duration matching blend of 16% Barclays Bond Futures - 10 year Treasury Notes Index and 84% Barclays Ubond futures - 30 year US Treasury Bonds Index. Interest Rate Swaps represented by liability-duration matching blend of Barclays US Par Rec Swap 10Y and Barclays US Par Rec Swap 30Y. Equities represented by MSCI All Country World (ACWI) Index. Bond yields are yield-to-maturities. It is not possible to invest directly in an unmanaged index. Refer to Appendix for additional correlation, index land risk information.
7
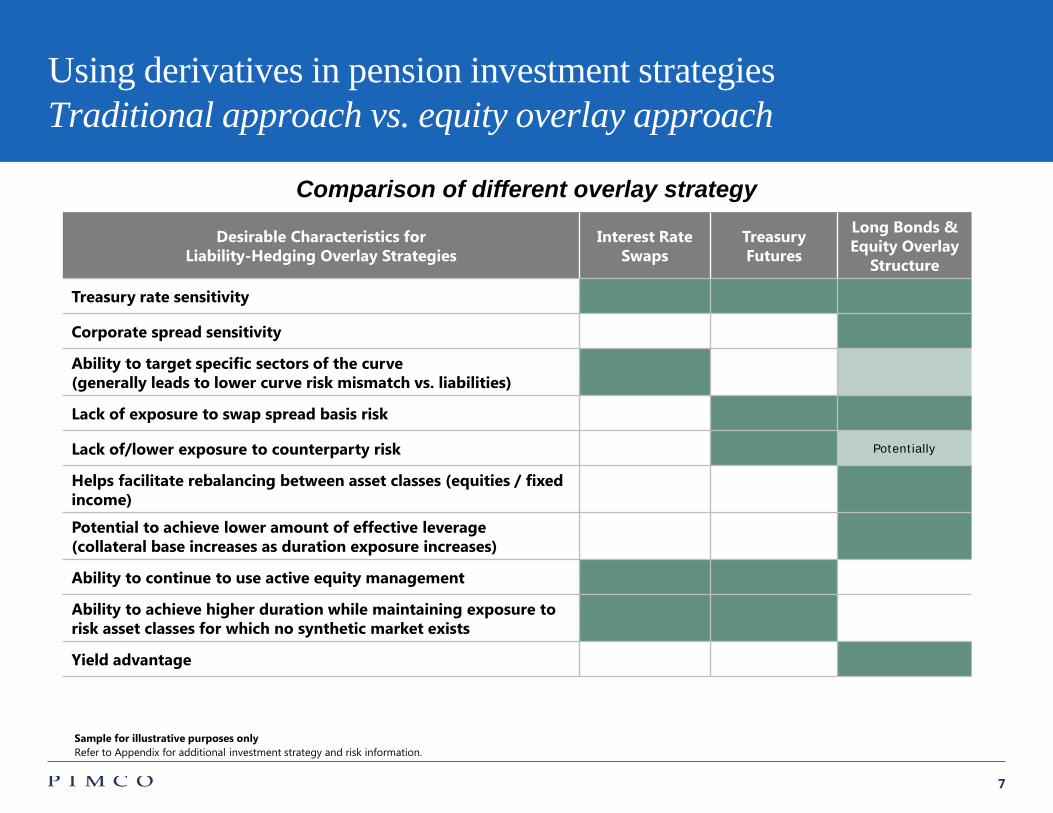
Using derivatives in pension investment strategiesTraditional approach vs. equity overlay approach
Desirable Characteristics forLiability-Hedging Overlay Strategies
Interest Rate Swaps
Treasury Futures
Long Bonds & Equity Overlay
Structure
Treasury rate sensitivity
Corporate spread sensitivity
Ability to target specific sectors of the curve (generally leads to lower curve risk mismatch vs. liabilities)
Lack of exposure to swap spread basis risk
Lack of/lower exposure to counterparty risk Potentially
Helps facilitate rebalancing between asset classes (equities / fixed income)
Potential to achieve lower amount of effective leverage (collateral base increases as duration exposure increases)
Ability to continue to use active equity management
Ability to achieve higher duration while maintaining exposure to risk asset classes for which no synthetic market exists
Yield advantage
Comparison of different overlay strategy
Sample for illustrative purposes onlyRefer to Appendix for additional investment strategy and risk information.
8
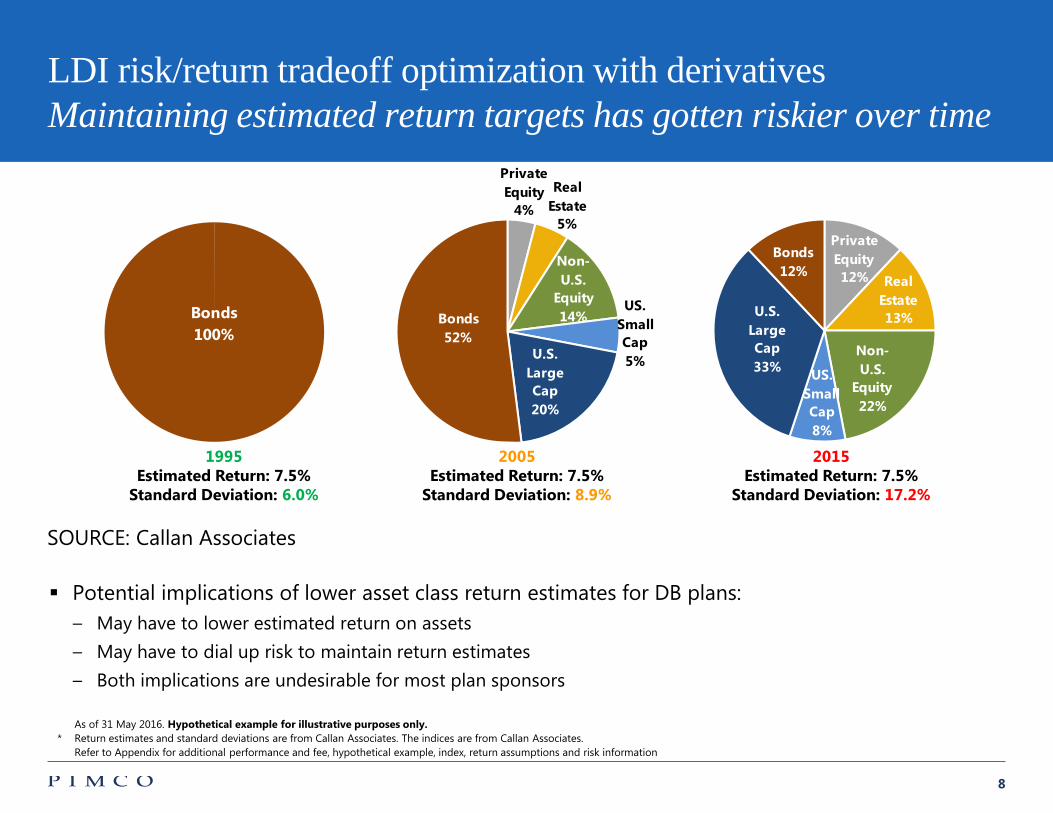
Private Equity12% Real
Estate 13%
Non-U.S.
Equity22%
US. Small Cap8%
U.S. Large Cap33%
Bonds12%
Private Equity
4%
Real Estate
5%
Non-U.S.
Equity14%
US. Small Cap5%U.S.
Large Cap20%
Bonds52%
Bonds100%
LDI risk/return tradeoff optimization with derivativesMaintaining estimated return targets has gotten riskier over time
Potential implications of lower asset class return estimates for DB plans:– May have to lower estimated return on assets– May have to dial up risk to maintain return estimates– Both implications are undesirable for most plan sponsors
1995Estimated Return: 7.5%
Standard Deviation: 6.0%
2005Estimated Return: 7.5%
Standard Deviation: 8.9%
2015Estimated Return: 7.5%
Standard Deviation: 17.2%
As of 31 May 2016. Hypothetical example for illustrative purposes only.* Return estimates and standard deviations are from Callan Associates. The indices are from Callan Associates.
Refer to Appendix for additional performance and fee, hypothetical example, index, return assumptions and risk information
Long_duration_review_66
SOURCE: Callan Associates
9
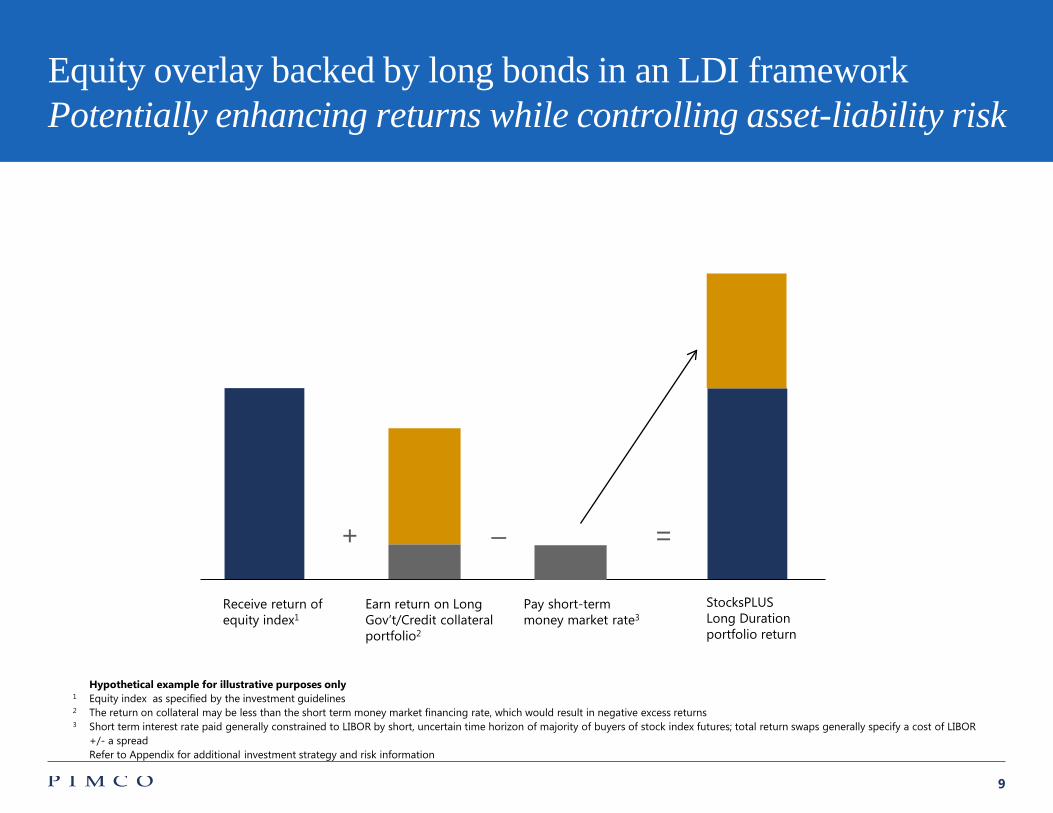
Equity overlay backed by long bonds in an LDI frameworkPotentially enhancing returns while controlling asset-liability risk
Hypothetical example for illustrative purposes only 1 Equity index as specified by the investment guidelines2 The return on collateral may be less than the short term money market financing rate, which would result in negative excess returns3 Short term interest rate paid generally constrained to LIBOR by short, uncertain time horizon of majority of buyers of stock index futures; total return swaps generally specify a cost of LIBOR
+/- a spreadRefer to Appendix for additional investment strategy and risk information
LDI_review_119
Receive return of equity index1
Pay short-term money market rate3
Earn return on Long Gov’t/Credit collateral portfolio2
StocksPLUS Long Duration portfolio return
– =+
10
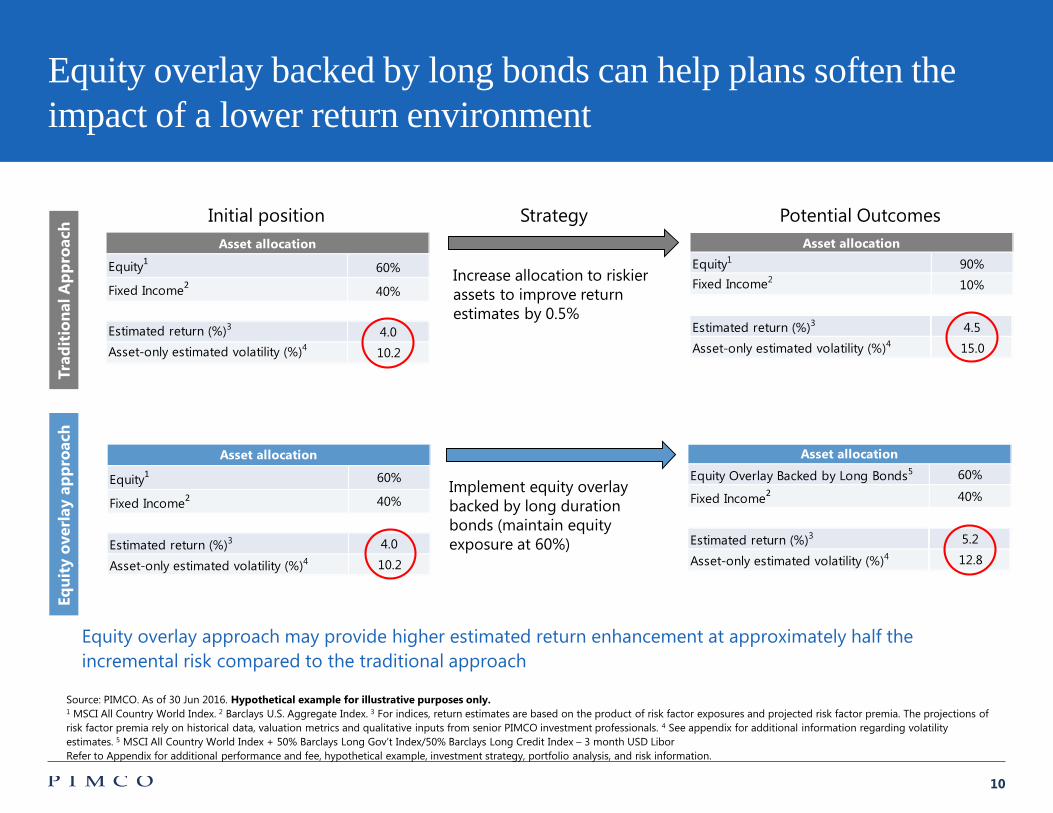
Equity overlay approach may provide higher estimated return enhancement at approximately half the incremental risk compared to the traditional approach
Equity Overlay Backed by Long Bonds5 60%
Fixed Income2 40%
Estimated return (%)3 5.2
Asset-only estimated volatility (%)4 12.8
Asset allocation
Equity1 90%Fixed Income2 10%
Estimated return (%)3 4.5Asset-only estimated volatility (%)4 15.0
Asset allocation
Equity1 60%
Fixed Income2 40%
Estimated return (%)3 4.0
Asset-only estimated volatility (%)4 10.2
Asset allocation
Equity1 60%
Fixed Income2 40%
Estimated return (%)3 4.0Asset-only estimated volatility (%)4 10.2
Asset allocation
Equity overlay backed by long bonds can help plans soften the impact of a lower return environment
Long_duration_review_69
Increase allocation to riskier assets to improve return estimates by 0.5%
Implement equity overlay backed by long duration bonds (maintain equity exposure at 60%)
Trad
itio
nal A
ppro
ach
Equi
ty o
verl
ay a
ppro
ach
Initial position Strategy Potential Outcomes
Source: PIMCO. As of 30 Jun 2016. Hypothetical example for illustrative purposes only.1 MSCI All Country World Index. 2 Barclays U.S. Aggregate Index. 3 For indices, return estimates are based on the product of risk factor exposures and projected risk factor premia. The projections ofrisk factor premia rely on historical data, valuation metrics and qualitative inputs from senior PIMCO investment professionals. 4 See appendix for additional information regarding volatility estimates. 5 MSCI All Country World Index + 50% Barclays Long Gov’t Index/50% Barclays Long Credit Index – 3 month USD LiborRefer to Appendix for additional performance and fee, hypothetical example, investment strategy, portfolio analysis, and risk information.
11
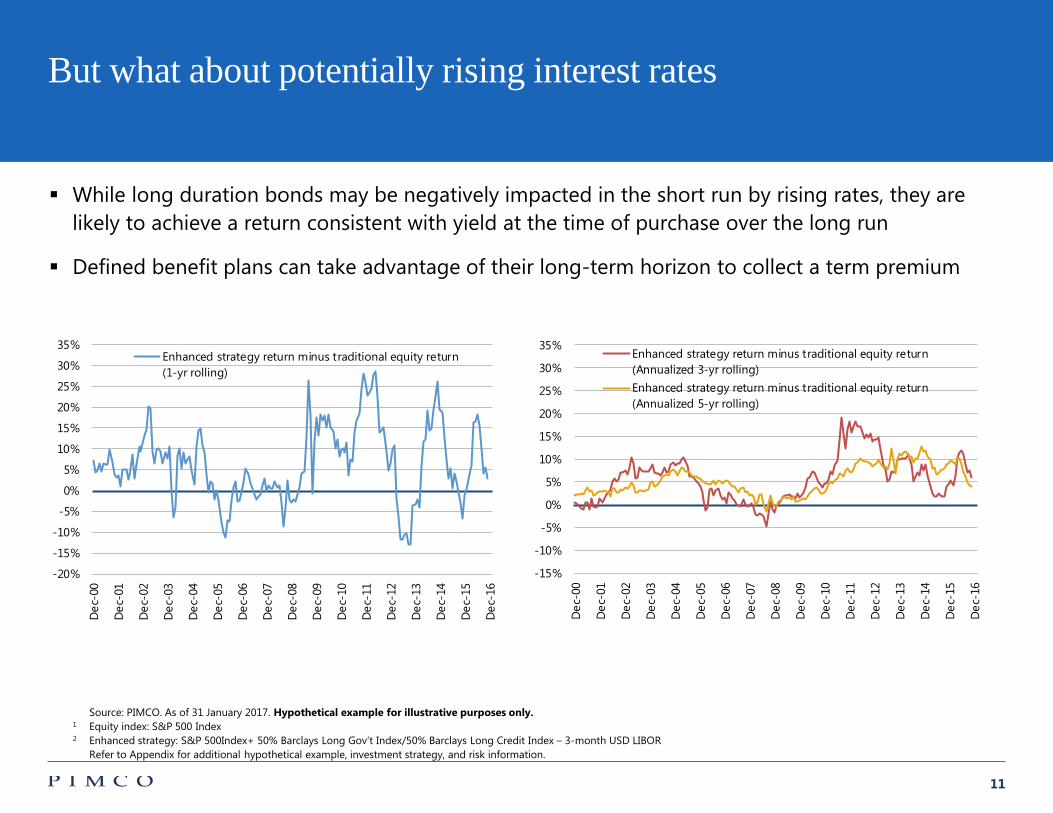
While long duration bonds may be negatively impacted in the short run by rising rates, they are likely to achieve a return consistent with yield at the time of purchase over the long run
Defined benefit plans can take advantage of their long-term horizon to collect a term premium
-15%
-10%
-5%
0%
5%
10%
15%
20%
25%
30%
35%
Dec
-00
Dec
-01
Dec
-02
Dec
-03
Dec
-04
Dec
-05
Dec
-06
Dec
-07
Dec
-08
Dec
-09
Dec
-10
Dec
-11
Dec
-12
Dec
-13
Dec
-14
Dec
-15
Dec
-16
Enhanced strategy return minus traditional equity return(Annualized 3-yr rolling)Enhanced strategy return minus traditional equity return(Annualized 5-yr rolling)
-20%
-15%
-10%
-5%
0%
5%
10%
15%
20%
25%
30%
35%
Dec
-00
Dec
-01
Dec
-02
Dec
-03
Dec
-04
Dec
-05
Dec
-06
Dec
-07
Dec
-08
Dec
-09
Dec
-10
Dec
-11
Dec
-12
Dec
-13
Dec
-14
Dec
-15
Dec
-16
Enhanced strategy return minus traditional equity return(1-yr rolling)
But what about potentially rising interest rates
LDI_review_53
Source: PIMCO. As of 31 January 2017. Hypothetical example for illustrative purposes only.1 Equity index: S&P 500 Index2 Enhanced strategy: S&P 500Index+ 50% Barclays Long Gov’t Index/50% Barclays Long Credit Index – 3-month USD LIBOR
Refer to Appendix for additional hypothetical example, investment strategy, and risk information.
12
-1.5
-1.0
-0.5
0.0
0.5
1.0
1.5
Equity Long Bond Short-termfinancing rate
Liabilities(equivalent tolong bonds)
-1.5
-1.0
-0.5
0.0
0.5
1.0
1.5
Equity Liabilities (equivalent tolong bonds)
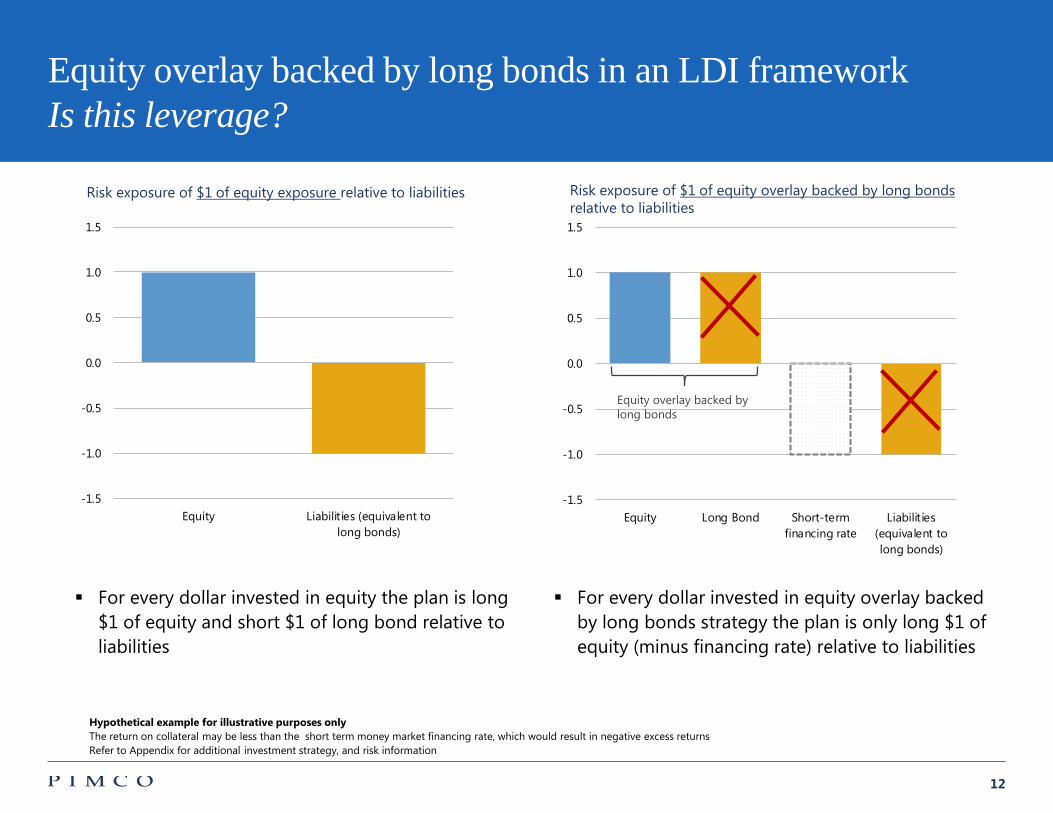
Equity overlay backed by long bonds in an LDI framework Is this leverage?
Hypothetical example for illustrative purposes only The return on collateral may be less than the short term money market financing rate, which would result in negative excess returnsRefer to Appendix for additional investment strategy, and risk information
LDI_review_120
For every dollar invested in equity the plan is long $1 of equity and short $1 of long bond relative to liabilities
For every dollar invested in equity overlay backed by long bonds strategy the plan is only long $1 of equity (minus financing rate) relative to liabilities
Risk exposure of $1 of equity exposure relative to liabilities Risk exposure of $1 of equity overlay backed by long bonds relative to liabilities
Equity overlay backed by long bonds
13
Use of derivatives to streamline and optimize glide path implementation
2.
14
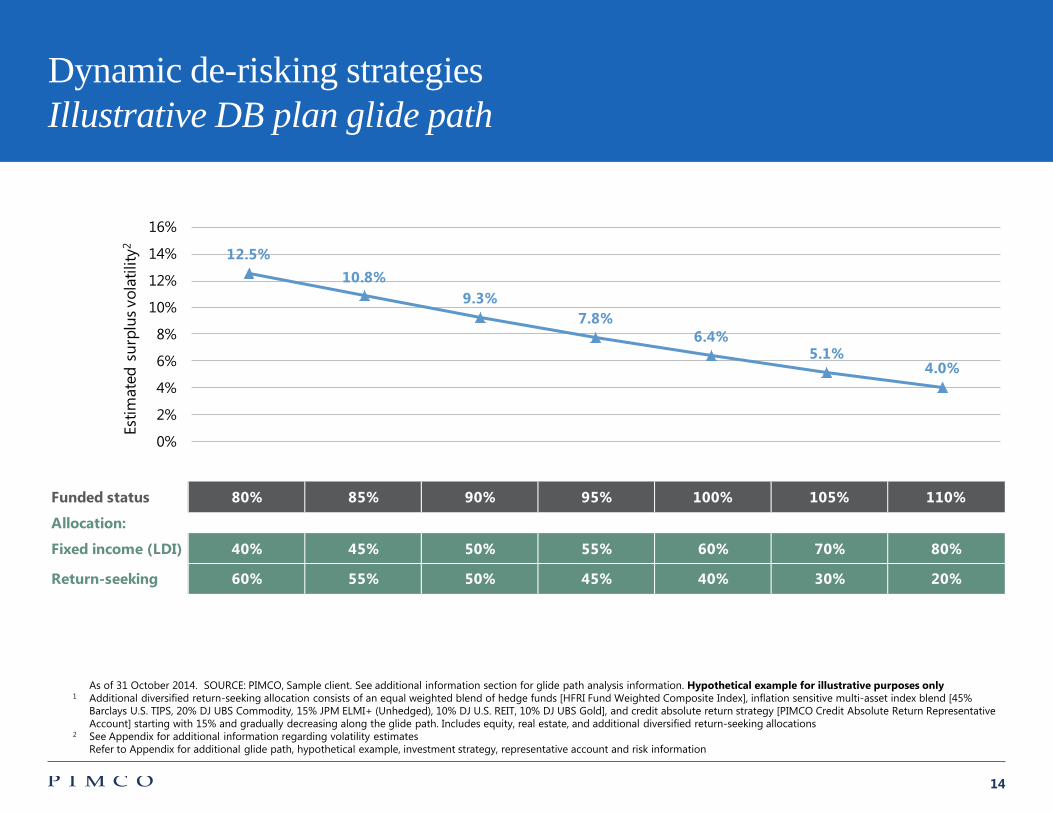
Funded status 80% 85% 90% 95% 100% 105% 110%
Allocation:
Fixed income (LDI) 40% 45% 50% 55% 60% 70% 80%
Return-seeking 60% 55% 50% 45% 40% 30% 20%
12.5%10.8%
9.3%7.8%
6.4%5.1%
4.0%
0%
2%
4%
6%
8%
10%
12%
14%
16%
Estim
ated
sur
plus
vol
atili
ty2
Dynamic de-risking strategiesIllustrative DB plan glide path
As of 31 October 2014. SOURCE: PIMCO, Sample client. See additional information section for glide path analysis information. Hypothetical example for illustrative purposes only1 Additional diversified return-seeking allocation consists of an equal weighted blend of hedge funds [HFRI Fund Weighted Composite Index], inflation sensitive multi-asset index blend [45%
Barclays U.S. TIPS, 20% DJ UBS Commodity, 15% JPM ELMI+ (Unhedged), 10% DJ U.S. REIT, 10% DJ UBS Gold], and credit absolute return strategy [PIMCO Credit Absolute Return Representative Account] starting with 15% and gradually decreasing along the glide path. Includes equity, real estate, and additional diversified return-seeking allocations
2 See Appendix for additional information regarding volatility estimatesRefer to Appendix for additional glide path, hypothetical example, investment strategy, representative account and risk information
LDI_Glidepath_review_21a
15
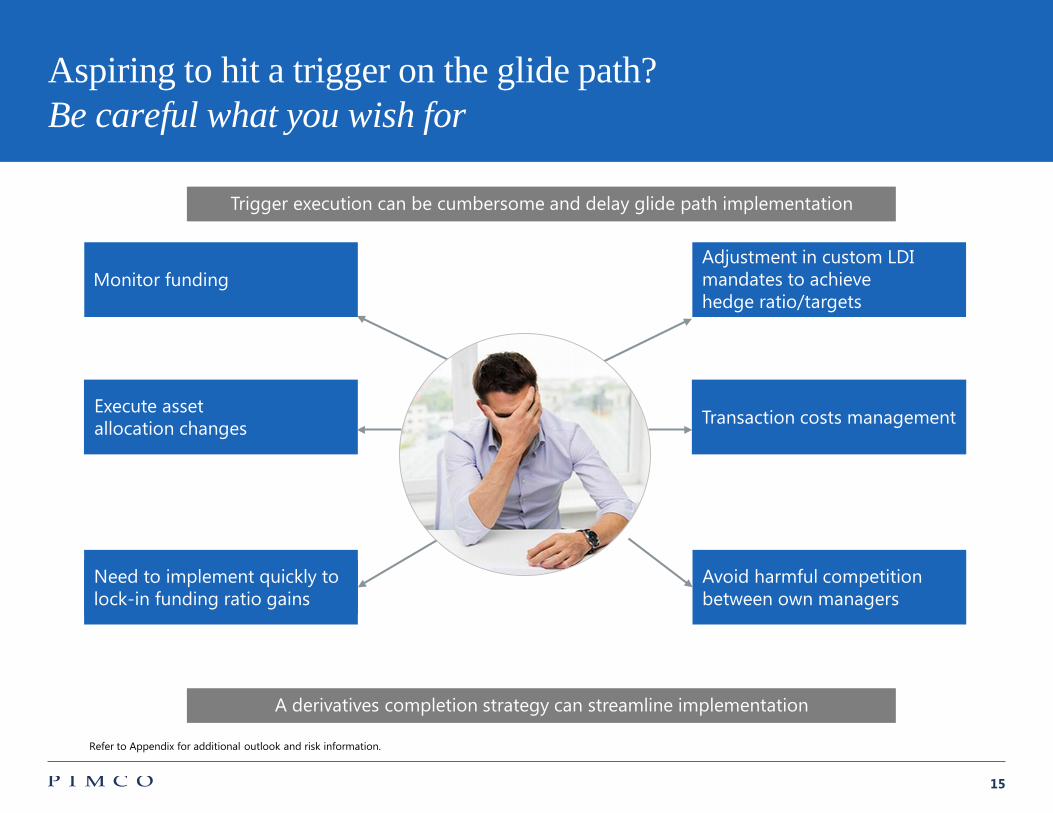
Adjustment in custom LDI mandates to achieve hedge ratio/targets
Aspiring to hit a trigger on the glide path? Be careful what you wish for
A derivatives completion strategy can streamline implementation
Execute asset allocation changes
Need to implement quickly to lock-in funding ratio gains
Transaction costs management
Avoid harmful competition between own managers
Monitor funding
Trigger execution can be cumbersome and delay glide path implementation
Refer to Appendix for additional outlook and risk information.
16
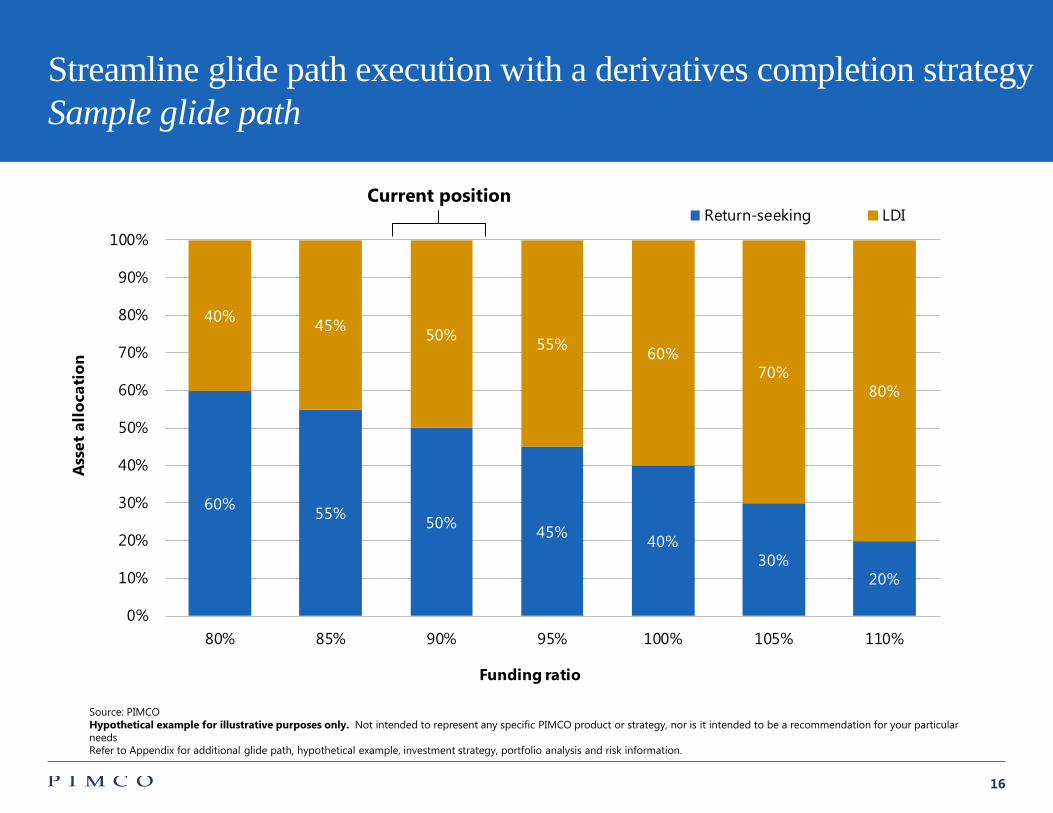
60% 55% 50% 45% 40%30%
20%
40% 45% 50% 55% 60%70%
80%
0%
10%
20%
30%
40%
50%
60%
70%
80%
90%
100%
80% 85% 90% 95% 100% 105% 110%
Ass
et a
lloca
tion
Funding ratio
Return-seeking LDICurrent position
Streamline glide path execution with a derivatives completion strategySample glide path
Source: PIMCOHypothetical example for illustrative purposes only. Not intended to represent any specific PIMCO product or strategy, nor is it intended to be a recommendation for your particular needsRefer to Appendix for additional glide path, hypothetical example, investment strategy, portfolio analysis and risk information.
LDI_CompMgmt_review_10
17
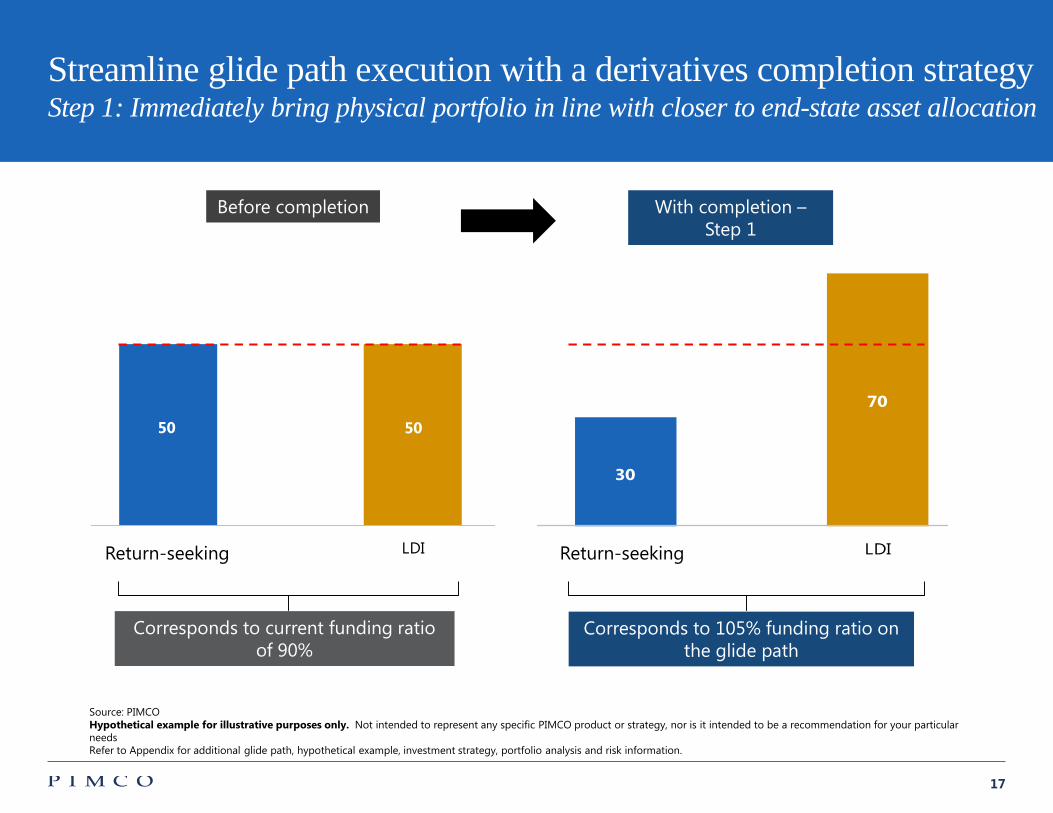
50 50
Return-seeking LDI
Before completion
Return-seeking
Corresponds to current funding ratio of 90%
Corresponds to 105% funding ratio on the glide path
Source: PIMCOHypothetical example for illustrative purposes only. Not intended to represent any specific PIMCO product or strategy, nor is it intended to be a recommendation for your particular needsRefer to Appendix for additional glide path, hypothetical example, investment strategy, portfolio analysis and risk information.
Streamline glide path execution with a derivatives completion strategyStep 1: Immediately bring physical portfolio in line with closer to end-state asset allocation
LDI_CompMgmt_review_11
30
70
Return-seeking LDI
With completion –Step 1
Return-seeking
18
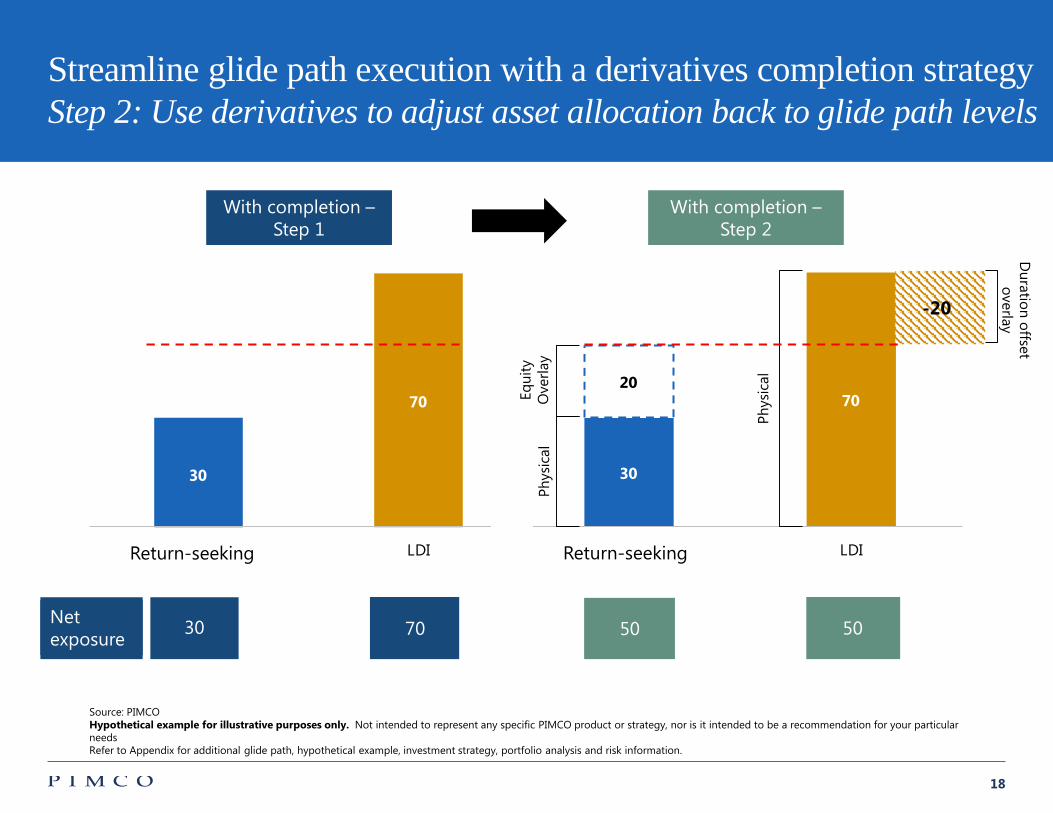
30
70
Return-seeking LDI
Net exposure
With completion –Step 1
7030
Return-seeking
30
7020
Return-seeking LDI
Phys
ical
Phys
ical
Duration offset
overlay
-20
Equi
ty
Ove
rlay
With completion –Step 2
Return-seeking
50 50
Streamline glide path execution with a derivatives completion strategyStep 2: Use derivatives to adjust asset allocation back to glide path levels
Source: PIMCOHypothetical example for illustrative purposes only. Not intended to represent any specific PIMCO product or strategy, nor is it intended to be a recommendation for your particular needsRefer to Appendix for additional glide path, hypothetical example, investment strategy, portfolio analysis and risk information.
LDI_CompMgmt_review_12
19
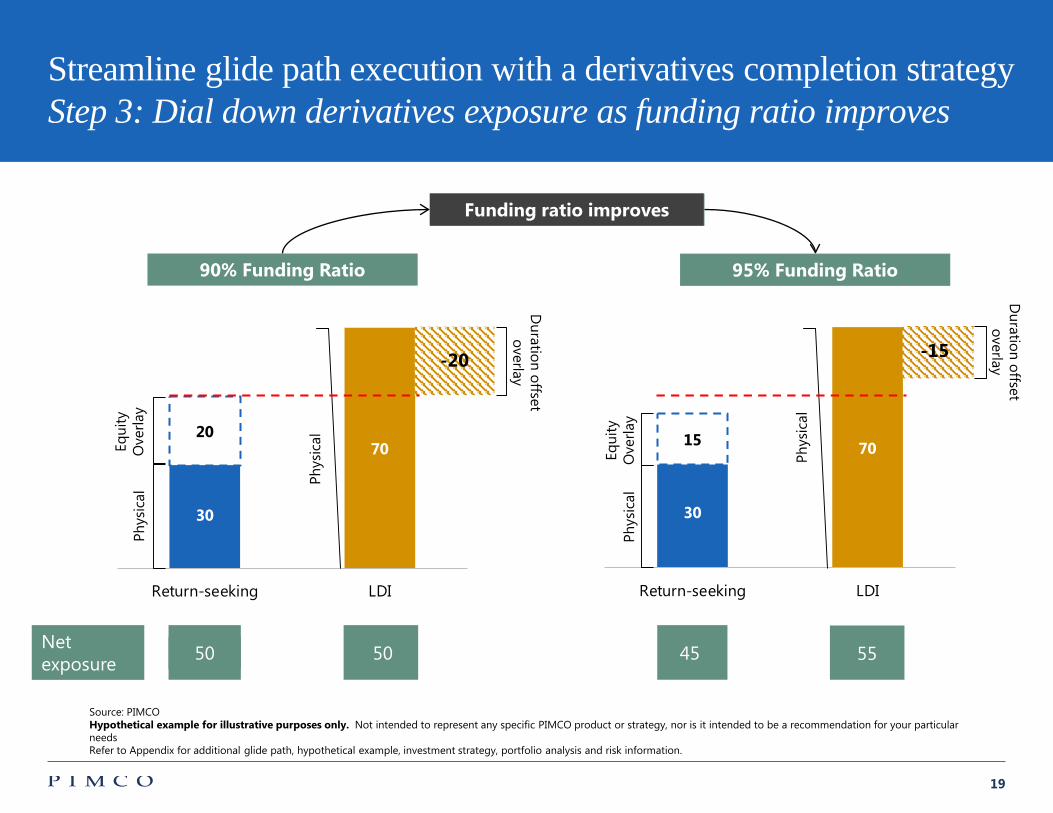
45 55
Funding ratio improves
Streamline glide path execution with a derivatives completion strategyStep 3: Dial down derivatives exposure as funding ratio improves
Source: PIMCOHypothetical example for illustrative purposes only. Not intended to represent any specific PIMCO product or strategy, nor is it intended to be a recommendation for your particular needsRefer to Appendix for additional glide path, hypothetical example, investment strategy, portfolio analysis and risk information.
30
7020
Return-seeking LDI
Duration offset
overlay
Net exposure 50 50
Phys
ical
Equi
ty
Ove
rlay
Phys
ical
-20
90% Funding Ratio
Duration offset
overlay
30
7015
Return-seeking LDI
Phys
ical
Equi
ty
Ove
rlay
Phys
ical
-15
95% Funding Ratio
LDI_CompMgmt_review_13
20
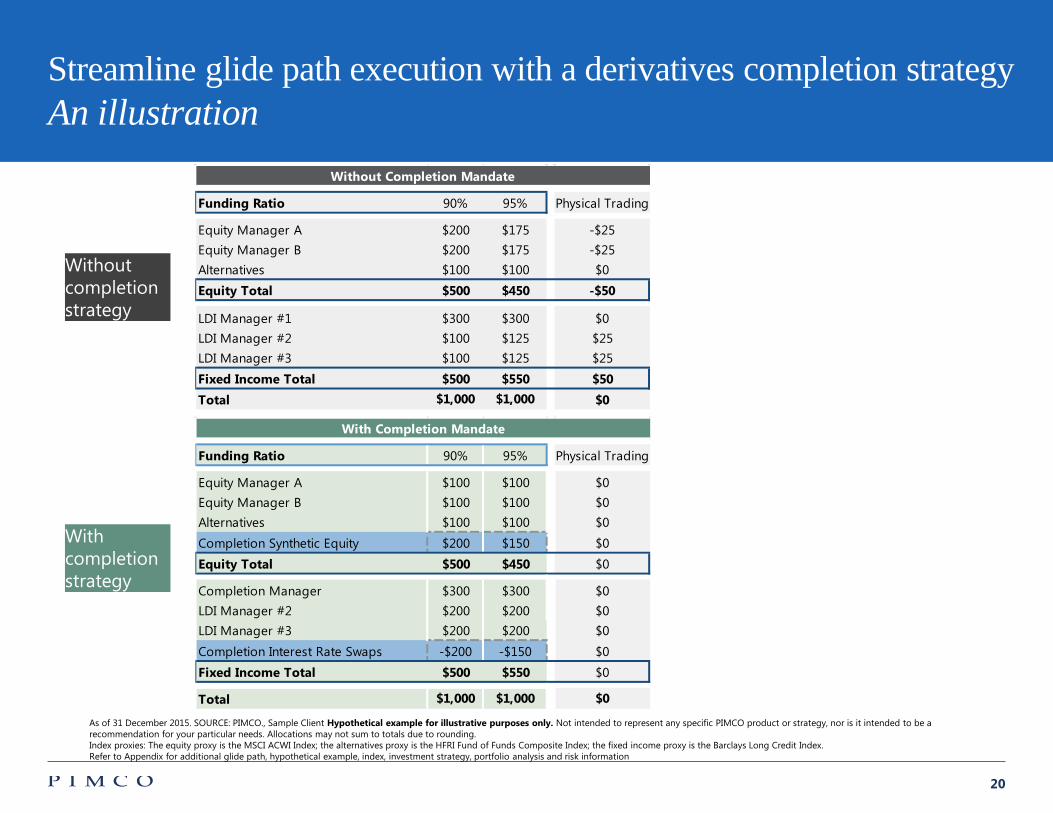
Funding Ratio 90% 95% Physical Trading
Equity Manager A $100 $100 $0Equity Manager B $100 $100 $0Alternatives $100 $100 $0Completion Synthetic Equity $200 $150 $0Equity Total $500 $450 $0
Completion Manager $300 $300 $0LDI Manager #2 $200 $200 $0LDI Manager #3 $200 $200 $0Completion Interest Rate Swaps -$200 -$150 $0Fixed Income Total $500 $550 $0
Total $1,000 $1,000 $0
With Completion Mandate
Funding Ratio 90% 95% Physical Trading
Equity Manager A $200 $175 -$25Equity Manager B $200 $175 -$25Alternatives $100 $100 $0Equity Total $500 $450 -$50
LDI Manager #1 $300 $300 $0LDI Manager #2 $100 $125 $25LDI Manager #3 $100 $125 $25Fixed Income Total $500 $550 $50Total $1,000 $1,000 $0
Without Completion Mandate
Streamline glide path execution with a derivatives completion strategyAn illustration
Long_duration_review_65
Without completion strategy
With completion strategy
As of 31 December 2015. SOURCE: PIMCO., Sample Client Hypothetical example for illustrative purposes only. Not intended to represent any specific PIMCO product or strategy, nor is it intended to be a recommendation for your particular needs. Allocations may not sum to totals due to rounding. Index proxies: The equity proxy is the MSCI ACWI Index; the alternatives proxy is the HFRI Fund of Funds Composite Index; the fixed income proxy is the Barclays Long Credit Index.Refer to Appendix for additional glide path, hypothetical example, index, investment strategy, portfolio analysis and risk information
21
Streamline glide path execution with a derivatives completion strategyPotential benefits
Enables plan sponsors to quickly lock-in funding ratio gains
Avoids competition with several other investors to buy long bonds in times of high demand
Significantly reduces operational complexity and risk of glide path implementation
Helps manage transaction costs
Streamlines hedge ratio adjustment
LDI_CompMgmt_review_18
22
Appendix
!mk_LDI_Trends_Appendix
Past performance is not a guarantee or a reliable indicator of future results.
CHARTPerformance results for certain charts and graphs may be limited by date ranges specified on those charts and graphs; different time periods may produce different results.
CORRELATIONThe correlation of various indexes or securities against one another or against inflation is based upon data over a certain time period. These correlations may vary substantially in the future or over different time periods that can result in greater volatility.
CREDIT QUALITYThe credit quality of a particular security or group of securities does not ensure the stability or safety of an overall portfolio. The quality ratings of individual issues/issuers are provided to indicate the credit worthiness of such issues/issuer and generally range from AAA, Aaa, or AAA (highest) to D, C, or D (lowest) for S&P, Moody’s, and Fitch respectively.
DEFINED BENEFIT GLIDE PATHDe-risking strategy based on a function of plan funded status. As plan funded status improves, clients may be interested in reducing their plan funded status volatility by shifting out of risk assets and into liability hedging fixed income.
GLIDE PATHGlide Path is the asset allocation within a Target Date Strategy (also known as a Lifecycle or Target Maturity strategy) that adjusts over time as the participant’s age increases and their time horizon to retirement shortens. The basis of the Glide Path is to reduce the portfolio risk as the participant’s time horizon decreases. Typically, younger participants with a longer time horizon to retirement have sufficient time to recover from market losses, their investment risk level is higher, and they are able to make larger contributions (depending on various factors such as salary, savings, account balance, etc.). Generally, older participants and eligible retirees have shorter time horizons to retirement and their investment risk level declines as preserving income wealth becomes more important.
HEDGE RATIODuration Hedge Ratio = asset duration exposure / liability duration exposure. Credit Spread Duration Hedge Ratio (Beta-Adjusted) = asset duration exposure / credit spread duration exposure.
HYPOTHETICAL EXAMPLENo representation is being made that any account, product, or strategy will or is likely to achieve profits, losses, or results similar to those shown. Hypothetical or simulated performance results have several inherent limitations. Unlike an actual performance record, simulated results do not represent actual performance and are generally prepared with the benefit of hinds ight. There are frequently sharp differences between simulated performance results and the actual results subsequently achieved by any particular account, product, or strategy. In addition, since trades have not actually been executed, simulated results cannot account for the impact of certain market risks such as lack of liquidity. There are numerous other factors related to the markets in general or the implementation of any specific investment strategy, which cannot be fully accounted for in the preparation of simulated results and all of which can adversely affect actual results.
INVESTMENT STRATEGYThere is no guarantee that these investment strategies will work under all market conditions or are suitable for all investors and each investor should evaluate their ability to invest long-term, especially during periods of downturn in the market. No representation is being made that any account, product, or strategy will or is likely to achieve profits, losses, or results similar to those shown.
ISSUERReferences to specific securities and their issuers are not intended and should not be interpreted as recommendations to purchase, sell or hold such securities. PIMCO products and strategies may or may not include the securities referenced and, if such securities are included, no representation is being made that such securities will continue to be included.
OASThe Option Adjusted Spread (OAS) measures the spread over a variety of possible interest rate paths. A security's OAS is the average return an investor will earn over Treasury returns, taking all possible future interest rate scenarios into account.

23
Appendix
PIMCO OPTIMIZERThis material contains hypothetical results based on a proprietary tool, PIMCO OPTIMIZER. PIMCO OPTIMIZER enables PIMCO to: (1) analyze client liability streams; (2) construct a customized benchmark to help meet the client’s liability streams; (3) calculate tracking error; (4) graphically display the differences between the client’s liability stream and PIMCO OPTIMIZER customized benchmark. Like any model, PIMCO OPTIMIZER may be useful to help identify portfolio strategies, but it does not represent a prediction of actual portfolio results. The results may vary with each use and over time.
PORTFOLIO ANALYSISThe portfolio analysis is based on several sample client portfolios. No representation is being made that the structure of the average portfolio or any account will remain the same or that similar returns will be achieved. Results shown may not be attained and should not be construed as the only possibilities that exist. Different weightings in the asset allocation illustration will produce different results. Actual results will vary and are subject to change with market conditions. There is no guarantee that results will be achieved. No fees or expenses were included in the estimated results and distribution. The scenarios assume a set of assumptions that may, individually or collectively, not develop over time. The analysis reflected in this information is based upon data at time of analysis. Forecasts, estimates, and certain information contained herein are based upon proprietary research and should not be considered as investment advice or a recommendation of any particular security, strategy or investment product.
PIMCO routinely reviews, modifies, and adds risk factors to its proprietary models. Due to the dynamic nature of factors affecting markets, there is no guarantee that simulations will capture all relevant risk factors or that the implementation of any resulting solutions will protect against loss. All investments contain risk and may lose value. Simulated risk analysis contains inherent limitations and is generally prepared with the benefit of hindsight. Realized losses may be larger than predicted by a given model due to additional factors that cannot be accurately forecasted or incorporated into a model based on historical or assumed data.
RISKInvesting in the bond market is subject to risks, including market, interest rate, issuer, credit, inflation risk, and liquidity risk. The value of most bonds and bond strategies are impacted by changes in interest rates. Bonds and bond strategies with longer durations tend to be more sensitive and volatile than those with shorter durations; bond prices generally fall as interest rates rise, and the current low interest rate environment increases this risk. Current reductions in bond counterparty capacity may contribute to decreased market liquidity and increased price volatility. Bond investments may be worth more or less than the original cost when redeemed. Absolute return portfolios may not fully participate in strong positive market rallies. Investing in foreign denominated and/or domiciled securities may involve heightened risk due to currency fluctuations, and economic and political risks, which may be enhanced in emerging markets. Sovereign securities are generally backed by the issuing government, obligations of U.S. Government agencies and authorities are supported by varying degrees but are generally not backed by the full faith of the U.S. Government; portfolios that invest in such securities are not guaranteed and will fluctuate in value. Inflation-linked bonds (ILBs) issued by a government are fixed-income securities whose principal value is periodically adjusted according to the rate of inflation; ILBs decline in value when real interest rates rise. Municipals may realize gains may be subject to state and local taxes and may at times be subject to the alternative minimum tax. High-yield, lower-rated, securities involve greater risk than higher-rated securities; portfolios that invest in them may be subject to greater levels of credit and liquidity risk than portfolios that do not. Mortgage and asset-backed securities may be sensitive to changes in interest rates, subject to early repayment risk, and while generally backed by a government, government-agency or private guarantor there is no assurance that the guarantor will meet its obligations. Derivatives and commodity-linked derivatives may involve certain costs and risks such as liquidity, interest rate, market, credit, management and the risk that a position could not be closed when most advantageous. Commodity-linked derivative instruments may involve additional costs and risks such as changes in commodity index volatility or factors affecting a particular industry or commodity, such as drought, floods, weather, livestock disease, embargoes, tariffs and international economic, political and regulatory developments. Investing in derivatives could lose more than the amount invested. Swaps are a type of privately negotiated derivative; there is no central exchange or market for swap transactions and therefore they are less liquid than exchange-traded instruments. Investors should consult their investment professional prior to making an investment decision.
STRATEGY AVAILABILITYStrategy availability may be limited to certain investment vehicles; not all investment vehicles may be available to all investors. Please contact your PIMCO representative for more information.
VOLATILITY (ESTIMATED)We employed a block bootstrap methodology to calculate volatilities. We start by computing historical factor returns that underlie each asset class proxy from January 1997 through the present date. We then draw a set of 12 monthly returns within the dataset to come up with an annual return number. This process is repeated 25,000 times to have a return series with 25,000 annualized returns. The standard deviation of these annual returns is used to model the volatility for each factor. We then use the same return series for each factor to compute covariance between factors. Finally, volatility of each asset class proxy is calculated as the sum of variances and covariance of factors that underlie that particular proxy. For each asset class, index, or strategy proxy, we will look at either a point in time estimate or historical average of factor exposures in order to determine the total volatility. Please contact your PIMCO representative for more details on how specific proxy factor exposures are estimated.
!mk_LDI_Trends_Appendix

24
Appendix
This material contains the current opinions of the manager and such opinions are subject to change without notice. Information contained herein has been obtained from sources believed to be reliable, but not guaranteed. This material has been distributed for informational purposes only and should not be considered as investment advice or a recommendation of any particular security, strategy, or investment product. No part of this material may be reproduced in any form, or referred to in any other publication, without express written permission. PIMCO is a trademark of Allianz Asset Management of America L.P. in the United States and throughout the world. Pacific Investment Management Company LLC, 650 Newport Center Drive, Newport Beach, CA 92660. 800.387.4626. ©2017, PIMCO.
INDEX DESCRIPTIONSThe Barclays Intermediate Government/Corporate Index is an unmanaged market index comprised of a blend of intermediate government and the investment grade corporate fixed income universe.
The Barclays Intermediate Investment Grade Corporate Index is an unmanaged index of publicly issued U.S. corporate and specified foreign debentures and secured notes that meet the specified maturity, liquidity, and quality requirements.
Barclays Long-Term Treasury consists of U.S. Treasury issues with maturities of 10 or more years.
Barclays Long Term Government/Credit Index is an unmanaged index of U.S. Government or Investment Grade Credit Securities having a maturity of 10 years or more.
The Barclays Long Corporate Index is a component of the Barclays U.S. Long Credit index. Barclays U.S. Long Credit Index is the credit component of the Barclays U.S. Government/Credit Index, a widely recognized index that features a blend of U.S. Treasury, government-sponsored (U.S. Agency and supranational), and corporate securities limited to a maturity of more than ten years.
Barclays U.S. Aggregate Index represents securities that are SEC-registered, taxable, and dollar denominated. The index covers the U.S. investment grade fixed rate bond market, with index components for government and corporate securities, mortgage pass-through securities, and asset-backed securities. These major sectors are subdivided into more specific indices that are calculated and reported on a regular basis.
Barclays U.S. Long Credit Index is the credit component of the Barclays U.S. Government/Credit Index, a widely recognized index that features a blend of U.S. Treasury, government-sponsored (U.S. Agency and supranational), and corporate securities limited to a maturity of more than ten years.
Citigroup STRIPS Index, 20+ Year Sub-Index represents a composition of outstanding Treasury Bonds and Notes with a maturity of at least twenty years. The index is rebalanced each month in accordance with underlying Treasury figures and profiles provided as of the previous month-end. The included STRIPS are derived only from bonds in the Citigroup U.S. Treasury Bond Index, which include coupon strips with less than one year remaining to maturity. The index does not reflect deductions for fees, expenses or taxes.
LIBOR (London Interbank Offered Rate) is the rate banks charge each other for short-term Eurodollar loans.
The MSCI EAFE (Morgan Stanley Capital International Europe, Australasia, Far East Index) is an unmanaged index of over 900 companies, and is a generally accepted benchmark for major overseas markets. Index weightings represent the relative capitalizations of the major overseas markets included in the index on a U.S. dollar adjusted basis.
The NCREIF (National Council of Real Estate Investment Fiduciaries) Property Index is a quarterly time series composite total rate of return measure of performance of a very large pool of individual commercial real estate properties acquired in the private market for investment purposes only.
The S&P 500 Index is an unmanaged market index generally considered representative of the stock market as a whole. The index focuses on the Large-Cap segment of the U.S. equities market.
It is not possible to invest directly in an unmanaged index.
CMR2017-0202-247029
!mk_LDI_Trends_Appendix