Harley -Davidson, Inc. - marketscreener.com fileHarley -Davidson, Inc. - marketscreener.com

2017 Interim Results
August 2017
2
Cautionary Statements Regarding Forward-Looking Statement
To the extent any statements made in this presentation containing information that is not historical are essentially
forward-looking. These forward-looking statements include but are not limited to projections, targets, estimates and
business plans that the Company expects or anticipates will or may occur in the future. These forward-looking
statements are subject to known and unknown risks and uncertainties that may be general or specific. Certain
statements, such as those including the words or phrases "potential", "estimates", "expects", "anticipates",
"objective", "intends", "plans", "believes", "will", "may", "should", and similar expressions or variations on such
expressions may be considered forward-looking statements.
Readers should be cautioned that a variety of factors, many of which may be beyond the Company's control, affect
the performance, operations, and results of the Company, and could cause actual results to differ materially from the
expectations expressed in any of the Company's forward-looking statements. These factors include but are not
limited to exchange rate fluctuations, market shares, competition, environmental risks, changes in legal, financial
and regulatory frameworks, international economic and financial market conditions, and other risks and factors
beyond our control. These and other factors should be considered carefully, and readers should not place undue
reliance on the Company's forward-looking statements. In addition, the Company undertakes no obligation to
publicly update or revise any forward-looking statement that is contained in this presentation as a result of new
information, future events, or otherwise. None of the Company, or any of its employees or affiliates is responsible
for, or is making, any representation concerning the future performance of the Company.

Contents
3
Overview
Customer Development
Business Review
Financial Review

4
Overview Financial
Review
Customer
Development Business Review
Overview
Chairman and CEO Peter Ma

5
Ping An's strategy: A World-leading Personal
Financial Services Provider
World-leading
Personal Financial Services Provider
Pan Financial Assets Pan Health Care
Financial
Services
Ecosystem
Real Estate
Finance
Ecosystem
Auto
Services
Ecosystem
Health
Care
Ecosystem
Two
Focuses
One
Positioning
Four Service
Ecosystems

6
Financial Review
Group CFO Jason Yao
Overview Financial
Review
Customer
Development Business Review
7
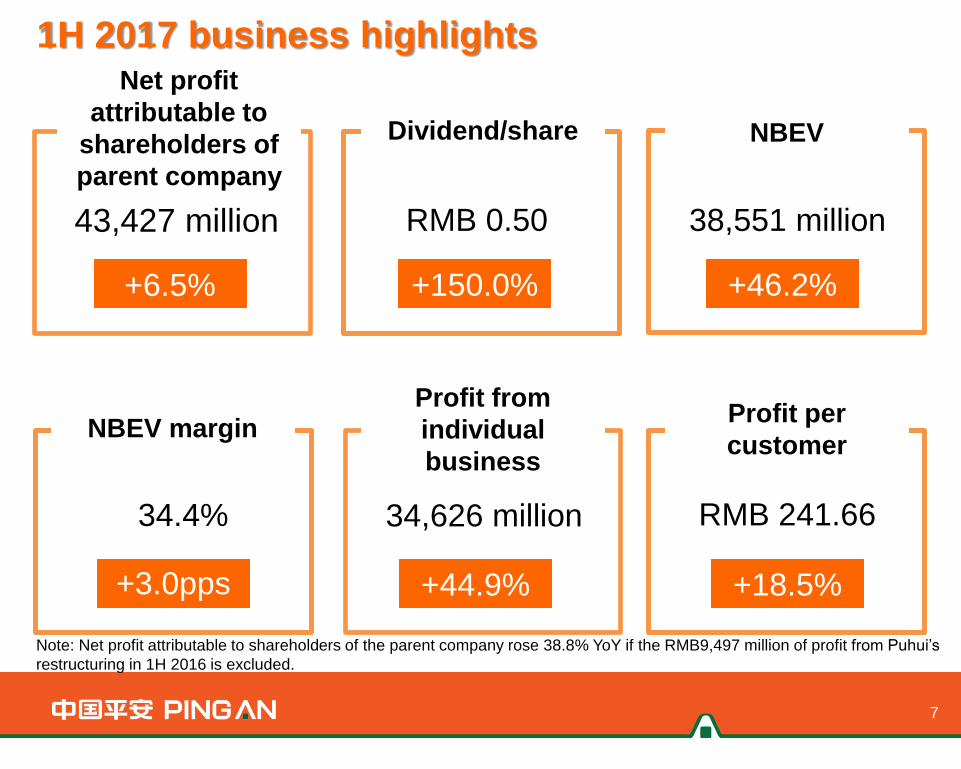
1H 2017 business highlights
Dividend/share
43,427 million
+6.5% +46.2% +150.0%
+18.5% +44.9%
Profit from
individual
business
34.4%
+3.0pps
NBEV
Profit per
customer NBEV margin
Net profit
attributable to
shareholders of
parent company
38,551 million RMB 0.50
34,626 million RMB 241.66
Note: Net profit attributable to shareholders of the parent company rose 38.8% YoY if the RMB9,497 million of profit from Puhui’s
restructuring in 1H 2016 is excluded.

Sustained business growth
Revenue Net Profit attributable to shareholders
of the parent company/EPS
8
23.4%
7.2%
6.5%
11.0%
407,828
503,143 40,776 43,427
2.28 2.43
10.6% 11.6%
5,576,903 5,978,688
425,780 383,449
(in RMB million/in RMB)
Dec 31, 2016 Jun 30, 2017
1H 2016 1H 2017
Dec 31, 2016/
1H 2016
Jun 30, 2017/
1H 2017
1H 2016 1H 2017
Note: Revenues are reported under the International Financial Reporting Standards (IFRS).
Total assets Equity attributable to shareholders of the
parent company/ROE(not annualized)

9
Profit contribution by business lines
Property and casualty
insurance 0.4
The Group
Banking business
Securities business
Life and health insurance 36.7
2.1
(3.1)
Trust business 152.0
Other asset management
15.8
100.0
16.8
2.6
54.3
5.2
8.2 92.0
6.5
6,861
43,427
7,281
1,142
23,576
2,260
3,557
Internet finance (94.7)
Others & elimination
0.9
(3.8) (26.2)
420
(1,670)
1H 2017 (in RMB million)
YoY change(%)
Notes: (1) In 1H2017, the Company redefined its business segments to provide clear and concise information.
(2) The other asset management business represents subsidiaries such as Ping An Asset Management and Ping An Financial Leasing. Elimination
includes offsets against cross-shareholding among business lines.
(3) If the RMB9,497 million of profit from Puhui’s restructuring in 1H 2016 is excluded, the profit contributed by the internet finance business
increased sharply, and the Group’s profit rose 38.8% YoY.
Proportion(%)
1H 2016
6,834
40,776
7,130
1,178
17,243
897
1,853
7,905
(2,264)
10
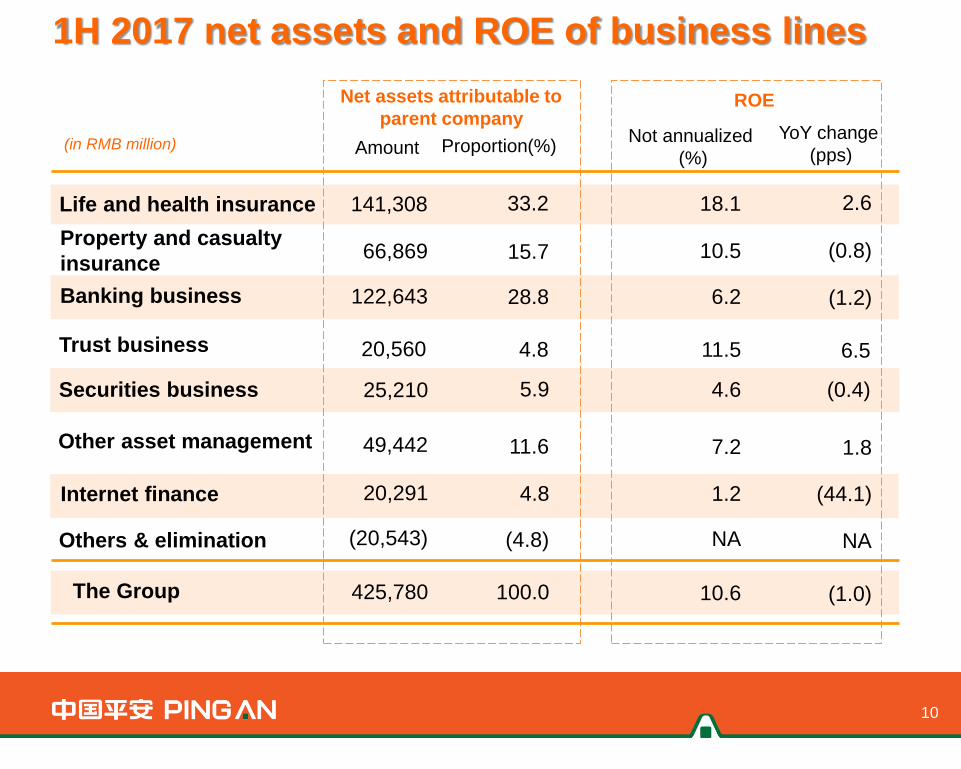
1H 2017 net assets and ROE of business lines
Property and casualty
insurance (0.8)
The Group
Banking business
Securities business
Life and health insurance 2.6
(1.2)
(0.4)
Trust business 6.5
Other asset management
15.7
100.0
28.8
5.9
33.2
4.8
11.6 1.8
(1.0)
66,869
425,780
122,643
25,210
141,308
20,560
49,442
Internet finance (44.1)
Others & elimination
4.8
(4.8) NA
20,291
(20,543)
Amount Proportion(%)
10.5
10.6
6.2
4.6
18.1
11.5
7.2
1.2
NA
Not annualized
(%)
Net assets attributable to
parent company YoY change
(pps)
ROE
(in RMB million)
11
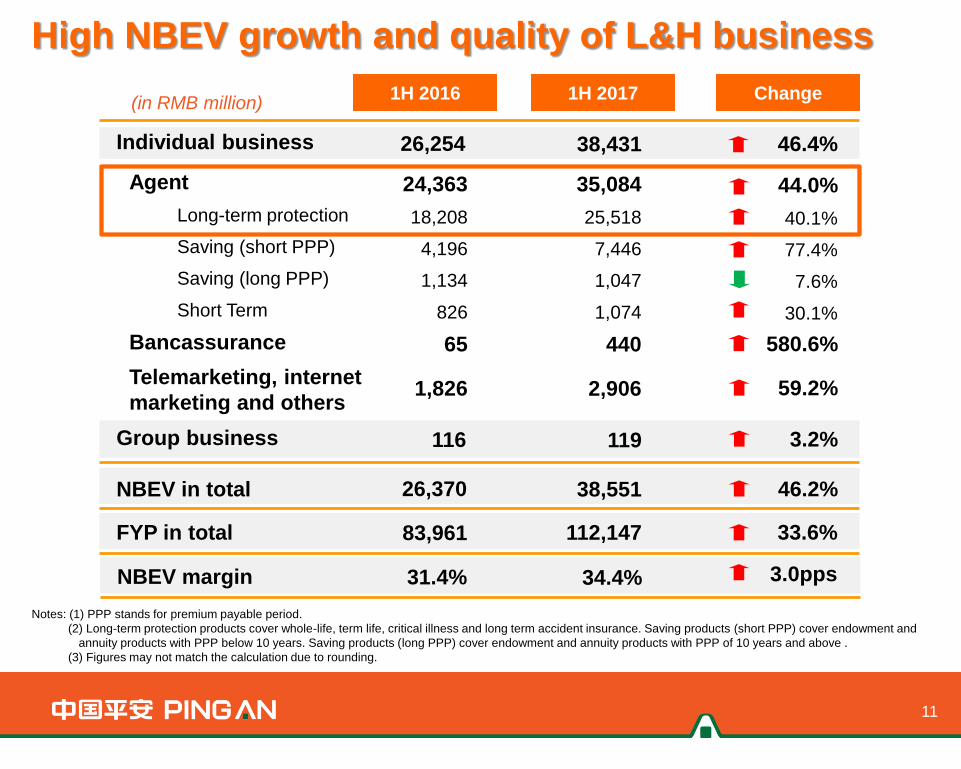
3.2% 116 119 Group business
(in RMB million)
Agent
Long-term protection
Saving (short PPP)
Saving (long PPP)
Short Term
Bancassurance
Telemarketing, internet
marketing and others
24,363
18,208
4,196
1,134
826
65
1,826
1H 2016
26,254 38,431 46.4% Individual business
1H 2017 Change
35,084
25,518
7,446
1,047
1,074
440
2,906
44.0%
40.1%
77.4%
7.6%
30.1%
580.6%
59.2%
26,370 38,551 46.2% NBEV in total
83,961 112,147 33.6% FYP in total
31.4% 34.4% 3.0pps NBEV margin
Notes: (1) PPP stands for premium payable period.
(2) Long-term protection products cover whole-life, term life, critical illness and long term accident insurance. Saving products (short PPP) cover endowment and
annuity products with PPP below 10 years. Saving products (long PPP) cover endowment and annuity products with PPP of 10 years and above .
(3) Figures may not match the calculation due to rounding.
High NBEV growth and quality of L&H business

NBEV growth driven by agent force and productivity
Note: The reason why above average agent force*6*new policies per agent per month*premium income per policy is slightly higher than total
first-year premium in the agent channel is that premiums generated from policies of the internet channel but sold by agents are accounted in
other channels.
Delivered increases in both
agent force and productivity
12
26,370
NBEV
38,551
35,084
24,363
Agent channel’s
NBEV
Other channels’
NBEV
3,467
2,007
First-year premium
NBEV margin
41.5%
42.9%
Average agent force
(’000 persons)
940
1,170
New policies per
agent per month
1.39
1.32
7,984
8,964
Premium income
per policy (in RMB)
44.0%
46.2%
72.8%
24.5%
5.3%
12.3%
1.4
pps
84,596
56,771
49.0%
(in RMB million)
1H 2016
1H 2017

Steady growth of Group EV
739,144
278,639
460,505
15.9%
21.0%
13.1%
230,363
407,340
637,703
739,144
446,600
292,544
15.9%
23.9%
5.5%
360,312
277,391
637,703
13
Embedded Value per Share @ Dec 31, 2016 = RMB 34.88
Embedded Value per Share @ Jun 30, 2017 = RMB 40.43
Value of in-
force
business
Adjusted
net asset
value
Life and health
insurance
business
Other
businesses
Dec 31, 2016 Jun 30, 2017 Jun 30, 2017 Dec 31, 2016
(in RMB million)

Group operating ROEV (not annualized): 15.4%
736,209 739,144
637,703 17,641
48,544 12,469 19,851 12,990 (10,054)
End-2016
Group EV
Expected
return on
EV
Operating
contribution
and others
of L&H
2017
interim
Group EV
EV operating profit of the Group: RMB 98,506 million
Value
generation
of new
business
Notes: (1) Value generation of new business includes NBEV and risk diversification effects.
(2) Operating contribution and others of L&H include operating assumptions and model changes(RMB90 million), operating variances
and others of life and health insurance business(RMB12,380 million).
(3) Investment variances and others include economic assumption changes, market value adjustments and investment variances.
Group EV
before non-
operating
variances
14
Investment
variances
and others
Dividend
paid
Net profit of
other
businesses
(in RMB million)
+15.4%

L&H operating ROEV (not annualized): 21.8%
438,966 446,600
360,312 17,641
48,544 12,469
13,856 (6,223)
End-2016
L&H EV
Expected
return on
EV
Operating
contribution
and others
2017
interim L&H
EV
EV operating profit of L&H: RMB 78,654 million
Value
generation
of new
business
L&H EV before
non-operating
variances
15
Dividend
paid
+21.8%
(in RMB million)
Notes: (1) Value generation of new business includes NBEV and risk diversification effects.
(2) Operating contribution and others include operating assumptions and model changes(RMB90 million), operating variances and
others of life and health insurance business(RMB12,380 million).
(3) Investment variances and others include economic assumption changes, market value adjustments and investment variances.
Investment
variances
and others
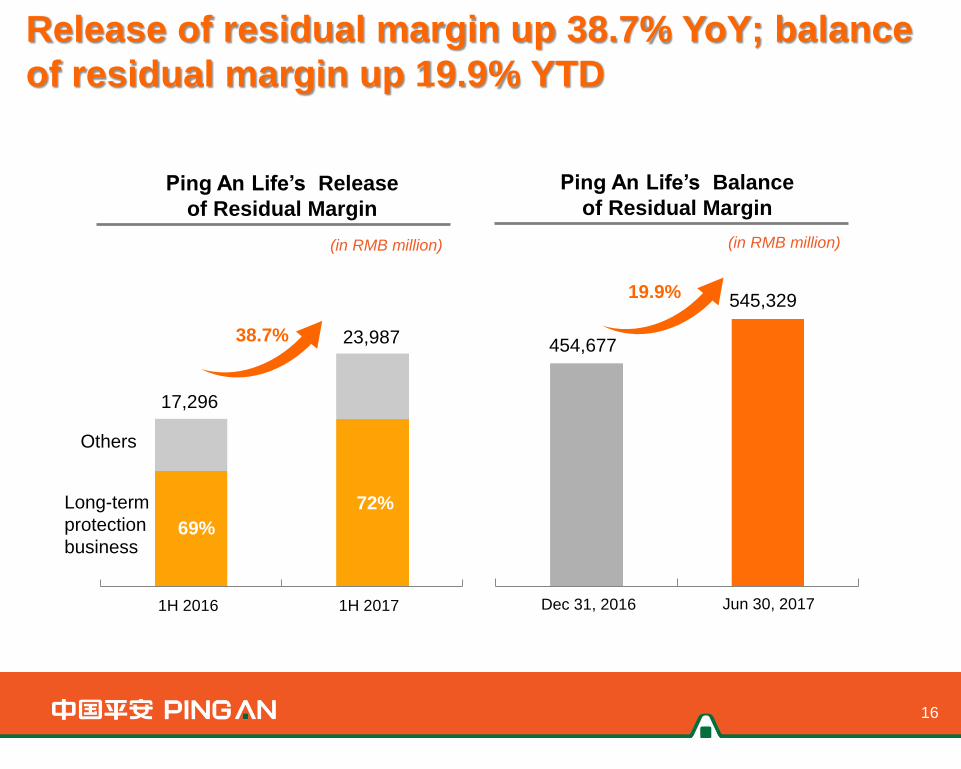
69%
72%
Release of residual margin up 38.7% YoY; balance
of residual margin up 19.9% YTD
Ping An Life’s Release
of Residual Margin
16
(in RMB million)
Ping An Life’s Balance
of Residual Margin
Others
Long-term
protection
business
38.7% 23,987
17,296
545,329
454,677
19.9%
1H 2016 1H 2017 Dec 31, 2016 Jun 30, 2017
(in RMB million)
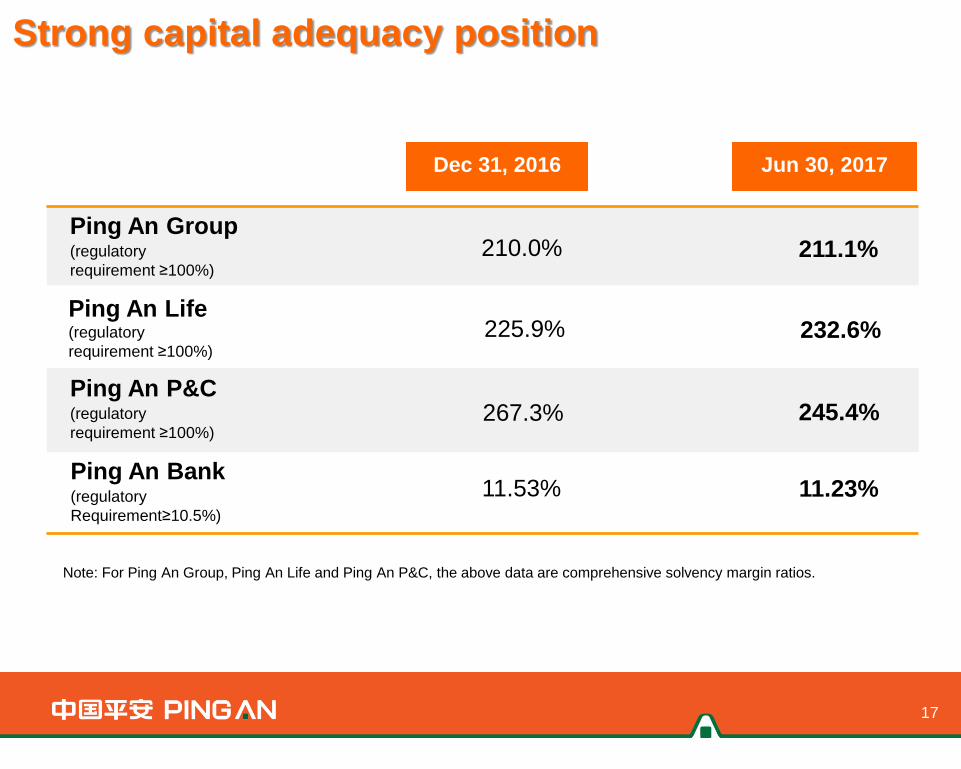
267.3%
210.0%
Dec 31, 2016 Jun 30, 2017
225.9%
11.53%
245.4%
211.1%
232.6%
11.23%
Strong capital adequacy position
17
Ping An Group (regulatory
requirement ≥100%)
Ping An P&C (regulatory
requirement ≥100%)
Ping An Life (regulatory
requirement ≥100%)
Ping An Bank (regulatory
Requirement≥10.5%)
Note: For Ping An Group, Ping An Life and Ping An P&C, the above data are comprehensive solvency margin ratios.
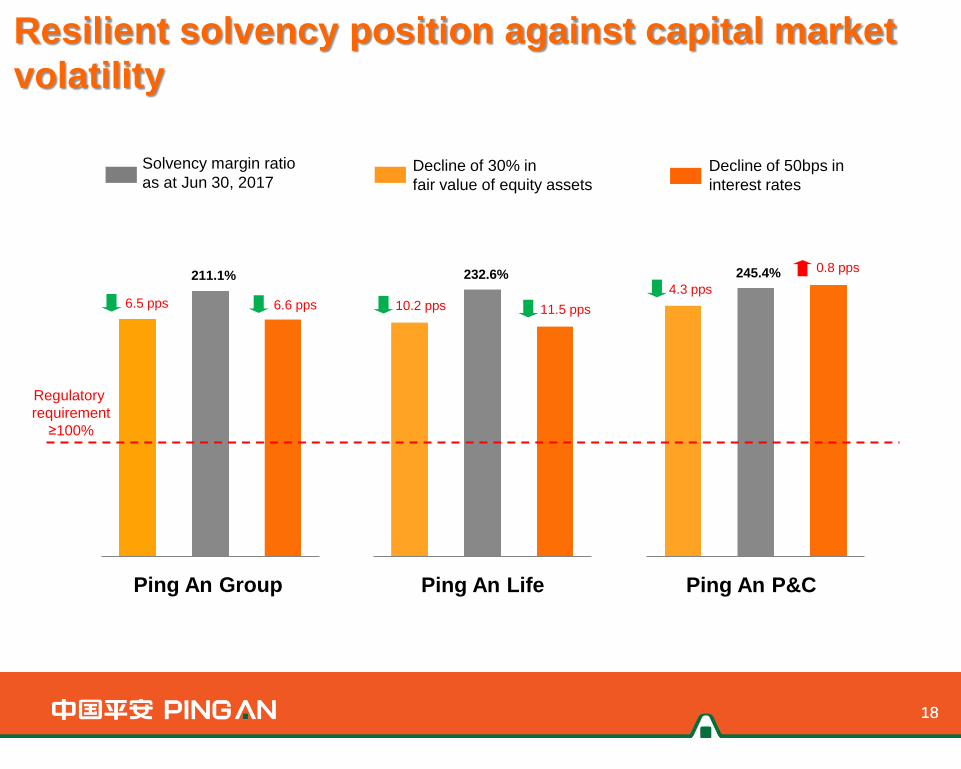
18 18
Ping An Group
Regulatory
requirement
≥100%
Ping An Life Ping An P&C
Solvency margin ratio
as at Jun 30, 2017 Decline of 30% in
fair value of equity assets
Decline of 50bps in
interest rates
Resilient solvency position against capital market
volatility
211.1%
6.5 pps
232.6% 245.4%
6.6 pps 10.2 pps 11.5 pps
4.3 pps
0.8 pps

Interim dividend: up 150% year on year
(in RMB million)
19
Profit size Business growth Capital
requirements
Sustainability of distribution
policy
RMB 0.50/share
RMB 0.20/share
Dividend
payout
ratio: 21.0%
Dividend
payout
ratio: 9.0%
We decided to increase dividends
given improving core profitability
coupled with strong solvency
position.
2017 interim dividend distribution
plan: to pay a cash dividend of RMB
0.50 per share, totaling RMB 9,140
million, up 150% year on year. 1H 2016 1H 2017
150%
3,656
9,140

20
Customer Development
Group CFO Jason Yao
Overview Financial
Review
Customer
Development Business Review
1H 2016/Jun 30, 2016
1H 2017/Jun 30, 2017
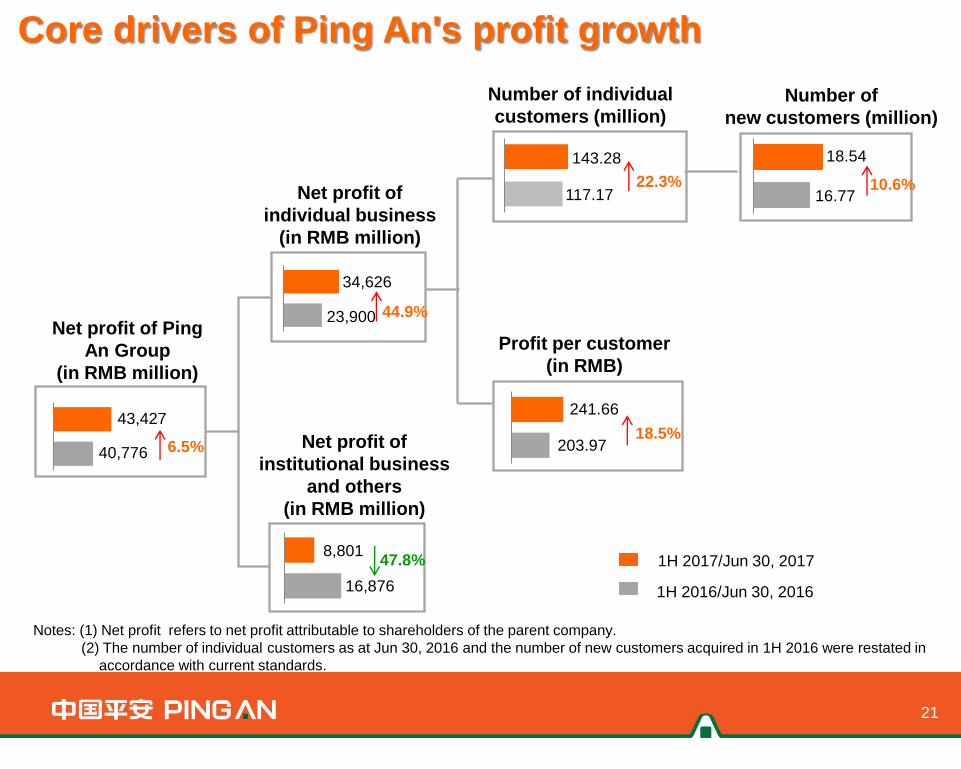
Core drivers of Ping An's profit growth
21
Notes: (1) Net profit refers to net profit attributable to shareholders of the parent company.
(2) The number of individual customers as at Jun 30, 2016 and the number of new customers acquired in 1H 2016 were restated in
accordance with current standards.
Net profit of Ping
An Group
(in RMB million)
Net profit of
individual business
(in RMB million)
Net profit of
institutional business
and others
(in RMB million)
Number of individual
customers (million)
Profit per customer
(in RMB)
143.28
117.17 22.3%
18.5% 6.5%
44.9%
34,626
23,900
43,427
40,776
8,801
16,876
241.66
203.97
47.8%
Number of
new customers (million)
16.77
18.54
10.6%

Stable growth in customer base, profit per customer,
and contracts per customer
22
Dec 31, 2016
Jun 30, 2017
18.5%
1H 2016
1H 2017
143.28 million
131.07 million
2.28 3.2%
9.3%
2.21 Dec 31, 2016
Jun 30, 2017 Contracts
per
customer
Profit per
customer
Number of
customers
RMB 241.66
RMB 203.97
23
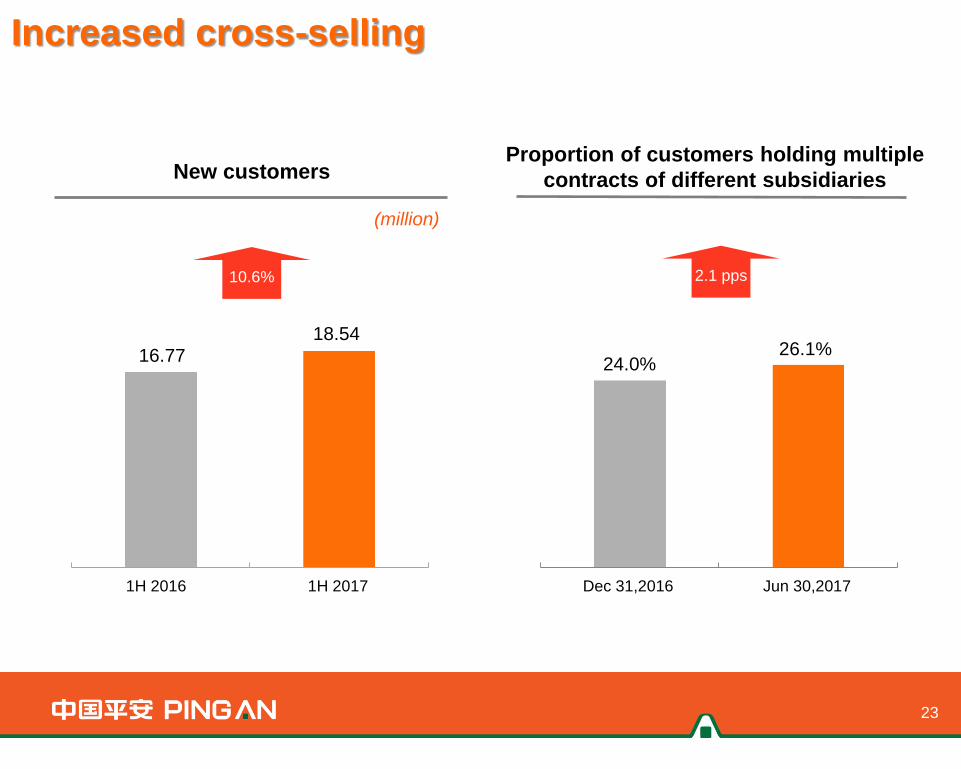
Increased cross-selling
New customers Proportion of customers holding multiple
contracts of different subsidiaries
2.1 pps
(million)
10.6%
16.77 18.54
1H 2016 1H 2017 Dec 31,2016 Jun 30,2017
24.0% 26.1%

Dec 31, 2016
Jun 30, 2017
76.1%
Jun 30, 2016
Jun 30, 2017
403 million
346 million
67.4%
4.1 pps
16.4%
Booming user base and growing user stickiness
65.31 million
37.08 million
24
Dec 31, 2016
Jun 30, 2017 71.5% Proportion
of app
users
Monthly
active
users
Number of
users
Note: Monthly active users refers to the monthly average of active users for 12 months by the end of the reporting period, where
active users are those who logged on at least once in the month.

25
Business Review
Group President Alex Ren
Overview Financial
Review
Customer
Development Business Review

26
L&H insurance: NBEV increased by 46.2% year on
year, with an increase of 44.0% of the agent channel.
The number of sales agents exceeded 1.30 million;
productivity increased by 18.2%, and their income
rose by 14.0% year on year.
Lufax Holding’s wealth management transaction
volume increased by 65.0% year on year;
institutional trading volume grew by 45.4%.
Finance One Account now has 203 million
registered users, and has cooperated with 406
banks and 1,493 non-bank financial and quasi-
financial institutions.
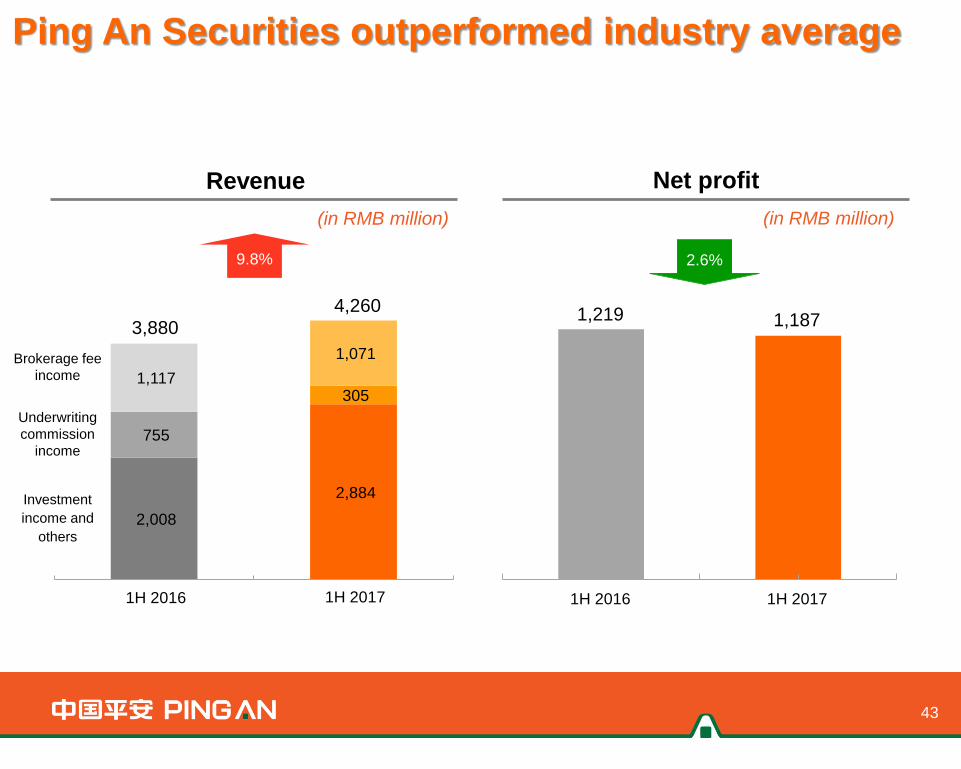
Ping An Securities developed differential
advantages; net profit slightly declined by 2.6%
year on year, better than industry average.
Ping An Asset Management’s AUM rose to about
RMB 2.49 trillion, up 10.0% YTD.
Results of business lines
Ping An Bank realized a net profit of RMB
12,554 million; its cost-to-income ratio
decreased by 4.04 pps year on year to 24.76%.
Retail business accounted for 40% of its total
revenue, up 11 pps year on year. P&C insurance: The premium income
reached RMB103.4billion, up 23.5% year on
year; the combined ratio was 96.1%; the
unannualized ROE was 10.5%.

27
Insurance Business
Overview Financial
Review
Customer
Development
Business Review
- Insurance

185,728
250,031
12,393
9,805
275,717
207,537
2016年 2017年
76,211 105,603
131,326
170,114
2015年 2016年
218,192
287,116
(in RMB million)
Written premium by business type
Group
business
Renewal
business
38.6%
31.6%
L&H Insurance: fast-growing written premium
29.5%
Individual
business
New
business
28
1H 2016 1H 2017
(in RMB million)
Written premium of individual
business by channel
Agent channel 34.6%
32.9%
Bancassurance
channel
Telemarketing,
internet
marketing and
other channels
1H 2016 1H 2017

1H 2016
Steady growth in agent force and productivity
29
26.7%
Agents’ productivity Number of agents
1,325,477
Jun 30, 2017 Jun 30, 2016
1,045,813
18.2%
(RMB/person/month)
Agents’ income
7,218
6,333
1H 2017 1H 2016
14.0%
(RMB/person/month) (person)
10,522
12,438
1H 2017
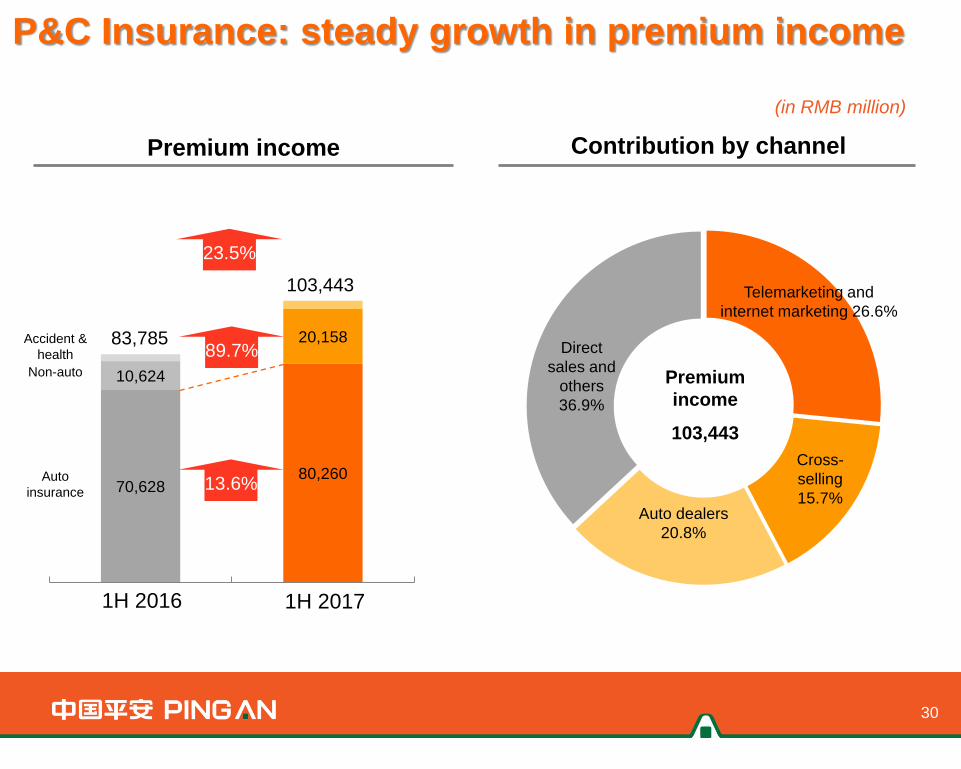
P&C Insurance: steady growth in premium income
Premium income
(in RMB million)
70,628 80,260
10,624
20,158
103,443
83,785
1H 2016 1H 2017
Contribution by channel
Direct
sales and
others
36.9%
Cross-
selling
15.7% Auto dealers
20.8%
Telemarketing and
internet marketing 26.6%
Premium
income
103,443
13.6%
89.7%
23.5%
30
Accident &
health
Non-auto
Auto
insurance

31
P&C Insurance: excellent combined ratio
Combined ratio
54.9% 58.8%
40.4% 37.3%
1H 2016 1H 2017
95.3% 96.1%
0.8
pps
Breakdown of premium income and
combined ratio
Expense
ratio
Loss
ratio
Guarantee insurance 9,515
Premium income
Corporate property insurance
Accidental injury insurance
91.5%
Combined ratio
Auto insurance 80,260 97.1%
69.7% 2,578
91.9% 3,100
Liability insurance 3,126 89.3%
(in RMB million)
32
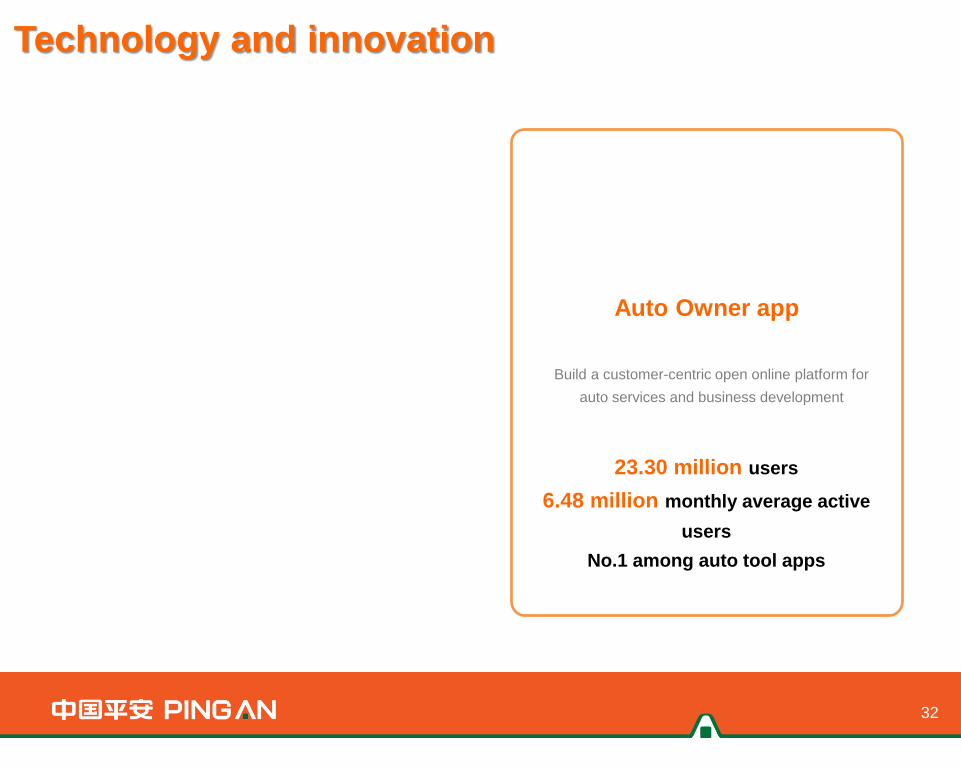
Technology and innovation
Auto Owner app
Build a customer-centric open online platform for
auto services and business development
23.30 million users
6.48 million monthly average active
users
No.1 among auto tool apps
Jin Guan Jia app
Diversify scenarios on the Jin Guan Jia app; promote
customer development and meet various demands
Over 120 million registered users
Over 23 million monthly average active
users

33
Banking Business
Overview Financial
Review
Customer
Development
Business Review
- Banking
1H 2016 1H 2017
Dec 31, 2016 Jun 30, 2017 Dec 31, 2016 Jun 30, 2017
Dec 31, 2016 Jun 30, 2017
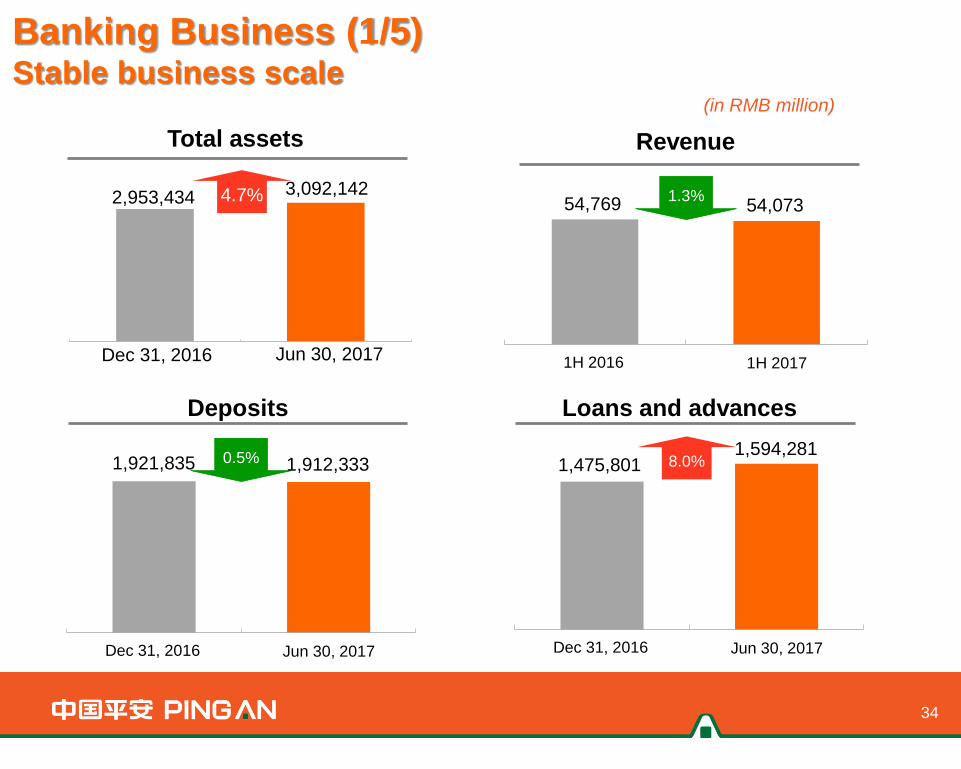
2,953,434 4.7%
(in RMB million)
Total assets
3,092,142
34
0.5% 1,921,835 1,912,333 1,594,281
1,475,801 8.0%
Banking Business (1/5) Stable business scale
Revenue
54,073 54,769 1.3%
Deposits Loans and advances
1H 2016 1H 2017
(in RMB million)
1H 2016 1H 2017
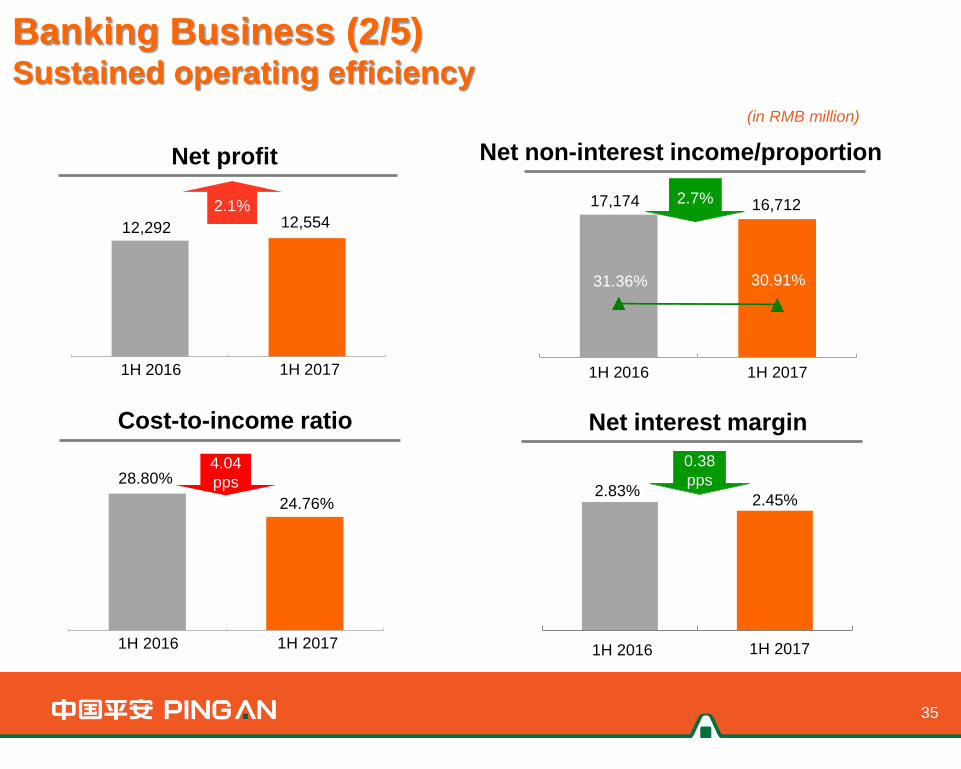
24.76%
28.80% 4.04
pps
Cost-to-income ratio
Net non-interest income/proportion
17,174 16,712
31.36% 30.91%
Net interest margin
2.45%
1H 2016 1H 2017
0.38
pps 2.83%
35
2.7%
Banking Business (2/5) Sustained operating efficiency
1H 2016 1H 2017
12,554 12,292
2.1%
Net profit

Dec 31, 2016
Jun 30, 2017
Personal assets
under
management
Number of retail
customers
58.43 million
52.39 million
RMB 951
billion 19.2%
11.5%
RMB 797.6 billion
36
Number of customers
holding products from
other subsidiaries of
Ping An Group
24.40 million
20.15 million Dec 31, 2016
Jun 30, 2017
Dec 31, 2016
Jun 30, 2017
Banking Business (3/5) Transformation towards retail banking
21.1%
Note: Retail customers include debit card customers and credit card customers, with duplication removed; the number of retail customers
as at the end of 2016 has been restated accordingly.

37
Banking Business (4/5) Encouraging signs from retail strategic transformation
(in RMB million)
% of
revenue
from
retail 29%
40% % of profit
before tax
from retail
29%
64%
Growth of
retail
deposits
Growth of
retail loans
16%
+43,051
-0.5%
21.5%
3.5%
+15,591
16,029
21,769
4,709
10,597
1H 2017
-1,366
1H 2016
1H 2017
1H 2016
1H 2017
1H 2016
1H 2017
1H 2016
+116,091

38
Banking Business (5/5) Asset quality snapshot
Dec 31, 2016 Change
1,475,801 8.0% Total loans and advances
1.74% +0.02 pps NPL ratio
4.11% +0.03 pps Proportion of special
mention loans
39,932 13.3% Loan loss provision balance
155.37% +5.95 pps Provision coverage ratio
98.51% +6.16 pps Provision coverage ratio of
loans overdue >= 90 days
Jun 30, 2017
1,594,281
1.76%
4.14%
45,229
161.32%
104.67%
(in RMB million)
39
Asset Management
Business
Overview Financial
Review
Customer
Development
Business Review –
Asset Management

Net investment income(1) 59,752 61,829
Net realized and unrealized gains(2) (21,277) (2,515)
Impairment loss (447) (239)
Total investment income 38,028 59,075
Annualized net investment yield(3) 5.7% 5.0%
Annualized total investment yield(3) 4.4% 4.9%
Investment returns on insurance funds
40
(in RMB million) 1H 2016 1H 2017
Notes: (1) Includes deposit interest income, bond interest income, dividends from equity investments, and rents from
investment properties.
(2) Includes capital gains from securities investments and profits/losses from fair value changes.
(3) Net foreign currency gains/losses on investment assets denominated in foreign currencies are excluded from the
above investment incomes. Average investment assets used as the denominator are computed in line with principles
of the Modified Dietz method.

Proportions Dec 31, 2016 Jun 30, 2017 Change (pps)
Fixed-income investments 74.6% 73.0% 1.6
Term deposits 10.5% 7.2% 3.3
Bond investments 46.2% 48.1% 1.9
Debt plan investments 6.9% 6.0% 0.9
Wealth management products(1) 6.3% 7.1% 0.8
Other fixed-income investments(2) 4.7% 4.6% 0.1
Equity investments 16.9% 20.4% 3.5
Stocks and equity funds 8.4% 11.8% 3.4
Preferred stocks 3.8% 3.2% 0.6
Bond funds 0.7% 0.4% 0.3
Wealth management products(1) 2.1% 3.1% 1.0
Unlisted equity investments 1.9% 1.9% -
Investment properties 2.2% 2.2% -
Cash, cash equivalents and others 6.3% 4.4% 1.9
Total investment assets (in RMB million) 1,971,798 2,219,658
Investment portfolio of insurance funds
41
Notes: (1) Wealth management products include trust plans from trust companies and wealth management products from commercial banks.
(2) Other fixed-income investments include financial assets purchased under agreements to resell, policy loans, and statutory deposits for insurance operations.
Proportion of non-
standard debts:
Dec 31, 2016: 13.2%
Jun 30, 2017: 13.1%

Structure of the non-standard debt portfolio
42
Real estate development 6.28 11.3 3.76
Investment
proportion (%)
5.97 Total 100.0
Real estate 6.37 12.3 3.73
Urban construction 20.2 6.03 5.06
Others 3.1 6.26 2.50
Expressway 19.2 6.03 6.60
5.40
Infrastructure 56.9 5.93 5.29
Electric power 8.0 5.63 3.49
Coal mining 4.5 6.09 3.17
Others 5.0 5.48 5.93
Others 1.0 7.46 3.42
Non-bank FIs 27.7 5.83 6.71
Remaining
maturity (year)
Nominal yield
(%)
43
2016年1-6月 2017年1-6月
Net profit
1,219 1,187
Ping An Securities outperformed industry average
Revenue
Investment
income and
others
Underwriting
commission
income
Brokerage fee
income
(in RMB million) (in RMB million)
2.6%
1H 2016 1H 2017
2,008
2,884
755
305 1,117
1,071
3,880
4,260
9.8%
1H 2016 1H 2017

44
Increasing number and activity of brokerage
customers
Number of brokerage customers Daily average active customers
(in thousand) (in thousand)
11.1% 50.6%
Dec 31, 2016 Jun 30, 2017
1,009 1,121
10,090
11,210
Jun 30, 2017 Dec 31, 2016
870
1,310

391,095 348,773
144,815 150,476
141,311 133,392
2016年12月31 2017年6月30日
52,500
65,500
2016年12月31 2017年6月30日 Dec 31, 2016
Ping An Trust enhanced risk management
Active wealth management customers Assets under management
677,221 632,641
24.7% 6.6%
(person) (in RMB million)
Jun 30, 2017 Dec 31, 2016 Jun 30, 2017
45
Administrative
category
Financing
category
Investment
category

46
Internet Finance Business
Overview Financial
Review
Customer
Development
Business Review -
Internet Finance

47
Technology-powered business transformation
Ping An is transforming from a traditional capital-powered model to a technology-powered model,
and is building core infrastructure platforms with innovative technologies such as AI, big data,
blockchain and cloud computing to support transformation of its core business activities
Scenarios
Connected 70% of core
business systems into
Ping An FinCloud
Data Speed A I
Exploring 12 blockchain-
based financial and
health care scenarios
Applied face recognition
to over 80 scenarios
within the Group
Big data platform’s
data size: 8.5PB
20,000 data labels for
single users
Help 2,200 institutions to
manage risks with credit
reference technology
Ping An FinCloud: a
proprietary financial
cloud platform
developed by Ping An
89% of product/ system
updates can be completed
within 30 days
Perception AI Accuracy rate of face
recognition: 99.8%
Accuracy rate of voiceprint
recognition:
text-dependent 99%
text-independent 93%
Prediction AI Joint R&D of the world’s first
“AI + big data” flu prediction
model
Prescription AI Increased the loss verification
speed of auto insurance by
4,000 times
Its basic environment can
be deployed within 150
seconds, allowing an
institution to finish
deployment jobs within
one day
59% of product/ system
updates can be
completed within 14 days

2016年12月31 2017年6月30日 Jun 30,2017
2,536.0 3,687.3
665.9
1,098.5
2016年1-6月 2017年1-6月 1H 2016 1H 2017
Lufax Holding achieved fast business growth
Up by 3.5% YTD Up by 46.9% YTD
31.23 million
registered
users
Up by 10.0% YTD
7.66 million
active investor
users
5.54 million
borrowers
with Puhui
(in RMB billion)
Transaction volume
49.5%
48
(in RMB billion)
Balance of loans under management
53.5%
3,201.9
4,785.8
146.6
225.1
Wealth
management
Institutional
trading
Dec 31,2016

49
Ping An Good Doctor and Finance One Account
Ping An Good Doctor: build a
comprehensive O2O health
care ecosystem
• Nearly 1,000 in-house doctors
• Over 60,000 external contracted doctors
• Nearly 2,300 hospitals
• 700 checkup centers
• Over 160 million users
• A peak number of 20 million monthly active
users
• A peak number of 460,000 queries per day
Finance One Account:
develop an open financial
services ecosystem
• Account, wealth, credit and lifestyle management
services
• 203 million users, up 9.7% from the beginning
of the year
• Sales of financial products rose to RMB 36.8
billion, up by 111.5% year on year
• Partnered with 406 banks and 1,493 non-bank
financial and quasi-financial institutions
• RMB 2.62 trillion of interbank trading volume
• Over 356 million credit inquiries
Individual customers:
Institutional clients:
User base:
Doctor network:
Partners:
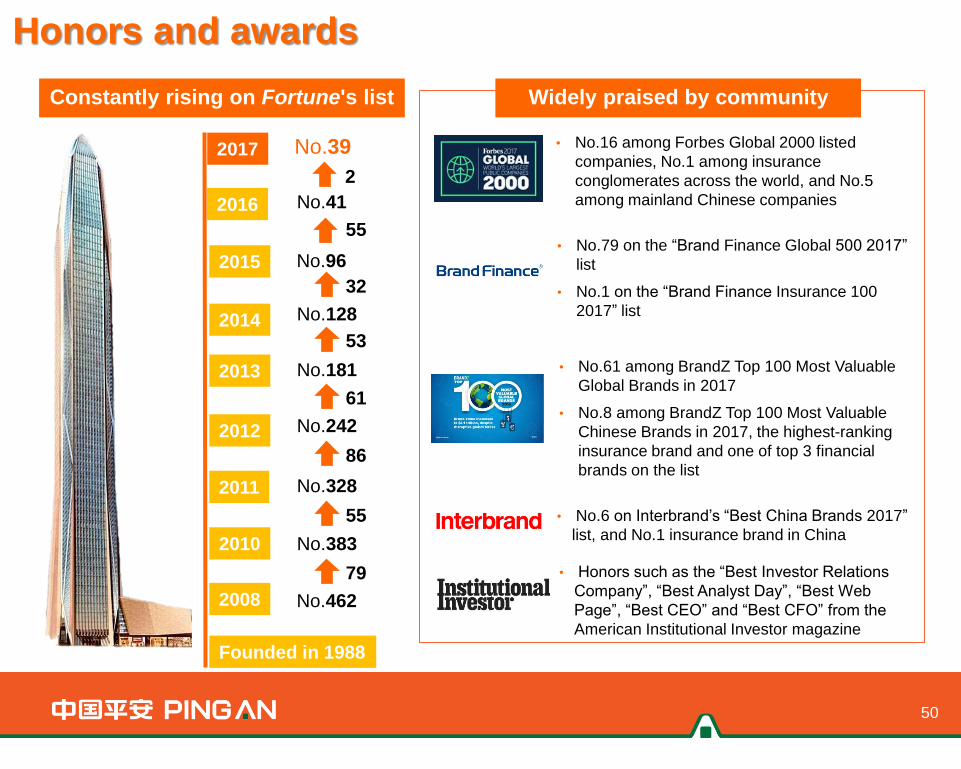
Honors and awards
Widely praised by community Constantly rising on Fortune's list
• No.6 on Interbrand’s “Best China Brands 2017”
list, and No.1 insurance brand in China
• Honors such as the “Best Investor Relations
Company”, “Best Analyst Day”, “Best Web
Page”, “Best CEO” and “Best CFO” from the
American Institutional Investor magazine
• No.16 among Forbes Global 2000 listed
companies, No.1 among insurance
conglomerates across the world, and No.5
among mainland Chinese companies
• No.79 on the “Brand Finance Global 500 2017”
list
• No.1 on the “Brand Finance Insurance 100
2017” list
50
No.462
No.383
No.328
No.242
No.181
No.128
No.41
2015
2014
2013
2012
2011
2010
2008
Founded in 1988
No.96
79
55
86
61
53
32
2017
55
2016
No.39
2
• No.61 among BrandZ Top 100 Most Valuable
Global Brands in 2017
• No.8 among BrandZ Top 100 Most Valuable
Chinese Brands in 2017, the highest-ranking
insurance brand and one of top 3 financial
brands on the list

Q&A