2016 GRESB Real Estate & Debt Results Release - Australia/NZ
Upload
gresbCategory
view
47download
0
2017GRESBRESULTS
N O R D I C S

198
850

Do you collect energy data?
2010 2012
Precise energy data coverage
24%

2017
60%

Sustainability clauses in lease contracts?
2012
23%

2017
Sustainability clauses in lease contracts?
80%

GRESB Score
GRESB participants(density)
2012n=445
0 20 40 60 80 100
2017n=823

2013
2011
2012 2014
2015
2016 2017

North America
Asia
Australia/NZ
Europe

Europe
Nordics
2017

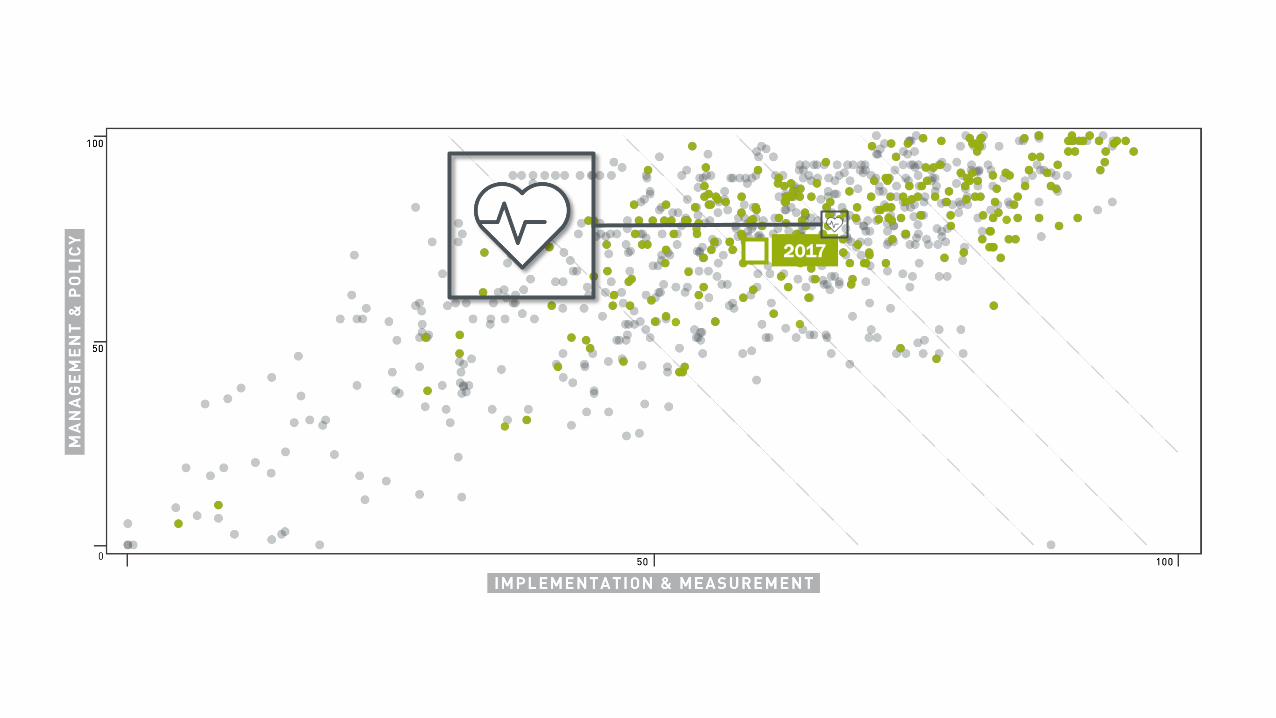
ESG LEADERS ADOPT HEALTH & WELL-BEING
North America
Europe Asia Aus/NZOther
2016 174
2017 25230% 70100 63
All GRESB

StakeholderEngagement
Management
Policy & Disclosure
Risks &Opportunities
Monitoring &EMS
Performance Indicators
Building Certifications

57%
Precise energy data coverage
EUROPE
INDUSTRIAL RETAIL RESIDENTIAL HOTEL OFFICE80 162 120 216 166
Intensities/Property type

Europe
North America
Australia/NZ
OFFICE

Average L-F-L energy consumption change
2016:-1.1%
GRESB average annualized intensity & l-f-l targets

204
$2,324.5bn
11
$2.3bn
3
$11.6bn
433
$803.7bn
124
$346.9bnGlobally diversified9
$26.7bn
66
$146.3bn

204
$2,324.5bn
11
$2.3bn
3
$11.6bn
433
$803.7bn
124
$346.9bnGlobally diversified9
$26.7bn
66
$146.3bn
NORTH AMERICA EUROPE ASIA-PACIFIC
54% 70% 50%
GRESB listed market coverage (% of market cap)
100%GRESB Public Disclosure

GRESB Public DisclosureABCDE
0
50
100
150
200Transparency is key
Non-GRESB participants

Transparency is key
0
100
80
60
40
20
2010 2017201620152014201320122011
52100
First-year
8-year
75100

Investors
94%
35%
100%
Use GRESB data in their investment process
Set specific targets in terms of GRESB performance
Consider their managers to be moderately to fully prepared to
meet ESG requirements
2012

2017
Investors have driven ESG-related disclosures in the real estate sector, with the aim to protect and enhance shareholder value
We can more precisely measure and evaluate ESG performance due to increased coverage, better metrics, and higher quality data
The sector’s increased transparency and improved performance supports our mission to evaluate and empower sustainability practices

2022?
Sustainable Real Assets

2017GRESBRESULTS
N O R D I C S

Sustainability at SpondaHannamari Koivula, Sustainability Manager2017 GRESB Real Estate Results, Nordics – event, Stockholm, 27 October 2017

26
1. Sponda today
2. Spondability
3. Sustainability reporting and going forward

1. Sponda today
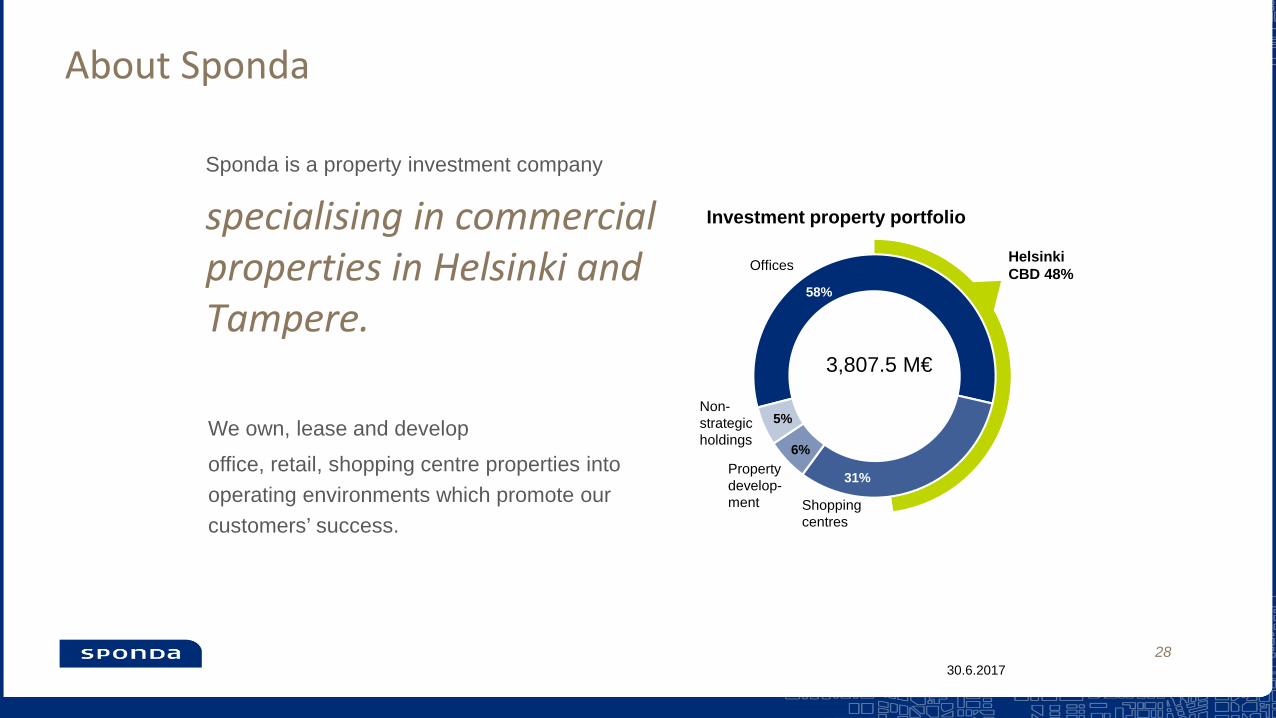
About Sponda
28
Offices
Shoppingcentres
Helsinki CBD 48%
Non-strategicholdings
Property develop-ment
5%
6%
58%
31%
3,807.5 M€
Investment property portfolio
30.6.2017
Sponda is a property investment company
specialising in commercial properties in Helsinki and Tampere.
We own, lease and developoffice, retail, shopping centre properties into operating environments which promote our customers’ success.

29
Sponda property allocation
MATINKYLÄ
KEILANIEMI
LEPPÄVAARA
PITÄJÄNMÄKI
AVIAPOLIS
RUOHOLAHTI
PASILA
TIKKURILA
CBD
KALASATAMA
OULU 2.3%
TAMPERE 6.5%
VANTAA TOTAL 0.7%
ESPOO TOTAL 4.8%
RUOHOLAHTI 15.5%
CBD 47.8%
REST OF HMA 11.9%
Total property portfolio value at 30 June 2017: EUR 3.8 billion
Property development 5.2%
Non-strategic holdings 5.3%
30
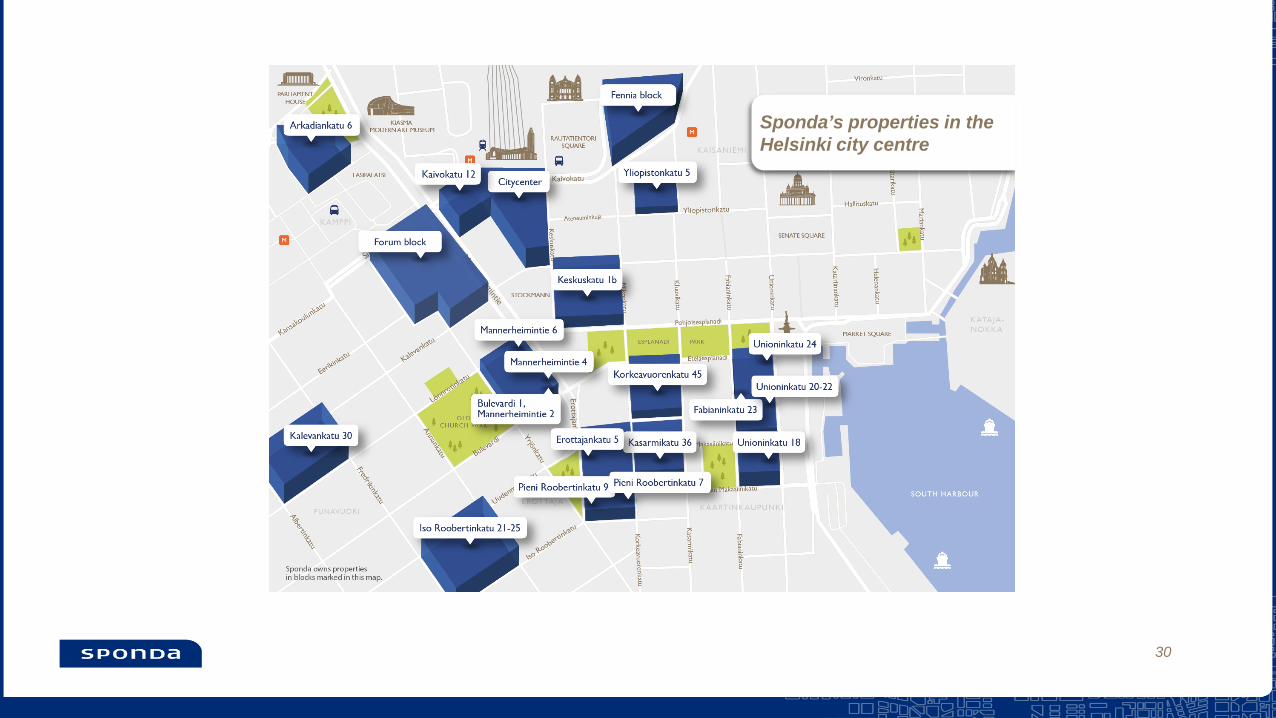
Sponda’s properties in theHelsinki city centre

2. Spondability


• The property sector as a whole plays a key role in improving energy efficiency and mitigating climate change, and Sponda wants to have a strong involvement in this effort.
• Environmental responsibility is one of Sponda’s strategic priority areas and one of our key processes.
• The main goals of Sponda’s strategy are profitable growth, simplification of the business structure and more focused property ownership.
• In addition to the company’s strategic direction, the criteria applied by Spondain selecting properties for acquisition and ownership include energy efficiency, flexibility, central location and access to public transport.
• Sponda takes environmental aspectsinto account in property planning, newdevelopment, renovation, maintenanceand usage, in cooperation withstakeholders.
• All of our new properties and major renovations are built to satisfy the criteria of the strictest environmental certification systems.
Environmental responsibility at Sponda

Sponda’s environmental targets
34
Sponda’s annual environmentaltargets focus on improving energyefficiency and reducing CO2emissions and increase the share of LEED and BREEAM certifiedproperties.
2017
2020
Sponda has joined the voluntary energy efficiency agreement for 2017–2025 between the property sector and the Finnish Ministry of Economic Affairs and Employment, the Finnish Ministry of the Environment and the Finnish Energy Authority. Sponda is thereby committed to conducting energy efficiency actions and investments by 7.5 per cent by 2025, when compared to the energy consumption level of 2015.
2025
LEED or BREEAM certified leasablearea
27%
Sponda’s energy efficiency program aims at 20 per cent reduction of the energy consumption of properties by 2020, compared to the averageconsumption of 2001-2005.
2020

Sponda’s environmental programmes –partnership for the good of the environment
In partnership with our customers and partners, we develop a wide range of solutions in order to increase the energy efficiency and eco-friendliness of properties.
Our energy-efficiency programme identifies potential energy savings and thus carbon footprint reduction in co-operation with the property users and managers. Over 90% of our properties belong to the programme.
Our environmental partnership programme takes into consideration not only energy consumption but also the environmental impacts of the property and its use more widely.

Long-term development of key environmental indicators*Energy consumption in total, MWh Electricity consumption, MWh Heating consumption, normalised, MWh
District cooling consumption, MWh Water consumption, m3 Waste recovery rate, %
195,0 200,0 205,0 210,0 215,0 220,0 225,0 230,0 235,0 240,0
2010 2011 2012 2013 2014 2015 2016
-11 %
88,0 90,0 92,0 94,0 96,0 98,0
100,0 102,0 104,0 106,0 108,0
2010 2011 2012 2013 2014 2015 2016
-11 %
100,0
105,0
110,0
115,0
120,0
125,0
130,0
135,0
2010 2011 2012 2013 2014 2015 2016
- 9 %
0
1 000
2 000
3 000
4 000
5 000
6 000
2010 2011 2012 2013 2014 2015 2016
-42 %
245,0250,0255,0260,0265,0270,0275,0280,0285,0290,0295,0300,0
2010 2011 2012 2013 2014 2015 2016
-10 %
0102030405060708090
100
2010 2011 2012 2013 2014 2015 2016
*) Like-for-like data includes only properties that have environmental data for thewhole 6-year-period.

3. Sustainability reporting and going forward

• Annual sustainability reporting• Sector leader 2017 in GRESB • Leadership A- in CDP Climate• UN Global Compact
• An annual report according to GRI G4, EPRA requirements
• The Finnish voluntary energy efficiency agreement of the property sector (TETS), commercial properties
• Climate Partner of the City of Helsinki
• WWF Green Office in HQ and MOW Co-working offices
Transparent reporting on corporate responsibility both internationally and in Finland

Sponda GRESB development path
• 2012: GRESB reporting started• 2013: Green Star since 2013• 2017: GRESB Sector Leader 2017
- The best result both in Nordic and in Europe in the ”Diversified – Office/Retail” sector
- Sponda outperformed more than 80% of the market
39
Since 2012, increasingcommitment, emphasis and resources to developsustainability and transparent reporting.

Sponda GRESB 2017 with development pointsManagement:Keeping up the good level
Policy & Disclosure:Widen the scope of third party assureddata and disclosure
Risks and opportunities:Continue sustainabilityrisk assessmentintegration in companyand property level riskmanagement processes
Environmental certifications:Increase the share of certifiedleased area annually accordingto company strategy and targets.
Performance:Continue actions according to companystrategy to to further reduceconsumption as well as CO2 footprintand increase energy efficiency.
Monitoring & EMS:Ensuring that property levelautomated consumptionmonitoring covers thehighest possible portion of properties.
Stakeholder engagement:Keeping up the good level in stakeholder engangement

Sponda sustainability development focus
Maintain position among the leading real estatecompanies in sustainability within the Nordic region
• Increase energy efficiency in property portfolio• Increase the share of renewable energy usage in property
portfolio• Reduce carbon footprint of property portfolio• Increase share of LEED and BREEAM environmentally certified
properties• Continue the implementation of responsibility principles in supply
chain• Maintain transparency in corporate sustainability via robust
sustainability reporting and communications

Main drivers for Sponda sustainabilitydevelopment Sector
The important roleof real estate
sector in improvingenergy efficiencyand minigatingclimate change
StakeholdersCustomers
OwnersInvestors
AssociationsNeighbourhood
Global and national Agenda
Climate changeUrbanisationRegulation
TransparencySponda
StrategySpondability
Ambition
Increase in property valueCost reduction
through reducedmaintenance costs,
customercooperation
Needs of the futureProperties better
designed to fulfill theneeds and
requirements of thefuture
42
Sponda PlcKorkeavuorenkatu 4500130 Helsinki Finland


![Sample Benchmark Report - GRESB · Sample Benchmark Report GRESB Real Estate GRESB Benchmark R ... [11%] Not integrated into the overall business strategy Percentage of Peers …](https://static.fdocuments.net/doc/165x107/5b5a181c7f8b9a6c4f8e30da/sample-benchmark-report-gresb-sample-benchmark-report-gresb-real-estate-gresb.jpg)