2017 Full-year results solutions Digital power base Growth story Premium business driven by...
24
14.02.2018 1 2017 Full-year results Conference presentation for investors, analysts & media Basel, 15 February 2018 Disclaimer This presentation contains certain forward-looking statements that reflect the current views of management. Such statements are subject to known and unknown risks, uncertainties and other factors that may cause actual results, performance or achievements of the Straumann Group to differ materially from those expressed or implied in this presentation. The Group is providing the information in this presentation as of this date and does not undertake any obligation to update any statements contained in it as a result of new information, future events or otherwise. The availability and indications/claims of the products illustrated and mentioned in this presentation may vary according to country. 2
Transcript of 2017 Full-year results solutions Digital power base Growth story Premium business driven by...

14.02.2018
1
2017 Full-year resultsConference presentation for investors, analysts & media
Basel, 15 February 2018
Disclaimer
This presentation contains certain forward-looking statements that reflect the current views ofmanagement. Such statements are subject to known and unknown risks, uncertainties and otherfactors that may cause actual results, performance or achievements of the Straumann Group todiffer materially from those expressed or implied in this presentation. The Group is providing theinformation in this presentation as of this date and does not undertake any obligation to updateany statements contained in it as a result of new information, future events or otherwise.
The availability and indications/claims of the products illustrated and mentioned in thispresentation may vary according to country.
2

14.02.2018
2
2017 highlights Marco Gadola, CEO
1 Organic growth – i.e. excluding the effects of currency fluctuations and acquired/divested business activities2 Excluding exceptionals3 Guidance expectations barring unforeseen events/circumstances
4
Growth story continues
REVENUE REVENUE GROWTH EBIT MARGIN2
CHF 1112m2016: CHF 918m
+16% organic1 25.7%
Driven by double-digit growth across all regions and businesses.
Q4: +18% organic; +28% in CHF Operational leverage drives EBIT margin improvement. Underlying EBITDA margin rises to 29.3%
KEY DRIVERS TECHNOLOGY OUTLOOK3
Total solutions Digital power base Growth storyPremium business driven by Straumann BLT. Dynamic growth in non-premiumdriven by Neodent and Medentika.
Dental Wings and ClearCorrect acquired; investment in Rapid Shape; strategic partnerships to support implant, restorative & orthodontics businesses.
…continues. Low double-digit organic growth expected in 2018 with further EBITDA margin improvement.

14.02.2018
3
5
Stream of launches in 2107
Intense M&A activity to expand scope, distribution and technology platform
6
Partner Stake Rationale
Medentika 51%(consolidated)
Further penetrate the non-premium implant & abutment segment
Dental Wings 100% Accelerate development of digital platforms and equipment
ClearCorrect 100%Enter orthodontics
Geniova 38%
Rapid Shape 35% Access to 3D printing technology
3Shape Partnership Distribute high-end intraoral scanners
Rodo Medical 30% Innovative fixation devices
Loop Digital Solutions 100% Online referral platform
Distributors in Turkey, Portugal, South Africa
50-100% Gain share in high-growth markets
14.02.2018
4
7
Digital powers acceleration in Q4
North America 28% of Group FY revenue
22.718.7
Q4 FY
LATAM 11% of Group FY revenue
APAC17% of Group FY revenue
Straumann Group
15.0
11.3
Q4 FY
22.1 23.6
Q4 FY
EMEA 44% of Group FY revenue
11.614.6
Q4 FY
Organic growth year-on-year (in %)
18.015.7
Q4 FY
4.254.75
2016 2017
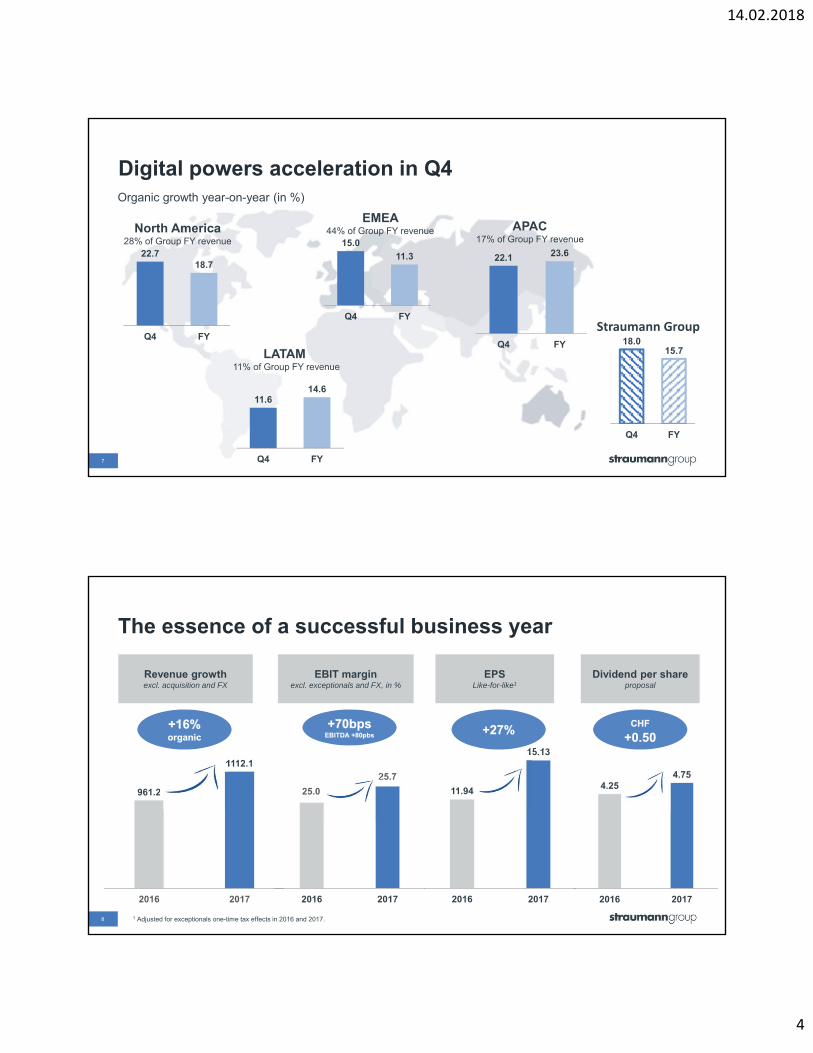
The essence of a successful business year
8
Revenue growth excl. acquisition and FX
EBIT marginexcl. exceptionals and FX, in %
EPSLike-for-like1
961.2
1112.1
2016 2017
+16%organic+16%organic
25.0
25.7
2016 2017
11.94
15.13
2016 2017
+70bpsEBITDA +80pbs
+70bpsEBITDA +80pbs +27%+27%
CHF
+0.50CHF
+0.50
Dividend per shareproposal
1 Adjusted for exceptionals one-time tax effects in 2016 and 2017.

14.02.2018
5
18.2%20.9%
23.3%24.8%
25.7%
0%
10%
20%
30%
0
50
100
150
200
250
300
2013 2014 2015 2016 2017
Profitable growth1
9
5-year organic revenue growth 5-year operating profit and margin
1.2%
6.4%
9.1%
13.1%
15.7%
2013 2014 2015 2016 2017
Market growth est. 4%
A v e r a g e + 9 . 1 % + 7 . 5 m a r g i n p o i n t s
15.9%18.4% 18.1%
20.4% 21.3%
0.0
5.0
10.
15.
20.
25.
0
50
100
150
200
250
300
2013 2014 2015 2016 2017
C A G R + 2 2 %
5-year net profit and margin
1 Excluding exceptionals and one-time effects
Growth drivers 2013-18
10
Portfolio expansion
Expand offering Innovation New segments New businesses
Scope expansion
- BLT
- ProArch
- Variobase
- Biomaterials
- Roxolid
- Ceramic implants
- Small-diameter implants
- Non-premium implant solutions
- Lab- and chairside milling & materials
- 3D printers & materials
- Clear Aligners
Premium
Non-Premium
T o o t h r e p l a c e m e n t m a r k e t
E s t h e t i c d e n t i s t r y
Geographic expansion

14.02.2018
6
111 Market data based on Renub Research, Marketsandmarkets, Goldman Sachs, and Straumann estimates. 2 Implant dentistry market segment includes implant fixtures, abutments and related instruments; information based on DRG and Straumann survey
Growing share in an attractive market Global market for implant
dentistry in 20172 worth CHF 3.7bn Global dentistry marketworth CHF 24bn in 20171
Others (400+)Dental specialties (implants/endo/ortho)
Prosthetics
General dentistry
Equipment
24%
19%
14%
8%
7%
6%
22%
Danaher
DentsplySirona
Zimmer Biomet
Henry Schein
Osstem
Business and regional reviewPeter Hackel, CFO

14.02.2018
7
13
Double-digit expansion in all regions
15.536.4
49.2
49.7
32.511.2
21.2% in CHF
LATAM
917.5
Revenues 2016
North America
EMEA
961.2
FX effect
1’112.1
15.7% organic
Revenues 2017
Revenues 2016 @ FX 2017
APACM&A effect
Revenue development (CHFm, rounded)
Change in organic growth
18.7% 14.6%11.3% 23.6% 33%
33%
24%
10% LATAM
APAC
NorthAmerica
EMEA
Regional share of organic growth
EMEA gains further momentum in Q4 Digital sales and strong demand in the
Middle East = main drivers of sequential acceleration
Key growth contributors: Germany, Italy, and France
New subsidiary in Iran gaining traction
Double-digit growth in premium and non-premium implant businesses
BLT and comprehensive prosthetic range help win new customers
ClearCorrect and Dental Wings consolidated since 1 October 2017 and add 3% points to growth
14
EMEA and North America – growth heavyweightsRevenue change (organic)
56%
15.0%
9.9% 9.9% 10.1% 8.0% 7.7%
Q4Q3Q2Q1 2017Q4Q3
North America22.7%
17.0% 17.2% 17.2% 16.0% 17.3%
Q4Q3Q2Q1 2017Q4Q3
EMEA
44% of Group
28% of Group

14.02.2018
8
11.6%
18.9%
12.8%15.3%15.0%
12.7%
Q4Q3Q2Q1 2017Q4Q3
Double-digit increases across all subsidiaries
Performance fueled by China and Japan
We obtained key approvals and launched the Straumann premium brand in India
Solid Q4 in Brazil following Neodent GM launch in Q3
Store network in Brazil expanded Dynamic growth continues in Mexico New subsidiaries in Argentina,
Colombia, and Chile performed well
15
Strong Asia Pacific – solid pace in Latin America
56%
Latin America
APAC
22.1%
27.9%
19.4%
25.7%
20.5%17.0%
Q4Q3Q2Q1 2017Q4Q3
17% of Group
11% of Group
Revenue change (organic)
Double-digit growth across all businesses
16
Implants Restorative & Digital Biomaterials

14.02.2018
9
Exceptional effects in 2017: the Medentika business combination resulted in inventory revaluation expenses of CHF 2m (COGS) and a CHF 25m consolidation gain
below the EBIT line. The Dental Wings takeover resulted in a consolidation gain of CHF 44m. A loan revaluation led to an impairment expense of CHF 16m in the
financial result. In 2016, net profit benefitted from a one-time effect of CHF 43m related to the capitalization of deferred tax assets in Brazil. 17
Key financials at a glance in CHF m (rounded) Δ % / bps
Reported Exceptionals excl. Exceptionals Reported Exceptionals excl. Exceptionals
excl. Exceptionals
Revenue 1112.1 917.5Organic growth in % 15.7% 13.1%
Gross profit 840.5 (2.0) 842.4 718.5 17%
margin 75.6% 75.8% 78.3% ( 250 bps)
EBITDA 323.5 325.5 259.2 26%margin 29.1% 29.3% 28.3% 100 bps
EBIT 283.6 285.6 227.2 26%margin 25.5% 25.7% 24.8% 90 bps
Net financial result (19.3) (16.3) (3.1) (3.3)
68.9 68.9 0.0 0.0
Share of result of associates (9.7) (1.6)
(47.8) 1.9 (49.7) 7.4 42.8 (35.4)
Net profit 275.6 229.6 20%
margin 24.8% 25.0% ( 20 bps)
Basic EPS 17.61 14.68
Free cash flow 144.7 138.7 4%
margin 13.0% 15.1%
FY 2017
Gain on consolidation
Taxes
FY 2016
1 Inventory revaluation expenses of CHF 2 million related to the Medentika business combination. 18
Business mix and capacity expansion squeeze gross margin
Change in %
0.2
0.1
Plant utilization
78.4
Gross profit margin 2017
-260bps
Mix (3rd party sales & digital)
Business combination exceptional1
Underlying gross profit
margin 2017
-0.2
-1.9
Volume, price & labor
75.8
-250bps
-0.9
Gross profit margin 2016
78.3
Adj. gross profit margin 2016 @ FX
2017
75.6
FX effect
• Incorporation of Dental Wings and ClearCorrect
• Strong demand for dental equipment
• Higher share of 3rd party products

14.02.2018
10
19
Underlying profitability improves; EBITDA margin expands 80bps
2.9
0.7
0.2
Adjusted EBITDA
margin 2016
+100bps
-0.2
Underlying EBITDA
margin 2017
Other incomeChange in gross profit
margin
28.329.3
28.5
FX effect Distribution
+80bps
-2.80.0
EBITDA margin 2017
Adminstration Business combination exceptional
EBITDA margin 2016
29.1
In %
in CHF m (rounded) FY 2017 H1 2017 H2 2017 FY 2016 Δ % / bps
2017 vs. 2016
EBITDA (reported) 323.5 156.1 167.5 259.2
margin 29.1% 28.7% 29.4% 28.3%
Depreciation 25.0 11.9 13.0 22.9 9%
Total amortization 14.9 6.3 8.6 9.2 63%
Regular amortization 4.9 1.9 3.0 3.2 56%
Amortization (of acquired intangibles) 10.0 4.4 5.6 6.0 67%
‐ Neodent 6.5 3.3 3.2 6.0
‐ Medentika 1.7 0.8 0.9
‐ Dental Wings 1.2 1.2
‐ Equinox 0.5 0.3 0.3
‐ ClearCorrect1
EBIT (reported) 283.6 137.8 145.8 227.2 25%
margin 25.5% 25.4% 25.6% 24.8% 70 bps
Exceptionals ‐2.0 ‐2.0
EBIT (excl. exceptionals) 285.6 139.8 145.8 227.2 26%
margin 25.7% 25.7% 25.6% 24.8% 90 bps
Valuable assets acquired for future growth
20 1 Purchase price allocation process for ClearCorrect ongoing

14.02.2018
11
21
EBIT margin rises 70bps despite higher amortization charges
In %
0.30.8
0.2
-0.4
25.5
EBIT margin 2017
Amortization Underlying EBIT margin
2017
DepreciationEBITDAAdjusted EBIT margin
2016
-0.2
Business combination exceptional
+90bps
25.0
FX effectEBIT margin 2016
25.7
24.8
+70bps
22
Underlying net profit surges 27%In CHF m 38.4
0.358.4
Fiancial result
Net profit 2017
Underlying net profit
2017
Income taxes
Exceptional & special tax effects
+27%+50m
-0.2
237.2
Associates
275.6
-8.1
Net profit 2016
186.8
One-time effects1
EBIT improvement
-42.8
229.6
Adjusted net profit 2016
Net profit margin20.4%
Special tax effects: One-time tax expense of CHF 8m due to sale
of treasury shares in September 2017 Effect of changes in US tax rates CHF 7m Positive tax effect on exceptionals CHF 2m
Net profit margin21.3%
1 In 2016, net profit was lifted by a one-time effect of CHF 43m, related to the capitalization of deferred tax assets in Brazil.

14.02.2018
12
23 Chart shows cash-relevant changes January-December 2017, compared with the same period in 2016.
Free-cash-flow reflects investments in production, geographic and portfolio expansion
0.1
64.3
Change in CAPEX Change NWC / non-cash OPEX
Change in interest, taxes and others
144.7
Free cash flow 2016
-26.5
138.7
Free cash flow 2017
-32.0
EBITDA improvement
In CHF m
Free cash flow margin
13.0%
Free cash flow margin
15.1%
Increased investment in manufacturing capacity
Villeret extension
Strategy in action moving forward
Marco Gadola, CEO

14.02.2018
13
Our strategic priorities
25
Drive our high performance STMN Group culture and organization
Target unexploited growth markets & segments
Expand scope to become a Total Solution Provider for esthetic dentistry
22172387
34713797 3797
2013 2014 2015 2016 2017
CH (incl. HQ)21%
Rest of EMEA24%
LATAM26%
NAM19%
APAC10%
Increased diversity as global team grows29% due to geographic and business expansion
26 1 Including Dental Wings and ClearCorrect, consolidated as of 1 October 2017
Headcount development (pro forma1)
4’881
+1084
+479 due to acquisitions
+605 internal growth+329 in Production+241 in Sales+153 in Switzerland

14.02.2018
14
Driving our cultural journey to the next level
27
• Cultural Journey now global – positively received in China and LATAM• 88% of staff actively support our Cultural Journey; 72% observe positive
changes in our culture1
• High-performance culture demonstrated in outperformance and profitability• Agility, openness, entrepreneurship (e.g. convergence of premium and non-
premium activities)
1 Straumann global staff survery 2017
Closer to customers in high growth markets
India: Group subsidiary opened, Straumann brand launched, Equinox integrated
Iran: Existing distribution agreement ended, new subsidiary set up, team hired
Turkey: Subsidiary established, former distributor & teamacquired
South Africa: Former distributor & team incorporated into new subsidiary/regional hub in Cape Town
Portugal*: Acquisition of SDS distribution company –provides access to its customers
28 * Transaction expected to be completed in Q1 2018
Entry into attractive markets where ~1.5m implants are placed
annually

14.02.2018
15
29 Implant dentistry market segment includes implant fixtures, abutments and related instruments; information based on DRG 2016 and Straumann survey in the largest 50 countries.
Market value
Premium implants Non-premium implants Straumann Group share
Market volumes
CHF 3.7bn>20 million
implant fixtures
Premium~55%
Non-premium
~45%
Large potential in premium and non-premium implants
Share of market value
Premium
Non-premium Neodent home
market
Medentika home market
Equinox home market
Premium
Non-premium
Non-premium
Premium
30
Premium
Non-Premium
Non-premium offering (current)
Future non-premium markets (2018/19)
Where to grow next in non-premium
Zinedent home market
Premium
Non-premium

14.02.2018
16
31
Neodent – a driving force
1 After up to 5 years: Sartori IAM, Latenek RT, Budel LA, Thomé G, Bernardes SR, Tiossi R. Retrospective analysis of 2244 implants and the importance of follow-up in implantology. Journal of
Research in Dentistry. 2014 Nov-Dez;2(6):555-564.
More than 20 years’ experience
A top-5 producer of dental implants worldwide
Excellent survival rates1
More than 200 scientific publications
Excellent alternative to leading competitor systems
Low cannibalization of Straumann
Available from the Straumann Group
Full solution including Neodent Digital
Innovative Grand Morse implant system
32
Premium and non-premium sales teams able to offer full range of biomaterials & CADCAM solutions
Simplification of internal processes and legal set-up
Instradent activities now coordinated at regional level
Approach tailored to local markets
Bringing premium & non premium together to simplify and create selling opportunities
Straumann Group Portfolio Menu
Straumann DIS
Neodent DISMedentikaportfolio
Other DIS (Anthogyr, Equinox,
Zinedent, etc.)
Digital business
Biomaterials
Country A DSOsCountry B Country C
Orthodontics

14.02.2018
17
Digital Business Unit – a global powerhouse
33
550+ employees
Regions
Research & Development
Production
Portfolio management
Training/Education
+Partner companies
Digital on the road
Penetration levelsDental
practicesDental
laboratories
Intra-oral scanners Desktop scanners
US 15-20% >65%
Germany 15-20% >75%
China <5% 25-30%
Brazil <5% 25-30%

14.02.2018
18
Powder-free handpiece byDental Wings
CARES® Intra-oral portable
Straumann Group offers complete digital suite
CARES® Intra-oral cart scanner
CARES® Visual chairside software
Feb 2016
IDS 2017
August2017
Sept2017
35
April2017
TRIOS® scannersuite by 3Shape
3D printers
Lab-mill
March 2016
Chairside mill
All-in-one digital solutions in North America
36
Straumann-branded 3Shape TRIOS 3 intra-oral scanner now available in North America
Accurate, ultra-fast, powder-free, full color; simplifies communication between dentist, lab, and milling center
High-end chairside solution in combination with Straumann’s compact C series mill
TRIOS 3 integrated with ClearCorrect orthodontic solutions
Complemented by the competitively-priced Dental Wings scanner range

14.02.2018
19
Growth ambitions for our clear-aligner business
37
Expand addressable market
Increase geographic reach
Leverage Straumann sales organization
Broaden indications
Increase patient adoption
Next steps for ClearCorrect
38
NAMExploit salesforcesynergies between ClearCorrect & STMN
NAMExploit salesforcesynergies between ClearCorrect & STMN
EuropePilots running in 4 countries to determine optimum sales approach; roll-out pilots to start in H2 2018
EuropePilots running in 4 countries to determine optimum sales approach; roll-out pilots to start in H2 2018
ASIAExplore partnerships in China; initial activities in Japan & Singapore in H2
ASIAExplore partnerships in China; initial activities in Japan & Singapore in H2
LATAMMarket launch in Brazil by Q1 2019
LATAMMarket launch in Brazil by Q1 2019

14.02.2018
20
Outlook 2018
-
2'000
4'000
I M AG I N G & P L AN N I N G B I O M ATE R I AL S I M P L AN T & S TAN D AR D AB U TM E N TS
C AD / C AM E Q U I P M E N T C AD / C AM P R O S TH E TI C S C L E AR AL I G N E R S
Plenty of growth potential in market segments collectively worth ~CHF 11 bn
40
Straumann Group market share
Growth potential in respective segment
CHF m

14.02.2018
21
41
Our 2018 guidanceBarring unforeseen circumstances
Market growth
Our revenue growth
Profitability
Global implant market to grow at approx. 4%
Further improvement in EBITDA margin;EBIT margin stable
Confident to outperform and achieve organic revenue growth in the low double-digit range
Questions & answers &

14.02.2018
22
43
Annual Report 2017 – now online
44
2018 Event Location
15 February Full-year 2017 results conference Straumann Group Headquarters, Basel
26 February Investor meetings London
06 March Investor meetings Toronto
07 March Investor meetings Boston
08 March Investor meetings Paris
22 March Kepler Cheuvreux Conference Zurich
04 April AGM 2018 Messe Basel
26 April Q1 revenue Webcast
07 May Investor meetings Milano / Lugano
Social media Type Source
Analyst Talk (Shift + left mouse) Executive interviewed by analysts straumann.com (Investors) / youtube.com
StraumannIR (Shift + left mouse) Investor Relations Twitter @StraumannIR
Calendar of upcoming events

14.02.2018
23
45
Growth strategy pays off
1 In March 2015, Straumann acquired the remaining 51% stake of Neodent (Brazil), which added 930 employees to the Group. In 2017, the incorporation of Equinox, Medentika, Dental Wings, ClearCorrect added 479 employees, while the remainder came through internal expansion, mainly in Brazil, Switzerland and the US, largely in production.
in CHF m 2013 2014 2015 2016 2017 5‐year average
Revenue 679.9 710.3 798.6 917.5 1112.1
Organic revenue growth in % 1.2 6.4 9.1 13.1 15.7 9.1
Acquisiton / Divesture effect in % ‐0.8 0.0 9.5 0.8 4.1 2.7
Change in l.c.% 0.4 6.4 18.6 13.9 19.8 11.8
FX effect in % ‐1.3 ‐1.9 ‐6.1 1.0 1.4 ‐1.4
Growth in CHF % ‐0.9 4.5 12.4 14.9 21.2 10.4
2013 2014 2015 2016 2017 CAGR 2013‐17
Gross profit b. exceptionals 535.9 558.7 628.0 718.5 842.4 12.0
Underlying margin 78.8% 78.7% 78.6% 78.3% 75.8%
EBIT b. exceptionals 123.8 148.3 185.7 227.2 285.6 23.2
Underlying margin 18.2% 20.9% 23.3% 24.8% 25.7%
Underlying net profit 107.9 130.9 144.7 186.8 237.2 21.8
Underlying margin 15.9% 18.4% 18.1% 20.4% 21.3%
Earnings per share (adjusted) 6.98 8.42 9.19 11.94 15.13 21.3
2013 2014 2015 2016 2017 CAGR 2013‐17
Operating cash flow 151.5 146.2 185.6 184.7 217.3 9.4
Capital expenditure (12.6) (18.8) (35.2) (46.7) (73.4)
as % of revenue ‐1.9% ‐2.6% ‐4.4% ‐5.1% ‐6.6%
Free cash flow 139.2 128.4 151.1 138.7 144.7 1.0
Number of employees (year‐end)1 2'217 2'387 3'471 3'797 4'881 21.8
CHF27%
EUR23%USD/CAD/AUD
26%
JPY3%
BRL10%
Other11%
CHF9%
EUR31%
USD/CAD/AUD30%
JPY6%
BRL10%
Other14%
Straumann’s currency exposure
1 These distribution charts represent the total net revenues and the total COGS, as well as OPEX in the various currencies. All numbers are rounded and based
on FY 2017 figures as well as average FX rates in 2017. They also include Medentika, which was consolidated on 1 January 2017.
Cost breakdown FY20171
Revenue breakdown FY20171
Average exchange rates (rounded)FX sensitivity
(+/- 10%) on full-year...
2016 2017 Latest trend Revenue EBIT
1 EURCHF 1.09 1.11 → +/- 35m +/- 21m
1 USDCHF 0.99 0.98 +/- 29m +/- 14m
100 BRLCHF 28.37 30.68 → +/- 11m +/- 3m
100 JPYCHF 0.90 0.88 → +/- 6m +/- 4m
46
60
80
100
120
2015 2016 2017 2018
Development of Straumann’s main exchange rates since 2015
USDCHF EURCHF JPYCHF BRLCHF