2017 full year results - IAB · Key Growth Drivers 5 Exploring the Drivers of Growth Over the past...
24
IAB internet advertising revenue report 2017 full year results www.pwc.com www.iab.net Any trademarks included are trademarks of their respective owners and are not affiliated with, nor endorsed by, PricewaterhouseCoopers LLP.
Transcript of 2017 full year results - IAB · Key Growth Drivers 5 Exploring the Drivers of Growth Over the past...

PwC
IAB internet advertising revenue report
2017 full year results
www.pwc.com
www.iab.net
Any trademarks included are trademarks of their respective owners and are not affiliated with, nor endorsed by, PricewaterhouseCoopers LLP.

PwCPwC
Agenda
2
May 2018
Survey methodology
Executive summary
Key growth drivers
Enabling advertising scalability
Full year and quarterly trends
Mobile trends
Advertising formats
Social media
Audio
Pricing models
Advertising by media type
About PwC

PwCPwC
Survey Methodology
3
Survey Scope
The IAB Internet Advertising Revenue Report is part of an ongoing IAB mission to provide an accurate barometer of Internet advertising growth.
To achieve differentiation from existing estimates and accomplish industry-wide acceptance, key aspects of the survey include:
• Obtaining historical data directly from companies generating internet (desktop and mobile) advertising revenues;
• Making the survey as inclusive as possible, encompassing all forms of internet advertising, including websites, consumer online services, ad networks and exchanges, mobile devices; and
• Ensuring and maintaining a confidential process, only releasing aggregate data.
Methodology
Throughout the reporting process, PwC:
• Compiles a database of industry participants selling internet advertising revenues.
• Conducts a quantitative mailing survey with leading industry players, including web publishers, ad networks, commercial online service providers, mobile providers, and other online media companies.
• Requests and compiles several specific data items, including monthly gross commissionable advertising revenue by industry category and transaction.
• Acquires supplemental data through the use of publicly disclosed information.
• Identifies non-participating companies and applies a conservative revenue estimate based on available public sources.
• Analyzes the findings, identifies and reports key trends.
May 2018

PwCPwC
Executive Summary
4
2017 Full Year Highlights
Internet advertising revenues (“revenues”) in the United States totaled $88.0 billion for the full year (“FY”) of 2017, with Q4 2017 accounting for approximately $26.1 billion and Q3 2017 accounting for approximately $21.8 billion. Revenues for FY 2017 increased 21.4% over FY 2016.
Key Trends
The shift to mobile continues
Advertising revenues delivered on mobile devices totaled $49.9 billion in FY 2017, a 36.2% increase from the prior full year revenues of $36.6 billion. Advertising delivered on mobile devices now makes up 56.7% of total internet advertising revenues.
Video continues strong growth
Digital video advertising totaled $11.9 billion, a 32.9% increase from the prior year.
Social Media impact
Advertising revenues from social media sites totaled more than $22 billion and now comprise approximately a quarter of all internet ad revenues
May 2018

PwCPwC
Key Growth Drivers
5
Exploring the Drivers of Growth
Over the past 21 years the internet has grown from a nascent industry to the largest ad supported media in the United States.
• Leading Companies have helped drive the growth
• Top 10 have historically contributed between 68% and 75% of overall revenue
• Changes in the top 10 composition occur frequently
May 2018

PwCPwC 6
May 2018
Enabling Advertising Scalability

PwCPwC 7
Full year revenues totaled $88.0 billion in 2017
Revenues for FY 2017 were 21.4% higher than in FY 2017
May 2018
FY 2016 vs. FY 2017 ($ billions)
$72.5
$88.0
FY 2016 FY 2017
21.4%
Revenues for FY 2017 totalled $88.0 billion,
$15.5 billion (21.4%) higher than in FY 2016

PwCPwC 8
2017 fourth quarter revenues totaled $26.1 billion
Revenue in Q4 2017 was $4.5 billion higher than in Q4 2016
May 2018
$21.6
$26.1
Q4 16 Q4 17
20.8%
Q4 2016 vs. Q4 2017 ($ billions)

PwCPwC 9
Strong growth between Q3 2017 and Q4 2017
Revenue in Q4 2017 was $4.3 billion higher than in Q3 2017
May 2018
$21.8
$26.1
Q3 17 Q4 17
20.0%
Q3 2017 vs. Q4 2017 ($ billions)

PwCPwC 10
Mobile internet advertising dominated total revenues in 2017
May 2018

PwCPwC 11
Second half revenues reached $47.9 billionHistorical revenue mix, first half vs. second half
May 2018

PwCPwC 12
Advertising formats – Q4 2017Search related revenues lost total revenue share, while digital video revenues exhibited steady growth in Q4 2017
May 2018
***

PwCPwC 13
Advertising formats – FY 2017FY 2017 trends mirrored those of Q4, with search related revenues growing in number, but decreasing in overall revenue share
May 2018
***

PwCPwC 14
Advertising formats – FY 2017Across desktop and mobile platforms Digital Video gains
May 2018* Other includes: Classifieds, Lead Generation, and Audio

PwC
Mobile overtakes desktop in Digital Video
Total digital video, including mobile and desktop, rose to $11.9 billion in FY 2017
15
May 2018

PwCPwC
Social media’s share of the pie increasedSocial media ad revenues, 2012 – 2017
16
May 2018
Over the past 5 years Social Media growth has had a CAGR of 50.1%resulting in a significant increased share of overall revenues – going from 8.0% to more than 25% in just six years.

PwCPwC
In 2017, digital audio advertising revenue reached $1.6 billion
17
May 2018
PwCPwC 18
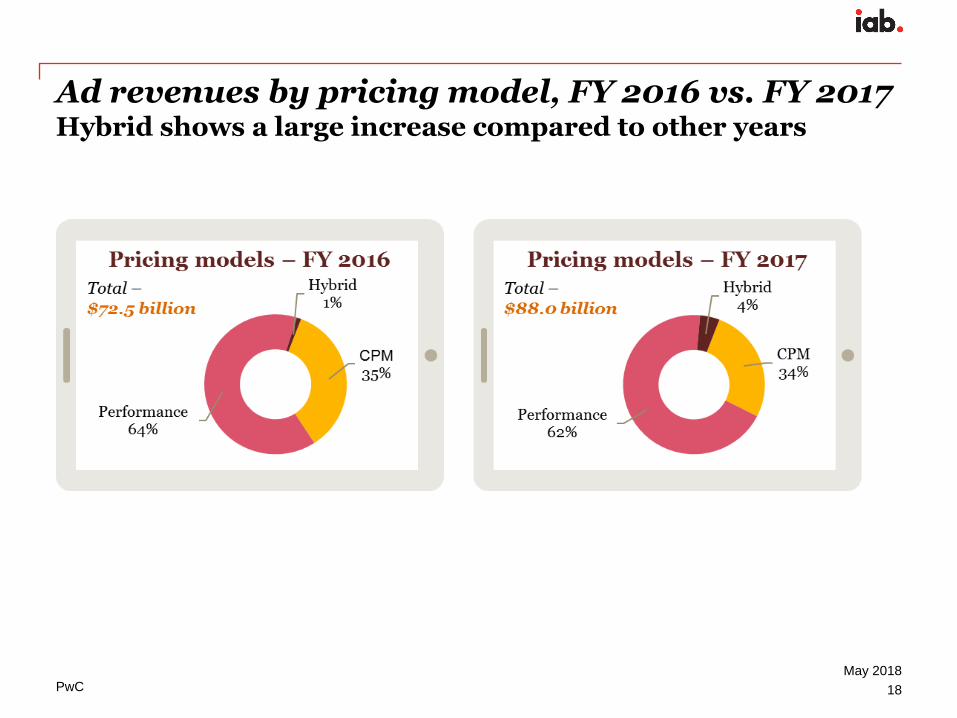
Ad revenues by pricing model, FY 2016 vs. FY 2017Hybrid shows a large increase compared to other years
May 2018
PwC
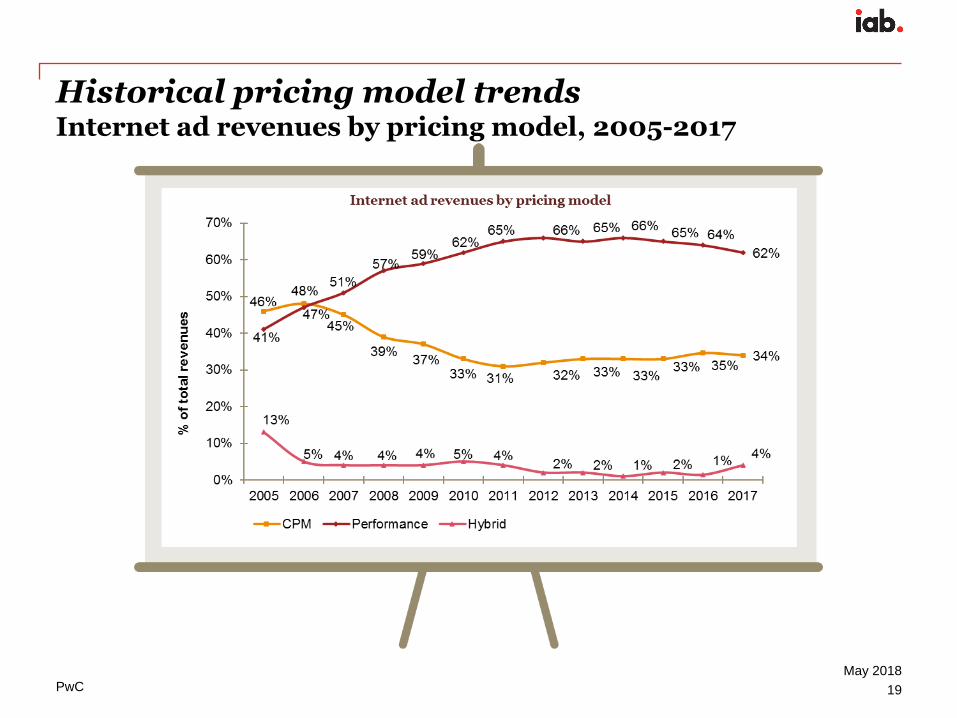
Historical pricing model trendsInternet ad revenues by pricing model, 2005-2017
19
May 2018

PwC
Advertising market share by mediaInternet advertising continued to be the leading source of advertising revenue in 2017
20
May 2018

PwC
Historical advertising market shareInternet advertising extends it lead and market share, while television growth slows
21
May 2018

PwCPwCMay 2018
PwC’s Technology and Entertainment, Media, and Communications practices
As business, accounting, and tax advisors to many of the world’s leading Entertainment, Media, and Communications (EMC) and Technology (Tech) companies, PwC (www.pwc.com) has an insider’s view of trends and developments driving the industry. With approximately 1,200 practitioners serving EMC and Tech clients in the United States, PwC is deeply committed to providing clients with industry experience and resources. In recent years, our pioneering work in EMC and Tech has included developing strategies to leverage digital technology, identifying new sources of financing, and marketplace positioning in industries characterized by consolidation and transformation. Our experience reaches across all geographies and segments of the EMC and Tech sectors, including broadband, wireless, the internet, music, film, television, publishing, advertising, gaming, theme parks, computers and networking, and software. With thousands of practitioners around the world, we're always close at hand to provide deep industry knowledge and resources.
Our services include:
• Business assurance services
• Web audience measurement and advertising delivery auditing and advisory
• IAB Measurement Certification Compliance auditing
• Privacy policy structuring, attestation, and compliance advisory
• Mergers & acquisitions assistance
• Tax planning and compliance
• Capital sourcing and IPO assistance
• Marketing & Media operations enablement
22

PwCPwCMay 2018
For information, contact one of the following PwC professionals:New York
David SilvermanPartner, Assurance [email protected]
Brian GaffneyManager, Advisory [email protected]
23
Technology and Entertainment, Media, and Communications practicesContacts

PwCMay 2018MaMay 2018
www.pwc.com/e&m
PricewaterhouseCoopers has exercised reasonable care in the collecting, processing, and reporting of this information but has not independently verified, validated, or audited the data to verify the accuracy or completeness of the information. PricewaterhouseCoopers gives no express or implied warranties, including but not limited to any warranties of merchantability or fitness for a particular purpose or use and shall not be liable to any entity or person using this document, or have any liability with respect to this document. This report is for general purposes only, and is not a substitute for consultation with professional advisors.
© 2018 PwC. All rights reserved. PwC refers to the US member firm or one of its subsidiaries or affiliates, and may sometimes refer to the PwC network. Each member firm is a separate legal entity. Please see www.pwc.com/structure for further details.