2017 Financial Fact Book - s2.q4cdn.com · Financial Overview 4 * Walmart U.S. grocery consists of...
13
NYSE: WMT Wal-Mart Stores, Inc. Fact Book – Fiscal 2017 April 20, 2017 NYSE: WMT 2017 Financial Fact Book
Transcript of 2017 Financial Fact Book - s2.q4cdn.com · Financial Overview 4 * Walmart U.S. grocery consists of...

NYSE: WMT
Wal-Mart Stores, Inc. Fact Book – Fiscal 2017 April 20, 2017 NYSE: WMT
2017 Financial Fact Book

Contents
Wal-Mart Stores, Inc. (WMT: NYSE) helps people around the world save money and live better - anytime and anywhere - in retail stores, online, and through their mobile devices. Each week, more than 260 million customers and members visit our 11,695 stores under 59 banners in 28 countries and e-commerce websites in 11 countries. With fiscal year 2017 revenue of $485.9 billion, Walmart employs approximately 2.3 million associates worldwide. Walmart continues to be a leader in sustainability, corporate philanthropy and employment opportunity. Additional information about Walmart can be found by visiting http://corporate.walmart.com, on Facebook at http://facebook.com/walmart and on Twitter at http://twitter.com/walmart.*
Investor Relations Contact Steve Schmitt Vice President, Investor Relations 479-258-7172 Media Contact Randy Hargrove Sr. Director - National Media Relations 1-800-331-0085
Home Office
Wal-Mart Stores, Inc. 702 SW 8th Street Bentonville, AR 72716 Tel: 479-273-4000 Fax: 479-277-1830 http://corporate.walmart.com/
Walmart U.S. Home Office
Walmart U.S. 702 SW 8th Street Bentonville, AR 72716
Sam’s Club Home Office
Sam’s Club 2101 S.E. Simple Savings Dr. Bentonville, AR 72716
Walmart International Home Office
Walmart International Support Center 702 SW 8th Street Bentonville, AR 72716
Walmart eCommerce Home Office
Walmart eCommerce 850 Cherry Avenue San Bruno, CA 94066
Wal-Mart Stores, Inc.
* As of January 31, 2017 The amounts shown in this Fact Book are based on the most recently publically disclosed documents for fiscal 2017.
Page Contents
1 Description and Contacts
2 Strategy
3 Becoming a More Digital Enterprise
4-6 Financial Overview
7 Stock Performance & Returns
8-9 Consolidated Statements of Income
10 Consolidated Balance Sheets
11 Consolidated Statements of Cash Flow
12 Global Responsibility Report
www.walmart.com www.jet.com www.hayneedle.com www.shoebuy.com www.modcloth.com www.samsclub.com www.walmart.ca/en www.walmart.com.mx/inicio www.wams.com.mx www.superama.com.mx www.asda.com/ www.wal-martchina.com
www.samsclub.cn www.seiyu.cn www.walmart.com.br/ electrohogar.lider.cl www.walmart.com.ar www.makro.co.za www.dionwired.co.za www.bestpricewholesale.co.in
1
Walmart Global eCommerce Retail Sites

Strategy
2
Strategic Objectives
Make Every Day Easier for Busy Families
Change How We Work
Deliver Results and Operate with Discipline
Be the Most Trusted Retailer
1
2
3
4
Financial Framework
Operating
Discipline
Framework for
Sustainable
Earnings Growth &
Returns
Strategic Capital
Allocation
Strong, Efficient
Growth

Becoming a More Digital Enterprise
Making every day
easier for busy
families
3
~$15B in Global
E-commerce sales*
35M+ SKUs online
assortment in US**
Sam’s Club
We are excited by our progress in digital and omni-channel but know there is more work to do.
In all the ways you choose to shop – in stores, mobile, or through pickup and delivery– it will be seamless
We will continue to enhance our e-commerce capabilities through internal innovation and opportunistic alliances and acquisitions
* FY17
** as of Jan 31, 2017
*** through an alliance between Walmart and JD.com
***

Financial Overview
4
* Walmart U.S. grocery consists of a full line of grocery items, including meat, produce, natural & organics, deli & bakery, dairy, frozen foods, alcoholic and nonalcoholic beverages, floral and dry grocery, as well as consumables such as health and beauty aids, baby products, household chemicals, paper goods and pet supplies
64%
24%
12%
Net Sales by Segment - FY17
Walmart U.S. Walmart International Sam's Club
59% 59% 57%
20% 20% 23%
9% 9% 8%
6% 7% 7% 6% 5% 5%
FY17 FY16 FY15
Sam's Club Merchandise Category - % of Net Sales
Grocery and consumables Fuel and other categories
Home and apparel Technology, office and entertainment
Health and wellness
56% 56% 56%
11% 11% 11%
33% 33% 33%
0%
20%
40%
60%
80%
100%
FY17 FY16 FY15
Walmart U.S. Merchandise Category - % of Net Sales
Grocery* Health and wellness General Merchandise

Financial Overview
* The company’s e-commerce sales impact includes those sales initiated through the company’s websites and fulfilled through the company’s dedicated e-commerce distribution facilities, as well as an estimate for sales initiated online, but fulfilled through the company’s stores and clubs. ** All Sam’s Club referenced metrics are w/o fuel ***Top 5 International markets by size. Results are on a constant currency basis. Source: Quarterly earnings presentations and releases 5
U.S. Quarterly Comparable Store Sales Results without fuel (4-5-4 Retail Calendar)
Fiscal Years Ended January 31
Comp-Store Sales Q4 Q3 Q2 Q1 Q4 Q3 Q2 Q1 Q4 Q3 Q2 Q1
Walmart U.S. 1.8% 1.2% 1.6% 1.0% 0.6% 1.5% 1.5% 1.1% 1.5% 0.5% 0.0% -0.1%
Neighborhood Market 5.3% 5.2% 6.5% 7.1% 7.0% 8.0% 7.3% 7.9% 7.7% 5.5% 5.6% 5.0%
Sam's Club 2.4% 1.4% 0.6% 0.1% -0.5% 0.4% 1.3% 0.4% 2.0% 0.4% 0.0% -0.5%
e-Commerce Impact* Q4 Q3 Q2 Q1 Q4 Q3 Q2 Q1 Q4 Q3 Q2 Q1
Walmart U.S. 0.4% 0.5% 0.4% 0.2% 0.3% 0.2% 0.2% 0.2% 0.3% 0.2% 0.3% 0.3%
Sam's Club** 0.8% 0.6% 0.6% 0.6% 0.8% 0.6% 0.6% 0.4% 0.4% 0.2% 0.3% 0.2%
Quarterly Traffic/Ticket Trends (4-5-4 Retail Calendar)
Fiscal Years Ended January 31
Walmart U.S. Q4 Q3 Q2 Q1 Q4 Q3 Q2 Q1 Q4 Q3 Q2 Q1
Traffic 1.4% 0.7% 1.2% 1.5% 0.7% 1.7% 1.3% 1.0% 1.4% -0.7% -1.1% -1.4%
Ticket 0.4% 0.5% 0.4% -0.5% -0.1% -0.2% 0.2% 0.1% 0.1% 1.2% 1.1% 1.3%
Sam's Club Q4 Q3 Q2 Q1 Q4 Q3 Q2 Q1 Q4 Q3 Q2 Q1
Traffic 1.2% -0.5% -0.4% -0.2% -1.4% -0.3% 0.5% -0.2% 1.5% 0.2% 0.3% -0.2%
Ticket 1.2% 1.9% 1.0% 0.3% 0.9% 0.7% 0.8% 0.6% 0.5% 0.2% -0.3% -0.3%
FY2017 International Comparable Store Sales & Traffic/Ticket Trends (4-5-4 Retail Calendar)Fiscal Years Ended January 31
WMT International*** Q4 Q3 Q2 Q1 Q4 Q3 Q2 Q1 Q4 Q3 Q2 Q1
UK -2.9% -5.8% -7.5% -5.7% -1.8% -4.2% -6.0% -5.0% -1.1% -1.6% -1.5% -0.7%
Walmex 7.3% 7.0% 7.3% 8.6% 1.3% 0.8% 0.7% 2.1% 6.0% 6.2% 6.6% 6.5%
Canada 0.2% 1.1% 1.1% 6.7% -1.1% 0.2% 0.5% 4.6% 1.3% 0.9% 0.6% 2.1%
Brazil 0.8% 8.1% 4.7% 4.5% -2.4% 0.5% -3.5% -3.7% 3.2% 7.6% 8.2% 8.2%
China 2.3% 1.6% -0.5% 1.4% -2.9% -2.7% -5.5% -3.8% 5.2% 4.3% 5.0% 5.2%
FY17 Comps FY17 TicketFY17 Traffic
FY16 FY15FY17
FY15
FY15FY16
FY16FY17
FY17

Financial Overview
* Free cash flow is a non-GAAP measure. Net cash provided by operating activities of continuing operations is the closest GAAP measure to free cash flow. Reconciliations and other information regarding free cash flow and its closest GAAP measure can be found in the Management’s Discussion and Analysis of Financial Condition and Results of Operations sections of our Form 10-K’s for the fiscal years ended January 31, 2015, 2016, and 2017 on our website at www.stock.walmart.com.
6
20.9
15.9 16.4
0
5
10
15
20
25
FY17 FY16 FY15
Free Cash Flow* (in billions of dollars)
6.2 6.3 6.2
8.3
4.1
1.0
0
2
4
6
8
10
12
14
16
18
20
FY17 FY16 FY15
Total Return to Shareholders (in billions of dollars)
Dividend Share Repurchases
7.2
10.4
14.5
FY17 Uses of Cash
Dividends
Acquisitions
& Alliances
Share
Repurchase
Core Capex e.g., New stores , remodels, e-commerce and customer initiatives
Increased for 44th consecutive year in FY18
By end of FY17, $9.2B remaining on current $20B authorization
e.g., Jet acquisition and JD alliance
6.1 6.7 6.3
2.7 2.9 3.9
0.6 0.7
0.8 1.2
1.1 1.2
0.0
2.0
4.0
6.0
8.0
10.0
12.0
14.0
16.0
FY17 FY16 FY15
Capital Expenditure Detail (in billions of dollars)
Walmart U.S. Walmart International Sam's Club Corporate & Support
12.2 11.5
10.6

$2.04
7
* Calculated by dividing the declared dividend by the close price at the end of the fiscal year ** As of close of the last trading day of fiscal 2017 *** Return on equity is defined as income from continuing operations divided by average total equity
3.5%
$0.00
$0.50
$1.00
$1.50
$2.00
$2.50
FY08 FY09 FY10 FY11 FY12 FY13 FY14 FY15 FY16 FY17 FY18
WMT Dividend
WAL-MART STORES, INC.
Other Financials
FY18 FY17 FY16 FY15 FY14 FY13 FY12 FY11 FY10 FY09 FY08 FY07
Stock Price
High N/A $75.19 $88.00 $90.97 $81.37 $77.60 $62.00 $57.90 $55.20 $63.85 $51.44 $52.15
Low N/A $62.35 $56.30 $72.27 $68.13 $57.18 $48.31 $47.77 $46.25 $46.92 $42.09 $42.31
Dividend
Declared $2.04 $2.00 $1.96 $1.92 $1.88 $1.59 $1.46 $1.21 $1.09 $0.95 $0.88 $0.67
Yield* N/A 3.00% 2.95% 2.26% 2.52% 2.27% 2.38% 2.16% 2.04% 2.02% 1.73% 1.40%
Price to Earnings** N/A 15.2 14.5 17.0 15.4 14.0 13.5 12.8 14.3 14.1 16.1 16.3
Return on Equity*** N/A 17.4% 17.8% 20.1% 20.3% 21.7% 20.8% 21.7% 20.8% 20.5% 20.5% 21.3%
Total Shareholder Return N/A 3.5% -19.8% 16.6% 9.4% 16.8% 12.5% 7.4% 15.9% -5.5% 8.4% 5.0%
-25%
-20%
-15%
-10%
-5%
0%
5%
10%
15%
20%
FY07 FY08 FY09 FY10 FY11 FY12 FY13 FY14 FY15 FY16 FY17
WMT Total Return to Shareholders

8
Wal-Mart Stores, Inc. Consolidated Statements of Income
Includes excerpts from audited financial statements. See full 10-K at www.stock.walmart.com.

(1) The sum of quarterly income per common share attributable to Walmart data may not agree to annual amounts due to rounding. Includes excerpts from audited financial statements. See full 10-K at www.stock.walmart.com.
9
Wal-Mart Stores, Inc. Quarterly Consolidated Financial Data

10
Wal-Mart Stores, Inc. Consolidated Balance Sheets
Includes excerpts from audited financial statements. See full 10-K at www.stock.walmart.com.

11
Wal-Mart Stores, Inc. Consolidated Statements of Cash Flows
Includes excerpts from audited financial statements. See full 10-K at www.stock.walmart.com.
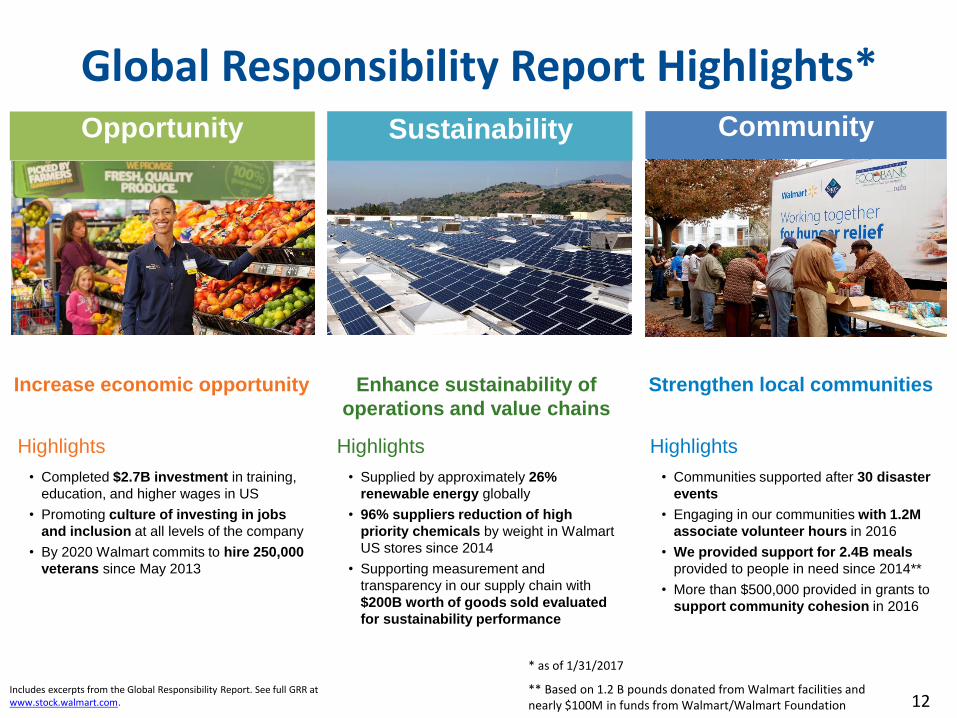
Increase economic opportunity
Highlights
• Completed $2.7B investment in training,
education, and higher wages in US
• Promoting culture of investing in jobs
and inclusion at all levels of the company
• By 2020 Walmart commits to hire 250,000
veterans since May 2013
Opportunity
Enhance sustainability of
operations and value chains
Highlights
• Supplied by approximately 26%
renewable energy globally
• 96% suppliers reduction of high
priority chemicals by weight in Walmart
US stores since 2014
• Supporting measurement and
transparency in our supply chain with
$200B worth of goods sold evaluated
for sustainability performance
Sustainability
Strengthen local communities
Highlights
• Communities supported after 30 disaster
events
• Engaging in our communities with 1.2M
associate volunteer hours in 2016
• We provided support for 2.4B meals
provided to people in need since 2014**
• More than $500,000 provided in grants to
support community cohesion in 2016
Community
12 Includes excerpts from the Global Responsibility Report. See full GRR at www.stock.walmart.com.
Global Responsibility Report Highlights*
** Based on 1.2 B pounds donated from Walmart facilities and nearly $100M in funds from Walmart/Walmart Foundation
* as of 1/31/2017